Page 1
123
Journal of Basic and Environmental Sciences 3 (2016) 123– 132
ISSN 2356-6388
Research Article Open Access
Kinetics and isotherm studies of Remazol Red adsorption onto polyaniline/
cerium oxide nanocomposites
M. Khairy*a, R. Kamalb, N. H. Aminb, M. A. Mousaa
aChemistry Department, Faculty of Science, Benha University, Benha, Egypt. bChemistry Department, Faculty of Education, Ain shams University, Roxy 11757, Cairo, Egypt.
* Corresponding author. Tel.: +20201270405481, +9660502508917.
E-mail address: [email protected]
Received: 20 Aug. 2016, In Revised form; 3 Sept. 2016, Accepted 3 Sept. 2016, Available online 1 Oct. 2016
Abstract:
Polyaniline/cerium oxide (PANI/CeO2) composites were prepared and characterized by XRD, FT-IR, nitrogen
adsorption/desorption isotherms and TEM techniques. The PANI/CeO2 composites were used for removal of Remazol
Red (RB-133) from aqueous solution. The adsorption behaviour of dye was studied at different experimental conditions
of solution pH and reaction temperature. The adsorption isotherm studies were carried out using Langmuir and
Freundlich models, of which Freundlich model was found more suitable. Pseudo-second-order model fitted well with
good agreement with the experimental values of qe (equilibrium adsorption capacity). Thermodynamic parameters for the
adsorption system were calculated and suggested that the adsorption process is spontaneous, exothermic and marked with
an increase in randomness at the solid–liquid interface.
Keywords: Polyaniline; polyaniline/ cerium oxide; Remazol red dye; Adsorption isotherm.
1. Introduction
Nowadays, Many industries are produced large amounts
of organic dyes and also used in in textile, papers,
dyestuffs, plastic, pharmaceutical and food industries.
However, Dye materials are important sources of the
environmental contaminations due to their non-bio
degradability and high toxicity to aquatic creatures and
carcinogenic effects on humans [1]. The presence of very
small amounts of dyes in water is highly visible and
affects the quality of water. Moreover, it is very difficult
to degrade dyes because they are stable to light, heat and
oxidizing agents.
Dyes can be divided according to the chemical nature
into: acridine dyes, azo dyes, arylmethane dyes,
anthraquinone dyes, nitro dyes, etc. azo dyes are the
largest chemical class of dyes which have been used
extensively in textile industries due to their low cost,
stability and variety of colors [2]. Removal of these dyes
from wastewater is difficult because of their high
solubility in water, synthetic origin and mainly aromatic
structures, which are biologically non-degradable. several
physical, chemical and biological decolorization
techniques have been applied to remove dyes from
wastewater, such as photochemical degradation, biological
degradation, coagulation, chemical oxidation, reverse
osmosis, flotation and adsorption. Among these
techniques, adsorption process is commonly used and
gives the best results owing to its high efficiency and
ability to remove different types of coloring materials,
simplicity of design, low-cost and economic feasibility [3-
9].
A few productive and particular adsorbent materials
have been created, for example, waste orange peel, banana
substance, rice husk, clay, and activated carbon [10-12] .
Recently, a conducting polymer, polyaniline (PANI), was
tested in the adsorption of dye effluent [13]. Polyaniline is
thought to be a standout amongst the most encouraging
classes of natural directing polymers because of their all
around characterized electrochemistry, simple protonation
reversibility, fabulous redox recyclability, and good
environmental stability, and variety of nanostructured
morphologies. PANI usually combined with inorganic
materials to form composites with high physical,
mechanical, and electrical properties, etc. In recent years,
rare earth oxides are introduced into the preparation of
polyaniline composites because of their excellent physical
and chemical characteristics. Among those oxides, CeO2
has potential applications in various fields including
catalysis and coatings. The high thermal resistance and
inflexibility of its structure make CeO2 an important
material for several technologies [14].
Page 2
Khairy et al., J. Bas. & Environ. Sci., 3 (2016) 123 – 132
124
The present study is an attempt to remove the anionic
dye Remazol Red RB-133 (RR RB-133), as a model dye,
from aqueous solutions by using each of polyaniline and
polyaniline/CeO2 nano composites with various
compositions (1 and 5 wt% CeO2) as adsorbents. Physical
properties of the adsorbent materials besides the kinetics
and the adsorption isotherms were also investigated.
2. Experimental
2.1. Preparation of CeO2 nanoparticles
A cerium oxide powder was prepared by low-
temperature combustion synthesis method in the presence
of chelating agent citric acid [15]. The molar ratio of
Ce(NO3)3.6H2O: citric acid of 1:1 were dissolved
completely in de-ionized water and the pH value of the
solution was adjusted to be 7. The mixture solution was
stirred well using a magnetic stirrer for about 2 h and then,
the prepared mixture solution was reflux at a temperature
of 80◦Cfor about 4 h. the sol heated at 80°C for 12h. The
obtained pale-yellow powder was calcined in furnace at
750 °C for 1.5 h.
2.2. Preparation of polyaniline
Polyaniline was synthesized by chemical
polymerization using ammonium persulfate (APS) as
oxidant and HNO3 as doping agent, respectively [16]. 1.6
mL of aniline was 50 mL dissolved in 100 mL of 1 M
HNO3 aqueous solutions. While maintaining vigorous
stirring within ice temperature (0 – 5 ºC), APS (4.564 g)
in 100 mL of dist. H2O was rapidly poured into the aniline
solution. The mixture was stirred at this temperature for
10 h. At the end, the product was collected by filtration
and washed with DI water and then acetone several times,
until the filtrate became colorless. After drying in oven at
70 ºC and sieving for 12 h, the PANI was obtained as a
powder.
2.3. Preparation of Polyaniline/CeO2 composites
The polyaniline/CeO2 composites were prepared by in
situ polymerization of aniline in a suspension of CeO2
particles in acidic solution. The content of CeO2 (wt%)
doped into aniline was fixed at 1%, 3% and 5%,
respectively. Typically, 1.6 mL aniline was dissolved in
100 mL of 1 M HNO3 containing CeO2 powder under
ultrasonic action. After 1 h, while maintaining vigorous
stirring within ice temperature (0 – 5 ºC), APS (4.564 g)
in 100 mL of dist. H2O was rapidly poured into the aniline
solution. The mixture was stirred at this temperature for
10 h. At the end, the precipitated powder was filtered and
washed with DI water and then acetone several times,
until the filtrate became colorless. After drying in oven at
70 ºC and sieving for 12 h. The resulting nanocomposites
with respect to different CeO2 amounts of 1 and 5 wt% are
denoted as PANI/CeO2-1 and PANI/CeO2-5 respectively.
2.4. Characterization
X-ray diffraction (XRD) patterns, obtained on an X-ray
diffractometer (type Bruker Axs D8 Advance, Germany)
using CuKα1 irradiation (λ = 0.15404 Å) at a scan rate of
2° in 2θ/min, were used to determine the identity of any
phase present and their crystallite size. Fourier transform
infrared (FT-IR) spectroscopy of composites was recorded
on a Jasco FT-IR 4100 spectrometer (Japan) using KBr
pellets in the range of 4000–400 cm−1 region. The surface
characteristics, namely specific surface areas (SBET), total
pore volume (Vp) and average pore radius (ŕ) of the
various catalysts were determined from nitrogen
adsorption isotherms measured at −196 °C using a Quanta
chrome NOVA 2000 automated gas-sorption apparatus
model 7.11 (USA). All catalysts were degassed at 200 °C
for 2 h under a reduced pressure of 1.3 mPa before taking
the measurements. Morphology of the samples was
investigated using transmission electron microscope
(TEM) (JEM-2100CX (JEOL)).
2.5. Adsorption studies
The adsorption of water-soluble reactive dye Remazol
Red RB- 133 (RR RB-133) from aqueous solution onto
the adsorbents was performed using batch equilibrium
technique. All the experiments were carried out at 25 °C.
For the determination of adsorption isotherms, 100 mL of
dye solution of known initial concentration was shaken
with a certain amount of the adsorbent (100 mg) on a
stirrer at 25 °C and pH = 6.5. Initial dye concentrations
were changed in the range of 25 mg L−1 to 75 mg L−1. At
various time intervals, samples were taken and allowed to
settle and further centrifuged at 7000 rpm for 10 min. The
concentration of the residual dye was measured using
UV–vis spectrophotometer (Jasco V-550, Japan) at
appropriate wavelength corresponding to the maximum
absorption of Remazol Red RB-133 (i.e., 520 nm). This
data was used to calculate the adsorption capacity of the
adsorbent. Initial dye concentration in the solution was
varied to investigate its effect on the adsorption capacity.
The equilibrium adsorption capacities (qe) were then
obtained by using the following mass balance equation.
𝑞𝑒 = (𝐶0 − 𝐶𝑒)𝑉
𝑊 (1)
Where qe is the adsorption capacity (dye adsorbed onto
the mass unit of the sample, mg/g), Where Co and Ce are
the initial and equilibrium dye concentrations in solution
(mg/L) respectively, W is the adsorbent amount (g), and V
is the volume of solution (L). Adsorption isotherms were
investigated by Langmuir and Freundlich models. The
reaction kinetics were performed by pseudo-first-order
kinetic model, pseudo-second-order kinetic model and
intra-particle diffusion model.
3. Results and discussions
3.1. Characterization of adsorbents
3.1.1. XRD
Fig. 1 shows the XRD pattern of synthesized CeO2
nanoparticles, pure PANI and PANI/CeO2-5
nanocomposite. Fig. 1a shows the XRD pattern of CeO2
nanoparticles synthesized by combustion method. All the
diffraction peaks of CeO2 are indexed to cerianite-(Ce):
syn structure with cubic phase, lattice points
a=b=c=5.41134 Å, space group: Fm-3m (no. 225) and
Joint Committee on Powder Diffraction Standards
(JCPDS) no. 34-0394 [17]. The powder XRD pattern of
CeO2 nanoparticles had shown broad peaks, which
confirmed the formation of small-sized nanoparticles. The
particle size of nanoparticles are determined using the
Scherrer’s relation: d = (0.9λ)/(βcosθ) [18], where is β the
full width at half maximum in radians, λ is the wavelength
of X-rays used, and θ is the Bragg’s angle. The average
Page 3
Khairy et al., J. Bas. & Environ. Sci., 3 (2016) 123 – 132
125
crystallite size calculated from the most intense peaks
(2θ=28.5 º) by the Scherrer formula was found to be 35
nm. Further, Fig. 1b shows the XRD pattern of PANI
which exhibits broad peaks at 2θ = 15.2◦, 21.5◦ and 25.3◦.
The XRD pattern of PANI/CeO2-5 -nanocomposite is
showed in Fig. 1c.It exhibited the same pattern as obtained
in the pure CeO2, representing that the crystal structure of
CeO2 is not altered by the PANI chain. Besides, some
extra peaks observed in nanocomposite may be assignable
to the dopants of PANI chain. Furthermore, these results
demonstrate that PANI is amorphous in the
nanocomposite, which suggest that the addition of CeO2
nanoparticles hinders the crystallization of the PANI
chain. This confirms that the PANI/CeO2-5
nanocomposite has become more crystalline as the
concentration of CeO2 is increased and PANI deposited on
the surface of CeO2 nanoparticles has no effect on the
crystallization behavior of CeO2 nanoparticles in the
nanocomposite [19].
Fig. 1 XRD spectra of (a) CeO2 nanoparticles, (b) PANI
and (c) PANI/CeO2-5nanocomposite.
3.1.2. FT-IR
Fig. 2 shows the FTIR spectra of CeO2, PANI and
PANI/CeO2-5 nanocomposite specimens. The spectrum of
CeO2, Fig. 3a, shows bands at 563 and 829 cm-1 which are
ascribed to (Ce–O) metal–oxygen vibrations [20].
Polymerization of aniline can be confirmed by the
presence of spectral bands at 1476 and 1563 cm-1, Fig. 2b,
which are recognized to stretching of the benzenoid and
quinoid rings, respectively, for the HNO3 doped PANI.
These results point to that the pure PANI is highly doped
and exists in conducting emeraldine salt form [21]. The
band observed at 1300 cm-1 matching to C–N stretching of
secondary amine in the polymer main chain. The FT-IR
spectrum of the PANI/CeO2-5 nanocomposite (Fig. 2c)
shows bands related to both the polyaniline (quinoid and
benzenoid rings at 1562 and 1471 cm−1, respectively, and
CeO2 nanoparticles (at 583 cm−1) besides a band at 3436
cm−1 ascribed to N–H stretching vibrations bending mode.
The specific bands observed for the polyaniline functional
groups are seen at somewhat higher frequency than their
actual value owing to their interaction with CeO2
nanoparticles. Really, there are several types of
interactions may occur between the polyhedral groups of
CeO2 nanoparticles with the polymeric ring of polyaniline
causing the observed shift e.g. the interaction between a
lone pair of electrons of nitrogen atom with the above
mentioned groups [22].
Figure 2. FT-IR spectra of (a) CeO2 nanoparticles, (b)
PANI and (c) PANI/CeO2-5 nanocomposite.
3.1.3. Specific surface areas and porosity
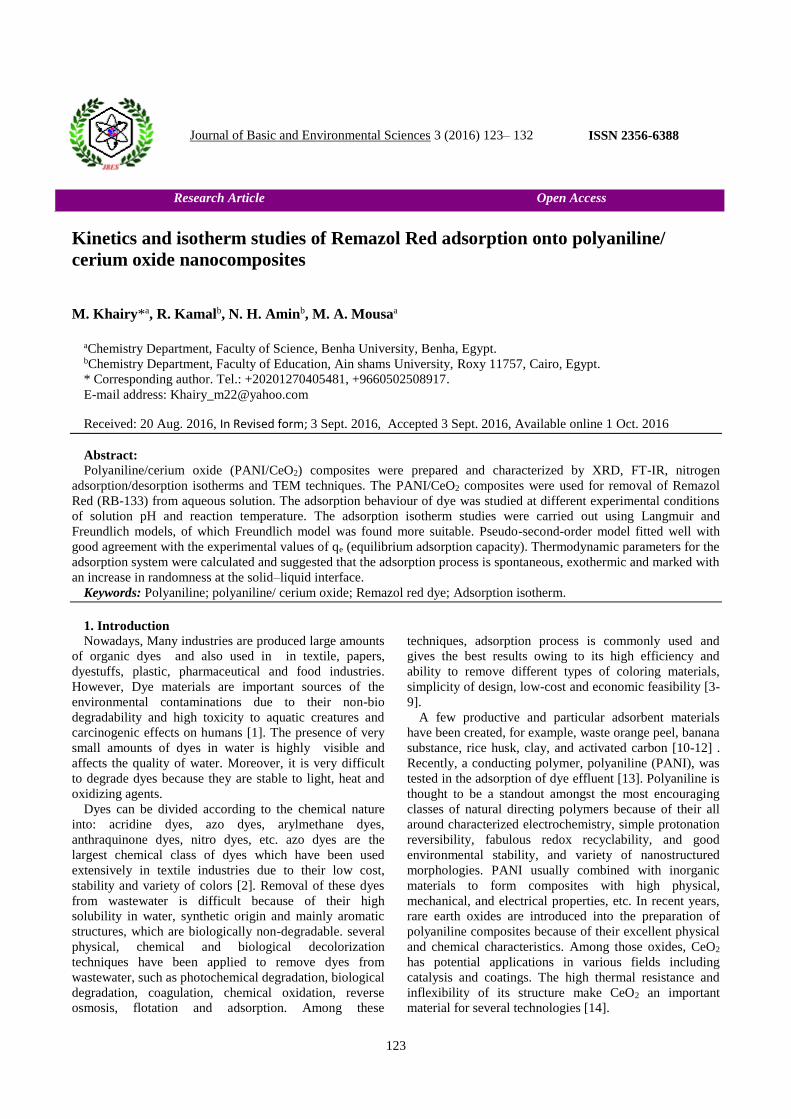
Fig. 3 displays the nitrogen adsorption–desorption
isotherms of CeO2, PANI and PANI/CeO2
nanocomposites. The nitrogen sorption isotherms of all
specimens are similar and belong to the type IV of
Brunauer's classifications with closed hysteresis loops of
type H3, demonstrating the formation of mesoporous
structures. The specific surface areas were calculated
using the BET (Brunauer–Emmett–Teller) method [23]
and the results obtained are recorded in Table 1. From
which it can be seen that the surface area increases with
increasing of CeO2 content in the composite. This might
be due to an incorporation of oxide particles in the
polymeric structure of polyaniline forming voids between
the particles. The total pore volumes, VP, were taken at
P/P° = 0.95 and was found to be lying in the scope of
0.31‒0.42 ml/g. The pore radius was calculated and
extended from 15.1–19.8 nm showing the formation of
narrow mesoporous structure, Table 1.
Page 4
Khairy et al., J. Bas. & Environ. Sci., 3 (2016) 123 – 132
126
Fig. 3 Nitrogen adsorption–desorption isotherms of (a)
CeO2 and PANI/CeO2 nanocomposites with (b) 1 wt%, (c)
5 wt% of CeO2.
Table 1 Surface parameters of CeO2, PANI and
PANI/CeO2 nanocomposites.
samples SBET
(m2/g)
Vp(mL/g
)
ŕ (nm)
CeO2 70 0.42 15.1
PANI 39 0.31 19.8
PANI/Ce
O2-1
49 0.34 17.0
PANI/Ce
O2-5
60 0.36 15.3
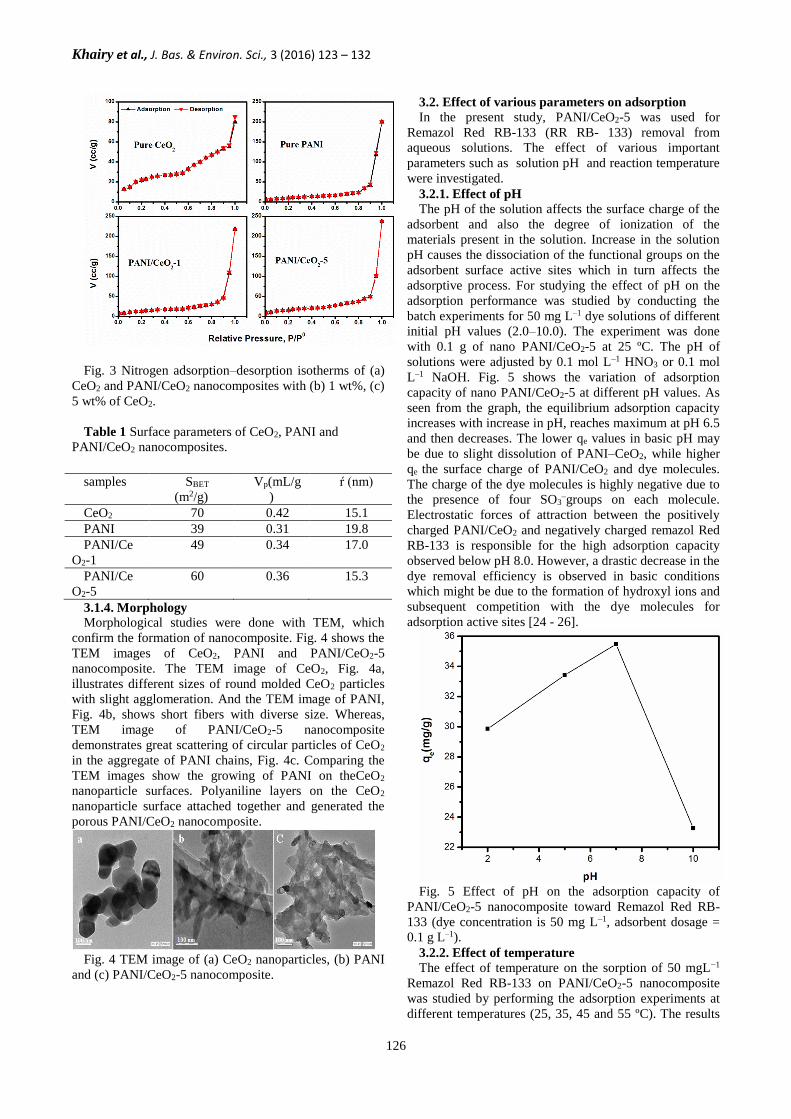
3.1.4. Morphology
Morphological studies were done with TEM, which
confirm the formation of nanocomposite. Fig. 4 shows the
TEM images of CeO2, PANI and PANI/CeO2-5
nanocomposite. The TEM image of CeO2, Fig. 4a,
illustrates different sizes of round molded CeO2 particles
with slight agglomeration. And the TEM image of PANI,
Fig. 4b, shows short fibers with diverse size. Whereas,
TEM image of PANI/CeO2-5 nanocomposite
demonstrates great scattering of circular particles of CeO2
in the aggregate of PANI chains, Fig. 4c. Comparing the
TEM images show the growing of PANI on theCeO2
nanoparticle surfaces. Polyaniline layers on the CeO2
nanoparticle surface attached together and generated the
porous PANI/CeO2 nanocomposite.
Fig. 4 TEM image of (a) CeO2 nanoparticles, (b) PANI
and (c) PANI/CeO2-5 nanocomposite.
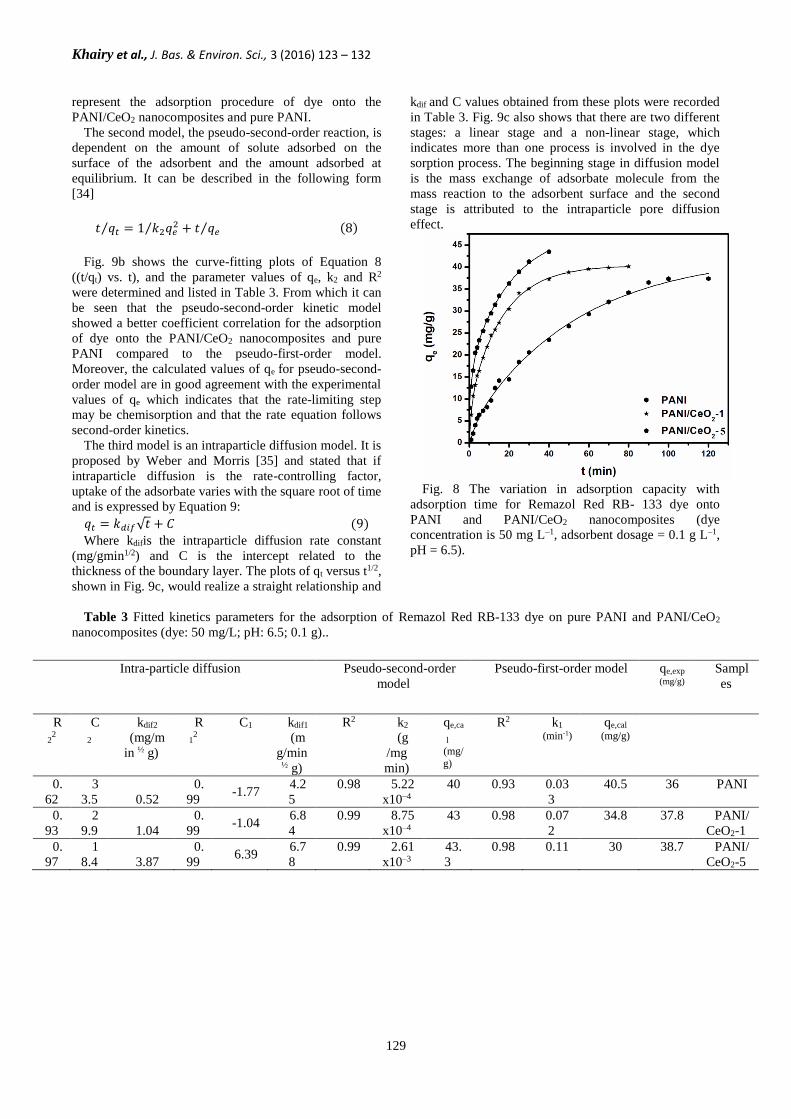
3.2. Effect of various parameters on adsorption
In the present study, PANI/CeO2-5 was used for
Remazol Red RB-133 (RR RB- 133) removal from
aqueous solutions. The effect of various important
parameters such as solution pH and reaction temperature
were investigated.
3.2.1. Effect of pH
The pH of the solution affects the surface charge of the
adsorbent and also the degree of ionization of the
materials present in the solution. Increase in the solution
pH causes the dissociation of the functional groups on the
adsorbent surface active sites which in turn affects the
adsorptive process. For studying the effect of pH on the
adsorption performance was studied by conducting the
batch experiments for 50 mg L–1 dye solutions of different
initial pH values (2.0–10.0). The experiment was done
with 0.1 g of nano PANI/CeO2-5 at 25 ºC. The pH of
solutions were adjusted by 0.1 mol L–1 HNO3 or 0.1 mol
L–1 NaOH. Fig. 5 shows the variation of adsorption
capacity of nano PANI/CeO2-5 at different pH values. As
seen from the graph, the equilibrium adsorption capacity
increases with increase in pH, reaches maximum at pH 6.5
and then decreases. The lower qe values in basic pH may
be due to slight dissolution of PANI–CeO2, while higher
qe the surface charge of PANI/CeO2 and dye molecules.
The charge of the dye molecules is highly negative due to
the presence of four SO3–groups on each molecule.
Electrostatic forces of attraction between the positively
charged PANI/CeO2 and negatively charged remazol Red
RB-133 is responsible for the high adsorption capacity
observed below pH 8.0. However, a drastic decrease in the
dye removal efficiency is observed in basic conditions
which might be due to the formation of hydroxyl ions and
subsequent competition with the dye molecules for
adsorption active sites [24 - 26].
Fig. 5 Effect of pH on the adsorption capacity of
PANI/CeO2-5 nanocomposite toward Remazol Red RB-
133 (dye concentration is 50 mg L–1, adsorbent dosage =
0.1 g L–1).
3.2.2. Effect of temperature The effect of temperature on the sorption of 50 mgL−1
Remazol Red RB-133 on PANI/CeO2-5 nanocomposite
was studied by performing the adsorption experiments at
different temperatures (25, 35, 45 and 55 ºC). The results
Page 5
Khairy et al., J. Bas. & Environ. Sci., 3 (2016) 123 – 132
127
revealed that the adsorption capacity decreased with
increase in temperature from 25 to 55 ºC (Fig. 6) and
maximum adsorption capacity is noticed at 25 ºC which
shows an exothermic nature of dye adsorption. The
decrease in the rate of adsorption with the increase in
temperature may be attributed to the physical bonding
between acid dye molecules and the active sites of the
adsorbent. It is weakened as temperature increased,
whereas, the solubility of dyes increased thus interaction
forces between the solute and the solvent become stronger
than those between solute and adsorbent, making the
solute more difficult to adsorb. The adsorption is favored
by a decrease in temperature, a phenomenon which is also
characteristic of physical adsorption [27].
Fig. 6 Effect of temperature on the adsorption capacity
of PANI/CeO2-5 nanocomposite.
3.4. Adsorption isotherms
The equilibrium of adsorption is one of the important
physicochemical aspects for the evaluation relationship
between the quantity of adsorbate per unit of adsorbent
(qe) and its equilibrium solution concentration (Ce) at a
constant-temperature was known as the adsorption
isotherm. The distribution of solute between the solid and
liquid phases is a measure of the distribution coefficient in
the adsorption process and can be shown by the
Freundlich and Langmuir equations.
The Langmuir adsorption [28] is based on the
assumption that adsorption occurs at specific
homogeneous sites within the adsorbent and once a dye
molecule occupies a site, no further adsorption takes place
at that site. Moreover, Langmuir’s model of adsorption
depends on the assumption of monolayer adsorption on a
structurally homogeneous adsorbent, where all the
sorption sites are identical and energetically equivalent.
The intermolecular forces decrease rapidly with distance
and can be used to predict the existence of monolayer
coverage of the adsorbate at the outer surface of the
adsorbent.
The Freundlich equilibrium isotherm [29] is used for the
description of multilayer adsorption with interaction
between adsorbed molecules. Model predicts that the dye
concentrations on the material will increase as long as
there is an increase of the dye concentration in the
solution. Usually it applies to adsorption onto
heterogeneous surfaces with a uniform energy distribution
and reversible adsorption. The application of the
Freundlich equation suggests that adsorption energy
exponentially decreases on completion of the adsorption
centers of an adsorbent. The linear form of Langmuir and
Freundlich equations are represented mathematically by
Eqs. (4) and (5), as follows:
𝐶𝑒 qe⁄ = 1 KL. qmax⁄ + Ce 𝑞𝑚𝑎𝑥⁄ (4)
lnqe = lnKF + (1n⁄ )lnCe (5)
Where qe is the amount of dye adsorbed at equilibrium
(mg/g), qmax is the theoretical maximum monolayer
sorption capacity (mg/g), and Ce is the equilibrium
concentration of dye in solution (mg L−1). KL, KF and n are
empirical constants. KL measures the affinity of the
sorbent for the solute. KF and n are constants that can be
related to the adsorption capacity and the adsorption
intensity, respectively. 1/n values indicate the type of
isotherm to be irreversible (1/n = 0), favorable (0 ˂1/n ˂
1) and unfavorable (1/n >1) [30].
For the Langmuir-type adsorption process, the influence
of the isotherm shape on whether adsorption is favorable
or unfavorable can be classified by a dimensionless
separation factor RL, which is considered as a more
reliable indicator of the adsorption capacity. This constant
is given by the following [31]:
𝑅𝐿 =1
1 + 𝐾𝐿𝐶0
(6)
Where Co is the initial dye concentration and KL is the
Langmuir adsorption constant (L/mg). The values of RL
indicate the shapes of isotherms to be either unfavorable
(RL> 1), linear (RL= 1), favorable (0 ˂ RL˂ 1) or
irreversible (RL= 0). Favorable adsorption is reported
when the RL values are between 0 and 1.
The equilibrium adsorption data of dye onto
PANI/CeO2 adsorbents was analyzed using Langmuir and
Freundlich models. The obtained experimental data were
fitted with these two models; the resulting plots were
shown respectively in Fig. 7 (a &b). Table 2 summaries
the Langmuir and Freundlich isothermal parameters for
the adsorption of dye on as-prepared PANI/CeO2
nanocomposites. As shown in Table 2, the Langmuir and
Freundlich isotherms were found to be linear over the
whole concentration range studied with R2> 0.98.In
addition, the values of 1/n ˂1showed that the adsorption
of the dye was favorable by Freundlich isotherm model
(Table 2). It can also be observed that the values of qmax
were higher than qe (exp), which confirmed the unfavorable
uptake of the dye process by Langmuir isotherm model.
So, the experimental equilibrium data were better
described by Freundlich isotherm model indicating
positive cooperativity in binding and a heterogeneous
nature of adsorption.
Page 6
Khairy et al., J. Bas. & Environ. Sci., 3 (2016) 123 – 132
128
Fig. 7 Langmuir isotherms (a) and Freundlich isotherms
(b) for Remazol Red RB-133 dye adsorption onto
PANI/CeO2 nanocomposites.
Table 2 Langmuir and Freundlich isotherm constants for Remazol Red RB-133 dye adsorption onto PANI/CeO2
nanocomposites.
nanocomposites Langmuir isotherm model Freundlich isotherm model
qmax
(mg/g)
KL
(L/mg)
R2 RL KF
(mg/g)
n 1/n R2
PANI/CeO2-1 18.6 6 0.992 0.24 13.3 1.02 0.98 0.99
PANI/CeO2-5 13.9 5.6 0.996 0.26 7.3 1.11 0.90 0.999
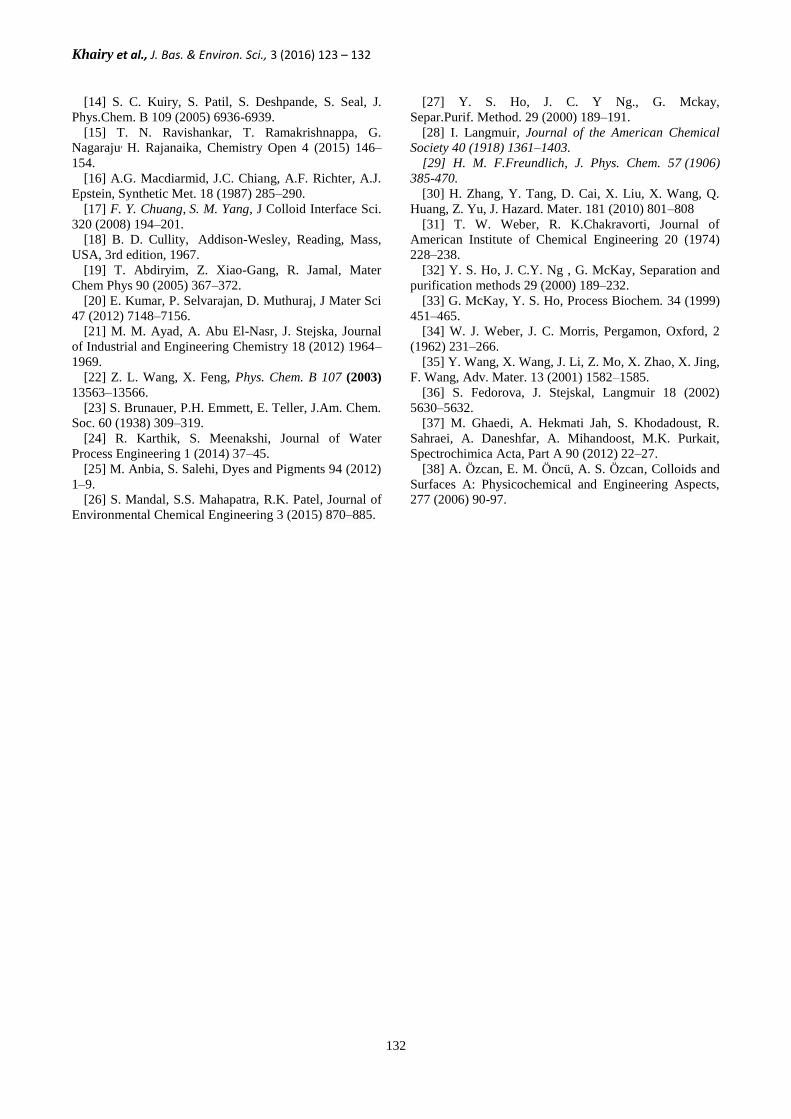
3.4 Kinetics of Adsorption
The adsorption kinetics provides an idea about the
mechanism of adsorption, from which efficiency of
process estimated. Any adsorption procedure is ordinarily
controlled by three dispersion steps: (i) transport of the
solute from the bulk solution to the film surrounding the
adsorbent, (ii) from the film to the adsorbent surface, (iii)
from the surface to the inside targets took after by tying
of the metal particles to the dynamic districts. The general
rate of the adsorption procedure is directed by the slowest
step and as a rule it is felt that the step (ii) prompts
surface adsorption and the stride (iii) prompts intra-
molecule adsorption [32]. The kinetics of Remazol Red
RB-133 (RR RB-133) dye adsorption onto 0.1 g of
PANI/CeO2 nanocomposites and pure PANI acquired by
batch contact time studies for a dye concentration of 50
mg L−1 at pH 6.5 were demonstrated in Fig. 8. The results
revealed that adsorption procedure was obviously time
dependent such that the dominant part of the dye
adsorption from aqueous solution was finished in more or
less 1.5 h. Also, under the same experimental conditions
utilized, PANI/CeO2 nanocomposites have much faster
dye uptake rate and higher adsorption capacity than that
of pure PANI adsorbent. It is noticed that CeO2 loading
accelerated the adsorption process. PANI/CeO2-5
adsorbent reached about 99% of the adsorption capacity
in almost half the time as pure PANI, because of the high
solid/liquid interface and upgraded adsorption sites. It
must be identified by their higher particular surface
regions and smaller pore width and also exceptional
microporous structures. The removal efficiencies of dye
within 40 min were ranked as: PANI/CeO2-
5>PANI/CeO2-1>pure PANI. In order to assess the
kinetic mechanism which controls the adsorption process,
the pseudo-first-order [34], pseudo-second order [35], and
intraparticle diffusion [36] models were examined, and
the validity of the models were confirmed by the linear
equation analysis log (qe – qt) vs. t, (t/qt) vs. t, and qt vs.
t1/2, separately. Great relationship with the kinetic data
clarifies the dye adsorption mechanism on the polyaniline
composite.
The first model is pseudo-first order and can be
represented by the following form [33]:
ln(𝑞𝑒 − 𝑞𝑡) = ln𝑞𝑒 − 𝑘1𝑡 (7)
Where qe and qt are the amounts of dye adsorbed
(mg/g) at equilibrium and at time t (min), individually,
and k1 (min−1) is the pseudo-first-order rate constant.
Values of k1 are obtained from the plots of ln (qe–qt)
versus t (see Fig. 9a) for the four composite specimens.
The correlation coefficient R2 values were not higher than
0.98 and the experimental qe values demonstrated a good
agreement with the calculated values from the direct plots
(Table 3), showing the suitability of this model to
Page 7
Khairy et al., J. Bas. & Environ. Sci., 3 (2016) 123 – 132
129
represent the adsorption procedure of dye onto the
PANI/CeO2 nanocomposites and pure PANI.
The second model, the pseudo-second-order reaction, is
dependent on the amount of solute adsorbed on the
surface of the adsorbent and the amount adsorbed at
equilibrium. It can be described in the following form
[34]
𝑡 𝑞𝑡⁄ = 1 𝑘2𝑞𝑒2⁄ + 𝑡 𝑞𝑒⁄ (8)
Fig. 9b shows the curve-fitting plots of Equation 8
((t/qt) vs. t), and the parameter values of qe, k2 and R2
were determined and listed in Table 3. From which it can
be seen that the pseudo-second-order kinetic model
showed a better coefficient correlation for the adsorption
of dye onto the PANI/CeO2 nanocomposites and pure
PANI compared to the pseudo-first-order model.
Moreover, the calculated values of qe for pseudo-second-
order model are in good agreement with the experimental
values of qe which indicates that the rate-limiting step
may be chemisorption and that the rate equation follows
second-order kinetics.
The third model is an intraparticle diffusion model. It is
proposed by Weber and Morris [35] and stated that if
intraparticle diffusion is the rate-controlling factor,
uptake of the adsorbate varies with the square root of time
and is expressed by Equation 9:
𝑞𝑡 = 𝑘𝑑𝑖𝑓√𝑡 + 𝐶 (9)
Where kdifis the intraparticle diffusion rate constant
(mg/gmin1/2) and C is the intercept related to the
thickness of the boundary layer. The plots of qt versus t1/2,
shown in Fig. 9c, would realize a straight relationship and
kdif and C values obtained from these plots were recorded
in Table 3. Fig. 9c also shows that there are two different
stages: a linear stage and a non-linear stage, which
indicates more than one process is involved in the dye
sorption process. The beginning stage in diffusion model
is the mass exchange of adsorbate molecule from the
mass reaction to the adsorbent surface and the second
stage is attributed to the intraparticle pore diffusion
effect.
Fig. 8 The variation in adsorption capacity with
adsorption time for Remazol Red RB- 133 dye onto
PANI and PANI/CeO2 nanocomposites (dye
concentration is 50 mg L–1, adsorbent dosage = 0.1 g L–1,
pH = 6.5).
Table 3 Fitted kinetics parameters for the adsorption of Remazol Red RB-133 dye on pure PANI and PANI/CeO2
nanocomposites (dye: 50 mg/L; pH: 6.5; 0.1 g)..
Intra-particle diffusion Pseudo-second-order
model
Pseudo-first-order model qe,exp
(mg/g)
Sampl
es
R
22
C
2
kdif2
(mg/m
in ½ g)
R
12
C1 kdif1
(m
g/min ½ g)
R2 k2
(g
/mg
min)
qe,ca
l
(mg/
g)
R2 k1 (min-1)
qe,cal (mg/g)
0.
62
3
3.5 0.52
0.
99 -1.77
4.2
5
0.98 5.22
x10–4
40 0.93 0.03
3
40.5 36 PANI
0.
93
2
9.9 1.04
0.
99 -1.04
6.8
4
0.99 8.75
x10–4
43 0.98 0.07
2
34.8 37.8 PANI/
CeO2-1
0.
97
1
8.4 3.87
0.
99 6.39
6.7
8
0.99 2.61
x10–3
43.
3
0.98 0.11 30 38.7 PANI/
CeO2-5
Page 8
Khairy et al., J. Bas. & Environ. Sci., 3 (2016) 123 – 132
130
Fig. 9 Pseudo-first-order kinetics (a), second-order
kinetics (b) and intra-particle diffusion kinetics (c) for
Remazol Red RB-133 dye adsorption onto PANI and
PANI/CeO2 nanocomposites (dye concentration is 50 mg
L–1, adsorbent dosage = 0.1 g L–1, pH = 6.5).
3.5. Adsorption thermodynamic The energy and entropy considerations were very
important in order to understand the kinetics of
adsorption. Thermodynamic parameters such as standard
enthalpy change (ΔHo) and standard entropy change
(ΔSo) were determined from the slope and intercept of
Van’t Hoff’s plot of ln Kc versus 1/T (Equation 10) [36,
37].
lnKc = ln (qe
Ce⁄ ) = − ΔHο
RT⁄ + ΔSο
R ⁄ (10)
where Kc is the equilibrium constant, (qe/Ce) is the
adsorption distribution coefficient, (ΔHo) is the standard
enthalpy change (kJ mol–1), (ΔSo) is standard entropy
change (kJ mol–1 K–1), T is the temperature in Kelvin and
R is the universal gas constant (8.314 J/ mol K).
The change in free energy of sorption (ΔGo) is
calculated by
ΔGο = ΔHο − TΔSο (11) The calculated values of thermodynamic parameters are
shown in Table 4. The negative values of ΔHo The
negative value of entropy change (ΔSo) corresponds to a
decrease in degree of freedom of the adsorbed species.
This suggests the decrease in concentration of adsorbate
in solid–solution interface, indicating there by an increase
in adsorbate concentration on the solid phase. This is the
normal effect of chemical adsorption phenomenon, which
takes place through ion-exchange interactions [39]. In
order to further confirm that chemisorption is the
predominant mechanism, the values of activation energy
(Ea) and sticking probability (S*) were calculated using a
modified Arrhenius type equation related to surface
coverage (θ) as follows:
S∗ = (1 − θ) e− E𝑎 𝑅𝑇⁄ (12) The S* is a function of the adsorbate/adsorbent system
under investigation, its value lies in the extent 0 <S*< 1
and is a subject to the temperature of the system. The
value of θ can be calculated from the following equation:
θ = [1 −Ce
C0⁄ ] (13)
The Ea was calculated from the slope of the plot of ln
(1- θ) vs. 1/T (Fig. 10b). The magnitude of activation
energy gives an idea regarding the type of adsorption,
which is predominantly physical or chemical. The
physisorption frames as a general rule have energies in
the extent of 5–40 kJ/mol, while higher activation
energies (40–800 kJ/mol) propose chemisorption [38].
The value of Ea for the adsorption of Remazol Red RB-
133 on PANI/CeO2-5 nanocomposite was observed to be
55.17 kJ/mol, and this suggesting that chemisorption was
the predominant mechanism involved.
Page 9
Khairy et al., J. Bas. & Environ. Sci., 3 (2016) 123 – 132
131
Fig. 10 (a) Van’t Hoff plot and (b) modified Arrhenius
plot for the adsorption of Remazol Red RB-133 dye onto
PANI/CeO2-5 nanocomposite.
Table 4 Thermodynamic parameters for the adsorption of Remazol Red RB-133 dye (50 mg/L) on PANI/CeO2-5
nanocomposite at pH 6.5.
S* Ea
(kJ mol−1)
Kc ΔH º
(kJ mol−1)
ΔSº
(JK−1mol−1)
ΔGº
(kJmol−1)
Temperature
(ºC)
1.85×10⁻¹¹ 55.17 99.37 -45.29 -115.24 -10.94 25
36.87 -9.79 35
23.05 -8.64 45
18.41 -7.49 55
4. Conclusions
The pure PANI, PANI/CeO2 nanocomposites (1 and 5
wt% CeO2) were prepared from aniline in the presence of
an oxidizing agent via in situ polymerization method.
Introducing CeO2 into the polymeric matrix significantly
improved the surface and adsorptive properties of PANI.
The composite samples showed better adsorption
efficiency for removing RR RB- 133 acid dye from an
aqueous solution than that of pure PANI. Adsorption rate
increases in the following order: PANI/CeO2-
5>PANI/CeO2-1> pure PANI. This is possibly because of
the increase in the surface area of polymer. The
adsorption kinetics can be successfully fitted to pseudo-
second-order kinetic model. Adsorption parameters for
the Langmuir and Freundlich isotherms were determined
and the equilibrium data were best described by the
Freundlich isotherm model. The adsorption of the acid
dye at various temperatures shows that the adsorption is
spontaneous, endothermic and marked with an increased
randomness at the solid–liquid interface. The present
study suggested that conducting PANI/CeO2 can be used
as a potential adsorbent for the removal of acidic dyes
from aqueous solutions.
5. References
[1] K.Y. Foo, B.H. Hameed, Chemical Engineering
Journal 156 (2010) 2–10.
[2] A. M. Donia, A. A. Atia , W. A. Al-amrani, A. M.
El-Nahas, Journal of Hazardous Materials 161 (2009)
1544–1550.
[3] A.R. Cestri, E.F.S. Vieira, A.A. Pinto, E.C.N.
Lopes, J. Colloid Interf. Sci. 292 (2005) 363–372.
[4] A. Krysztafkiewicz, S. Binkowski, T. Jesionowski,
Appl. Surf. Sci. 199 (2002) 31–39.
[[5] K.C. Chen, J.Y. Wu, C.C. Huang, Y.M. Liang,
S.C.J. Hwang, Journal of Biotechnology 101 (2003) 241–
252.
[6] T. Robinson, G. McMullan, R. Marchant, P. Nigam,
Remediation of dyes in textile effluent: a critical review
on current treatment technologies with a proposed
alternative, Biosour. Technol. 77 (2001) 247–255.
[7] T. Jesionowski, Dyes and Pigments 55 (2002) 133–
141.
[8] E. Eren, B. Afsin, Dyes and Pigments 76 (2008)
220–225.
[9] A.R. Cestari, E.F.S. Vieira, G.S. Vieira, L.E.
Almeida, J. Hazard. Mater. B 138 (2006) 133–141.
[10]Y.C. Sharma, S.N. Uma, G.F. Upadhyay, J. of
Applied Science in Environmental Sanitation 4 (2009)
21–24.
[11] A. Khenifi , Z. Bouberka , F. Sekrane, M.
Kameche, Z. Derriche, Adsorption 13 (2007) 149–158.
[12] R. C. Torane, K. S. Mundhe, A. A. Bhave, G. S.
Kamble, R. V. Kashalkar, N. R. Deshpande, Der Pharma
Chemica 2 (2010) 171–177.
[13] D. Bingola, S. Veli, S. Zora, U. Ozdemirb, Synth.
Met. 162 (2012) 1566 –1571.
Page 10
Khairy et al., J. Bas. & Environ. Sci., 3 (2016) 123 – 132
132
[14] S. C. Kuiry, S. Patil, S. Deshpande, S. Seal, J.
Phys.Chem. B 109 (2005) 6936-6939.
[15] T. N. Ravishankar, T. Ramakrishnappa, G.
Nagaraju, H. Rajanaika, Chemistry Open 4 (2015) 146–
154.
[16] A.G. Macdiarmid, J.C. Chiang, A.F. Richter, A.J.
Epstein, Synthetic Met. 18 (1987) 285–290.
[17] F. Y. Chuang, S. M. Yang, J Colloid Interface Sci.
320 (2008) 194–201.
[18] B. D. Cullity, Addison-Wesley, Reading, Mass,
USA, 3rd edition, 1967.
[19] T. Abdiryim, Z. Xiao-Gang, R. Jamal, Mater
Chem Phys 90 (2005) 367–372.
[20] E. Kumar, P. Selvarajan, D. Muthuraj, J Mater Sci
47 (2012) 7148–7156.
[21] M. M. Ayad, A. Abu El-Nasr, J. Stejska, Journal
of Industrial and Engineering Chemistry 18 (2012) 1964–
1969.
[22] Z. L. Wang, X. Feng, Phys. Chem. B 107 (2003)
13563–13566.
[23] S. Brunauer, P.H. Emmett, E. Teller, J.Am. Chem.
Soc. 60 (1938) 309–319.
[24] R. Karthik, S. Meenakshi, Journal of Water
Process Engineering 1 (2014) 37–45.
[25] M. Anbia, S. Salehi, Dyes and Pigments 94 (2012)
1–9.
[26] S. Mandal, S.S. Mahapatra, R.K. Patel, Journal of
Environmental Chemical Engineering 3 (2015) 870–885.
[27] Y. S. Ho, J. C. Y Ng., G. Mckay,
Separ.Purif. Method. 29 (2000) 189–191.
[28] I. Langmuir, Journal of the American Chemical
Society 40 (1918) 1361–1403.
[29] H. M. F.Freundlich, J. Phys. Chem. 57 (1906)
385-470.
[30] H. Zhang, Y. Tang, D. Cai, X. Liu, X. Wang, Q.
Huang, Z. Yu, J. Hazard. Mater. 181 (2010) 801–808
[31] T. W. Weber, R. K.Chakravorti, Journal of
American Institute of Chemical Engineering 20 (1974)
228–238.
[32] Y. S. Ho, J. C.Y. Ng , G. McKay, Separation and
purification methods 29 (2000) 189–232.
[33] G. McKay, Y. S. Ho, Process Biochem. 34 (1999)
451–465.
[34] W. J. Weber, J. C. Morris, Pergamon, Oxford, 2
(1962) 231–266.
[35] Y. Wang, X. Wang, J. Li, Z. Mo, X. Zhao, X. Jing,
F. Wang, Adv. Mater. 13 (2001) 1582–1585.
[36] S. Fedorova, J. Stejskal, Langmuir 18 (2002)
5630–5632.
[37] M. Ghaedi, A. Hekmati Jah, S. Khodadoust, R.
Sahraei, A. Daneshfar, A. Mihandoost, M.K. Purkait,
Spectrochimica Acta, Part A 90 (2012) 22–27.
[38] A. Özcan, E. M. Öncü, A. S. Özcan, Colloids and
Surfaces A: Physicochemical and Engineering Aspects,
277 (2006) 90-97.