Kinetics of pyrolysis, combustion and gasification of three biomass fuels
Osvalda Senneca ⁎
Istituto di Ricerche sulla Combustione (C.N.R.), P.le Tecchio 80, Naples, 80125, Italy
Received 10 March 2006; received in revised form 8 September 2006; accepted 13 September 2006
Abstract
The paper compares the microstructural properties and the intrinsic reactivity of pine seed shells, olive husk and wood chips upon pyrolysis,combustion and gasification (with CO2 and H2O). Such biomasses, all of interest in energy production, are quite different from one another interms of O/C and H/C content, of porosimetric structure and of ash content.
An extensive campaign of isothermal and non-isothermal thermogravimetric experiments allowed to assess the reactivity of the fuels and toobtain kinetic expressions for the main reactive processes (pyrolysis, char combustion and char gasification).
Biomass energy currently represents approximately 14%of world final energy consumption, a share higher than that ofcoal (12%) and comparable to those of gas (15%) and electricity(14%). In fact the importance of biomass varies significantlyacross regions of the world. Its share reaches 80–90% in thepoorest countries of Africa and Asia, dropping to 2–3% in thewestern countries. Biomass is however becoming a more andmore attractive fuel also in the industrialised countries, becauseit is a renewable energy source and it is CO2 neutral [1–6].Potential biomass fuels are very numerous, including wood,short-rotation woody crops and herbaceous species, bagasse,grass, as well as wastes: paper and wood wastes, municipal solidwaste, sawdust, wastes from agriculture and food processing andmany more.
While the traditional energetic use of biomass is combustion,modern options are much more differenciated. The main option isthe use of biomass in utility boilers alone or co-fired with coal.
Studies [7–9] have shown that cofiring biomass with coal does notonly reduce the emissions of greenhouse gases (CO2, CH4, etc.)per unit of energy produced butmay have a positive impact also onthe emission of other pollutants, such as SO2 and NOx.Alternatively biomass can be pyrolysed or gasified producing aliquid fuel or a gas-like fuel such asmethane, hydrogen and carbonmonoxide. In pyrolysis processes the thermal destruction oforganic materials is pursued by heating in the absence of oxygenor by combustion with limited oxygen supply. The processvariables can be set to enhance the yield in gaseous versus liquidproducts. In gasification processes biomass reacts with carbondioxide and steam at high temperatures to form a gas mixture ofcarbon monoxide, hydrogen and methane, together with carbondioxide and nitrogen which is suitable for direct use in combined-cycle gas turbine systems or can be used as syn-gas. Co-pyrolysisand co-gasification of biomass with coal are also feasible options.
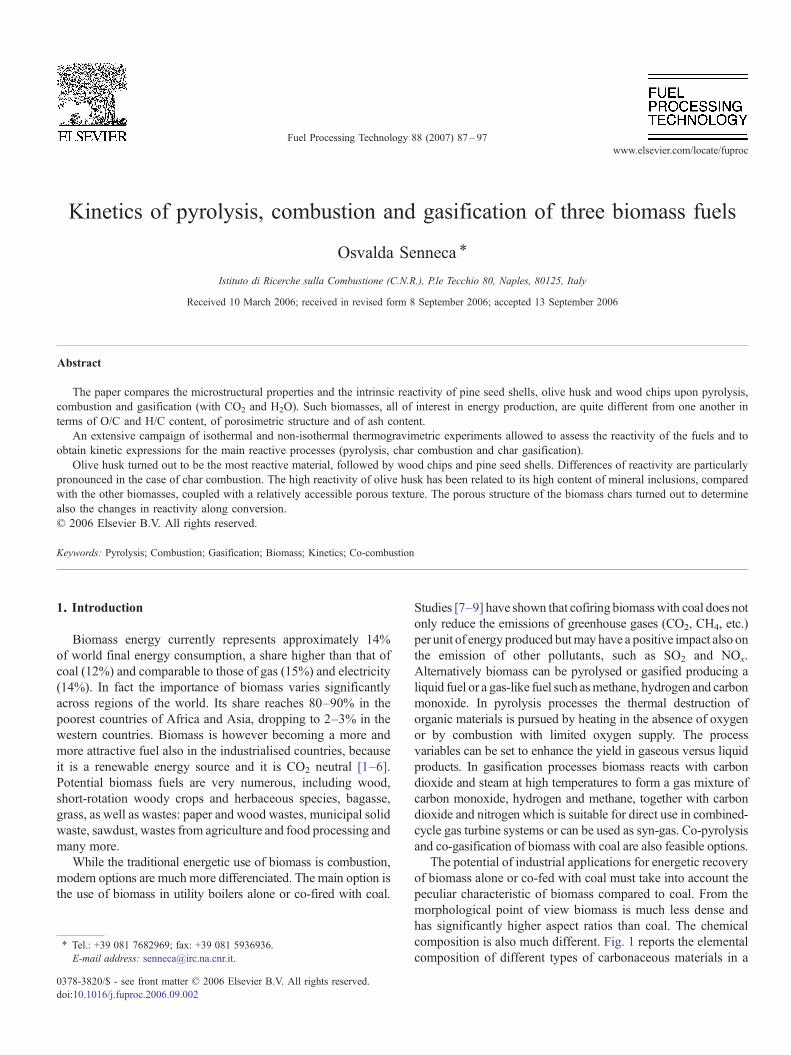
The potential of industrial applications for energetic recoveryof biomass alone or co-fed with coal must take into account thepeculiar characteristic of biomass compared to coal. From themorphological point of view biomass is much less dense andhas significantly higher aspect ratios than coal. The chemicalcomposition is also much different. Fig. 1 reports the elementalcomposition of different types of carbonaceous materials in a
Fig. 1. Van Krevelen diagram for different materials.
88 O. Senneca / Fuel Processing Technology 88 (2007) 87–97
Van Krevelen type diagram [10]. It can be noted that com-position variations among biomass fuels are much larger thanamong coals. All biomass fuels have however more oxygen andhydrogen and less carbon than coal. This is consistent with thefact that biomass fuels have much higher volatile and moisturecontent compared to coal and lower heating value. The inor-ganic properties of biomass fuels also differ significantly fromcoal. As a class, biomass fuels have less aluminum, iron, andtitanium, more silica, potassium and some times calcium thancoal. Nitrogen, chlorine, and metal content also vary signifi-cantly among biomass fuels. These components are directlyrelated to NOx emissions, corrosion and ash deposition.
Biomass is in general considered more reactive than coalupon pyrolysis, combustion and gasification. However the widevariability of chemical and physical properties among differenttypes of biomass reflects also in variable reactivity [11]. Whileextensive modelling work has been done on the pyrolysis andcombustion of biomass [12–24], the possibility to applysuccessfully such models to a given fuel relies on the avail-ability of appropriate chemico-physical and kinetic data.
In the present paper three biomasses with potential interest forenergy production have been characterised for their morpholog-ical and chemical properties and in terms of their reactivity,namely pine seed shells, olive husk, and wood chips. Non-isothermal thermogravimentric experiments have been carried outon the three biomasses under purely inert conditions and undermoderately oxidizing conditions in order to assess their reactivityupon pyrolysis and oxidative pyrolysis. Isothermal thermogravi-metric experiments with oxygen, carbon dioxide and watervapour have been carried out on pre-pyrolysed samples in order toassess the reactivity of biomass chars upon combustion andgasification. Kinetic expressions have been obtained for pyrol-ysis, char combustion and char gasification with carbon dioxide.
2. Experimental
2.1. Materials
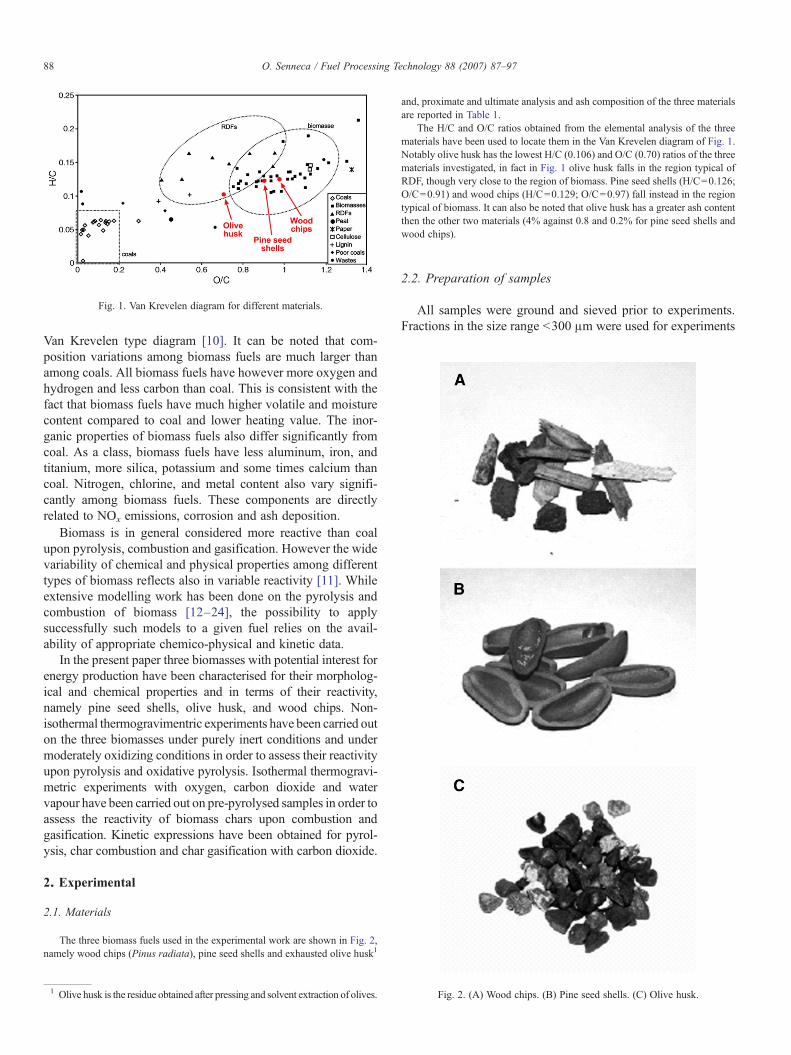
The three biomass fuels used in the experimental work are shown in Fig. 2,namely wood chips (Pinus radiata), pine seed shells and exhausted olive husk1
1 Olive husk is the residue obtained after pressing and solvent extraction of olives.
and, proximate and ultimate analysis and ash composition of the three materialsare reported in Table 1.
The H/C and O/C ratios obtained from the elemental analysis of the threematerials have been used to locate them in the Van Krevelen diagram of Fig. 1.Notably olive husk has the lowest H/C (0.106) and O/C (0.70) ratios of the threematerials investigated, in fact in Fig. 1 olive husk falls in the region typical ofRDF, though very close to the region of biomass. Pine seed shells (H/C=0.126;O/C=0.91) and wood chips (H/C=0.129; O/C=0.97) fall instead in the regiontypical of biomass. It can also be noted that olive husk has a greater ash contentthen the other two materials (4% against 0.8 and 0.2% for pine seed shells andwood chips).
2.2. Preparation of samples
All samples were ground and sieved prior to experiments.Fractions in the size range b300 μm were used for experiments
of pyrolysis and oxidative pyrolysis in the thermogravimetricapparatus.
Fractions in the size range 3.35–5.0 mm were instead used toprepare larger amounts of char samples to be used for furtheranalyses. Char samples were prepared in a bubbling fluidisedbed reactor operated with nitrogen at 850 °C for 5 min. Afterpyrolysis in the fluidised bed, char samples were ground andsieved to the size range b300 μm.
Some char samples were also reacted with air or with carbondioxide up to 10% carbon conversion. Partial conversion wasrealised in an electrically heated tubular furnace operated at440 °C and at 800 °C in the case of reaction with air and withCO2, respectively. The reaction times required to reach 10%carbon conversion, evaluated on the basis of results ofthermogravimetric analysis, were 8 min with air and 39 minwith CO2 for pine seed shells, 2.5 min with air and 14 min withCO2 for olive husk, 3 min with air and 16 min with CO2 forwood chips.
2.3. Morphological characterization of chars
A selection of char particles prepared in the fluidised bedreactor were embedded in epoxy resin and cut. Cross-sectionswere observed under a scanning electron microscope (PhilipsXL30 with LaB6 filament) at magnifications up to 50 times.
2.4. Porosimetric characterization of chars
Porosimetric analysis was carried out on samples of charproduced in the fluidised bed reactor under inert conditions as
well as on char samples partially reacted with air and withcarbon dioxide. The analysis included mercury intrusionporosimetry, adsorption of N2 at 77 K and of CO2 at 273 K.The porosimetric station consisted in a high-pressure mercuryporosimeter Carlo Erba 2000 equipped with a Macropore unitand a Carlo Erba Sorptomatic 1900.
Mercury porosimetry allowed to evaluate the pore sizedistribution of char in the size range of 200 μmNdpN75 Å andthe % porosity, ε. Nitrogen adsorption results allowed to eval-uate BET surface areas. Data of carbon dioxide adsorption wereanalysed according to Dubinin Radishkevich method to eval-uate micropore volumes.
2.5. Thermogravimetric experiments
Five sets of thermogravimetric experiments have been car-ried out:
• non-isothermal pyrolysis under inert conditions;• non-isothermal pyrolysis under oxidative conditions;• isothermal combustion of char;• isothermal gasification of char with carbon dioxide;• isothermal gasification of char with water vapor.
A thermobalance Rheometrics PL1000M has been usedwhich features maximum temperature of 1000 °C and maxi-mum heating rate of 900 °C/min.
In non-isothermal experiments samples were dehumidified inthe TG for 5 min at 100 °C in an upward flow of 50 ml/min. Thetemperature was then raised from 100 °C to 800 °C at a constantheating rate, HR, comprised between 5 and 100 °C/min. Thesample was finally held at 800 °C for 15 min. For experiments ofpyrolysis under inert conditions 100% nitrogen of chromato-graphic grade was used, additionally purified in a copper furnaceat 850 °C. For experiments of pyrolysis under oxidativeconditions a mixture of 5% oxygen in nitrogen was used.
In isothermal experiments of char combustion/gasificationthe pre-pyrolysed char was heated up in the thermobalance to agiven temperature TR in a flow of nitrogen. Heat up took lessthan 30 s. The gas was then switched from nitrogen to thedesired reactive atmosphere and isothermal combustion tookplace till carbon burn-out. In experiments of char combustionthe reaction temperature TR was comprised between 400 and600 °C and mixtures of oxygen in nitrogen were used withoxygen partial pressure in the range 0.05–0.21 bar. In experi-ments of char gasification with carbon dioxide the reactiontemperature TR was comprised between 750 and 910 °C andCO2–N2 mixtures were used with carbon dioxide partialpressure in the range 0.05–1 bar. Char gasification with watervapour was carried out at 830 °C with 30% H2O(v) in N2. Thewater vapour–nitrogen mixture was realised by a BronkhorstControl Evaporator Mixing device.
It must be emphasized that in all the experiments the particlesize was kept below 300 μm, the amount of sample loaded waskept very small (generally around 1 mg and sometimes evenbelow 0.5 mg) and particles were evenly spread on the sampleholder. These precautions were necessary to avoid internal
90 O. Senneca / Fuel Processing Technology 88 (2007) 87–97
gradients of heat and gas concentration and also to avoid prob-lems of particle overheating and ignition, which could indeedoccur in experiments on olive husk at too high temperatures,heating rate and/or sample loading. For this reason combustionof olive husk char was carried out at temperatures not exceeding480 °C at the value of oxygen partial pressure of 0.05 bar andnot exceeding 438 °C in air.
2.6. Analysis of thermogravimetric data
The mass loss recorded during non-isothermal experimentswas worked out to obtain TG plots of m/mo versus T and DTG
plots of −dmdT
1mo
¼ dfdT
mo−ml
moversus T, where m, mo and m∞
are the actual weight of the sample, the initial weight of sample(after the dehumidification stage in pyrolysis and oxidativepyrolysis experiments) and the weight of the sample residue atthe end of the experiment, respectively.
Results were fitted to a power law expression:
−1mo
dmdt
¼ ko exp−ERT
� �1−
ml
mo
� �a
ð1Þ
The kinetic parameters of Eq. (1) were obtained by non-linearregression analysis of the DTG curves according to the Friedman[25] and Kissinger [26] methods using general-purposeregression tools. Data from experiments at heating rate (HR)below 20 °C/min were used to estimate the kinetic parameters.
The mass loss recorded during isothermal experiments ofchar combustion and gasification was worked out to calculate:
1. the carbon conversion degree f=(mo−m)/(mo−m∞), m, mo
and m∞ being the actual weight of the sample, the initialweight of sample and the weight of the sample residue at theend of the experiment;
2. the istantaneous rate of carbon conversiondfdt
� �TG;
3. the time τ0.5 required to achieve 50% dcarbon conversion;4. data of instantaneous carbon conversion rate have been
normalized with respect to τ0.5 and plotted against the carbonconversion degree f.
A power law kinetic expression has been applied for charcombustion and gasification:
dfdt
¼ A fð Þd ko exp −ERT
� �png ð2Þ
where pg is the partial pressure of the reacting gas (O2/CO2/H2O)in char combustion and gasification experiments and A( f )describes the evolution of instantaneous conversion rate alongburn-off.
Accordingly the time τ0.5 required to achieve 50%conversion reeds:
s0:5 ¼ 1ko
expERT
� �p−ng
Z 0:5
0
d fAð f Þ ð3Þ
and the reaction rate averaged over the first 50% conversion:
R0:5 ¼ 0:5s0:5
¼ ko0 exp
−ERT
� �png ð4Þ
kinetic parameters of Eq. (4) were obtained by non-linearregression analysis of the carbon conversion averaged over theconversion interval f=[0, 0.5].
3. Results
3.1. Morphological and porosimetric characterization of chars
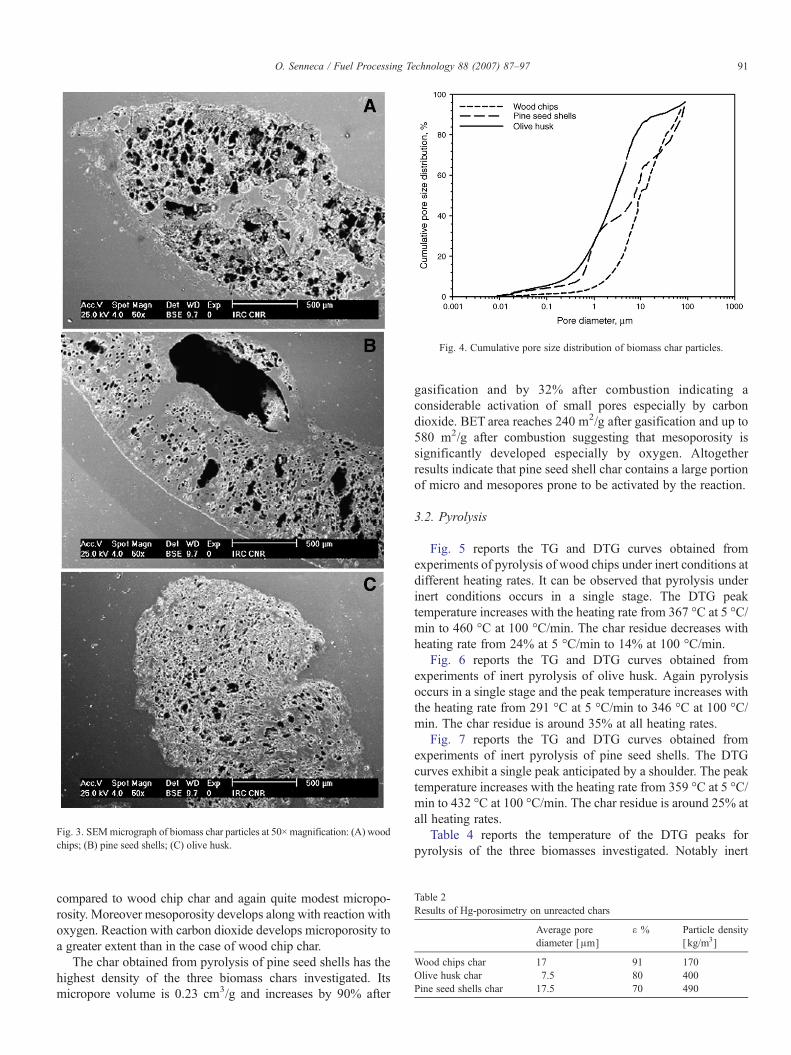
Fig. 3A–C show the cross-sections of char particles of woodchips, pine seed shells and olive husk observed under thescanning electron microscope. The micrographs show that charfrom wood chips and pine seed shells has a highly anisotropicpore structure characterized by parallel channels running in theaxial direction (orthogonal to the paper sheet). This is aconsequence of the fibrous structure of the parent biomass.Large pores and cavities are also evident in the case of olivehusk char, but the orientation appears to be random. Acomparison of the three micrographs shows that the solidmatrix of the char from wood chips is the most porous, whilethat of pine seed shell char is the most compact.
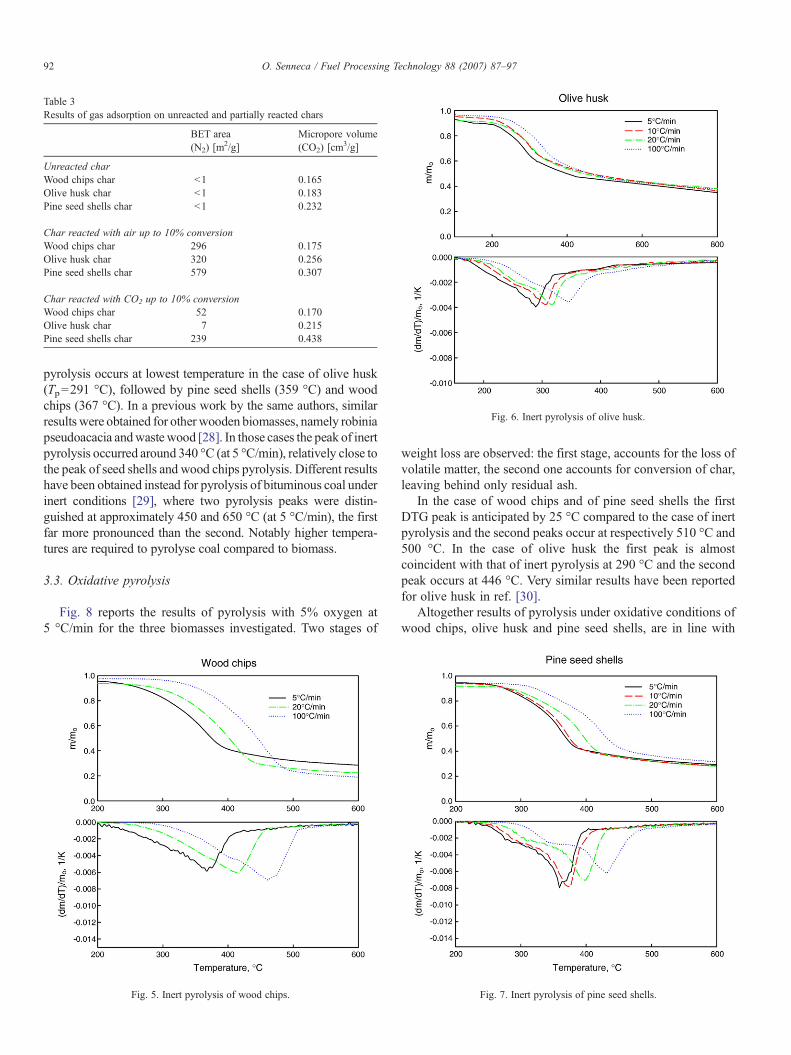
The cumulative pore size distribution on volume basis for thechars of the three biomass fuels is reported in Fig. 4. Table 2 reportsthe overall char porosity and density calculated from porosimetricdata. Table 3 reports the BET surface area and the microporevolume of unconverted char samples and of char reactedwith air orwith carbon dioxide up to 10% carbon conversion.
It can be observed that wood chip char is characterized by thelowest density and the largest porosity, which consists pre-dominantly of macropores (N1 μm). Wood chip char has alsothe smallest micropore volume of the three chars (0.17 cm3/g).Moreover micropore volume of wood chip chars is scarcelyaffected by partial conversion both with air and with carbondioxide. BET area of wood chip char is negligible afterpyrolysis, it increases to 52 m2/g after 10% gasification and upto 300 m2/g after 10% combustion. Noteworthy the increase inBET surface with the progress of carbon consumption can berelated with the opening up and development of mesopores,while the increase of micropore volume can be related with theevolution of microporosity [27]. The observed results thereforesuggest that reaction of wood chip char with oxygen opens uplarger pores (macro and mesopores). These are instead scarcelyaffected by reaction with carbon dioxide. The extent and therole of microporosity are very limited in wood chip char.
Olive husk generates a char that is denser thanwood chips charand relatively less macroporous. The pore size distribution isindeed shifted toward smaller pore sizes.Micropore volume of theunconverted char is comparable with that of wood chips(0.18 cm3/g) but increases by 17% after modest gasification andby 40% after combustion. BET surface increases up to 320 m2/gafter combustion, whereas it is scarcely affected by gasificationwith CO2. Altogether results of porosimetric analysis suggest thatolive husk char possess a more extensive network of mesopores
Table 2Results of Hg-porosimetry on unreacted chars
compared to wood chip char and again quite modest micropo-rosity. Moreover mesoporosity develops along with reaction withoxygen. Reaction with carbon dioxide develops microporosity toa greater extent than in the case of wood chip char.
The char obtained from pyrolysis of pine seed shells has thehighest density of the three biomass chars investigated. Itsmicropore volume is 0.23 cm3/g and increases by 90% after
gasification and by 32% after combustion indicating aconsiderable activation of small pores especially by carbondioxide. BET area reaches 240 m2/g after gasification and up to580 m2/g after combustion suggesting that mesoporosity issignificantly developed especially by oxygen. Altogetherresults indicate that pine seed shell char contains a large portionof micro and mesopores prone to be activated by the reaction.
3.2. Pyrolysis
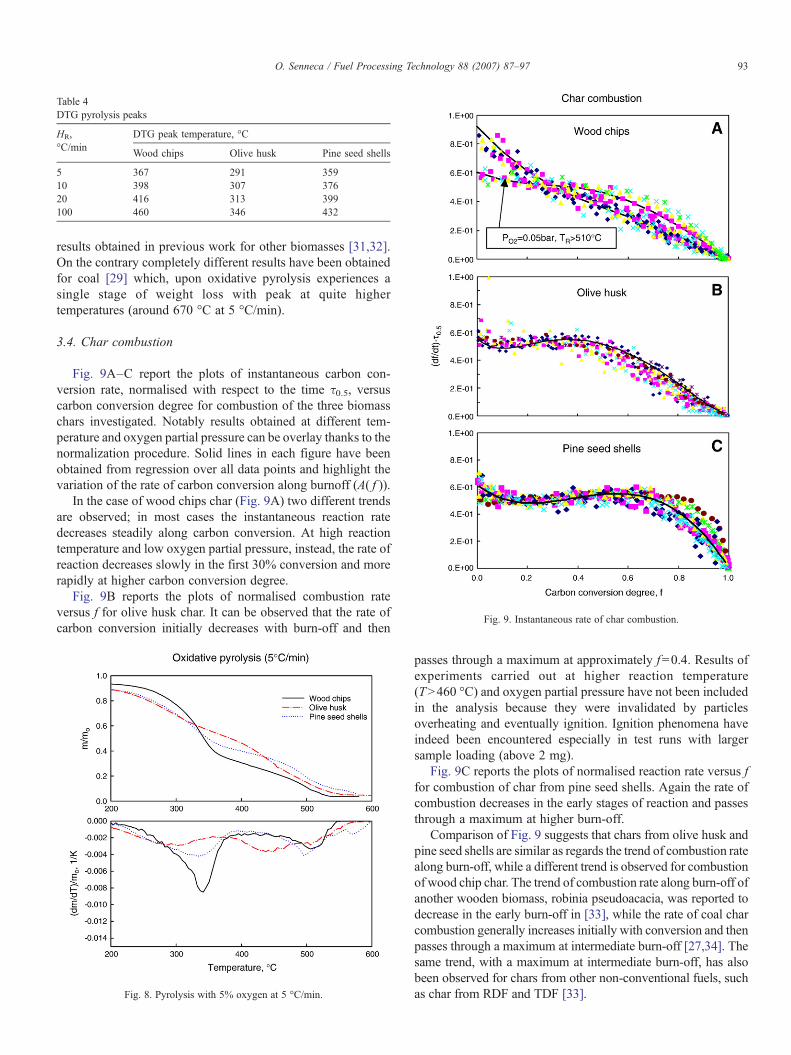
Fig. 5 reports the TG and DTG curves obtained fromexperiments of pyrolysis of wood chips under inert conditions atdifferent heating rates. It can be observed that pyrolysis underinert conditions occurs in a single stage. The DTG peaktemperature increases with the heating rate from 367 °C at 5 °C/min to 460 °C at 100 °C/min. The char residue decreases withheating rate from 24% at 5 °C/min to 14% at 100 °C/min.
Fig. 6 reports the TG and DTG curves obtained fromexperiments of inert pyrolysis of olive husk. Again pyrolysisoccurs in a single stage and the peak temperature increases withthe heating rate from 291 °C at 5 °C/min to 346 °C at 100 °C/min. The char residue is around 35% at all heating rates.
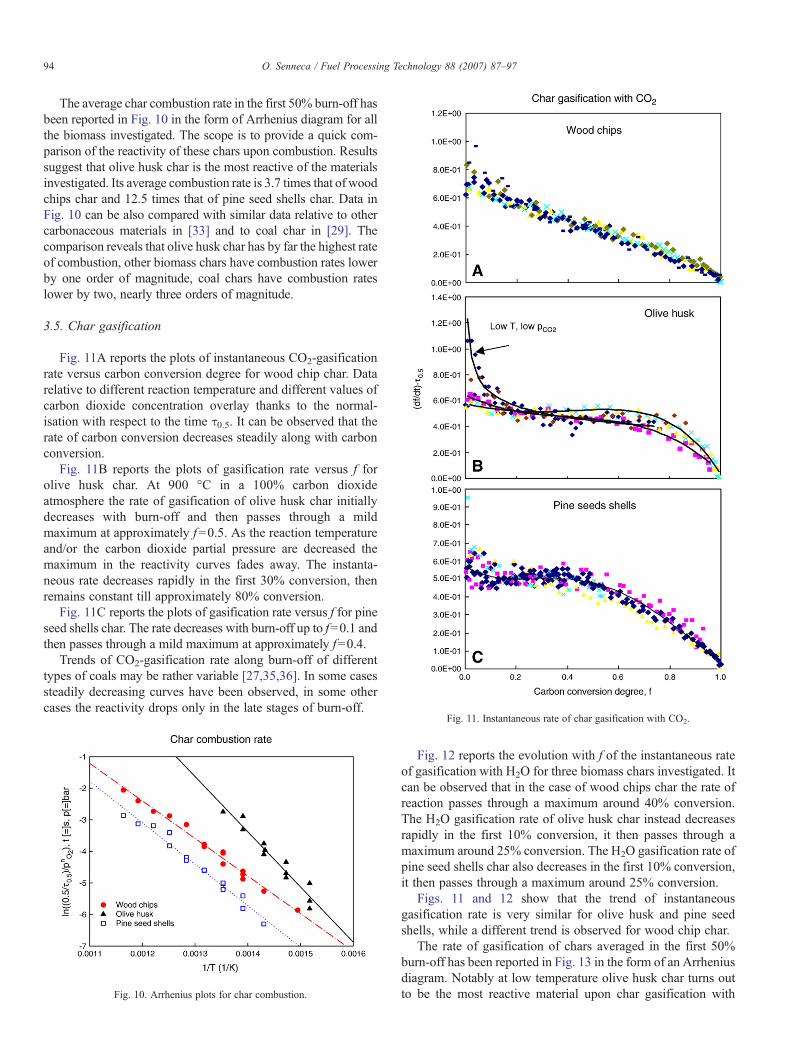
Fig. 7 reports the TG and DTG curves obtained fromexperiments of inert pyrolysis of pine seed shells. The DTGcurves exhibit a single peak anticipated by a shoulder. The peaktemperature increases with the heating rate from 359 °C at 5 °C/min to 432 °C at 100 °C/min. The char residue is around 25% atall heating rates.
Table 4 reports the temperature of the DTG peaks forpyrolysis of the three biomasses investigated. Notably inert
Fig. 6. Inert pyrolysis of olive husk.
Table 3Results of gas adsorption on unreacted and partially reacted chars
Char reacted with air up to 10% conversionWood chips char 296 0.175Olive husk char 320 0.256Pine seed shells char 579 0.307
Char reacted with CO2 up to 10% conversionWood chips char 52 0.170Olive husk char 7 0.215Pine seed shells char 239 0.438
92 O. Senneca / Fuel Processing Technology 88 (2007) 87–97
pyrolysis occurs at lowest temperature in the case of olive husk(Tp=291 °C), followed by pine seed shells (359 °C) and woodchips (367 °C). In a previous work by the same authors, similarresults were obtained for other wooden biomasses, namely robiniapseudoacacia andwastewood [28]. In those cases the peak of inertpyrolysis occurred around 340 °C (at 5 °C/min), relatively close tothe peak of seed shells and wood chips pyrolysis. Different resultshave been obtained instead for pyrolysis of bituminous coal underinert conditions [29], where two pyrolysis peaks were distin-guished at approximately 450 and 650 °C (at 5 °C/min), the firstfar more pronounced than the second. Notably higher tempera-tures are required to pyrolyse coal compared to biomass.
3.3. Oxidative pyrolysis
Fig. 8 reports the results of pyrolysis with 5% oxygen at5 °C/min for the three biomasses investigated. Two stages of
Fig. 5. Inert pyrolysis of wood chips.
weight loss are observed: the first stage, accounts for the loss ofvolatile matter, the second one accounts for conversion of char,leaving behind only residual ash.
In the case of wood chips and of pine seed shells the firstDTG peak is anticipated by 25 °C compared to the case of inertpyrolysis and the second peaks occur at respectively 510 °C and500 °C. In the case of olive husk the first peak is almostcoincident with that of inert pyrolysis at 290 °C and the secondpeak occurs at 446 °C. Very similar results have been reportedfor olive husk in ref. [30].
Altogether results of pyrolysis under oxidative conditions ofwood chips, olive husk and pine seed shells, are in line with
results obtained in previous work for other biomasses [31,32].On the contrary completely different results have been obtainedfor coal [29] which, upon oxidative pyrolysis experiences asingle stage of weight loss with peak at quite highertemperatures (around 670 °C at 5 °C/min).
3.4. Char combustion
Fig. 9A–C report the plots of instantaneous carbon con-version rate, normalised with respect to the time τ0.5, versuscarbon conversion degree for combustion of the three biomasschars investigated. Notably results obtained at different tem-perature and oxygen partial pressure can be overlay thanks to thenormalization procedure. Solid lines in each figure have beenobtained from regression over all data points and highlight thevariation of the rate of carbon conversion along burnoff (A( f )).
In the case of wood chips char (Fig. 9A) two different trendsare observed; in most cases the instantaneous reaction ratedecreases steadily along carbon conversion. At high reactiontemperature and low oxygen partial pressure, instead, the rate ofreaction decreases slowly in the first 30% conversion and morerapidly at higher carbon conversion degree.
Fig. 9B reports the plots of normalised combustion rateversus f for olive husk char. It can be observed that the rate ofcarbon conversion initially decreases with burn-off and then
Fig. 8. Pyrolysis with 5% oxygen at 5 °C/min.
passes through a maximum at approximately f=0.4. Results ofexperiments carried out at higher reaction temperature(TN460 °C) and oxygen partial pressure have not been includedin the analysis because they were invalidated by particlesoverheating and eventually ignition. Ignition phenomena haveindeed been encountered especially in test runs with largersample loading (above 2 mg).
Fig. 9C reports the plots of normalised reaction rate versus ffor combustion of char from pine seed shells. Again the rate ofcombustion decreases in the early stages of reaction and passesthrough a maximum at higher burn-off.
Comparison of Fig. 9 suggests that chars from olive husk andpine seed shells are similar as regards the trend of combustion ratealong burn-off, while a different trend is observed for combustionof wood chip char. The trend of combustion rate along burn-off ofanother wooden biomass, robinia pseudoacacia, was reported todecrease in the early burn-off in [33], while the rate of coal charcombustion generally increases initially with conversion and thenpasses through a maximum at intermediate burn-off [27,34]. Thesame trend, with a maximum at intermediate burn-off, has alsobeen observed for chars from other non-conventional fuels, suchas char from RDF and TDF [33].
94 O. Senneca / Fuel Processing Technology 88 (2007) 87–97
The average char combustion rate in the first 50% burn-off hasbeen reported in Fig. 10 in the form of Arrhenius diagram for allthe biomass investigated. The scope is to provide a quick com-parison of the reactivity of these chars upon combustion. Resultssuggest that olive husk char is the most reactive of the materialsinvestigated. Its average combustion rate is 3.7 times that of woodchips char and 12.5 times that of pine seed shells char. Data inFig. 10 can be also compared with similar data relative to othercarbonaceous materials in [33] and to coal char in [29]. Thecomparison reveals that olive husk char has by far the highest rateof combustion, other biomass chars have combustion rates lowerby one order of magnitude, coal chars have combustion rateslower by two, nearly three orders of magnitude.
3.5. Char gasification
Fig. 11A reports the plots of instantaneous CO2-gasificationrate versus carbon conversion degree for wood chip char. Datarelative to different reaction temperature and different values ofcarbon dioxide concentration overlay thanks to the normal-isation with respect to the time τ0.5. It can be observed that therate of carbon conversion decreases steadily along with carbonconversion.
Fig. 11B reports the plots of gasification rate versus f forolive husk char. At 900 °C in a 100% carbon dioxideatmosphere the rate of gasification of olive husk char initiallydecreases with burn-off and then passes through a mildmaximum at approximately f=0.5. As the reaction temperatureand/or the carbon dioxide partial pressure are decreased themaximum in the reactivity curves fades away. The instanta-neous rate decreases rapidly in the first 30% conversion, thenremains constant till approximately 80% conversion.
Fig. 11C reports the plots of gasification rate versus f for pineseed shells char. The rate decreases with burn-off up to f=0.1 andthen passes through a mild maximum at approximately f=0.4.
Trends of CO2-gasification rate along burn-off of differenttypes of coals may be rather variable [27,35,36]. In some casessteadily decreasing curves have been observed, in some othercases the reactivity drops only in the late stages of burn-off.
Fig. 10. Arrhenius plots for char combustion.
Fig. 11. Instantaneous rate of char gasification with CO2.
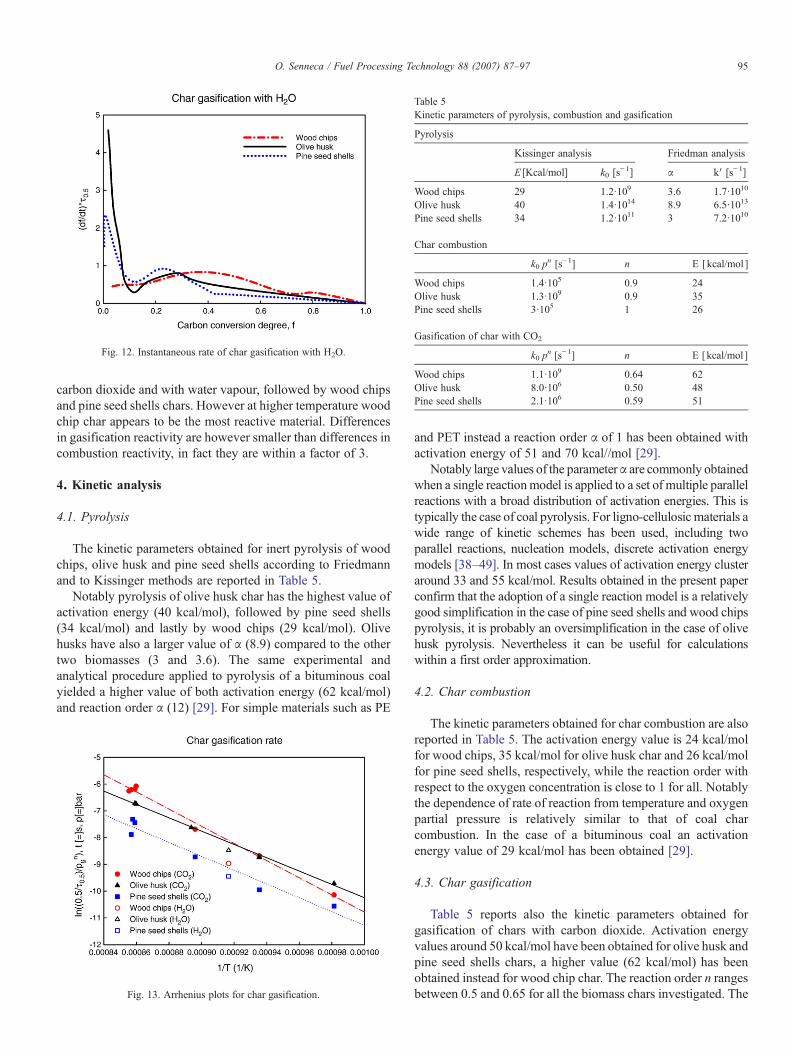
Fig. 12 reports the evolution with f of the instantaneous rateof gasification with H2O for three biomass chars investigated. Itcan be observed that in the case of wood chips char the rate ofreaction passes through a maximum around 40% conversion.The H2O gasification rate of olive husk char instead decreasesrapidly in the first 10% conversion, it then passes through amaximum around 25% conversion. The H2O gasification rate ofpine seed shells char also decreases in the first 10% conversion,it then passes through a maximum around 25% conversion.
Figs. 11 and 12 show that the trend of instantaneousgasification rate is very similar for olive husk and pine seedshells, while a different trend is observed for wood chip char.
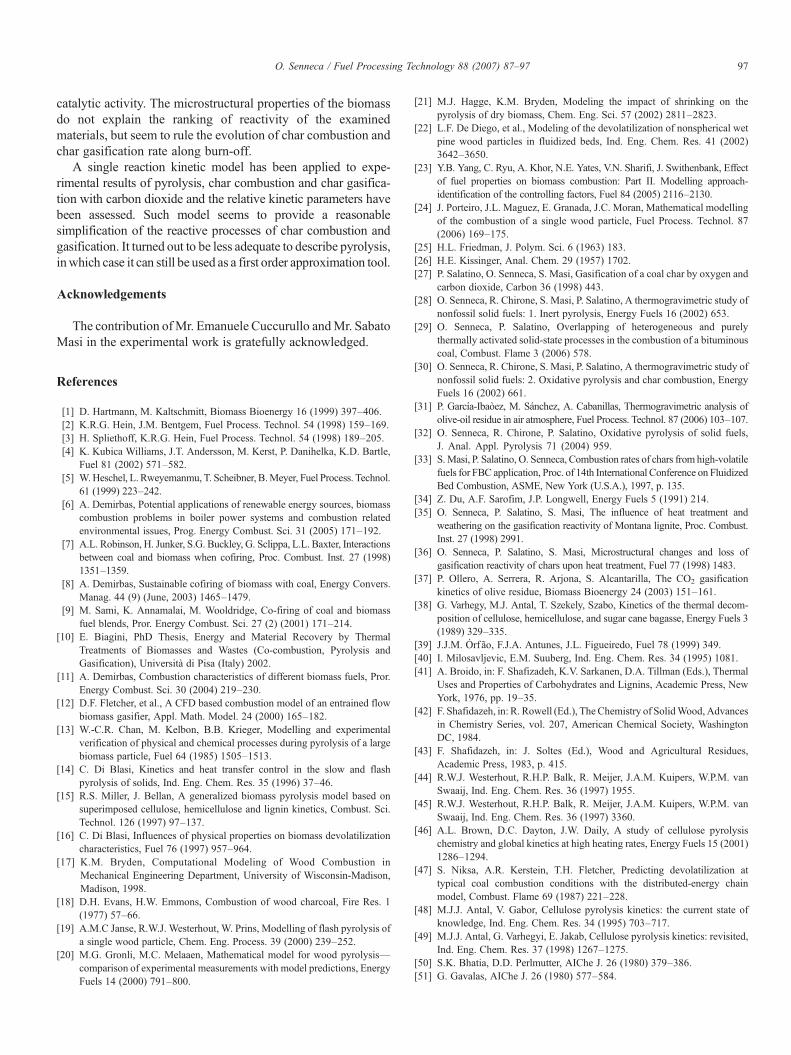
The rate of gasification of chars averaged in the first 50%burn-off has been reported in Fig. 13 in the form of an Arrheniusdiagram. Notably at low temperature olive husk char turns outto be the most reactive material upon char gasification with
Table 5Kinetic parameters of pyrolysis, combustion and gasification
carbon dioxide and with water vapour, followed by wood chipsand pine seed shells chars. However at higher temperature woodchip char appears to be the most reactive material. Differencesin gasification reactivity are however smaller than differences incombustion reactivity, in fact they are within a factor of 3.
4. Kinetic analysis
4.1. Pyrolysis
The kinetic parameters obtained for inert pyrolysis of woodchips, olive husk and pine seed shells according to Friedmannand to Kissinger methods are reported in Table 5.
Notably pyrolysis of olive husk char has the highest value ofactivation energy (40 kcal/mol), followed by pine seed shells(34 kcal/mol) and lastly by wood chips (29 kcal/mol). Olivehusks have also a larger value of α (8.9) compared to the othertwo biomasses (3 and 3.6). The same experimental andanalytical procedure applied to pyrolysis of a bituminous coalyielded a higher value of both activation energy (62 kcal/mol)and reaction order α (12) [29]. For simple materials such as PE
Fig. 13. Arrhenius plots for char gasification.
and PET instead a reaction order α of 1 has been obtained withactivation energy of 51 and 70 kcal//mol [29].
Notably large values of the parameterα are commonly obtainedwhen a single reactionmodel is applied to a set of multiple parallelreactions with a broad distribution of activation energies. This istypically the case of coal pyrolysis. For ligno-cellulosic materials awide range of kinetic schemes has been used, including twoparallel reactions, nucleation models, discrete activation energymodels [38–49]. In most cases values of activation energy clusteraround 33 and 55 kcal/mol. Results obtained in the present paperconfirm that the adoption of a single reaction model is a relativelygood simplification in the case of pine seed shells and wood chipspyrolysis, it is probably an oversimplification in the case of olivehusk pyrolysis. Nevertheless it can be useful for calculationswithin a first order approximation.
4.2. Char combustion
The kinetic parameters obtained for char combustion are alsoreported in Table 5. The activation energy value is 24 kcal/molfor wood chips, 35 kcal/mol for olive husk char and 26 kcal/molfor pine seed shells, respectively, while the reaction order withrespect to the oxygen concentration is close to 1 for all. Notablythe dependence of rate of reaction from temperature and oxygenpartial pressure is relatively similar to that of coal charcombustion. In the case of a bituminous coal an activationenergy value of 29 kcal/mol has been obtained [29].
4.3. Char gasification
Table 5 reports also the kinetic parameters obtained forgasification of chars with carbon dioxide. Activation energyvalues around 50 kcal/mol have been obtained for olive husk andpine seed shells chars, a higher value (62 kcal/mol) has beenobtained instead for wood chip char. The reaction order n rangesbetween 0.5 and 0.65 for all the biomass chars investigated. The
96 O. Senneca / Fuel Processing Technology 88 (2007) 87–97
paucity of literature data on gasification of biomass does notallow a sound validation of present results. Ollero et al. [37]report for CO2 gasification of olive husk an activation energy ofonly 32 kcal/mol and for other biomasses values around 50 kcal/mol. Kinetic studies on carbon gasification reported higheractivation energies, in the order of 70–100 kcal/mol, andcomparable values of reaction order n, in the range 0.5–1.
5. Discussion
Results of the experimental work can be summarised in thefollowing points:
1. Olive husk is the most reactive material examined in thepresent work, followed by wood chips and pine seed shells.Differences are very pronounced for char combustion andmodest for gasification. All biomass fuels investigated arehowever far more reactive than coal.
2. The trend of instantaneous rate versus conversion degree isvery similar for olive husk and pine seed shells, while adifferent trend is observed for wood chip char.
3. Wood chip char is characterized by the lowest density and thelargest porosity, which consists predominantly of macropores(N1 μm). The pore size distribution shifts toward smaller poresizes moving to olive husk and pine seed shells char.
The reactivity of the three materials can be tentatively relatedto the microstructural and chemical properties of each material.
Inspection of the Van Krevelen diagram of Fig. 1 suggeststhat wood chips should be moderately more reactive than pineseed shells, having slightly higher O/C and H/C values, which isindeed confirmed by experimental results. But on the basis ofthe elemental composition olive husk, having the lowest O/Cand H/C, should be erroneously considered the least reactive ofthe examined biomasses.
On the other hand, analysis of Table 1 reveals that olive huskhas the highest ash content of the three materials and in particularthe highest amount of catalytically active minerals such aspotassium. The amount of potassium oxides in olive husk, pineseed shells andwood chips is indeed in the ratio 26:5:1. This coulddefinitely be the key to the extremely high reactivity of olive husk.However the porous texture of the chars also contributes to theircombustion/gasification reactivity, in particular this might be akey to explain the patterns of reactivity along conversion.
Monotonously decreasing plots have been obtained in thepresent work for gasification of wood chip char with CO2 and forcombustion of the samematerial at low temperatures. This trend istypically observed when the porosity is readily accessible to thereactive gas and does not change during the course of reaction.
Reactivity plots observed for olive husk and pine seed shellschars are more complicated: in most cases the reactivity initiallydecreases, then increases again and passes through a maximum.A maximum of instantaneous reactivity at intermediate burn-offis commonly regarded as an indicator of pore widening andincrease of accessible surface area by carbon consumption [34].The well known random pore models of Bhatia and Perlmutter's[50] and Gavalas' [51] in fact predict a reactivity maximum at
intermediate carbon conversion degrees on the basis of thegrowth and overlapping of pores. Notably, such models cannotreproduce an initial decay of instantaneous reactivity followedby a maximum, as observed in the present work, nor they canpredict a reactivity maximum at fN0.393, as also observed insome experiments within the present work. It can be hypothe-sised, however, that the first 20% of conversion is due to the lossof some very reactive material present in the char at thebeginning of the reaction (possibly volatile residues frozen onthe char surface). Based on this hypothesis we can neglect theearly 20% carbon consumption and apply Bhatia's model to fitfurther experimental data points with appropriate values of thestructural parameter ψ. It is recalled that this parameter is relatedto the initial pore length, total porosity and pore volumedistribution; the more open the porosity and the larger theavailability of surface area in the unconverted char, the smaller isψ. The fitting procedure yields ψ=30 for combustion and ψ=4for CO2 gasification of pine seed shells. Smaller values of ψ areobtained for olive husk (ψ=4 for combustion and ψ=2 forgasification with CO2). Monotonously decreasing plots similarto those of wood chip chars can be reproduced byBhatia's modelwith small of ψ (ψb2). Altogether, the value of the parameter ψdecreases from wood chip char to olive husk char, to pine seedshells char and is higher for combustion than for gasification.
This finding is fully consistent with the results of theporosimetric analysis that showed wood chip char to possess thehighest porosity (ε=0.91) and to be mainly macroporous. For thisreason its internal surface is easily accessible to gas since the earlystages of reaction. Olive husk char is denser compared to woodchip char, it possess a more extensive network of mesopores andmodest microporosity. This porosity is less accessible to gas in theinitial stages of reaction and opens up moderately along withconversion. Lastly, pine seed shells char has the highest density ofthe three chars investigated. Its porosity is the least accessible togas in the initial stages of reaction, however, it is activated bycombustion and gasification.
It can be concluded that the nature of the porous texture ofbiomass chars does affect the evolution of their combustion andgasification rate. The absolute reactivity of biomass charsinvestigated in the present work is however strongly affected bythe presence of catalytically active inorganic matter. Olive huskis in fact the most reactive of the three biomass chars because ithas the highest contribution of inorganic materials coupled witha relatively accessible porous network.
6. Conclusions
Thermogravimetric experiments on olive husk, pine seedshells and wood chips and on the respective chars showed thatolive husk is the most reactive material upon pyrolysis, charcombustion and char gasification as well. Follow wood chipsand pine seed shells. Differences are very pronounced for charcombustion and modest for gasification. The very high reac-tivity of olive husk is at the origin of particle overheating andignition problems in char combustion tests.
The high reactivity of olive husk seems to be related mostlyto its highest content of mineral inclusions exerting pronounced
catalytic activity. The microstructural properties of the biomassdo not explain the ranking of reactivity of the examinedmaterials, but seem to rule the evolution of char combustion andchar gasification rate along burn-off.
A single reaction kinetic model has been applied to expe-rimental results of pyrolysis, char combustion and char gasifica-tion with carbon dioxide and the relative kinetic parameters havebeen assessed. Such model seems to provide a reasonablesimplification of the reactive processes of char combustion andgasification. It turned out to be less adequate to describe pyrolysis,inwhich case it can still be used as a first order approximation tool.
Acknowledgements
The contribution ofMr. Emanuele Cuccurullo andMr. SabatoMasi in the experimental work is gratefully acknowledged.
References
[1] D. Hartmann, M. Kaltschmitt, Biomass Bioenergy 16 (1999) 397–406.[2] K.R.G. Hein, J.M. Bentgem, Fuel Process. Technol. 54 (1998) 159–169.[3] H. Spliethoff, K.R.G. Hein, Fuel Process. Technol. 54 (1998) 189–205.[4] K. Kubica Williams, J.T. Andersson, M. Kerst, P. Danihelka, K.D. Bartle,
Fuel 81 (2002) 571–582.[5] W.Heschel, L. Rweyemanmu, T. Scheibner, B.Meyer, Fuel Process. Technol.
61 (1999) 223–242.[6] A. Demirbas, Potential applications of renewable energy sources, biomass
combustion problems in boiler power systems and combustion relatedenvironmental issues, Prog. Energy Combust. Sci. 31 (2005) 171–192.
[7] A.L. Robinson, H. Junker, S.G. Buckley, G. Sclippa, L.L. Baxter, Interactionsbetween coal and biomass when cofiring, Proc. Combust. Inst. 27 (1998)1351–1359.
[8] A. Demirbas, Sustainable cofiring of biomass with coal, Energy Convers.Manag. 44 (9) (June, 2003) 1465–1479.
[9] M. Sami, K. Annamalai, M. Wooldridge, Co-firing of coal and biomassfuel blends, Pror. Energy Combust. Sci. 27 (2) (2001) 171–214.
[10] E. Biagini, PhD Thesis, Energy and Material Recovery by ThermalTreatments of Biomasses and Wastes (Co-combustion, Pyrolysis andGasification), Università di Pisa (Italy) 2002.
[11] A. Demirbas, Combustion characteristics of different biomass fuels, Pror.Energy Combust. Sci. 30 (2004) 219–230.
[12] D.F. Fletcher, et al., A CFD based combustion model of an entrained flowbiomass gasifier, Appl. Math. Model. 24 (2000) 165–182.
[13] W.-C.R. Chan, M. Kelbon, B.B. Krieger, Modelling and experimentalverification of physical and chemical processes during pyrolysis of a largebiomass particle, Fuel 64 (1985) 1505–1513.
[14] C. Di Blasi, Kinetics and heat transfer control in the slow and flashpyrolysis of solids, Ind. Eng. Chem. Res. 35 (1996) 37–46.
[15] R.S. Miller, J. Bellan, A generalized biomass pyrolysis model based onsuperimposed cellulose, hemicellulose and lignin kinetics, Combust. Sci.Technol. 126 (1997) 97–137.
[16] C. Di Blasi, Influences of physical properties on biomass devolatilizationcharacteristics, Fuel 76 (1997) 957–964.
[17] K.M. Bryden, Computational Modeling of Wood Combustion inMechanical Engineering Department, University of Wisconsin-Madison,Madison, 1998.
[18] D.H. Evans, H.W. Emmons, Combustion of wood charcoal, Fire Res. 1(1977) 57–66.
[19] A.M.C Janse, R.W.J. Westerhout, W. Prins, Modelling of flash pyrolysis ofa single wood particle, Chem. Eng. Process. 39 (2000) 239–252.
[20] M.G. Gronli, M.C. Melaaen, Mathematical model for wood pyrolysis—comparison of experimental measurements with model predictions, EnergyFuels 14 (2000) 791–800.
[21] M.J. Hagge, K.M. Bryden, Modeling the impact of shrinking on thepyrolysis of dry biomass, Chem. Eng. Sci. 57 (2002) 2811–2823.
[22] L.F. De Diego, et al., Modeling of the devolatilization of nonspherical wetpine wood particles in fluidized beds, Ind. Eng. Chem. Res. 41 (2002)3642–3650.
[23] Y.B. Yang, C. Ryu, A. Khor, N.E. Yates, V.N. Sharifi, J. Swithenbank, Effectof fuel properties on biomass combustion: Part II. Modelling approach-identification of the controlling factors, Fuel 84 (2005) 2116–2130.
[24] J. Porteiro, J.L. Maguez, E. Granada, J.C. Moran, Mathematical modellingof the combustion of a single wood particle, Fuel Process. Technol. 87(2006) 169–175.
[25] H.L. Friedman, J. Polym. Sci. 6 (1963) 183.[26] H.E. Kissinger, Anal. Chem. 29 (1957) 1702.[27] P. Salatino, O. Senneca, S. Masi, Gasification of a coal char by oxygen and
carbon dioxide, Carbon 36 (1998) 443.[28] O. Senneca, R. Chirone, S. Masi, P. Salatino, A thermogravimetric study of
nonfossil solid fuels: 1. Inert pyrolysis, Energy Fuels 16 (2002) 653.[29] O. Senneca, P. Salatino, Overlapping of heterogeneous and purely
thermally activated solid-state processes in the combustion of a bituminouscoal, Combust. Flame 3 (2006) 578.
[30] O. Senneca, R. Chirone, S. Masi, P. Salatino, A thermogravimetric study ofnonfossil solid fuels: 2. Oxidative pyrolysis and char combustion, EnergyFuels 16 (2002) 661.
[31] P. García-Ibaòez, M. Sánchez, A. Cabanillas, Thermogravimetric analysis ofolive-oil residue in air atmosphere, Fuel Process. Technol. 87 (2006) 103–107.
[32] O. Senneca, R. Chirone, P. Salatino, Oxidative pyrolysis of solid fuels,J. Anal. Appl. Pyrolysis 71 (2004) 959.
[33] S.Masi, P. Salatino, O. Senneca, Combustion rates of chars from high-volatilefuels for FBC application, Proc. of 14th International Conference on FluidizedBed Combustion, ASME, New York (U.S.A.), 1997, p. 135.
[34] Z. Du, A.F. Sarofim, J.P. Longwell, Energy Fuels 5 (1991) 214.[35] O. Senneca, P. Salatino, S. Masi, The influence of heat treatment and
weathering on the gasification reactivity of Montana lignite, Proc. Combust.Inst. 27 (1998) 2991.
[36] O. Senneca, P. Salatino, S. Masi, Microstructural changes and loss ofgasification reactivity of chars upon heat treatment, Fuel 77 (1998) 1483.
[37] P. Ollero, A. Serrera, R. Arjona, S. Alcantarilla, The CO2 gasificationkinetics of olive residue, Biomass Bioenergy 24 (2003) 151–161.
[38] G. Varhegy, M.J. Antal, T. Szekely, Szabo, Kinetics of the thermal decom-position of cellulose, hemicellulose, and sugar cane bagasse, Energy Fuels 3(1989) 329–335.
Uses and Properties of Carbohydrates and Lignins, Academic Press, NewYork, 1976, pp. 19–35.
[42] F. Shafidazeh, in: R. Rowell (Ed.), The Chemistry of SolidWood,Advancesin Chemistry Series, vol. 207, American Chemical Society, WashingtonDC, 1984.
[43] F. Shafidazeh, in: J. Soltes (Ed.), Wood and Agricultural Residues,Academic Press, 1983, p. 415.
[46] A.L. Brown, D.C. Dayton, J.W. Daily, A study of cellulose pyrolysischemistry and global kinetics at high heating rates, Energy Fuels 15 (2001)1286–1294.
[47] S. Niksa, A.R. Kerstein, T.H. Fletcher, Predicting devolatilization attypical coal combustion conditions with the distributed-energy chainmodel, Combust. Flame 69 (1987) 221–228.
[48] M.J.J. Antal, V. Gabor, Cellulose pyrolysis kinetics: the current state ofknowledge, Ind. Eng. Chem. Res. 34 (1995) 703–717.
[49] M.J.J. Antal, G. Varhegyi, E. Jakab, Cellulose pyrolysis kinetics: revisited,Ind. Eng. Chem. Res. 37 (1998) 1267–1275.
[50] S.K. Bhatia, D.D. Perlmutter, AIChe J. 26 (1980) 379–386.[51] G. Gavalas, AIChe J. 26 (1980) 577–584.