Kinetics of Strong Acid Hydrolysis of a Bleached Kraft Pulp forProducing Cellulose Nanocrystals (CNCs)Qianqian Wang,†,‡ Xuebing Zhao,*,‡,§ and J. Y. Zhu*,‡
†Biofuels Institute, School of the Environment, Jiangsu University, Zhenjiang, China§Institute of Applied Chemistry, Department of Chemical Engineering, Tsinghua University, Beijing, China‡Forest Products Laboratory, USDA Forest Service, Madison, Wisconsin 53726, United States
*S Supporting Information
ABSTRACT: Cellulose nanocrytals (CNCs) are predominantly produced using the traditional strong acid hydrolysis process. Inmost reported studies, the typical CNC yield is low (approximately 30%) despite process optimization. This study investigatedthe hydrolysis of a bleached kraft eucalyptus pulp using sulfuric acid between 50 and 64 wt % at temperatures of 35−80 °C overtime periods of up to 240 min for the production of CNCs. The experimental design captured the feature of the coexistence of avariety of reaction products, such as CNC, cellulosic solid residue (CSR), glucose, and xylose, in the product stream for accuratekinetic modeling to improve the CNC production yield. The kinetic model describing the solubilization of cellulose fibers usedthree phenomenological reactions, namely, hydrolysis of xylan to form xylose, depolymerization of cellulose to CNCs, andhydrolysis of cellulose to form glucose, each of which can be described by pseudohomogenous first-order kinetics. The conceptof “degrees of hydrolyzable xylan or cellulose” to reflect the inhomogeneity of xylan or cellulose in hydrolysis was incorporatedinto the kinetic modeling to improve model accuracy. The developed model showed excellent predictability for CNC production.Both the experimental data and the model clearly indicate that CNC production was limited by cellulose depolymerization at lowacid concentrations of below 58 wt %, but controlled by CNC degradation when the acid concentration was higher than 58 wt %.This work for the first time provides the most plausible description of CNC production kinetics, which is significant for thecommercial production of CNCs.
■ INTRODUCTION
Cellulose nanocrystals (CNCs) have been found to exhibit veryspecial mechanical and optical properties.1−6 CNCs can be usedas powerful building blocks for the production of high-quality,durable, lightweight, and cost-effective products for a variety ofapplications.7,8 CNCs are mainly produced using the traditionalacid hydrolysis method from cellulosic fibers that are renewableand abundant.6,9−11 When strong sulfuric acid is used, theresultant CNC surface is negatively charged as a result of theformation of sulfate groups and forms a stable colloidalsuspension, which is favorable for aqueous processing.10
However, approximately 70% of the cellulose can besimultaneously hydrolyzed to sugars, resulting in a typicalCNC yield of only 30%. The sugars cannot be economicallyrecovered from the strong acid solution, which significantlyaffects CNC production economics. Several studies were carriedout to optimize CNC production but were not able to avoidsignificant sugar degradation and improve the CNC yield,12−14
because cellulose depolymerization and sulfation and CNCproduction occur abruptly and simultaneously.9,12
Recently, we discovered a very narrow operating window inwhich cellulose degradation to sugars can be eliminated,resulting in cellulosic solid residue (CSR), which is easilyrecoverable, in addition to a high CNC yield of approximately55%.9 The CSR also contains sulfate groups, which facilitatenanofibrillation with low energy input to produce cellulosenanofibrils (CNFs) with good optical and mechanical proper-ties.15 The recovery of CSR in CNC production has significanteconomic benefits. Developing an understanding of the reaction
kinetics of the acid hydrolysis of cellulosic fibers at high acidconcentrations can reduce the conversion of cellulose to sugarsand facilitate the recovery of CSR and, therefore, hascommercial significance. Although the hydrolysis of lignocellu-loses under dilute acid conditions has been explored in theliterature,16,17 we are not aware of reported kinetic studies onthe hydrolysis of cellulosic materials at very high acidconcentrations close to the cellulose solubilization point of 64wt %. The rapid hydrolysis reactions of cellulosic fibers at highconcentrations result in a very narrow operating widow, whichcreates experimental difficulties in representatively capturing thereaction process as required for accurate modeling. Theobjective of this work was thus to conduct a kinetic study ofthe acid hydrolysis of cellulosic fibers for CNC production. Theexperiments were designed to capture the narrow operatingwindow in which significant amounts of CSR and CNC andsmall amounts of sugars coexist in the reactant stream. A kineticmodel was then developed based on the experimental data as amathematical tool for large-scale process design.
■ MATERIALS AND METHODS
Materials. All materials were the same as those described inour previous study.9 Sulfuric acid of ACS reagent grade was
Received: April 23, 2014Revised: June 9, 2014Accepted: June 10, 2014Published: June 10, 2014
purchased from Sigma-Aldrich (St. Louis, MO). Bleached Krafteucalyptus dry lap pulp was obtained from a commercial source(Aracruz Celulose S.A., Aracruz, Brazil). The Klason lignin andxylan contents of the eucalyptus pulp were 0.1 ± 0.1% and 15.5± 0.6%, respectively. The measured cellulose content of thepulp was 78.1 ± 1.0%; however, the normalized value of 84.4%based on mass balance was used because other componentswere undetectable. Cellulosic fibers were produced by soakingthe dry lap pulp in water overnight and disintegrating it for 5000revolutions at 312 rpm and 5% solids at room temperature(model 73-06-01, TMI, Ronkonkoma, New York). The pulpwas then vacuum-dewatered and air-dried to approximately 5%moisture in 30% relative humidity at 26.7 °C. The air-dried pulpwas used in acid hydrolysis.Acid Hydrolysis. Acid hydrolysis experiments were
conducted using a narrow range of acid concentrations (50−64 wt %) and temperatures (35−80 °C), but with a relativelylarge range of reaction times (15−240 min). These testconditions can capture the reactions of CSR and CNC alongwith sugars and sugar degradation products such as furfural and5-hydroxylmethfurfural (HMF) to ensure the integrity of thekinetic model to be developed. The acid hydrolysis experimentswere carried out according to the procedure described in ourprevious study.9 Time-dependent data were obtained bysampling the reaction stream periodically by pipet. The reactionin each sample was immediately quenched by adding an 8-foldquantity of deionized water. After centrifugation at 9000 rpm toseparate the precipitant, an aliquot of the supernatant was takenfor analyses of sugars and sugar degradation products. Theprecipitate was dialyzed using deionized water until constant pHwas reached. The suspension was centrifuged again to separateCNC from CSR.Determination of CNC and CSR Yields. The yields of
CNC and CSR were determined by a method involvingchemical oxygen demand (COD).9 An aliquot of CNC or CSRsuspension was digested in a commercial COD test vial(Biosciences, Inc., Bethlehem, PA). Chromium consumptionwas determined calorimetrically at 600 nm by UV−visspectrophotometer (Spectronic Genesys 5, Milton RoyCompany, Warminster, PA). The concentrations of cellulosicsuspensions were calculated from the COD data assuming thatall organic materials detected originated from polymericcellulose as (C6H10O5)n, that is, COD (mg/L) = 3410.2I600.The mass of cellulose was then calculated as mC6H10O5
(mg/L) =
COD/1.185 = 2877I600 through calibration using Avicel. Thesystematic error was 2.28% assuming that all organics detectedoriginated from polymeric cellulose as (C6H10O5)n and ignoringthe fact that approximately 15% was xylan [(C5H8O4)n].
Analysis of Sugars and Degradation Products. Sugarand its degradation products were analyzed by high-perform-ance anion-exchange chromatography with pulsed amperomet-ric detection (HPAEC-PAD) (Dionex ICS-3000).
Data Processing. The kinetic constants were obtained bynonlinear fitting of the experimental data using Matlab 6.5software to minimize the objective function, namely, thequadratic sum of the differences between model predictedvalues and experimental data. The fourth-order Runge−Kuttamethod was used to solve the differential equations numerically.
■ KINETIC MODELING
Cellulose fibers consist mainly of hemicelluloses (mainly xylanin the present study) and cellulose. It is generally believed thatcellulose fibers can be divided into crystalline and noncrystalline(disordered or paracrystalline) regions. The noncrystallinecellulose regions are preferentially hydrolyzed, whereas thecrystalline regions have a higher resistance to acid attack andthus a much slower hydrolysis. The hydrolysis of noncrystallinecellulose is approximately 2−30 times faster than that ofcrystalline cellulose.16 As a result, rodlike cellulose nanocrystalson the order of 5−10 nm in diameter and 100 nm in length canbe produced following the acid treatment of cellulose fibers.6 Atypical elemental crystal in the wood fibers has a diameter of 3−5 nm and a length of approximately 60 nm.18 Hydrolysis ofcellulose and hemicellulose to form monosaccharides such asglucose and xylose is inevitable. These sugars can be furtherdegraded to form degradation products such as HMF andfurfural.Based on the above understanding, the reactions involved in
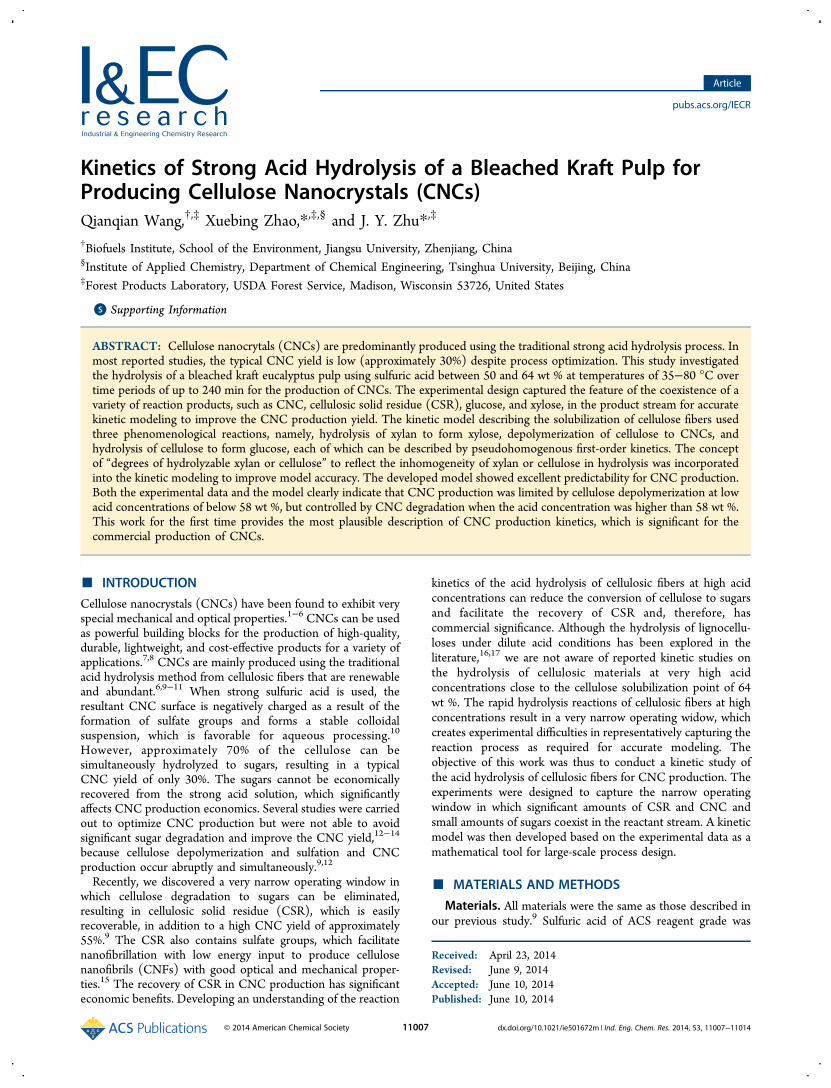
the acid hydrolysis of cellulose fibers for CNC production canbe modeled using three pathways as shown schematically inFigure 1. The first and predominant pathway, represented byrate constant k1, is the hydrolysis of noncrystalline cellulose toCNCs. The CNCs can be further degraded to glucose undersevere hydrolysis conditions with rate constant k2. The secondpathway is the direct hydrolysis of cellulose to glucose,represented by rate constant k3. The basis of this pathway isthat some cellulosic fraction is not directly connected to thecrystalline cellulose but is rather more associated with
Figure 1. Schematic of the proposed reaction pathways for cellulosic fiber hydrolysis under strong acid conditions for the production of cellulosenanocrystals.
Industrial & Engineering Chemistry Research Article
hemicelluloses and might have a different reaction rate inhydrolysis. The glucose resulting from the first two pathwayscan be further degraded to HMF, corresponding to rate constantk4. The third pathway is the hydrolysis of hemicelluloses (xylanin the present study) to sugars (xylose), represented by rateconstant k5. The further degradation of xylose is represented byrate constant k6. First-order reactions are usually used to modelthe hydrolysis of polysaccharides in lignocelluloses.16,17,19 Basedon Figure 1, the preparation of CNCs from bleached pulp can bedescribed by several pseudo-first-order models.Xylan Hydrolysis. It is well-known that a certain fraction of
xylan is much easier (faster) to hydrolyze than others(slower).20−22 This perhaps is due to the multilayered structureof cell walls. Therefore, under a certain hydrolysis severity, thetotal xylan can be phenomenologically categorized as ahydrolyzable fraction and an unhydrolyzable fraction. We candefine the “potential degree of hydrolysis” for xylan (δX, 0 ≤ δX≤ 1) as the proportion of xylan that is hydrolyzable under theconditions employed.16 We can thus describe xylan hydrolysisusing the conventional Saeman model of first-order kinetics withrespect to the remaining xylan17,19
− = − =Xt
Xt
k Xdd
dd
n na5 na (1)
where Xna is the concentration of hydrolyzable xylan, which canbe represented in terms of δX and the total xylan concentration(Xn) as
δ= − −X X X (1 )na n n0 X (2)
in which Xn0 is the initial total xylan concentration (time = 0) inthe pseudohomogeneous system (g/L). The rate of xylanhydrolysis can thus be expressed as
δ− = − −Xt
k X k Xdd
(1 )n5 n 5 n0 X (3a)
The integral form of this equation is
δ= − − −X X k t{1 [1 exp( )]}n n0 X 5 (3b)
The formations of xylose, X, and furfural, Fur, can also bemodeled using first-order kinetics as17,23,24
= −Xt
k X k Xdd
1.136 5 n 6 (4a)
=Ft
k Xdd
ur6 (5a)
The corresponding xylose and furfural concentrations can beobtained after integration as
δ=
−− − −X
X kk k
k t k t1.136
[exp( ) exp( )]n0 X 5
5 66 5
(4b)
δ δ=
−− − −
−
− −
FX k
k kk t
X kk k
k t
1.136[1 exp( )]
1.136
[1 exp( )]
urn0 5 X
5 66
n0 6 X
5 6
5 (5b)
When the degradation of xylose can be neglected (i.e., k6 = 0),the xylose concentration can be expressed as
δ= − −X X k t1.136 [1 exp( )]n0 X 5 (4c)
Cellulose Hydrolysis and Production of CNC. Similarly,we can define a “degree of hydrolysis” for cellulose, γ (0 ≤ γ ≤
1), as the fraction of cellulose that was depolymerized to theform of glucose (DP = 1) all the way up to CNC (DP ≈ 120).Applying first-order kinetics, we modeled cellulose hydrolysis inthe production of CNC as follows
γ− = + − −C
tk k C C
dd
( )[ (1 )]Cel1 3 Cel Cel0 (6a)
= −C
tk C k C
dd
NC1 Cel 2 NC (7a)
= + −G
tk C k C k G
dd
1.111 1.111lu2 NC 3 Cel 4 lu (8a)
where CCel is the concentration of cellulose remaining in thepseudohomogeneous system (g/L), CCel0 is the initial celluloseconcentration in the pseudohomogeneous system (g/L), CNC isthe concentration of CNC (g/L), and Glu is the concentration ofglucose (g/L). Integration using the initial conditions t = 0, CCel= CCel0, CNC = 0, and Glu = 0 results in the following integralforms
γ= − − − +C C k k t(1 {1 exp[ ( ) ]})Cel Cel0 1 3 (6b)
γ=
+ −− − − +C
C kk k k
k t k k t{exp( ) exp[ ( ) ]}NCCel0 1
1 3 22 1 3
(7b)
γ
γ
=− +
+ − − −−
− − + ++ − −
− − −
GC k k k k
k k k k k kk t
k k tC k k
k k k k k
k t k t
1.111 ( )( )( )( )
{exp( )
exp[ ( ) ]}1.111
( )( )
[exp( ) exp( )]
luCel0 2 3 1 3
1 3 2 4 1 34
1 3Cel0 1 2
1 3 2 4 2
2 4 (8b)
When the degradation of glucose can be neglected (i.e., k4 = 0),the glucose concentration can be expressed as
γ
γ
=−
+ −− − +
++ −
− −
GC k k
k k kk k t
C kk k k
k t
1.111 ( )( )
{1 exp[ ( ) ]}
1.111( )
[1 exp( )]
luCel0 3 2
1 3 21 3
Cel0 1
1 3 22
(8c)
Then, the concentration of CSR (CCSR, g/L) in thepseudohomogenous system can be calculated based on massbalance as
γ
δ
= + =
− − − +
+ − − −
C C C C
k k t
X k t
(1 {1 exp[ ( ) ]})
{1 [1 exp( )]}
XCSR Cel Cel0
1 3
n0 X 5
n
(9)
The yields of CNC (YCNC) and CSR (YCSR) are defined basedon the initial fiber mass concentration CSR0 are given by
= ×YC
C100%CNC
NC
CSR0 (10)
= ×YC
C100%CSR
SR
CSR0 (11)
Thus, we can obtain the time courses of YCNC and YCSR as
Industrial & Engineering Chemistry Research Article
Optimal Hydrolysis Time and CNC Yield. According toeq 12, when k2 ≠ 0, there is an optimum time at which YCNCreaches the maximum for a given acid concentration andreaction temperature. This optimum time depends on kineticconstants k1, k2, and k3. By taking the differential calculation foreq 12, we can easily obtain that the optimum time, topt, as
=+ −
+( )t
k k k
ln k kk
opt1 3 2
1 3
2
(14)
and the corresponding maximum CNC yield, YCNCmax, as
γ=
++ − −⎛
⎝⎜⎞⎠⎟Y
C kC k k
k kk( )
k k k k
CNCmaxCel0 1
CSR0 1 3
1 3
2
/( )2 2 1 3
(15)
■ RESULTS AND DISCUSSIONComparisons between Kinetic Model Predictions and
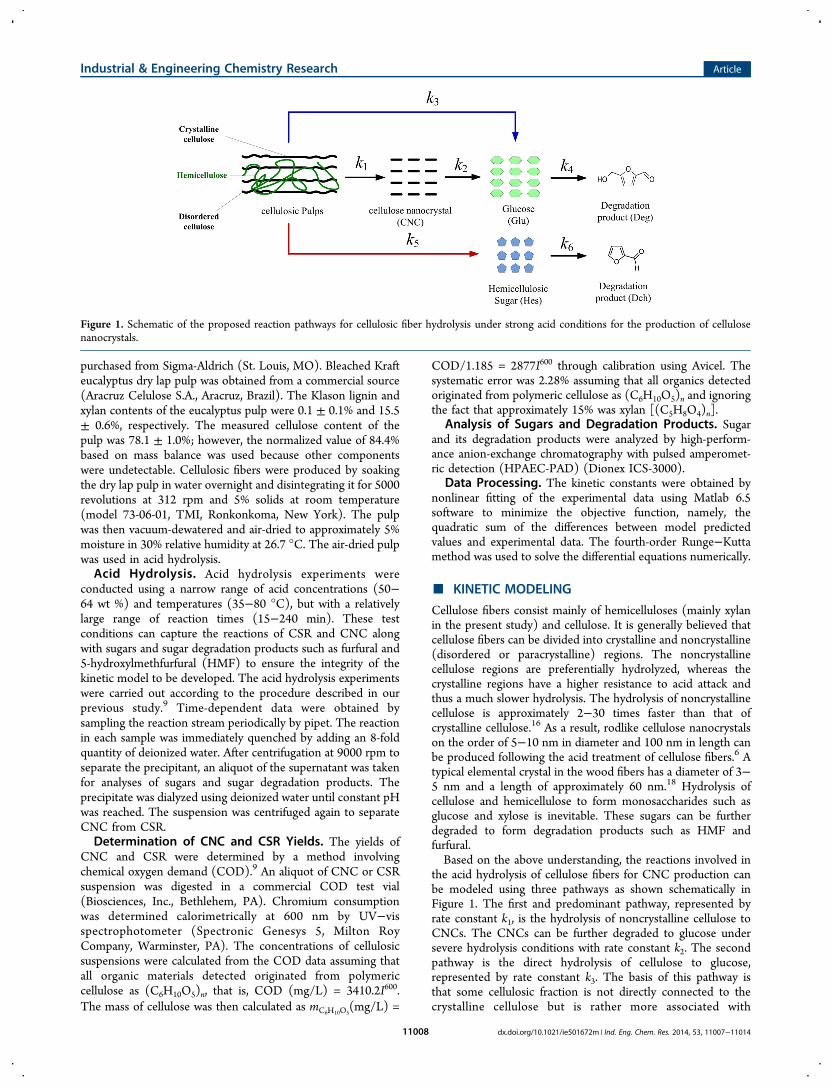
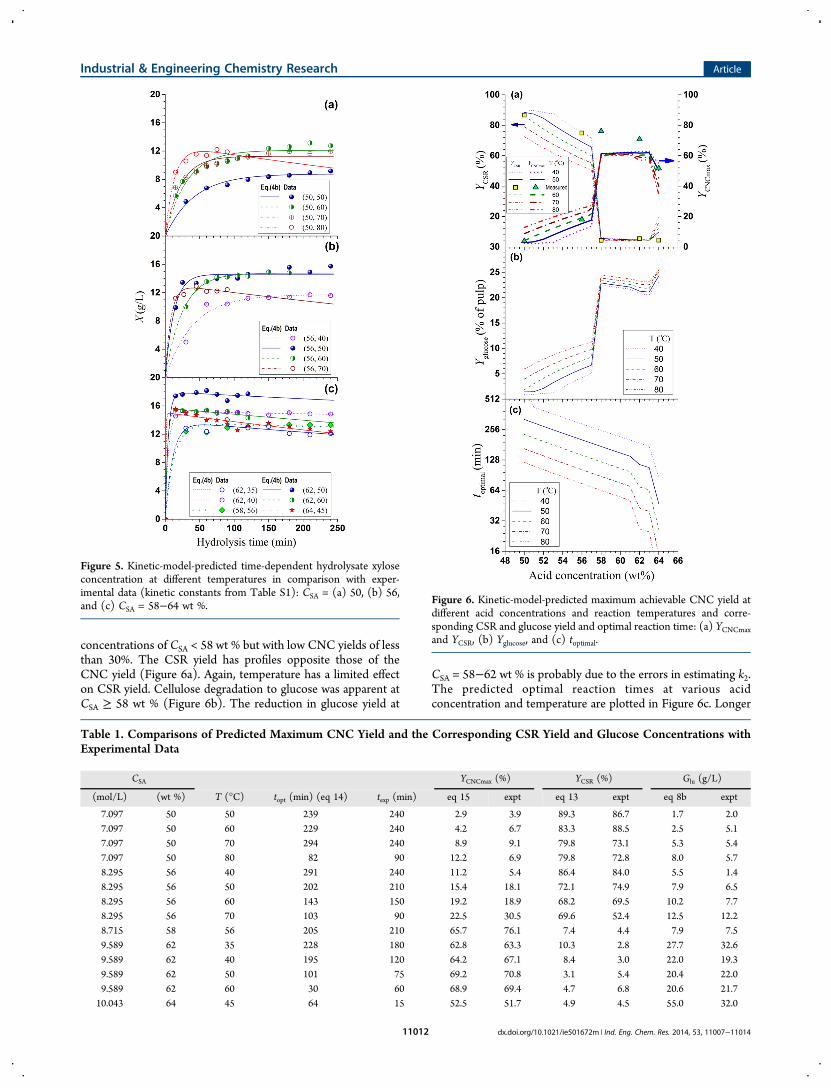
Experimental Data. Kinetic rate constants were obtained byfitting the model to the experimental yields of reaction productsincluding CNC and CSR (Table S1, Supporting Information).Comparisons of the time-dependent experimental data withmodel-predicted values of the yields of CNC (eq 12) and CSR(eq 13) and the concentrations of xylose (eq 4b) and glucose(eq 8b) are shown in Figures 2−5, respectively. Goodagreements were obtained, indicating that the developed modelscan provide good predictions of the kinetic behavior of the acidhydrolysis of cellulose fibers for CNC production.The results also clearly indicate that the acid concentration
plays a dominant role in CNC production (Figure 2). It appearsthat there is a maximum CNC yield for a given sulfuric acidconcentration for the range of temperatures investigated. Forexample, the maximum CNC yield was less than 10% at an acidconcentration 50 wt %. The maximum CNC yield increased toapproximately 30% and 70% when the acid concentration wasincreased to 56 and 62 wt %, respectively. The reactiontemperature and duration can affect CNC yield, but they cannotaffect the maximum CNC yield for a given acid concentration.In general, the CNC yield improved with reaction time andtemperature at acid concentrations below 64 wt % because ofthe improved hydrolysis of noncrystalline cellulose (Figure 2).However, at an acid concentration of 64 wt % or at hightemperatures such as in runs (64, 45, t) and (62, 60, t), CNCdegradation became important, and the CNC yield decreasedunder extended hydrolysis durations (Figure 2c). This behaviorof CNC yield reflects the competing reactions between the first-stage cellulose depolymerization to CNC (DP ≈ 100) and CNCdegradation (further depolymerization of CNC to oligomericand monomeric sugars) in the system.The CSR yield is dictated by the acid concentration and
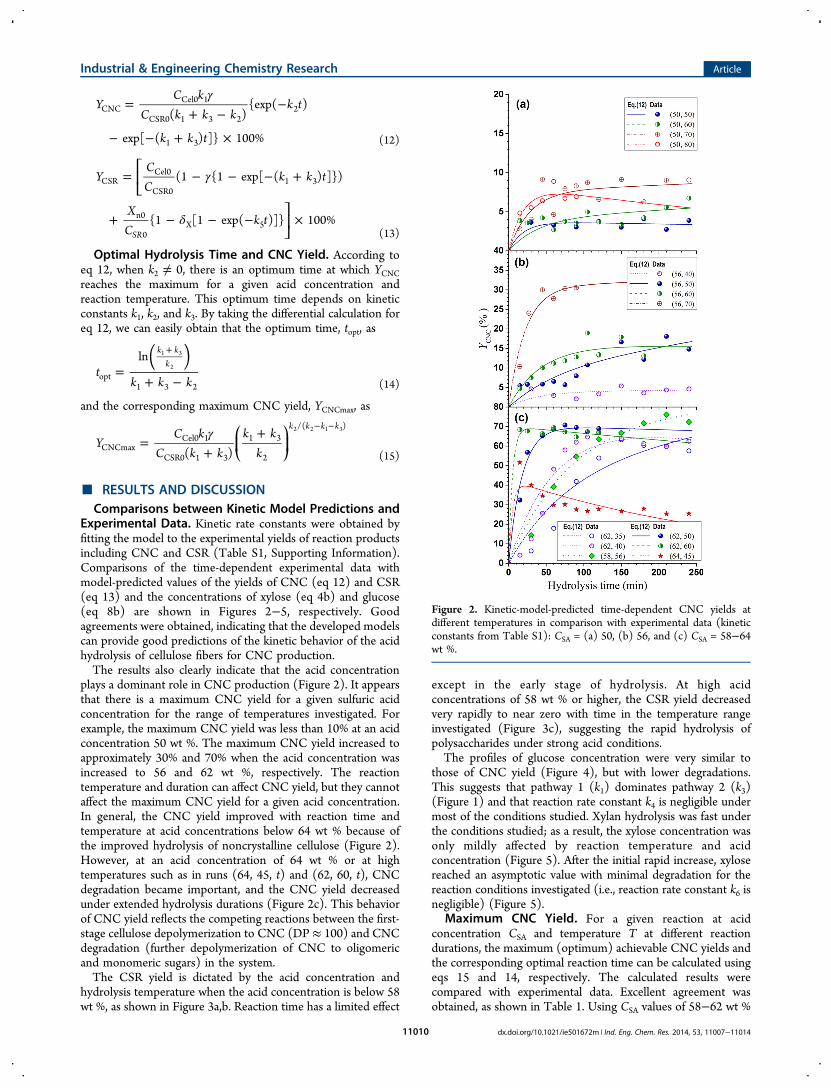
hydrolysis temperature when the acid concentration is below 58wt %, as shown in Figure 3a,b. Reaction time has a limited effect
except in the early stage of hydrolysis. At high acidconcentrations of 58 wt % or higher, the CSR yield decreasedvery rapidly to near zero with time in the temperature rangeinvestigated (Figure 3c), suggesting the rapid hydrolysis ofpolysaccharides under strong acid conditions.The profiles of glucose concentration were very similar to
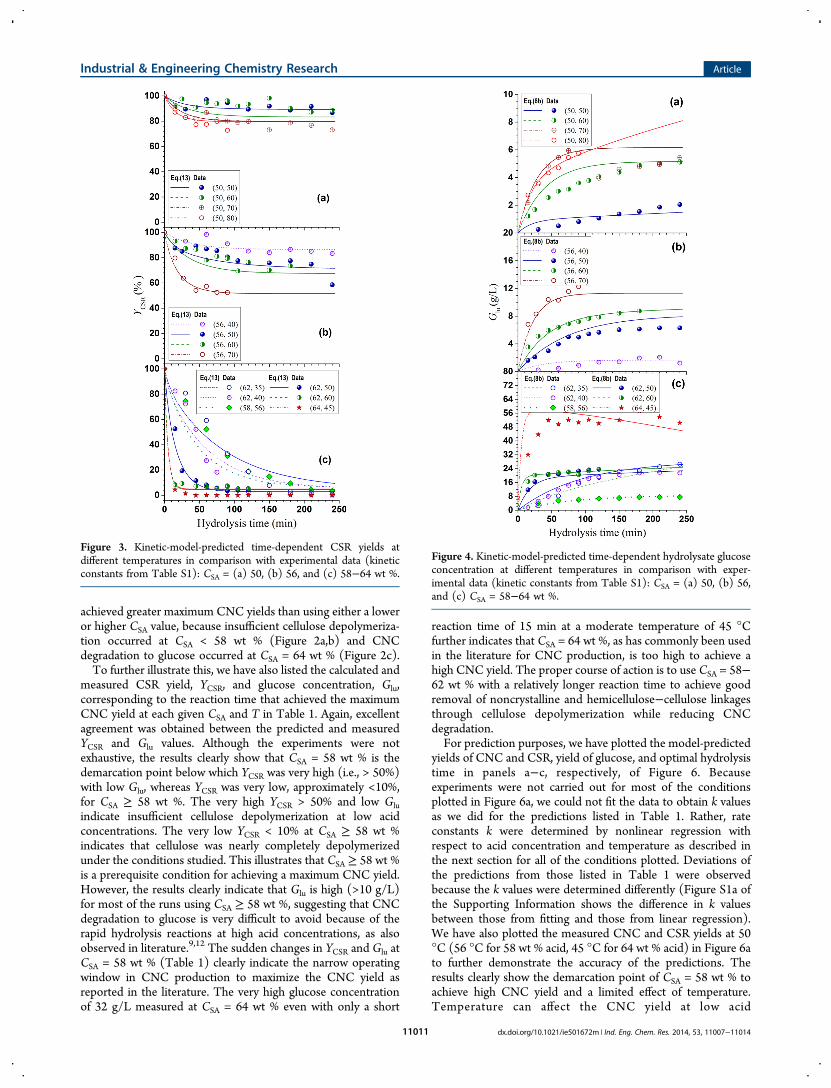
those of CNC yield (Figure 4), but with lower degradations.This suggests that pathway 1 (k1) dominates pathway 2 (k3)(Figure 1) and that reaction rate constant k4 is negligible undermost of the conditions studied. Xylan hydrolysis was fast underthe conditions studied; as a result, the xylose concentration wasonly mildly affected by reaction temperature and acidconcentration (Figure 5). After the initial rapid increase, xylosereached an asymptotic value with minimal degradation for thereaction conditions investigated (i.e., reaction rate constant k6 isnegligible) (Figure 5).
Maximum CNC Yield. For a given reaction at acidconcentration CSA and temperature T at different reactiondurations, the maximum (optimum) achievable CNC yields andthe corresponding optimal reaction time can be calculated usingeqs 15 and 14, respectively. The calculated results werecompared with experimental data. Excellent agreement wasobtained, as shown in Table 1. Using CSA values of 58−62 wt %
Figure 2. Kinetic-model-predicted time-dependent CNC yields atdifferent temperatures in comparison with experimental data (kineticconstants from Table S1): CSA = (a) 50, (b) 56, and (c) CSA = 58−64wt %.
Industrial & Engineering Chemistry Research Article
achieved greater maximum CNC yields than using either a loweror higher CSA value, because insufficient cellulose depolymeriza-tion occurred at CSA < 58 wt % (Figure 2a,b) and CNCdegradation to glucose occurred at CSA = 64 wt % (Figure 2c).To further illustrate this, we have also listed the calculated and
measured CSR yield, YCSR, and glucose concentration, Glu,corresponding to the reaction time that achieved the maximumCNC yield at each given CSA and T in Table 1. Again, excellentagreement was obtained between the predicted and measuredYCSR and Glu values. Although the experiments were notexhaustive, the results clearly show that CSA = 58 wt % is thedemarcation point below which YCSR was very high (i.e., > 50%)with low Glu, whereas YCSR was very low, approximately <10%,for CSA ≥ 58 wt %. The very high YCSR > 50% and low Gluindicate insufficient cellulose depolymerization at low acidconcentrations. The very low YCSR < 10% at CSA ≥ 58 wt %indicates that cellulose was nearly completely depolymerizedunder the conditions studied. This illustrates that CSA ≥ 58 wt %is a prerequisite condition for achieving a maximum CNC yield.However, the results clearly indicate that Glu is high (>10 g/L)for most of the runs using CSA ≥ 58 wt %, suggesting that CNCdegradation to glucose is very difficult to avoid because of therapid hydrolysis reactions at high acid concentrations, as alsoobserved in literature.9,12 The sudden changes in YCSR and Glu atCSA = 58 wt % (Table 1) clearly indicate the narrow operatingwindow in CNC production to maximize the CNC yield asreported in the literature. The very high glucose concentrationof 32 g/L measured at CSA = 64 wt % even with only a short
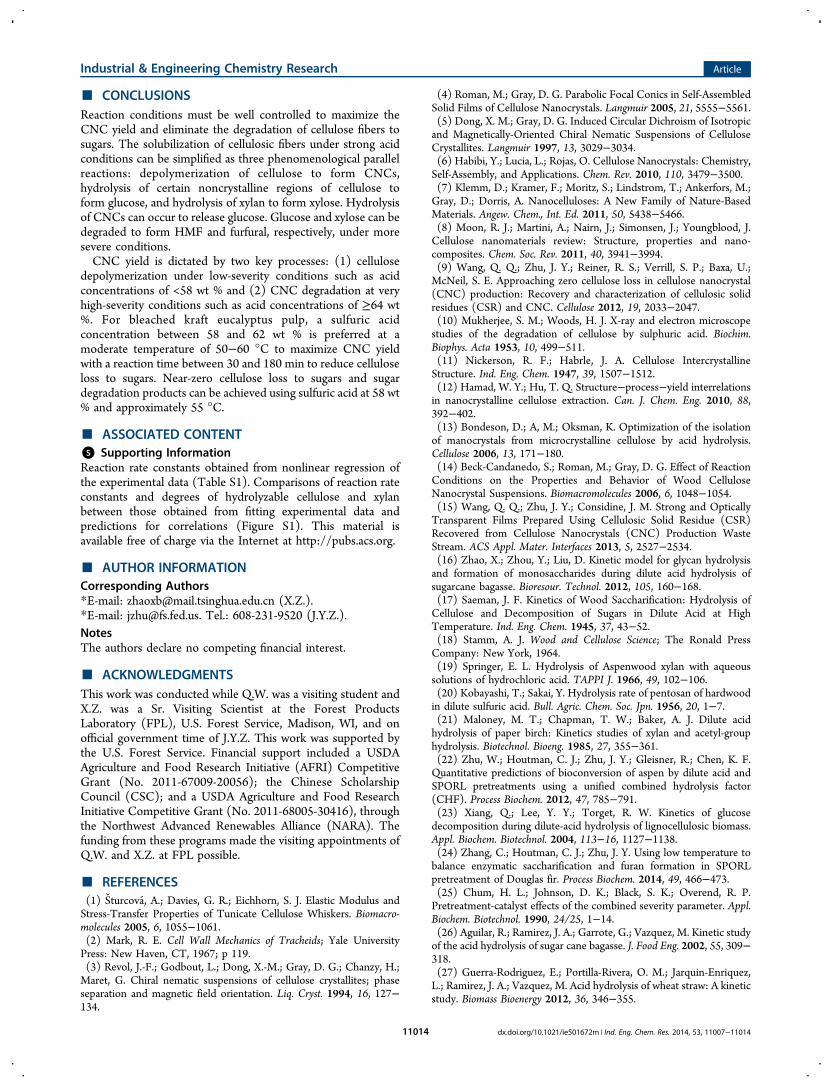
reaction time of 15 min at a moderate temperature of 45 °Cfurther indicates that CSA = 64 wt %, as has commonly been usedin the literature for CNC production, is too high to achieve ahigh CNC yield. The proper course of action is to use CSA = 58−62 wt % with a relatively longer reaction time to achieve goodremoval of noncrystalline and hemicellulose−cellulose linkagesthrough cellulose depolymerization while reducing CNCdegradation.For prediction purposes, we have plotted the model-predicted
yields of CNC and CSR, yield of glucose, and optimal hydrolysistime in panels a−c, respectively, of Figure 6. Becauseexperiments were not carried out for most of the conditionsplotted in Figure 6a, we could not fit the data to obtain k valuesas we did for the predictions listed in Table 1. Rather, rateconstants k were determined by nonlinear regression withrespect to acid concentration and temperature as described inthe next section for all of the conditions plotted. Deviations ofthe predictions from those listed in Table 1 were observedbecause the k values were determined differently (Figure S1a ofthe Supporting Information shows the difference in k valuesbetween those from fitting and those from linear regression).We have also plotted the measured CNC and CSR yields at 50°C (56 °C for 58 wt % acid, 45 °C for 64 wt % acid) in Figure 6ato further demonstrate the accuracy of the predictions. Theresults clearly show the demarcation point of CSA = 58 wt % toachieve high CNC yield and a limited effect of temperature.Temperature can affect the CNC yield at low acid
Figure 3. Kinetic-model-predicted time-dependent CSR yields atdifferent temperatures in comparison with experimental data (kineticconstants from Table S1): CSA = (a) 50, (b) 56, and (c) 58−64 wt %.
Figure 4. Kinetic-model-predicted time-dependent hydrolysate glucoseconcentration at different temperatures in comparison with exper-imental data (kinetic constants from Table S1): CSA = (a) 50, (b) 56,and (c) CSA = 58−64 wt %.
Industrial & Engineering Chemistry Research Article
concentrations of CSA < 58 wt % but with low CNC yields of lessthan 30%. The CSR yield has profiles opposite those of theCNC yield (Figure 6a). Again, temperature has a limited effecton CSR yield. Cellulose degradation to glucose was apparent atCSA ≥ 58 wt % (Figure 6b). The reduction in glucose yield at
CSA = 58−62 wt % is probably due to the errors in estimating k2.The predicted optimal reaction times at various acidconcentration and temperature are plotted in Figure 6c. Longer
Figure 5. Kinetic-model-predicted time-dependent hydrolysate xyloseconcentration at different temperatures in comparison with exper-imental data (kinetic constants from Table S1): CSA = (a) 50, (b) 56,and (c) CSA = 58−64 wt %.
Table 1. Comparisons of Predicted Maximum CNC Yield and the Corresponding CSR Yield and Glucose Concentrations withExperimental Data
reaction times are needed when hydrolysis is conducted at lowtemperatures. Therefore, a moderate temperature of 50−60 °Cis preferred to reduce the reaction time even thoughtemperature has a minimal effect on CNC yield (Figure 6a).Reaction Rate Constants. The regression-obtained rate
constants k can be correlated with T and CSA using the expandedArrhenius equation
= −⎜ ⎟⎛⎝
⎞⎠k k
ERT
Cexp m0
aSA
(16)
where k0 and Ea are the pre-exponential factor and activationenergy, respectively, and m is the reaction order with respect toacid concentration. Similarly, this equation can be expressed as
= − +k kER T
m Cln ln1
ln0a
SA (17)
where k0, Ea, and m can be determined by plotting ln k with 1/Tand CSA, and the results are listed in Table 2.
Therefore, the kinetic constants in the models can beexpressed using the following equations
= −⎜ ⎟⎛⎝
⎞⎠k
RTC4.8059 exp
363531 SA
3.8157
(18a)
= −⎜ ⎟⎛⎝
⎞⎠k
RTC24.1186 exp
402223 SA
3.2566
(18b)
= −⎜ ⎟⎛⎝
⎞⎠k
RTC0.0010 exp
314425 SA
7.5119
(18c)
Because not enough data were obtained for the CNChydrolysis and sugar degradation reactions, the relationships fork2, k4, and k6 were not established. The rate constants k1−k3predicted using eqs 18a−18c were compared with thoseobtained by fitting the experimental data, as shown in FigureS1a (Supporting Information). The agreement was found to begood in general. Large discrepancies were observed for a fewdata points with low k values, especially k1 and k3, which wereless than 0.1 as a result of experimental and mathematicaldifficulties.The rate constant for xylose formation (k5) was found to be
1−2 orders of magnitude larger than that for glucose formation(k3). Similar results were also reported when dilute acid wasused to hydrolyze lignocellulosic biomass.16,26,27 The degrada-tions of xylose and glucose were negligible in most cases.Significant degradations were observed only under severecondition such as CSA > 62% or T > 60 °C. The rate constantfor xylan hydrolysis was found to be 4 orders of magnitude
greater than that for xylose degradation, and the rate constantfor cellulose hydrolysis was about 2 orders of magnitude greaterthan that for glucose degradation. The hydrolysis of CNCs isnot significant in most cases, except at acid concentrations of 64wt % or higher.As shown in Table 2, cellulose hydrolysis to form glucose had
the highest activation energy, whereas xylan hydrolysis had thelowest. Both activation energies were much lower than those forthe dilute acid hydrolysis of lignocelluloses,16,17 indicating thatstrong acid facilitates the hydrolysis of cellulose and xylan at lowtemperatures.
Degrees of Hydrolyzable Cellulose and Xylan. Thedegrees of hydrolyzable cellulose, γ, and xylan, δX, are functionsof reaction severity, that is, sulfuric acid concentration CSA andtemperature T. Based on the combined severity factorconcept,25 we can establish a temperature-related severity
=′ −⎛
⎝⎜⎞⎠⎟R
T Texp
14.750r
(19)
where T′ is the temperature in °C and Tr is a referencetemperature. In this work, we chose Tr = 25 °C, at which thedegradation of CNC should be low. Considering the effect ofsulfuric acid, a “combined severity factor” (R) is defined as
=′ −
=⎛⎝⎜
⎞⎠⎟R C
T TC Rexp
14.75n r n
SA SA 0(20)
where the exponent n represents the strong acid dependence ofthe hydrolysis reactions under strong acid conditions. When Rreaches a certain critical severity (RC) contributed by high CSA
or T, γ or δX tends toward 1, that is, limR→RCγ = 1 and limR→RC
δX= 1. Therefore, for R < RC (corresponding to CSA < CSAC or T <TC), the relationship between γ or δX and R can thus beproposed as
γ δ = − = −α β εB
RB
C Ror 1 1X
SA 0 (21)
where B is a constant and β and ε are corresponding exponentsthat reflect the impacts of sulfuric acid and temperature,respectively, on γ or δX. These equations can also be expressedas
γ δβ ε
−= − + +B C Rln
11 (or )
ln ln lnX
SA 0(22)
Therefore, the parameters B, β, and ε can be determined byplotting ln[1/(1 − γ)] or ln[1/(1 − δX)] versus CSA and R0
γ = −C R
160.8259
SA1.9752
00.1314
(23a)
δ = −C R
146.3115
XSA
2.18530
0.0974(23b)
As discussed previously, an acid concentration of 58 wt % isthe demarcation point above which cellulosic fibers can becompletely dissolved; therefore, γ = 1 when CSA ≥ 58%, in whichcase eq 23a is no longer valid.The degrees of hydrolyzable cellulose and xylan predicted
using eqs 23a and 23b were compared with those determined byfitting the experimental data. Excellent agreement was obtained(Figure S1b, Supporting Information), suggesting that theapproach employed to derive eqs 23a and 23b using thecombined severity factor defined in eq 20 is valid.
Table 2. Kinetic Constants for Predicting Rate Constants kand Degrees of Hydrolyzable Cellulose and Xylan
k orδX k0 or B
Ea (kJ/mol)or ε m or β conditions
γ 60.8259 0.1314 1.9752 50% < CSA < 58%,308 K < T < 353 K
k1 4.8059 36.353 3.8157 50% < CSA < 64%,308 K < T < 353 K
k3 24.1186 40.222 3.2566 50% < CSA < 64%,308 K < T < 353 K
δX 46.3115 0.0974 2.1853 50% < CSA < 64%,308 K < T < 353 K
k5 0.0010 31.442 7.5119 50% < CSA < 64%,308 K < T < 353 K
Industrial & Engineering Chemistry Research Article
■ CONCLUSIONSReaction conditions must be well controlled to maximize theCNC yield and eliminate the degradation of cellulose fibers tosugars. The solubilization of cellulosic fibers under strong acidconditions can be simplified as three phenomenological parallelreactions: depolymerization of cellulose to form CNCs,hydrolysis of certain noncrystalline regions of cellulose toform glucose, and hydrolysis of xylan to form xylose. Hydrolysisof CNCs can occur to release glucose. Glucose and xylose can bedegraded to form HMF and furfural, respectively, under moresevere conditions.CNC yield is dictated by two key processes: (1) cellulose
depolymerization under low-severity conditions such as acidconcentrations of <58 wt % and (2) CNC degradation at veryhigh-severity conditions such as acid concentrations of ≥64 wt%. For bleached kraft eucalyptus pulp, a sulfuric acidconcentration between 58 and 62 wt % is preferred at amoderate temperature of 50−60 °C to maximize CNC yieldwith a reaction time between 30 and 180 min to reduce celluloseloss to sugars. Near-zero cellulose loss to sugars and sugardegradation products can be achieved using sulfuric acid at 58 wt% and approximately 55 °C.
■ ASSOCIATED CONTENT*S Supporting InformationReaction rate constants obtained from nonlinear regression ofthe experimental data (Table S1). Comparisons of reaction rateconstants and degrees of hydrolyzable cellulose and xylanbetween those obtained from fitting experimental data andpredictions for correlations (Figure S1). This material isavailable free of charge via the Internet at http://pubs.acs.org.
■ ACKNOWLEDGMENTSThis work was conducted while Q.W. was a visiting student andX.Z. was a Sr. Visiting Scientist at the Forest ProductsLaboratory (FPL), U.S. Forest Service, Madison, WI, and onofficial government time of J.Y.Z. This work was supported bythe U.S. Forest Service. Financial support included a USDAAgriculture and Food Research Initiative (AFRI) CompetitiveGrant (No. 2011-67009-20056); the Chinese ScholarshipCouncil (CSC); and a USDA Agriculture and Food ResearchInitiative Competitive Grant (No. 2011-68005-30416), throughthe Northwest Advanced Renewables Alliance (NARA). Thefunding from these programs made the visiting appointments ofQ.W. and X.Z. at FPL possible.
■ REFERENCES(1) Sturcova, A.; Davies, G. R.; Eichhorn, S. J. Elastic Modulus andStress-Transfer Properties of Tunicate Cellulose Whiskers. Biomacro-molecules 2005, 6, 1055−1061.(2) Mark, R. E. Cell Wall Mechanics of Tracheids; Yale UniversityPress: New Haven, CT, 1967; p 119.(3) Revol, J.-F.; Godbout, L.; Dong, X.-M.; Gray, D. G.; Chanzy, H.;Maret, G. Chiral nematic suspensions of cellulose crystallites; phaseseparation and magnetic field orientation. Liq. Cryst. 1994, 16, 127−134.
(4) Roman, M.; Gray, D. G. Parabolic Focal Conics in Self-AssembledSolid Films of Cellulose Nanocrystals. Langmuir 2005, 21, 5555−5561.(5) Dong, X. M.; Gray, D. G. Induced Circular Dichroism of Isotropicand Magnetically-Oriented Chiral Nematic Suspensions of CelluloseCrystallites. Langmuir 1997, 13, 3029−3034.(6) Habibi, Y.; Lucia, L.; Rojas, O. Cellulose Nanocrystals: Chemistry,Self-Assembly, and Applications. Chem. Rev. 2010, 110, 3479−3500.(7) Klemm, D.; Kramer, F.; Moritz, S.; Lindstrom, T.; Ankerfors, M.;Gray, D.; Dorris, A. Nanocelluloses: A New Family of Nature-BasedMaterials. Angew. Chem., Int. Ed. 2011, 50, 5438−5466.(8) Moon, R. J.; Martini, A.; Nairn, J.; Simonsen, J.; Youngblood, J.Cellulose nanomaterials review: Structure, properties and nano-composites. Chem. Soc. Rev. 2011, 40, 3941−3994.(9) Wang, Q. Q.; Zhu, J. Y.; Reiner, R. S.; Verrill, S. P.; Baxa, U.;McNeil, S. E. Approaching zero cellulose loss in cellulose nanocrystal(CNC) production: Recovery and characterization of cellulosic solidresidues (CSR) and CNC. Cellulose 2012, 19, 2033−2047.(10) Mukherjee, S. M.; Woods, H. J. X-ray and electron microscopestudies of the degradation of cellulose by sulphuric acid. Biochim.Biophys. Acta 1953, 10, 499−511.(11) Nickerson, R. F.; Habrle, J. A. Cellulose IntercrystallineStructure. Ind. Eng. Chem. 1947, 39, 1507−1512.(12) Hamad, W. Y.; Hu, T. Q. Structure−process−yield interrelationsin nanocrystalline cellulose extraction. Can. J. Chem. Eng. 2010, 88,392−402.(13) Bondeson, D.; A, M.; Oksman, K. Optimization of the isolationof manocrystals from microcrystalline cellulose by acid hydrolysis.Cellulose 2006, 13, 171−180.(14) Beck-Candanedo, S.; Roman, M.; Gray, D. G. Effect of ReactionConditions on the Properties and Behavior of Wood CelluloseNanocrystal Suspensions. Biomacromolecules 2006, 6, 1048−1054.(15) Wang, Q. Q.; Zhu, J. Y.; Considine, J. M. Strong and OpticallyTransparent Films Prepared Using Cellulosic Solid Residue (CSR)Recovered from Cellulose Nanocrystals (CNC) Production WasteStream. ACS Appl. Mater. Interfaces 2013, 5, 2527−2534.(16) Zhao, X.; Zhou, Y.; Liu, D. Kinetic model for glycan hydrolysisand formation of monosaccharides during dilute acid hydrolysis ofsugarcane bagasse. Bioresour. Technol. 2012, 105, 160−168.(17) Saeman, J. F. Kinetics of Wood Saccharification: Hydrolysis ofCellulose and Decomposition of Sugars in Dilute Acid at HighTemperature. Ind. Eng. Chem. 1945, 37, 43−52.(18) Stamm, A. J. Wood and Cellulose Science; The Ronald PressCompany: New York, 1964.(19) Springer, E. L. Hydrolysis of Aspenwood xylan with aqueoussolutions of hydrochloric acid. TAPPI J. 1966, 49, 102−106.(20) Kobayashi, T.; Sakai, Y. Hydrolysis rate of pentosan of hardwoodin dilute sulfuric acid. Bull. Agric. Chem. Soc. Jpn. 1956, 20, 1−7.(21) Maloney, M. T.; Chapman, T. W.; Baker, A. J. Dilute acidhydrolysis of paper birch: Kinetics studies of xylan and acetyl-grouphydrolysis. Biotechnol. Bioeng. 1985, 27, 355−361.(22) Zhu, W.; Houtman, C. J.; Zhu, J. Y.; Gleisner, R.; Chen, K. F.Quantitative predictions of bioconversion of aspen by dilute acid andSPORL pretreatments using a unified combined hydrolysis factor(CHF). Process Biochem. 2012, 47, 785−791.(23) Xiang, Q.; Lee, Y. Y.; Torget, R. W. Kinetics of glucosedecomposition during dilute-acid hydrolysis of lignocellulosic biomass.Appl. Biochem. Biotechnol. 2004, 113−16, 1127−1138.(24) Zhang, C.; Houtman, C. J.; Zhu, J. Y. Using low temperature tobalance enzymatic saccharification and furan formation in SPORLpretreatment of Douglas fir. Process Biochem. 2014, 49, 466−473.(25) Chum, H. L.; Johnson, D. K.; Black, S. K.; Overend, R. P.Pretreatment-catalyst effects of the combined severity parameter. Appl.Biochem. Biotechnol. 1990, 24/25, 1−14.(26) Aguilar, R.; Ramirez, J. A.; Garrote, G.; Vazquez, M. Kinetic studyof the acid hydrolysis of sugar cane bagasse. J. Food Eng. 2002, 55, 309−318.(27) Guerra-Rodriguez, E.; Portilla-Rivera, O. M.; Jarquin-Enriquez,L.; Ramirez, J. A.; Vazquez, M. Acid hydrolysis of wheat straw: A kineticstudy. Biomass Bioenergy 2012, 36, 346−355.
Industrial & Engineering Chemistry Research Article