King County Metro Transit 2014 Rider Survey Final Report Summary April 2015 Research Conducted for: King County Department of Transportation Metro Transit Division By: Northwest Research Group, LLC
Transcript
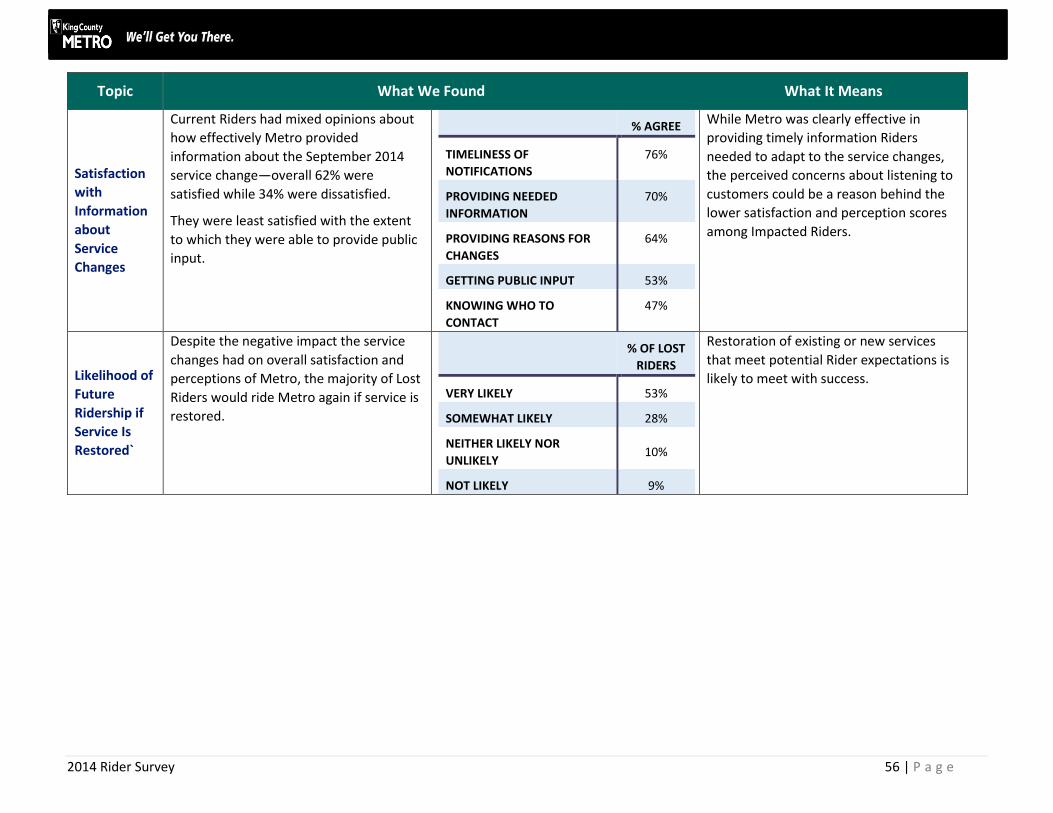
King County
Metro Transit
2014 Rider Survey
Final Report
Summary
April 2015
Research Conducted for:
King County
Department of Transportation
Metro Transit Division
By:
Northwest Research Group, LLC
2014 Rider Survey 2 | P a g e
Prepared by:
King County Metro Transit Division
Strategy and Performance
Project / Program Manager
Lori Mimms
Senior Projects Manager
Chuck Sawyer
Northwest Research Group, LLC
Rebecca Elmore-Yalch, Principal / Managing Director
Table of Contents ........................................................................................................................................................................................................... 3
Study Background and Objectives................................................................................................................................................................................ 22
Findings: Fare Payment ................................................................................................................................................................................................ 41
Findings: Sources of Information about Metro ............................................................................................................................................................ 43
Findings: Overall Satisfaction with Metro and Goodwill .............................................................................................................................................. 44
Findings: Service Quality .............................................................................................................................................................................................. 48
Findings: Personal Safety ............................................................................................................................................................................................. 53
Impact of Service Change ............................................................................................................................................................................................. 54
2014 Rider Survey 4 | P a g e
EXECUTIVE SUMMARY
Project Overview
King County Metro Transit places high value on customer feedback. For more than 25 years, Metro has conducted an annual telephone survey of King
County residents—both those who ride Metro buses and those who do not.
Objectives
• Provide a reliable measure of market share
• Track awareness and perceptions of Metro services among both Riders and Non-Riders
• Identify and track demographic characteristics, attitudes, and transit use among Riders and Non-Riders
• Provide insight about topics related to Metro’s service, marketing, and communications strategies
The study is widely used by different Metro sections. It provides important information on current and past performance and helps provide direction
for future strategies.
Methodology
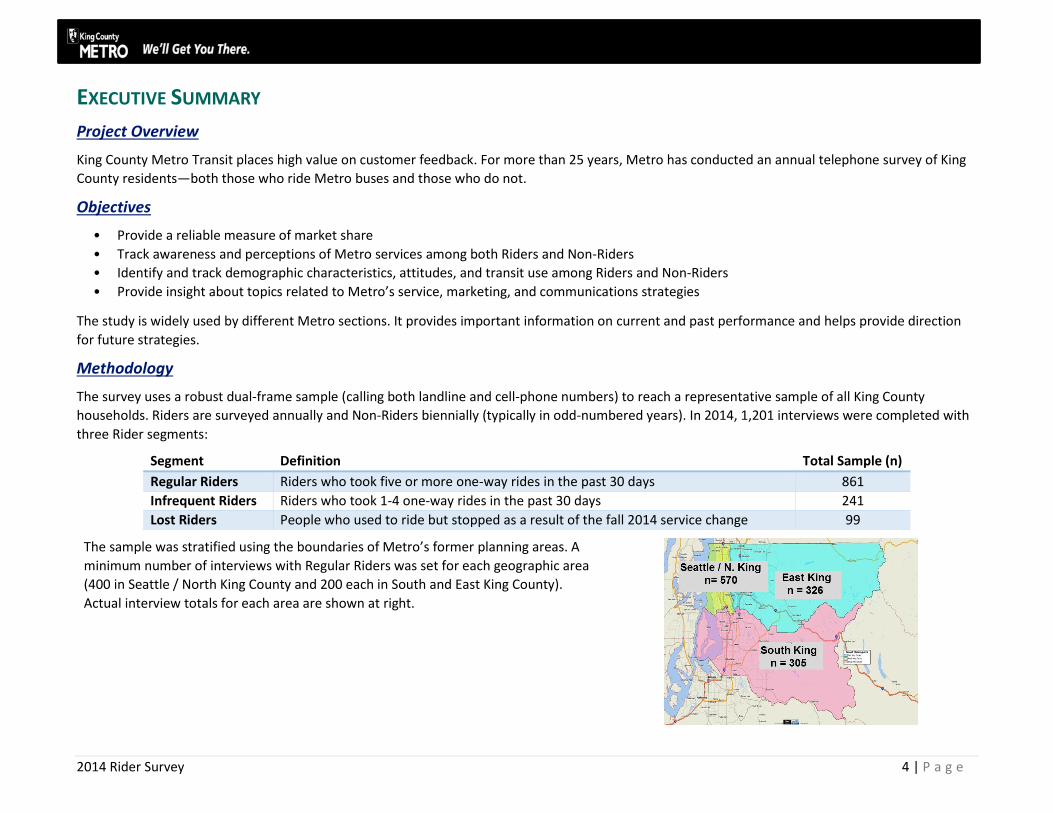
The survey uses a robust dual-frame sample (calling both landline and cell-phone numbers) to reach a representative sample of all King County
households. Riders are surveyed annually and Non-Riders biennially (typically in odd-numbered years). In 2014, 1,201 interviews were completed with
three Rider segments:
Segment Definition Total Sample (n)
Regular Riders Riders who took five or more one-way rides in the past 30 days 861
Infrequent Riders Riders who took 1-4 one-way rides in the past 30 days 241
Lost Riders People who used to ride but stopped as a result of the fall 2014 service change 99
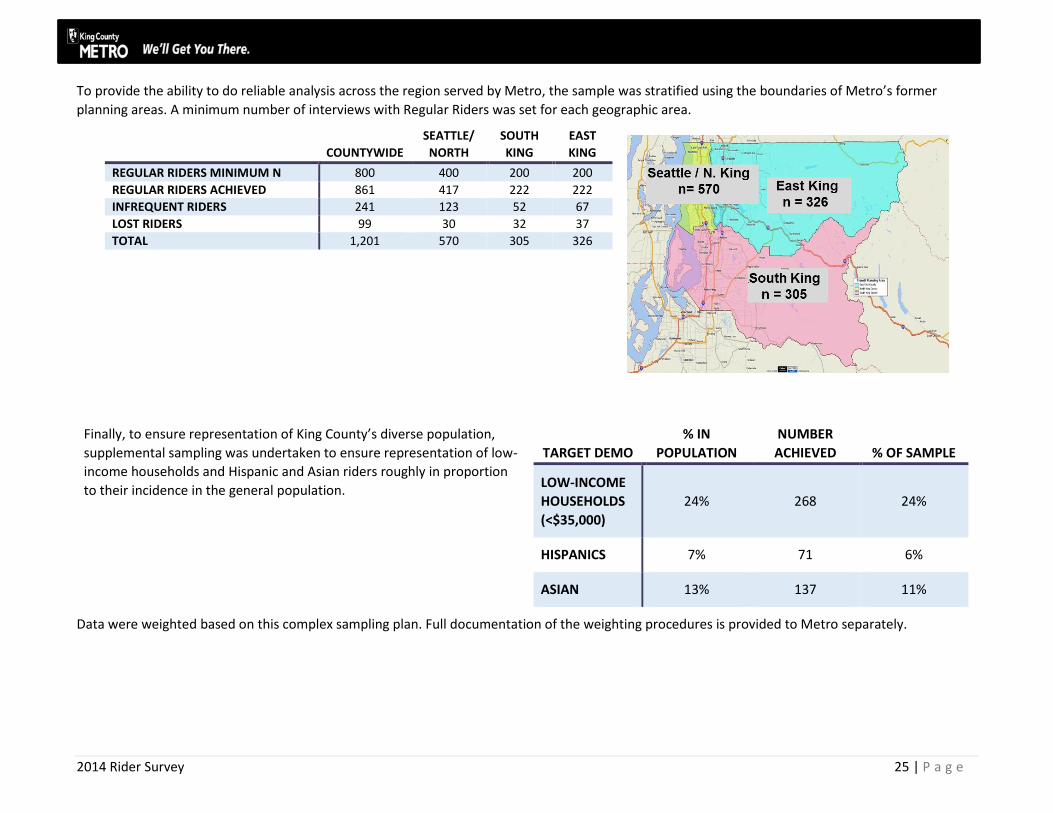
The sample was stratified using the boundaries of Metro’s former planning areas. A
minimum number of interviews with Regular Riders was set for each geographic area
(400 in Seattle / North King County and 200 each in South and East King County).
Actual interview totals for each area are shown at right.
2014 Rider Survey 5 | P a g e
Key Findings
MARKET SHARE
Metro represents an important mode of transportation for a significant percentage of King County’s population.
Metro gained significant market share in 2012 and again in 2013.The share
of households with Regular Riders increased slightly in 2014 while the
share of households with Infrequent Riders decreased. The overall share
of Rider households between 2013 and 2014 is unchanged.
Seattle / North King County represents Metro’s largest market. While
small geographically it has the highest number of households and the
highest percentage of households with Riders. More than half of all Riders
live in this area.
South and East King County are similar in size and market share. A greater
percentage of Riders live in South versus East King County due to larger
household sizes.
The share of Regular Rider households in South and East King County has risen significantly over the past several years.
▲ / ▼ indicates a statistically significant change from previous year
PERCENTAGE OF…
SEATTLE
/ N. KING
SOUTH
KING
EAST
KING
HOUSEHOLDS 39% 35% 35%
RIDER HOUSEHOLDS 62% 31% 31%
POPULATION WHO ARE
RIDERS
55% 27% 27%
METRO RIDERS 52% 26% 22%
2014 Rider Survey 6 | P a g e
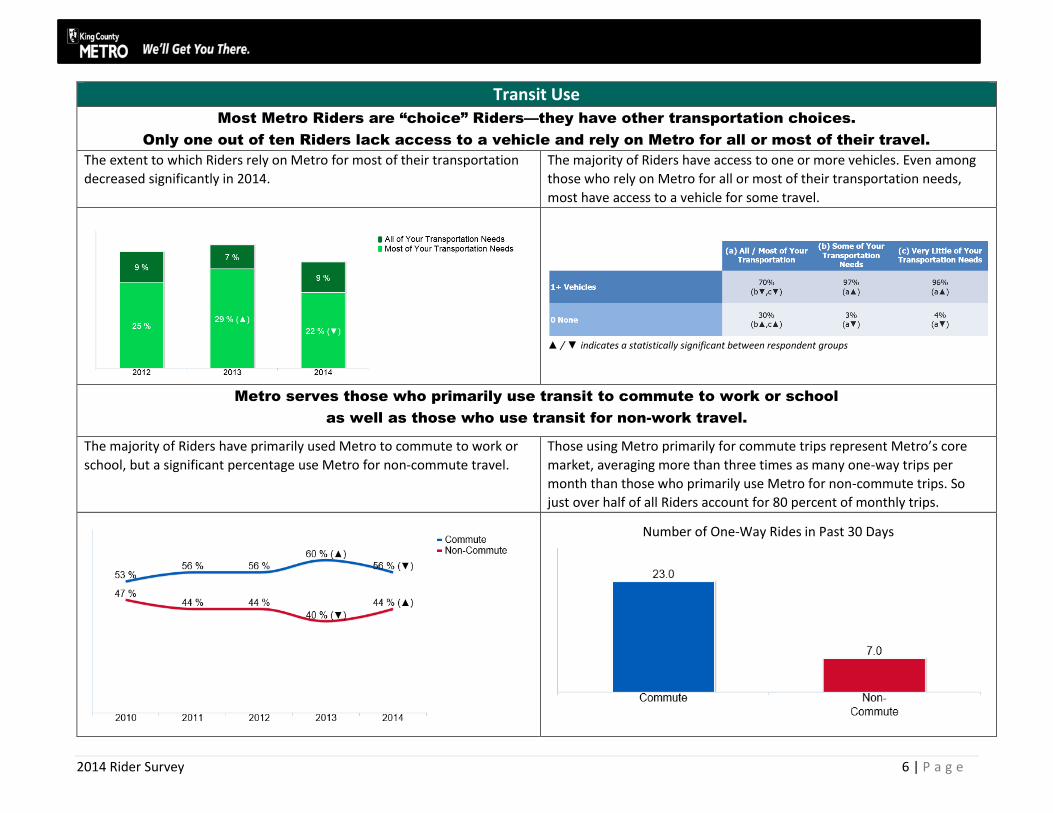
Transit Use
Most Metro Riders are “choice” Riders—they have other transportation choices.
Only one out of ten Riders lack access to a vehicle and rely on Metro for all or most of their travel.
The extent to which Riders rely on Metro for most of their transportation
decreased significantly in 2014.
The majority of Riders have access to one or more vehicles. Even among
those who rely on Metro for all or most of their transportation needs,
most have access to a vehicle for some travel.
▲ / ▼ indicates a statistically significant between respondent groups
Metro serves those who primarily use transit to commute to work or school
as well as those who use transit for non-work travel.
The majority of Riders have primarily used Metro to commute to work or
school, but a significant percentage use Metro for non-commute travel.
Those using Metro primarily for commute trips represent Metro’s core
market, averaging more than three times as many one-way trips per
month than those who primarily use Metro for non-commute trips. So
just over half of all Riders account for 80 percent of monthly trips.
Number of One-Way Rides in Past 30 Days
2014 Rider Survey 7 | P a g e
Transit Use
Metro serves three primary Rider segments, based on the number of monthly trips.
Frequent Regular Riders are Metro’s core market
The distribution of these segments has remained relatively stable over the
years. Two out of five Riders are Frequent Regular Riders—taking 11 or
more one-way trips per month.
With the exception of Frequent Regular Riders, the average number of
one-way trips taken has been relatively stable.
Trips taken by Frequent Regular Riders peaked in 2012 and have been decreasing since then. Frequent Regular Riders account for 85% of all trips.
2014 Rider Survey 8 | P a g e
Fare Payment
The split between ORCA and cash has remained relatively stable over the past two years.
Riders who use Reduced Regional Fare Permits increased significantly in 2014.
Riders are more than twice as likely to use an ORCA card than pay with
cash—62% compared to 27%. ORCA use includes the 49% of Riders with an
adult or youth fare on their ORCA cards as well as 13% with a Regional
Reduced Fare Permit on their ORCA cards and 7% with a U-PASS.
The percentage of ORCA users with a pass on their cards decreased
somewhat (significant at the 90% confidence level), with a corresponding
increase in the percentage with an E-Purse. Consistent with the increase
in older Riders surveyed in 2014, significantly more Riders currently have
an RRFP on their ORCA Card.
* Includes ORCA Cards, RRFP on ORCA Card, U-PASS
2014 Rider Survey 9 | P a g e
Information Sources
Riders rely heavily on online sources to get information about Metro, but printed timetables and information at
stops are also widely used. A relatively small percentage of Riders call or use Metro Alerts.
Riders use multiple sources to get information
about Metro. The most frequently used were online
sources and information at stops.
2014 Rider Survey 10 | P a g e
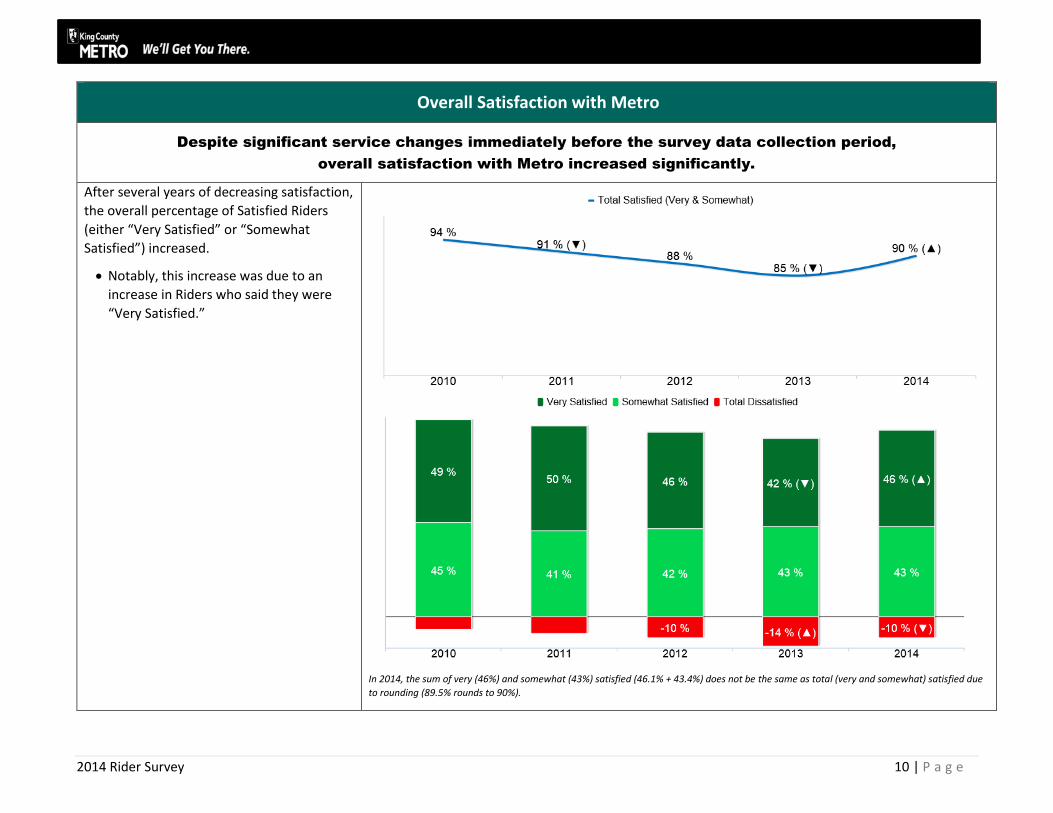
Overall Satisfaction with Metro
Despite significant service changes immediately before the survey data collection period,
overall satisfaction with Metro increased significantly.
After several years of decreasing satisfaction,
the overall percentage of Satisfied Riders
(either “Very Satisfied” or “Somewhat
Satisfied”) increased.
Notably, this increase was due to an
increase in Riders who said they were
“Very Satisfied.”
In 2014, the sum of very (46%) and somewhat (43%) satisfied (46.1% + 43.4%) does not be the same as total (very and somewhat) satisfied due
to rounding (89.5% rounds to 90%).
2014 Rider Survey 11 | P a g e
Riders’ Expectations of and Advocacy for Metro
Riders have significantly more positive impressions of Metro.
The majority of Riders have high
expectations for service quality and generally
feel that Metro can deliver on these
expectations.
At the same time, three out of ten
Riders have low or mixed
impressions and expect to encounter
problems when riding.
Riders are significantly more likely to strongly
agree that they “like to be able to say they
ride Metro.”
This statement serves as a proxy for Riders’
willingness to recommend riding and/or
advocate for supporting Metro.
Agree/Disagree: I like to be able to say I ride Metro
2014 Rider Survey 12 | P a g e
Satisfaction with Service
Despite significant service changes immediately before the survey data collection period,
overall satisfaction with Metro increased significantly.
Riders were asked their satisfaction with 36
specific elements of service. These next
tables provide details of the percentage of
Riders who are very satisfied with these
elements of service and changes in the
percentage of Very Satisfied Riders from
2013.
Satisfaction increased for some of the
individual elements of service.
Notably, the percentage of Very Satisfied
Riders increased significantly for several
elements of Personal Safety.
Riders continue to be less satisfied with
Daytime Safety on Buses than at Stops.
While the percentage of Very Satisfied
Riders increased significantly for Onboard
Safety after Dark, this continues to be
one of the lowest rated elements of
service (< 40% Very Satisfied).
2014 Rider Survey 13 | P a g e
Satisfaction with Service
Satisfaction remained relatively stable for
most elements of service.
Several elements of service related to
Personal Safety and Comfort and Cleanliness
at Stops continue to be some of the lowest-
rated elements of service (< 40% Very
Satisfied).
Satisfaction with information at bus stops was added in 2014, so no comparable ratings are available for 2013
2014 Rider Survey 14 | P a g e
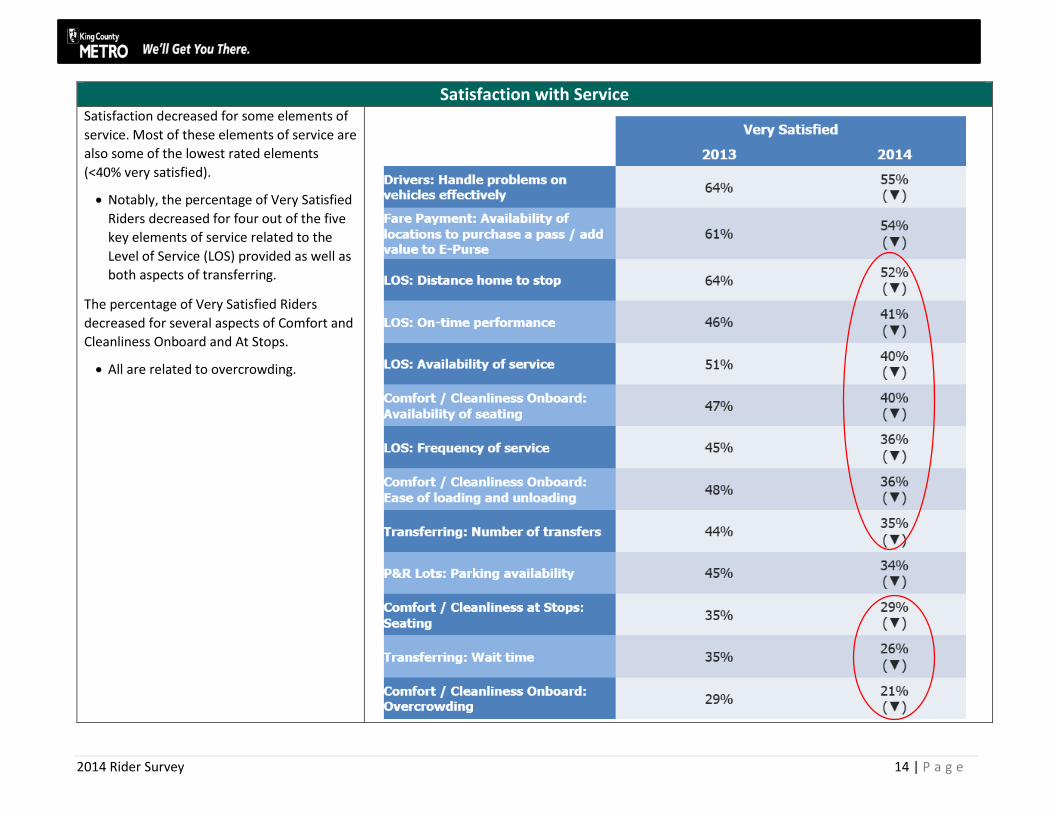
Satisfaction with Service
Satisfaction decreased for some elements of
service. Most of these elements of service are
also some of the lowest rated elements
(<40% very satisfied).
Notably, the percentage of Very Satisfied
Riders decreased for four out of the five
key elements of service related to the
Level of Service (LOS) provided as well as
both aspects of transferring.
The percentage of Very Satisfied Riders
decreased for several aspects of Comfort and
Cleanliness Onboard and At Stops.
All are related to overcrowding.
2014 Rider Survey 15 | P a g e
Perceptions of Personal Safety
Consistent with increased satisfaction with Personal Safety, Riders perceptions
of Metro’s efforts to improve safety have improved.
The majority of Riders do not avoid riding
because of concerns about safety.
The extent to which Riders avoid riding has decreased significantly from 2012, the first year this question was asked.
Nearly half of all Riders strongly agree that
Metro provides a safe and secure
transportation environment. This number is
up significantly from 2013, and at its highest
level of agreement since the question was
first asked in 2012.
2014 Rider Survey 16 | P a g e
Perceptions of Personal Safety
One of three Riders strongly agree that
Metro is proactive in improving safety and
security, and the increase in the percentage
who strongly agree is consistent with other
increases in positive perceptions of Metro
and its efforts to improve safety.
Riders are increasingly likely to strongly agree
that it is safe to ride in downtown Seattle.
Riders continue to express concerns
about safety using public transportation
in downtown Seattle when it is dark.
Agree/Disagree: Safe to use transit in DT Seattle daytime Agree/Disagree: Safe to use transit in DT Seattle after dark
2014 Rider Survey 17 | P a g e
Impacts of September 2014 Service Change
The large majority of Riders were not impacted by the service change.
Nearly three out of four respondents indicated that they were not
impacted by the service change (Current Riders: No Impact).
About 1 in 17 respondents said they stopped riding as a result of the
service changes (Lost Riders).
2014 Rider Survey 18 | P a g e
Impacts of September 2014 Service Change
The service change had a significant impact on Riders’ overall satisfaction with Metro as well as their
perceptions that Metro can deliver the level of service they expect.
The service change had a significant impact on Impacted Riders’ overall
satisfaction with Metro. Without the service change, it is possible the
increase in overall satisfaction mentioned earlier could have been
greater.
Current Riders impacted by the service change and Lost Riders also
have significantly lower expectations that Metro can deliver quality
service.
2014 Rider Survey 19 | P a g e
Impacts of September 2014 Service Change
Riders who were impacted by the service change were significantly less
satisfied with the Level of Service provided. The impact was greatest on
the percentage very satisfied with:
Frequency of Service
Travel Time
Riders impacted by the service change were also significantly less
satisfied with Comfort Onboard. The impact was greatest on the
percentage very satisfied with:
Availability of Seating
Ease of Loading and Unloading (due to crowding on the
vehicles)
2014 Rider Survey 20 | P a g e
Impacts of September 2014 Service Change
The majority of those who stopped riding as a result of the service change say they
would ride again if service is restored.
Despite the impact the service changes had on overall satisfaction and
perceptions of Metro among Lost Riders, a large majority of Lost Riders
suggest they would ride Metro again if service is restored.
2014 Rider Survey 21 | P a g e
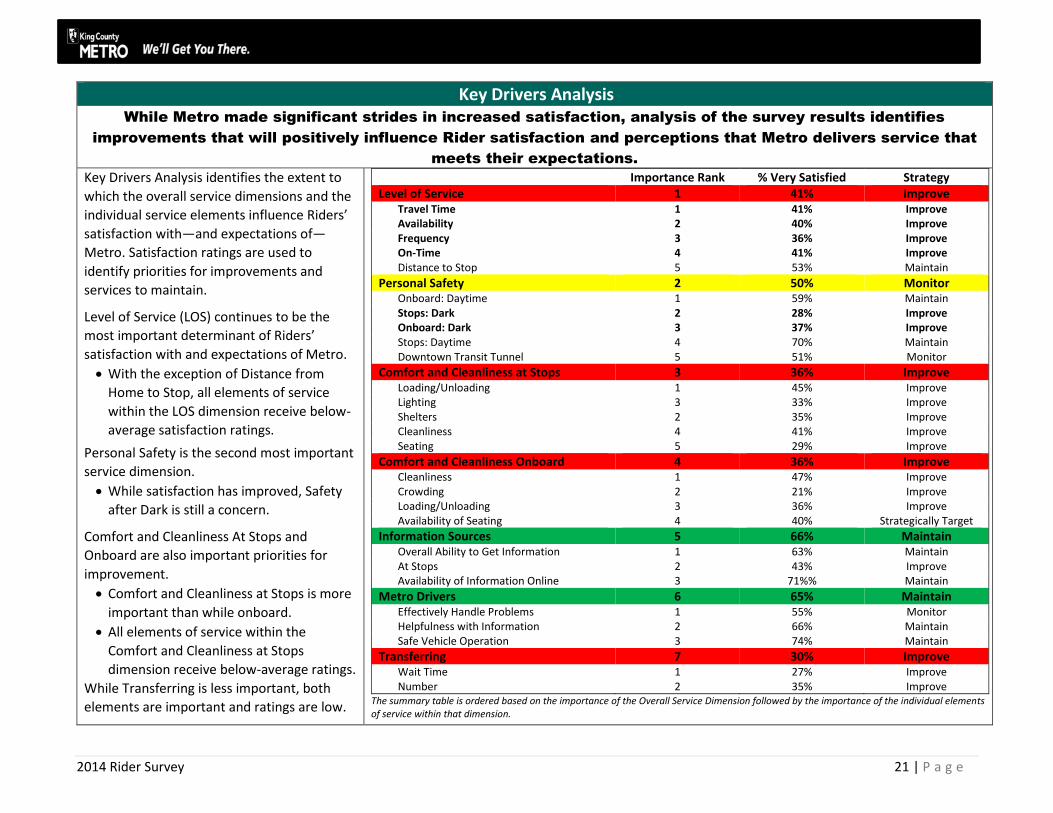
Key Drivers Analysis
While Metro made significant strides in increased satisfaction, analysis of the survey results identifies
improvements that will positively influence Rider satisfaction and perceptions that Metro delivers service that
meets their expectations.
Key Drivers Analysis identifies the extent to
which the overall service dimensions and the
individual service elements influence Riders’
satisfaction with—and expectations of—
Metro. Satisfaction ratings are used to
identify priorities for improvements and
services to maintain.
Level of Service (LOS) continues to be the
most important determinant of Riders’
satisfaction with and expectations of Metro.
With the exception of Distance from
Home to Stop, all elements of service
within the LOS dimension receive below-
average satisfaction ratings.
Personal Safety is the second most important
service dimension.
While satisfaction has improved, Safety
after Dark is still a concern.
Comfort and Cleanliness At Stops and
Onboard are also important priorities for
improvement.
Comfort and Cleanliness at Stops is more
important than while onboard.
All elements of service within the
Comfort and Cleanliness at Stops
dimension receive below-average ratings.
While Transferring is less important, both
elements are important and ratings are low.
Importance Rank % Very Satisfied Strategy Level of Service 1 41% Improve
Travel Time 1 41% Improve Availability 2 40% Improve Frequency 3 36% Improve On-Time 4 41% Improve Distance to Stop 5 53% Maintain
Overall Ability to Get Information 1 63% Maintain At Stops 2 43% Improve Availability of Information Online 3 71%% Maintain
Metro Drivers 6 65% Maintain
Effectively Handle Problems 1 55% Monitor Helpfulness with Information 2 66% Maintain Safe Vehicle Operation 3 74% Maintain
Transferring 7 30% Improve
Wait Time 1 27% Improve Number 2 35% Improve
The summary table is ordered based on the importance of the Overall Service Dimension followed by the importance of the individual elements of service within that dimension.
2014 Rider Survey 22 | P a g e
STUDY BACKGROUND AND OBJECTIVES King County’s Department of Transportation—Transit Division (King County Metro) places high value on customer feedback and for more than 25 years
has conducted an annual survey with King County residents who are transit Riders and Non-Riders. The primary objectives of this ongoing study are to:
Provide a reliable measure of market share—that is, the percentage of households in King County with one or more riders
Track customer awareness and perceptions of Metro services and programs
Identify and track demographic, attitudinal, and transit use characteristics among riders and commuters
Provide insights on current and relevant topics that are a current focus of Metro’s service, marketing, and communications strategies
Riders are surveyed every year; Non-Riders are generally included every other (odd-numbered) year. This year’s survey (2014) focuses primarily on
Riders. In addition, the survey included some respondents who stopped riding due to the September service change.
2014 Rider Survey 23 | P a g e
METHODOLOGY
Sampling
The 2014 survey was based on a random telephone (landline and cell phone) sample of 5,348 King County residents aged 16 and older. A total of 1,201
of those contacted reported that they had ridden Metro in the 30 days prior to being surveyed and completed the entire survey.
Three primary rider segments were interviewed. The Lost Rider segment is new in 2014 and was included to provide insights into the impact of the
September 2014 service changes.
Regular Riders
5 or More One-Way Rides in Past 30 Days
n = 861
Infrequent Riders
1–4 One-Way Rides in Past 30 Days
n = 241
Lost Riders Rode Prior to 10/2014 and Stopped
Riding as a Result of Service Changes
n = 99
Regular Riders were further segmented based on their riding frequency.
Frequent Regular Riders
11+ One-Way Rides in Past 30 Days n = 591
Moderate Regular Riders
5–10 One-Way Rides in Past 30 Days n = 266
Four (4) Regular Riders did not provide an absolute number of one-way rides taken in the past 30 days. Therefore they are not included in the Frequent or Moderate Regular Rider classifications, and the sum of
these two segments (n = 857) is less than total Regular Riders (n = 861).
• Personal Travel • Fare Payment • Personal Safety
• Information Sources • Commute Status and Behavior
• Management of Service Change • Satisfaction with Service Elements
Current and Lost Riders
• Overall Satisfaction • Perceptions of Metro • Demographics
The survey instrument was pretested over several days. The initial pretest focused on questionnaire wording and respondent understanding.
Subsequent pretesting was used to test study assumptions including survey length and incidence. Data collection began on November 8, 2014, and
continued through December 14, 2014. No interviewing was done the day before or after the Thanksgiving holiday (November 27).
Data collection was originally scheduled to start on 10/27/2014 but was delayed to begin after the election held on 11/04/2014. It was felt that
inclusion of Proposition 1 (a transit-related measure) on the Seattle ballot could adversely impact response rates and introduce bias.
Bernett Research was used for telephone data collection; they also did the data collection for the 2013 Rider / Non-Rider Survey. A minimum of 10
percent of all interviews were monitored; NWRG project staff monitored (either live or through recordings) a minimum of 5 percent of the interviews.
Interviews were conducted in English and Spanish. The survey was translated into Spanish and administered by multilingual interviewers. Seventy-one
(71) respondents self-identified as Hispanic; a total of 22 interviews (31%) chose to complete the survey in Spanish. This is significantly higher than
2013 when only 22 out of a total of 120 Hispanics (18%) completed the survey in Spanish.
2014 Rider Survey 28 | P a g e
FINDINGS—MARKET SHARE This annual survey provides a reliable measure of market share—defined as the percentage of King County households with one or more Regular Rider
(individuals taking at least five one-way rides monthly). This is done by asking all households contacted: (1) the number of individuals in their household
16 years of age and older, (2) the number of household members taking at least one one-way ride on a Metro bus or the South Lake Union Streetcar in the
previous 30 days, and (3) the number taking five or more one-way rides in the previous 30 days.
Topic What We Found What It Means
Household
Market
Share
Countywide, the share of Regular Rider
households has remained stable for the
past three years.
The share of households with
Infrequent Riders (no Regular Riders)
has fluctuated over the years.
2012 2013 2014
REGULAR Rider Households
33% 34% 35%
INFREQUENT Rider Households
7% 11%▲ 9%▼
NON-Rider Households
60% 55%▼ 56%
Significant increase (▲) or (▼) from previous year
Metro’s ridership growth in recent years
has come from population growth—that
is, growth in the number of households in
King County—attracting Riders from
within these new households while
retaining Riders from within existing
households.
Seattle / N.
King County
Geographically Seattle / North King
County is relatively small but is the most
densely populated area of the county
(39% of all households).
After decreasing significantly between
2012 and 2013, the share of Regular Rider
households increased somewhat in 2014.
This increase, however, is not statistically
significant and should be monitored in
further years.
2012 2013 2014
REGULAR Rider Households
53% 47%▼ 49%
INFREQUENT Rider Households
11% 14%▲ 13%
NON-Rider Households
36% 39% 38%
Significant increase (▲) or (▼) from previous year
Seattle / North King County continues to
represent King County’s core market. It is
the most densely populated geographic
area (39% of all households), and
extensive, relatively high-frequency
service has translated into very high
market share.
2014 Rider Survey 29 | P a g e
Topic What We Found What It Means
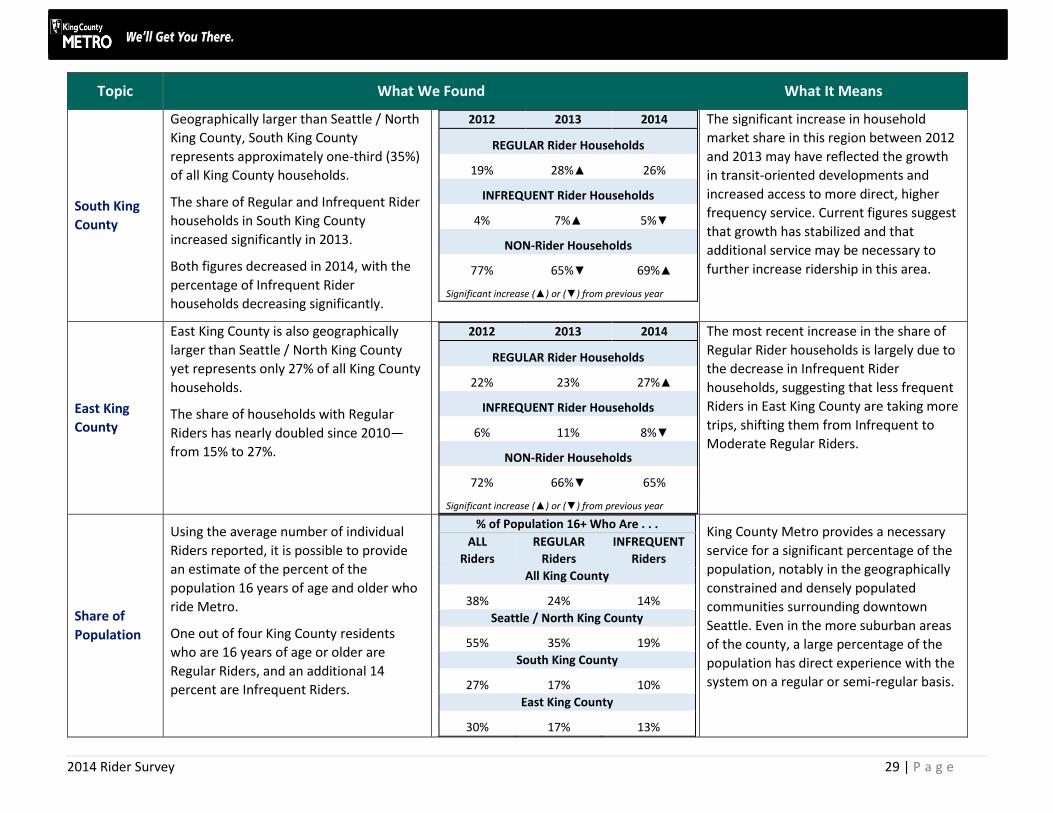
South King
County
Geographically larger than Seattle / North
King County, South King County
represents approximately one-third (35%)
of all King County households.
The share of Regular and Infrequent Rider
households in South King County
increased significantly in 2013.
Both figures decreased in 2014, with the
percentage of Infrequent Rider
households decreasing significantly.
2012 2013 2014
REGULAR Rider Households
19% 28%▲ 26%
INFREQUENT Rider Households
4% 7%▲ 5%▼
NON-Rider Households
77% 65%▼ 69%▲
Significant increase (▲) or (▼) from previous year
The significant increase in household
market share in this region between 2012
and 2013 may have reflected the growth
in transit-oriented developments and
increased access to more direct, higher
frequency service. Current figures suggest
that growth has stabilized and that
additional service may be necessary to
further increase ridership in this area.
East King
County
East King County is also geographically
larger than Seattle / North King County
yet represents only 27% of all King County
households.
The share of households with Regular
Riders has nearly doubled since 2010—
from 15% to 27%.
2012 2013 2014
REGULAR Rider Households
22% 23% 27%▲
INFREQUENT Rider Households
6% 11% 8%▼
NON-Rider Households
72% 66%▼ 65%
Significant increase (▲) or (▼) from previous year
The most recent increase in the share of
Regular Rider households is largely due to
the decrease in Infrequent Rider
households, suggesting that less frequent
Riders in East King County are taking more
trips, shifting them from Infrequent to
Moderate Regular Riders.
Share of
Population
Using the average number of individual
Riders reported, it is possible to provide
an estimate of the percent of the
population 16 years of age and older who
ride Metro.
One out of four King County residents
who are 16 years of age or older are
Regular Riders, and an additional 14
percent are Infrequent Riders.
% of Population 16+ Who Are . . .
ALL
Riders
REGULAR
Riders
INFREQUENT
Riders
All King County
38% 24% 14%
Seattle / North King County
55% 35% 19%
South King County
27% 17% 10%
East King County
30% 17% 13%
King County Metro provides a necessary
service for a significant percentage of the
population, notably in the geographically
constrained and densely populated
communities surrounding downtown
Seattle. Even in the more suburban areas
of the county, a large percentage of the
population has direct experience with the
system on a regular or semi-regular basis.
2014 Rider Survey 30 | P a g e
FINDINGS: RIDER DEMOGRAPHICS
Topic What We Found What It Means
All Current
Riders
Riders surveyed in 2014 are more likely to
be women than men—the reverse of the
general population.
In addition, Riders surveyed in 2014 are
older than the general population.
Notably, more than four out of ten riders
surveyed in 2014 are 55 and older,
compared to just three out of ten
individual in the general population. The
increase in the percentage of older riders
surveyed occurred within the 55+ age
group, with a corresponding decreased in
the percentage between the ages of 18
and 44.
Riders are somewhat less affluent than
the general population.
More than four out of five Riders have a
driver’s license and/or access to a vehicle
King County
Population*
Current
Metro
Riders
Male 52% 47%
Female 48% 53%
16–17 3% 3%
18–34 29% 23%
35–54 37% 33%
55+ 31% 41%
Mean 44.8 48.3
Employed 64% 65%
Not Employed 36% 35%
<$35,000 24% 26%
$35K–<$75K 28% 30%
$75K–<$100K 13% 12%
$100K + 35% 31%
Median $70,998 $66,448
% with License n.a. 83%
% with Vehicle
in Household 91% 88%
* Source: 2013 American Community Survey three-year
estimates
While response rates to the survey were
high, there is a significant increase in the
percentage of older riders reached. A
greater number of older riders were
reached through the cell phone sample
which in the past reached a high number
of younger residents. In addition, a
greater percentage of Infrequent Riders
were surveyed. Infrequent Riders are
older. Future research can be used to
determine if this (aging Riders) is a trend.
With most Riders have access to a vehicle,
it is clear that they have a choice in
whether or not to use transit. Other
factors such as access to service,
congestion, parking costs, and social
consciousness are likely motivators for
transit use among these Riders.
2014 Rider Survey 31 | P a g e
Topic What We Found What It Means
Regular and
Infrequent
Riders
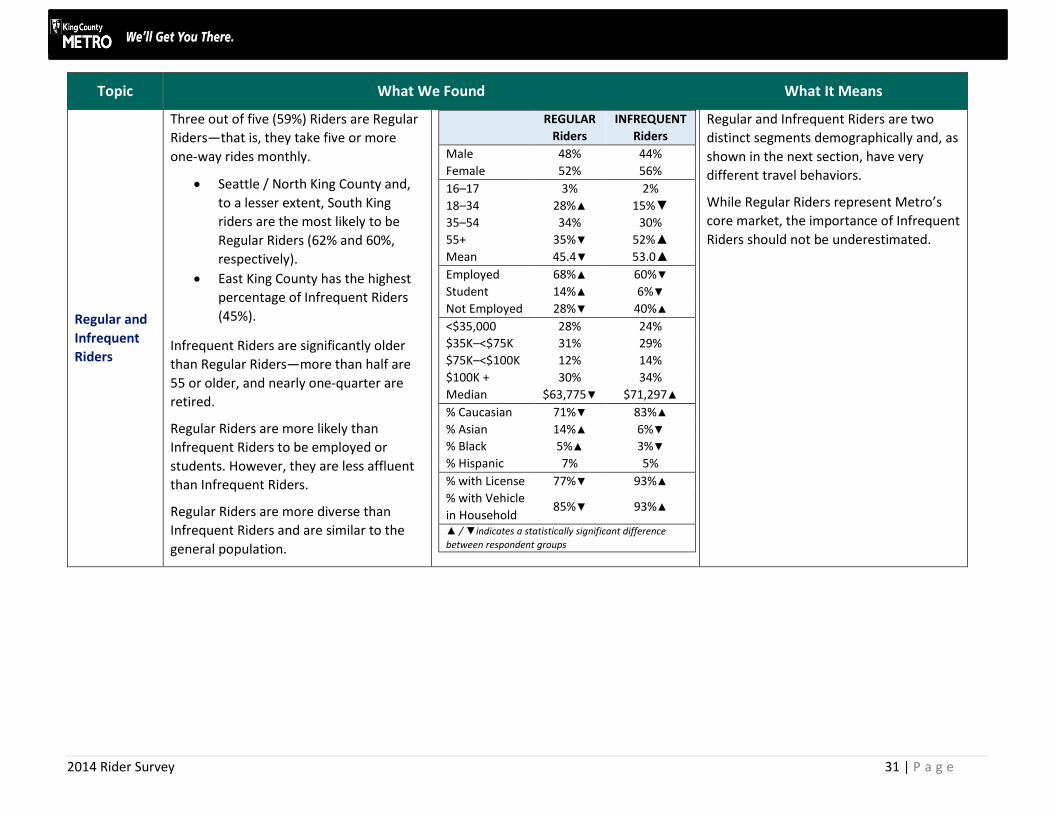
Three out of five (59%) Riders are Regular
Riders—that is, they take five or more
one-way rides monthly.
Seattle / North King County and,
to a lesser extent, South King
riders are the most likely to be
Regular Riders (62% and 60%,
respectively).
East King County has the highest
percentage of Infrequent Riders
(45%).
Infrequent Riders are significantly older
than Regular Riders—more than half are
55 or older, and nearly one-quarter are
retired.
Regular Riders are more likely than
Infrequent Riders to be employed or
students. However, they are less affluent
than Infrequent Riders.
Regular Riders are more diverse than
Infrequent Riders and are similar to the
general population.
REGULAR
Riders
INFREQUENT
Riders
Male 48% 44%
Female 52% 56%
16–17 3% 2%
18–34 28%▲ 15%▼
35–54 34% 30%
55+ 35%▼ 52%▲
Mean 45.4▼ 53.0▲
Employed 68%▲ 60%▼
Student 14%▲ 6%▼
Not Employed 28%▼ 40%▲
<$35,000 28% 24%
$35K–<$75K 31% 29%
$75K–<$100K 12% 14%
$100K + 30% 34%
Median $63,775▼ $71,297▲
% Caucasian 71%▼ 83%▲
% Asian 14%▲ 6%▼
% Black 5%▲ 3%▼
% Hispanic 7% 5%
% with License 77%▼ 93%▲
% with Vehicle
in Household 85%▼ 93%▲
▲ / ▼indicates a statistically significant difference
between respondent groups
Regular and Infrequent Riders are two
distinct segments demographically and, as
shown in the next section, have very
different travel behaviors.
While Regular Riders represent Metro’s
core market, the importance of Infrequent
Riders should not be underestimated.
2014 Rider Survey 32 | P a g e
Topic What We Found What It Means
Regular
Riders
Seven out of ten (69%) Regular Riders are
Frequent Regular Riders—that is, they
take 11 or more one-way rides monthly.
South King County has the highest
percentage of Frequent Regular
Riders—nearly three out of four
(74%) are Frequent Regular
Riders.
With the exception of age and
employment status, there are few
demographic differences between
Frequent and Moderate Regular Riders.
Frequent Regular Riders are:
Significantly younger (average age
44) than Moderate Regular Riders.
More likely to be employed.
Moderate Regular Riders are
Significantly older (average age
48) than Frequent Regular Riders
but younger than Infrequent
Riders (average age 53).
Less likely to be employed; one-
fourth (24%) are retired.
Frequent
Regular
Riders
Moderate
Regular
Riders
16–17 3% 4%
18–34 29% 24%
35–54 36% 30%
55+ 31%▼ 42%▲
Mean 44.1▼ 48.3▲
Employed 74%▲ 55%▼
Student 15% 11%
Not Employed 22%▼ 45%▲ ▲ / ▼indicates a statistically significant difference
between respondent groups
The differences in age between the three
rider segments (Frequent Regular,
Moderate Regular, and Infrequent Riders)
and corresponding employment status
suggest opportunities for generational
segmentation and marketing
communications.
2014 Rider Survey 33 | P a g e
Topic What We Found What It Means
Low-Income
Riders
One out of four (24%) Riders have a
household income that is below
$35,000—that is, are Low-Income Riders.
One out of three (34%) South King
County Riders are Low-Income
Riders.
Low-Income Riders cross all age groups.
However, a relatively higher
percentage are between the ages
of 18 and 34 and, to a lesser
extent, 55 and older.
Only two out of five Low-Income Riders
are employed.
Nearly one out of five are
students.
Nearly three out of five Low-Income are
unemployed.
20% are retired
16% are not currently employed
17 % are disabled
Low-Income Riders are diverse.
Only three out of five Low-Income Riders
have a driver’s license and/or access to a
vehicle.
<$35K >$35K
Male 42% 48%
Female 58% 52%
16–17 2% 3%
18–34 29%▲ 21%▼
35–54 25%▼ 36%▲
55+ 45% 40%
Mean 48.1 48.5
Employed 40%▼ 74%▲
Student 17%▲ 9%▼
Not Employed 58%▲ 23%▼
Median $17,986 $121,094
% Caucasian 65%▼ 81%▲
% Asian 9% 11%
% Black 9%▲ 3%▼
% Hispanic 13%▲ 4%▼
% with License 61%▼ 92%▲
% with Vehicle
in Household 61%▼ 97%▲
▲ / ▼indicates a statistically significant difference
between respondent groups
King County Metro provides an important
social service for those who have limited
options for travel. This is a diverse
segment and is likely to have varying
travel needs.
2014 Rider Survey 34 | P a g e
FINDINGS: RIDERS’ GENERAL TRAVEL BEHAVIOR
Topic What We Found What It Means
Frequency of
Travel
After peaking in 2012, the average
number of one-way trips taken by Regular
Riders has decreased among those living
in Seattle / North King County and East
King County.
On the other hand, the average number of
one-way trips taken by Regular Riders
living in South King County has been
increasing; current frequency is
significantly greater than 2012.
2012 2013 2014
All REGULAR Riders
26.9 26.1 24.5
Seattle / North King County
28.4 27.5 24.1▼
South King County
24.5 25.3 27.0
East King County
25.0 22.8▼ 22.4
Significant increase (▲) or (▼) from previous year
The decrease in the average number of
trips taken by Regular Riders may be due
to a number of factors—a decrease in
overall travel or access to alternative
modes such as car and bike share
programs.
South King County is experiencing
increases in both number of Riders and
the average number of trips those Riders
make.
The decrease in trip frequency in East King
County has been offset by ongoing growth
in the number of Riders.
Length of
Time Riding
While the majority of Riders are
Experienced Riders (riding Metro more
than one year), between 12 and 15
percent are New Riders (that is, started
riding in the past year).
Reflecting growth in market share, a
greater percentage of Riders living in
South and East King County are New
Riders.
The percentage of New Riders
increased significantly in South
King County.
Relatively few Riders in Seattle / North
King County started riding in the past year.
2012 2013 2014
% New Riders
13% 12% 14%
Seattle / North King County
10% 12% 6%▼
South King County
17% 12% 19%▲
East King County
20% 15% 19%
Significant increase (▲) or (▼) from previous year
Metro’s ridership growth can be
attributed to the combination of retaining
Experienced Riders, even as they move
through lifestyle changes, as well as
attracting New Riders.
The decline in the percentage of New
Riders in Seattle / North King County may
be of some concern.
2014 Rider Survey 35 | P a g e
Topic What We Found What It Means
New Rider
Demos
New Riders are significantly younger than
Experienced Riders—nearly two out of
five are millennials.
The majority of New Riders are employed;
however, a significant number are
students. Even with a high percentage of
students, New Riders are as affluent as
Experienced Riders.
New
Riders
Experienced
Riders
16–17 5% 3%
18–34 38%▲ 21%▼
35–54 33% 33%
55+ 24%▼ 44%▲
Mean 41.0▼ 49.5▲
Employed 56%▼ 66%▲
Student 21%▲ 9%▼
Not Employed 30% 33%
Median
Income $67,105 $67,890
▲ / ▼indicates a statistically significant difference
between respondent groups
Retaining these new younger Riders,
notably as they transition from being
students to employees, is key to long-term
growth. Millennials have significantly
different lifestyles, values, and
motivations as well as different ways of
communicating. Use of social media,
mobile devices, and other technologies
will be important to reach these Riders.
Primary Trip
Purpose
While over time the majority of Riders
have primarily used Metro to commute to
work or school, a significant percentage
use Metro for non-commute travel.
Those primarily using Metro for
commute trips average 23 one-way
trips per month while those primarily
using Metro for non-commute trips
average 7 one-way trips per month.
The percentage primarily using Metro for
non-commute trips increased somewhat
in 2014. This increase is significant among
riders living in Seattle / North King County.
2012 2013 2014
ALL Riders
Commute 56% 60%▲ 56%▼
Non-Commute 44% 40%▼ 44%▲
Seattle / North King County
Commute 56% 59% 51%▼
Non-Commute 44% 41% 49%▲
South King County
Commute 56% 59% 56%
Non-Commute 44% 41% 44%
East King County
Commute 55% 64% 62%
Non-Commute 45% 36% 38%
Significant increase (▲) or (▼) from previous year
Riders using Metro for commute trips are
clearly Metro’s core market—they are the
larger segment, and they take more than
three times as many trips per month.
At the same time, those using Metro for
non-commute trips represent an
important source of incremental ridership.
The increase in those primarily using
Metro for non-commute trips in Seattle /
North King County may reflect in part the
older demographics among Riders in this
market as well as less access to a vehicle.
2014 Rider Survey 36 | P a g e
Topic What We Found What It Means
Other Trips
on Metro
New questions were added in 2014 to
provide insights into the extent Riders use
Metro for trips in addition to their primary
trip. Specifically, Riders were asked what
percent of their total trips were
represented by their primary trip.
Two out of three Riders only use Metro
for their primary trip.
The relatively small segment of Riders
who primarily use Metro to commute
to school are the most likely segment
to use Metro for trips other than their
primary one.
ALL Riders
Only Use for Primary Trip 68%
Mostly Use for Primary Trip 18%
Other Trips 14%
% of Riders who Only Use Metro for
Primary Trip by Primary Trip Type
To / From Work 69%
To / From School 44%
Non-Commute 72%
There are additional opportunities for
ridership growth by encouraging those
who only use Metro for their primary trip,
notably those who only use Metro to
commute to work, to use Metro for
additional non-commute trips.
Dependence
on Metro
The majority of Riders are “Choice Riders,”
relying on Metro for some or very little of
their transportation needs.
The extent to which Riders rely on Metro
for all or most of their transportation
needs has varied over the years.
The percentage of Regular Riders who
rely on Metro for all or most of their
transportation needs decreased
significantly in 2014, due to a
decrease in the extent to which
Frequent Regular Riders rely on Metro
for all or most of their travel.
2012 2013 2014
ALL Riders
All / Most 34% 36% 31%▼
Some Travel 37% 34% 35%
Very Little 29% 30% 34%▲
REGULAR Riders
All / Most 47% 51%▲ 45%▼
Frequent Regular Riders
All / Most 57% 62% 55%▼
Moderate Regular Riders
All / Most 23% 30%▲ 24%
INFREQUENT Riders
All / Most 11% 10% 7%
Significant increase (▲) or (▼) from previous year
King County continues to be a car-reliant
community for at least some travel,
making most Riders, even those who rely
on Metro for a significant amount of their
travel, Choice Riders. It is important to
understand the other factors that
motivate these riders’ decision to use
transit and to provide the type and quality
of service they expect.
The decrease in the percentage of riders
who rely on Metro for all or most of their
transportation needs is explained by the
decrease in the percentage of Frequent
Regular Riders who rely on Metro for all or
most of their transportation needs.
2014 Rider Survey 37 | P a g e
Topic What We Found What It Means
Transit
Reliant
Riders
Demo-
graphics
Riders who rely on Metro for all or most
of their travel are clearly differentiated by
their income. While the majority are
employed, a significant number are
unemployed or disabled.
Four out of ten do not have a driver’s
license; three out of ten do not have
access to a vehicle.
Transit Reliant*
Riders
<$35K 44%
Median $43,824
Employed 61%
Student 15%
Retired 13%
Unemployed 10%
Disabled 1o%
% with Driver’s
License 62%
% with Access to
Vehicle 70%
* Rely on Metro for all or most of their travel
While a large percentage of Metro’s
transit-reliant market is what is
traditionally considered Captive Riders—
that is, low-income, with no access to
vehicles—this is likely too narrow a view.
New transit research is looking into
further understanding what is being called
the “Captive by Choice” market—that is,
Riders who have chosen to give up
vehicles and rely primarily on public
transportation.
Transfer
Rates
The percentage of Riders reporting that
they do not transfer increased
significantly in 2014, returning to 2010
levels.
Riders in Seattle / North and East
King County are least likely to have
to transfer for their primary trip.
The increase in Riders reporting no
transfer (for their primary trip) is
greatest among those living in
South King County, traditionally the
area where more riders had to
transfer.
2012 2013 2014
% of Riders who Do Not Transfer
(Primary Trip)
50% 48% 61%▲
Seattle / North King County
52% 55% 67%▲
South King County
38% 32% 52%▲
East King County
58% 56% 62%
Significant increase (▲) or (▼) from previous year
Despite recent service cuts and
modifications, Riders increasingly report
having access to a route for their primary
trip that does not require a transfer.
Access to service is an important
determinant of mode choice, and the
increased access to direct service may
account for the increases in ridership the
system is experiencing.
2014 Rider Survey 38 | P a g e
Topic What We Found What It Means
Park-and-
Ride Lot Use
Overall park-and-ride lot use has been
increasing. However, trends in use vary by
geographic area.
Use of park-and-ride lots continues to
be highest in East King County;
however, usage in this area has
trended downwards since 2010, when
77% of all East King County Riders
used a park-and-ride lot.
2012 2013 2014
% of Riders Using Park-and-Ride Lots in Past
Year
33% 35% 39%▲
Seattle / North King County
18% 19% 15%▼
South King County
49% 43% 46%
East King County
69% 66% 62%
# of Time Use Park-and-Ride Past 30 Days
33% 35% 39%▲
Seattle / North King County
18% 19% 15%▼
South King County
49% 43% 46%
East King County
69% 66%▼ 62%▼
Significant increase (▲) or (▼) from previous year
Metro’s park-and-ride lot system
continues to provide an important means
for accessing service, particularly for
Riders living in East and South King
County.
Increased access to direct service among
riders living in Seattle / North King County
may account for the recent decrease in
use of park-and-ride lots among Riders in
this area.
2014 Rider Survey 39 | P a g e
FINDINGS: RIDERS’ COMMUTE BEHAVIOR
Topic What We Found What It Means
Commute
Status
Consistent with the increase in older
Riders surveyed, we see an increase in the
percentage of riders who are do not
commute to work or school—that is, are
Non-Commuters.
Despite this increase, nearly two out of
three Riders commute to work or school.
Note that not all riders who are
Commuters use Metro for their commute
trips.
2012 2013 2014
Commute to Work
58% 61% 57%
Commute to School
12% 10% 9%
Non-Commuter
30% 29% 35%▲ Significant increase (▲) or (▼) from previous year
The percentage of Riders who commute
to work (57%) is somewhat lower than the
percentage of work commuters in the
general population of King County (63%).
Therefore, while Metro clearly serves
Work Commuters, it is also an important
source of travel for those commuting to
School and Non-Commuters.
Metro
Commuters
Nearly three out of five Commuters who
are Riders use Metro to get to work or
school.
Among Regular Riders, this figure jumps to
four out of five. This is the highest
percentage to date and has been
increasing at a significant level since 2012.
The increase in Riders’ use of Metro to
commute to work or school is greatest in
Seattle / North and South King County.
2012 2013 2014
ALL Riders
53% 55% 58%
REGULAR Riders
69% 75%▲ 80%▲
Seattle / North King REGULAR Riders
67% 73% 76%▲
South King REGULAR Riders
76% 82% 86%▲
East King REGULAR Riders
73% 72% 79%
Significant increase (▲) or (▼) from previous year
For subareas, significant increases from baseline (2012)
Better and more direct service, high
parking costs, traffic congestion, and
general comfort with using public
transportation are likely contributors to
increased transit use for commuting
among existing riders. Better
understanding the motives behind the
mode choice decision for commuting
could lead to increased use of Metro by
Commuters who are Infrequent Riders
and Non-Riders.
2014 Rider Survey 40 | P a g e
Topic What We Found What It Means
Commute
Mode by
Major Work
Location
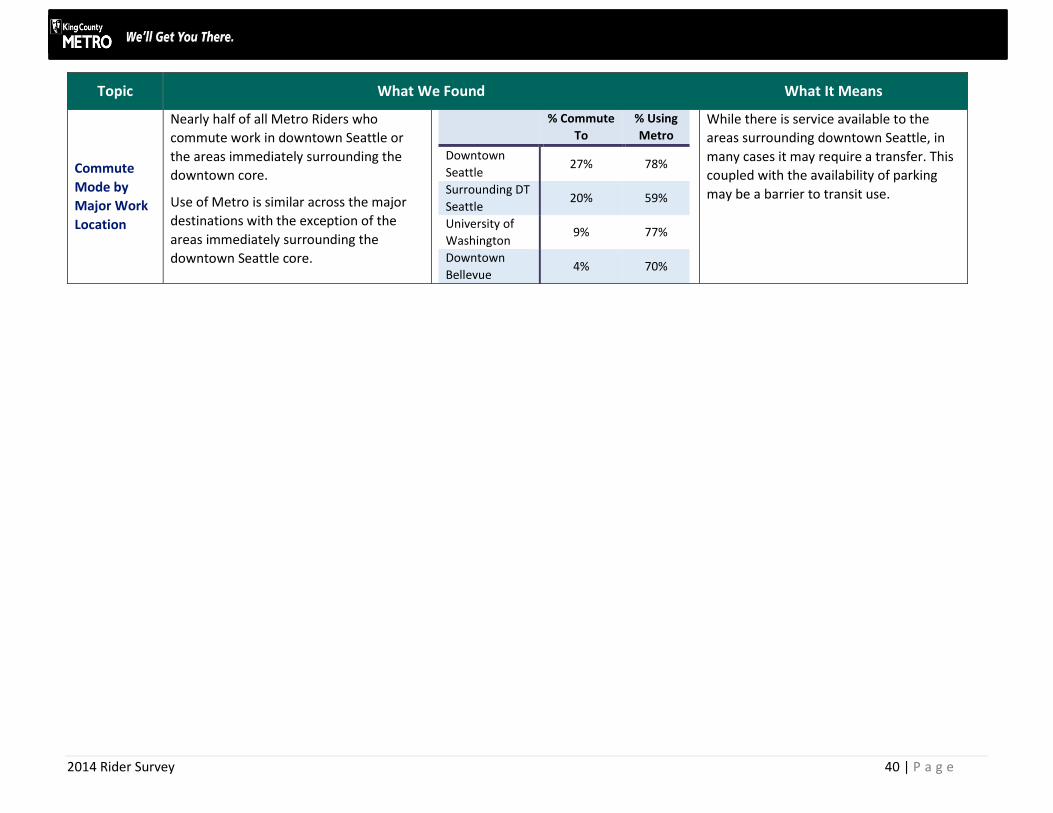
Nearly half of all Metro Riders who
commute work in downtown Seattle or
the areas immediately surrounding the
downtown core.
Use of Metro is similar across the major
destinations with the exception of the
areas immediately surrounding the
downtown Seattle core.
% Commute
To
% Using
Metro
Downtown
Seattle 27% 78%
Surrounding DT
Seattle 20% 59%
University of
Washington 9% 77%
Downtown
Bellevue 4% 70%
While there is service available to the
areas surrounding downtown Seattle, in
many cases it may require a transfer. This
coupled with the availability of parking
may be a barrier to transit use.
2014 Rider Survey 41 | P a g e
FINDINGS: FARE PAYMENT
Topic What We Found What It Means
Fare
Payment
Method
ORCA Cards are used by more than three
out of five Riders. Overall use of ORCA
Cards increased by 2 percentage points in
2014.
Use of cash to pay fares increased
significantly between 2012 and 2013 and
remained unchanged in 2014.
Reflecting the higher percentage of older
riders surveyed in 2014, the percentage of
Riders using a Reduced Regional Fare
Permit (RRFP) increased significantly.
More than four out of five (84%) riders
using an RRFP have the permit loaded on
an ORCA Card, up from 72% in 2013.
2012 2013 2014
ORCA (Includes Adult, Youth, U-PASS and RRFP on
CARD)
66% 66% 68%
CASH / TICKETS
22% 28%▲ 27%
RRFP (Includes RRFP On and Not On ORCA Card)
14% 12% 16%▲
Significant increase (▲) or (▼) from previous year
As noted over the past several years,
ORCA Cards have likely hit close to
maximum adoption rates without new,
value-added features. The very small
growth in ORCA Card use between 2013
and 2014 is in part attributable to
increased adoption among older Riders
with their RRFP on an ORCA Card as well
as increased adoption among Frequent
Regular Riders.
Moving Infrequent Riders from cash to
some form of cashless payment system is
likely to be difficult without some form of
incentive.
While more older Riders were surveyed in
2014, these Riders may be recently retired
and already had an ORCA Card.
2014 Rider Survey 42 | P a g e
Topic What We Found What It Means
Products on
ORCA Card
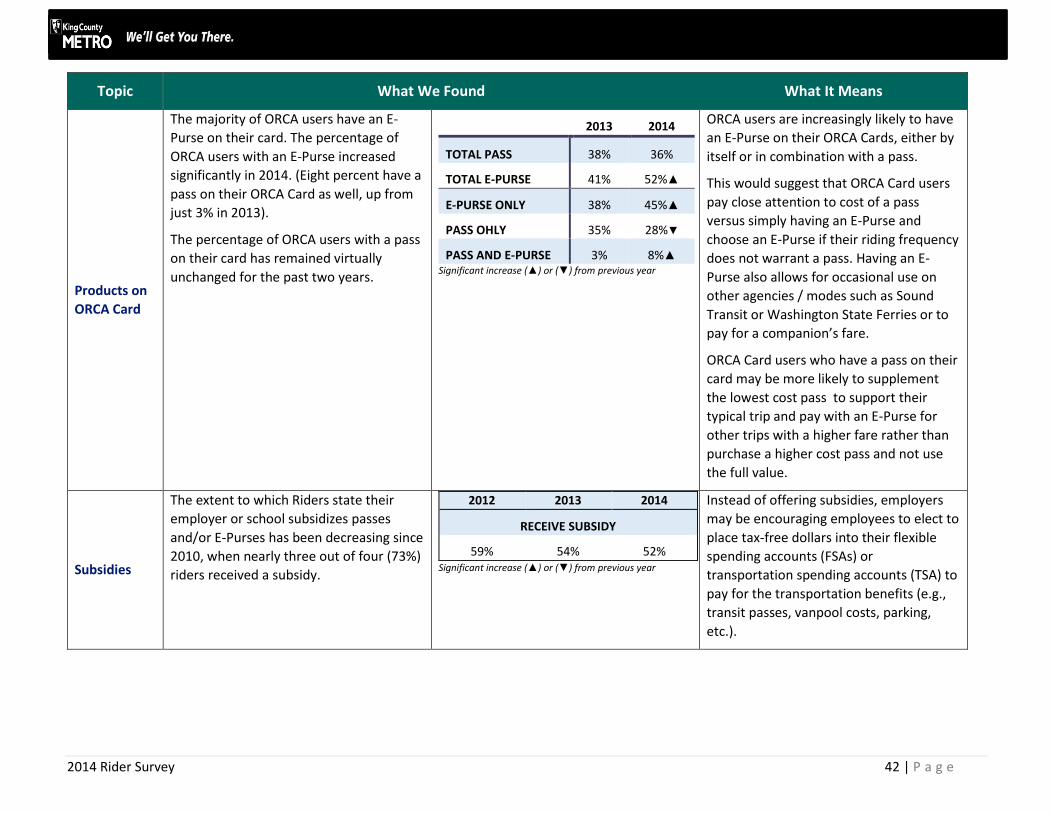
The majority of ORCA users have an E-
Purse on their card. The percentage of
ORCA users with an E-Purse increased
significantly in 2014. (Eight percent have a
pass on their ORCA Card as well, up from
just 3% in 2013).
The percentage of ORCA users with a pass
on their card has remained virtually
unchanged for the past two years.
2013 2014
TOTAL PASS 38% 36%
TOTAL E-PURSE 41% 52%▲
E-PURSE ONLY 38% 45%▲
PASS OHLY 35% 28%▼
PASS AND E-PURSE 3% 8%▲ Significant increase (▲) or (▼) from previous year
ORCA users are increasingly likely to have
an E-Purse on their ORCA Cards, either by
itself or in combination with a pass.
This would suggest that ORCA Card users
pay close attention to cost of a pass
versus simply having an E-Purse and
choose an E-Purse if their riding frequency
does not warrant a pass. Having an E-
Purse also allows for occasional use on
other agencies / modes such as Sound
Transit or Washington State Ferries or to
pay for a companion’s fare.
ORCA Card users who have a pass on their
card may be more likely to supplement
the lowest cost pass to support their
typical trip and pay with an E-Purse for
other trips with a higher fare rather than
purchase a higher cost pass and not use
the full value.
Subsidies
The extent to which Riders state their
employer or school subsidizes passes
and/or E-Purses has been decreasing since
2010, when nearly three out of four (73%)
riders received a subsidy.
2012 2013 2014
RECEIVE SUBSIDY
59% 54% 52% Significant increase (▲) or (▼) from previous year
55% 56% 67%▲ Significant increase (▲) or (▼) from previous year
While smartphone ownership is high and
represents an important source of
information about Metro, not all Riders
have smartphones. Notably, lower income
and older Riders are less likely to own a
smartphone; they may also be less likely
to have access to a computer and/or the
Internet. These Riders need alternative
sources of information.
2014 Rider Survey 44 | P a g e
FINDINGS: OVERALL SATISFACTION WITH METRO AND GOODWILL
Topic What We Found What It Means
Overall
Satisfaction
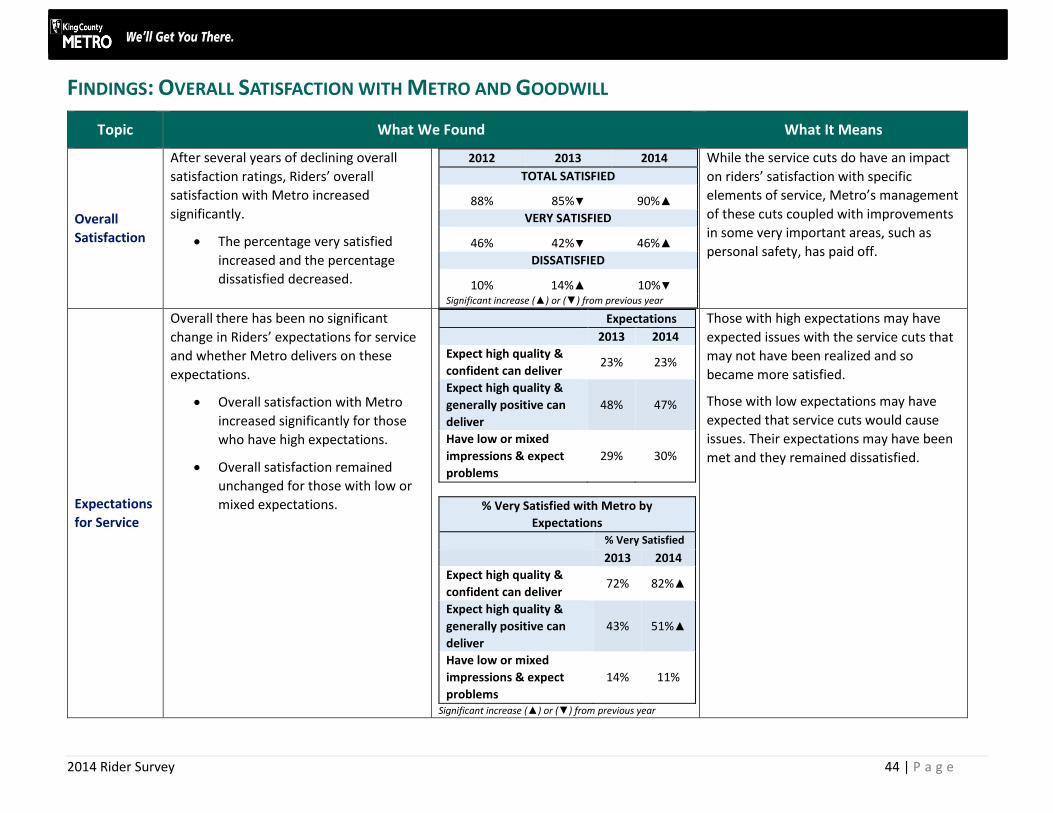
After several years of declining overall
satisfaction ratings, Riders’ overall
satisfaction with Metro increased
significantly.
The percentage very satisfied
increased and the percentage
dissatisfied decreased.
2012 2013 2014
TOTAL SATISFIED
88% 85%▼ 90%▲
VERY SATISFIED
46% 42%▼ 46%▲
DISSATISFIED
10% 14%▲ 10%▼ Significant increase (▲) or (▼) from previous year
While the service cuts do have an impact
on riders’ satisfaction with specific
elements of service, Metro’s management
of these cuts coupled with improvements
in some very important areas, such as
personal safety, has paid off.
Expectations
for Service
Overall there has been no significant
change in Riders’ expectations for service
and whether Metro delivers on these
expectations.
Overall satisfaction with Metro
increased significantly for those
who have high expectations.
Overall satisfaction remained
unchanged for those with low or
mixed expectations.
Expectations
2013 2014
Expect high quality &
confident can deliver 23% 23%
Expect high quality &
generally positive can
deliver
48% 47%
Have low or mixed
impressions & expect
problems
29% 30%
% Very Satisfied with Metro by
Expectations
% Very Satisfied
2013 2014
Expect high quality &
confident can deliver 72% 82%▲
Expect high quality &
generally positive can
deliver
43% 51%▲
Have low or mixed
impressions & expect
problems
14% 11%
Significant increase (▲) or (▼) from previous year
Those with high expectations may have
expected issues with the service cuts that
may not have been realized and so
became more satisfied.
Those with low expectations may have
expected that service cuts would cause
issues. Their expectations may have been
met and they remained dissatisfied.
2014 Rider Survey 45 | P a g e
Topic What We Found What It Means
External
Influences
The majority of Riders continue to hear
good things about Metro from their
friends and colleagues.
However, negative word of mouth
has a significant influence on
overall satisfaction.
On the other hand, negative influences
from the media are increasing.
Negative media coverage has less
of an impact on overall
satisfaction with Metro.
2013 2014
Word of Mouth
Agree 67% 62%▼
Disagree 28% 30%
Media
Agree 63% 46%▼
Disagree 32% 46%▲ Significant increase (▲) or (▼) from previous year
% Satisfied with Metro by Hear Positive
Things about Metro Word of Mouth
2013 2014
Strongly Agree 90% 99%▲
Somewhat Agree 85% 94%▲
Disagree 20% 29%▲
% Satisfied with Metro by Hear Positive
Things about Metro in Media
2013 2014
Strongly Agree 89% 100%▲
Somewhat Agree 90% 96%▲
Disagree 22% 22% Significant increase (▲) or (▼) from previous year
Metro should continue to use social media
as well as more traditional media sources
to tell a positive story about the system.
Agency
Relations
Riders in 2014 are significantly more likely
than those in 2013 to say they strongly
agree that they like to be able to say they
ride Metro.
This increase is evident
countywide. However, those living
in Seattle / North King County are
the least likely to strongly agree.
2013 2014
% Strongly Agree
Agency I like &
respect 44% 45%
Agency I trust 43% 47%
I like to be able to
say I ride 41% 56%▲
Significant increase (▲) or (▼) from previous year
Marketing communications focusing on
riders saying why they like to ride Metro
may serve to offset negative word of
mouth and/or media coverage.
2014 Rider Survey 46 | P a g e
Topic What We Found What It Means
High Value /
Customer
Focus
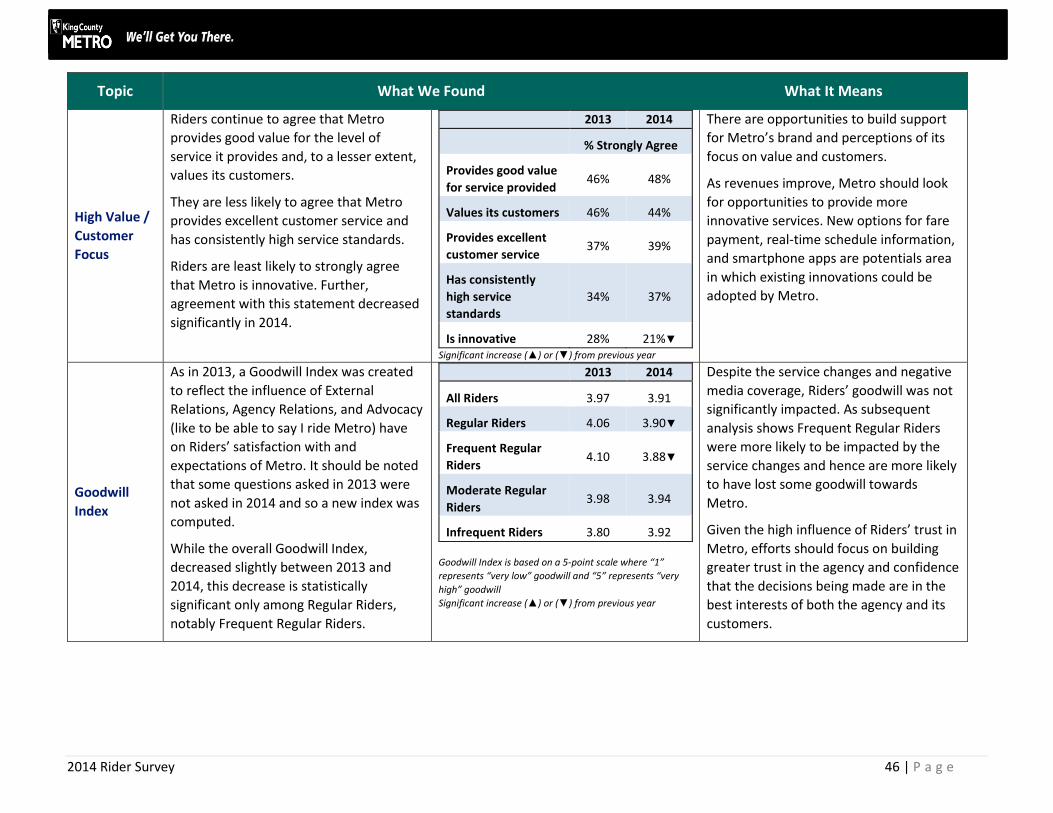
Riders continue to agree that Metro
provides good value for the level of
service it provides and, to a lesser extent,
values its customers.
They are less likely to agree that Metro
provides excellent customer service and
has consistently high service standards.
Riders are least likely to strongly agree
that Metro is innovative. Further,
agreement with this statement decreased
significantly in 2014.
2013 2014
% Strongly Agree
Provides good value
for service provided 46% 48%
Values its customers 46% 44%
Provides excellent
customer service 37% 39%
Has consistently
high service
standards
34% 37%
Is innovative 28% 21%▼ Significant increase (▲) or (▼) from previous year
There are opportunities to build support
for Metro’s brand and perceptions of its
focus on value and customers.
As revenues improve, Metro should look
for opportunities to provide more
innovative services. New options for fare
payment, real-time schedule information,
and smartphone apps are potentials area
in which existing innovations could be
adopted by Metro.
Goodwill
Index
As in 2013, a Goodwill Index was created
to reflect the influence of External
Relations, Agency Relations, and Advocacy
(like to be able to say I ride Metro) have
on Riders’ satisfaction with and
expectations of Metro. It should be noted
that some questions asked in 2013 were
not asked in 2014 and so a new index was
computed.
While the overall Goodwill Index,
decreased slightly between 2013 and
2014, this decrease is statistically
significant only among Regular Riders,
notably Frequent Regular Riders.
2013 2014
All Riders 3.97 3.91
Regular Riders 4.06 3.90▼
Frequent Regular
Riders 4.10 3.88▼
Moderate Regular
Riders 3.98 3.94
Infrequent Riders 3.80 3.92
Goodwill Index is based on a 5-point scale where “1”
represents “very low” goodwill and “5” represents “very
high” goodwill
Significant increase (▲) or (▼) from previous year
Despite the service changes and negative
media coverage, Riders’ goodwill was not
significantly impacted. As subsequent
analysis shows Frequent Regular Riders
were more likely to be impacted by the
service changes and hence are more likely
to have lost some goodwill towards
Metro.
Given the high influence of Riders’ trust in
Metro, efforts should focus on building
greater trust in the agency and confidence
that the decisions being made are in the
best interests of both the agency and its
customers.
2014 Rider Survey 47 | P a g e
Topic What We Found What It Means
Value and
Customer
Focus Index
A second index was computed to reflect
the influence of Riders’ perception of
Metro’s focus on the customer and
providing high value service on their
satisfaction with and expectations of
Metro.
Overall Metro has a Value / Customer
Focus Index of 3.22, suggesting an average
rating. There was no change from 2013.
2013 2014
All Riders 3.20 3.22
Regular Riders 3.22 3.19
Frequent Regular
Riders 3.20 3.18
Moderate Regular
Riders 3.24 3.20
Infrequent Riders 3.16 3.27
Value & Customers Index is based on a 5-point scale where
“1” represents “very low” value / customer focus and “5”
represents “very high” value / customer focus
Significant increase (▲) or (▼) from previous year
The lower rating for Value and Customer
Focus than Goodwill suggests that while
Riders have generally positive impressions
of Metro as an agency (goodwill), they are
somewhat less positive that Metro meets
their expectations for delivering high
value service with a focus on the
customer.
2014 Rider Survey 48 | P a g e
FINDINGS: SERVICE QUALITY
Topic What We Found What It Means
Satisfaction
with Overall
Service
Dimensions
Riders continue to be very satisfied with
Fare Payment, Metro Drivers, and Sources
of Information about Metro.
Satisfaction with Sources of
Information about Metro
increased in 2014.
Satisfaction with Metro Drivers
decreased slightly.
The percentage of Very Satisfied Riders
increased significantly for Personal Safety.
The percentage of Very Satisfied Riders
decreased significantly for:
Transferring
Comfort and Cleanliness Onboard
Level of Service (LOS)
Park-and-Ride Lots
% VERY SATISFIED
2013 2014
FARE PAYMENT 75% 76%
METRO DRIVERS 68% 65%▼
INFORMATION
SOURCES
60% 66%▲
PERSONAL SAFETY 46% 50%▲
PARK-AND-RIDE LOTS 48% 42%▼
LEVEL OF SERVICE
(LOS)
50% 41%▼
STOPS: COMFORT/
CLEANLINESS 38% 36%
ONBOARD: COMFORT
/ CLEANLINESS 43% 36%▼
TRANSFERRING 39% 30%▼
Significant change (▲) or (▼) from previous year
It is clear that service changes enacted in
September 2014 had an impact on Riders’
satisfaction with many aspects of service,
but notably for the Level of Service
provided and Transferring. As later
analysis indicates, these are the single
most important aspects of Metro service.
2014 Rider Survey 49 | P a g e
Topic What We Found What It Means
Highest
Rated
Elements of
Service (60%+ Very
Satisfied)
Consistent with high ratings for the overall
service dimensions, all aspects of Fare
Payment and Information Sources are
rated highly:
Satisfaction with the Ease of
Paying Fares when Boarding
increased significantly.
Satisfaction with ORCA Cards also
increased.
The Availability of Information on
Metro Online increased
significantly.
However, satisfaction with the
Availability of Locations to
Purchase Passes or Add Value to
an E-Purse decreased.
The increase in satisfaction for the
Personal Safety dimension is due in part to
a significant increase in Riders’ satisfaction
with Daytime Safety at Stops.
% VERY SATISFIED
2013 2014
FARE: ORCA CARDS 83% 87%▲
FARE: EASE OF
PAYING WHEN
BOARDING
76% 81% ▲
FARE: EASE OF
LOADING PASS 68% 76%
DRIVERS: OPERATE
VEHICLES SAFELY 77% 74%
INFO: AVAILABILITY
ONLINE 60% 71% ▲
SAFETY: DAYTIME AT
STOPS 63% 70% ▲
FARE: EASE OF
ADDING VALUE TO E-
PURSE
71% 68%
DRIVERS:
HELPFULNESS 64% 66%
INFO: OVERALL ABILITY TO OBTAIN
60% 63%
▲ / ▼ indicates significant (95%) change from previous year
▲ / ▼ indicates significant (90%) change from previous year
The quality of Metro’s fare payment
system is evident in these high ratings, and
continued innovation should be
considered. At the same time, efforts
should be made to make it easier for
Riders to purchase passes or add value to
their E-Purse either online or through
more convenient fixed locations.
Metro should continue to focus on
providing quality and accurate
information. Online sources—either
developed by Metro or third-party
sources—should be a priority.
Metro should continue its focus on safety
improvements, the recent success of
which is evident here.
2014 Rider Survey 50 | P a g e
Topic What We Found What It Means
Above-
Average
Ratings (50–59% Very
Satisfied)
While satisfaction also improved for
Daytime Safety Onboard Metro vehicles,
Riders are less likely to be very satisfied
with how well Drivers Handle Problems on
the vehicles when they occur.
Satisfaction with Distance from Home to
Stop has decreased, notably among South
King County Riders.
% VERY SATISFIED
2013 2014
SAFETY: DAYTIME
ONBOARD 51% 59%▲
DRIVERS: HANDLE
PROBLEMS 64% 55%▼
FARE: LOCATIONS TO
PURCHASE PASS /
ADD VALUE TO E-
PURSE
61% 54% ▼
LOS: DISTANCE FROM
HOME TO STOP 64% 52%▼
SAFETY: DT TRANSIT
TUNNEL 48% 51%
Additional training and support for drivers
so they can effectively handle problems or
incidents should be a continued focus.
Particular attention should be on routes
serving Seattle / North and South King
County.
Again, service changes made in September
have affected riders who now have to
walk further to a stop.
Below-
Average
Ratings (40–49% Very
Satisfied)
Most elements of service in this category
(below-average) were in this same
category of service in 2013.
Several aspects of Park-and-Ride Lots (e.g.,
Lighting and Personal Safety) moved from
having above-average ratings to now
having below-average ratings, due to
somewhat lower percentages of very
satisfied users.
Satisfaction decreased for all elements of
service within the Level of Service
dimension. The decrease is greatest for
Availability of Service.
% VERY SATISFIED
2013 2014
P&R LOTS: LIGHTING 54% 48%
ONBOARD:
CLEANLINESS 46% 47%
P&R LOTS: PERSONAL
SAFETY 52% 46%
STOPS: LOADING /
UNLOADING DUE TO
CROWDING
49% 45%
INFO: AVAILABILITY
AT STOPS n.a. 45%
LOS: ON-TIME
PERFORMANCE 46% 41%▼
LOS: TRAVEL TIME 43% 41%
STOPS: CLEANLINESS 38% 41%
LOS: AVAILABILITY OF SERVICE
51% 40%▼
ONBOARD: AVAILABILITY OF SEATING
47% 40%
P&R LOTS: VEHICLE SECURITY
44% 40%
Lighting and Personal Safety at Park-and-
Ride Lots are related, and ratings for these
two elements of service decreased.
Increased lighting at park-and-ride lots
identified as having little or no lighting as
well as those with a higher number of
reported security incidents could move
these two elements of service back into a
potential strength.
Ratings for Level of Service could only
improve if service is restored.
2014 Rider Survey 51 | P a g e
Topic What We Found What It Means
Lowest
Rated
Elements of
Service (<40% Very
Satisfied)
Onboard Safety After Dark and At Stops
continue to be two of the lowest rated
elements of service.
However, satisfaction with
Onboard Safety after Dark has
increased significantly.
While overall satisfaction with
Safety at Stops after Dark did not
change, the percent of Seattle /
North King County Riders very
satisfied with this element of
service decreased significantly.
Overcrowding on Buses continues to be
the element of service with which Riders
are least satisfied.
Satisfaction with all elements of
service related to crowding on the
vehicles has decreased, notably on
routes serving Seattle / North King
County.
Transferring, notably Wait Times when
Transferring, also continues to be an area
with low levels of satisfaction.
% VERY SATISFIED
2013 2014
SAFETY: ONBOARD
AFTER DARK 30% 37% ▲
ONBOARD: LOADING
/ UNLOADING DUE TO
CROWDING
48% 36%▼
LOS: FREQUENCY OF
SERVICE 45% 36%▼
TRANSFERS: NUMBER 44% 35%▼
STOPS: AVAILABILITY
OF SHELTERS 33% 35%
P&R LOTS: PARKING
AVAILABILITY 45% 34%▼
STOPS: LIGHTING 33% 33%
STOPS: AVAILABILITY
OF SEATING 35% 29%▼
SAFETY: AT STOPS
AFTER DARK 31% 28%
TRANSFERS: WAIT
TIME 35% 26%▼
ONBOARD: OVERCROWDING
29% 21%▼
Metro should continue to focus its efforts
on safety after. Particular focus should be
on stops in downtown Seattle and other
high-ridership areas in Seattle / North King
County.
Reduction in service in areas with high
ridership aggravates the crowding issue.
While more riders report having direct
service, those who have to transfer are
increasingly dissatisfied. Riders living in
South King County continue to be the
most likely to take trips that require a
transfer, and reported wait times are
longer for these riders.
2014 Rider Survey 52 | P a g e
Key Drivers
Analysis
This survey asked riders about their
satisfaction with 36 service elements.
Statistical analysis was used to group
these service elements into nine Overall
Service Dimensions, and to identify the
importance of these Overall Service
Dimensions and the individual service
elements, in determining Rider
satisfaction with and expectations of
Metro. This summary table is ordered
based on the importance of the Overall
Service Dimension followed by the
importance of the elements of service.
Level of Service (LOS) and Transferring
continue to be the most important
determinants of Riders’ satisfaction with
and expectations of Metro. Level of
Service is more important than
Transferring.
With the exception of Distance from
Home to Stop, all elements of service
within the LOS dimension receive
below-average satisfaction ratings.
Personal Safety is the third most
important service dimension.
While satisfaction has improved,
Safety after Dark is still a concern.
Comfort and Cleanliness At Stops and, to a
lesser extent, Onboard are also important
service dimensions.
All elements of service within the
Comfort and Cleanliness at Stops
Dimension receive below-average
ratings.
High Importance / Below-Average Satisfaction: Improve
Imp. Rank
% Very Satisfied
Level of Service (LOS)
Travel Time 1 41%
Availability 2 40%
Frequency 3 36%
On-Time 4 41%
Personal Safety
Stops: Dark 2 28%
Onboard: Dark 3 37%
Comfort and Cleanliness at Stops
Loading/unloading 1 45%
Lighting 3 33%
Shelters 2 35%
Cleanliness 4 41%
Seating 5 29%
Comfort and Cleanliness Onboard
Cleanliness 1 47%
Crowding 2 21%
Loading/Unloading 3 36%
Information
At Stops 2 45%
Transferring
Wait Time 1 26%
Number 2 35%
High Importance / Above-Average Satisfaction: Maintain
Level of Service
Distance to Stop 5 52%
Personal Safety
Stops: Daytime 4 70%
Onboard: Daytime 1 59%
Drivers
Handling Problems 1 55%
Depending on funding and revenues,
restoration of service and, where possible,
additional service should be a priority.
The focus should be on Travel
Time (the most important element
of service) and Frequency of
Service (lowest rated).
Restored or new service to
support heavily traveled routes
will also address crowding issues.
While continuing to provide more direct
service through routes such as the
RapidRide or other express services is
good, improved scheduling for routes with
known links to others to decrease transfer
wait times should also be a priority.
Metro should continue its ongoing efforts
to improve safety. While the focus should
be nighttime safety, daytime safety should
not be ignored.
Adding shelters and/or seating at stops
should continue to be a priority. Improved
lighting can partially address safety
concerns with waiting after dark.
Continuing to improve signage at stops,
particularly if printed timetables are no
longer available, should be an area for
improvement.
2014 Rider Survey 53 | P a g e
FINDINGS: PERSONAL SAFETY In addition to questions on Riders’ satisfaction with personal safety (covered in the Service Quality section), questions were included to address Riders’
concerns regarding safety and their perceptions of Metro’s efforts to improve safety.
Topic What We Found What It Means
Concerns
about Safety
One out of five Riders state that they
avoid riding the bus or streetcar due to
concerns about personal safety. This
percentage has decreased significantly
from 2012 when this question was first
asked.
2012 2013 2014
Avoid Riding Due to Concerns about Safety
23% 22% 20%▼ Significant increase (▲) or (▼) from baseline (2012)
Metro’s focus on safety has clearly had an
impact both in terms of Rider satisfaction
as discussed in the service quality analysis
but also in Riders’ stated behaviors.
Attitudes
toward
Metro’s
Efforts to
Improve
Safety
The extent to which Riders strongly agree
that Metro provides a safe and secure
transportation environment and is
proactive in its efforts to improve safety
and security increased significantly.
While the percentage who strongly agree
that they feel safer riding now than a year
ago decreased, the percentage who
disagree decreased steadily—from 36% in
2012 to 34% in 2013 to 29% in 2014.
% Strongly Agree
2012 2013 2014
Provides a Safe and Secure Environment
42% 35%▼ 49%▲
Is Proactive in Efforts to Improve Safety
27% 26% 33%▲
Feel Safer Riding Now than a Year Ago
37% 42%▲ 38%▼ Significant increase (▲) or (▼) from previous year
Rider attitudes are clearly translating into
behaviors. As noted above, fewer Riders
are avoiding transit due to concerns about
safety. There has been an increase in the
percentage of Riders stating that they
sometimes or frequently ride when it is
dark—67% in 2014 compared to 55% in
2013.
Safety Using
Public
Transit in
Downtown
Seattle
Riders who use Metro in downtown
Seattle are increasingly likely to strongly
agree that it is safe to use transit during
the daytime and when it is dark.
In addition, far fewer Riders state that it is
not safe.
Safe to Use Transit in Downtown Seattle
2013 2014
% Strongly Agree
During the Day 61% 73%▲
% Strongly Agree
When It Is Dark
16% 28%▲
% Disagree
38% 25%▼ Significant increase (▲) or (▼) from previous year
Again, Metro’s strong focus on safety is
paying off. Metro should continue to work
with the city and other stakeholders on
these efforts.
2014 Rider Survey 54 | P a g e
IMPACT OF SERVICE CHANGE
Topic What We Found What It Means
Impact on
Ridership
The majority of Riders were not impacted
by the service change.
Six percent of respondents contacted who
were Riders immediately prior to or
during the survey data collection period
indicated that they were impacted and as
a result of these service changes stopped
riding. Three out of five Lost Riders now
drive alone for the primary trip they
formerly took on Metro.
Impact of Service Change on Ridership
Current
Riders:
No Impact
Current
Riders:
Impacted
Lost
Riders
72% 22% 6%
While these figures are generally positive,
the impact of significant changes in
service on ridership, customer goodwill,
and travel behaviors should not be
underestimated.
Impact on
Overall
Satisfaction
with /
Perceptions
of Metro
The service change had a definitive impact
on Riders’—both Current and Lost
Riders’—overall satisfaction with Metro.
Other key measures were also significantly
impacted.
It is also clear that the service change
negatively impacted Riders’ expectations
and perceptions of Metro as shown in the
table.
Of note is the increase in the extent to
which Impacted Riders disagree that
Metro is innovative.
Current
Riders:
No Impact
Current
Riders:
Impacted Lost Riders
Overall Satisfaction: % Satisfied
93% 79%▼ 45%▼
Expectations: % Positive
74% 55%▼ 45%▼
Advocacy: % Strongly Agree
59% 49%▼ n.a.
Trust: % Strongly Agree
49% 39%▼ 32%▼
High Service Standards: % Strongly Agree
39% 28%▼ 24%▼
Is Innovative: % Disagree
23% 38%▲ 48%▲
While Metro’s overall satisfaction rating
among Current Riders increased in 2014,
the lower satisfaction ratings among those
impacted by the service change would
indicate that the increase in overall
satisfaction would have been greater if
the service changes did not occur.
It is clear also that Metro has lost
customer goodwill, which can be difficult
to rebuild.
2014 Rider Survey 55 | P a g e
Topic What We Found What It Means
Impact on
Satisfaction
with Service
Dimensions
and
Elements of
Service
In addition to the impact on overall
satisfaction, Current Riders impacted by
the service change are less satisfied with
specific aspects of service. In particular,
they are less satisfied with:
Overall Level of Service, notably
Frequency of Service and Travel
Time
Comfort and Cleanliness Onboard,
notably Availability of Seating and
Ease of Loading and Unloading
Current
Riders:
No Impact
Current
Riders:
Impacted
% Satisfied (Very and Somewhat)
Level of Service
Overall
Satisfaction
83%▲ 64%▼
Frequency
of Service
83%▲ 56%▼
Travel Time 84%▲ 65%▼
Comfort / Cleanliness Onboard
Overall
Satisfaction 80%▲ 60%▼
Availability
of Seating 84%▲ 56%▼
Ease of
Loading and
Unloading
83%▲ 58%▼
▲ / ▼ indicates a statistically difference between
respondent groups
As noted in the service quality discussions,
Level of Service is the single most
important service dimension and these
two elements (Frequency of Service and
Travel Time) are also important elements
of service. Improvements in these two
areas will positively influence all Riders.
Comfort and Cleanliness Onboard is also
an important service dimension. While
Availability of Seating is as important as
Overcrowding, it is clear that in the case
of Impacted Riders, Availability of Seating
is a concern as is Ease of Loading and
Unloading (due to crowding).
Impact on
Goodwill and
Customer
Focus Indices
As discussed earlier, two indices were
developed to summarize (1) the extent to
which Riders have goodwill towards
Metro and (2) the extent to which Riders
feel Metro provides value and is focused
on its customers.
The service changes had a clear and
negative impact on both goodwill and the
extent to which Impacted Current and
Lost Riders feel that Metro provides value
and is focused on its customers.
Current
Riders:
No Impact
Current
Riders:
Impacted Lost Riders
Goodwill Index
3.98 3.63▼ 3.40▼
Value / Customer Focus Index
3.26 3.06▼ 2.52▼▼
Indices are based on a 5-point scale where “1” represents
“very low” and “5” represents “very high” goodwill or
value and customer focus ▲ / ▼ indicates a statistically difference between