Estimating The Benefits From Improved Market Information Andrew Kizito Agricultural, Food, and, Resource Economics Michigan State University A paper prepared for the workshop on “Agricultural Market Information Systems in Africa: Renewal and Impact” Montpellier (France), 29-31 March 2010
Transcript
Estimating The Benefits From ImprovedMarket Information
Andrew KizitoAgricultural, Food, and, Resource Economicsg , , ,
Michigan State University
A paper prepared for the workshop on “Agricultural Market Information Systems in Africa: Renewal and Impact”
Montpellier (France), 29-31 March 2010
Summary of presentation
• Method Used To Value Information• The Price Adjustment ModelThe Price Adjustment Model• Comparative Statics• Application of the ModelApplication of the Model
• Summary and Conclusion• Implications for MIS Investment• Implications for MIS Investment
Method Used To Value Information
Hayami and Peterson (1972): Increase in social welfare resulting from increased accuracy or reduction in sampling errorsreduction in sampling errors 1.Inventory Adjustment Model
a) Constant production) p2.Production Adjustment Model
a) Production adjustsComplementarities with other reforms• Potentially lead to attribution problems• Jointly measure the benefits and costs of• Jointly measure the benefits and costs of
complementary programs
The Price Adjustment Model
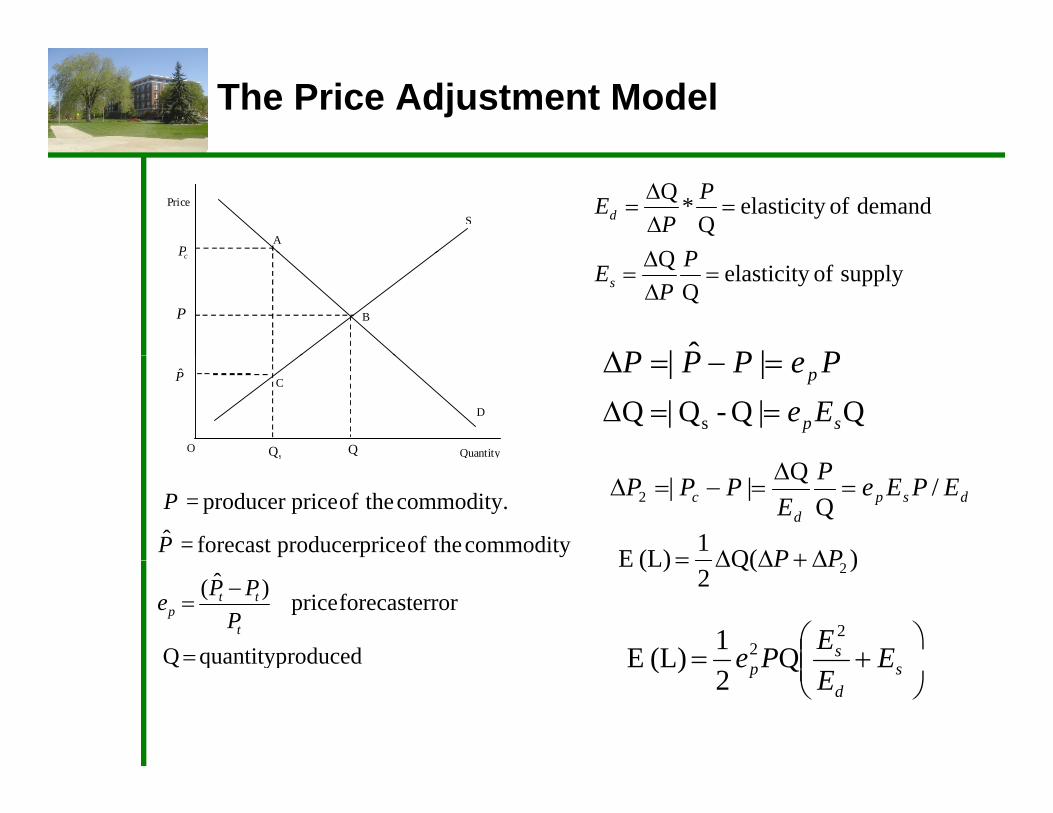
• Based on the partial equilibrium model– Value information as the reduction inValue information as the reduction in
dead-weight loss when users with rational expectations respond to improved price forecasts from MIS.
– Reduction of the cost of being off the equilibrium price and quantity
The Price Adjustment Model
Setting and Assumptions: • MIS provides price forecasts• A closed economy with no international trade • Rational Expectations- Based on new
informationinformation– Adjust Production strategies (how much to
grow)– Adjust Marketing strategies (when to sell or
store)• A single homogenous commodity replicatedA single homogenous commodity, replicated
to four separate commodities sold on the market.
The Price Adjustment Model
• Benefits in form of reduction in net social welfare loss by producers and consumers as a result of reduction in price forecastinga result of reduction in price forecasting errors.
• Also known as cost of being off the ilib i i d titequilibrium price and quantity
• Estimations based onFo r major cereals (millet mai e sorgh m– Four major cereals (millet, maize, sorghum and rice)Account for more than 85% of cereal– Account for more than 85% of cereal calories in Mali (Dembélé and Staatz., 1999).1999).
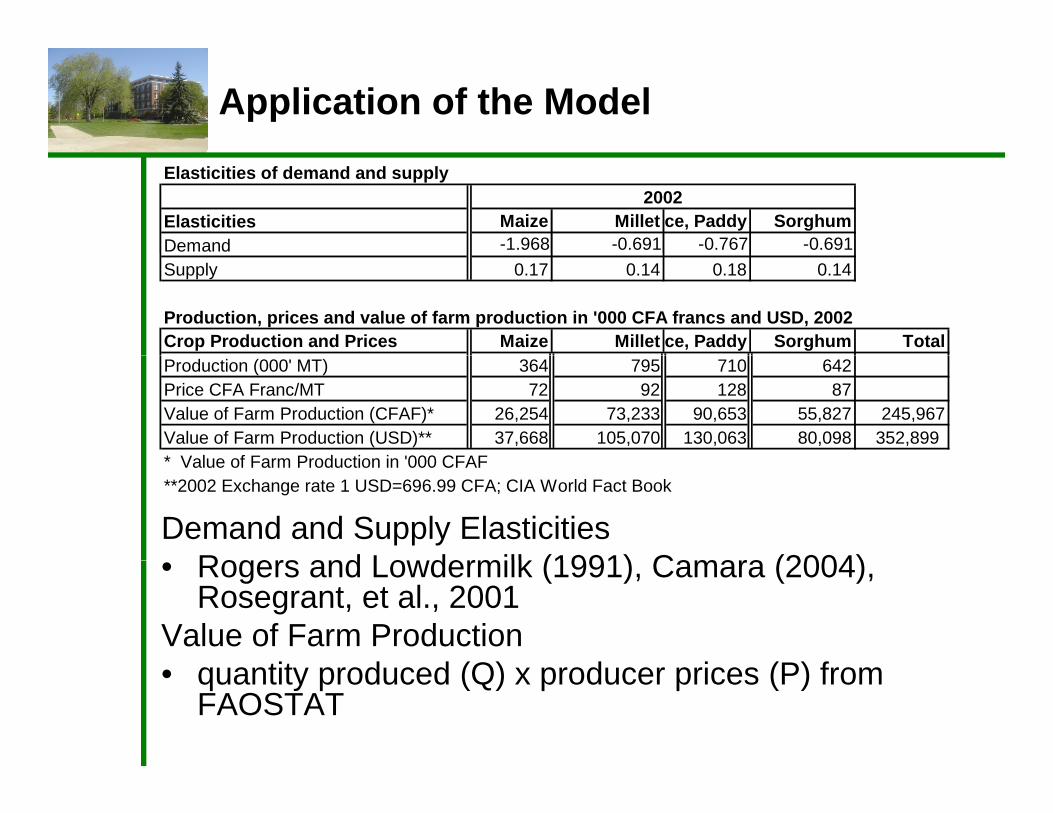
Production, prices and value of farm production in '000 CFA francs and USD, 2002Crop Production and Prices Maize Millet ce, Paddy Sorghum TotalProduction (000' MT) 364 795 710 642Price CFA Franc/MT 72 92 128 87Value of Farm Production (CFAF)* 26,254 73,233 90,653 55,827 245,967Value of Farm Production (USD)** 37,668 105,070 130,063 80,098 352,899 * V l f F P d ti i '000 CFAF
Demand and Supply ElasticitiesRogers and Lo dermilk (1991) Camara (2004)
* Value of Farm Production in '000 CFAF**2002 Exchange rate 1 USD=696.99 CFA; CIA World Fact Book
• Rogers and Lowdermilk (1991), Camara (2004), Rosegrant, et al., 2001
Value of Farm Productiontit d d (Q) d i (P) f• quantity produced (Q) x producer prices (P) from
FAOSTAT
Welfare Loss & Benefits of Improved Information
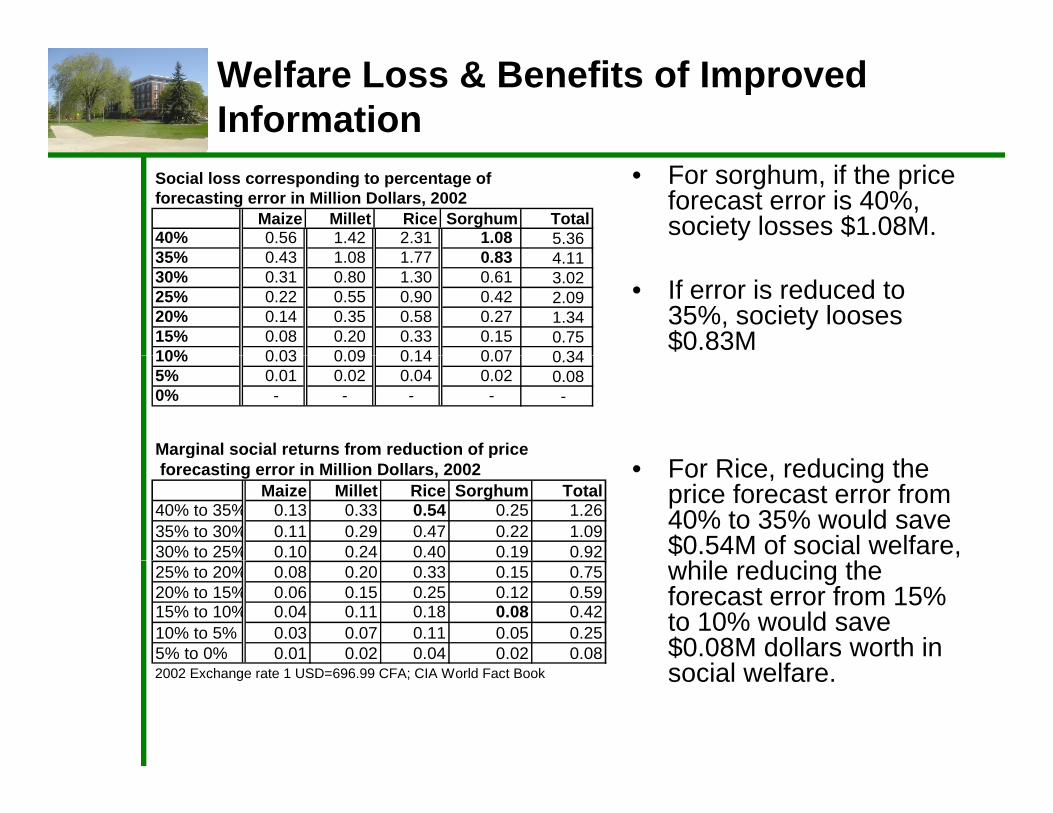
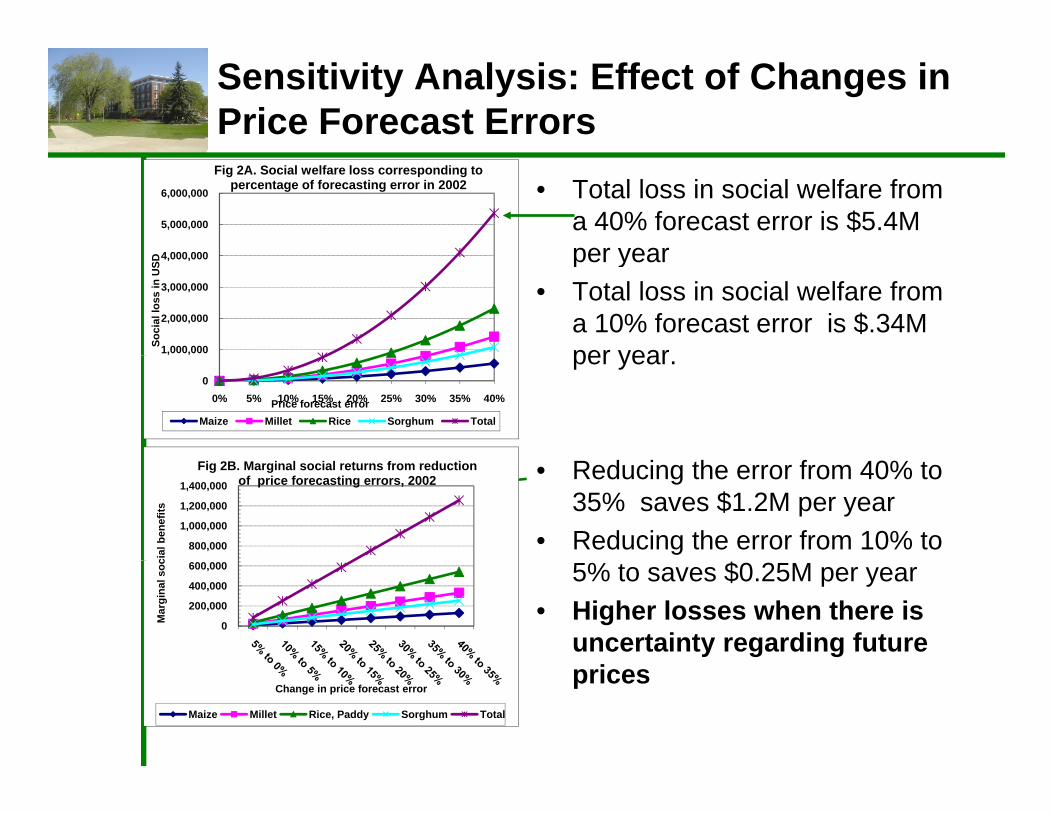
• For sorghum, if the price forecast error is 40%, society losses $1.08M.
Social loss corresponding to percentage of forecasting error in Million Dollars, 2002
• Reducing the error from 40% to 35% saves $1.2M per year
• Reducing the error from 10% to $
800,000
1,000,000
1,200,000
1,400,000
cial
ben
efits
Fig 2B. Marginal social returns from reduction of price forecasting errors, 2002
5% to saves $0.25M per year• Higher losses when there is
uncertainty regarding future 0
200,000
400,000
600,000
Mar
gina
l soc
prices Change in price forecast error
Maize Millet Rice, Paddy Sorghum Total
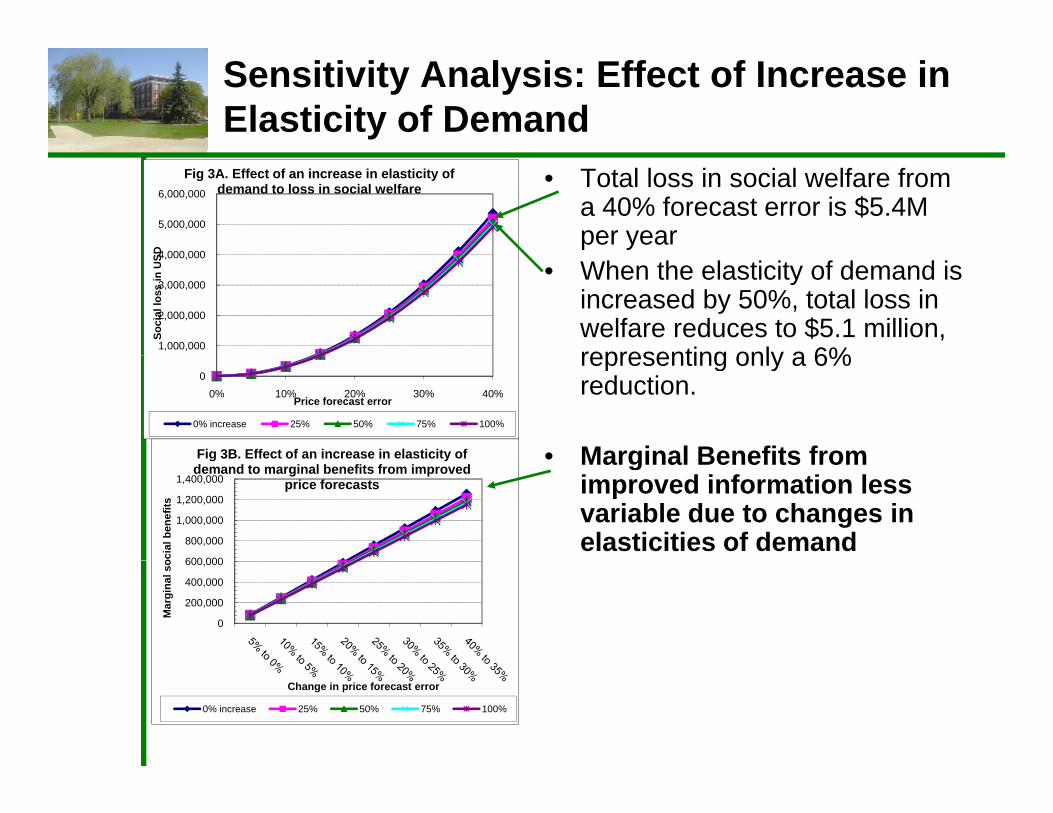
Sensitivity Analysis: Effect of Increase in Elasticity of Demand
• Total loss in social welfare from a 40% forecast error is $5.4M per year
4 000 000
5,000,000
6,000,000
DFig 3A. Effect of an increase in elasticity of
demand to loss in social welfare
• When the elasticity of demand is increased by 50%, total loss in welfare reduces to $5.1 million, representing only a 6%1,000,000
2,000,000
3,000,000
4,000,000
Soci
al lo
ss in
USD
representing only a 6% reduction.
• Marginal Benefits from
00% 10% 20% 30% 40%
Price forecast error
0% increase 25% 50% 75% 100%
Fig 3B. Effect of an increase in elasticity of • Marginal Benefits from improved information less variable due to changes in elasticities of demand
600 000
800,000
1,000,000
1,200,000
1,400,000
ocia
l ben
efits
Fig 3B. Effect of an increase in elasticity of demand to marginal benefits from improved
price forecasts
0
200,000
400,000
600,000
Mar
gina
l so
Change in price forecast error
0% increase 25% 50% 75% 100%
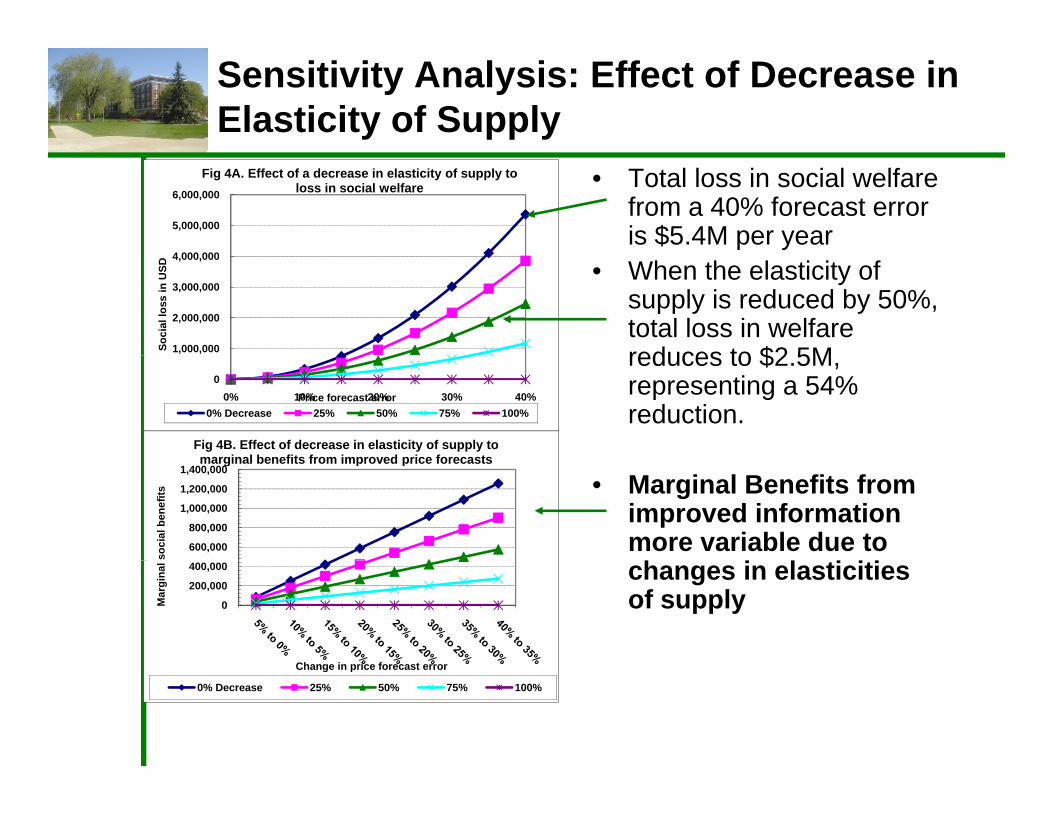
Sensitivity Analysis: Effect of Decrease in Elasticity of Supply
• Total loss in social welfare from a 40% forecast error is $5.4M per year
4 000 000
5,000,000
6,000,000
Fig 4A. Effect of a decrease in elasticity of supply to loss in social welfare
• When the elasticity of supply is reduced by 50%, total loss in welfare reduces to $2 5M1,000,000
2,000,000
3,000,000
4,000,000
Soci
al lo
ss in
USD
reduces to $2.5M, representing a 54% reduction.
00% 10% 20% 30% 40%Price forecast error
0% Decrease 25% 50% 75% 100%
Fig 4B. Effect of decrease in elasticity of supply to marginal benefits from improved price forecasts
• Marginal Benefits from improved information more variable due to 600,000
800,000
1,000,000
1,200,000
1,400,000
soci
al b
enef
its
marginal benefits from improved price forecasts
changes in elasticities of supply0
200,000
400,000
Mar
gina
l
Ch i i f tChange in price forecast error
0% Decrease 25% 50% 75% 100%
Cost - Benefit comparisons
Country ActivityCost / year in USD Source
Kenya ** Dissemination only 120,000(Shepherd, 2001)y y ( p )
UgandaDissemination / language 20,000(Shepherd, 2001)
Uganda* Full operation costs 30,000(Muganga, et al. 2000) Tanzania Dissemination only 10,000(Shepherd, 2001)Mali** Full operation costs 350,000(Staatz, 2006)
• *Decentralized/Localized MIS covering 3 districts • ** National MIS (Covers many commodities and
Markets)Markets)• Benefit from reducing price forecast errors with in a
10% to 15% range ($.42 million) are larger than the g ( ) gcosts ($.35 million) of running the service.
Summary and Conclusions
Better returns if improved market information is targeted to farmers and traders when:
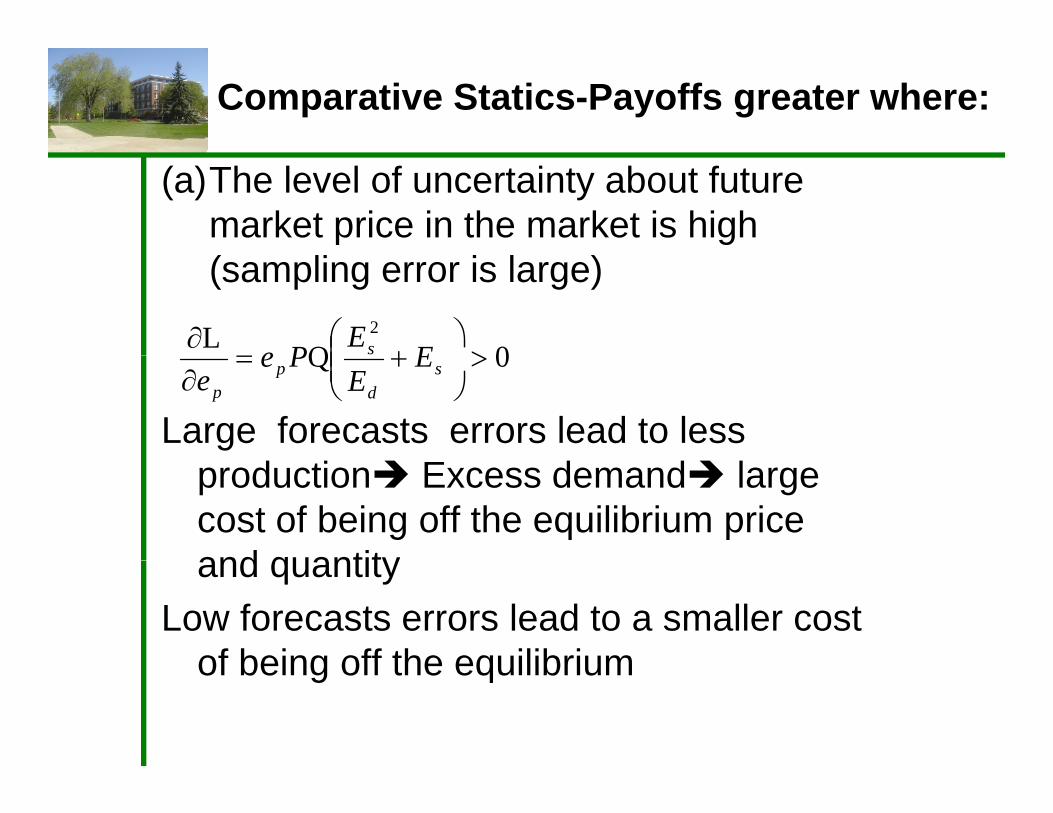
1. The level of uncertainty about future market price in the market is high.
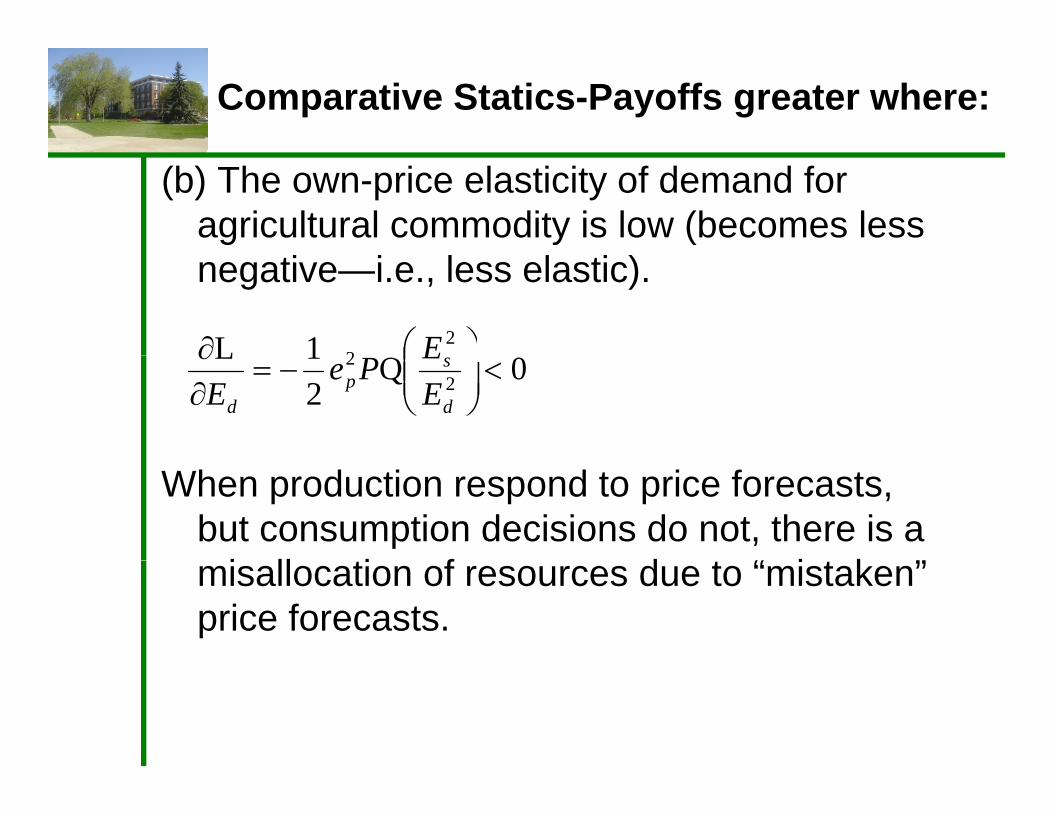
2 The o n price elasticit of demand for2. The own-price elasticity of demand for agricultural commodity is low.
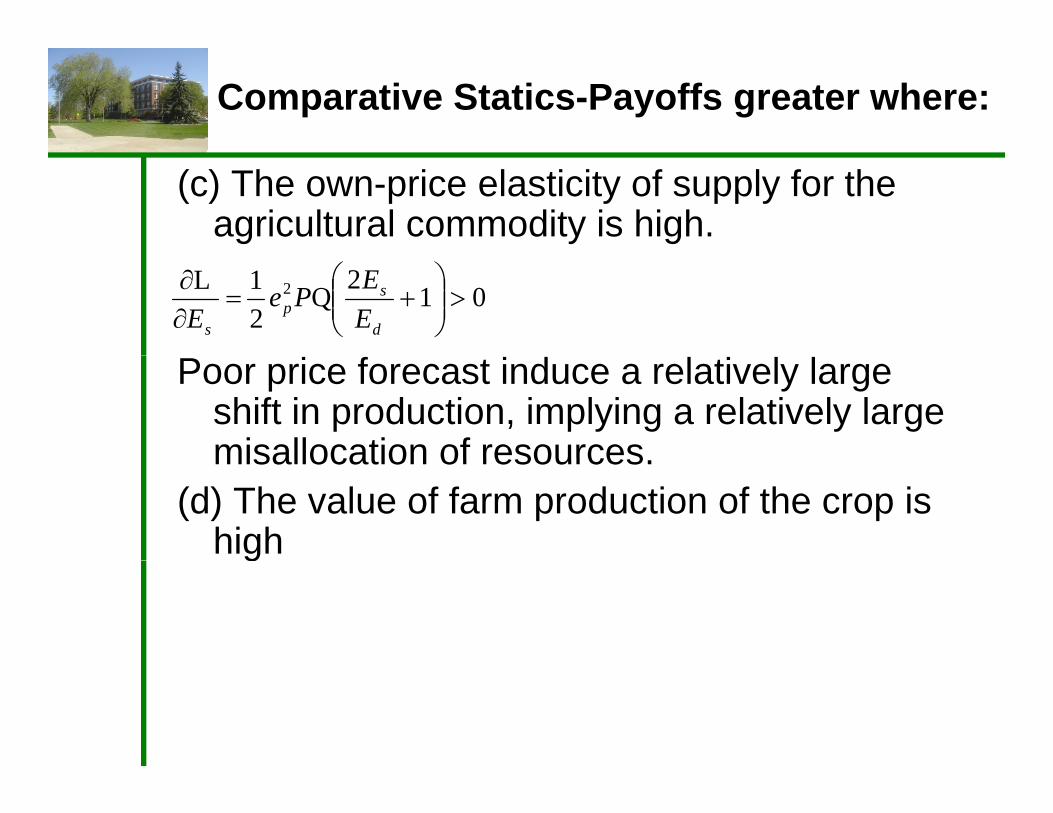
3 The own-price elasticity of supply for the3. The own price elasticity of supply for the agricultural commodity is high.
4. The value of farm production of the crop is p phigh.
Implications for MIS investments
• Decentralized or localized MIS: Collection, analysis and dissemination of market i f ti f i iinformation on few crops in a given agro-ecological, market or administrative area or region.region.
• Targeted Crop-specific MIS: Collection, g p p ,analysis and dissemination in areas where the value of agricultural production of the selected crops is high and responds toselected crops is high and responds to market information signals.