Knowledge and Use of Oral Rehydration Therapy for Childhood Diarrhoea in India: Effects of Exposure to Mass Media K. V. Rao, Vinod K. Mishra, and Robert D. Retherford National Family Health Survey Subject Reports Number 10 • November 1998 International Institute for Population Sciences Mumbai, India East-West Center Program on Population Honolulu, Hawaii, U.S.A.
Transcript
1
National Family Health Survey Subject Reports, No. 10
Knowledge and Use of OralRehydration Therapy forChildhood Diarrhoea inIndia: Effects of Exposureto Mass Media
K. V. Rao, Vinod K. Mishra, and Robert D. Retherford
National Family Health Survey Subject Reports
Number 10 • November 1998
International Institute for Population Sciences
Mumbai, India
East-West Center Program on Population
Honolulu, Hawaii, U.S.A.
2
National Family Health Survey Subject Reports, No. 10
ii
Correspondence addresses:
International Institute for Population SciencesGovandi Station Road, Deonar, Mumbai - 400 088, India
India’s National Family Health Survey (NFHS) was conducted in 1992–93 under the auspicesof the Ministry of Health and Family Welfare. The survey provides national and state-level
estimates of fertility, infant and child mortality, family planning practice, maternal and child
health, and the utilization of services available to mothers and children. The InternationalInstitute for Population Sciences, Mumbai, coordinated the project in cooperation with 18
population research centres throughout India, the East-West Center Program on Population in
Honolulu, Hawaii, and Macro International in Calverton, Maryland. The United States Agencyfor International Development provided funding for the project.
ISSN 1026-4736
This publication may be reproduced for educational purposes.
3
National Family Health Survey Subject Reports, No. 10
Knowledge and Use of OralRehydration Therapy forChildhood Diarrhoea in India:Effects of Exposure to MassMedia
Abstract. Diarrhoea is a major cause of illness and death among young children inIndia. Treatment guidelines issued by the World Health Organisation indicate thatmost cases of childhood diarrhoea can be treated at home by increased fluid intakeand continued feeding during diarrhoeal episodes. In accordance with WHO guide-lines, the Government of India promotes oral rehydration therapy, including the use oforal rehydration salt (ORS) packets or a recommended home-made solution (RHS)made from salt, sugar, and water. In its Oral Rehydration Therapy Programme, thegovernment has relied heavily on the electronic mass media, including radio, televi-sion, and cinema. It also supports community-level mass media and group educa-tional activities, which are carried out routinely in rural areas.
This Subject Report evaluates the effects of mother’s exposure to the massmedia on knowledge and use of oral rehydration therapy, using data from India’s 1992–93 National Family Health Survey. Results indicate that, despite a vigorous OralRehydration Therapy Programme for more than a decade, knowledge and use of oralrehydration therapy remain quite limited. Very small percentages of children who fall illwith diarrhoea are treated with ORS, RHS, or increased fluids, despite the fact thatmany of these children receive treatment from a health facility or provider. Many of thechildren who are treated by a health facility or provider are given unnecessary, andsometimes harmful, antibiotics and other antidiarrhoeal drugs but not ORS or RHS.The proportion receiving inappropriate treatment is slightly higher among children whoare treated in the private sector.
The analysis indicates that mother’s exposure to electronic mass media increasesawareness and use of oral rehydration therapy. Women who are regularly exposed toradio, television, or cinema are much more likely than are unexposed women to knowabout ORS packets and to use ORS or RHS to treat childhood diarrhoea. In ruralareas, community-level mass media and group educational activities also have posi-tive effects on knowledge and use of ORS and RHS, independent of mother’s expo-sure to electronic mass media and other demographic and socioeconomic variables.The results show some discrimination against girls in the use of ORS.
These findings indicate a lack of awareness of proper treatment of diarrhoea notonly among mothers but also among health-care providers. There is clearly a need to
4
National Family Health Survey Subject Reports, No. 10
strengthen education programmes for mothers and to provide supplemental trainingto health-care providers, emphasizing the importance of increased fluid intake andcontinued feeding and discouraging the use of drugs. The Oral Rehydration TherapyProgramme also needs to address the problem of discrimination against girls in theuse of ORS packets. The results of this study indicate that the mass media can help inthese efforts.
K. V. Rao, Vinod K. Mishra, and Robert D. Retherford
K. V. Rao is a Joint Director in the Department of Family Welfare, Ministry of Health
and Family Welfare, New Delhi. Vinod K. Mishra is a Fellow, and Robert D. Retherford
is a Senior Fellow in the East-West Center’s Program on Population.
National Family Health Survey Subject Reports, Number 10 • November 1998
5
National Family Health Survey Subject Reports, No. 10
FOREWORD
This Subject Report is a product of the Project to Strengthen the Survey Research
Capabilities of the Population Research Centres (PRC) in India, more commonly
known as the PRC project. The 1992–93 National Family Health Survey (NFHS) is
a major component of this project. Findings from the NFHS provide the basis for
this report.
The Ministry of Health and Family Welfare (MOHFW) launched the PRC project
in 1991. The MOHFW designated the International Institute for Population Sciences
(IIPS), Mumbai, as the nodal agency to provide coordination and technical guidance
for the project. Various consulting organisations collected survey data during 1992–
93 in collaboration with Population Research Centres in the various states. Basic
survey reports and summary reports for India as a whole and for 25 states (including
Delhi, which recently attained statehood) were published during 1994–95. The East-
West Center (Honolulu, Hawaii, U.S.A.) and Macro International (Calverton, Mary-
land, U.S.A.) provided technical assistance for all survey operations. The United
States Agency for International Development (USAID) provided funding for the PRC/
NFHS project.
Upon completion of the basic survey reports and summary reports in Decem-
ber 1995, the NFHS data were released to the scientific community for further study.
As part of this further research and as a continuation of the PRC/NFHS project, a
Subject Reports series was established. The present Subject Report on the effects of
exposure to mass media on knowledge and use of oral rehydration therapy is the
10th in this series. The research on which this report is based was conducted while
K. V. Rao was a Visiting Fellow at the East-West Center. Selected findings from this
report have also been published in summary form in NFHS Bulletin No. 11.
We thank Fred Arnold, Norman Y. Luther, B. M. Ramesh, and T. K. Roy for
helpful comments on an earlier draft of the report. We also thank Victoria Ho, Gayle
Yamashita, and Noreen Tanouye for computing and research assistance, Sidney B.
Westley for editorial assistance, and O. P. Sharma for assistance with printing and
distribution.
6
National Family Health Survey Subject Reports, No. 10
INTRODUCTION
Diarrhoea is a major cause of illness and death among young children in developing
countries. Globally, an estimated 1.8 billion episodes of childhood diarrhoea occur
every year—a higher annual incidence than that of any other disease—and more than
three million children under age five die from diarrhoea or diarrhoea-related causes
annually (WHO 1995). As in other developing countries, diarrhoea is a major cause
of illness and death among young children in India (GOI 1998). The main immediate
cause of death from acute diarrhoea is dehydration. According to treatment guide-
lines issued by WHO (1995), most cases of childhood diarrhoea can be treated at
home by continuing feeding and increasing fluid intake.
Because diarrhoea accounts for a significant proportion of childhood mortality
in India, the government considers the Oral Rehydration Therapy Programme one of
its priority activities for promoting child survival. This programme aims at educating
mothers and communities about the causes, symptoms, and treatment of diarrhoea.
Mothers are instructed to increase fluid intake, continue feeding, and recognize dan-
ger signs requiring treatment at a health facility. For more than a decade, the programme
also emphasized the use of a solution made from widely available Oral Rehydration
Salt (ORS) packets and an alternative home-made solution made from salt, sugar,
and water, referred to here as Recommended Home Solution (RHS).
It is widely believed that the electronic mass media can play an important role
in educating women about oral rehydration therapy in a country such as India, where
about two-thirds of mothers are illiterate. Accordingly, the government has relied
heavily on the electronic media to educate mothers and communities about home
management of diarrhoea. Spot messages on home treatment of diarrhoea using ORS
and RHS are aired on radio and television, and longer documentaries are shown in
cinema halls. A number of community-level activities are also conducted to educate
rural people about major public health issues, including oral rehydration therapy.
Such activities include film shows, drama and song performances, exhibitions, group
meetings, and training camps.
India’s 1992–93 National Family Health Survey (NFHS), which provides the
data for this report, does not contain questions about specific exposure to media mes-
sages on oral rehydration therapy, but it does include general questions about expo-
sure to electronic mass media and community-level mass media and group educa-
tional activities. Using responses to these questions, this report estimates the effects
of exposure to mass media on knowledge and use of oral rehydration therapy to treat
childhood diarrhoea.
Exposure to mass media has been shown to have substantial effects on people’s
attitudes and behaviors in India. For example, in a recent study also based on NFHS
data, Retherford and Mishra (1997) found that electronic mass media exposure has a
7
National Family Health Survey Subject Reports, No. 10
substantial positive effect on current use and intended future use of family planning,
even after controlling for number of living children, urban/rural residence, and edu-
cation. In another recent study based on NFHS data, Gandotra and others (1998)
found that women who are regularly exposed to electronic mass media have signifi-
cantly lower fertility than do other women, even after controlling for urban/rural
residence and education. It appears that little research has been done on the effects of
mass media exposure on knowledge and use of oral rehydration therapy to treat child-
hood diarrhoea. This report attempts to fill this gap.
DATA AND METHODS
This study is based on data from India’s 1992–93 National Family Health Survey
(NFHS). The NFHS covered 25 states (including Delhi, which recently attained state-
hood), representing 99 percent of India’s population. Data were collected from a
nationally representative sample of 89,777 ever-married women age 13–49 residing
in 88,562 households. This report is based on data for the 38,161 women covered by
the NFHS who gave birth during the four years before the survey and on data for the
4,558 children born in the period 1–47 months before the NFHS who were ill with
diarrhoea during the two weeks before the survey.
Three questionnaires were used in the NFHS—one for villages (administered
only in rural areas), one for households, and one for ever-married women age 13–49
within households. Three data files correspond to these three questionnaires—the
village data file, the household data file, and the individual data file. This report uses
information from all three NFHS data files. Selected village characteristics are used
only when the analysis is done separately for rural areas.
The sample design for some states is self-weighting, but in other states certain
sectors of the population, such as urban areas, are over-sampled. It is, therefore,
necessary to use weights to restore the correct proportions. For tabulations at the
state level, weights are designed to preserve the total number of ever-married women
interviewed in the state, so that the weighted state total equals the unweighted state
total. For tabulations at the national level, a different set of weights is required be-
cause sampling fractions vary from state to state. The national-level weights are
designed to preserve the total number of 89,777 ever-married women who were in-
terviewed. Thus each woman has two weights, one that is used when the state is the unit
for tabulation and a second that is used when the whole country is the unit for tabulation.
A number of tables in this report contain results both for India as a whole and
for individual states. In such tables, the national-level results use the national weights,
and the individual state results use the state-level weights. All results (including num-
bers of cases where specified) are based on the weighted data. The sample design for
the survey is discussed in more detail in the original NFHS report (IIPS 1995).
8
National Family Health Survey Subject Reports, No. 10
The NFHS included three questions on women’s general exposure to electronic
mass media: ‘Do you usually listen to a radio at least once a week?’, ‘Do you usually
watch television at least once a week?’, and ‘Do you usually go to a cinema hall or
theatre to see a movie at least once a month?’. In the analysis that follows, these three
types of electronic mass media are sometimes considered separately, but usually they
are grouped together. Exposure to the three media is measured by a single dummy
variable, defined as 1 if the respondent answered ‘yes’ to any of the three questions,
and 0 otherwise.
The village questionnaire, used in rural areas, had additional questions on orga-
nized mass-media activities in the village, including ‘number of film shows held’,
‘number of exhibitions held’, ‘number of drama/song performances held’, ‘number
of group meetings held’, and ‘any leaders’ orientation training camp held?’. From
these questions we constructed a variable, ‘village media/educational activity’. This
is represented by a dummy variable defined as 1 if the village had any film show,
exhibition, drama/song performance, or group meeting during the year before the
survey or if any leaders’ orientation training camp was ever held in the village, and 0
otherwise.
Mothers of children born during the four years before the survey were also
asked a series of questions about the incidence of diarrhoea among their children.
The questions used here asked whether a child had been ill with diarrhoea in the
previous two weeks, whether a child had been ill with diarrhoea in the previous 24
hours, and whether the diarrhoea had been bloody.
If the mother reported that a child had been ill with diarrhoea in the previous
two weeks, she was asked about any treatment given for the diarrhoea. If the child
was still breastfeeding, she was asked whether she had increased the frequency of
breastfeeding (one way of increasing fluid intake). She was also asked whether the
child had received increased fluids aside from breast milk. Then she was asked whether
she had sought advice or treatment from any of several types of health facility or
provider. She was also asked whether the child had received any treatment for diar-
rhoea, including ORS, RHS, antibiotics or other drugs, or intravenous rehydration.
Mothers whose children did not have diarrhoea during the two weeks before the
survey or who did not treat an incidence of diarrhoea with ORS were asked whether
they had heard of ORS or had ever used ORS packets. Mothers who had treated an
incidence of diarrhoea with RHS were asked how they had learned to prepare the
solution. The possible response categories to this last question included radio, televi-
sion, and printed material.
From these questions on treatment of diarrhoea, we constructed several vari-
ables. Some pertain to mothers of children born during the four years before the
survey, and others pertain to children born 1–47 months before the NFHS who were
ill with diarrhoea at any time during the two weeks before the survey. The variables
9
National Family Health Survey Subject Reports, No. 10
for mothers include whether the mother knows about ORS and has ever used ORS
packets. For mothers who have used RHS, there is also a variable on whether the
mother learned how to prepare RHS from the mass media, defined for this question
as radio, television, and printed material. The variables for children include whether
the child received treatment from a health facility or provider during the recent bout
of diarrhoea, whether the child received ORS, whether the child received RHS, whether
the child received more frequent breastfeeding, whether the child received increased
fluids, and whether the child received antibiotics or other antidiarrhoeal drugs.
The NFHS also collected information on various socioeconomic and demo-
graphic characteristics of children, mothers, and households. The effects of mass
media exposure on knowledge and use of oral rehydration therapy are likely to be
confounded with the effects of some of these other variables. To avoid this problem,
it is useful to control statistically, or ‘adjust’, for selected socioeconomic and demo-
graphic characteristics by holding them constant at their mean values. The variables
included as controls in this analysis are: child’s age (1–5, 6–11, 12–23, 24–47 months);
sex of child (boy, girl); mother’s age (13–19, 20–29, 30–49 years); residence (urban,
rural); mother’s education (illiterate, literate with less than middle school complete,
middle school complete or higher); religion (Hindu, Muslim, other); caste/tribe (sched-
uled caste or scheduled tribe, other)1; house type (kachcha, pucca or semi-pucca)2;
crowding (less than three persons per room, three or more persons per room); safe
drinking water (yes, no); sanitary toilet facility (yes, no); electricity in the household
(yes, no); and geographic region (north, central, east, northeast, west, south). When
rural areas are examined separately, the analysis also includes controls for village
media/educational activity (yes, no); distance to a health-care facility (less than two
kilometres, two kilometres or greater); and whether the village is connected to the
outside by an all-weather road (yes, no). For further detail on definitions of variables,
see Tables 7 and 12 later in this report.
Each control variable has a rationale for inclusion. Child’s age is controlled
because it is correlated with frequency of diarrhoeal episodes as well as with mother’s
exposure to mass media. Child’s gender is controlled because in India boys are more
likely than girls to receive treatment for diarrhoea. Mother’s age is controlled be-
cause a mother’s exposure to mass media and knowledge of oral rehydration therapy
1. Scheduled castes (SC) and scheduled tribes (ST) are castes and tribes identified by the
Government of India as socially and economically backward and in need of special protection
from social injustice and exploitation.
2. Kachcha houses are made from mud, thatch, or other low-quality materials; pucca houses
are made from high-quality materials (such as bricks, tiles, cement, and concrete) throughout,
including roof, walls, and floor; and semi-pucca houses are made from partly low-quality and
partly high-quality materials.
10
National Family Health Survey Subject Reports, No. 10
are both correlated with her age. Mother’s education and urban/rural residence are
controlled because they are correlated with electronic mass media exposure and with
access to health-care services. Religion and caste/tribe are cultural variables that control
for cultural variations in child care and treatment practices. Religion and caste/tribe are
also likely to be correlated with mothers’ access to mass media and health-care facilities.
Controlling for household economic status is important because it is an indirect
indicator of the nutritional and health status of the child as well as access to health
care. Household economic status is also likely to be correlated with radio and televi-
sion ownership and exposure to electronic mass media. House type, crowding, access
to safe drinking water, access to a sanitary toilet facility, and household electricity all
help to control for household economic status. Crowding, access to safe drinking
water, and access to a sanitary toilet facility also control for unhygienic living condi-
tions, which may be correlated with frequency of diarrhoeal episodes.
At the village level, availability of an all-weather road connecting the village to
the outside is correlated with access to information and health-care facilities, and it
may also be correlated with the general level of economic and social development of
the village. Availability of a health-care facility within two kilometres is correlated
with access to both health care and information about health care, including oral
rehydration therapy. Geographic region is controlled because both media exposure
and prevalence of diarrhoea in India vary by region.
The analysis focuses on how a mother’s exposure to radio, television, or cinema
affects her knowledge and use of oral rehydration therapy, after controlling for all
these potentially confounding variables. For rural areas, the report also assesses the
effects of community-level mass media and educational activities on knowledge and
use of oral rehydration therapy.
The analysis is based on two sets of logistic or multinomial logistic regressions.
In the first set, mothers are the units of analysis. These regressions analyse the effects
of mass media exposure on mother’s knowledge and ever-use of ORS packets. In the
second set, the units of analysis are children who were ill with diarrhoea during the
two weeks before the survey. These regressions analyse the effects of mother’s mass
media exposure on treatment of diarrhoea using ORS, RHS, frequency of breastfeeding,
and fluid intake.
The logistic or multinomial logistic regressions are used to estimate the unad-
justed and adjusted effects of mother’s mass media exposure on knowledge and use
of oral rehydration therapy. This involves calculating unadjusted and adjusted values
of the response variable for each category of media exposure (regularly exposed or
not regularly exposed). When women are the units of analysis, the unadjusted and
adjusted values of the response variable are expressed as percentages of women who
know about ORS packets or as percentages of women who have ever used ORS pack-
ets. When children are the units of analysis, the unadjusted and adjusted values of the
11
National Family Health Survey Subject Reports, No. 10
response variable are expressed as percentages of children who have received a speci-
fied type of treatment (e.g., ORS or RHS).
Unadjusted percentages are calculated from logistic or multinomial logistic re-
gressions that have only a single predictor variable, namely media exposure. Ad-
justed percentages are calculated from logistic or multinomial logistic regressions
that include not only media exposure but also all the control variables as predictor
variables. When calculating the adjusted percentages for categories of media expo-
sure, the control variables are held constant by setting them to their mean values in
the underlying regressions. For further details of this methodology, see Retherford
and Choe (1993).
Each logistic or multinomial logistic regression is calibrated by resetting the
value of the constant term in the regression so that the predicted percentage (either
unadjusted or adjusted) that is obtained when all predictor variables are set to their
mean values equals the observed percentage. The estimation of levels of statistical
significance of underlying logistic regression coefficients takes into account design
effects due to clustering at the level of the primary sampling unit. The regressions
were estimated using the STATA statistical software package (Stata Corporation 1997).
The regression analysis is carried out not only for India as a whole, but also for
urban and rural areas separately and for boys and girls separately. In the separate
analyses for urban and rural areas, the residence variable is omitted from the set of
control variables. Similarly, in the separate analyses for boys and girls, the gender
variable is omitted from the set of control variables.
EXPOSURE TO ELECTRONIC MASS MEDIA, PREVALENCE OFDIARRHOEA, AND KNOWLEDGE AND EVER-USE OF ORS PACKETS
This section describes variations in exposure to electronic mass media, prevalence of
diarrhoea, and knowledge and use of ORS packets by selected demographic and so-
cioeconomic characteristics, for India as a whole and for individual states.
Exposure to electronic mass media
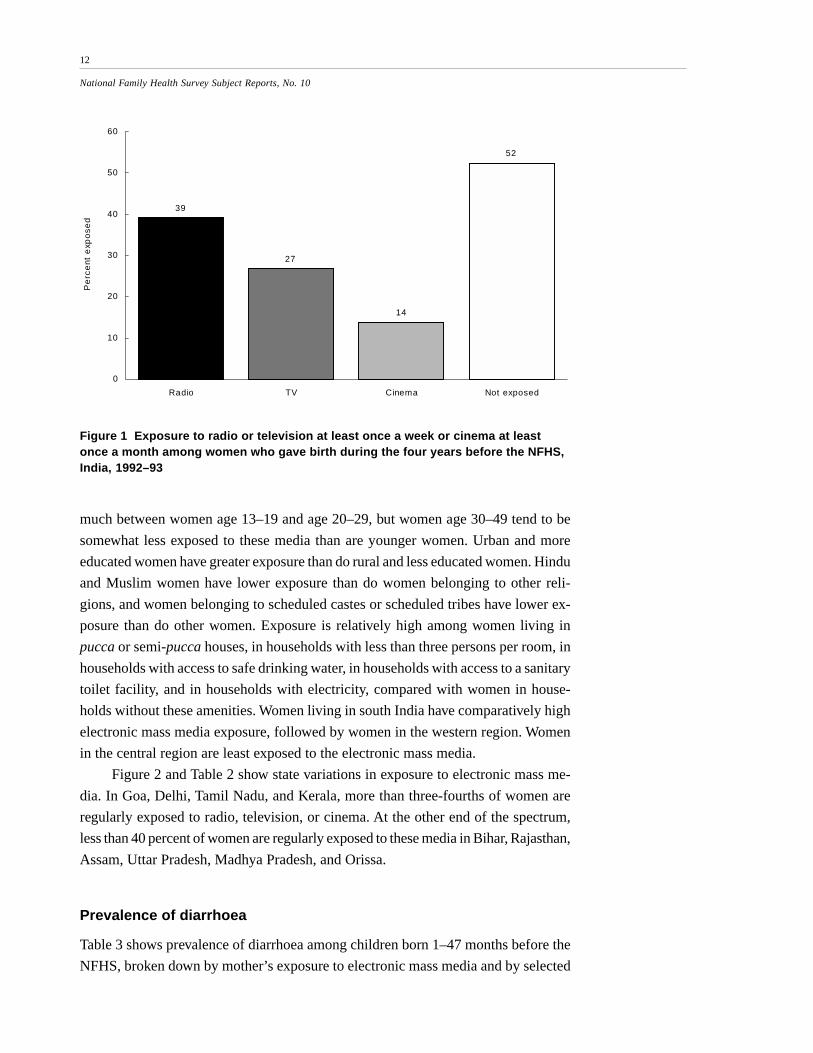
Figure 1 shows the extent of exposure to electronic mass media among Indian women
who gave birth during the four years before the survey. Thirty-nine percent of these
women listen to radio at least once a week, 27 percent watch television at least once
a week, and 14 percent go to a cinema hall or theatre to see a movie at least once a
month. Altogether, 48 percent are regularly exposed to at least one of these electronic
mass media; 52 percent are not regularly exposed to any of them.
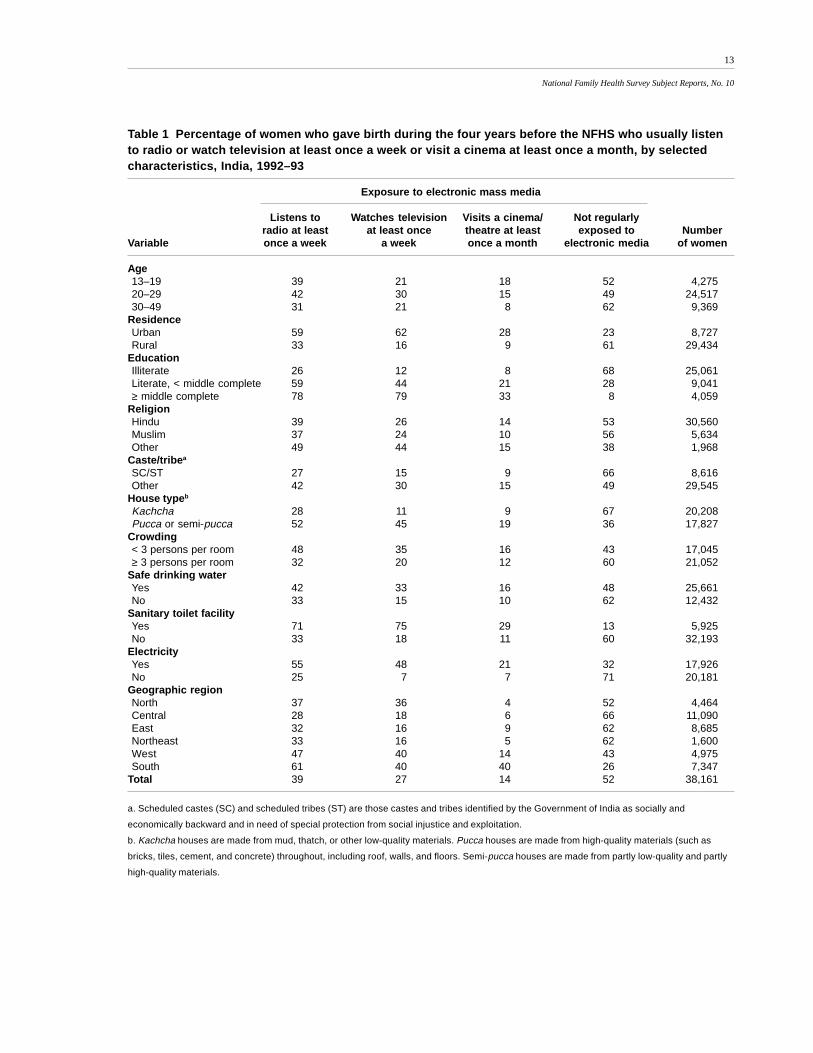
Table 1 shows how exposure to the three types of electronic mass media varies
by selected demographic and socioeconomic characteristics. Exposure does not vary
12
National Family Health Survey Subject Reports, No. 10
much between women age 13–19 and age 20–29, but women age 30–49 tend to be
somewhat less exposed to these media than are younger women. Urban and more
educated women have greater exposure than do rural and less educated women. Hindu
and Muslim women have lower exposure than do women belonging to other reli-
gions, and women belonging to scheduled castes or scheduled tribes have lower ex-
posure than do other women. Exposure is relatively high among women living in
pucca or semi-pucca houses, in households with less than three persons per room, in
households with access to safe drinking water, in households with access to a sanitary
toilet facility, and in households with electricity, compared with women in house-
holds without these amenities. Women living in south India have comparatively high
electronic mass media exposure, followed by women in the western region. Women
in the central region are least exposed to the electronic mass media.
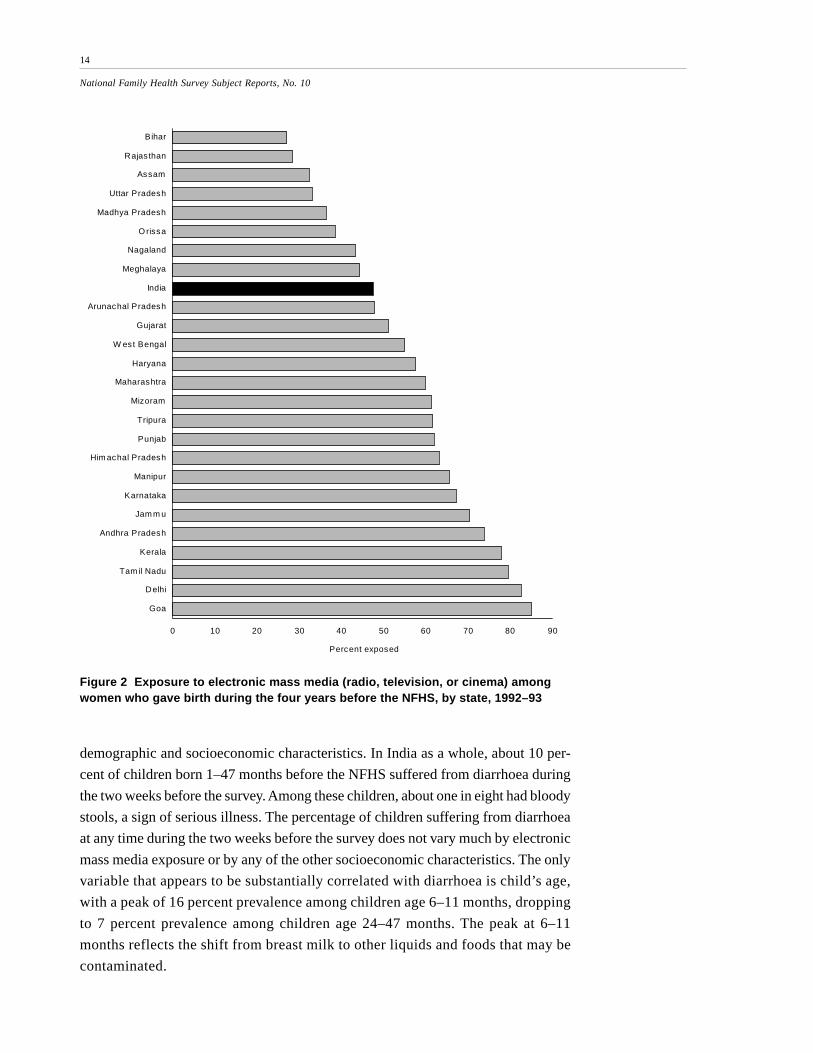
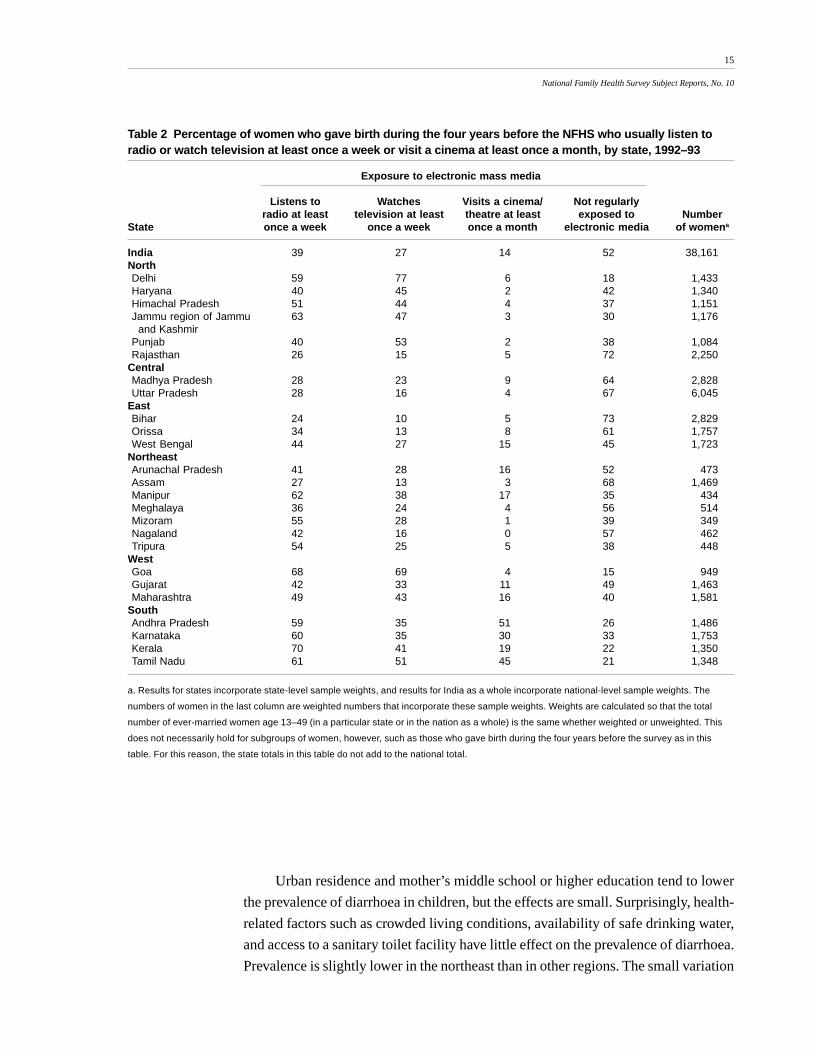
Figure 2 and Table 2 show state variations in exposure to electronic mass me-
dia. In Goa, Delhi, Tamil Nadu, and Kerala, more than three-fourths of women are
regularly exposed to radio, television, or cinema. At the other end of the spectrum,
less than 40 percent of women are regularly exposed to these media in Bihar, Rajasthan,
Assam, Uttar Pradesh, Madhya Pradesh, and Orissa.
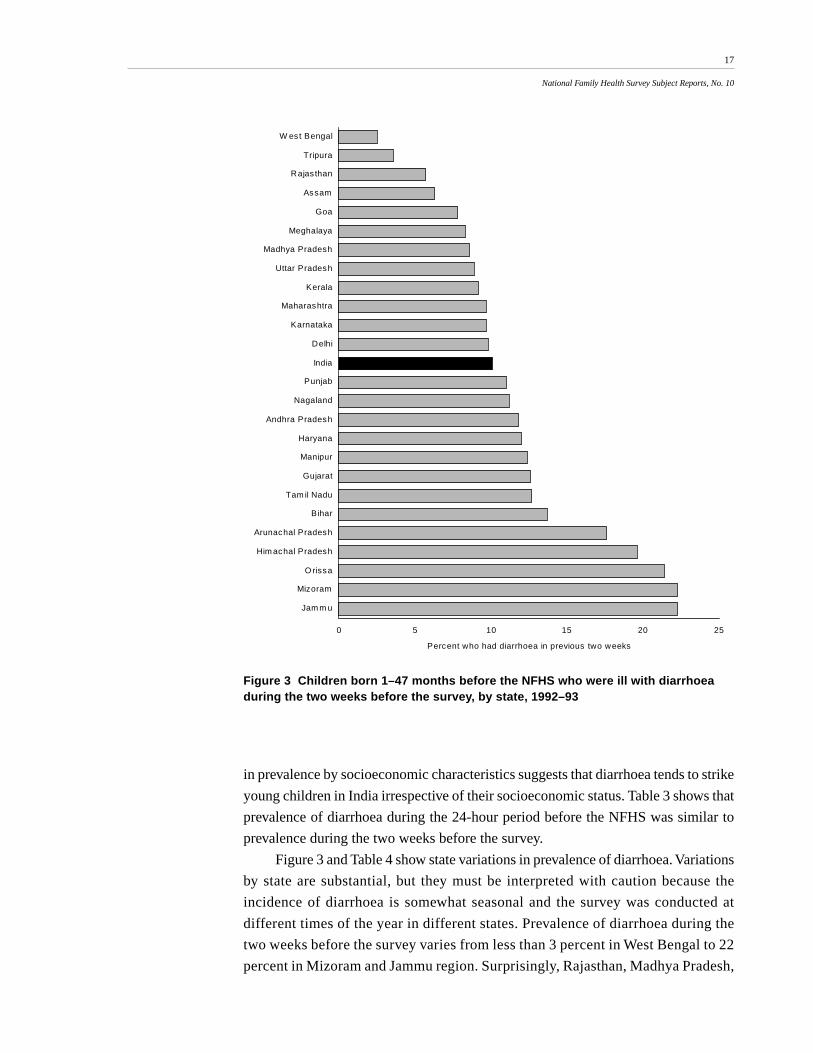
Prevalence of diarrhoea
Table 3 shows prevalence of diarrhoea among children born 1–47 months before the
NFHS, broken down by mother’s exposure to electronic mass media and by selected
39
27
14
52
0
10
20
30
40
50
60
Radio TV Cinema Not exposed
Pe
rce
nt e
xpo
sed
Figure 1 Exposure to radio or television at least once a week or cinema at leastonce a month among women who gave birth during the four years before the NFHS,India, 1992–93
13
National Family Health Survey Subject Reports, No. 10
Table 1 Percentage of women who gave birth during the four years before the NFHS who usually listento radio or watch television at least once a week or visit a cinema at least once a month, by selectedcharacteristics, India, 1992–93
Exposure to electronic mass media
Listens to Watches television Visits a cinema/ Not regularlyradio at least at least once theatre at least exposed to Number
Variable once a week a week once a month electronic media of women
a. Scheduled castes (SC) and scheduled tribes (ST) are those castes and tribes identified by the Government of India as socially and
economically backward and in need of special protection from social injustice and exploitation.
b. Kachcha houses are made from mud, thatch, or other low-quality materials. Pucca houses are made from high-quality materials (such as
bricks, tiles, cement, and concrete) throughout, including roof, walls, and floors. Semi-pucca houses are made from partly low-quality and partly
high-quality materials.
14
National Family Health Survey Subject Reports, No. 10
0 10 20 30 40 50 60 70 80 90
Bihar
Rajas than
Assam
Uttar Pradesh
Madhya Pradesh
O rissa
Nagaland
Meghalaya
India
Arunachal Pradesh
Gujarat
W est Bengal
Haryana
Maharashtra
Mizoram
Tripura
Punjab
Him achal Pradesh
Manipur
Karnataka
Jam m u
Andhra Pradesh
Kerala
Tam il Nadu
Delhi
Goa
Percent exposed
Figure 2 Exposure to electronic mass media (radio, television, or cinema) amongwomen who gave birth during the four years before the NFHS, by state, 1992–93
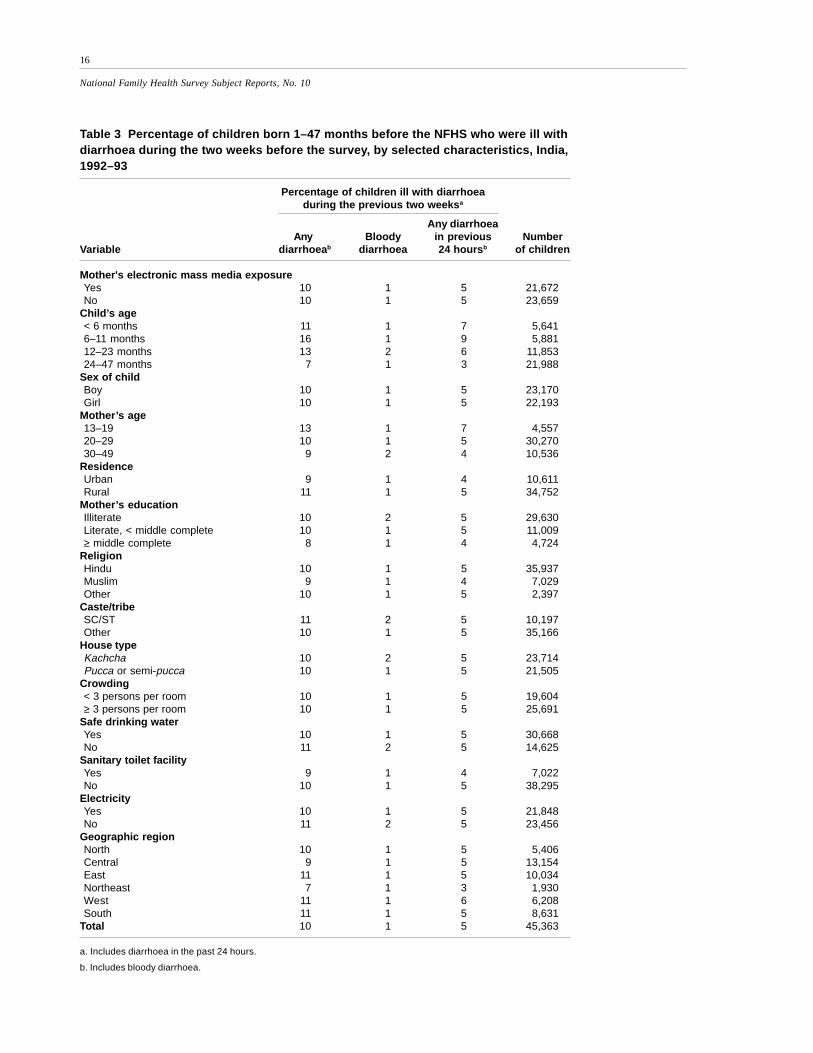
demographic and socioeconomic characteristics. In India as a whole, about 10 per-
cent of children born 1–47 months before the NFHS suffered from diarrhoea during
the two weeks before the survey. Among these children, about one in eight had bloody
stools, a sign of serious illness. The percentage of children suffering from diarrhoea
at any time during the two weeks before the survey does not vary much by electronic
mass media exposure or by any of the other socioeconomic characteristics. The only
variable that appears to be substantially correlated with diarrhoea is child’s age,
with a peak of 16 percent prevalence among children age 6–11 months, dropping
to 7 percent prevalence among children age 24–47 months. The peak at 6–11
months reflects the shift from breast milk to other liquids and foods that may be
contaminated.
15
National Family Health Survey Subject Reports, No. 10
Table 2 Percentage of women who gave birth during the four years before the NFHS who usually listen toradio or watch television at least once a week or visit a cinema at least once a month, by state, 1992–93
Exposure to electronic mass media
Listens to Watches Visits a cinema/ Not regularlyradio at least television at least theatre at least exposed to Number
State once a week once a week once a month electronic media of womena
a. Results for states incorporate state-level sample weights, and results for India as a whole incorporate national-level sample weights. The
numbers of women in the last column are weighted numbers that incorporate these sample weights. Weights are calculated so that the total
number of ever-married women age 13–49 (in a particular state or in the nation as a whole) is the same whether weighted or unweighted. This
does not necessarily hold for subgroups of women, however, such as those who gave birth during the four years before the survey as in this
table. For this reason, the state totals in this table do not add to the national total.
Urban residence and mother’s middle school or higher education tend to lower
the prevalence of diarrhoea in children, but the effects are small. Surprisingly, health-
related factors such as crowded living conditions, availability of safe drinking water,
and access to a sanitary toilet facility have little effect on the prevalence of diarrhoea.
Prevalence is slightly lower in the northeast than in other regions. The small variation
16
National Family Health Survey Subject Reports, No. 10
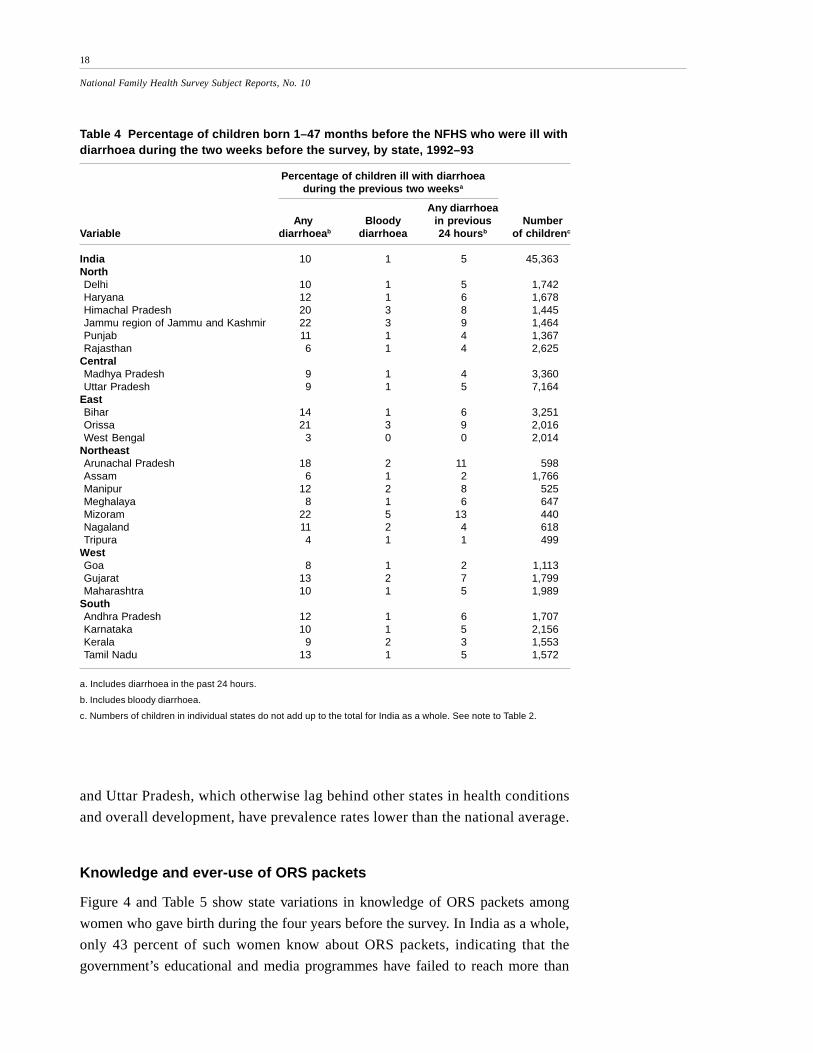
Table 3 Percentage of children born 1–47 months before the NFHS who were ill withdiarrhoea during the two weeks before the survey, by selected characteristics, India,1992–93
Percentage of children ill with diarrhoeaduring the previous two weeksa
Any diarrhoeaAny Bloody in previous Number
Variable diarrhoeab diarrhoea 24 hoursb of children
Mother's electronic mass media exposureYes 10 1 5 21,672No 10 1 5 23,659
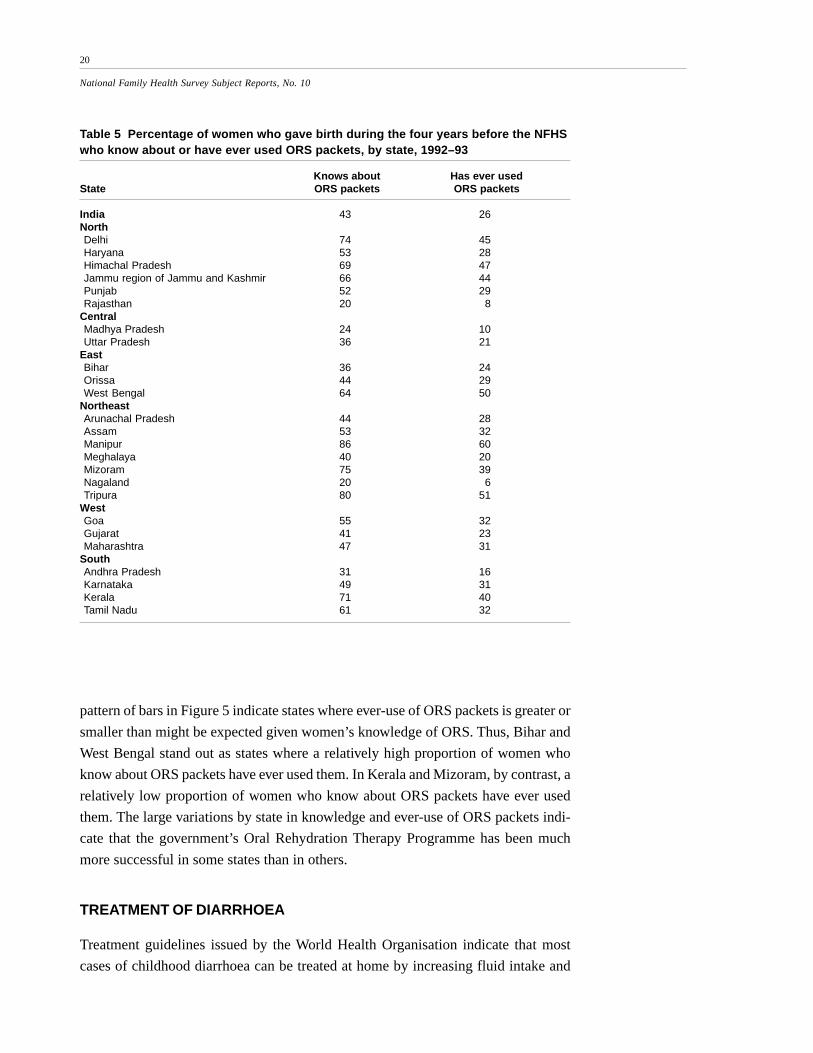
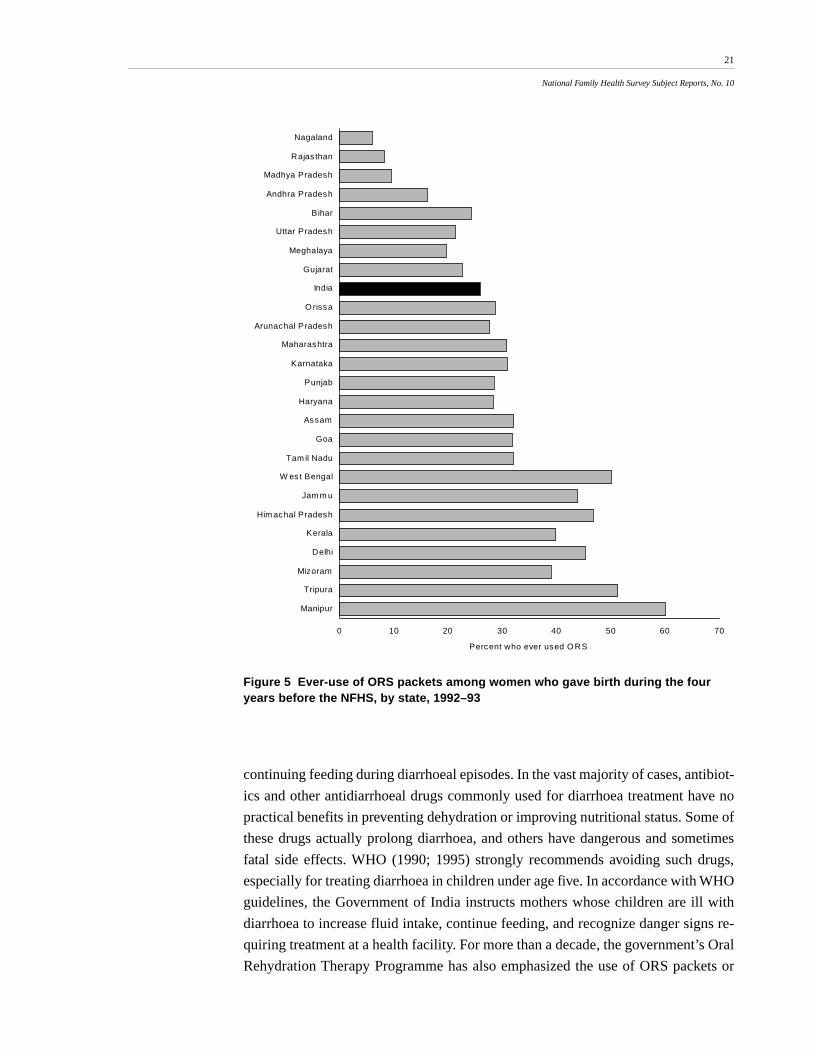
pattern of bars in Figure 5 indicate states where ever-use of ORS packets is greater or
smaller than might be expected given women’s knowledge of ORS. Thus, Bihar and
West Bengal stand out as states where a relatively high proportion of women who
know about ORS packets have ever used them. In Kerala and Mizoram, by contrast, a
relatively low proportion of women who know about ORS packets have ever used
them. The large variations by state in knowledge and ever-use of ORS packets indi-
cate that the government’s Oral Rehydration Therapy Programme has been much
more successful in some states than in others.
TREATMENT OF DIARRHOEA
Treatment guidelines issued by the World Health Organisation indicate that most
cases of childhood diarrhoea can be treated at home by increasing fluid intake and
21
National Family Health Survey Subject Reports, No. 10
Figure 5 Ever-use of ORS packets among women who gave birth during the fouryears before the NFHS, by state, 1992–93
continuing feeding during diarrhoeal episodes. In the vast majority of cases, antibiot-
ics and other antidiarrhoeal drugs commonly used for diarrhoea treatment have no
practical benefits in preventing dehydration or improving nutritional status. Some of
these drugs actually prolong diarrhoea, and others have dangerous and sometimes
fatal side effects. WHO (1990; 1995) strongly recommends avoiding such drugs,
especially for treating diarrhoea in children under age five. In accordance with WHO
guidelines, the Government of India instructs mothers whose children are ill with
diarrhoea to increase fluid intake, continue feeding, and recognize danger signs re-
quiring treatment at a health facility. For more than a decade, the government’s Oral
Rehydration Therapy Programme has also emphasized the use of ORS packets or
0 10 20 30 40 50 60 70
Nagaland
Rajas than
Madhya Pradesh
Andhra Pradesh
Bihar
Uttar Pradesh
Meghalaya
Gujarat
India
O rissa
Arunachal Pradesh
Maharashtra
Karnataka
Punjab
Haryana
Assam
Goa
Tam il Nadu
W est Bengal
Jam m u
Him achal Pradesh
Kerala
Delhi
Mizoram
Tripura
Manipur
Percent who ever used O RS
22
National Family Health Survey Subject Reports, No. 10
RHS to help prevent dehydration, which is the primary cause of death in children
suffering from acute diarrhoea.
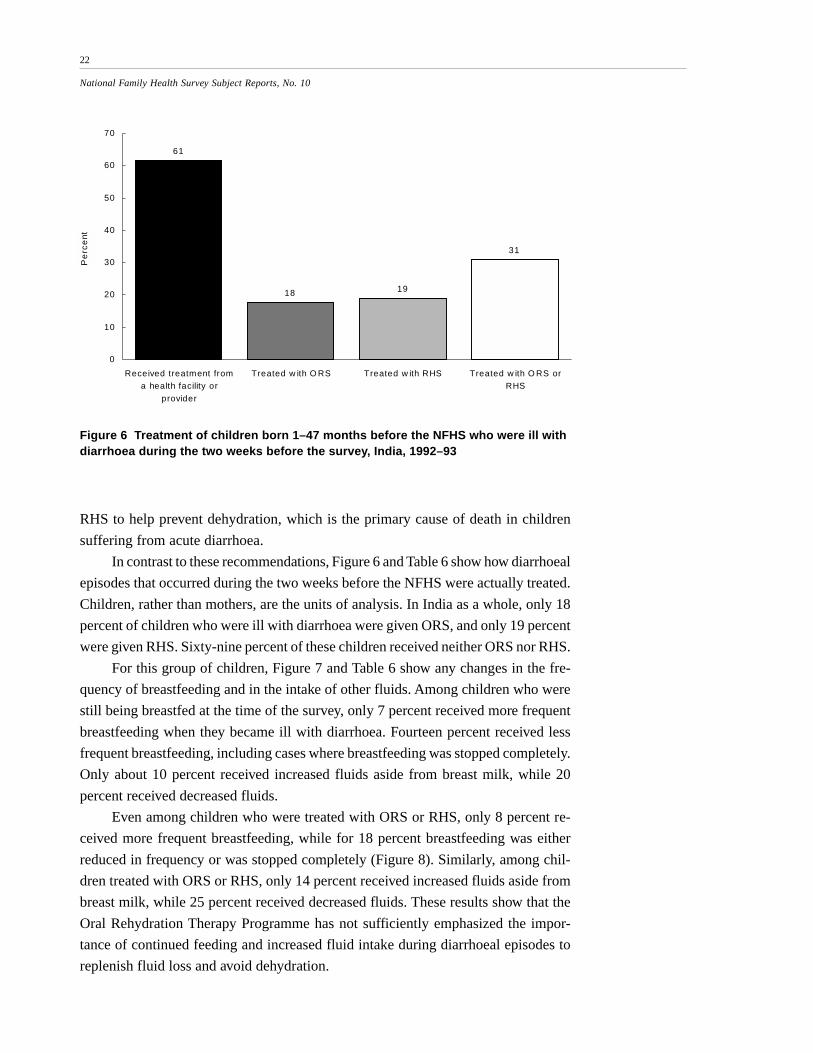
In contrast to these recommendations, Figure 6 and Table 6 show how diarrhoeal
episodes that occurred during the two weeks before the NFHS were actually treated.
Children, rather than mothers, are the units of analysis. In India as a whole, only 18
percent of children who were ill with diarrhoea were given ORS, and only 19 percent
were given RHS. Sixty-nine percent of these children received neither ORS nor RHS.
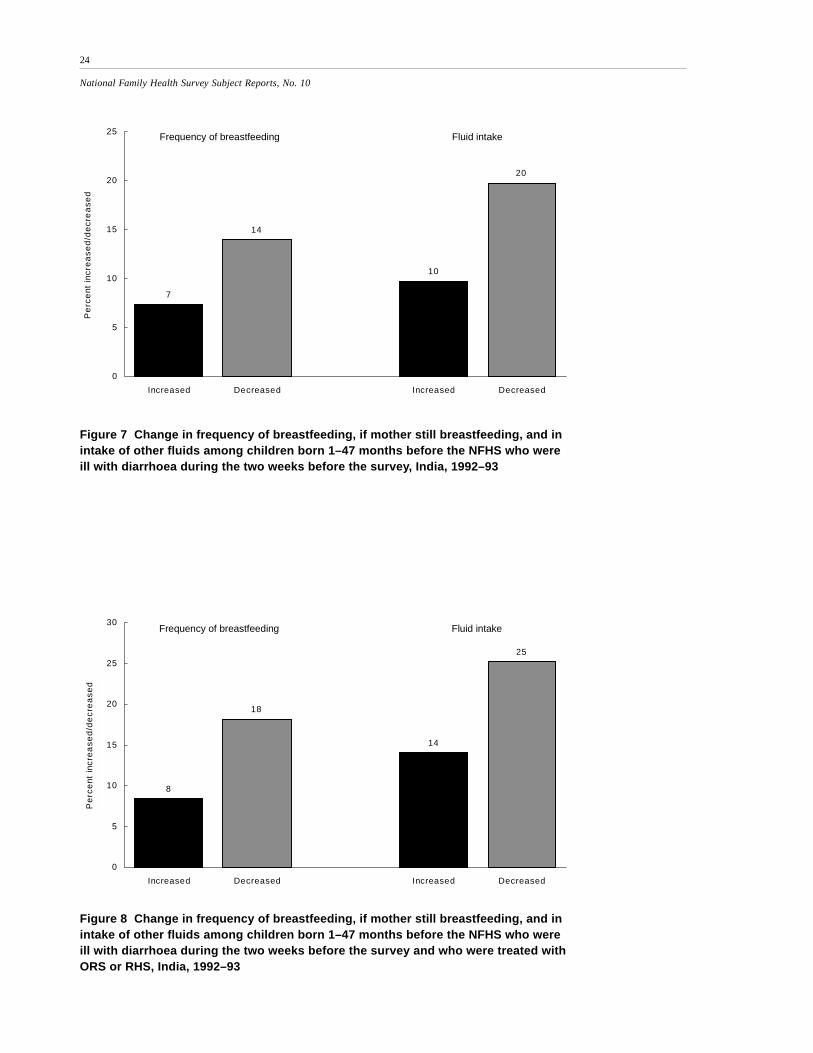
For this group of children, Figure 7 and Table 6 show any changes in the fre-
quency of breastfeeding and in the intake of other fluids. Among children who were
still being breastfed at the time of the survey, only 7 percent received more frequent
breastfeeding when they became ill with diarrhoea. Fourteen percent received less
frequent breastfeeding, including cases where breastfeeding was stopped completely.
Only about 10 percent received increased fluids aside from breast milk, while 20
percent received decreased fluids.
Even among children who were treated with ORS or RHS, only 8 percent re-
ceived more frequent breastfeeding, while for 18 percent breastfeeding was either
reduced in frequency or was stopped completely (Figure 8). Similarly, among chil-
dren treated with ORS or RHS, only 14 percent received increased fluids aside from
breast milk, while 25 percent received decreased fluids. These results show that the
Oral Rehydration Therapy Programme has not sufficiently emphasized the impor-
tance of continued feeding and increased fluid intake during diarrhoeal episodes to
replenish fluid loss and avoid dehydration.
Figure 6 Treatment of children born 1–47 months before the NFHS who were ill withdiarrhoea during the two weeks before the survey, India, 1992–93
61
18 19
31
0
10
20
30
40
50
60
70
Received treatment froma health facility or
provider
Treated w ith O RS Treated w ith RHS Treated w ith O RS orRHS
Pe
rce
nt
23
National Family Health Survey Subject Reports, No. 10
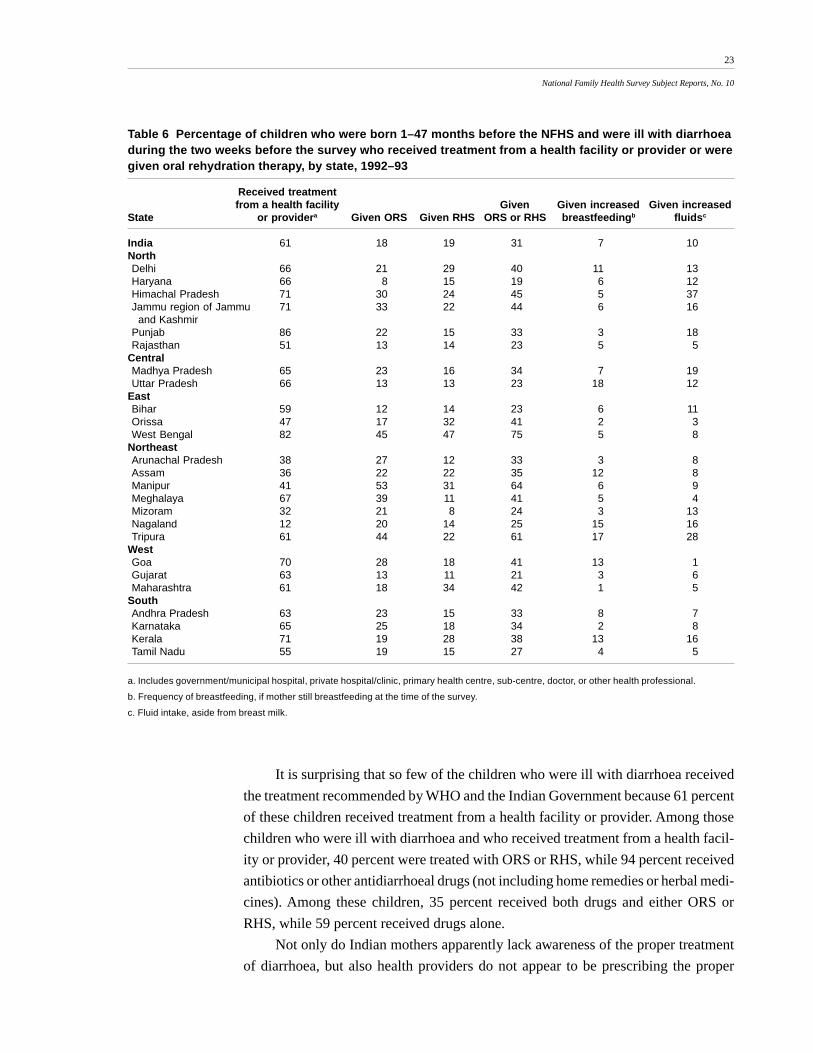
It is surprising that so few of the children who were ill with diarrhoea received
the treatment recommended by WHO and the Indian Government because 61 percent
of these children received treatment from a health facility or provider. Among those
children who were ill with diarrhoea and who received treatment from a health facil-
ity or provider, 40 percent were treated with ORS or RHS, while 94 percent received
antibiotics or other antidiarrhoeal drugs (not including home remedies or herbal medi-
cines). Among these children, 35 percent received both drugs and either ORS or
RHS, while 59 percent received drugs alone.
Not only do Indian mothers apparently lack awareness of the proper treatment
of diarrhoea, but also health providers do not appear to be prescribing the proper
Table 6 Percentage of children who were born 1–47 months before the NFHS and were ill with diarrhoeaduring the two weeks before the survey who received treatment from a health facility or provider or weregiven oral rehydration therapy, by state, 1992–93
Received treatmentfrom a health facility Given Given increased Given increased
State or providera Given ORS Given RHS ORS or RHS breastfeedingb fluidsc
a. Includes government/municipal hospital, private hospital/clinic, primary health centre, sub-centre, doctor, or other health professional.
b. Frequency of breastfeeding, if mother still breastfeeding at the time of the survey.
c. Fluid intake, aside from breast milk.
24
National Family Health Survey Subject Reports, No. 10
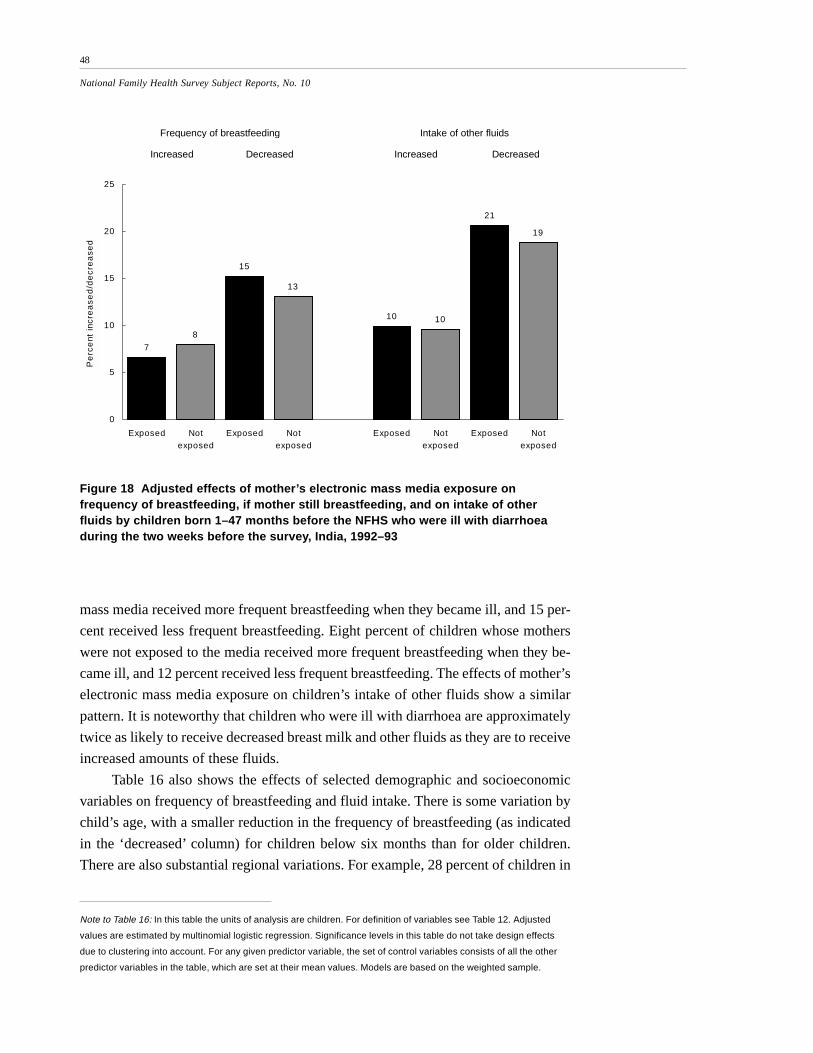
Figure 7 Change in frequency of breastfeeding, if mother still breastfeeding, and inintake of other fluids among children born 1–47 months before the NFHS who wereill with diarrhoea during the two weeks before the survey, India, 1992–93
7
14
10
20
0
5
10
15
20
25
Increased Decreased Increased Decreased
Pe
rce
nt in
cre
ase
d/d
ecr
ea
sed
Frequency of breastfeeding Fluid intake
Figure 8 Change in frequency of breastfeeding, if mother still breastfeeding, and inintake of other fluids among children born 1–47 months before the NFHS who wereill with diarrhoea during the two weeks before the survey and who were treated withORS or RHS, India, 1992–93
8
18
14
25
0
5
10
15
20
25
30
Increased Decreased Increased Decreased
Pe
rce
nt in
cre
ase
d/d
ecr
ea
sed
Frequency of breastfeeding Fluid intake
25
National Family Health Survey Subject Reports, No. 10
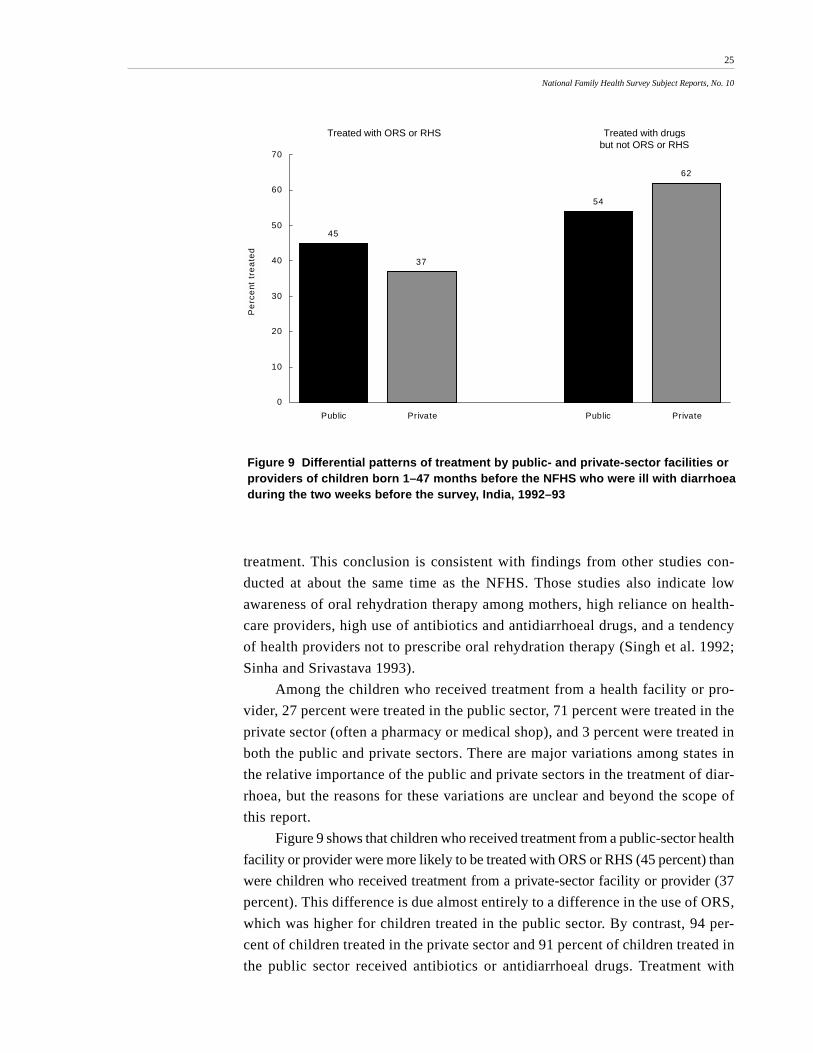
Figure 9 Differential patterns of treatment by public- and private-sector facilities orproviders of children born 1–47 months before the NFHS who were ill with diarrhoeaduring the two weeks before the survey, India, 1992–93
45
37
54
62
0
10
20
30
40
50
60
70
Public Private Public Private
Pe
rce
nt t
rea
ted
Treated with ORS or RHS Treated with drugsbut not ORS or RHS
treatment. This conclusion is consistent with findings from other studies con-
ducted at about the same time as the NFHS. Those studies also indicate low
awareness of oral rehydration therapy among mothers, high reliance on health-
care providers, high use of antibiotics and antidiarrhoeal drugs, and a tendency
of health providers not to prescribe oral rehydration therapy (Singh et al. 1992;
Sinha and Srivastava 1993).
Among the children who received treatment from a health facility or pro-
vider, 27 percent were treated in the public sector, 71 percent were treated in the
private sector (often a pharmacy or medical shop), and 3 percent were treated in
both the public and private sectors. There are major variations among states in
the relative importance of the public and private sectors in the treatment of diar-
rhoea, but the reasons for these variations are unclear and beyond the scope of
this report.
Figure 9 shows that children who received treatment from a public-sector health
facility or provider were more likely to be treated with ORS or RHS (45 percent) than
were children who received treatment from a private-sector facility or provider (37
percent). This difference is due almost entirely to a difference in the use of ORS,
which was higher for children treated in the public sector. By contrast, 94 per-
cent of children treated in the private sector and 91 percent of children treated in
the public sector received antibiotics or antidiarrhoeal drugs. Treatment with
26
National Family Health Survey Subject Reports, No. 10
drugs alone, without ORS or RHS, was somewhat higher for children treated in
the private sector (62 percent) than for children treated in the public sector (54
percent).
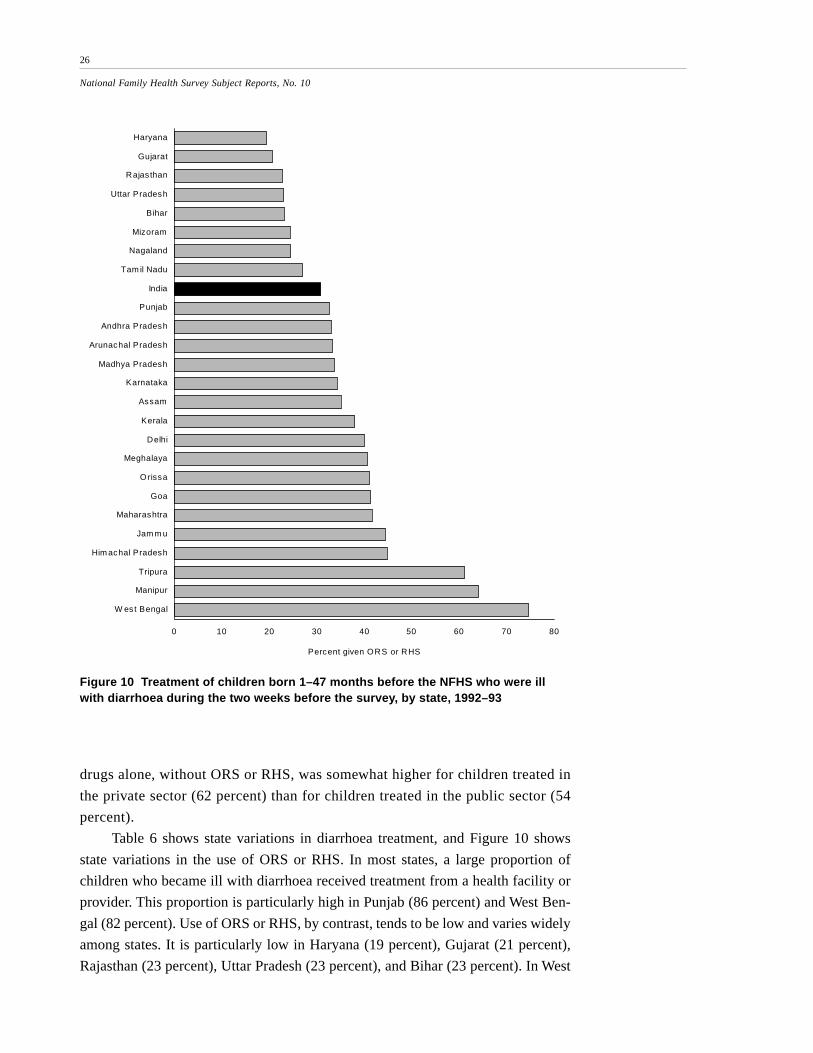
Table 6 shows state variations in diarrhoea treatment, and Figure 10 shows
state variations in the use of ORS or RHS. In most states, a large proportion of
children who became ill with diarrhoea received treatment from a health facility or
provider. This proportion is particularly high in Punjab (86 percent) and West Ben-
gal (82 percent). Use of ORS or RHS, by contrast, tends to be low and varies widely
among states. It is particularly low in Haryana (19 percent), Gujarat (21 percent),
Rajasthan (23 percent), Uttar Pradesh (23 percent), and Bihar (23 percent). In West
0 10 20 30 40 50 60 70 80
Haryana
Gujarat
Rajas than
Uttar Pradesh
Bihar
Mizoram
Nagaland
Tam il Nadu
India
Punjab
Andhra Pradesh
Arunachal Pradesh
Madhya Pradesh
Karnataka
Assam
Kerala
Delhi
Meghalaya
O rissa
Goa
Maharashtra
Jam m u
Him achal Pradesh
Tripura
Manipur
W est Bengal
Percent given ORS or RHS
Figure 10 Treatment of children born 1–47 months before the NFHS who were illwith diarrhoea during the two weeks before the survey, by state, 1992–93
27
National Family Health Survey Subject Reports, No. 10
Bengal, by contrast, 75 percent of children who were ill with diarrhoea received
ORS or RHS. (The total number of diarrhoea cases in West Bengal is only 51, how-
ever, so caution must be exercised when interpreting these results.) The percentages
of children who received more frequent breastfeeding and increased fluids are low in
all states, with some variation.
EFFECTS OF MEDIA EXPOSURE ON MOTHERS’ KNOWLEDGEAND EVER-USE OF ORS PACKETS
A multivariate analysis shows the effects of mass media exposure on awareness and
ever-use of ORS packets. The analysis focuses on women who gave birth during the
four years before the NFHS, incorporating a number of controls for demographic and
socioeconomic background variables.
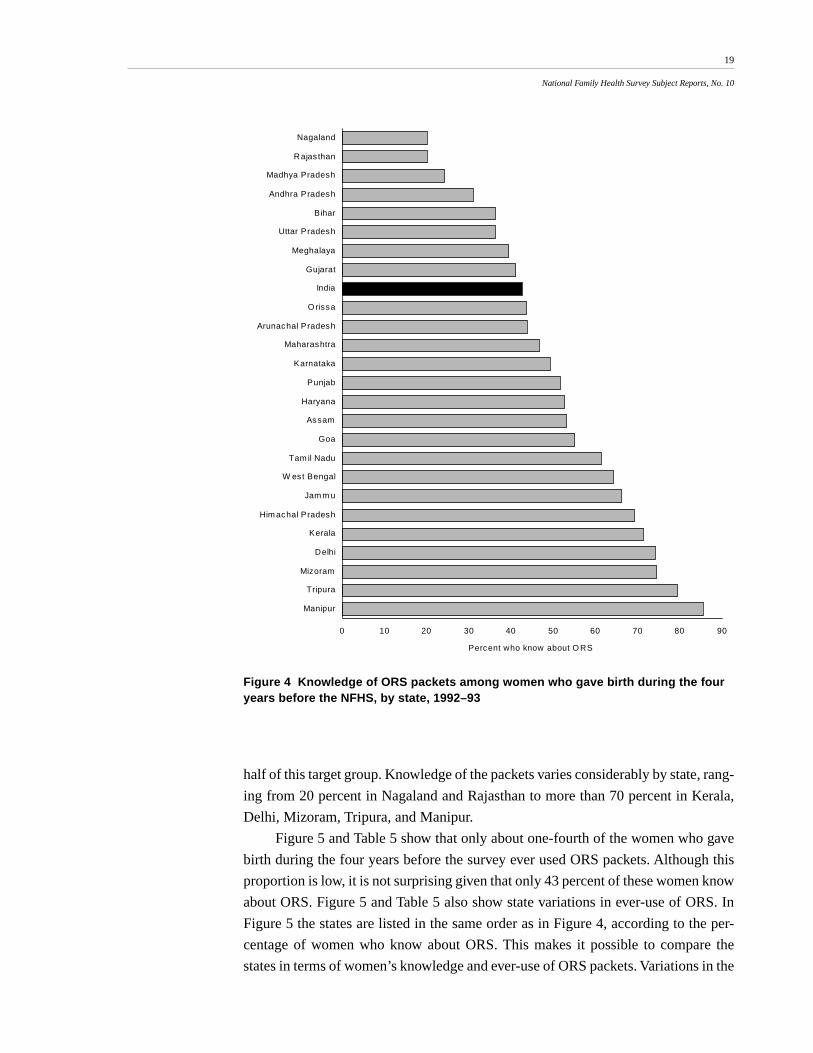
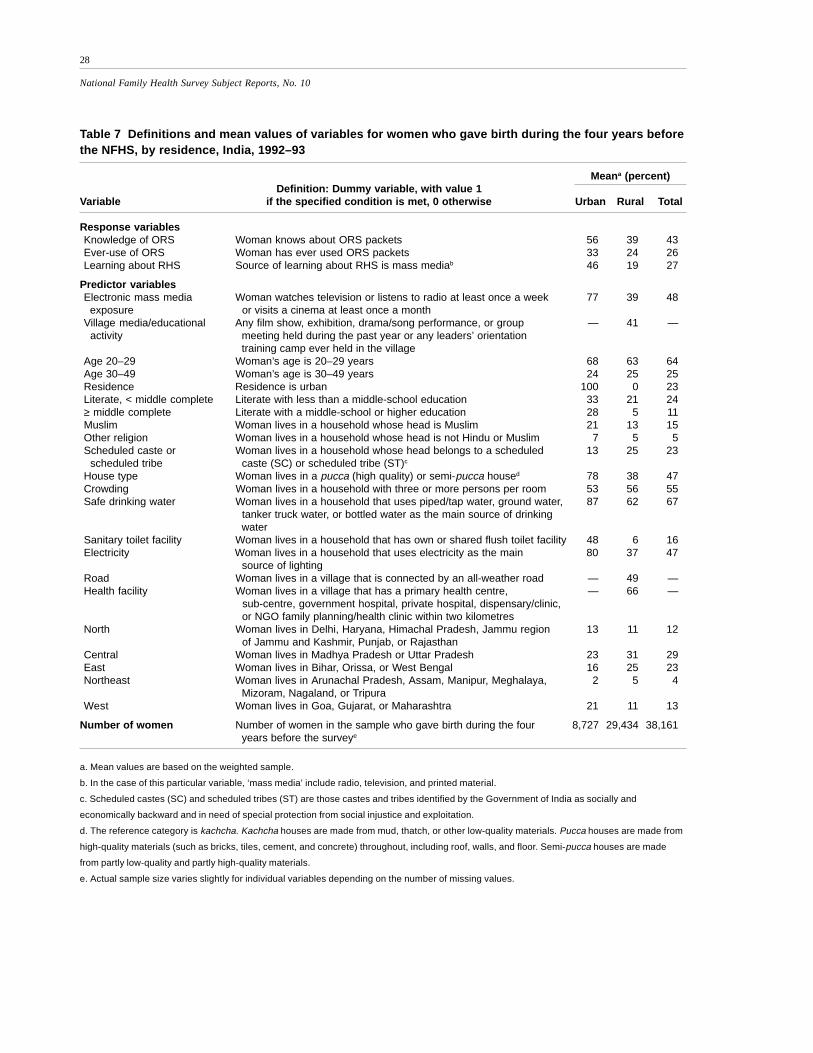
Table 7 gives definitions of variables and their mean values. In India as a whole,
43 percent of women who gave birth during the four years before the NFHS know
about ORS packets, and 26 percent have ever used them. Forty-eight percent are
regularly exposed to at least one of the electronic mass media (radio, television, or
cinema). Of those who lived in rural areas, 41 percent live in villages that have held at
least one village-level mass media activity or other educational activity related to
health and family welfare.
Sixty-four percent of these women are in their twenties. More than three-quar-
ters reside in rural areas, and about two-thirds are illiterate. Eighty percent are Hin-
dus, and 23 percent belong to scheduled castes or scheduled tribes. Slightly more
than half live in kachcha houses, and similar proportions live in households without
electricity and in households with more than three persons per room. About two-
thirds have access to safe drinking water, but only 16 percent have access to a sanitary
toilet facility. There are sharp urban/rural differences in the mean values of most of
these variables. In rural areas, about one-half of these women live in villages con-
nected to the outside by an all-weather road, and about two-thirds have access to a
health facility within two kilometres of the village.
Knowledge of ORS packets
Figure 11 and Table 8 show the effects of electronic mass media exposure on knowl-
edge of ORS packets among women who gave birth during the four years before the
NFHS. Unadjusted and adjusted results are derived by logistic regression. The ad-
justed results incorporate controls for age, urban/rural residence, education, religion,
caste/tribe, house type, crowding, access to safe drinking water, access to a sanitary
toilet facility, availability of household electricity, and geographic region. The unad-
justed results do not incorporate any controls.
28
National Family Health Survey Subject Reports, No. 10
Table 7 Definitions and mean values of variables for women who gave birth during the four years beforethe NFHS, by residence, India, 1992–93
Meana (percent)Definition: Dummy variable, with value 1
Variable if the specified condition is met, 0 otherwise Urban Rural Total
Response variablesKnowledge of ORS Woman knows about ORS packets 56 39 43Ever-use of ORS Woman has ever used ORS packets 33 24 26Learning about RHS Source of learning about RHS is mass mediab 46 19 27
Predictor variablesElectronic mass media Woman watches television or listens to radio at least once a week 77 39 48 exposure or visits a cinema at least once a monthVillage media/educational Any film show, exhibition, drama/song performance, or group — 41 — activity meeting held during the past year or any leaders’ orientation
training camp ever held in the villageAge 20–29 Woman’s age is 20–29 years 68 63 64Age 30–49 Woman’s age is 30–49 years 24 25 25Residence Residence is urban 100 0 23Literate, < middle complete Literate with less than a middle-school education 33 21 24≥ middle complete Literate with a middle-school or higher education 28 5 11Muslim Woman lives in a household whose head is Muslim 21 13 15Other religion Woman lives in a household whose head is not Hindu or Muslim 7 5 5Scheduled caste or Woman lives in a household whose head belongs to a scheduled 13 25 23 scheduled tribe caste (SC) or scheduled tribe (ST)c
House type Woman lives in a pucca (high quality) or semi-pucca housed 78 38 47Crowding Woman lives in a household with three or more persons per room 53 56 55Safe drinking water Woman lives in a household that uses piped/tap water, ground water, 87 62 67
tanker truck water, or bottled water as the main source of drinking water
Sanitary toilet facility Woman lives in a household that has own or shared flush toilet facility 48 6 16Electricity Woman lives in a household that uses electricity as the main 80 37 47
source of lightingRoad Woman lives in a village that is connected by an all-weather road — 49 —Health facility Woman lives in a village that has a primary health centre, — 66 —
sub-centre, government hospital, private hospital, dispensary/clinic, or NGO family planning/health clinic within two kilometres
North Woman lives in Delhi, Haryana, Himachal Pradesh, Jammu region 13 11 12 of Jammu and Kashmir, Punjab, or Rajasthan
Central Woman lives in Madhya Pradesh or Uttar Pradesh 23 31 29East Woman lives in Bihar, Orissa, or West Bengal 16 25 23Northeast Woman lives in Arunachal Pradesh, Assam, Manipur, Meghalaya, 2 5 4
Mizoram, Nagaland, or TripuraWest Woman lives in Goa, Gujarat, or Maharashtra 21 11 13
Number of women Number of women in the sample who gave birth during the four 8,727 29,434 38,161 years before the surveye
a. Mean values are based on the weighted sample.
b. In the case of this particular variable, ‘mass media’ include radio, television, and printed material.
c. Scheduled castes (SC) and scheduled tribes (ST) are those castes and tribes identified by the Government of India as socially and
economically backward and in need of special protection from social injustice and exploitation.
d. The reference category is kachcha. Kachcha houses are made from mud, thatch, or other low-quality materials. Pucca houses are made from
high-quality materials (such as bricks, tiles, cement, and concrete) throughout, including roof, walls, and floor. Semi-pucca houses are made
from partly low-quality and partly high-quality materials.
e. Actual sample size varies slightly for individual variables depending on the number of missing values.
29
National Family Health Survey Subject Reports, No. 10
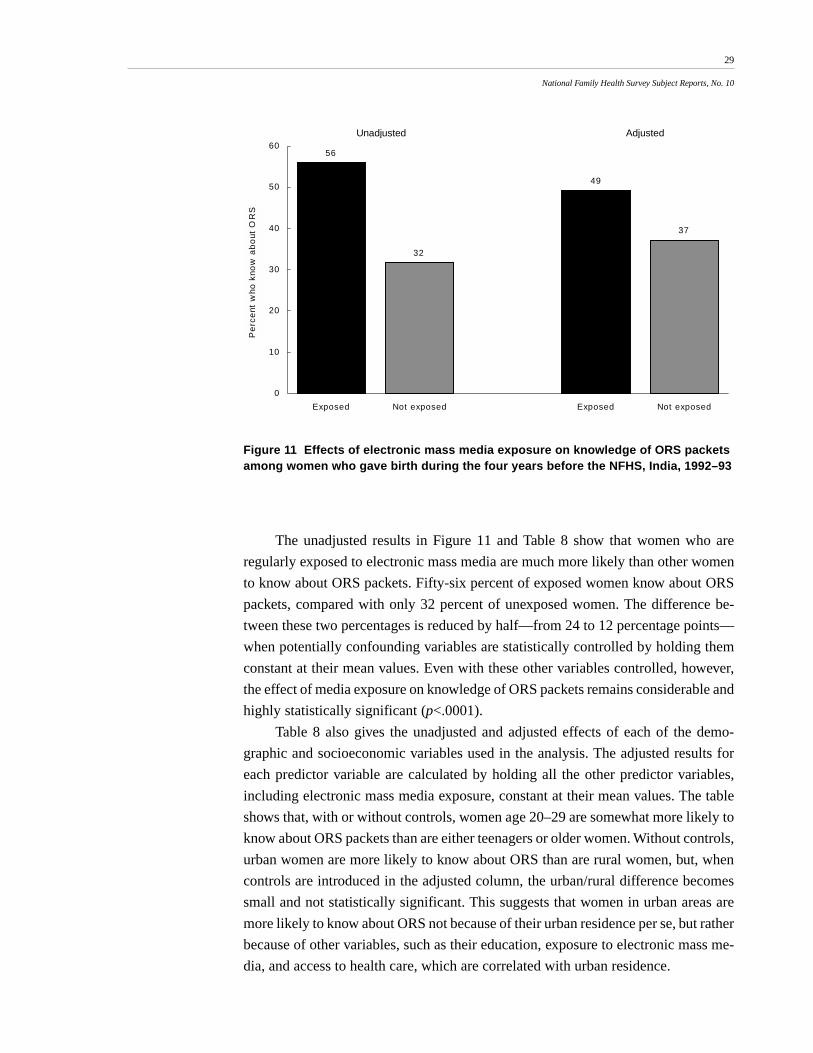
Figure 11 Effects of electronic mass media exposure on knowledge of ORS packetsamong women who gave birth during the four years before the NFHS, India, 1992–93
The unadjusted results in Figure 11 and Table 8 show that women who are
regularly exposed to electronic mass media are much more likely than other women
to know about ORS packets. Fifty-six percent of exposed women know about ORS
packets, compared with only 32 percent of unexposed women. The difference be-
tween these two percentages is reduced by half—from 24 to 12 percentage points—
when potentially confounding variables are statistically controlled by holding them
constant at their mean values. Even with these other variables controlled, however,
the effect of media exposure on knowledge of ORS packets remains considerable and
highly statistically significant (p<.0001).
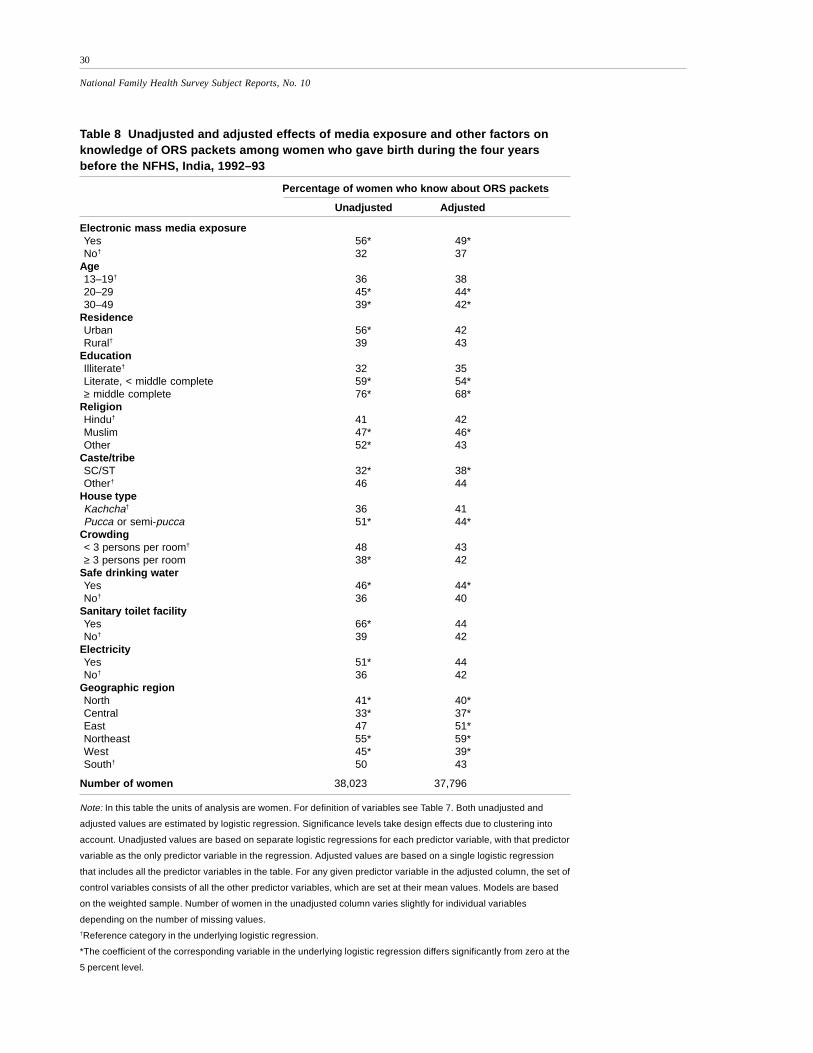
Table 8 also gives the unadjusted and adjusted effects of each of the demo-
graphic and socioeconomic variables used in the analysis. The adjusted results for
each predictor variable are calculated by holding all the other predictor variables,
including electronic mass media exposure, constant at their mean values. The table
shows that, with or without controls, women age 20–29 are somewhat more likely to
know about ORS packets than are either teenagers or older women. Without controls,
urban women are more likely to know about ORS than are rural women, but, when
controls are introduced in the adjusted column, the urban/rural difference becomes
small and not statistically significant. This suggests that women in urban areas are
more likely to know about ORS not because of their urban residence per se, but rather
because of other variables, such as their education, exposure to electronic mass me-
dia, and access to health care, which are correlated with urban residence.
56
32
49
37
0
10
20
30
40
50
60
Exposed Not exposed Exposed Not exposed
Pe
rce
nt w
ho k
now
ab
out
OR
S
Unadjusted Adjusted
30
National Family Health Survey Subject Reports, No. 10
Table 8 Unadjusted and adjusted effects of media exposure and other factors onknowledge of ORS packets among women who gave birth during the four yearsbefore the NFHS, India, 1992–93
Percentage of women who know about ORS packets
Unadjusted Adjusted
Electronic mass media exposureYes 56* 49*No† 32 37
Note: In this table the units of analysis are women. For definition of variables see Table 7. Both unadjusted and
adjusted values are estimated by logistic regression. Significance levels take design effects due to clustering into
account. Unadjusted values are based on separate logistic regressions for each predictor variable, with that predictor
variable as the only predictor variable in the regression. Adjusted values are based on a single logistic regression
that includes all the predictor variables in the table. For any given predictor variable in the adjusted column, the set of
control variables consists of all the other predictor variables, which are set at their mean values. Models are based
on the weighted sample. Number of women in the unadjusted column varies slightly for individual variables
depending on the number of missing values.†Reference category in the underlying logistic regression.
*The coefficient of the corresponding variable in the underlying logistic regression differs significantly from zero at the
5 percent level.
31
National Family Health Survey Subject Reports, No. 10
As expected, women’s education has a large and highly statistically significant
effect on knowledge of ORS. Even after controlling for potentially confounding
variables, women who have completed middle school or higher education are almost
twice as likely as illiterate women to know about ORS packets. Muslim women are
somewhat more likely to know about ORS than are either Hindu women or women
belonging to other religious groups. Women belonging to scheduled castes or sched-
uled tribes are considerably less likely to know about ORS than are other women,
perhaps partly because they have relatively poor access to health care. Women living
in the eastern and northeastern regions are more likely to know about ORS packets
than are women living in other regions of India.
Women who live in pucca or semi-pucca houses, in households that are not
crowded, or in households that have electricity, access to safe drinking water, or ac-
cess to a sanitary toilet facility are more likely than other women to know about ORS
packets. When other variables are statistically controlled, however, the effect of each
of these variables is greatly reduced, with only the effects of house type and access to
safe drinking water remaining statistically significant.
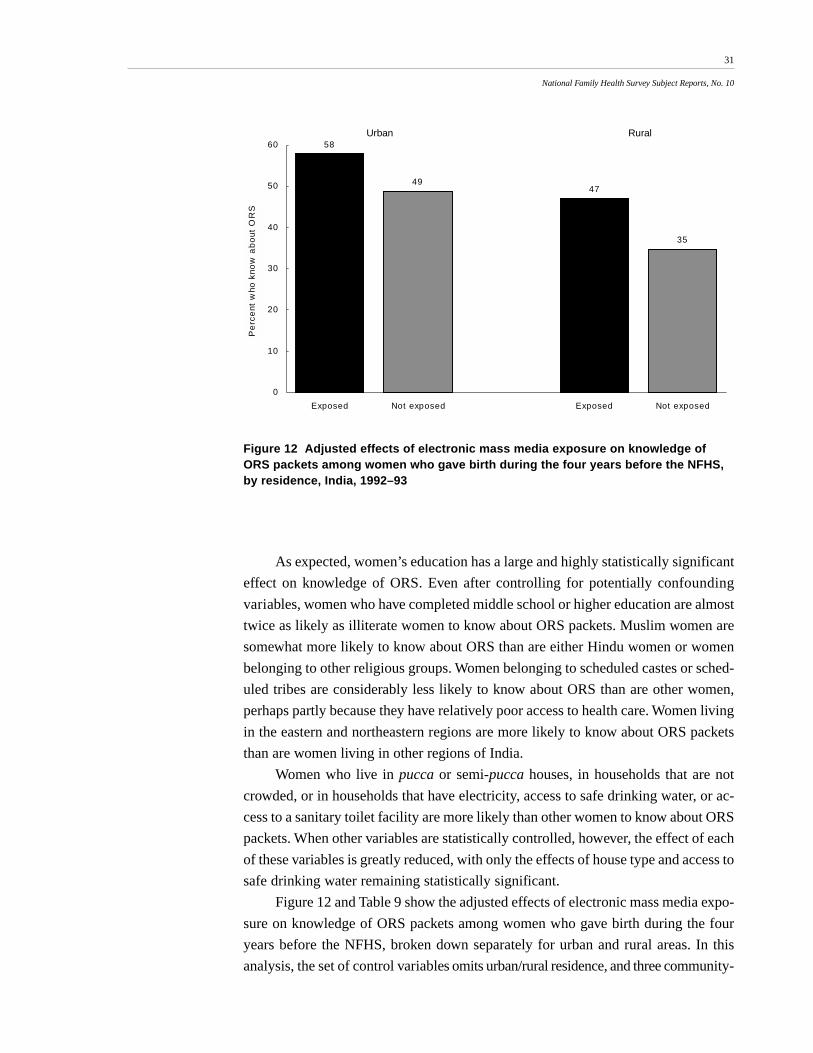
Figure 12 and Table 9 show the adjusted effects of electronic mass media expo-
sure on knowledge of ORS packets among women who gave birth during the four
years before the NFHS, broken down separately for urban and rural areas. In this
analysis, the set of control variables omits urban/rural residence, and three community-
Figure 12 Adjusted effects of electronic mass media exposure on knowledge ofORS packets among women who gave birth during the four years before the NFHS,by residence, India, 1992–93
58
4947
35
0
10
20
30
40
50
60
Exposed Not exposed Exposed Not exposed
Pe
rce
nt w
ho k
now
ab
out
OR
S
Urban Rural
32
National Family Health Survey Subject Reports, No. 10
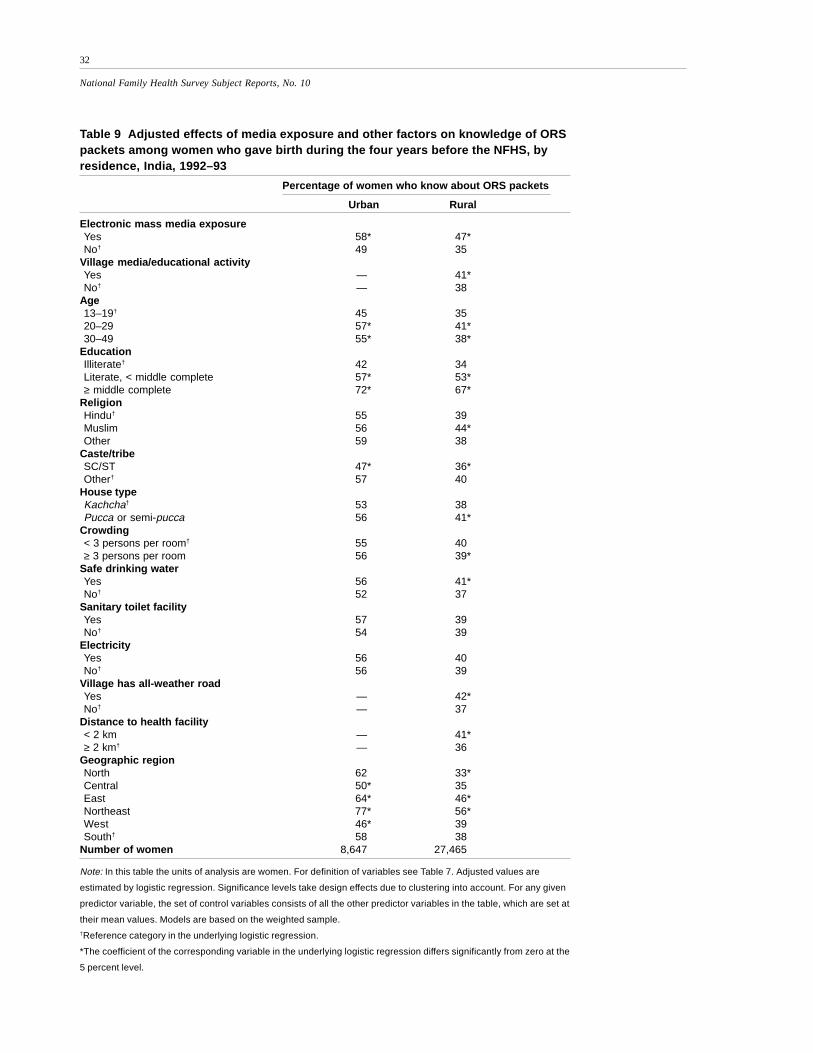
Table 9 Adjusted effects of media exposure and other factors on knowledge of ORSpackets among women who gave birth during the four years before the NFHS, byresidence, India, 1992–93
Percentage of women who know about ORS packets
Urban Rural
Electronic mass media exposureYes 58* 47*No† 49 35
Village media/educational activityYes — 41*No† — 38
Note: In this table the units of analysis are women. For definition of variables see Table 7. Adjusted values are
estimated by logistic regression. Significance levels take design effects due to clustering into account. For any given
predictor variable, the set of control variables consists of all the other predictor variables in the table, which are set at
their mean values. Models are based on the weighted sample.†Reference category in the underlying logistic regression.
*The coefficient of the corresponding variable in the underlying logistic regression differs significantly from zero at the
5 percent level.
33
National Family Health Survey Subject Reports, No. 10
level variables are added for women in rural areas. Results show that the adjusted
effect of electronic mass media exposure is large and highly statistically significant
in both urban and rural areas. Although urban women are more likely than rural
women to know about ORS packets (see Tables 7 and 8), the effect of electronic mass
media exposure on knowledge of ORS is considerably greater in rural areas. The
electronic mass media may play a less important role in teaching urban women about
ORS packets because urban women have more access to information on health
care than do rural women and are thus more likely to learn about ORS from other
sources.
Table 9 includes three additional predictor variables specific to rural areas—
occurrence of at least one village-level mass-media or educational activity, availabil-
ity of an all-weather road, and distance to the nearest health facility. Even when the
effects of general exposure to electronic mass media and various demographic and
socioeconomic factors are controlled, village-level mass media and educational ac-
tivities have a small but statistically significant effect on knowledge of ORS packets.
Availability of an all-weather road and availability of a health facility within two
kilometres of the village also have statistically significant effects.
Ever-use of ORS packets
Figure 13 and Table 10 show unadjusted and adjusted effects of exposure to elec-
tronic mass media on ever-use of ORS packets. Again, the analysis focuses on women
who gave birth during the four years before the NFHS. In India as a whole, ever-use
of ORS packets is considerably higher among women who have been regularly ex-
posed to mass media than among women who have not been exposed. Controlling
for the other demographic and socioeconomic variables reduces the difference be-
tween exposed and unexposed women by half (from 14 to 7 percentage points), but
this difference is still considerable and highly statistically significant (p<.0001).
Table 10 also shows the unadjusted and adjusted effects of the demographic and
socioeconomic variables included in the analysis. With or without controls, women
age 20–29 are somewhat more likely to have ever used ORS packets than are either
teenagers or older women. Although the unadjusted percentage of women who have
ever used ORS is considerably higher in urban areas than in rural areas, the adjusted
percentages are virtually the same. Women’s education, by contrast, has a large and
highly statistically significant effect on ever-use of ORS packets that persists after
adjusting for other variables. Women who have completed middle school or higher
education are somewhat more than twice as likely as illiterate women to have ever
used ORS packets.
Even with other variables controlled, Muslim women are more likely to have
ever used ORS packets than are Hindu women or women belonging to other religions.
34
National Family Health Survey Subject Reports, No. 10
This result is somewhat surprising, inasmuch as Muslim women generally tend to
make less use of health services than do other women in India (IIPS 1995). This
unexpected result may occur because a mother can treat her child’s diarrhoea with
ORS packets without leaving her home to visit a health provider, in keeping with
Muslim norms about the seclusion of women.
Women who belong to scheduled castes or scheduled tribes are less likely than
other women to have ever used ORS packets, even after controlling for other vari-
ables. This is consistent with the finding that women who belong to these disadvan-
taged groups are less likely than other women to know about ORS, reflecting their
relatively poor access to information and health services. Women who live in pucca
or semi-pucca houses or in households with access to safe drinking water are more
likely than other women to have ever used ORS. Women in the east and northeast are
more likely than women in other regions to have ever used ORS. All these finding are
consistent with results for knowledge of ORS.
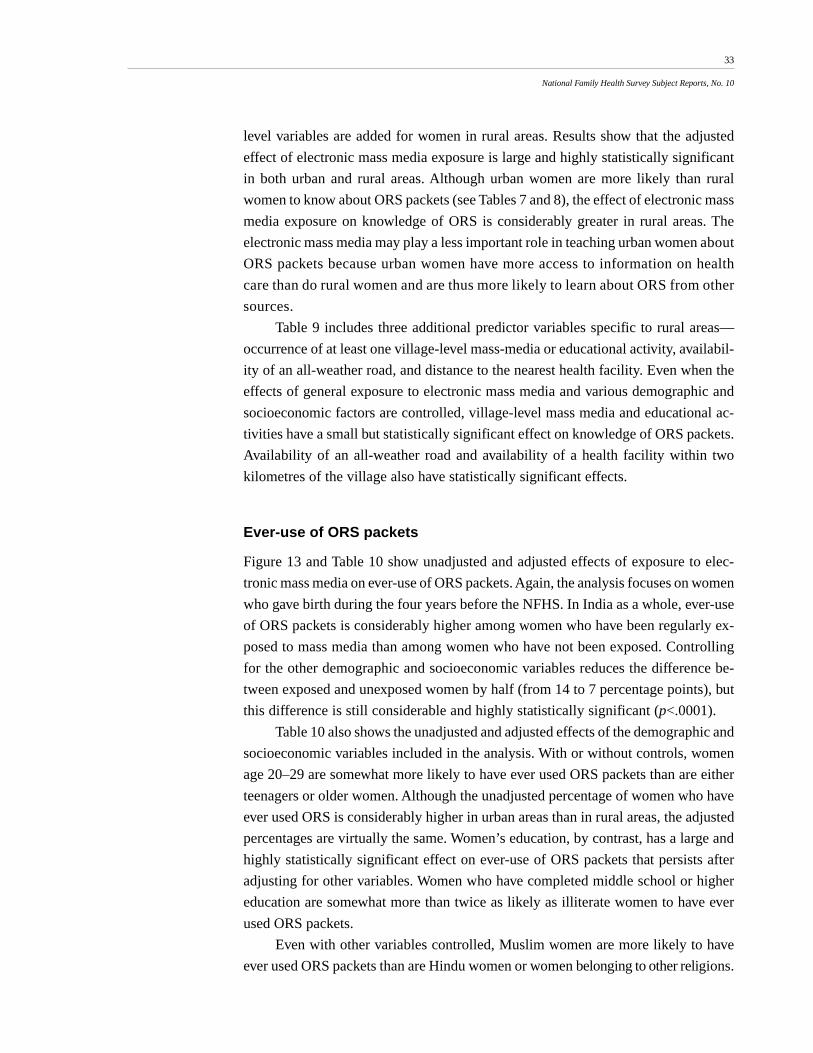
Figure 14 and Table 11 show the effects of electronic mass media exposure on
ever-use of ORS packets separately for urban and rural areas. As with knowledge of
ORS, the adjusted effect of electronic mass media exposure on ever-use of ORS packets
is small and not statistically significant in urban areas, but it is large and highly
statistically significant in rural areas. The smaller effect in urban areas may occur
partly because urban women have more sources of information than do rural
women and are therefore more likely to learn about ORS packets from sources
other than radio, television, and cinema. Urban women also have greater access
Figure 13 Effects of electronic mass media exposure on ever-use of ORS packetsamong women who gave birth during the four years before the NFHS, India, 1992–93
34
20
30
23
0
10
20
30
40
Exposed Not exposed Exposed Not exposed
Pe
rce
nt w
ho e
ver
use
d O
RS
Unadjusted Adjusted
35
National Family Health Survey Subject Reports, No. 10
Table 10 Unadjusted and adjusted effects of media exposure and other factors onever-use of ORS packets by women who gave birth during the four years before theNFHS, India, 1992–93
Percentage of women who have ever used ORS packets
Unadjusted Adjusted
Electronic mass media exposureYes 34* 30*No† 20 23
Note: In this table the units of analysis are women. For definition of variables see Table 7. Both unadjusted and
adjusted values are estimated by logistic regression. Significance levels take design effects due to clustering into
account. Unadjusted values are based on separate logistic regressions for each predictor variable, with that predictor
variable as the only predictor variable in the regression. Adjusted values are based on a single logistic regression
that includes all the predictor variables in the table. For any given predictor variable in the adjusted column, the set of
control variables consists of all the other predictor variables, which are set at their mean values. Models are based
on the weighted sample. Number of women in the unadjusted column varies slightly for individual variables
depending on the number of missing values.†Reference category in the underlying logistic regression.
*The coefficient of the corresponding variable in the underlying logistic regression differs significantly from zero at the
5 percent level.
36
National Family Health Survey Subject Reports, No. 10
Figure 14 Adjusted effects of electronic mass media exposure on ever-use of ORSpackets among women who gave birth during the four years before the NFHS, byresidence, India, 1992–93
to health facilities and providers who can provide ORS packets to children who
are ill with diarrhoea.
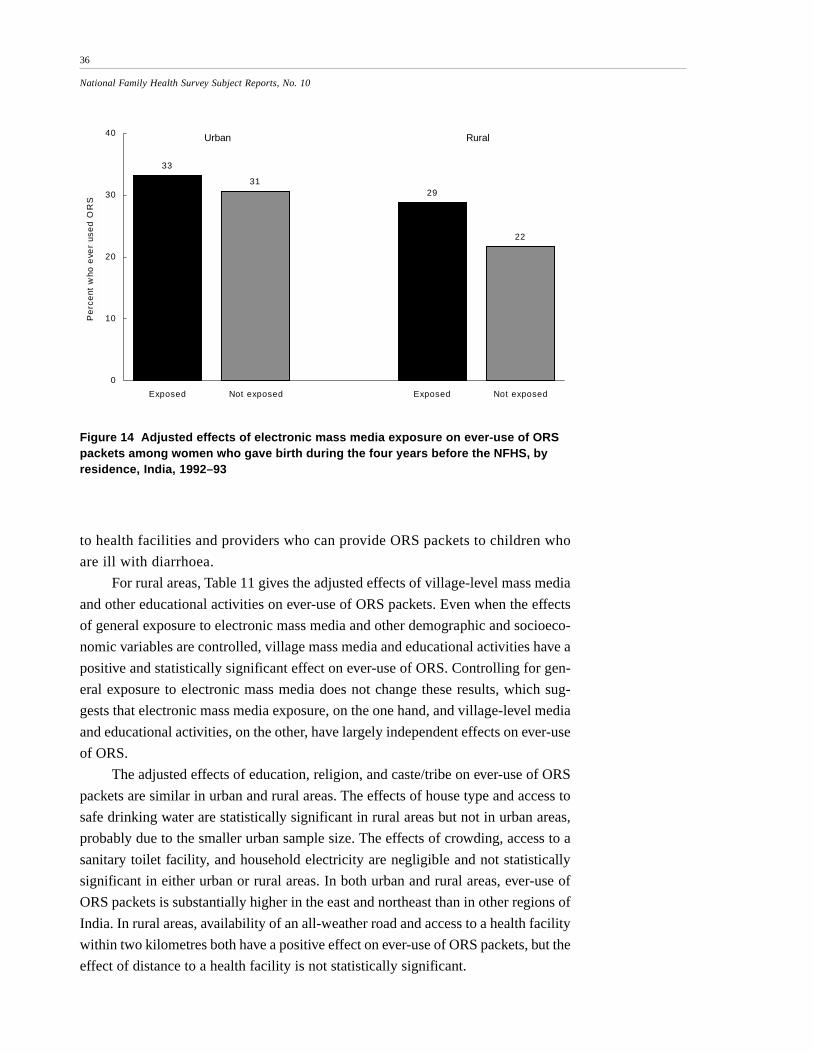
For rural areas, Table 11 gives the adjusted effects of village-level mass media
and other educational activities on ever-use of ORS packets. Even when the effects
of general exposure to electronic mass media and other demographic and socioeco-
nomic variables are controlled, village mass media and educational activities have a
positive and statistically significant effect on ever-use of ORS. Controlling for gen-
eral exposure to electronic mass media does not change these results, which sug-
gests that electronic mass media exposure, on the one hand, and village-level media
and educational activities, on the other, have largely independent effects on ever-use
of ORS.
The adjusted effects of education, religion, and caste/tribe on ever-use of ORS
packets are similar in urban and rural areas. The effects of house type and access to
safe drinking water are statistically significant in rural areas but not in urban areas,
probably due to the smaller urban sample size. The effects of crowding, access to a
sanitary toilet facility, and household electricity are negligible and not statistically
significant in either urban or rural areas. In both urban and rural areas, ever-use of
ORS packets is substantially higher in the east and northeast than in other regions of
India. In rural areas, availability of an all-weather road and access to a health facility
within two kilometres both have a positive effect on ever-use of ORS packets, but the
effect of distance to a health facility is not statistically significant.
33
3129
22
0
10
20
30
40
Exposed Not exposed Exposed Not exposed
Pe
rce
nt w
ho e
ver
use
d O
RS
Urban Rural
37
National Family Health Survey Subject Reports, No. 10
Table 11 Adjusted effects of media exposure and other factors on ever-use of ORSpackets by women who gave birth during the four years before the NFHS, byresidence, India, 1992–93
Percentage of women who have ever used ORS packets
Urban Rural
Electronic mass media exposureYes 33 29*No† 31 22
Village media/educational activityYes — 26*No† — 23
Note: In this table the units of analysis are women. For definition of variables see Table 7. Adjusted values are
estimated by logistic regression. Significance levels take design effects due to clustering into account. For any given
predictor variable, the set of control variables consists of all the other predictor variables in the table, which are set at
their mean values. Models are based on the weighted sample.†Reference category in the underlying logistic regression.
*The coefficient of the corresponding variable in the underlying logistic regression differs significantly from zero at the
5 percent level.
38
National Family Health Survey Subject Reports, No. 10
EFFECTS OF MEDIA EXPOSURE ON TREATMENT WITH ORALREHYDRATION THERAPY
This section examines the effects of mother’s exposure to mass media on the use of
oral rehydration therapy to treat children born 1–47 months before the NFHS who
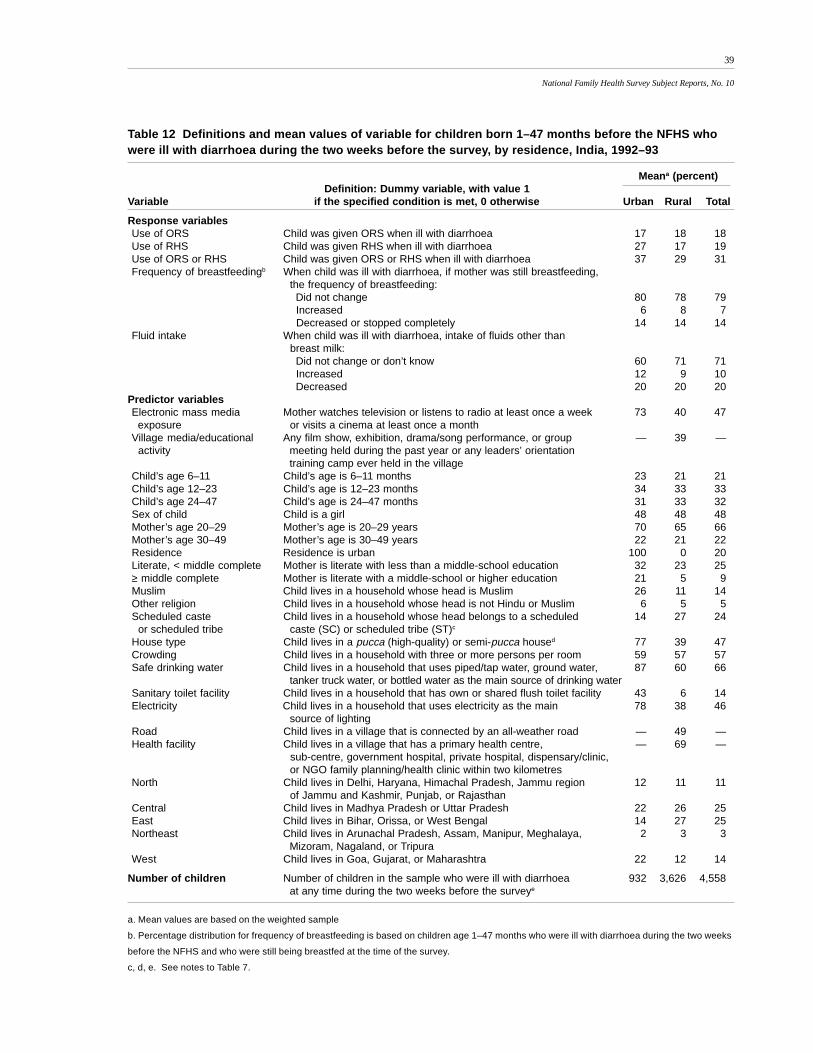
were ill with diarrhoea at any time during the two weeks before the survey. Table 12
presents definitions of variables and their mean values for these children, broken
down by urban/rural residence. Table 12 is similar to Table 7, except that in Table 12
children who had diarrhoea during the two weeks before the survey are the units of
analysis rather than women who gave birth during the four years before the survey.
Table 12 shows that 18 percent of children who were ill with diarrhoea during
the two weeks before the survey were treated with ORS, and 19 percent were treated
with RHS. Sixty-nine percent of these children did not receive either ORS or RHS.
Use of ORS is about the same in urban and rural areas, but use of RHS is consider-
ably higher in urban areas. Only 7 percent of the children who were still being breastfed
were breastfed more frequently when ill with diarrhoea, whereas 14 percent were
breastfed less frequently or not at all. Only 10 percent were given increased fluids
(aside from breast milk) when they became ill with diarrhoea, whereas 20 percent
were given decreased fluids. Changes in frequency of breastfeeding and in fluid in-
take are about the same in urban and rural areas.
Table 12 includes the same predictor variables as Table 7 plus child’s age and
gender. Mean values for most variables in Table 12, where children are the units of
analysis, tend to be about the same as in Table 7, where women are the units of analysis.
Treatment with ORS packets
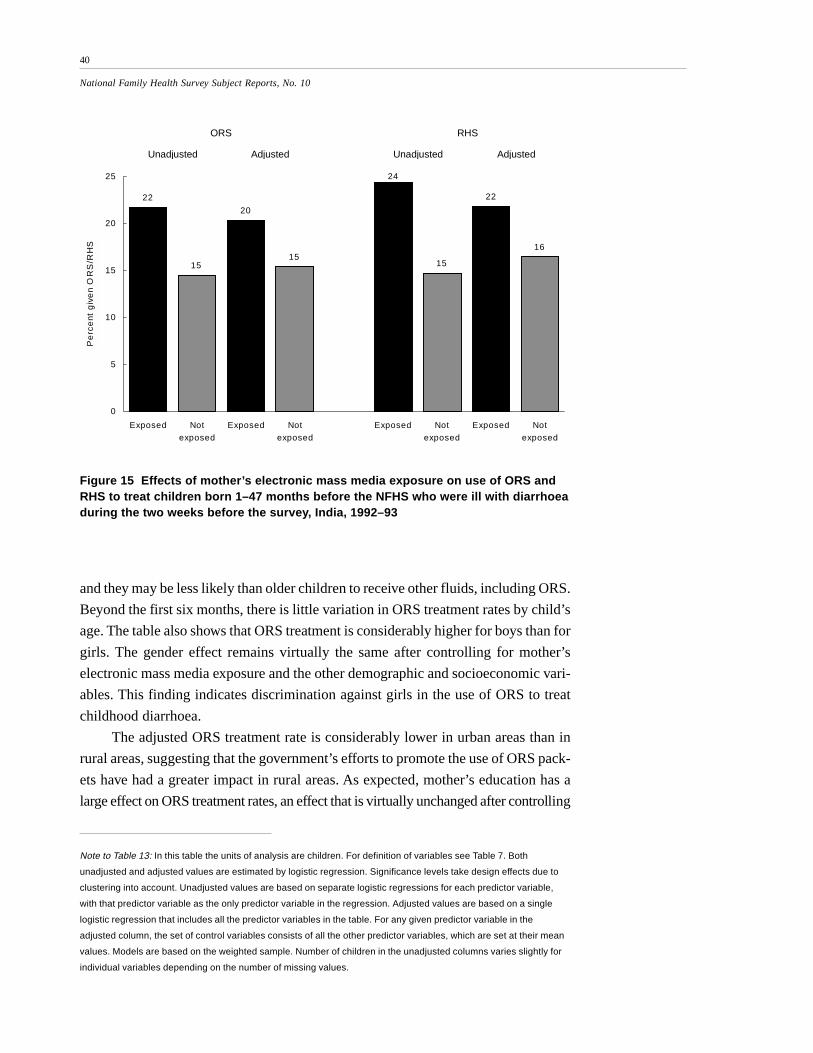
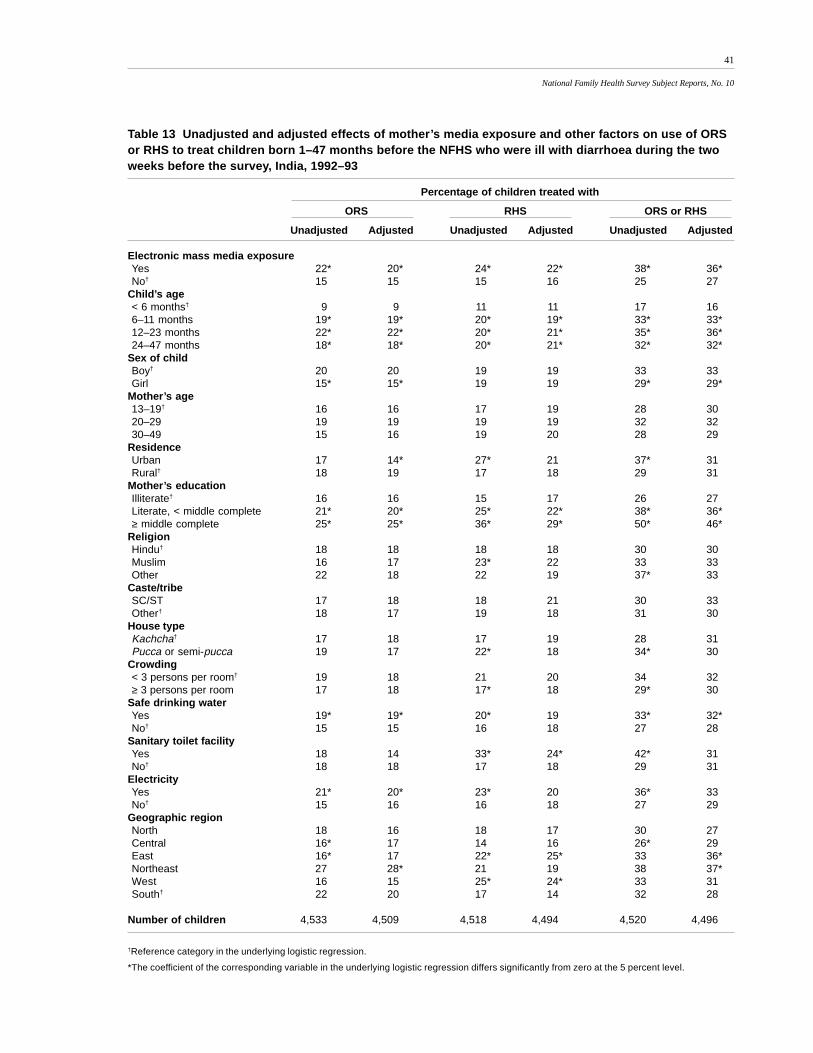
Figure 15 and Table 13 show unadjusted and adjusted rates of treatment with ORS
and RHS for children born 1–47 months before the NFHS who were ill with diar-
rhoea during the two weeks before the survey. Treatment rates are broken down by
mother’s exposure to electronic mass media and by other demographic and socioeco-
nomic variables. Results show that mother’s exposure to electronic mass media has a
large positive effect on the use of ORS. The unadjusted rate of ORS treatment is 22
percent for children whose mothers were exposed to mass media and 15 percent for
children whose mothers were not exposed. Controlling for the other demographic
and socioeconomic variables reduces the difference in treatment rates only slightly,
to 20 percent for children of mothers exposed to mass media and 15 percent for
children of mothers not exposed. The difference between the two adjusted rates is
highly statistically significant (p<.006).
Table 13 shows that the ORS treatment rate is much lower for children under six
months old. This might be because almost all children in this age range are breastfed,
39
National Family Health Survey Subject Reports, No. 10
Table 12 Definitions and mean values of variable for children born 1–47 months before the NFHS whowere ill with diarrhoea during the two weeks before the survey, by residence, India, 1992–93
Meana (percent)Definition: Dummy variable, with value 1
Variable if the specified condition is met, 0 otherwise Urban Rural Total
Response variablesUse of ORS Child was given ORS when ill with diarrhoea 17 18 18Use of RHS Child was given RHS when ill with diarrhoea 27 17 19Use of ORS or RHS Child was given ORS or RHS when ill with diarrhoea 37 29 31Frequency of breastfeedingb When child was ill with diarrhoea, if mother was still breastfeeding,
the frequency of breastfeeding: Did not change 80 78 79 Increased 6 8 7 Decreased or stopped completely 14 14 14
Fluid intake When child was ill with diarrhoea, intake of fluids other than breast milk: Did not change or don’t know 60 71 71 Increased 12 9 10 Decreased 20 20 20
Predictor variablesElectronic mass media Mother watches television or listens to radio at least once a week 73 40 47 exposure or visits a cinema at least once a monthVillage media/educational Any film show, exhibition, drama/song performance, or group — 39 — activity meeting held during the past year or any leaders’ orientation
training camp ever held in the villageChild’s age 6–11 Child’s age is 6–11 months 23 21 21Child’s age 12–23 Child’s age is 12–23 months 34 33 33Child’s age 24–47 Child’s age is 24–47 months 31 33 32Sex of child Child is a girl 48 48 48Mother’s age 20–29 Mother’s age is 20–29 years 70 65 66Mother’s age 30–49 Mother’s age is 30–49 years 22 21 22Residence Residence is urban 100 0 20Literate, < middle complete Mother is literate with less than a middle-school education 32 23 25≥ middle complete Mother is literate with a middle-school or higher education 21 5 9Muslim Child lives in a household whose head is Muslim 26 11 14Other religion Child lives in a household whose head is not Hindu or Muslim 6 5 5Scheduled caste Child lives in a household whose head belongs to a scheduled 14 27 24 or scheduled tribe caste (SC) or scheduled tribe (ST)c
House type Child lives in a pucca (high-quality) or semi-pucca housed 77 39 47Crowding Child lives in a household with three or more persons per room 59 57 57Safe drinking water Child lives in a household that uses piped/tap water, ground water, 87 60 66
tanker truck water, or bottled water as the main source of drinking waterSanitary toilet facility Child lives in a household that has own or shared flush toilet facility 43 6 14Electricity Child lives in a household that uses electricity as the main 78 38 46
source of lightingRoad Child lives in a village that is connected by an all-weather road — 49 —Health facility Child lives in a village that has a primary health centre, — 69 —
sub-centre, government hospital, private hospital, dispensary/clinic, or NGO family planning/health clinic within two kilometres
North Child lives in Delhi, Haryana, Himachal Pradesh, Jammu region 12 11 11 of Jammu and Kashmir, Punjab, or Rajasthan
Central Child lives in Madhya Pradesh or Uttar Pradesh 22 26 25East Child lives in Bihar, Orissa, or West Bengal 14 27 25Northeast Child lives in Arunachal Pradesh, Assam, Manipur, Meghalaya, 2 3 3
Mizoram, Nagaland, or TripuraWest Child lives in Goa, Gujarat, or Maharashtra 22 12 14
Number of children Number of children in the sample who were ill with diarrhoea 932 3,626 4,558 at any time during the two weeks before the surveye
a. Mean values are based on the weighted sample
b. Percentage distribution for frequency of breastfeeding is based on children age 1–47 months who were ill with diarrhoea during the two weeks
before the NFHS and who were still being breastfed at the time of the survey.
c, d, e. See notes to Table 7.
40
National Family Health Survey Subject Reports, No. 10
Figure 15 Effects of mother’s electronic mass media exposure on use of ORS andRHS to treat children born 1–47 months before the NFHS who were ill with diarrhoeaduring the two weeks before the survey, India, 1992–93
and they may be less likely than older children to receive other fluids, including ORS.
Beyond the first six months, there is little variation in ORS treatment rates by child’s
age. The table also shows that ORS treatment is considerably higher for boys than for
girls. The gender effect remains virtually the same after controlling for mother’s
electronic mass media exposure and the other demographic and socioeconomic vari-
ables. This finding indicates discrimination against girls in the use of ORS to treat
childhood diarrhoea.
The adjusted ORS treatment rate is considerably lower in urban areas than in
rural areas, suggesting that the government’s efforts to promote the use of ORS pack-
ets have had a greater impact in rural areas. As expected, mother’s education has a
large effect on ORS treatment rates, an effect that is virtually unchanged after controlling
Note to Table 13: In this table the units of analysis are children. For definition of variables see Table 7. Both
unadjusted and adjusted values are estimated by logistic regression. Significance levels take design effects due to
clustering into account. Unadjusted values are based on separate logistic regressions for each predictor variable,
with that predictor variable as the only predictor variable in the regression. Adjusted values are based on a single
logistic regression that includes all the predictor variables in the table. For any given predictor variable in the
adjusted column, the set of control variables consists of all the other predictor variables, which are set at their mean
values. Models are based on the weighted sample. Number of children in the unadjusted columns varies slightly for
individual variables depending on the number of missing values.
22
15
20
15
24
15
22
16
0
5
10
15
20
25
Exposed Notexposed
Exposed Notexposed
Exposed Notexposed
Exposed Notexposed
Pe
rce
nt g
ive
n O
RS
/RH
S
ORS RHS
Unadjusted Adjusted Unadjusted Adjusted
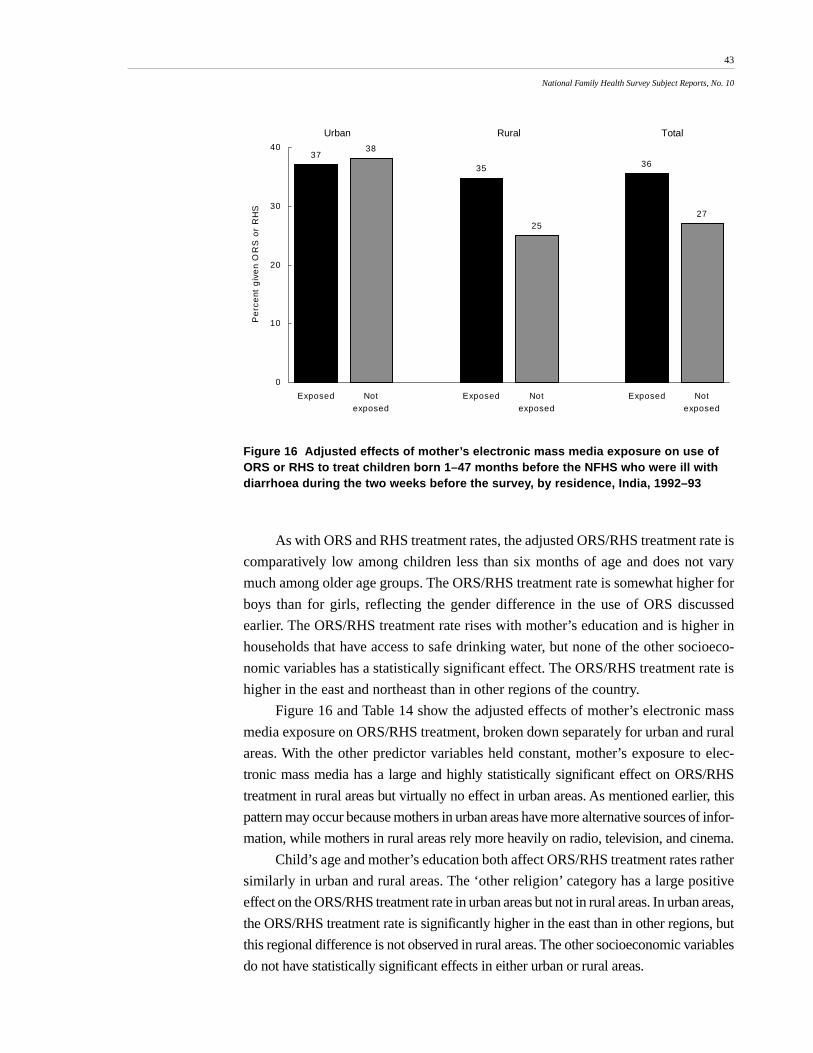
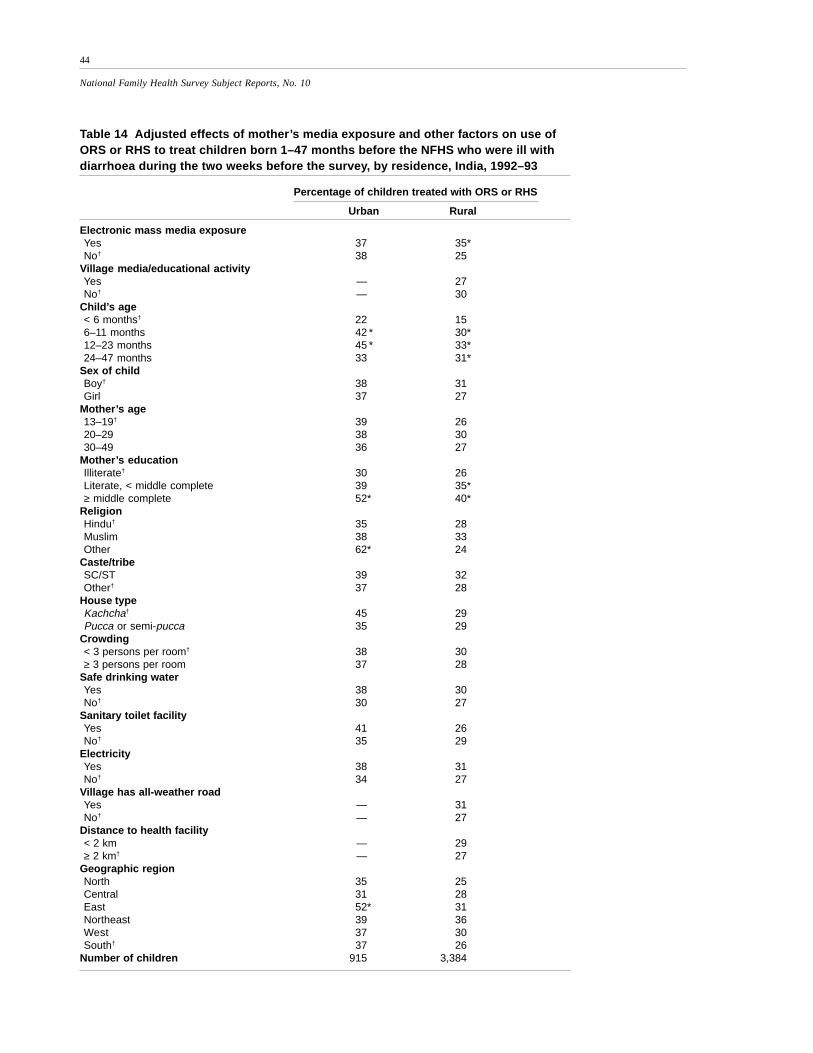
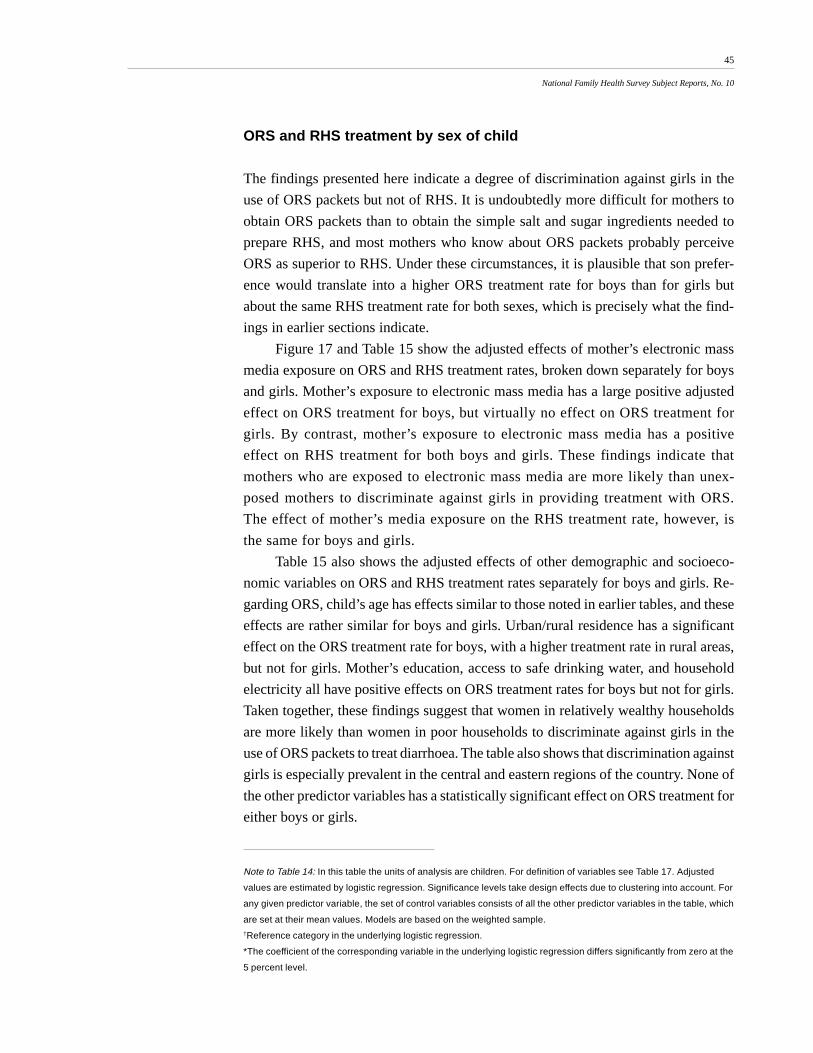
41
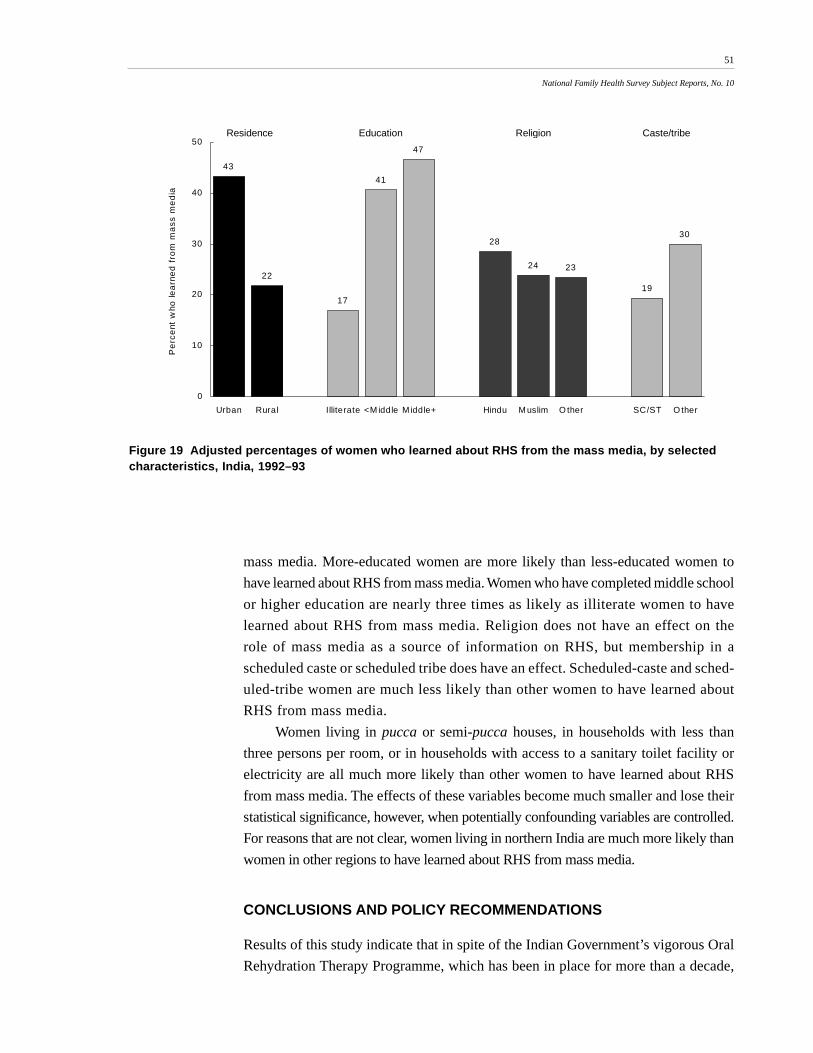
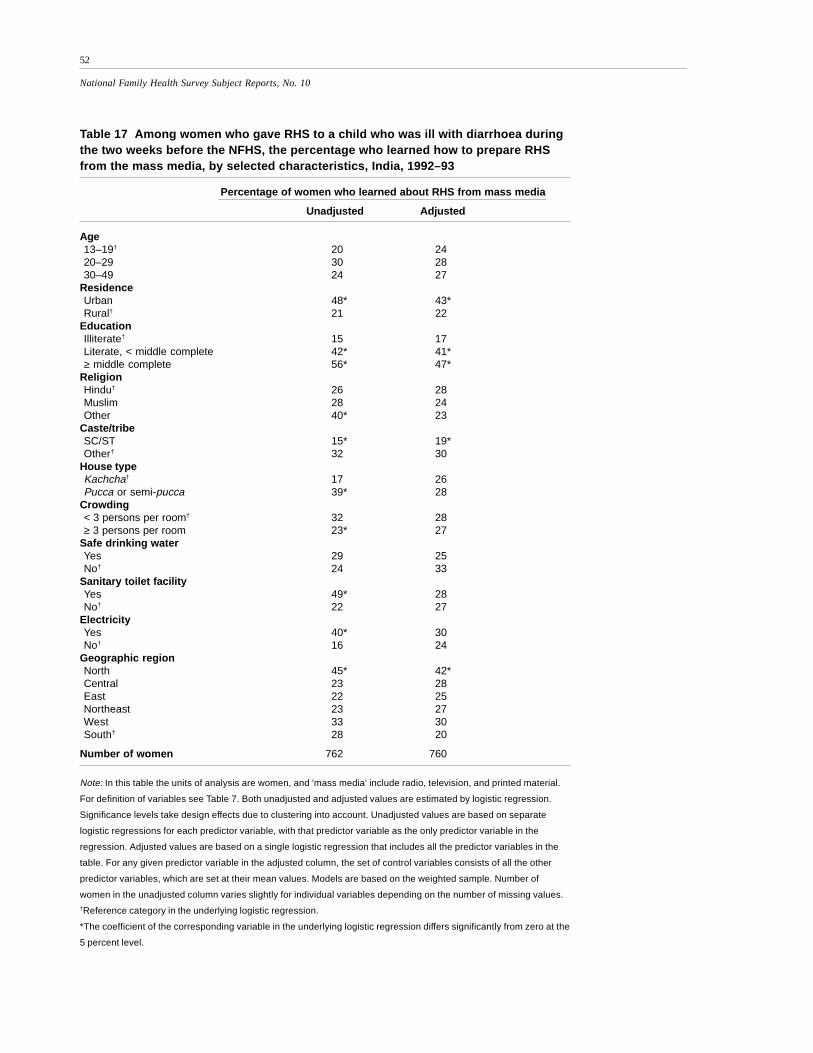
National Family Health Survey Subject Reports, No. 10
Table 13 Unadjusted and adjusted effects of mother’s media exposure and other factors on use of ORSor RHS to treat children born 1–47 months before the NFHS who were ill with diarrhoea during the twoweeks before the survey, India, 1992–93
Number of children 4,533 4,509 4,518 4,494 4,520 4,496
†Reference category in the underlying logistic regression.
*The coefficient of the corresponding variable in the underlying logistic regression differs significantly from zero at the 5 percent level.
42
National Family Health Survey Subject Reports, No. 10
for media exposure and the other demographic and socioeconomic variables. Ad-
justed ORS treatment rates were also significantly higher for children living in house-
holds with electricity and in households with access to safe drinking water. There is
little variation in adjusted ORS treatment rates by mother’s age, religion, caste/tribe,
house type, crowding, or access to a sanitary toilet facility. The ORS treatment rate is
much higher in the northeast than in other regions of the country.
Treatment with RHS
Figure 15 and Table 13 show unadjusted and adjusted RHS treatment rates for chil-
dren who had diarrhoea during the two weeks before the survey. The RHS treatment
rate is considerably higher for children whose mothers were exposed to electronic
mass media (24 percent) than for children whose mothers were not exposed (15 per-
cent). Controlling for other demographic and socioeconomic variables reduces the
difference in RHS treatment rates by about one-third—to 22 percent for children of
women exposed to mass media and 16 percent for children of women not exposed.
The difference between the two adjusted treatment rates remains highly statistically
significant (p<.002).
As with ORS treatment, the RHS treatment rate is comparatively low for chil-
dren under six months of age and does not vary much among older age groups. Un-
like ORS treatment, however, the RHS treatment rate shows little variation by sex of
child. Neither does RHS treatment vary much by mother’s age or by urban/rural
residence once electronic mass media exposure and other demographic and socio-
economic variables are controlled. The adjusted effect of mother’s education is sub-
stantial and highly statistically significant, and the adjusted effect of access to a sani-
tary toilet facility is positive and statistically significant. The adjusted effects of other
variables—including religion, caste/tribe, house type, crowding, access to safe drinking
water, and household electricity—are small and not statistically significant. RHS treat-
ment rates are somewhat higher in the east and west than in other regions of India.
Treatment with ORS or RHS
Table 13 also shows unadjusted and adjusted rates of treatment with ORS or RHS for
children who had diarrhoea during the two weeks before the survey. As a combined
category, the ORS/RHS treatment rate is inevitably higher than either the ORS treat-
ment rate or the RHS treatment rate alone, but it is not quite as high as these two rates
added together because children who were given both ORS and RHS are not counted
twice. Mother’s exposure to electronic mass media has a large and highly statistically
significant (p<.0001) effect on ORS/RHS treatment, both before and after adjusting
for the effects of other variables.
43
National Family Health Survey Subject Reports, No. 10
As with ORS and RHS treatment rates, the adjusted ORS/RHS treatment rate is
comparatively low among children less than six months of age and does not vary
much among older age groups. The ORS/RHS treatment rate is somewhat higher for
boys than for girls, reflecting the gender difference in the use of ORS discussed
earlier. The ORS/RHS treatment rate rises with mother’s education and is higher in
households that have access to safe drinking water, but none of the other socioeco-
nomic variables has a statistically significant effect. The ORS/RHS treatment rate is
higher in the east and northeast than in other regions of the country.
Figure 16 and Table 14 show the adjusted effects of mother’s electronic mass
media exposure on ORS/RHS treatment, broken down separately for urban and rural
areas. With the other predictor variables held constant, mother’s exposure to elec-
tronic mass media has a large and highly statistically significant effect on ORS/RHS
treatment in rural areas but virtually no effect in urban areas. As mentioned earlier, this
pattern may occur because mothers in urban areas have more alternative sources of infor-
mation, while mothers in rural areas rely more heavily on radio, television, and cinema.
Child’s age and mother’s education both affect ORS/RHS treatment rates rather
similarly in urban and rural areas. The ‘other religion’ category has a large positive
effect on the ORS/RHS treatment rate in urban areas but not in rural areas. In urban areas,
the ORS/RHS treatment rate is significantly higher in the east than in other regions, but
this regional difference is not observed in rural areas. The other socioeconomic variables
do not have statistically significant effects in either urban or rural areas.
3738
35
25
36
27
0
10
20
30
40
Exposed Notexposed
Exposed Notexposed
Exposed Notexposed
Pe
rce
nt g
ive
n O
RS
or
RH
S
Urban Rural Total
Figure 16 Adjusted effects of mother’s electronic mass media exposure on use ofORS or RHS to treat children born 1–47 months before the NFHS who were ill withdiarrhoea during the two weeks before the survey, by residence, India, 1992–93
44
National Family Health Survey Subject Reports, No. 10
Table 14 Adjusted effects of mother’s media exposure and other factors on use ofORS or RHS to treat children born 1–47 months before the NFHS who were ill withdiarrhoea during the two weeks before the survey, by residence, India, 1992–93
Percentage of children treated with ORS or RHS
Urban Rural
Electronic mass media exposureYes 37 35*No† 38 25
Village media/educational activityYes — 27No† — 30
National Family Health Survey Subject Reports, No. 10
Note to Table 14: In this table the units of analysis are children. For definition of variables see Table 17. Adjusted
values are estimated by logistic regression. Significance levels take design effects due to clustering into account. For
any given predictor variable, the set of control variables consists of all the other predictor variables in the table, which
are set at their mean values. Models are based on the weighted sample.†Reference category in the underlying logistic regression.
*The coefficient of the corresponding variable in the underlying logistic regression differs significantly from zero at the
5 percent level.
ORS and RHS treatment by sex of child
The findings presented here indicate a degree of discrimination against girls in the
use of ORS packets but not of RHS. It is undoubtedly more difficult for mothers to
obtain ORS packets than to obtain the simple salt and sugar ingredients needed to
prepare RHS, and most mothers who know about ORS packets probably perceive
ORS as superior to RHS. Under these circumstances, it is plausible that son prefer-
ence would translate into a higher ORS treatment rate for boys than for girls but
about the same RHS treatment rate for both sexes, which is precisely what the find-
ings in earlier sections indicate.
Figure 17 and Table 15 show the adjusted effects of mother’s electronic mass
media exposure on ORS and RHS treatment rates, broken down separately for boys
and girls. Mother’s exposure to electronic mass media has a large positive adjusted
effect on ORS treatment for boys, but virtually no effect on ORS treatment for
girls. By contrast, mother’s exposure to electronic mass media has a positive
effect on RHS treatment for both boys and girls. These findings indicate that
mothers who are exposed to electronic mass media are more likely than unex-
posed mothers to discriminate against girls in providing treatment with ORS.
The effect of mother’s media exposure on the RHS treatment rate, however, is
the same for boys and girls.
Table 15 also shows the adjusted effects of other demographic and socioeco-
nomic variables on ORS and RHS treatment rates separately for boys and girls. Re-
garding ORS, child’s age has effects similar to those noted in earlier tables, and these
effects are rather similar for boys and girls. Urban/rural residence has a significant
effect on the ORS treatment rate for boys, with a higher treatment rate in rural areas,
but not for girls. Mother’s education, access to safe drinking water, and household
electricity all have positive effects on ORS treatment rates for boys but not for girls.
Taken together, these findings suggest that women in relatively wealthy households
are more likely than women in poor households to discriminate against girls in the
use of ORS packets to treat diarrhoea. The table also shows that discrimination against
girls is especially prevalent in the central and eastern regions of the country. None of
the other predictor variables has a statistically significant effect on ORS treatment for
either boys or girls.
46
National Family Health Survey Subject Reports, No. 10
Figure 17 Adjusted effects of mother’s electronic mass media exposure on use ofORS and RHS to treat children born 1–47 months before the NFHS who were ill withdiarrhoea during the two weeks before the survey, by sex of child, India, 1992–93
For RHS, two socioeconomic variables have a greater effect on the treatment
rate for boys than for girls—Muslim religion and household electricity. The other
demographic and socioeconomic variables have similar effects on RHS treatment
rates for children of both sexes.
In the combined treatment category, the effect of mother’s electronic mass me-
dia exposure on treatment with ORS or RHS is greater for boys than for girls. House-
hold electricity also has a greater effect on the ORS/RHS treatment rate for boys than
for girls, but most of the other predictor variables have similar effects for children of
both sexes. For girls, the combined ORS/RHS treatment rate is highest in the north-
east, whereas for boys it is highest in the east.
Fluid intake
For children born 1–47 months before the NFHS who were ill with diarrhoea during
the two weeks before the survey, Figure 18 and Table 16 present the adjusted effects
of mother’s electronic mass media exposure on frequency of breastfeeding (for chil-
dren who were still being breastfed) and on level of fluid intake aside from breast
milk. Among children who were ill with diarrhoea during the two weeks before the
survey, mother’s electronic mass media exposure has virtually no effect on frequency
of breastfeeding. Seven percent of children whose mothers were exposed to electronic
16
15
24
16
22
16
22
16
0
5
10
15
20
25
Exposed Notexposed
Exposed Notexposed
Exposed Notexposed
Exposed Notexposed
Pe
rce
nt g
ive
n O
RS
/RH
S
ORS RHS
Girls Boys Girls Boys
47
National Family Health Survey Subject Reports, No. 10
Table 15 Adjusted effects of media exposure and other factors on use of ORS or RHS to treat childrenborn 1–47 months before the NFHS who were ill with diarrhoea during the two weeks before the survey,by sex of child, India, 1992–93
Percentage of children treated with
ORS RHS ORS or RHS
Girls Boys Girls Boys Girls Boys
Mother's electronic mass media exposureYes 16 24* 22* 22* 31 40*No† 15 16 16 16 27 27
Number of children 2,141 2,368 2,137 2,357 2,136 2,360
Note: In this table the units of analysis are children. For definition of variables see Table 12. Adjusted values are estimated by logistic regression.
Significance levels in this table take design effects due to clustering into account. For any given predictor variable, the set of control variables
consists of all the other predictor variables in the table, which are set at their mean values. Models are based on the weighted sample.†Reference category in the underlying logistic regression.
*The coefficient of the corresponding variable in the underlying multinomial logistic regression differs significantly from zero at the 5 percent level.
48
National Family Health Survey Subject Reports, No. 10
mass media received more frequent breastfeeding when they became ill, and 15 per-
cent received less frequent breastfeeding. Eight percent of children whose mothers
were not exposed to the media received more frequent breastfeeding when they be-
came ill, and 12 percent received less frequent breastfeeding. The effects of mother’s
electronic mass media exposure on children’s intake of other fluids show a similar
pattern. It is noteworthy that children who were ill with diarrhoea are approximately
twice as likely to receive decreased breast milk and other fluids as they are to receive
increased amounts of these fluids.
Table 16 also shows the effects of selected demographic and socioeconomic
variables on frequency of breastfeeding and fluid intake. There is some variation by
child’s age, with a smaller reduction in the frequency of breastfeeding (as indicated
in the ‘decreased’ column) for children below six months than for older children.
There are also substantial regional variations. For example, 28 percent of children in
Figure 18 Adjusted effects of mother’s electronic mass media exposure onfrequency of breastfeeding, if mother still breastfeeding, and on intake of otherfluids by children born 1–47 months before the NFHS who were ill with diarrhoeaduring the two weeks before the survey, India, 1992–93
Note to Table 16: In this table the units of analysis are children. For definition of variables see Table 12. Adjusted
values are estimated by multinomial logistic regression. Significance levels in this table do not take design effects
due to clustering into account. For any given predictor variable, the set of control variables consists of all the other
predictor variables in the table, which are set at their mean values. Models are based on the weighted sample.
7
8
15
13
10 10
21
19
0
5
10
15
20
25
Exposed Notexposed
Exposed Notexposed
Exposed Notexposed
Exposed Notexposed
Pe
rce
nt in
cre
ase
d/d
ecr
ea
sed
Frequency of breastfeeding Intake of other fluids
Increased Decreased Increased Decreased
49
National Family Health Survey Subject Reports, No. 10
Table 16 Adjusted effects of media exposure and other factors on frequency of breastfeeding, if motherstill breastfeeding, and on intake of other fluids by children born 1–47 months before the NFHS whowere ill with diarrhoea during the two weeks before the survey, India, 1992–93
Frequency of breastfeeding Intake of other fluids
Same Increased Decreased Same Increased Decreased
Electronic mass media exposureYes 78 7 15 69 10 21No† 79 8 13 72 10 19
†Reference category in the underlying logistic regression.
*The coefficient of the corresponding variable in the underlying multinomial logistic regression differs significantly from zero at the 5 percent
level.
50
National Family Health Survey Subject Reports, No. 10
the northeast experienced a reduction in the frequency of breastfeeding when they
were ill with diarrhoea, compared with only 9 percent in the south. None of the other
demographic or socioeconomic variables has a substantial effect on the frequency of
breastfeeding.
Older children are slightly more likely than younger children to receive either
increased or decreased fluids (other than breast milk) when ill with diarrhoea, while
younger children are more likely to maintain the same level of fluid intake. Consis-
tent with expectations, children of more-educated mothers are more likely than other
children to receive increased fluids when ill with diarrhoea, but, surprisingly, they are
also more likely to receive decreased fluids. Evidently even highly educated women do
not necessarily appreciate the importance of increasing fluids when children have
diarrhoea. Muslim children are much more likely to receive decreased fluids than are
Hindu children or children belonging to other religions. There is considerable re-
gional variation in the extent to which diarrhoea induces changes in children’s
fluid intake.
These findings indicate that most women in India, regardless of their socioeco-
nomic background, are not aware of the importance of increasing breastfeeding and
the intake of other fluids when children are ill with diarrhoea. Apparently the Oral
Rehydration Therapy Programme has not sufficiently emphasized the need for in-
creased fluids as an essential aspect of proper treatment of diarrhoea. Although so-
cioeconomic factors do not have much effect on either the frequency of breastfeeding
or amount of other fluid intake, there is considerable variation by geographic region.
The reasons for this geographic variation are unclear.
Source of information about RHS
Women who reported using RHS to treat a child who had diarrhoea during the two
weeks before the survey were asked where they learned to prepare the solution. Among
17 possible pre-coded responses to this question, ‘mass media’ were defined as tele-
vision, radio, or printed material. Thus, in our analysis of responses to this question,
the mass media include television and radio, but not cinema, and they also include
the print media. Twenty-seven percent of mothers who gave RHS to children who
were ill with diarrhoea during the two weeks before the survey learned how to pre-
pare the solution from the mass media as defined in this way.
Figure 19 and Table 17 show the unadjusted and adjusted effects of selected
variables on whether a woman identified the mass media as her source of information
on RHS, with women as the units of analysis. Woman’s age has no effect on whether
the mass media were her source of information on RHS. Urban/rural residence, on
the other hand, has a substantial effect. Even after other variables are controlled,
urban women are twice as likely as rural women to have learned about RHS from
51
National Family Health Survey Subject Reports, No. 10
mass media. More-educated women are more likely than less-educated women to
have learned about RHS from mass media. Women who have completed middle school
or higher education are nearly three times as likely as illiterate women to have
learned about RHS from mass media. Religion does not have an effect on the
role of mass media as a source of information on RHS, but membership in a
scheduled caste or scheduled tribe does have an effect. Scheduled-caste and sched-
uled-tribe women are much less likely than other women to have learned about
RHS from mass media.
Women living in pucca or semi-pucca houses, in households with less than
three persons per room, or in households with access to a sanitary toilet facility or
electricity are all much more likely than other women to have learned about RHS
from mass media. The effects of these variables become much smaller and lose their
statistical significance, however, when potentially confounding variables are controlled.
For reasons that are not clear, women living in northern India are much more likely than
women in other regions to have learned about RHS from mass media.
CONCLUSIONS AND POLICY RECOMMENDATIONS
Results of this study indicate that in spite of the Indian Government’s vigorous Oral
Rehydration Therapy Programme, which has been in place for more than a decade,
43
22
17
41
47
28
24 23
19
30
0
10
20
30
40
50
Urban Rural Illiterate <M iddle M iddle+ Hindu M uslim O ther SC/ST O ther
Pe
rce
nt w
ho le
arn
ed
fro
m m
ass
me
dia
Residence Education Religion Caste/tribe
Figure 19 Adjusted percentages of women who learned about RHS from the mass media, by selectedcharacteristics, India, 1992–93
52
National Family Health Survey Subject Reports, No. 10
Table 17 Among women who gave RHS to a child who was ill with diarrhoea duringthe two weeks before the NFHS, the percentage who learned how to prepare RHSfrom the mass media, by selected characteristics, India, 1992–93
Percentage of women who learned about RHS from mass media
Note: In this table the units of analysis are women, and 'mass media' include radio, television, and printed material.
For definition of variables see Table 7. Both unadjusted and adjusted values are estimated by logistic regression.
Significance levels take design effects due to clustering into account. Unadjusted values are based on separate
logistic regressions for each predictor variable, with that predictor variable as the only predictor variable in the
regression. Adjusted values are based on a single logistic regression that includes all the predictor variables in the
table. For any given predictor variable in the adjusted column, the set of control variables consists of all the other
predictor variables, which are set at their mean values. Models are based on the weighted sample. Number of
women in the unadjusted column varies slightly for individual variables depending on the number of missing values.†Reference category in the underlying logistic regression.
*The coefficient of the corresponding variable in the underlying logistic regression differs significantly from zero at the
5 percent level.
53
National Family Health Survey Subject Reports, No. 10
women’s knowledge and use of oral rehydration therapy to treat childhood diarrhoea
remain quite limited. According to the NFHS, only 43 percent of women who gave
birth during the four years before the survey know about ORS packets, and only 26
percent have ever used them. Only 18 percent of children born 1–47 months before
the NFHS who were ill with diarrhoea during the two weeks before the survey were
treated with ORS packets, and only 19 percent were treated with RHS. Sixty-nine
percent received neither ORS nor RHS.
The results also suggest that the government’s Oral Rehydration Therapy
Programme has not sufficiently emphasized the importance of increased breastfeeding
and fluid intake in the treatment of childhood diarrhoea. Only 7 percent of children
were given more frequent breastfeeding when they were ill with diarrhoea, whereas
14 percent were given less frequent breastfeeding, and for some of these children
breastfeeding was stopped completely. Only 10 percent received increased fluids aside
from breast milk, while 20 percent received decreased fluids.
Very small percentages of children who were ill with diarrhoea during the two
weeks before the NFHS were treated with ORS, RHS, or increased fluids, despite the
fact that 61 percent of these children received treatment from a health facility or
provider. Among those who received treatment from a health facility or provider, 94
percent were treated with antibiotics or other antidiarrhoeal drugs, contrary to WHO
recommendations that drugs not be used for treatment of diarrhoea in children under
five. Fifty-nine percent of these children received drugs alone without ORS or RHS.
Treatment with drugs appears to be widespread among both public- and private-sec-
tor providers, but it is somewhat more common in the private sector.
These findings indicate a lack of awareness of proper treatment of childhood
diarrhoea, not only among Indian mothers but also among health-care providers. It is
possible that many health-care providers are ignorant of the proper roles of oral
rehydration therapy and drugs in the management of childhood diarrhoea. It is also
possible that many providers (including some public-sector providers who have pri-
vate practices on the side) prefer to prescribe drugs in order to be able to charge
more money than would be possible if they simply recommended oral rehydration.
Finally, the tendency of health providers to prescribe drugs may reflect parental
expectations about what constitutes proper medical care of children who are ill
with diarrhoea.
The analysis indicates that the electronic mass media are effective in increasing
awareness and use of oral rehydration therapy. Women regularly exposed to elec-
tronic mass media are much more likely than other women to know about ORS pack-
ets and to use ORS or RHS to treat their children for diarrhoea. The effect of elec-
tronic mass media exposure on knowledge and use of ORS packets is stronger in
rural areas than in urban areas, probably because urban women have access to a
wider variety of services and sources of information than do rural women. Among
54
National Family Health Survey Subject Reports, No. 10
women who have used RHS to treat childhood diarrhoea, however, those who live in
urban areas and those who have completed middle school or higher education are
much more likely than other women to have learned about RHS from the mass me-
dia. In rural areas, community-level mass media and group educational activities
have positive effects on knowledge and use of oral rehydration therapy over and above
the effects of mother’s exposure to electronic mass media and of other demographic
and socioeconomic variables.
The results reported here suggest that there is some discrimination against girls
in the use of ORS packets to treat diarrhoea. The use of RHS, however, is about the
same for boys and girls.
There is clearly a need to strengthen educational programmes for mothers and
communities and to provide supplemental training to health-care providers in the
proper treatment of childhood diarrhoea. Such educational programmes need to em-
phasize the importance of increasing fluid intake—including greater use of ORS pack-
ets—and continuing feeding in the treatment of childhood diarrhoea. They also need
to discourage the use of unnecessary and potentially harmful drugs. Finally, the Oral
Rehydration Therapy Programme needs to address the problem of gender dis-
crimination in the treatment of childhood diarrhoea. The mass media can help in
these efforts.
55
National Family Health Survey Subject Reports, No. 10
REFERENCES
Gandotra, M. M., R. D. Retherford, A. Pandey, N. Y. Luther, and V. K. Mishra. 1998.
Fertility in India. National Family Health Survey Subject Reports No. 9.Mumbai: International Institute for Population Sciences; Honolulu: East-West
Center, Program on Population.
GOI (Government of India). 1998. Annual report 1997–98. New Delhi: Ministry ofHealth and Family Welfare, Government of India.
IIPS (International Institute for Population Sciences). 1995. National Family Health
Survey (MCH and family planning): India 1992–93. Bombay: InternationalInstitute for Population Sciences.
Retherford, R. D., and M. K. Choe. 1993. Statistical models for causal analysis. New
York: John Wiley.
Retherford, R. D., and V. Mishra. 1997. Media exposure increases contraceptive use.
National Family Health Survey Bulletin No. 7. Mumbai: International
Institute for Population Sciences; Honolulu: East-West Center, Program onPopulation.
Singh, J., D. Gowriswari, B. R. Chavan, R. A. Patiat, A. C. Debnath, D. C. Jain, R. S.
Sharma, R. C. Sharma, and K. K. Datta. 1992. Diarrhoeal diseases amongchildren under five: A study in rural Alwar. Journal of Communicable
Diseases 24(3): 150–5.
Sinha, A. K., and S. P. Srivastava. 1993. Awareness of diarrhoeal disease control inrural and urban areas of Bihar. Indian Pediatrics 30(12): 1433–9.
Stata Corporation. 1997. Stata reference manual, release 5. College Station, Texas:
Stata Press.
WHO (World Health Organisation). 1990. The rational use of drugs in the
management of acute diarrhoea in children. Geneva: World Health
Organisation.
WHO (World Health Organisation). 1995. The treatment of diarrhoea: A manual for
physicians and other senior health workers. Geneva: World Health