11
procurence. supply chain risk management Meercat KPI Dashboard Web-based Dashboard Generator

procurence. supply chain risk management
Meercat KPI Dashboard
Web-based Dashboard Generator

procurence. supply chain risk management
KPI dashboards are the bread and butter of corporate reporting. Most of
them are Excel-based, since it‘s too expensive to adjust existing BI tools.
Are you looking for a web-
based tool, which would
allow the you to gather Key
Performance Indicators
from various systems and
business units and display
them in customised
dashboards?
You work with and report to multiple stakeholders and need a tool to
easily gather the data and communicate the results
You need to have an overview of your savings initiatives
You’d like to know how efficient your organisation is worldwide
You need to track the progress and effects of your projects
You have world-wide multiple ERP systems and you need to
temporarily integrate the necessary data
Typical situations
where flexible KPI
dashboard are needed

procurence. supply chain risk management
Create new
dashboards in minutes
Freely definable
dashboard layouts –
can be adjusted at any
time
Controlled access
for all stakeholders
World-wide access
Integrated
communication
Meercat KPI: a flexible, web-based tool for easy gathering and reporting
of Key Performance Indicators
Client requirements
web-based no limits flexible layouts
No more emails with
Excel® files
Automatic reminders
to update data
integrated
communication
Unlimited users
Unlimited KPIs
Unlimited
dashboards

procurence. supply chain risk management
Now imagine that within 1 hour you could: create this dashboard, add
data and communicate to the stakeholders.
Sample KPI dashboard: Supplier Structure
procurence. supply chain risk management
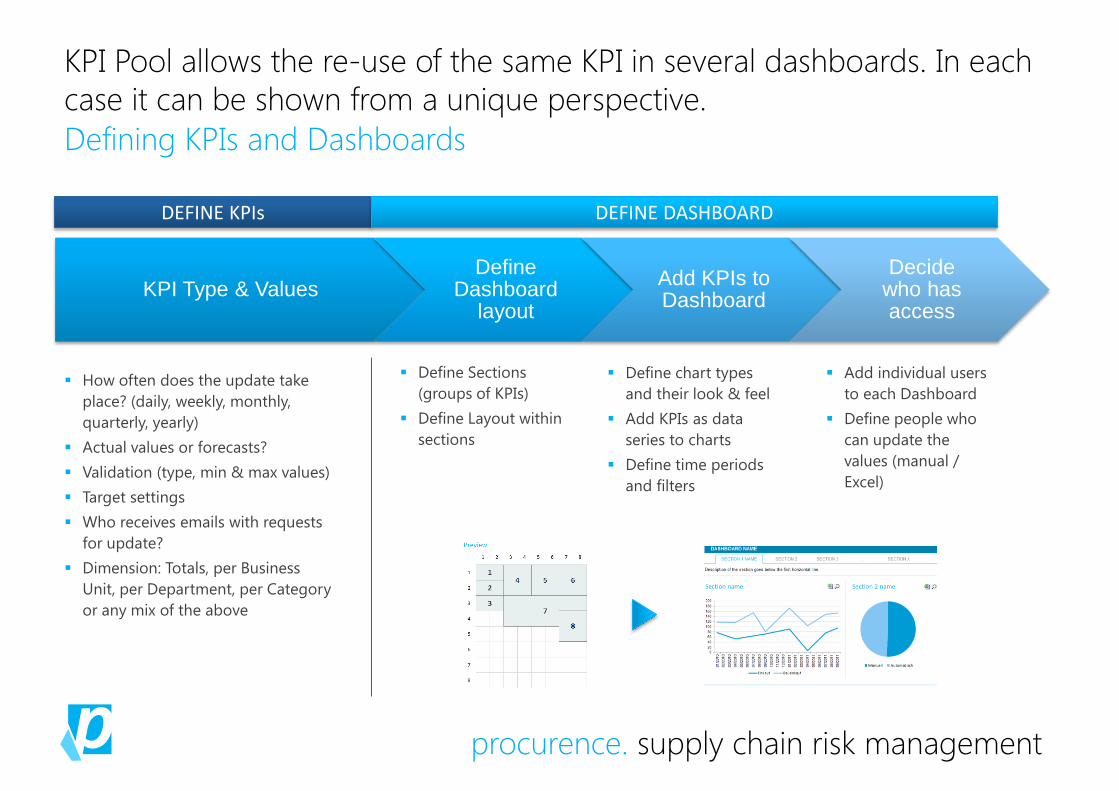
KPI Type & Values Define
Dashboard layout
Add KPIs to Dashboard
Decide who has access
How often does the update take
place? (daily, weekly, monthly,
quarterly, yearly)
Actual values or forecasts?
Validation (type, min & max values)
Target settings
Who receives emails with requests
for update?
Dimension: Totals, per Business
Unit, per Department, per Category
or any mix of the above
KPI Pool allows the re-use of the same KPI in several dashboards. In each
case it can be shown from a unique perspective.
Defining KPIs and Dashboards
DEFINE KPIs DEFINE DASHBOARD
Define Sections
(groups of KPIs)
Define Layout within
sections
Define chart types
and their look & feel
Add KPIs as data
series to charts
Define time periods
and filters
Add individual users
to each Dashboard
Define people who
can update the
values (manual /
Excel)

procurence. supply chain risk management
A Dashboard is composed
of a series of SECTIONS
(pages) that are themselves
divided into a matrix.
It’s up to you decide where
to place individual charts
and how big to make them.
You decide which KPIs
should be displayed and
whether the values should
be gathered for the whole
company, business unit,
project, department or a
category.
Creating a new dashboard is a simple matter of adding KPIs, deciding on
their position and chart types
Dashboard

procurence. supply chain risk management
Users receive automatic
email reminders to
update KPIs
By clicking on the
provided link, they arrive
at the data entry page,
where the system asks
them for the
information.
Supervisor has an
overview which data is
missing and can contact
the responsible persons
to follow up.
You can edit data in
multiple sessions, as
they arrive.
You can define who is responsible for updating the KPIs and the system
makes sure the data is entered
Data entry: Manual
procurence. supply chain risk management
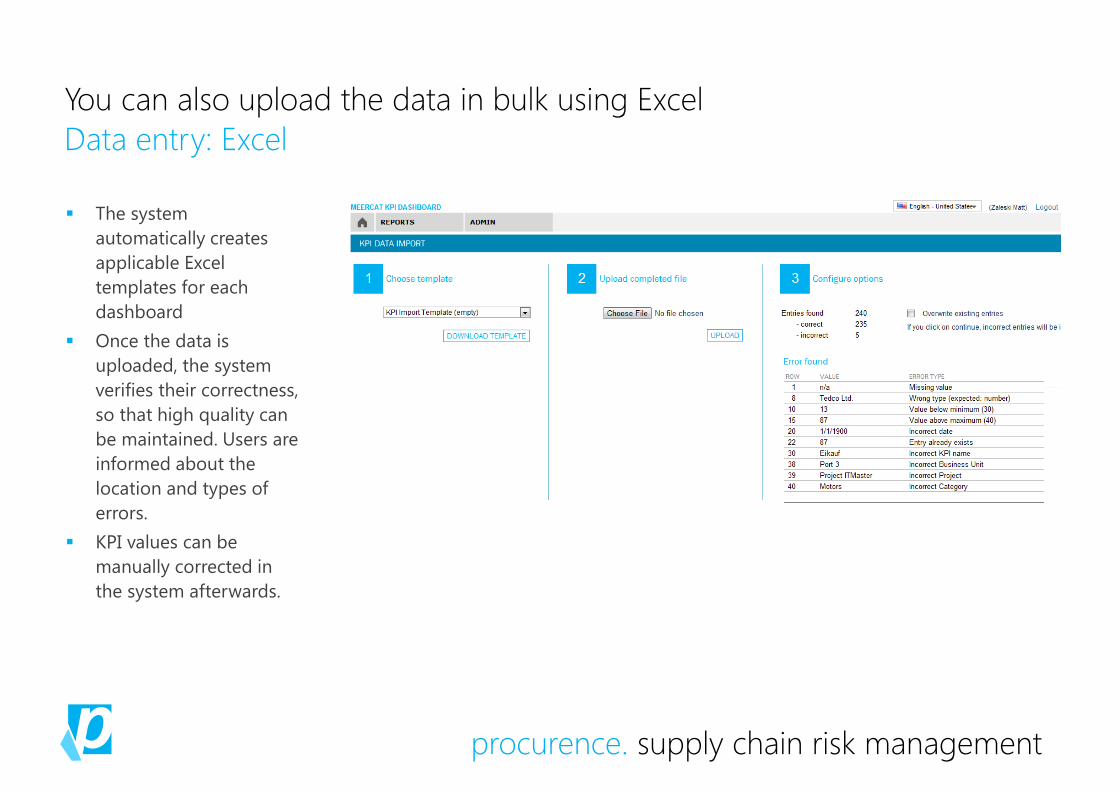
You can also upload the data in bulk using Excel
Data entry: Excel
The system
automatically creates
applicable Excel
templates for each
dashboard
Once the data is
uploaded, the system
verifies their correctness,
so that high quality can
be maintained. Users are
informed about the
location and types of
errors.
KPI values can be
manually corrected in
the system afterwards.

procurence. supply chain risk management
Meercat KPI shares all the key administrative functions with the main
Meercat application
Administrative features
Supports multiple
languages
Ability to add Business
Units, Projects, Categories
(Warengruppen) and
Departments
Complete user
management
SMS session authorisation
if required
Unlimited number of users
Completely integrated
with other Meercat
modules
Supplier access on
demand
procurence. supply chain risk management
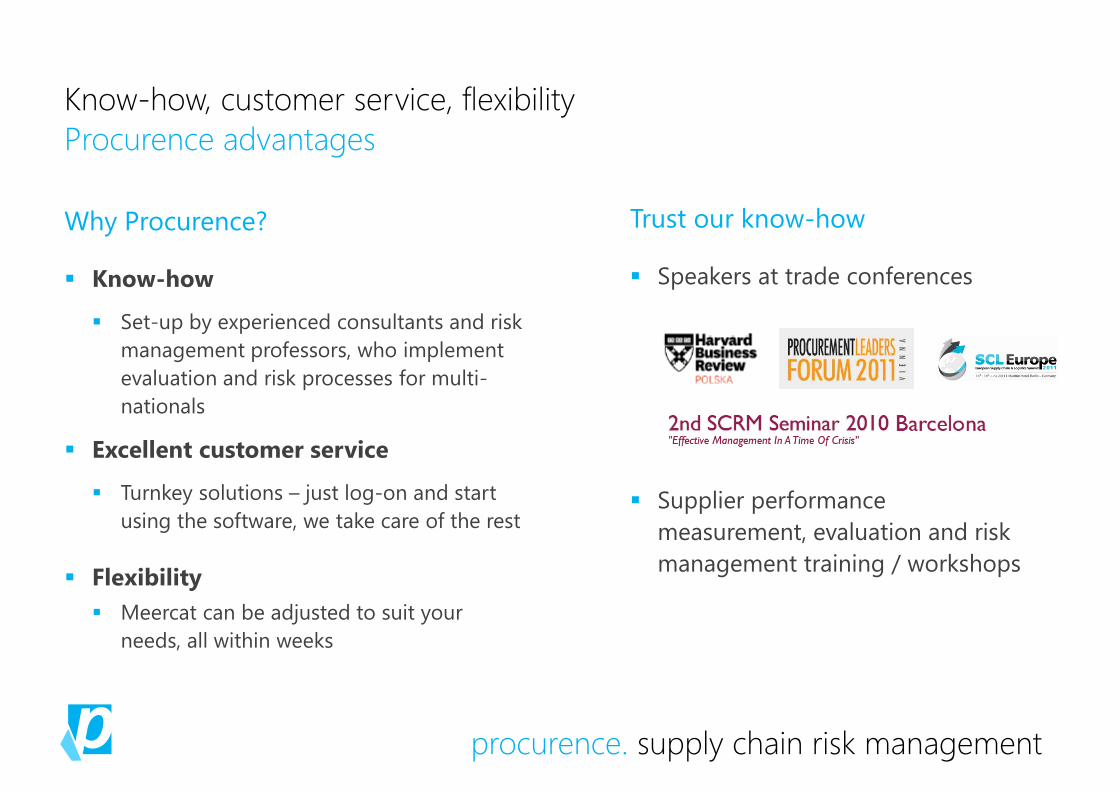
Know-how, customer service, flexibility
Procurence advantages
Trust our know-how
Speakers at trade conferences
Supplier performance
measurement, evaluation and risk
management training / workshops
Why Procurence?
Know-how
Set-up by experienced consultants and risk
management professors, who implement
evaluation and risk processes for multi-
nationals
Excellent customer service
Turnkey solutions – just log-on and start
using the software, we take care of the rest
Flexibility
Meercat can be adjusted to suit your
needs, all within weeks

tel. +48 22 219 5400
www.procurence.com
procurence sp. z o.o.
ul. dereniowa 2/306
02-776 warsaw, poland
meercat. web-based software
supply chain risk management
supply chain assessment


