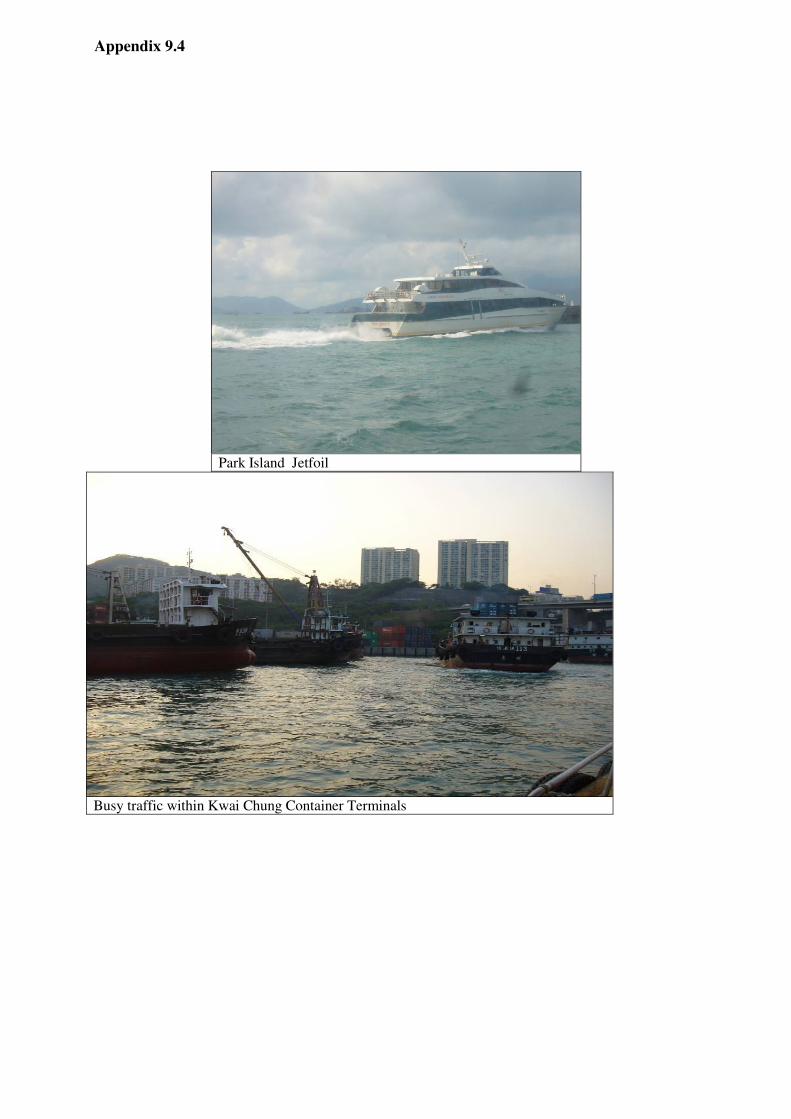
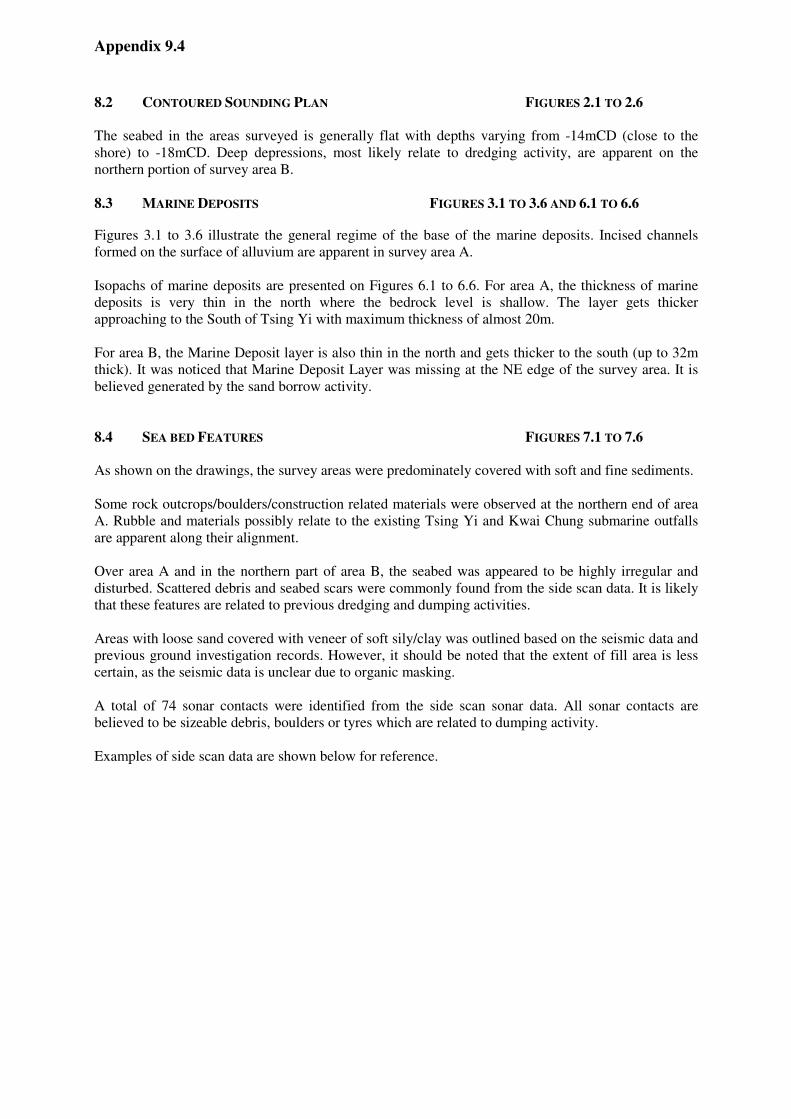
Appendix 9.4 KWAI TSING CONTAINER BASIN – MARINE GEOPHYSICAL SURVEY 1 INTRODUCTION 1.1 INSTRUCTIONS AND OBJECTIVES EGS (Asia) Limited was commissioned by Lam Geotechnics Limited to undertake the bathymetric and geophysical surveys on the proposed dredging areas in order to identify any potential obstructions to the dredging works, to reveal the subsurface condition, to locate the existing utilities and provide information for the marine archaeological investigation. The following survey techniques were deployed: METHOD OBJECTIVE Multibeam swath survey (Swath) To measure sea bed levels in detail Marine seismic profiling survey (Seismic) To identify the geological succession over the survey areas and to locate the existing utilities within survey area A2 and B2 Marine side scan sonar survey (SSS) To identify any features and objects at or above the sea bed, such as rock outcrops, dumped materials and other artefacts Only information relevant to the archaeological assessment is included in this section. 1.2 SURVEY PERIOD The survey was carried out during the period of 5 th to 16 th November 2009. The details are listed below: DATE SURVEY AREA SURVEY TYPE SURVEY VESSEL 5 th – 12 th Nov 2009 A1 & A2 Swath, Seismic and SSS WH2 13 th – 16 th Nov 2009 B1 & B2 Swath, Seismic and SSS WH2 2 SITE DESCRIPTION The bathymetric and geophysical surveys were carried out in two areas. Survey area A is located within the basin of Kwai Chung Container Terminal and its approaching fairway to the south of Tsing Yi. Survey area B lies along the western side of Southern Fairway and is located to the west of Hong Kong Island. As expected, the marine traffic around the survey areas was very busy during the survey period. Some of these marine activities are illustrated in the photographs below:
Transcript
Appendix 9.4
KWAI TSING CONTAINER BASIN – MARINE GEOPHYSICAL SURVEY 1 INTRODUCTION 1.1 INSTRUCTIONS AND OBJECTIVES EGS (Asia) Limited was commissioned by Lam Geotechnics Limited to undertake the bathymetric and geophysical surveys on the proposed dredging areas in order to identify any potential obstructions to the dredging works, to reveal the subsurface condition, to locate the existing utilities and provide information for the marine archaeological investigation. The following survey techniques were deployed: METHOD OBJECTIVE Multibeam swath survey (Swath) To measure sea bed levels in detail Marine seismic profiling survey (Seismic)
To identify the geological succession over the survey areas and to locate the existing utilities within survey area A2 and B2
Marine side scan sonar survey (SSS) To identify any features and objects at or above the sea bed, such as rock outcrops, dumped materials and other artefacts
Only information relevant to the archaeological assessment is included in this section. 1.2 SURVEY PERIOD The survey was carried out during the period of 5th to 16th November 2009. The details are listed below:
DATE SURVEY AREA SURVEY TYPE SURVEY VESSEL 5th – 12th Nov 2009 A1 & A2 Swath, Seismic and SSS WH2
13th – 16th Nov 2009 B1 & B2 Swath, Seismic and SSS WH2 2 SITE DESCRIPTION The bathymetric and geophysical surveys were carried out in two areas. Survey area A is located within the basin of Kwai Chung Container Terminal and its approaching fairway to the south of Tsing Yi. Survey area B lies along the western side of Southern Fairway and is located to the west of Hong Kong Island. As expected, the marine traffic around the survey areas was very busy during the survey period. Some of these marine activities are illustrated in the photographs below:
Appendix 9.4
Busy traffic within Kwai Chung Container Terminals
Park Island Jetfoil
Appendix 9.4
3 EQUIPMENT LIST The following equipment was mobilised on MV Wing Hung 2, a Class IV commercially licensed vessel.
Equipment Qty EGS Serial No. C-Nav GcGPS 1 GPS80A The EGS computerised navigation package v1.2 and PC 1 D253 Echotrac MKIII 1 ESD23 The Reson 8125 multibeam system 1 SWA06 Swath PC 1 D411 Boomer 1 LVB008 Hydrophone 1 HYD15 EGS TVG console 1 TVG16 Waverley recorder 1 GPR13 Klein 2000 Side Scan Sonar system with digital tow fish 1 SSS17 TSS Gyro compass 1 HMC09 TSS 320B heave motion compensator (SBES) 1 HMC06 Valeport velocity profiler 1 SVP12 TSS DMS 3-05 heave motion compensator 1 HMC21
4 LOCATION CONTROL 4.1 HORIZONTAL LOCATION CONTROL 4.2 BASIC METHOD The survey vessel was located with a globally corrected Global Positioning System (GcGPS) unit called C-Nav, for which no shore based differential correction transmitter is required. The system provides corrected positions to an accuracy of +/- 0.3m without the need for a shore-based transmitting system. 4.3 COMPUTERISED NAVIGATION The EGS computerized navigation system was added to the positioning system to control the steering of the boat along the traverses specified, and to log all horizontal and vertical control data. This system provides the user with a dynamic analogue and digital screen display on which the following are continuously updated: Skewed grid set parallel to the desired line direction Boat position Water depth Date and Time GcGPS diagnostics enabling quality control Other information displayed for the assistance of the hydrographic surveyor includes, course, speed, fixing status, and coordinates on the National Grid (in this case, the Hong Kong Metric Grid), as well as a number of other user-defined options for marine surveying. 4.4 CALIBRATION, ACCURACY AND QUALITY ASSURANCE
Appendix 9.4
The positioning system was calibrated by checking the co-ordinates displayed by the navigation system at the previously co-ordinated point located at the Yau Ma Tei typhoon shelter. Carrying out the above quality assurance checking procedure ensured an accuracy of +/-1m or better. 4.5 VERTICAL LOCATION CONTROL Tidal measurements were recorded at Kwai Chung, Terminal 8 and tidal data collected were used to reduce all echo sounding data to Chart Datum, (CD). 4.6 DATUMS The datums in use or implied in Hong Kong are as follows:
4.7 UTILIZATION OF TIDAL MEASUREMENTS Based on the relationship between datums mentioned in Section 4.6, above, tide data collected at Kwai Chung was used by interpolation to reduce all observations to Chart Datum or Principal Datum Hong Kong (PD) as appropriate. 5 OPERATING SYSTEM ON THE SURVEY VESSELS AND IN THE OFFICE EGS has developed the C-View operating and interpretation software package. This system was installed on survey vessels and in the office, to carry out the following functions:
Operations during surveying The system provided screen displays on up to three monitors for seismic profiling and side scan systems. Full operating systems coverage was provided, to enable the best survey records to be obtained. All raw data was logged digitally.
Appendix 9.4
Sub-bottom and side scan sonar interpretation While interpretation of SSS data was conducted with c-view software, and interpretation files were uploaded to Autocad without the need for further re-digitizing, seismic data interpretation was carried out on paper rolls.
6 FIELD PROCEDURES 6.1 SURVEY VESSEL The swath, seismic and side scan sonar surveys were carried out on a Class IV survey vessel, MV Wing Hung 2:
Wing Hung 2, Class IV commercially licensed survey vessel
6.2 SURVEY COVERAGE The survey boundary and survey traverse intervals were proposed and agreed with the client before the start of the survey:
Survey Area Survey Type Survey Interval (m) A1 & B1 Swath, Seismic and Side Scan Sonar 40m x 200m
A2 Additional Seismic Survey 40m x 200m, offset to the middle of A1 traverses
B2 Additional Seismic Survey 40m SN direction 6.3 SWATH (MULTIBEAM) BATHYMETRY TECHNIQUE 6.4 ARRANGEMENT OF SWATH EQUIPMENT ON BOARD Measurement of seabed level was made with a multibeam echo sounder system with the transducers mounted over the starboard side of the survey vessel. The GcGPS antenna was mounted directly above the transducers and as such the swath transducer acted as the datum for the survey vessel. 6.5 PRINCIPLE
Appendix 9.4
The swath system is a multibeam echo sounder. Instead of transmitting a single vertical pulse, which provides a record of water column thickness beneath the vessel track, the swath measures the same type of data over a 'fan' on both sides of the vessel. 6.6 CALIBRATION To avoid errors in measurement, the MBES system requires careful calibrations. A potential source of error relates to the speed of sound in water; the MBES system requires the speed of sound be measured through the water column, and for these data to be entered into a file which is accessed by the MBES acquisition and processing software. In addition, due to the fact that the speed of sound can vary significantly near the sea surface, a speed velocity probe is installed at MBES transducer so that measurements are recorded at all times during the survey and the corresponding corrections can be made within the MBES system in real-time. In addition, a patch test is required to calibrate system components, as follows:
Navigation Delay A survey line is set exactly over a well-defined feature, such as a rock outcrop, a significant slope or a man-made structure. The line is run twice in the same direction, once at the slowest possible speed and once at the highest speed Pitch Offset A survey line is set exactly over a well-defined feature. The line is run in opposite directions at the same speed Roll Offset A survey line is set over an area with a flat and featureless seabed. The line is run in opposite direction at the same speed Yaw (Heading) Offset Two parallel lines are set to either side of a well-defined feature with the feature positioned in the middle of the two lines. The off-track distance between the feature and the lines are selected according to water depth and the fan width of the MBES system, so that the feature will be detected at the outer part of sounding “fan”. The lines are run in the same direction at the same speed; once passing the feature to Port and once to Starboard.
By applying appropriate algorithms to match the apparent differences in the positions of the selected feature and the seabed topography measured in the individual calibration line, these calibration factors can be determined and are entered into the acquisition system to correct the seabed level measurements in real-time.
Illustrations of swath bathymetry systems The transducer of the swath system
Appendix 9.4
6.7 SIDE SCAN SONAR SURVEY TECHNIQUE Prior to the commencement of survey, a wet test for the side scan sonar system was conducted in order to ensure the system was working properly. The side scan sonar tow fish was towed behind the vessel at a depth of around 8-10m above the seabed in order to ensure sufficient data coverage and to obtain optimum data quality. The recording parameters for the side scan survey were as follows:
All data was logged to the C-View SDMP where two channels (100kHz port and starboard; 500kHz port and starboard) were simultaneously recorded with navigation, fix, vessel heading, cable out angle and length, fish heading, water depth. Detailed log sheets were recorded with unique survey line number, start fix and end fix of each survey line, roll number, range, frequency and cable out value and angle. The corresponding C-View data file name was also recorded in these log sheets.
The Klein 2000 dual frequency side scan sonar
6.8 SEISMIC REFLECTION SURVEY TECHNIQUE Prior to the commencement of survey the EGS LVB boomer was wet tested to ensure the system was working correctly. The EGS boomer was towed from the stern of the survey vessel, at a distance of 20m such that noise induced by the survey vessel was kept to a minimum. The recording parameters for the seismic reflection survey were as follows:
6.9 SITE SAFETY Onboard safety measures were generally in accordance with the 'Marine Geophysical Operations Safety Manual' (International Association of Geophysical Contractors, Ninth Edition, 2004). 7 REDUCTION OF OBSERVATIONS AND INTERPRETATION 7.1 SWATH (MULTIBEAM) DATA For sounding readings, the influence of wave action was corrected in real time by the TSS heave motion compensator. The smoothed sounding data was then reduced to levels below Chart Datum (CD) using the measured tide levels. Tidal correction and filters were applied before the swath data sets were edited manually. Judgement was required at this stage, to identify small features which were real reflections from low-level noise; for guidance, two or more mutually consistent soundings which were higher or lower than the general sea bed level were accepted, especially if the same anomalous soundings were present on separate survey traverses.
True-positioned soundings are used for producing swath charts. True-positioned sounding data, which was set at about 7.5m spacing for this survey (3mm on a 1:2500 chart), were selected from the processed sounding data. Minimum sounding values are selected during the sounding selection process.
7.2 SIDE SCAN SONAR DATA Processing and interpretation of side scan sonar data was carried out using the C-View interpretation software. All features were individually marked or grouped into regions using on- screen digitising. All offsets and laybacks were applied to the C-View system. The subsequently generated interpretation files were then imported to the Auto CAD environment on a line by line basis where the interpretation was reconciled and a detailed check was performed. The interpretation of the side scan sonar records in this area had sought to quantify the following elements and features on the seabed:
• Seafloor with fine sediments • Seafloor with coarse sediments • Seafloor with boulders and debris • Seafloor with scars and other utility related marks
Seismic acquisition and printing system The EGS LVB boomer used for sub-bottom
seismic profiling
Appendix 9.4
• All unidentified objects on the seabed 7.3 SEISMIC DATA 7.4 GENERAL The quality of the seismic records was generally good and acceptable. However there are masking zones over some of the survey areas. 7.5 INTERPRETATION OF THE GEOLOGICAL SUCCESSION The interpretation of the seismic records has sought to quantify the following four elements of the offshore geological unit:
Geological Unit Event Seabed N/A Marine Deposits of Holocene age (Hang Hau Formation)
The base of these deposits occurred during the last ice age
Alluvium (Chek Lap Kok Formation) Up to four ice ages occurred during the Pleistocene
The top of rock in any state of decomposition (Jurassic age)
N/A
Marine Deposits are generally soft SILT/CLAY, and as such are readily identifiable on seismic records as a clear conformable horizon sometimes with an unconformity represented by a desiccated layer or by local re-working of deposits by the water currents regime. One or more of the main geological units may be missing in some near shore area, for example, where Marine Deposits pinch out against the underlying Alluvium and rock, close to the shallow rockhead area in the northern portion of survey area A. Interpretation was carried out as follows:
The seismic horizons were selected for interpretation in accordance with the list above, and drawn on copies of the seismic records during preliminary interpretation All traverse crossing points were then calculated, and marked on the seismic records
The records were then physically correlated at all of these points Relevant drillhole logs were then marked up on the records, and consideration given to any adjustments to the preliminary interpretation indicated by the drilling results
Finally, the correlated horizons were digitized, plotted and contoured
Examples of seismic data are presented in the following figures:
Appendix 9.4
Ssismic data example
7.6 ORGANIC MASKING In some areas within survey area A, the quality of seismic data was adversely affected by masking. This is probably caused by the presence of organic materials and gas bubbles in the sediments which absorb the seismic energy and thereby preventing reflections from deeper horizons. The masked zones are outlined in Figures 6.1 – 6.6 (see Appendix 9.6). Very little useable seismic data could be obtained over these masked zones. 8 RESULTS 8.1 PRESENTATION The results have been presented as follows: DRAWINGS (Presented in Appendix 9.6) Figures 2.1 to 2.3 Contoured Sounding Plan, Area A Figures 2.4 to 2.6 Contoured Sounding Plan, Area B Figures 3.1 to 3.3 Contoured Levels at the Base of Marine Deposits, Area A Figures 3.4 to 3.6 Contoured Levels at the Base of Marine Deposits, Area B Figures 6.1 to 6.3 Contoured Isopachs of Marine Deposits, Area A Figures 6.4 to 6.6 Contoured Isopachs of Marine Deposits, Area B Figures 7.1 to 7.3 Seabed Features, Area A Figures 7.4 to 7.6 Seabed Features, Area B
��������������
���
���
��������
� ����������� ����
�� �� ��
�� ���������
�����������������
���� ����
� ����������� �� ��
Appendix 9.4
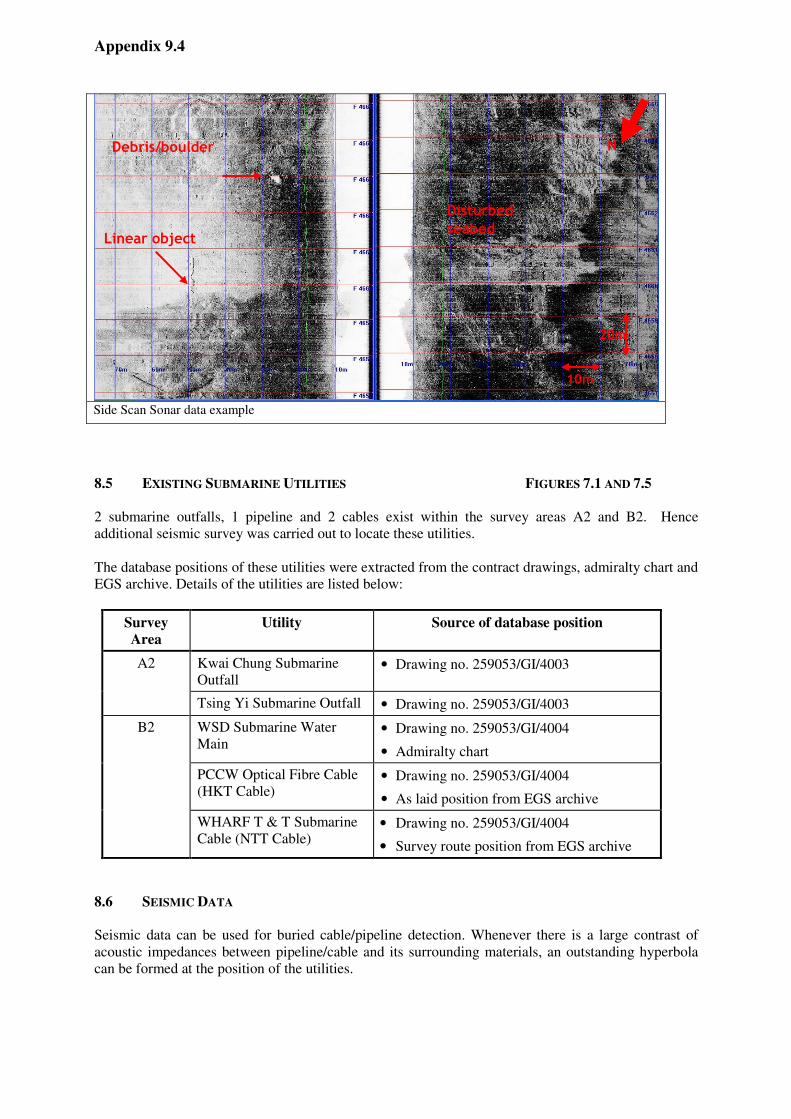
8.2 CONTOURED SOUNDING PLAN FIGURES 2.1 TO 2.6 The seabed in the areas surveyed is generally flat with depths varying from -14mCD (close to the shore) to -18mCD. Deep depressions, most likely relate to dredging activity, are apparent on the northern portion of survey area B. 8.3 MARINE DEPOSITS FIGURES 3.1 TO 3.6 AND 6.1 TO 6.6 Figures 3.1 to 3.6 illustrate the general regime of the base of the marine deposits. Incised channels formed on the surface of alluvium are apparent in survey area A. Isopachs of marine deposits are presented on Figures 6.1 to 6.6. For area A, the thickness of marine deposits is very thin in the north where the bedrock level is shallow. The layer gets thicker approaching to the South of Tsing Yi with maximum thickness of almost 20m. For area B, the Marine Deposit layer is also thin in the north and gets thicker to the south (up to 32m thick). It was noticed that Marine Deposit Layer was missing at the NE edge of the survey area. It is believed generated by the sand borrow activity. 8.4 SEA BED FEATURES FIGURES 7.1 TO 7.6 As shown on the drawings, the survey areas were predominately covered with soft and fine sediments. Some rock outcrops/boulders/construction related materials were observed at the northern end of area A. Rubble and materials possibly relate to the existing Tsing Yi and Kwai Chung submarine outfalls are apparent along their alignment. Over area A and in the northern part of area B, the seabed was appeared to be highly irregular and disturbed. Scattered debris and seabed scars were commonly found from the side scan data. It is likely that these features are related to previous dredging and dumping activities. Areas with loose sand covered with veneer of soft sily/clay was outlined based on the seismic data and previous ground investigation records. However, it should be noted that the extent of fill area is less certain, as the seismic data is unclear due to organic masking. A total of 74 sonar contacts were identified from the side scan sonar data. All sonar contacts are believed to be sizeable debris, boulders or tyres which are related to dumping activity. Examples of side scan data are shown below for reference.
Appendix 9.4
Side Scan Sonar data example
8.5 EXISTING SUBMARINE UTILITIES FIGURES 7.1 AND 7.5 2 submarine outfalls, 1 pipeline and 2 cables exist within the survey areas A2 and B2. Hence additional seismic survey was carried out to locate these utilities. The database positions of these utilities were extracted from the contract drawings, admiralty chart and EGS archive. Details of the utilities are listed below:
Survey Area
Utility Source of database position
Kwai Chung Submarine Outfall
• Drawing no. 259053/GI/4003 A2
Tsing Yi Submarine Outfall • Drawing no. 259053/GI/4003
WSD Submarine Water Main
• Drawing no. 259053/GI/4004
• Admiralty chart
PCCW Optical Fibre Cable (HKT Cable)
• Drawing no. 259053/GI/4004
• As laid position from EGS archive
B2
WHARF T & T Submarine Cable (NTT Cable)
• Drawing no. 259053/GI/4004
• Survey route position from EGS archive 8.6 SEISMIC DATA Seismic data can be used for buried cable/pipeline detection. Whenever there is a large contrast of acoustic impedances between pipeline/cable and its surrounding materials, an outstanding hyperbola can be formed at the position of the utilities.
������!��������
"�������#�$��
%�
���
&���
����������
��������
Appendix 9.4
Seismic data acquired in the survey were inspected thoroughly for the detection of the existing utilities. Below are the examples of seismic data where hyperbolas were observed.
Seismic data example
9 PRESENTATION OF DATA IN CONTOURED FORM Presentation of data in contoured form implies knowledge of the level of each horizon between survey lines. The extent to which such interpolation is justified depends on the traverse separation, and on the topographic relief of the horizon in question. Where traverses are closely spaced and for smooth horizons, the interpolation error will be small, but for surfaces the level of which fluctuates rapidly, errors between survey lines could greatly exceed the estimates given below. 9.1 ESTIMATES OF ACCURACY, ALL HORIZONS The following estimates of accuracy would seem to be appropriate in this case: Sounding +/- 0.25m Base of Marine Deposits +/- 1 m Top of Rock in Any State of Decomposition +/- 2 m Top of Grade III, II Rock +/- 5 m 10 CONCLUSIONS The survey has served to measure the seabed in detail and to reveal the subsurface condition below seabed, as well as to identify any features on the seabed. In addition, positions of the existing utilities were presented based on the geophysical data.


![C201700217a02 ODII ] M Route A10 …FileLinkedWithBanner...After Tsing Ma Bridge, divert via North West Tsing Yi Interchange, Tsing Yi North Coastal Road, Tsing Tsuen Road, Tsuen Wan](https://static.documents.pub/doc/80x56/5f1dd138b0549a02df11c484/c201700217a02-odii-m-route-a10-filelinkedwithbanner-after-tsing-ma-bridge.jpg)


