41
Emerging Markets Package KwaZulu-Natal 2018
EmergingMarketsPackage
KwaZulu-Natal2018

1. Mpumalanga2. Clermont3. Chesterville4. KwaMashu5. Lamontville6. Umlazi 7. Ezakheni 8. Steadville 9. Madadeni 10. Osizweni 11. Esikhawini12. Kwambonambi 13. Bhekuzulu
KwaZulu-Natal
ListofTownships
(CatoRidge)(Durban)(Durban)(Durban)(Durban)(Durban)(Ladysmith)(Ladysmith)(Newcastle)(Newcastle)(RichardsBay)(RichardsBay)(Vryheid)
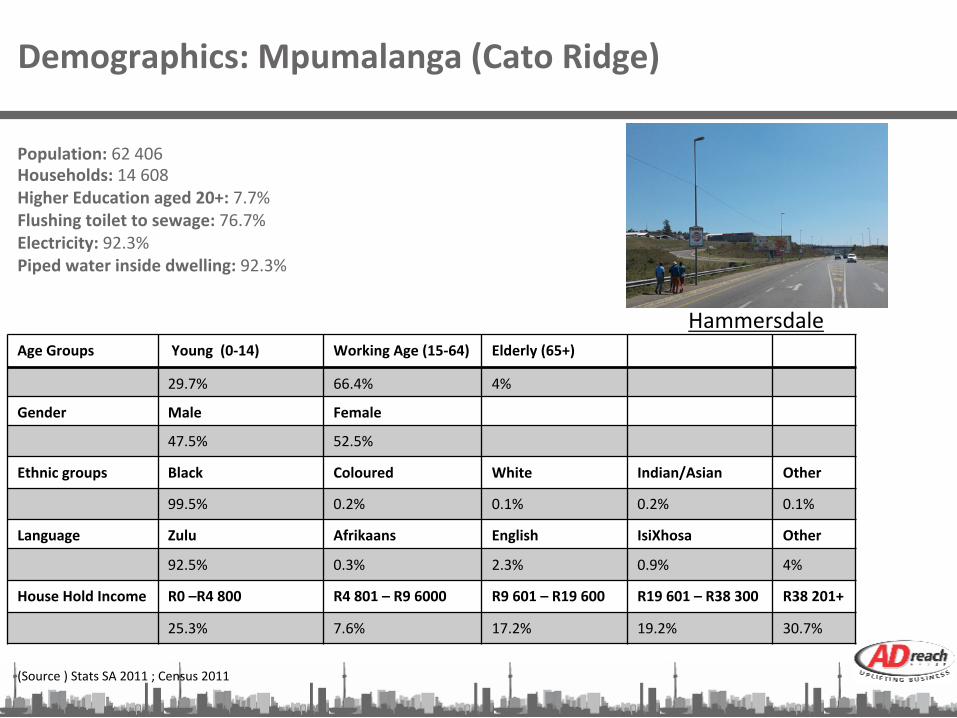
Demographics:Mpumalanga(CatoRidge)
Population:62406Households:14608HigherEducationaged20+:7.7%Flushingtoilettosewage:76.7%Electricity:92.3%Pipedwaterinsidedwelling:92.3%
AgeGroups Young(0-14) WorkingAge(15-64) Elderly(65+)
29.7% 66.4% 4%
Gender Male Female
47.5% 52.5%
Ethnicgroups Black Coloured White Indian/Asian Other
99.5% 0.2% 0.1% 0.2% 0.1%
Language Zulu Afrikaans English IsiXhosa Other
92.5% 0.3% 2.3% 0.9% 4%
HouseHoldIncome R0–R4800 R4801–R96000 R9601–R19600 R19601–R38300 R38201+
25.3% 7.6% 17.2% 19.2% 30.7%
Hammersdale
(Source)StatsSA2011;Census2011

MapofMpumalanga:Pointsofinterest
(Source)Mapdatac2018AfriGIS(Pty)LtdGoogle
RoadExamples
1. Mr385Road2. KellyRoad3. MthokoMkhizeRoad4. 74095Street5. KuneneRoad6. 400122Street
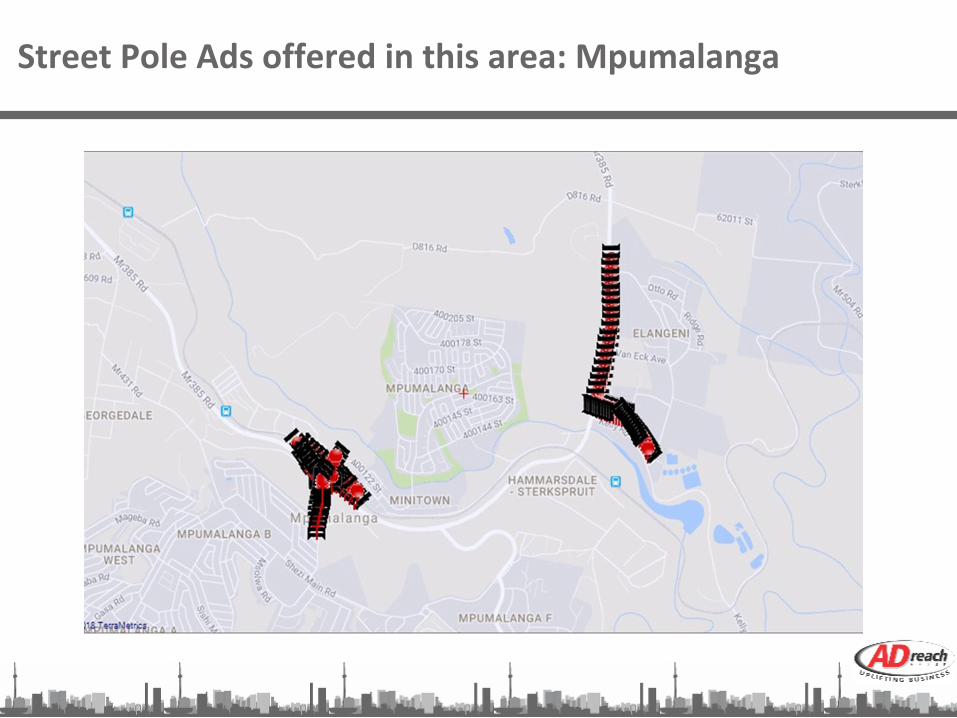
StreetPoleAdsofferedinthisarea:Mpumalanga
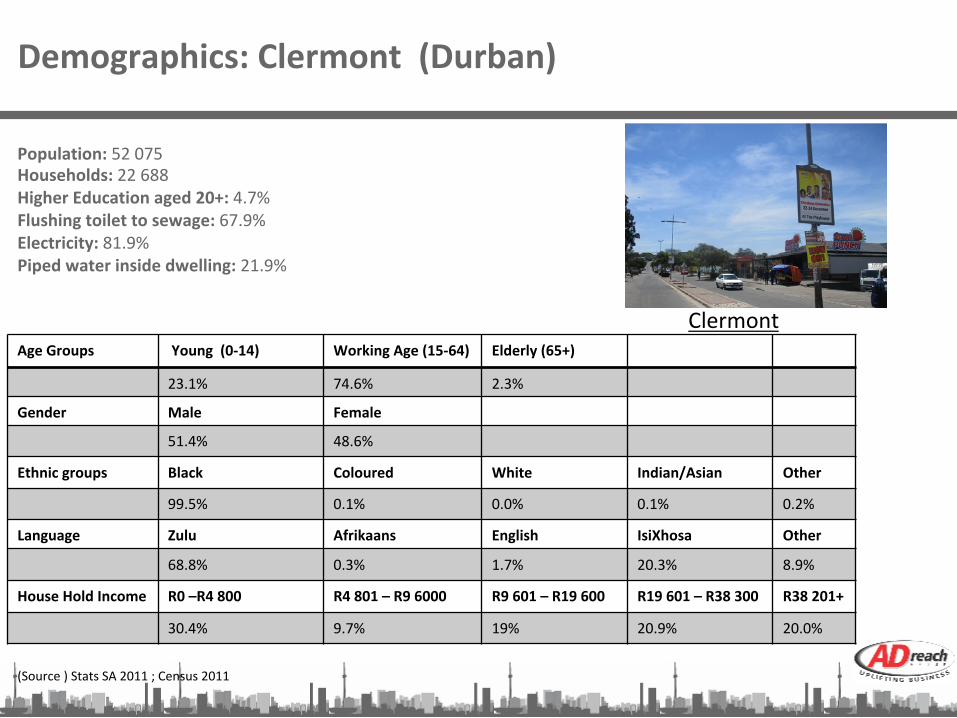
Demographics:Clermont(Durban)
Population:52075Households:22688HigherEducationaged20+:4.7%Flushingtoilettosewage:67.9%Electricity:81.9%Pipedwaterinsidedwelling:21.9%
AgeGroups Young(0-14) WorkingAge(15-64) Elderly(65+)
23.1% 74.6% 2.3%
Gender Male Female
51.4% 48.6%
Ethnicgroups Black Coloured White Indian/Asian Other
99.5% 0.1% 0.0% 0.1% 0.2%
Language Zulu Afrikaans English IsiXhosa Other
68.8% 0.3% 1.7% 20.3% 8.9%
HouseHoldIncome R0–R4800 R4801–R96000 R9601–R19600 R19601–R38300 R38201+
30.4% 9.7% 19% 20.9% 20.0%
Clermont
(Source)StatsSA2011;Census2011

MapofClermont:Pointsofinterest
(Source)Mapdatac2018AfriGIS(Pty)LtdGoogle
RoadExamples1. ClermontRoad2. ZaziRoad

StreetPoleAdsofferedinthisarea:Clermont
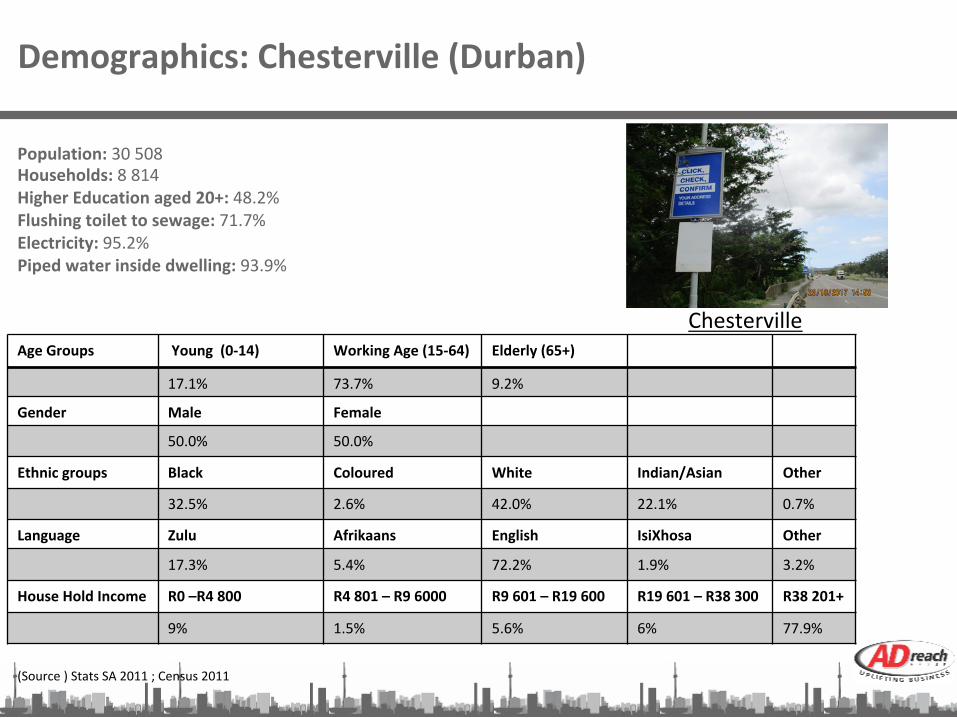
Demographics:Chesterville(Durban)
Population:30508Households:8814HigherEducationaged20+:48.2%Flushingtoilettosewage:71.7%Electricity:95.2%Pipedwaterinsidedwelling:93.9%
AgeGroups Young(0-14) WorkingAge(15-64) Elderly(65+)
17.1% 73.7% 9.2%
Gender Male Female
50.0% 50.0%
Ethnicgroups Black Coloured White Indian/Asian Other
32.5% 2.6% 42.0% 22.1% 0.7%
Language Zulu Afrikaans English IsiXhosa Other
17.3% 5.4% 72.2% 1.9% 3.2%
HouseHoldIncome R0–R4800 R4801–R96000 R9601–R19600 R19601–R38300 R38201+
9% 1.5% 5.6% 6% 77.9%
Chesterville
(Source)StatsSA2011;Census2011

MapofChesterville:Pointsofinterest
(Source)Mapdatac2018AfriGIS(Pty)LtdGoogle
RoadExamples
1. HarryGwalaRoad2. MahlathiRoad
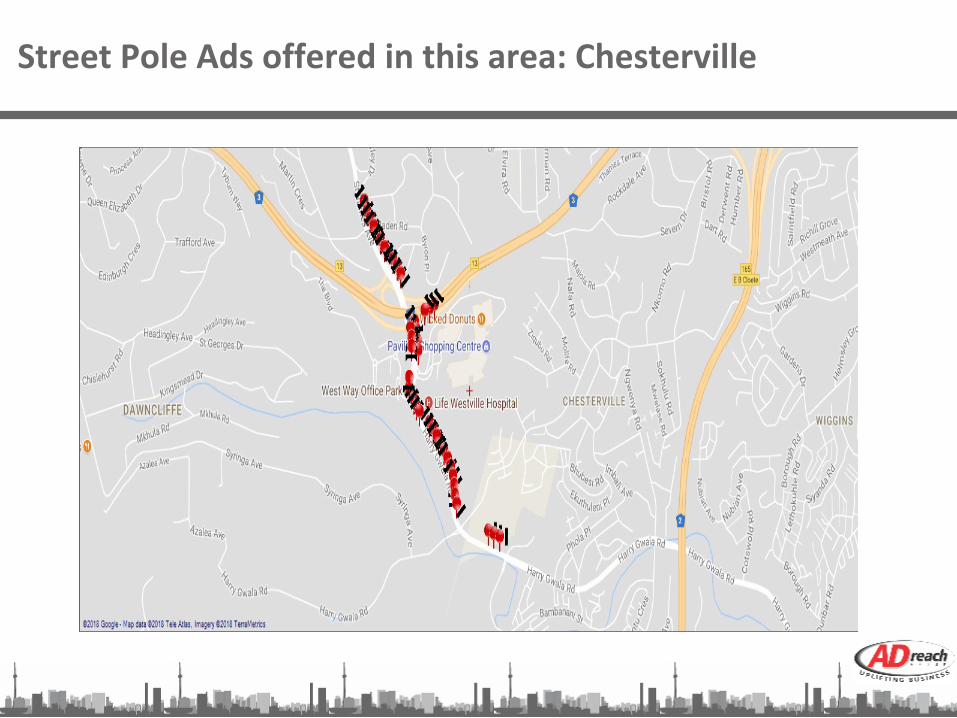
StreetPoleAdsofferedinthisarea:Chesterville
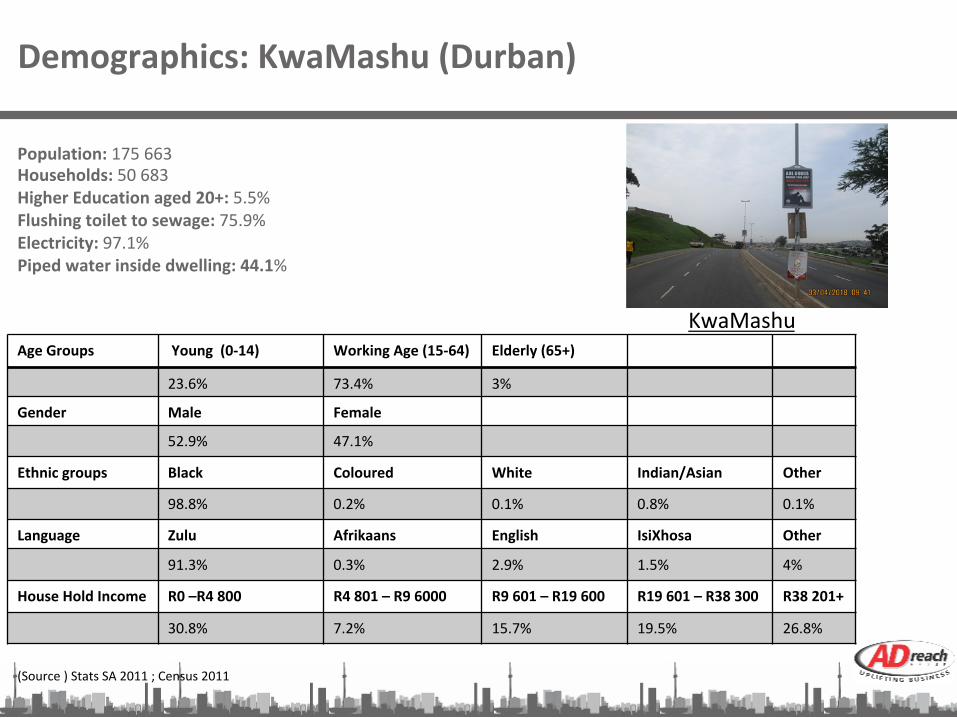
Demographics:KwaMashu(Durban)
Population:175663Households:50683HigherEducationaged20+:5.5%Flushingtoilettosewage:75.9%Electricity:97.1%Pipedwaterinsidedwelling:44.1%
AgeGroups Young(0-14) WorkingAge(15-64) Elderly(65+)
23.6% 73.4% 3%
Gender Male Female
52.9% 47.1%
Ethnicgroups Black Coloured White Indian/Asian Other
98.8% 0.2% 0.1% 0.8% 0.1%
Language Zulu Afrikaans English IsiXhosa Other
91.3% 0.3% 2.9% 1.5% 4%
HouseHoldIncome R0–R4800 R4801–R96000 R9601–R19600 R19601–R38300 R38201+
30.8% 7.2% 15.7% 19.5% 26.8%
KwaMashu
(Source)StatsSA2011;Census2011
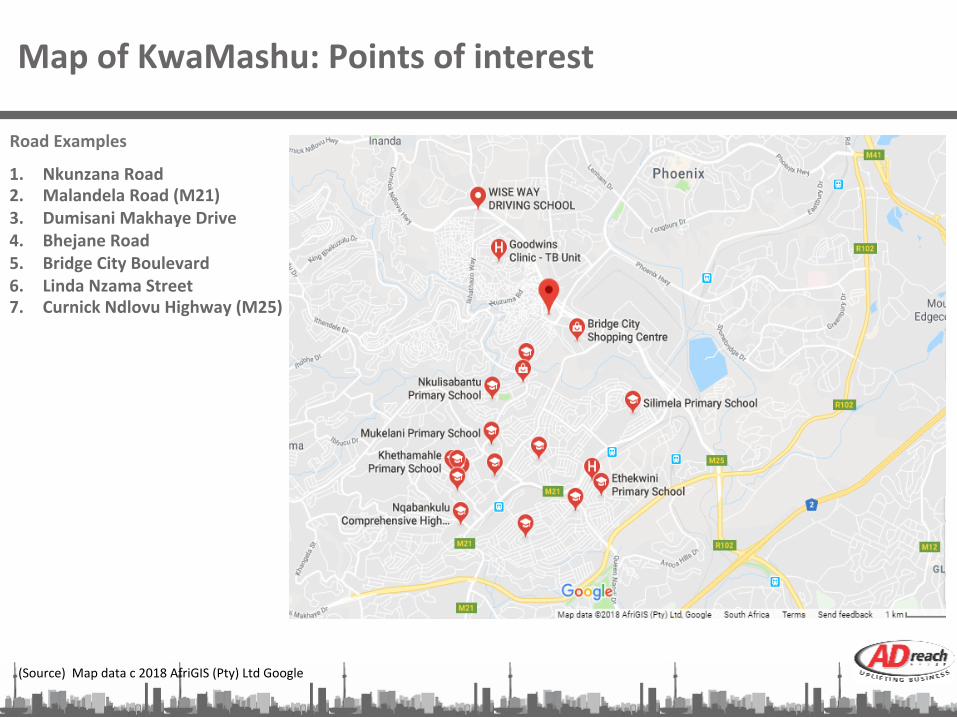
MapofKwaMashu:Pointsofinterest
(Source)Mapdatac2018AfriGIS(Pty)LtdGoogle
RoadExamples
1. NkunzanaRoad2. MalandelaRoad(M21)3. DumisaniMakhayeDrive4. BhejaneRoad5. BridgeCityBoulevard6. LindaNzamaStreet7. CurnickNdlovuHighway(M25)

StreetPoleAdsofferedinthisarea:KwaMashu

Demographics:Lamontville(Durban)
Population:196580Households:54497HigherEducationaged20+:7.4%Flushingtoilettosewage:82.4%Electricity:91.0%Pipedwaterinsidedwelling:79.1%
AgeGroups Young(0-14) WorkingAge(15-64) Elderly(65+)
20.6% 72.5% 6.9%
Gender Male Female
48.3% 51.7%
Ethnicgroups Black Coloured White Indian/Asian Other
38.2% 1.2% 0.1% 60.0% 0.5%
Language Zulu Afrikaans English IsiXhosa Other
26.2% 0.8% 62.6% 5.7% 4.7%
HouseHoldIncome R0–R4800 R4801–R96000 R9601–R19600 R19601–R38300 R38201+
17.6% 4.6% 14.8% 16.8% 46.2%
Lamontville
(Source)StatsSA2011;Census2011
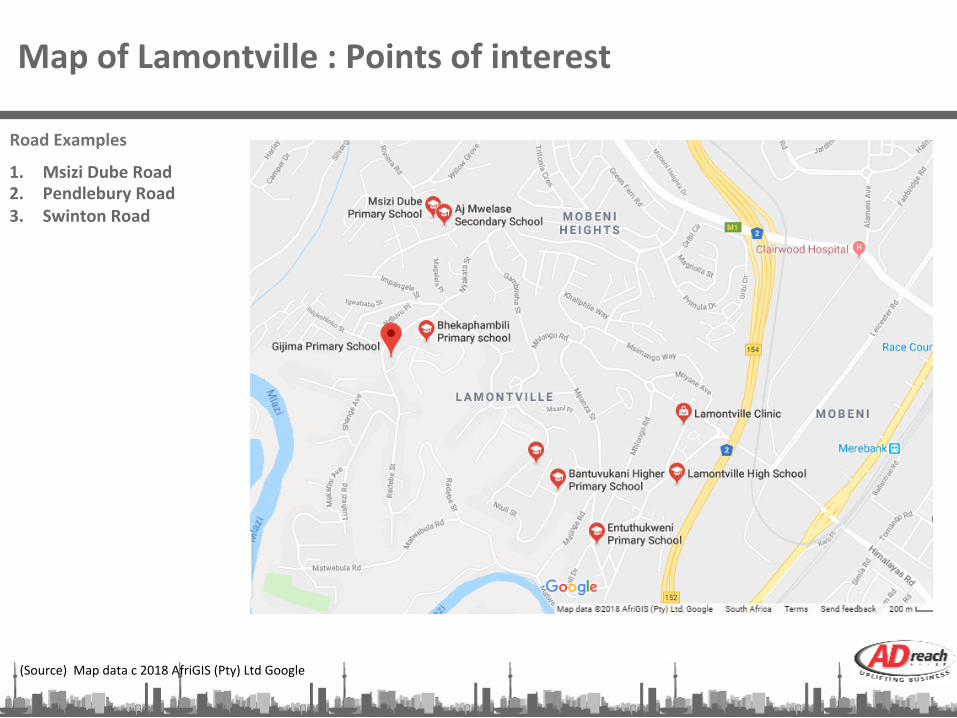
MapofLamontville:Pointsofinterest
(Source)Mapdatac2018AfriGIS(Pty)LtdGoogle
RoadExamples
1. MsiziDubeRoad2. PendleburyRoad3. SwintonRoad
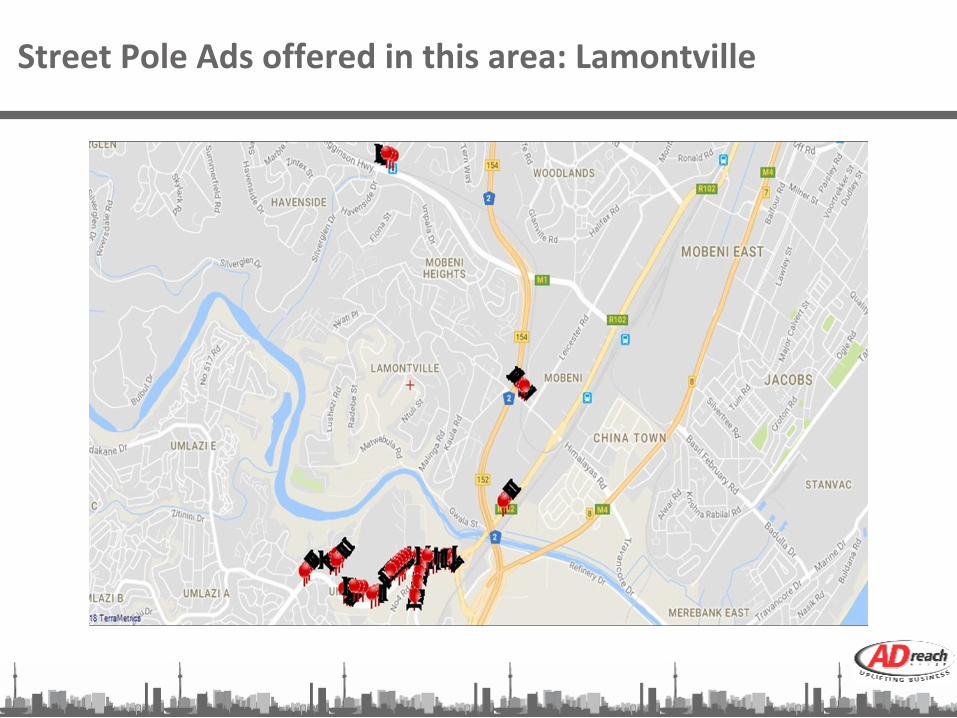
StreetPoleAdsofferedinthisarea:Lamontville
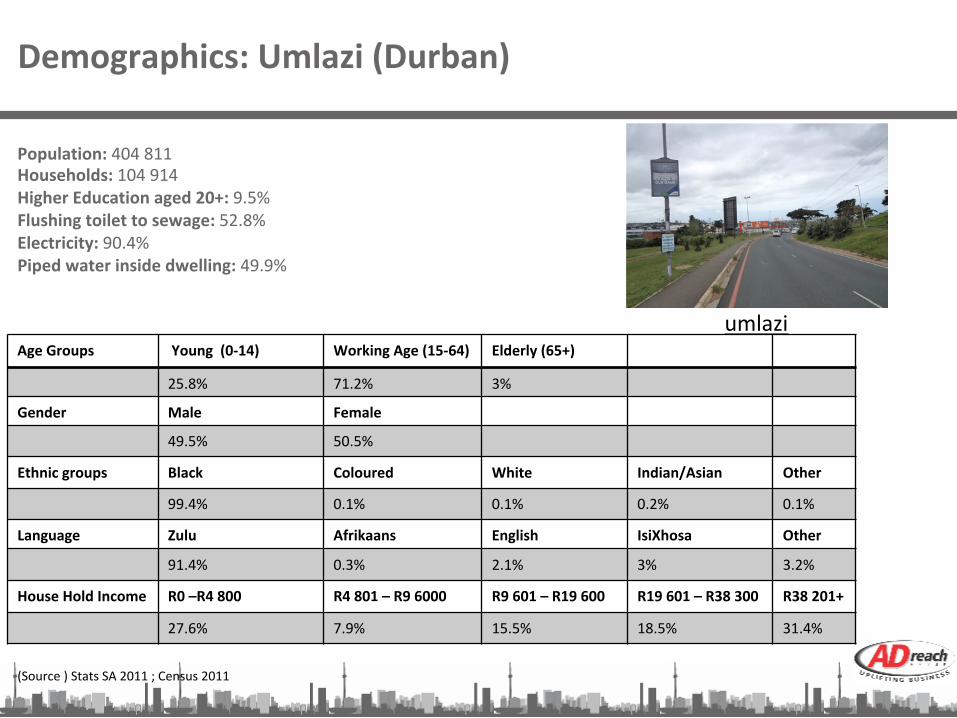
Demographics:Umlazi(Durban)
Population:404811Households:104914HigherEducationaged20+:9.5%Flushingtoilettosewage:52.8%Electricity:90.4%Pipedwaterinsidedwelling:49.9%
AgeGroups Young(0-14) WorkingAge(15-64) Elderly(65+)
25.8% 71.2% 3%
Gender Male Female
49.5% 50.5%
Ethnicgroups Black Coloured White Indian/Asian Other
99.4% 0.1% 0.1% 0.2% 0.1%
Language Zulu Afrikaans English IsiXhosa Other
91.4% 0.3% 2.1% 3% 3.2%
HouseHoldIncome R0–R4800 R4801–R96000 R9601–R19600 R19601–R38300 R38201+
27.6% 7.9% 15.5% 18.5% 31.4%
umlazi
(Source)StatsSA2011;Census2011
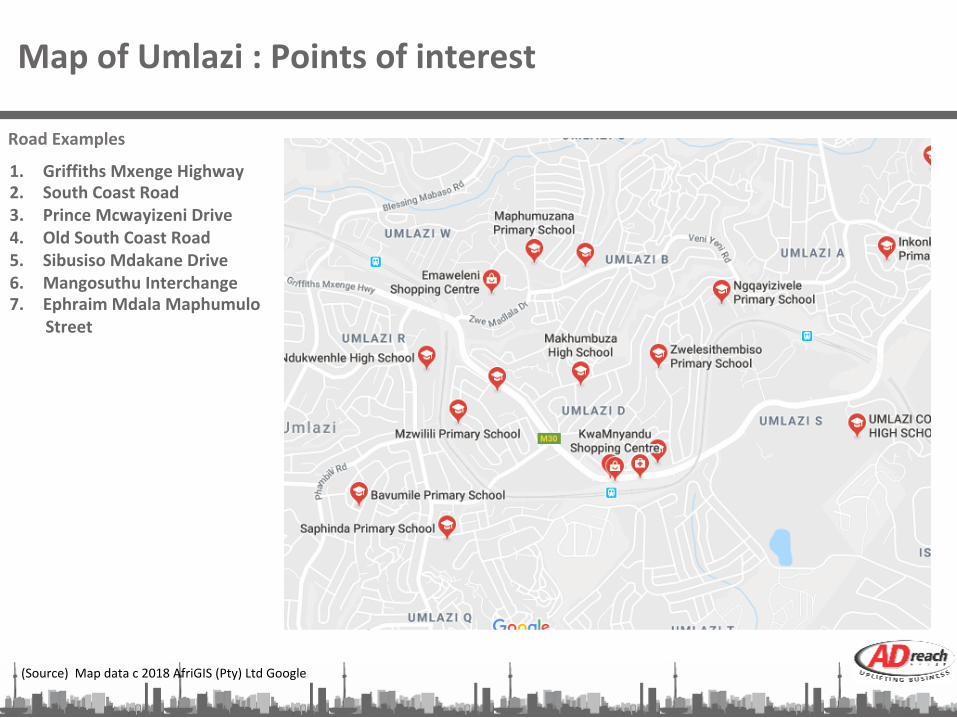
MapofUmlazi:Pointsofinterest
(Source)Mapdatac2018AfriGIS(Pty)LtdGoogle
RoadExamples
1. GriffithsMxengeHighway2. SouthCoastRoad3. PrinceMcwayizeniDrive4. OldSouthCoastRoad5. SibusisoMdakaneDrive6. MangosuthuInterchange7. EphraimMdalaMaphumulo
Street
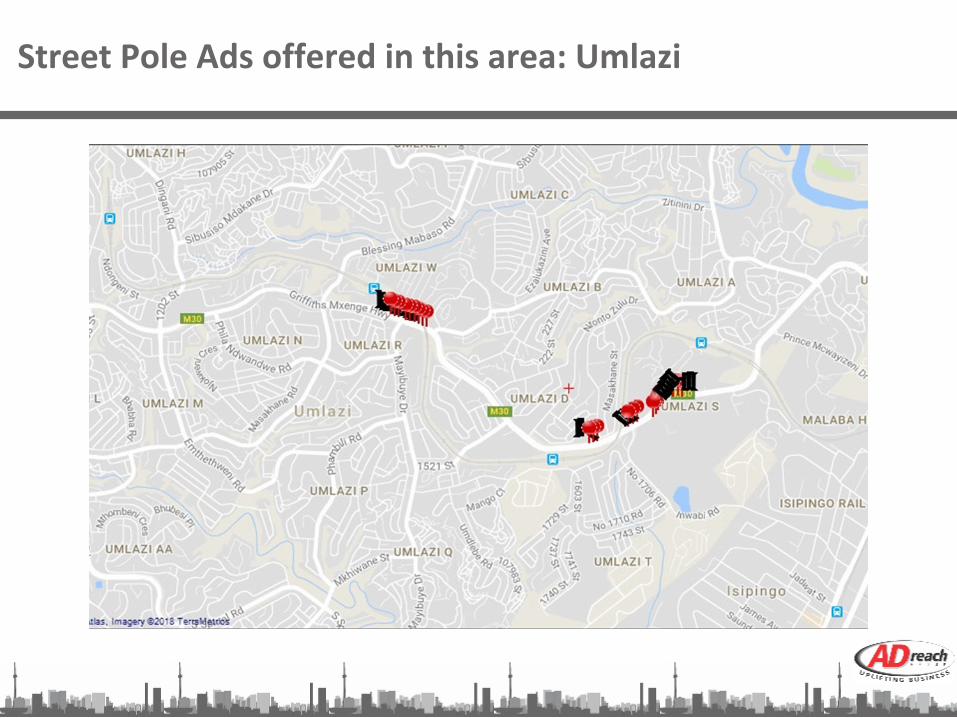
StreetPoleAdsofferedinthisarea:Umlazi
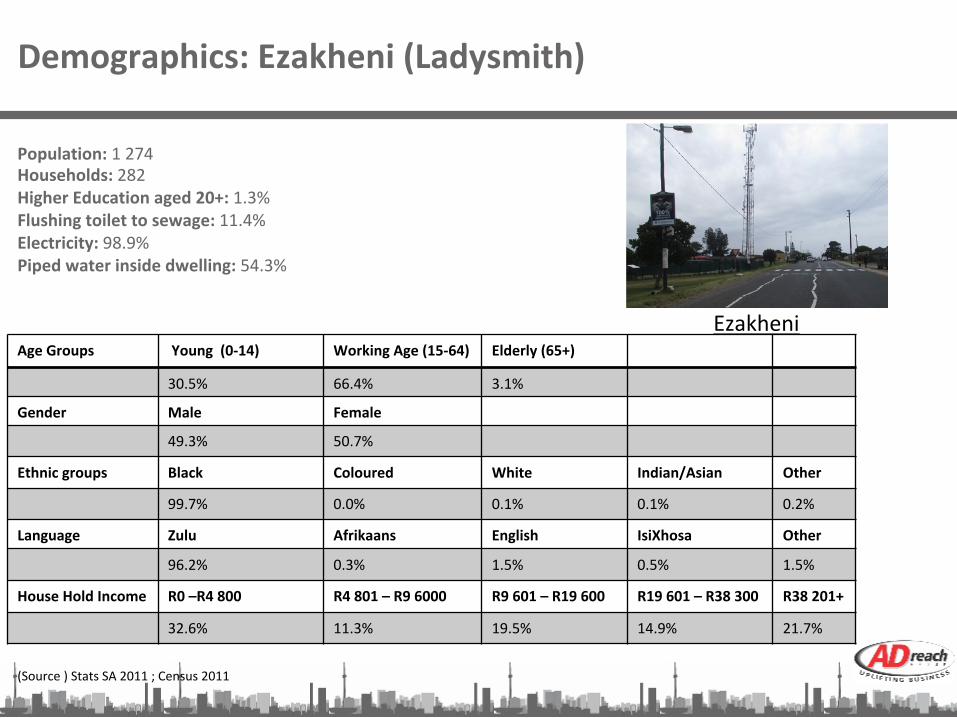
Demographics:Ezakheni(Ladysmith)
Population:1274Households:282HigherEducationaged20+:1.3%Flushingtoilettosewage:11.4%Electricity:98.9%Pipedwaterinsidedwelling:54.3%
AgeGroups Young(0-14) WorkingAge(15-64) Elderly(65+)
30.5% 66.4% 3.1%
Gender Male Female
49.3% 50.7%
Ethnicgroups Black Coloured White Indian/Asian Other
99.7% 0.0% 0.1% 0.1% 0.2%
Language Zulu Afrikaans English IsiXhosa Other
96.2% 0.3% 1.5% 0.5% 1.5%
HouseHoldIncome R0–R4800 R4801–R96000 R9601–R19600 R19601–R38300 R38201+
32.6% 11.3% 19.5% 14.9% 21.7%
Ezakheni
(Source)StatsSA2011;Census2011
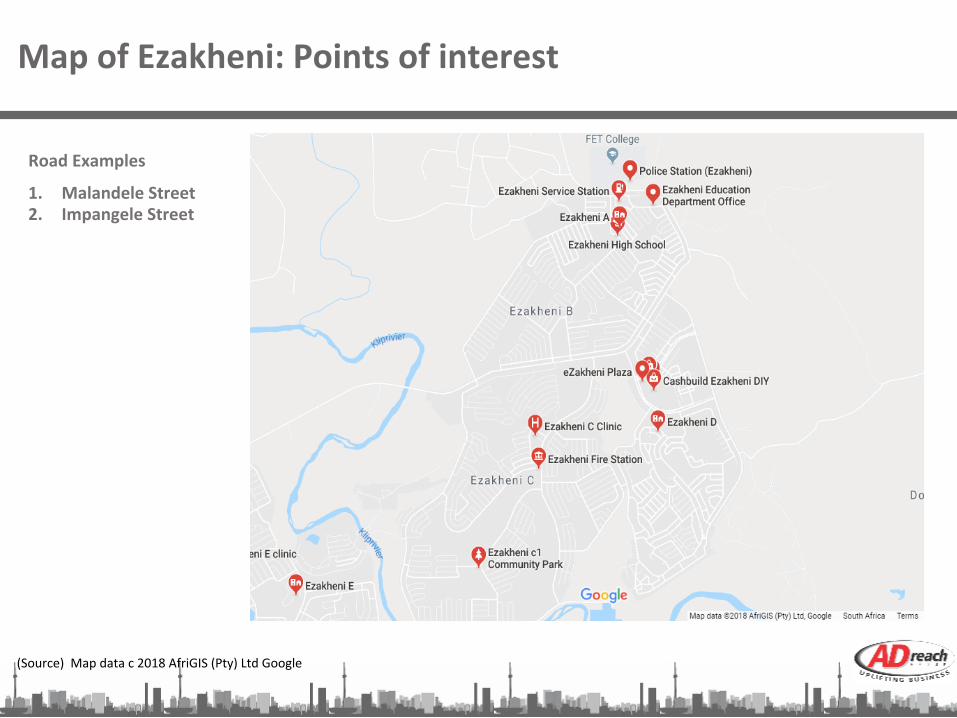
MapofEzakheni:Pointsofinterest
(Source)Mapdatac2018AfriGIS(Pty)LtdGoogle
RoadExamples
1. MalandeleStreet2. ImpangeleStreet
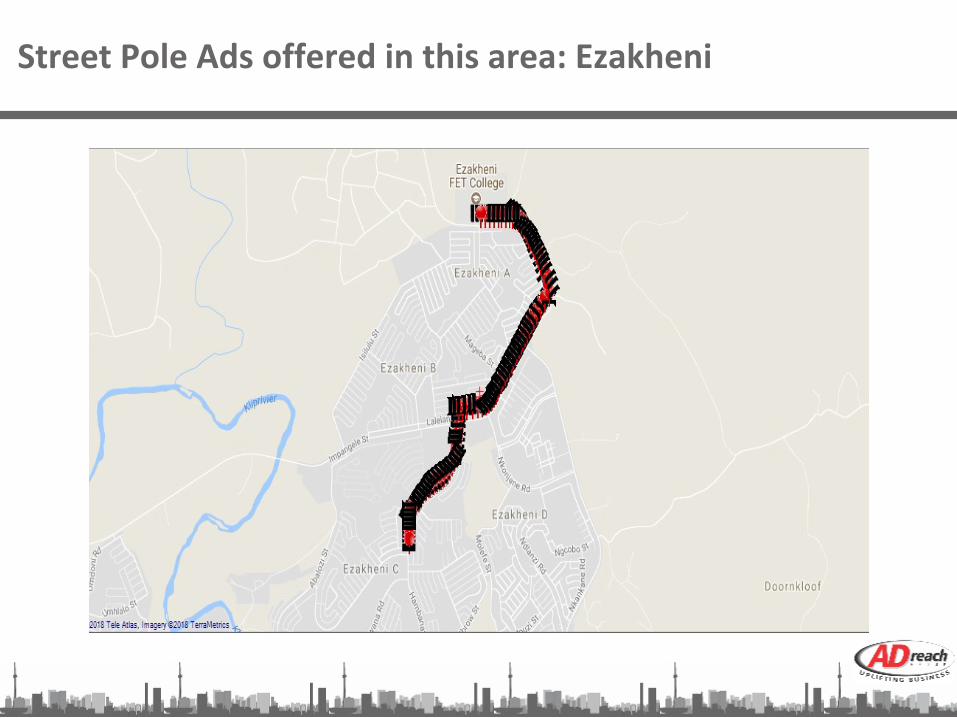
StreetPoleAdsofferedinthisarea:Ezakheni

Demographics:Steadville(Ladysmith)
Population:237437Households:58058HigherEducationaged20+:9%Flushingtoilettosewage:56.1%Electricity:82.1%Pipedwaterinsidedwelling:45.4%
AgeGroups Young(0-14) WorkingAge(15-64) Elderly(65+)
33.3% 62.2% 4.5%
Gender Male Female
47% 53%
Ethnicgroups Black Coloured White Indian/Asian Other
91.8% 1% 2.7% 4.4% 0.2%
Language Zulu Afrikaans English IsiXhosa Other
85.3% 2.2% 7.3% 0.3% 4.9%
HouseHoldIncome R0–R4800 R4801–R96000 R9601–R19600 R19601–R38300 R38201+
20.1% 9% 20% 19.9% 31%
Steadville
(Source)StatsSA2011;Census2011

MapofSteadville:Pointsofinterest
(Source)Mapdatac2018AfriGIS(Pty)LtdGoogle
RoadExamples
1. MandelaRoad2. TsahaneDrive

StreetPoleAdsofferedinthisarea:Steadville

Demographics:Madadeni(Newcastle)
Population:119497Households:27431HigherEducationaged20+:10.7%Flushingtoilettosewage:61.8%Electricity:97.1%Pipedwaterinsidedwelling:57.9%
AgeGroups Young(0-14) WorkingAge(15-64) Elderly(65+)
31.2% 64.8% 3.9%
Gender Male Female
47.2% 52.8%
Ethnicgroups Black Coloured White Indian/Asian Other
99.4% 0.2% 0.1% 0.2% 0.1%
Language Zulu Afrikaans English IsiXhosa Other
94.4% 0.2% 1.2% 0.3% 3.9%
HouseHoldIncome R0–R4800 R4801–R96000 R9601–R19600 R19601–R38300 R38201+
26.4% 8.8% 18.4% 18.4% 28%
Madadeni
(Source)StatsSA2011;Census2011

MapofMadadeni:Pointsofinterest
(Source)Mapdatac2018AfriGIS(Pty)LtdGoogle
RoadExamples
1. NkosiAlbertLuthuliRoad
2. NelsonMandelaRoad3. DrFtMolaldseRoad4. Ma42Street
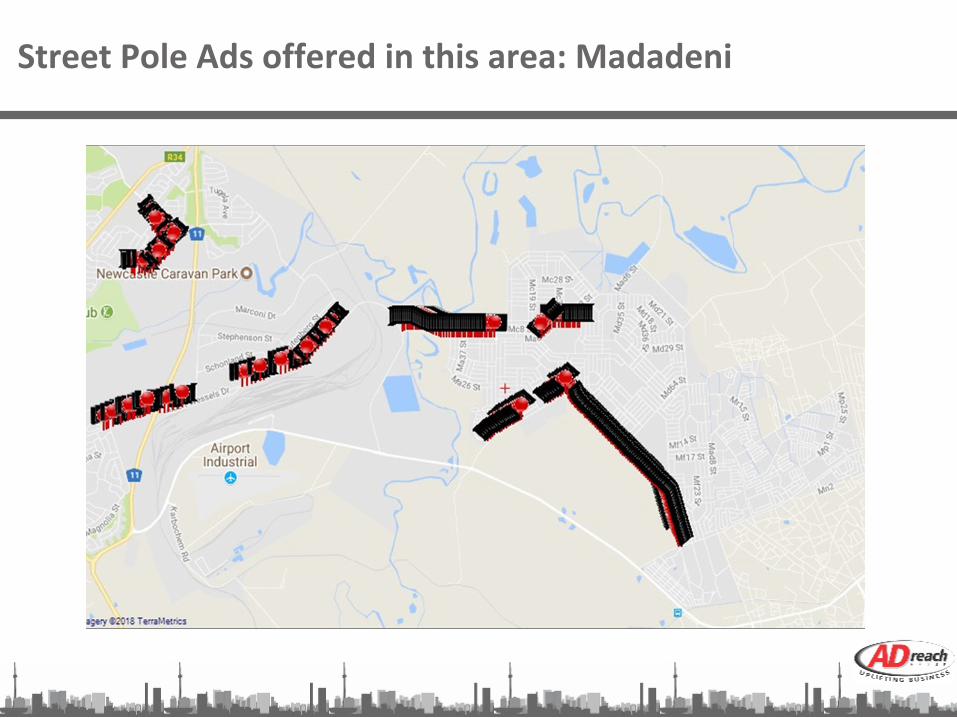
StreetPoleAdsofferedinthisarea:Madadeni
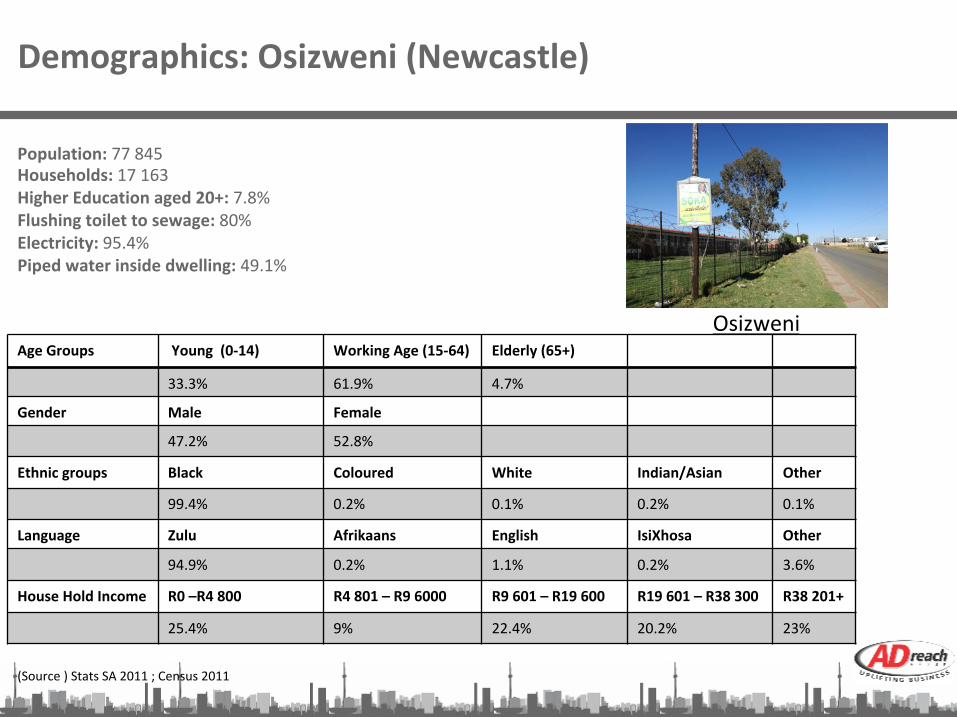
Demographics:Osizweni(Newcastle)
Population:77845Households:17163HigherEducationaged20+:7.8%Flushingtoilettosewage:80%Electricity:95.4%Pipedwaterinsidedwelling:49.1%
AgeGroups Young(0-14) WorkingAge(15-64) Elderly(65+)
33.3% 61.9% 4.7%
Gender Male Female
47.2% 52.8%
Ethnicgroups Black Coloured White Indian/Asian Other
99.4% 0.2% 0.1% 0.2% 0.1%
Language Zulu Afrikaans English IsiXhosa Other
94.9% 0.2% 1.1% 0.2% 3.6%
HouseHoldIncome R0–R4800 R4801–R96000 R9601–R19600 R19601–R38300 R38201+
25.4% 9% 22.4% 20.2% 23%
Osizweni
(Source)StatsSA2011;Census2011
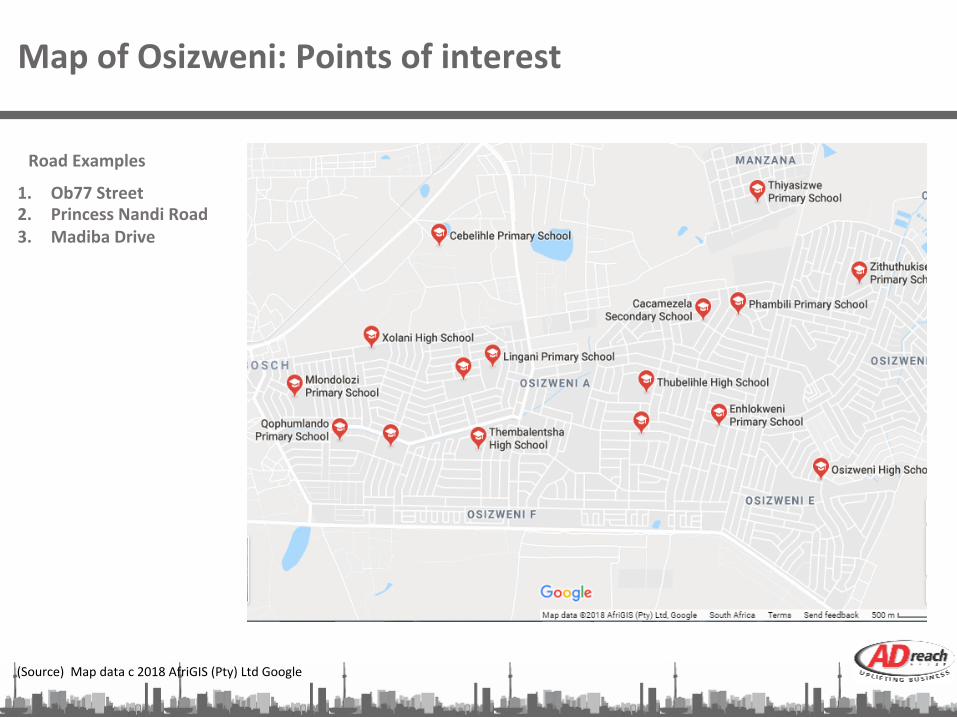
MapofOsizweni:Pointsofinterest
(Source)Mapdatac2018AfriGIS(Pty)LtdGoogle
RoadExamples
1. Ob77Street2. PrincessNandiRoad3. MadibaDrive
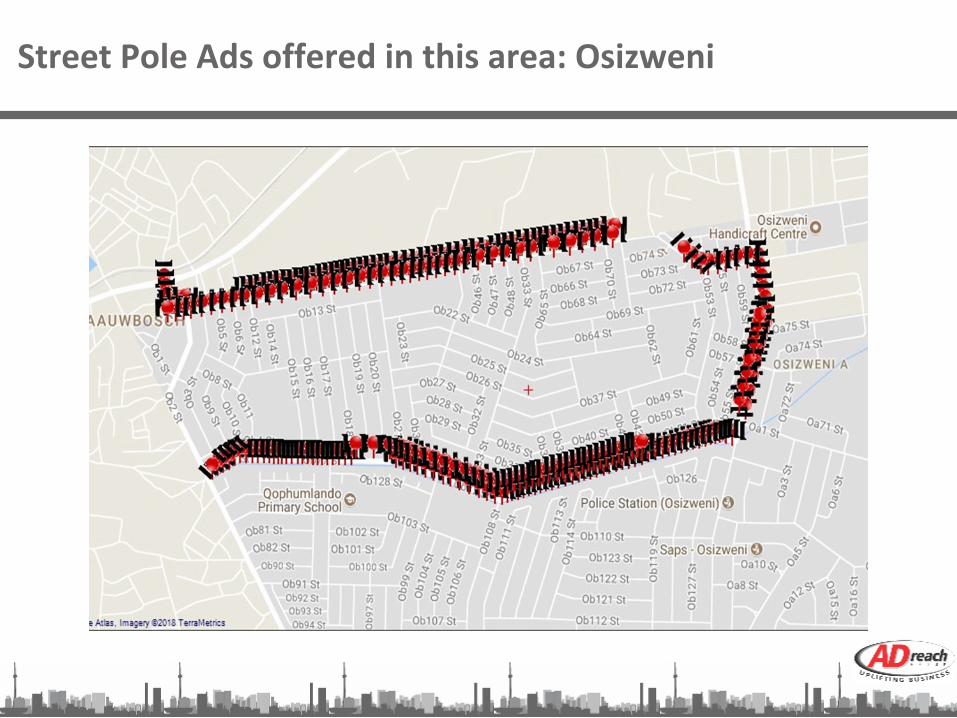
StreetPoleAdsofferedinthisarea:Osizweni
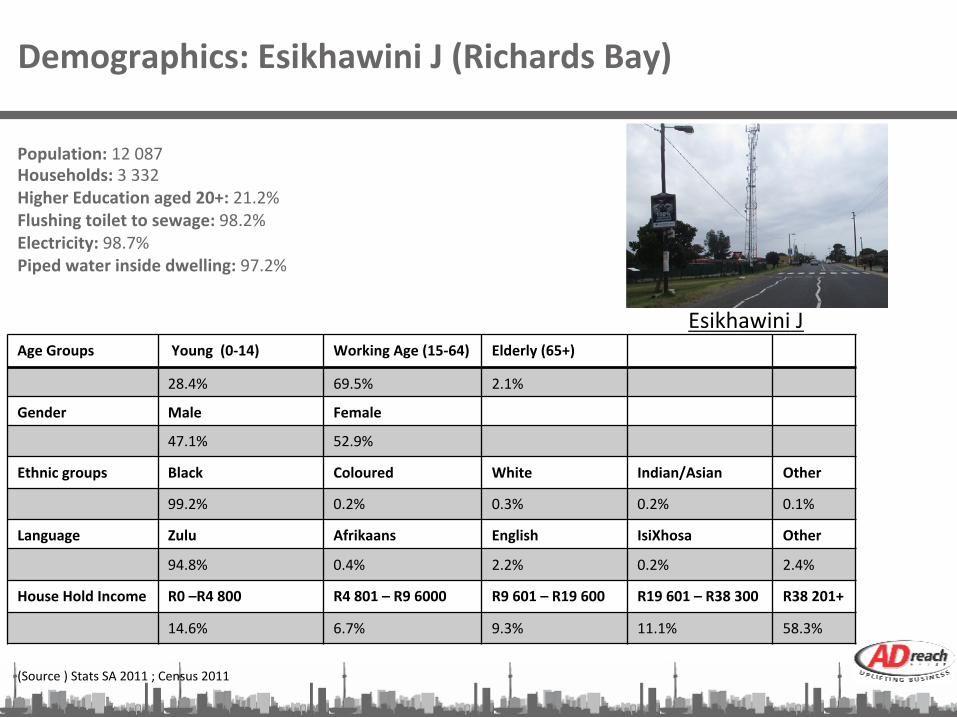
Demographics:EsikhawiniJ(RichardsBay)
Population:12087Households:3332HigherEducationaged20+:21.2%Flushingtoilettosewage:98.2%Electricity:98.7%Pipedwaterinsidedwelling:97.2%
AgeGroups Young(0-14) WorkingAge(15-64) Elderly(65+)
28.4% 69.5% 2.1%
Gender Male Female
47.1% 52.9%
Ethnicgroups Black Coloured White Indian/Asian Other
99.2% 0.2% 0.3% 0.2% 0.1%
Language Zulu Afrikaans English IsiXhosa Other
94.8% 0.4% 2.2% 0.2% 2.4%
HouseHoldIncome R0–R4800 R4801–R96000 R9601–R19600 R19601–R38300 R38201+
14.6% 6.7% 9.3% 11.1% 58.3%
EsikhawiniJ
(Source)StatsSA2011;Census2011
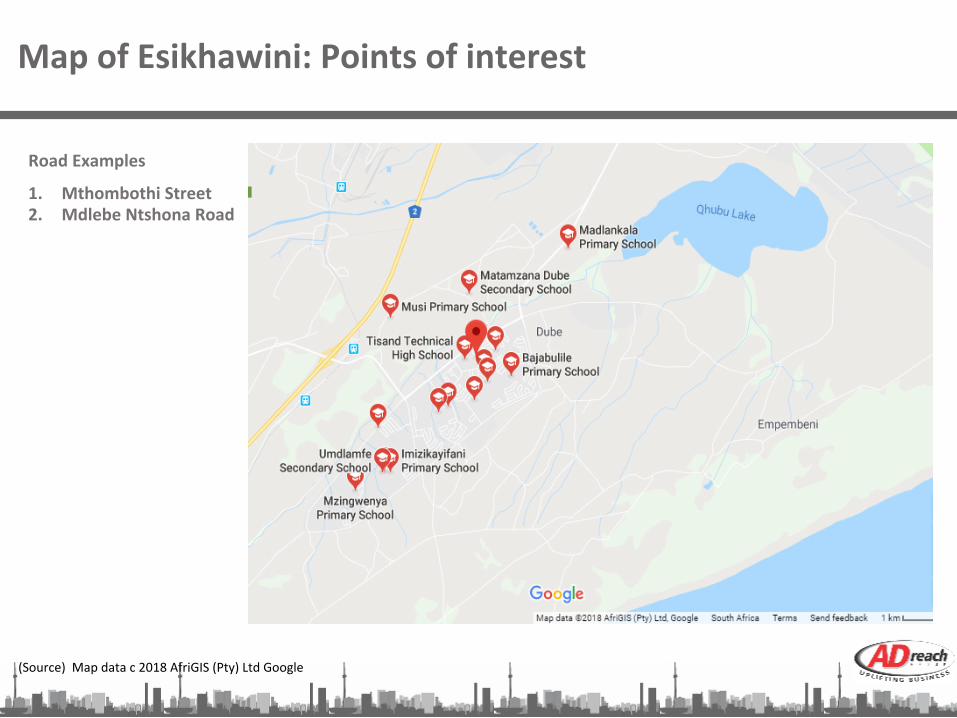
MapofEsikhawini:Pointsofinterest
(Source)Mapdatac2018AfriGIS(Pty)LtdGoogle
RoadExamples
1. MthombothiStreet2. MdlebeNtshonaRoad

StreetPoleAdsofferedinthisarea:Esikhawini

Demographics:Kwambonambi(RichardsBay)
Population:57387Households:15758HigherEducationaged20+:24.1%Flushingtoilettosewage:83.5%Electricity:96.2%Pipedwaterinsidedwelling:85.4%
AgeGroups Young(0-14) WorkingAge(15-64) Elderly(65+)
24.2% 72% 3.9%
Gender Male Female
49.9% 50.1%
Ethnicgroups Black Coloured White Indian/Asian Other
48.0% 3.2% 30.1% 18.2% 0.4%
Language Zulu Afrikaans English IsiXhosa Other
40.6% 21.5% 33.8% 0.7% 3.4%
HouseHoldIncome R0–R4800 R4801–R96000 R9601–R19600 R19601–R38300 R38201+
13.1% 2.4% 5.6% 6.7% 72.2%
Kwabonambi
(Source)StatsSA2011;Census2011
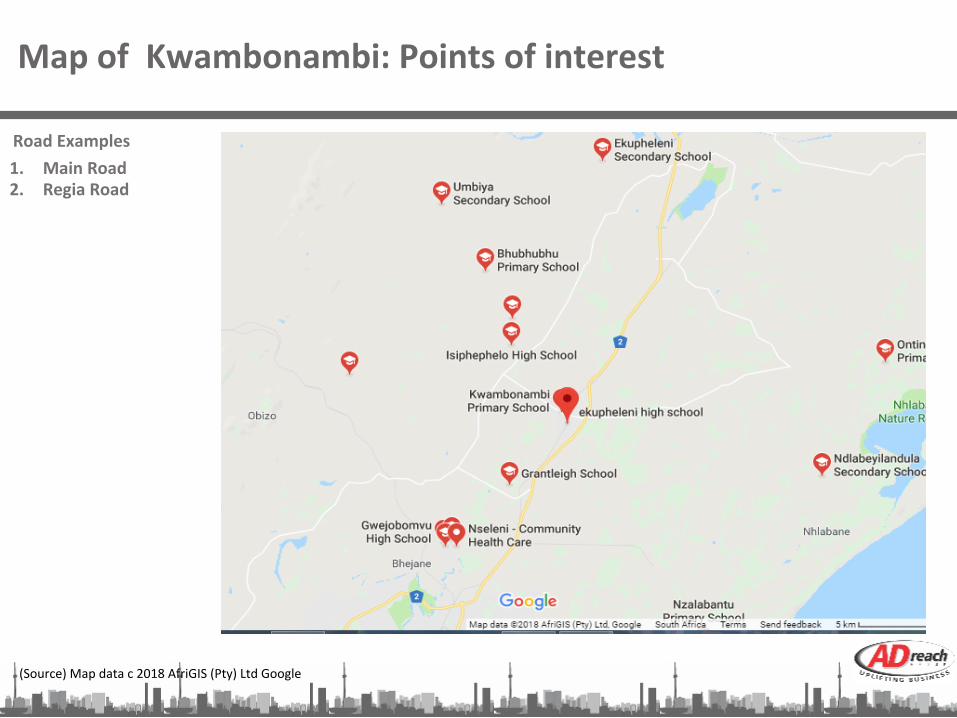
MapofKwambonambi:Pointsofinterest
(Source)Mapdatac2018AfriGIS(Pty)LtdGoogle
1. MainRoad2. RegiaRoad
RoadExamples
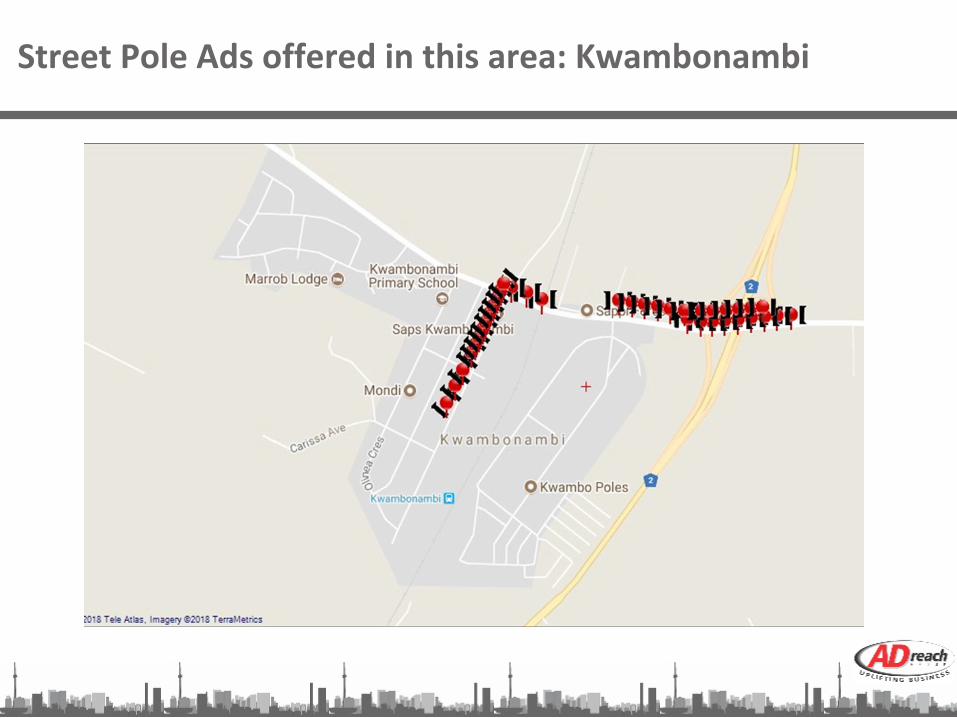
StreetPoleAdsofferedinthisarea:Kwambonambi
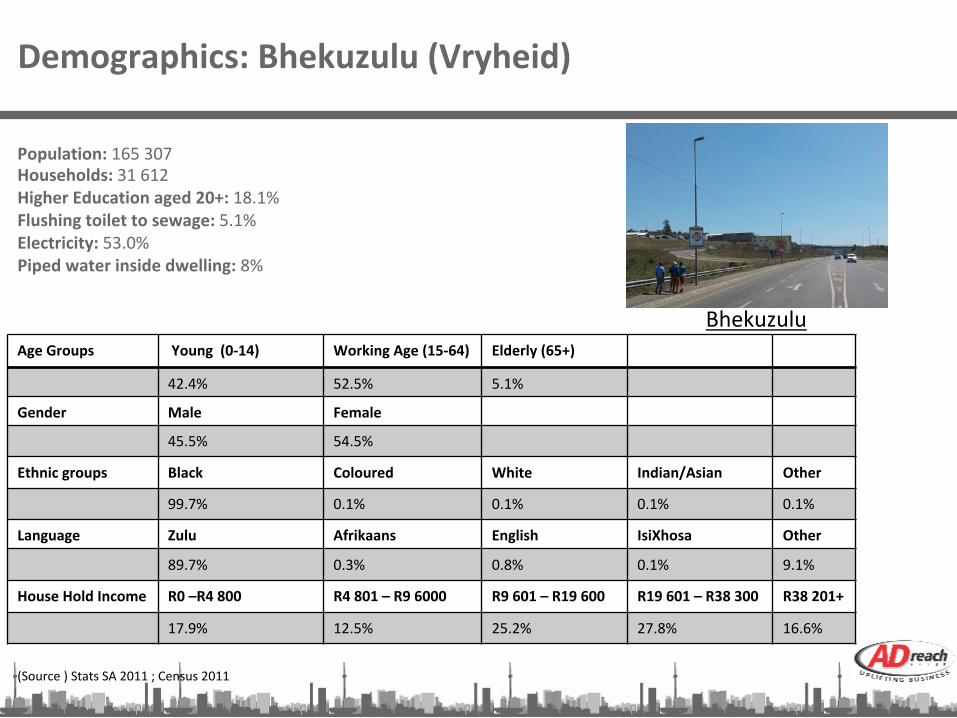
Demographics:Bhekuzulu(Vryheid)
Population:165307Households:31612HigherEducationaged20+:18.1%Flushingtoilettosewage:5.1%Electricity:53.0%Pipedwaterinsidedwelling:8%
AgeGroups Young(0-14) WorkingAge(15-64) Elderly(65+)
42.4% 52.5% 5.1%
Gender Male Female
45.5% 54.5%
Ethnicgroups Black Coloured White Indian/Asian Other
99.7% 0.1% 0.1% 0.1% 0.1%
Language Zulu Afrikaans English IsiXhosa Other
89.7% 0.3% 0.8% 0.1% 9.1%
HouseHoldIncome R0–R4800 R4801–R96000 R9601–R19600 R19601–R38300 R38201+
17.9% 12.5% 25.2% 27.8% 16.6%
Bhekuzulu
(Source)StatsSA2011;Census2011
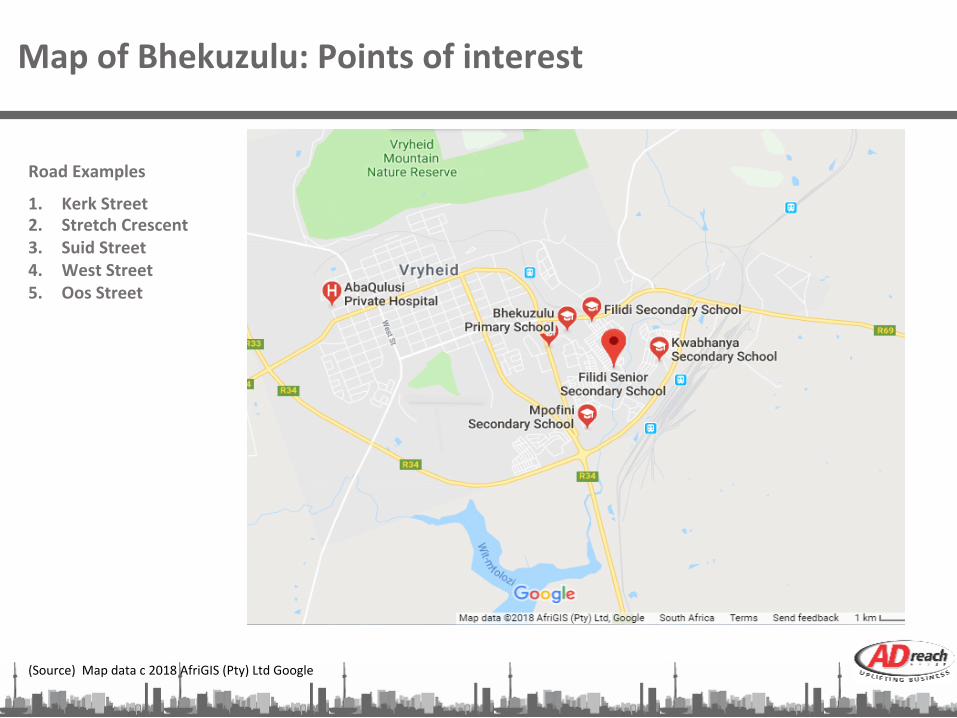
MapofBhekuzulu:Pointsofinterest
(Source)Mapdatac2018AfriGIS(Pty)LtdGoogle
1. KerkStreet2. StretchCrescent3. SuidStreet4. WestStreet5. OosStreet
RoadExamples
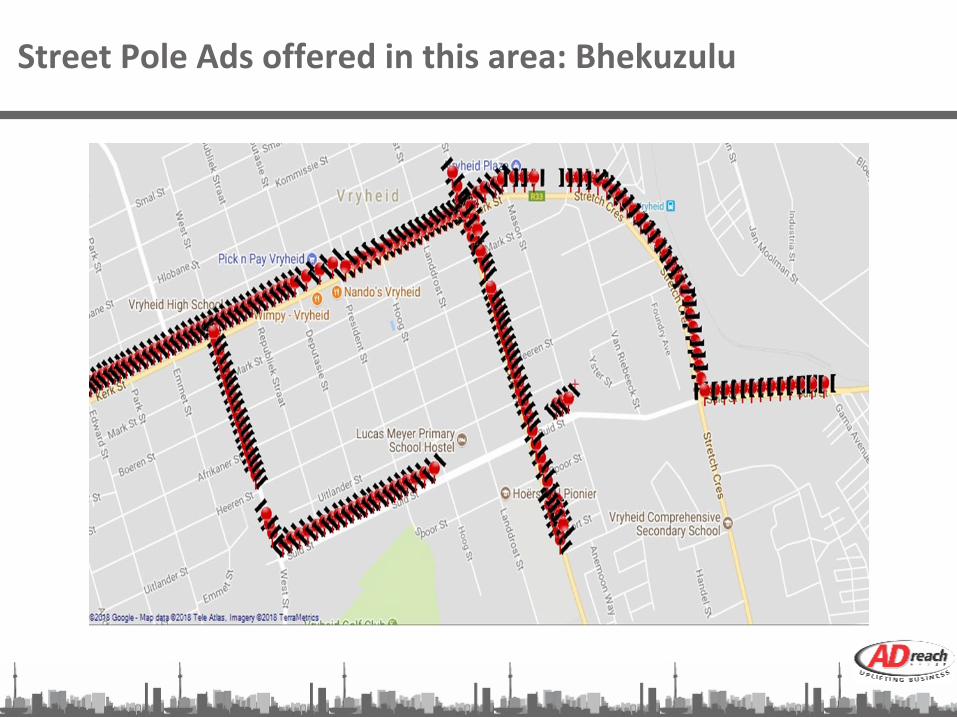
StreetPoleAdsofferedinthisarea:Bhekuzulu


