PROGRESS TOWARD THE FUTURE KYB Corporation Annual Report 2014 Year Ended March 31, 2014 Contents 1 Progress Toward the Future: Our Products 2 Progress Toward the Future: Our History 4 Ten-Years Summary 6 To Our Shareholders and Investors 8 Interview with the President 14 Corporate Governance 17 Risk Information 19 Topics 20 Consolidated Subsidiaries and Equity-Method Affiliates 22 Corporate Information 23 Shareholder Information 24 Financial Section Forward-Looking Statements This annual report contains forward-looking statements, including KYB’s plans and strategies, as well as statements that report historical results. Forward-looking statements involve such known and unknown risks and uncertainties as economic conditions; currency exchange rates; laws, regulations, and government policies; and political instability in principal markets.
Transcript
Progress Toward The FuTureKYB Corporation
Annual Report 2014 Year Ended March 31, 2014
Contents
1 Progress Toward the Future: Our Products
2 Progress Toward the Future: Our History
4 Ten-Years Summary
6 To Our Shareholders and Investors
8 Interview with the President
14 Corporate Governance
17 Risk Information
19 Topics
20 Consolidated Subsidiaries and Equity-Method Affiliates
22 Corporate Information
23 Shareholder Information
24 Financial Section
Forward-Looking Statements
This annual report contains forward-looking statements, including
KYB’s plans and strategies, as well as statements that report historical
results. Forward-looking statements involve such known and unknown
risks and uncertainties as economic conditions; currency exchange
rates; laws, regulations, and government policies; and political
instability in principal markets.
3 1
KYB Corporation Annual Report 2014
KYB Holding Company
Production Base
Sales Of�ce
2 Railroad Equipment
KYB Holding Company
Production Base
Sales Of�ce
Shock Absorbers
Vibration Control Devices
Vibration Control Dampers
Steer-by-wire Vane Pumps for CVT Hydraulic Systems
6
Hejacules (Self Propelled Hydraulic Jack)
8
1
2
3
4
Actuators
Semi-active Suspension Systems for Bullet Train Cars
Hydraulic Cylinders
Hydraulic Valves Concrete Mixer Trucks
5
Rear Cushion Units
DLC Coated Front Fork7
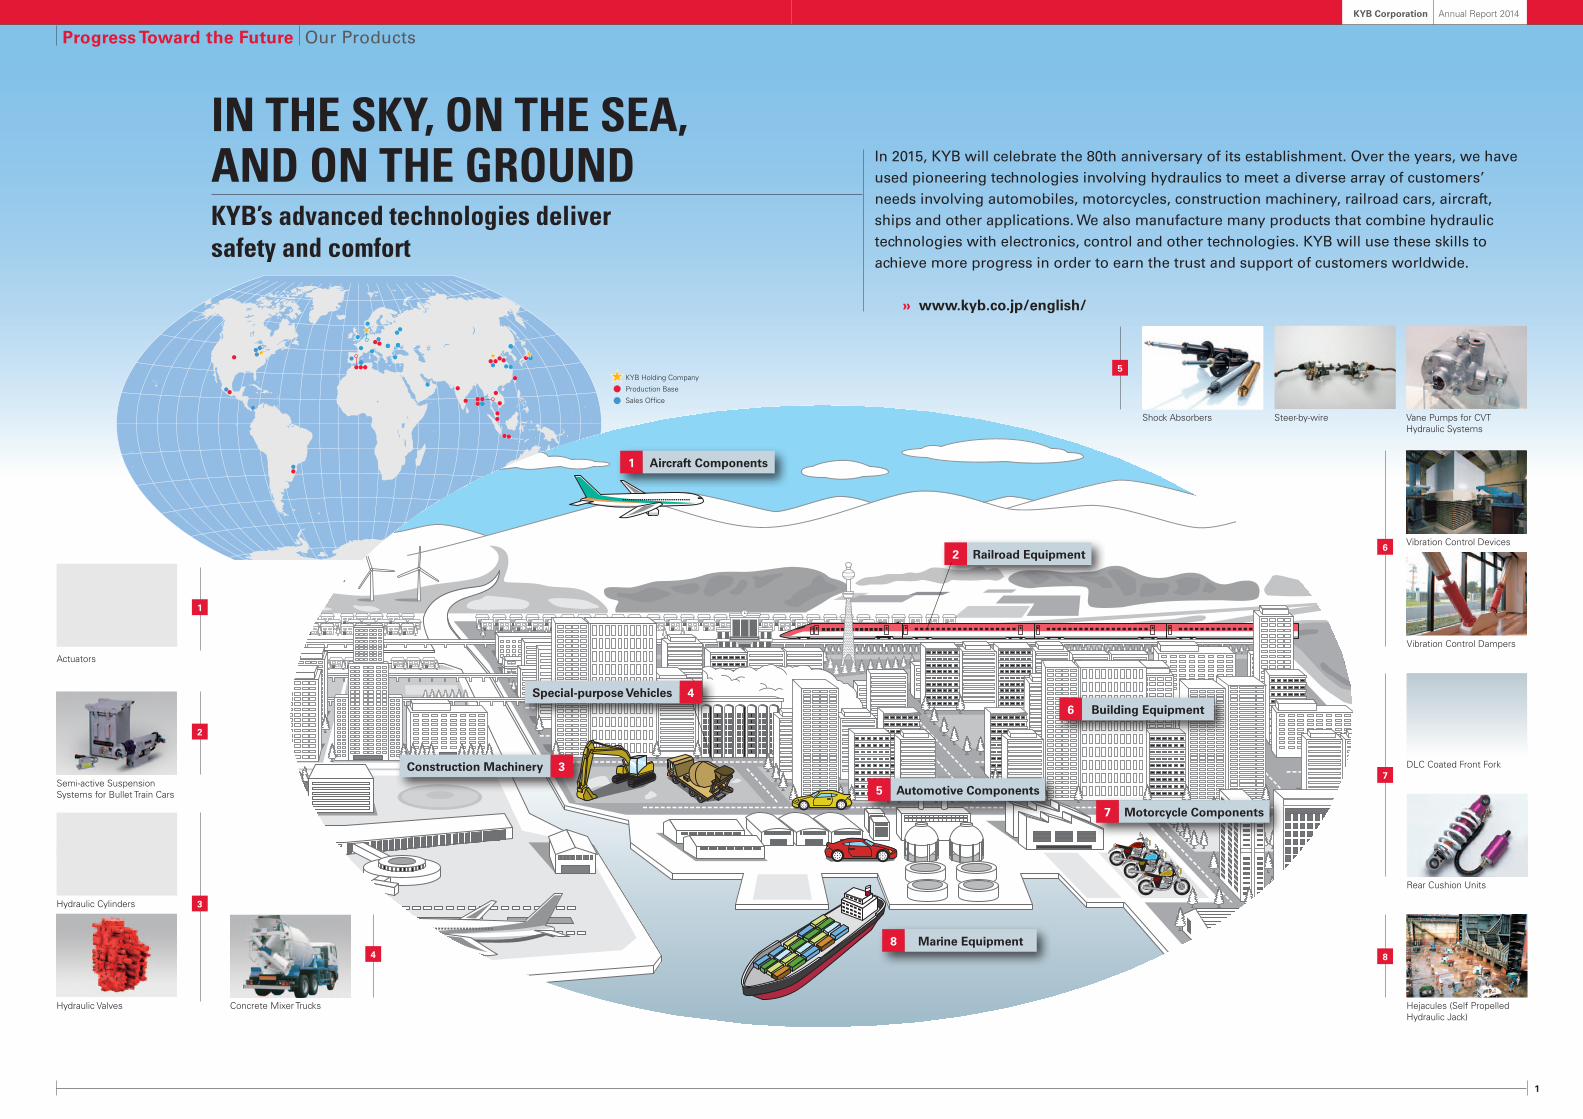
In 2015, KYB will celebrate the 80th anniversary of its establishment. Over the years, we have used pioneering technologies involving hydraulics to meet a diverse array of customers’ needs involving automobiles, motorcycles, construction machinery, railroad cars, aircraft, ships and other applications. We also manufacture many products that combine hydraulic technologies with electronics, control and other technologies. KYB will use these skills to achieve more progress in order to earn the trust and support of customers worldwide.
» www.kyb.co.jp/english/
Progress Toward the Future Our Products
IN The sKY, oN The sea, aNd oN The grouNdKYB’s advanced technologies deliver safety and comfort
3Construction Machinery
4Special-purpose Vehicles
1 Aircraft Components
5 Automotive Components
6 Building Equipment
8 Marine Equipment
Motorcycle Components7
2 3
KYB Corporation Annual Report 2014
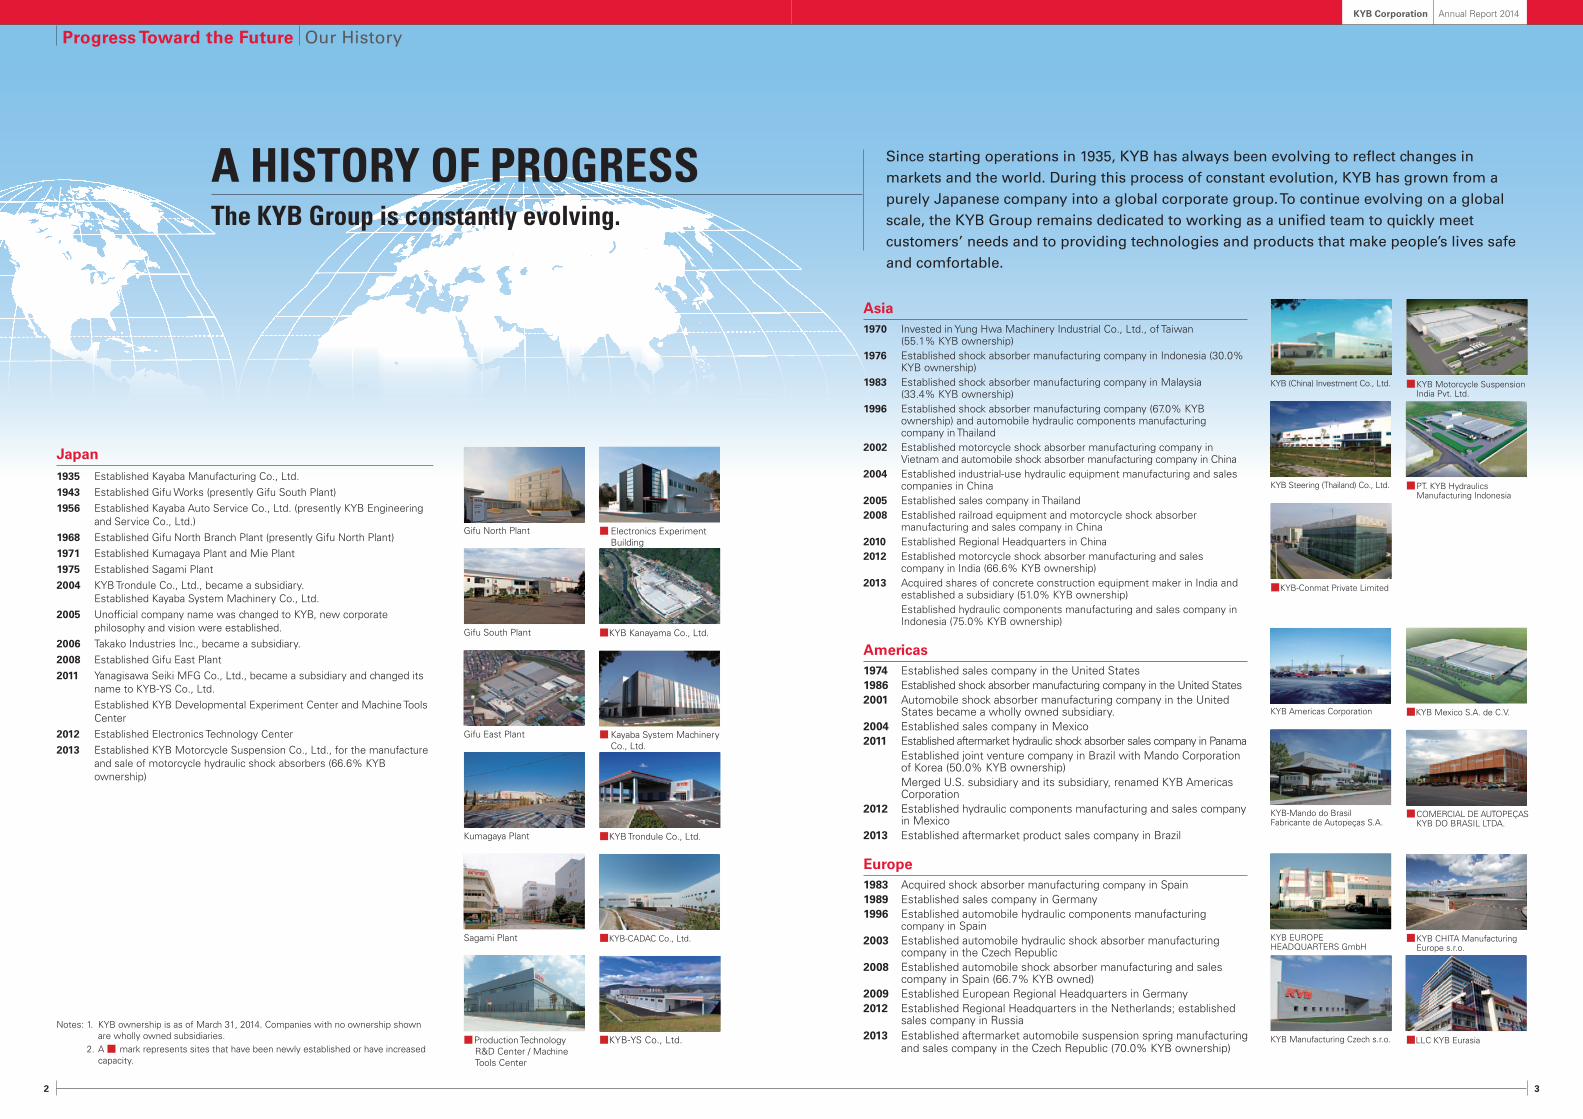
a hIsTorY oF ProgressThe KYB group is constantly evolving.
Since starting operations in 1935, KYB has always been evolving to reflect changes in markets and the world. During this process of constant evolution, KYB has grown from a purely Japanese company into a global corporate group. To continue evolving on a global scale, the KYB Group remains dedicated to working as a unified team to quickly meet customers’ needs and to providing technologies and products that make people’s lives safe and comfortable.
Japan1935 Established Kayaba Manufacturing Co., Ltd.1943 Established Gifu Works (presently Gifu South Plant)1956 Established Kayaba Auto Service Co., Ltd. (presently KYB Engineering
and Service Co., Ltd.) 1968 Established Gifu North Branch Plant (presently Gifu North Plant)1971 Established Kumagaya Plant and Mie Plant1975 Established Sagami Plant2004 KYB Trondule Co., Ltd., became a subsidiary.
Established Kayaba System Machinery Co., Ltd.2005 Unofficial company name was changed to KYB, new corporate
philosophy and vision were established.2006 Takako Industries Inc., became a subsidiary.2008 Established Gifu East Plant2011 Yanagisawa Seiki MFG Co., Ltd., became a subsidiary and changed its
name to KYB-YS Co., Ltd. Established KYB Developmental Experiment Center and Machine Tools
Center2012 Established Electronics Technology Center2013 Established KYB Motorcycle Suspension Co., Ltd., for the manufacture
and sale of motorcycle hydraulic shock absorbers (66.6% KYB ownership)
Asia1970 Invested in Yung Hwa Machinery Industrial Co., Ltd., of Taiwan
(55.1% KYB ownership)1976 Established shock absorber manufacturing company in Indonesia (30.0%
KYB ownership)1983 Established shock absorber manufacturing company in Malaysia
(33.4% KYB ownership)1996 Established shock absorber manufacturing company (67.0% KYB
ownership) and automobile hydraulic components manufacturing company in Thailand
2002 Established motorcycle shock absorber manufacturing company in Vietnam and automobile shock absorber manufacturing company in China
2004 Established industrial-use hydraulic equipment manufacturing and sales companies in China
2005 Established sales company in Thailand2008 Established railroad equipment and motorcycle shock absorber
manufacturing and sales company in China2010 Established Regional Headquarters in China2012 Established motorcycle shock absorber manufacturing and sales
company in India (66.6% KYB ownership)2013 Acquired shares of concrete construction equipment maker in India and
established a subsidiary (51.0% KYB ownership) Established hydraulic components manufacturing and sales company in
Indonesia (75.0% KYB ownership)
Americas1974 Established sales company in the United States1986 Established shock absorber manufacturing company in the United States2001 Automobile shock absorber manufacturing company in the United
States became a wholly owned subsidiary.2004 Established sales company in Mexico2011 Established aftermarket hydraulic shock absorber sales company in Panama Established joint venture company in Brazil with Mando Corporation
of Korea (50.0% KYB ownership) Merged U.S. subsidiary and its subsidiary, renamed KYB Americas
Corporation2012 Established hydraulic components manufacturing and sales company
in Mexico2013 Established aftermarket product sales company in Brazil
Europe1983 Acquired shock absorber manufacturing company in Spain1989 Established sales company in Germany1996 Established automobile hydraulic components manufacturing
company in Spain2003 Established automobile hydraulic shock absorber manufacturing
company in the Czech Republic2008 Established automobile shock absorber manufacturing and sales
company in Spain (66.7% KYB owned)2009 Established European Regional Headquarters in Germany2012 Established Regional Headquarters in the Netherlands; established
sales company in Russia2013 Established aftermarket automobile suspension spring manufacturing
and sales company in the Czech Republic (70.0% KYB ownership)
■Production Technology R&D Center / Machine Tools Center
Gifu South Plant
■ Electronics Experiment Building
Gifu East Plant
■KYB Kanayama Co., Ltd.
KYB Americas Corporation
■ COMERCIAL DE AUTOPEÇAS KYB DO BRASIL LTDA.
■KYB Mexico S.A. de C.V.
KYB-Mando do Brasil Fabricante de Autopeças S.A.
KYB EUROPE HEADQUARTERS GmbH
■LLC KYB Eurasia
■ KYB CHITA Manufacturing Europe s.r.o.
KYB Manufacturing Czech s.r.o.
Notes: 1. KYB ownership is as of March 31, 2014. Companies with no ownership shown are wholly owned subsidiaries. 2. A ■ mark represents sites that have been newly established or have increased capacity.
4 5
KYB Corporation Annual Report 2014
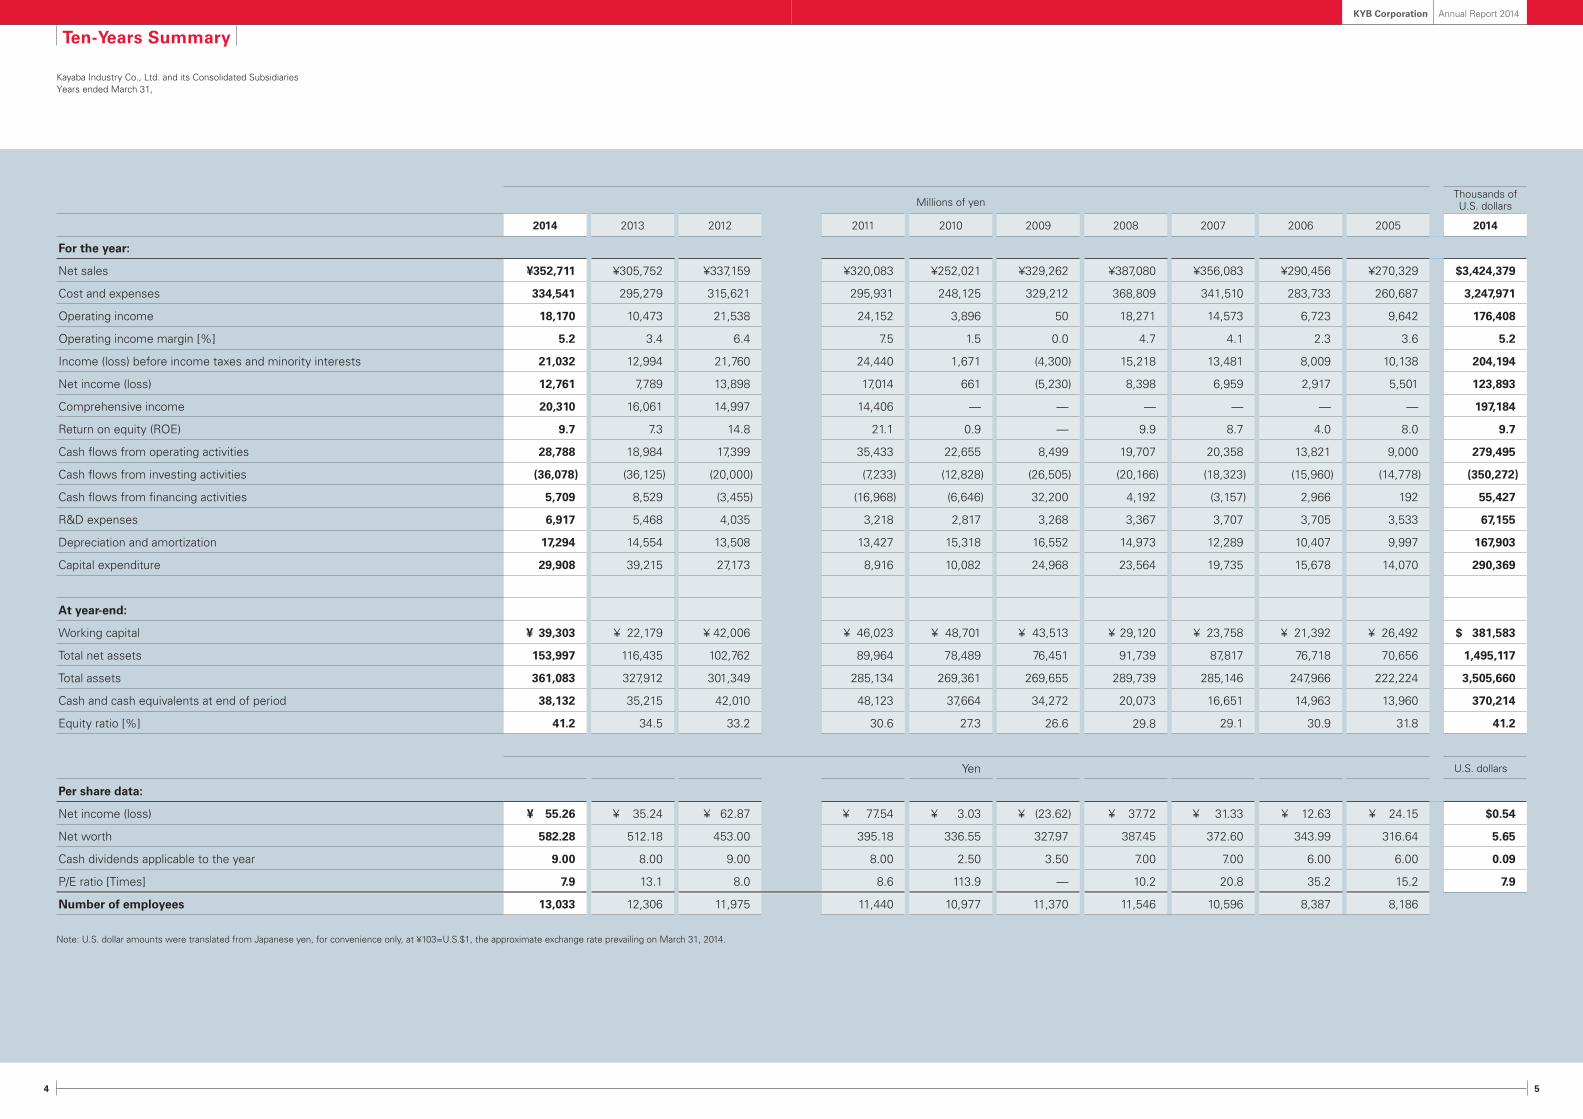
Kayaba Industry Co., Ltd. and its Consolidated SubsidiariesYears ended March 31,
Number of employees 13,033 12,306 11,975 11,440 10,977 11,370 11,546 10,596 8,387 8,186
Note: U.S. dollar amounts were translated from Japanese yen, for convenience only, at ¥103=U.S.$1, the approximate exchange rate prevailing on March 31, 2014.
6 7
KYB Corporation Annual Report 2014
Fiscal 2013 Business Climate
In fiscal 2013, year ended March 31, 2014, economies
in Japan, the United States and Europe began to show
signs of a recovery. However, the economic outlook in
China became increasingly uncertain as growth of capital
expenditures slowed. Furthermore, the pace of economic
recoveries slowed in some emerging countries due to
weakening currencies and other reasons.
In Japan’s automobile industry, which is one major
source of demand for our products, sluggish sales were
foreseen because of the end of the previous fiscal year’s
eco-car subsidy. However, fiscal 2013 new car shipments
reached the highest level since fiscal 2006. Introductions
of new models and a rush to buy before the April 2014
consumption tax hike were the main reasons.
In the construction machinery industry, which also
accounts for a significant share of our sales, demand
was strong in Japan mainly due to purchases prior to the
consumption tax hike and upcoming tighter restrictions
on emissions. In China, there was only a small upturn
in construction machinery demand in part because the
expected rebound in excavator demand did not happen as
soon as anticipated.
Fiscal 2013 Investments
The KYB Group has been taking numerous actions to
enlarge and upgrade manufacturing, sales and product
development capabilities. All investments were aimed
at meeting demands of customers worldwide with even
more speed.
In Japan, we constructed plants for mini-excavator
hydraulic cylinders, castings for mono-block valves and oil
dampers for seismic isolation systems. Additionally, we
used part of the motorcycle shock absorber business to
form a jointly owned company with Yamaha Motor Co., Ltd.
sPeedINg uP growTh To aChIeVe our VIsIoNsolidifying ties with customers rooted in mutual trust
Outside Japan, we constructed a continuously variable
transmission (CVT) vane pump plant in Mexico and a
hydraulic cylinder plant for mid-sized hydraulic excavators
in Indonesia to serve customers in the ASEAN region.
We established joint ventures in India, one for motorcycle
shock absorbers and the other for concrete mixer trucks.
In Brazil, we established a company that imports and sells
aftermarket automotive shock absorbers.
To give the KYB Group a more powerful R&D
infrastructure, we constructed a new building for our
Production Technology R&D Center and Machine Tools
Center at Gifu East Plant.
Fiscal 2013 Performance
The KYB Group’s net sales increased ¥47.0 billion, or
15.4%, to ¥352.7 billion (US$3,424 million). Growth
was attributable mainly to higher sales of automotive
components outside Japan and to the weaker yen.
Earnings benefited from structural reform initiatives
throughout the Group, chiefly cost reduction programs. As
a result, net income increased ¥5.0 billion, or 63.8%, to
¥12.8 billion (US$124 million).
Fiscal 2014 Outlook
In fiscal 2014, the year ending March 31, 2015, we will start
a new medium-term business plan that will continue to
March 2016. This plan is the second phase of our activities
for achieving our vision for fiscal 2020 that we announced in
fiscal 2011: Compete and Win on the Global Stage with the
Power of the KYB Group. We have reached a critical period
for speeding up growth to achieve our vision.
The economic outlook remains unclear. Economies in
North America and Europe are likely to remain healthy in the
fiscal year. On the other hand, there are concerns about a
downturn in demand in emerging countries. In Japan, the
economy is expected to continue improving, but the higher
consumption tax may have a negative impact.
We forecast higher sales in the automotive components
segment, including sales of aftermarket products, primarily
due to growth in automotive shock absorber sales. We
also anticipate higher sales in the hydraulic components
segment, mainly for construction machinery components,
because of the expected recovery in demand for
construction machinery in China.
Earnings Distributions
Distributing a suitable amount of earnings to shareholders
is one of our most important priorities. Our basic policy is
to pay a dividend that is at least 2% of our consolidated
shareholders’ equity.
The dividend applicable to fiscal 2013 was ¥9 (US$0.09)
per share, the sum of a ¥4 interim dividend and a ¥5
year-end dividend. Increasing retained earnings is also
important in order to fund capital expenditures and R&D
expenditures. Our goal is to maximize shareholder value
through sustained growth.
In December 2013, we issued new shares by way of
third-party allotment. Proceeds will be used to expand our
consistent earnings base, fund investments to support
sustained growth and improve financial soundness as the
KYB Group continues to grow. Specifically, investments
to enlarge and reinforce the Group’s manufacturing
infrastructure will be the primary use of these proceeds.
These new facilities will give us an even sounder base for
generating long-term earnings growth.
KYB will celebrate its 80th anniversary in March
2015. Our organization has had to overcome countless
challenges in Japan and overseas during the past eight
decades. The KYB Group of today is the result of the
hydraulic technologies, monozukuri (manufacturing
expertise) skills and global network that our predecessors
created. Everyone at the KYB Group has a strong
commitment to tackling more challenges and fulfilling
our medium-term targets so that we can pass on an
even stronger organization to the next generation. Our
significant accomplishments in recent years put us in an
excellent position for even more progress in order to meet
the expectations of shareholders, investors and all other
stakeholders.
July 2014
Masao Usui
Representative Director, President Executive Officer
Masao Usui
To Our Shareholders and Investors
8 9
KYB Corporation Annual Report 2014
14
2 7
14
98
5
310
11
26
25 12
20
134
621
17
15
2322
27
1 16 19 2418
Newly established Increased capacity
Q. What is your assessment of KYB’s performance
during the 2011 mid-term plan which ended
March 31, 2014?
A. This was a period of “planting seeds” and
“building a stronger foundation.” The KYB Group
concentrated on building an infrastructure
capable of meeting the demands of our
customers around the world.
Our vision for fiscal 2020, ending March 31, 2021,
is to be a highly reliable organization that supplies
products to all of the world’s major automobile and
construction machinery manufacturers. The 2011
mid-term plan that just ended was a phase for us
to plant seeds and build a foundation for taking the
actions needed to make this vision a reality. The
plan’s slogan was “Compete and Win on the Global
Stage with the Power of the KYB Group.” Numerous
actions were taken to set the stage for growth,
including substantial up-front investments. Initially,
we planned on capital expenditures of ¥77.7 billion
during the plan’s three years. But these expenditures
totaled ¥96.3 billion as we moved swiftly to respond
to shifts in market conditions.
The past three years were extremely difficult.
The Great East Japan Earthquake, flooding in
Thailand, slowing economic growth in China and
the prolonged economic crisis in Europe were just
a few of the events that created challenges for the
KYB Group. Due to these challenges, net sales were
¥352.7 billion (US$ 3,424 million) compared with the
medium-term plan target of ¥400.0 billion and the
operating income margin was 5.2% compared with
the 8.0% target. But we also made progress. As a
result, I believe the 2011 mid-term plan gave us a
base for adopting a more aggressive stance as we
start our new medium-term business plan.
Q. What were the primary investments during the
2011 mid-term plan?
A. We added new manufacturing and sales bases in
Japan and overseas. We also made investments
to increase output at existing plants. Overall,
these investments give us an infrastructure that
can rapidly respond to customer demand.
Achieving sustained growth will require assembling
a global network with our operations in the best
possible locations. Then we must use our resources
in each region of the world to create a steady stream
of innovative products and systems.
In Japan, we expanded seismic isolation product
development and production activities at Kayaba
System Machinery and increased mini-excavator
cylinder output at KYB-YS. Furthermore, we
constructed new plants at KYB Trondule for high-
performance electric power steering (EPS) electronic
control units, at KYB Kanayama for EPS parts and a
pumps, and at KYB-CADAC for control valve castings.
Two more major projects were the construction
of a test course and an Electronics Experiment
Building. Outside Japan, we constructed a CVT
hydraulic pump plant in Mexico (production to start in
September 2014), and a motorcycle hydraulic shock
The KYB Group started a new medium-term business plan in April 2014 (hereinafter the 2014 mid-term plan) that covers the three-year period ending March 31, 2017. KYB president Masao Usui talks about the new plan, which shifts the Group’s focus to strategies for growth amid the current challenging operating environment.
Major KYB Group Investments
Development and Manufacture of Shock Absorbers1 Developmental Experiment Center (new building) KYB Corporation Japan2 Technical Center (new building) KYB Americas Corporation America3 Plant expansion KYB Manufacturing Czech s.r.o. Czech Republic4 Increase R&D personnel KYB (China) Investment Co., Ltd. China5 Increase R&D personnel KYB EUROPE HEADQUARTERS GmbH Spain
Manufacture and Sales of Aftermarket Shock Absorbers6 Increase productivity KYB Industrial Machinery (Zhenjiang) Ltd. China7 Increase productivity KYB Americas Corporation America8 Increase productivity KYB-Mando do Brasil Fabricante de Autopeças S.A. Brazil9 New sales company COMERCIAL DE AUTOPEÇAS KYB DO BRASIL LTDA. Brazil10 New plant (spring) KYB CHITA Manufacturing Europe s.r.o. Czech Republic11 New sales company LLC KYB Eurasia Russia
Manufacture of CVT Pumps12 New plant KYB Steering (Thailand) Co., Ltd. Thailand13 New plant KYB Industrial Machinery (Zhenjiang) Ltd. China14 New plant KYB Mexico S.A.de. C.V. Mexico
Electronics Technology and Product Development15 Electronics Technology Center (new building) KYB Corporation Japan16 Machine Tools Center (new building) KYB Corporation Japan17 New plant KYB Trondule Co., Ltd. Japan
Manufacture of Hydraulic Equipment for Excavators18 Increase productivity (cylinders for large-sized excavators) KYB Corporation Japan19 New plant (cylinders for mid-sized excavators) KYB Corporation Japan20 New plant (cylinders for mid-sized excavators) PT. KYB Hydraulics Manufacturing Indonesia Indonesia
21 New plant (cylinders for mid-sized excavators and motors for mini excavators)
KYB Hydraulics Industry (Zhenjiang) Ltd. China
22 New plant (control valve casting for mid-sized excavators) KYB-CADAC Co., Ltd. Japan23 New plant (cylinders for mini excavators) KYB-YS Co., Ltd. Japan
Manufacture and Sales of Motorcycle 24 New company KYB Motorcycle Suspension Co., Ltd. Japan25 New company KYB Motorcycle Suspension India Pvt. Ltd. India
Manufacture and Sales of Concrete Mixers26 New company KYB-Conmat Pvt. Ltd. India
Manufacture and Sales of Seismic Vibration Dampers27 New plant Kayaba System Machinery Co., Ltd. Japan
Interview with the President
Progress Toward The FuTureearning Trust from Customers and Capturing orders
10 11
KYB Corporation Annual Report 2014
absorber plant (production to start in April 2015)
and a special-purpose vehicle plant (joint venture
with Conmat Systems Pvt. Ltd.) in India. There are
several other new overseas plants: an aftermarket
spring plant in the Czech Republic (production
started in January 2014); a hydraulic cylinder plant
in Indonesia (production to start in December 2014);
an aftermarket shock absorber sales company (sales
started in January 2013) in Russia; and a shock
absorber plant and aftermarket shock absorber sales
company (sales started in February 2014) in Brazil
with Mando Corp. All of these investments give us
a broad foundation for rapidly meeting the needs of
customers in Japan and around the world.
Q. Please explain the strategic goals of the 2014
mid-term plan and the activities planned in each
business of the KYB Group.
A. The plan has three central elements: become
even more competitive, develop new
technologies and products, and enter new
markets and business fields. By focusing on these
goals, we aim to earn the trust of customers
worldwide and capture more orders.
In the 2014 mid-term plan, we are advancing from
the phase of “planting seeds” and “building a
stronger foundation” to the pursuit of a growth
strategy. We are determined to achieve much more
growth and progress during this three-year period.
We want to ensure that the investments we
made during the previous medium-term business
plan generate growth for the KYB Group. To achieve
this growth, we will fully utilize our products,
technologies, human resources, sales channels
and production sites. Improving quality and raising
manufacturing efficiency to become more cost
competitive are two more goals. Additionally, every
group company will focus on developing products
quickly to prevent missing any opportunities,
supplying distinctive products, extending sales to
companies and regions we do not currently serve,
and starting operations in new business fields and
industries. Our ultimate objective is to earn the trust
of customers worldwide and capture more orders.
The 2014 mid-term plan establishes the following
goals for each business operations.
Automotive Components Operations
For CVT pumps, we have established a global supply
network with facilities in Japan, China, Thailand and
Mexico to meet the needs of our customers. Our
CVT pump output was 3.36 million units in fiscal
2012 and I expect that this will increase to 5.16
million units in fiscal 2014.
We plan to increase shock absorber sales to
U.S. and German automakers by offering high-
performance shock absorbers and other innovative
products. Non-Japanese automakers accounted for
18% of our shock absorber sales in the past fiscal
year. Our goal is to raise this to 20% in the current
fiscal year and to 34% by fiscal 2020.
For aftermarket shock absorbers, we raised sales
from 14 million units in fiscal 2010 to 18.9 million
units in fiscal 2013. We plan to raise these sales to
28 million units by fiscal 2020.
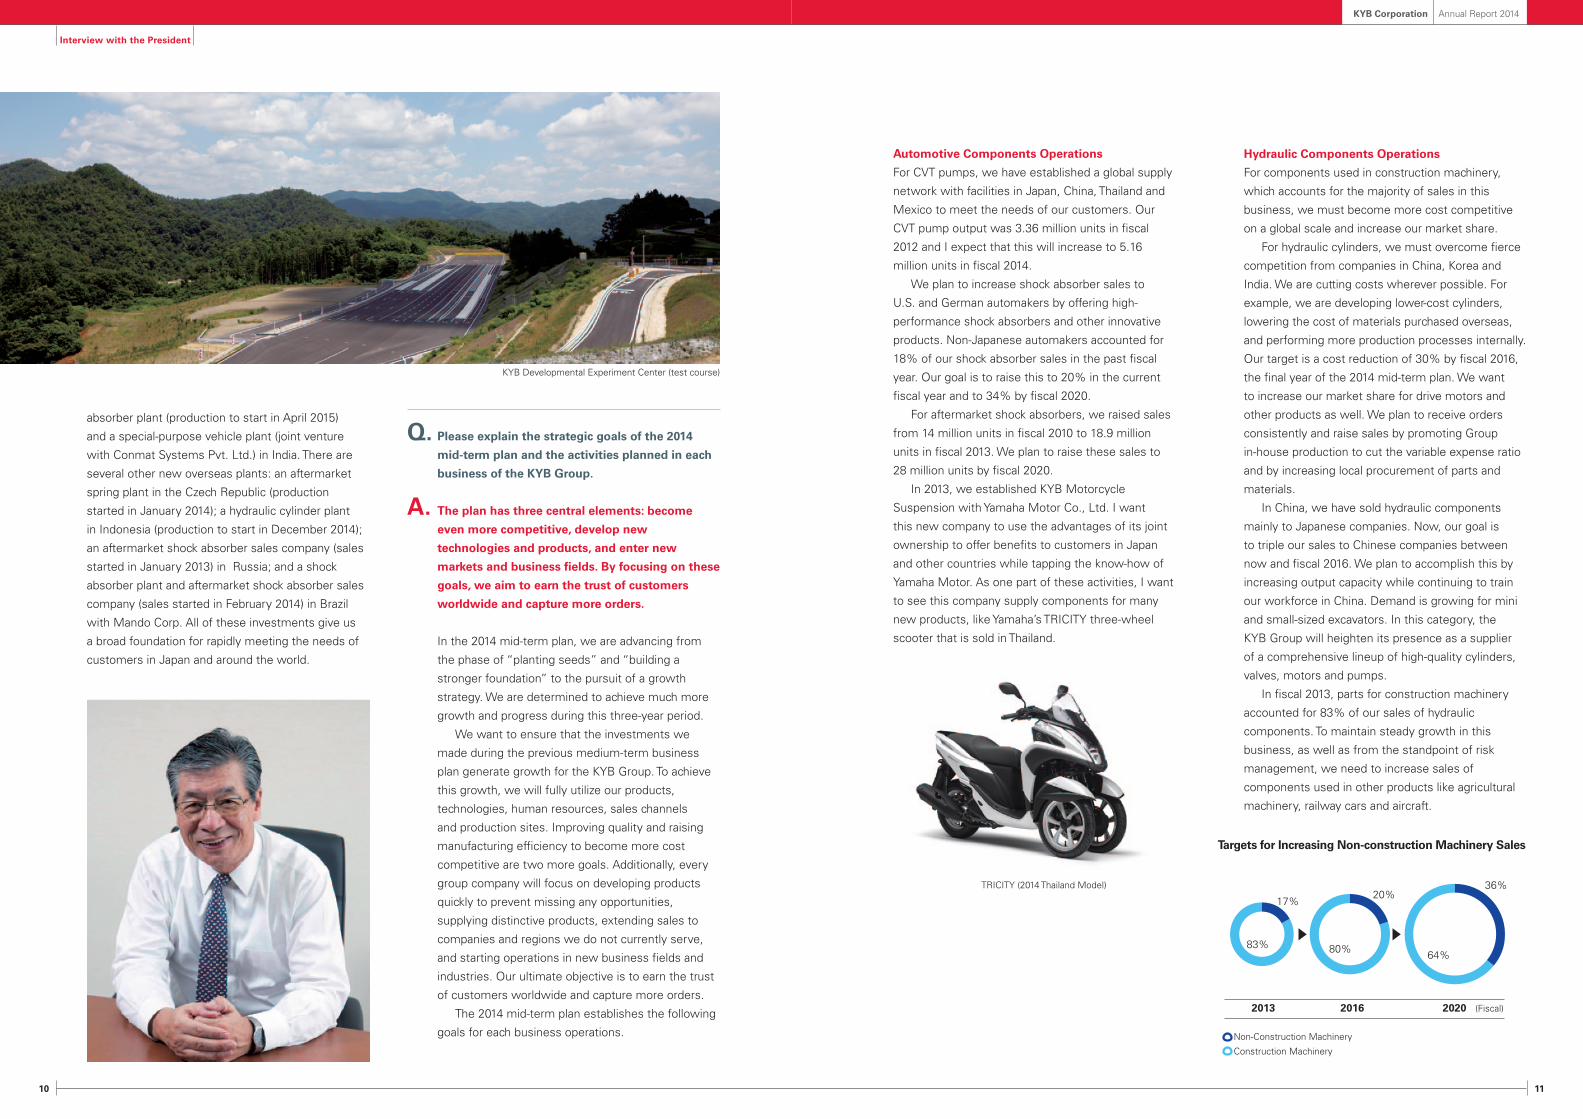
In 2013, we established KYB Motorcycle
Suspension with Yamaha Motor Co., Ltd. I want
this new company to use the advantages of its joint
ownership to offer benefits to customers in Japan
and other countries while tapping the know-how of
Yamaha Motor. As one part of these activities, I want
to see this company supply components for many
new products, like Yamaha’s TRICITY three-wheel
scooter that is sold in Thailand.
Hydraulic Components Operations
For components used in construction machinery,
which accounts for the majority of sales in this
business, we must become more cost competitive
on a global scale and increase our market share.
For hydraulic cylinders, we must overcome fierce
competition from companies in China, Korea and
India. We are cutting costs wherever possible. For
example, we are developing lower-cost cylinders,
lowering the cost of materials purchased overseas,
and performing more production processes internally.
Our target is a cost reduction of 30% by fiscal 2016,
the final year of the 2014 mid-term plan. We want
to increase our market share for drive motors and
other products as well. We plan to receive orders
consistently and raise sales by promoting Group
in-house production to cut the variable expense ratio
and by increasing local procurement of parts and
materials.
In China, we have sold hydraulic components
mainly to Japanese companies. Now, our goal is
to triple our sales to Chinese companies between
now and fiscal 2016. We plan to accomplish this by
increasing output capacity while continuing to train
our workforce in China. Demand is growing for mini
and small-sized excavators. In this category, the
KYB Group will heighten its presence as a supplier
of a comprehensive lineup of high-quality cylinders,
valves, motors and pumps.
In fiscal 2013, parts for construction machinery
accounted for 83% of our sales of hydraulic
components. To maintain steady growth in this
business, as well as from the standpoint of risk
management, we need to increase sales of
components used in other products like agricultural
machinery, railway cars and aircraft.
Interview with the President
KYB Developmental Experiment Center (test course)
TRICITY (2014 Thailand Model)
2013 2016 2020
Non-Construction Machinery
Construction Machinery
83%
17%
80%
20%
64%
(Fiscal)
36%
Targets for Increasing Non-construction Machinery Sales
12 13
KYB Corporation Annual Report 2014
Q. Capital expenditures were very high during the
2011 mid-term plan. What are your plans for the
2014 mid-term plan?
A. We will make investments for streamlining
operations, performing more in-house production
and improving productivity.
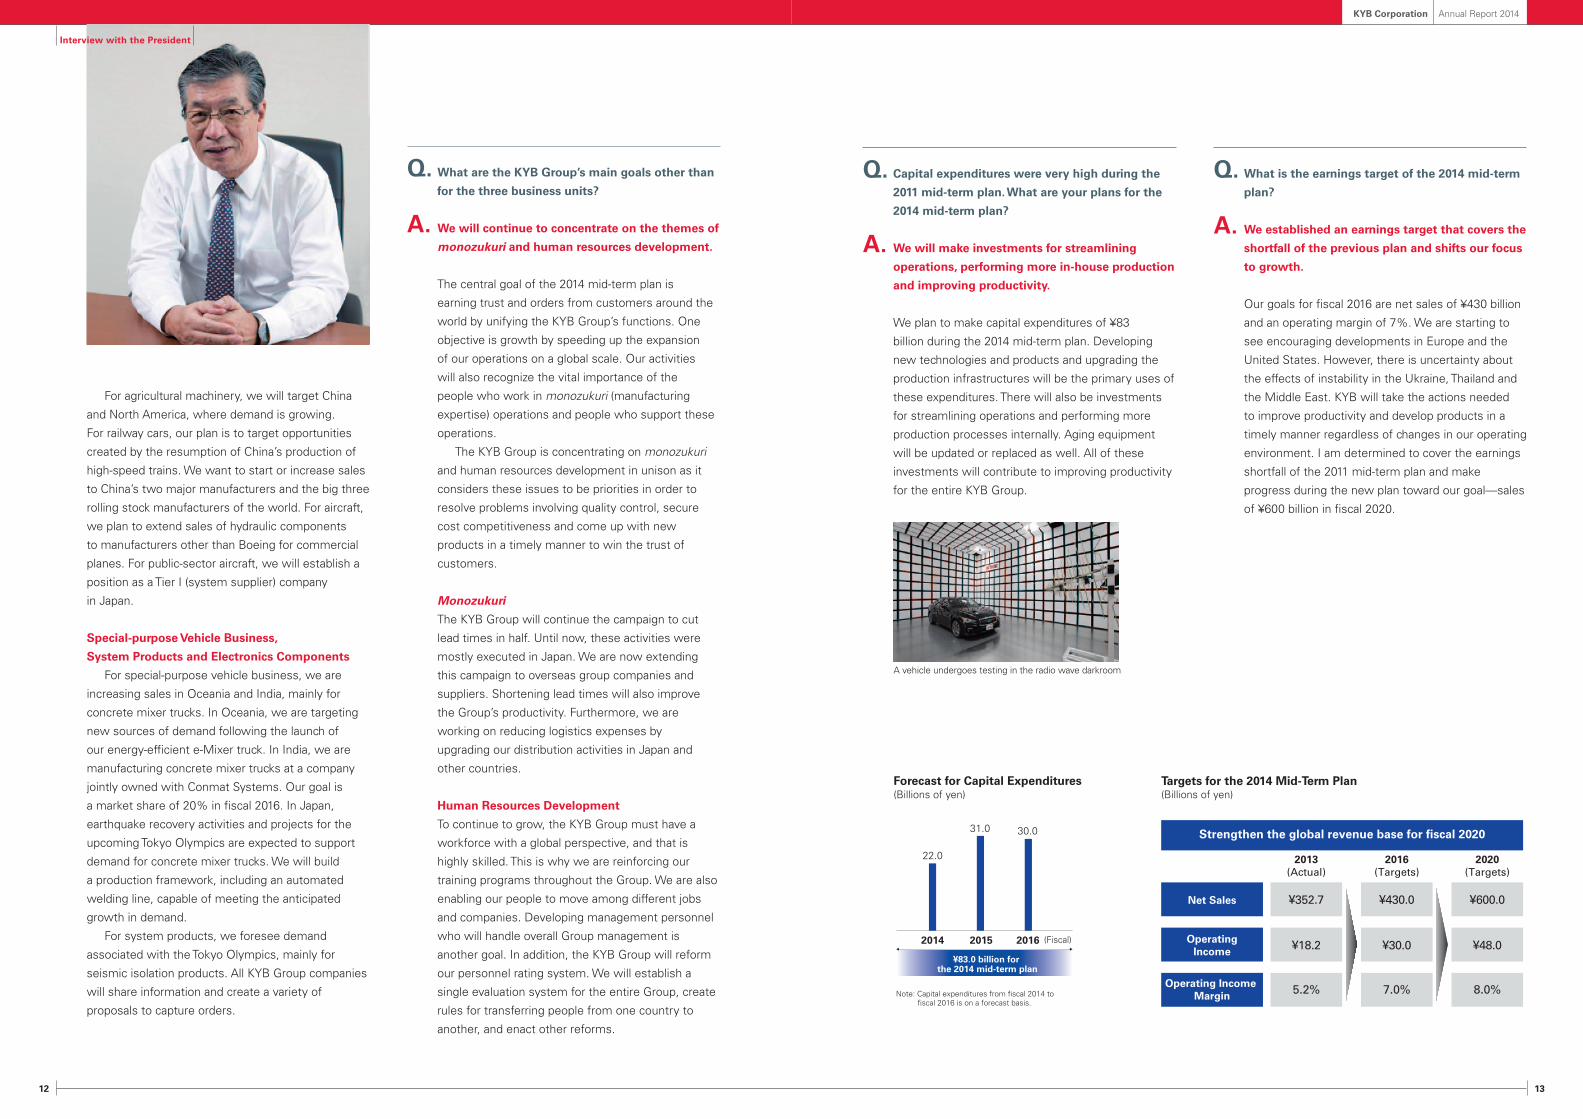
We plan to make capital expenditures of ¥83
billion during the 2014 mid-term plan. Developing
new technologies and products and upgrading the
production infrastructures will be the primary uses of
these expenditures. There will also be investments
for streamlining operations and performing more
production processes internally. Aging equipment
will be updated or replaced as well. All of these
investments will contribute to improving productivity
for the entire KYB Group.
Q. What is the earnings target of the 2014 mid-term
plan?
A. We established an earnings target that covers the
shortfall of the previous plan and shifts our focus
to growth.
Our goals for fiscal 2016 are net sales of ¥430 billion
and an operating margin of 7%. We are starting to
see encouraging developments in Europe and the
United States. However, there is uncertainty about
the effects of instability in the Ukraine, Thailand and
the Middle East. KYB will take the actions needed
to improve productivity and develop products in a
timely manner regardless of changes in our operating
environment. I am determined to cover the earnings
shortfall of the 2011 mid-term plan and make
progress during the new plan toward our goal—sales
of ¥600 billion in fiscal 2020.
Targets for the 2014 Mid-Term Plan(Billions of yen)
2014 2015 2016
Note: Capital expenditures from �scal 2014 to �scal 2016 is on a forecast basis.
22.0
31.0 30.0
¥83.0 billion for the 2014 mid-term plan
(Fiscal)
Forecast for Capital Expenditures(Billions of yen)
For agricultural machinery, we will target China
and North America, where demand is growing.
For railway cars, our plan is to target opportunities
created by the resumption of China’s production of
high-speed trains. We want to start or increase sales
to China’s two major manufacturers and the big three
rolling stock manufacturers of the world. For aircraft,
we plan to extend sales of hydraulic components
to manufacturers other than Boeing for commercial
planes. For public-sector aircraft, we will establish a
position as a Tier I (system supplier) company
in Japan.
Special-purpose Vehicle Business,
System Products and Electronics Components
For special-purpose vehicle business, we are
increasing sales in Oceania and India, mainly for
concrete mixer trucks. In Oceania, we are targeting
new sources of demand following the launch of
our energy-efficient e-Mixer truck. In India, we are
manufacturing concrete mixer trucks at a company
jointly owned with Conmat Systems. Our goal is
a market share of 20% in fiscal 2016. In Japan,
earthquake recovery activities and projects for the
upcoming Tokyo Olympics are expected to support
demand for concrete mixer trucks. We will build
a production framework, including an automated
welding line, capable of meeting the anticipated
growth in demand.
For system products, we foresee demand
associated with the Tokyo Olympics, mainly for
seismic isolation products. All KYB Group companies
will share information and create a variety of
proposals to capture orders.
Q. What are the KYB Group’s main goals other than
for the three business units?
A. We will continue to concentrate on the themes of
monozukuri and human resources development.
The central goal of the 2014 mid-term plan is
earning trust and orders from customers around the
world by unifying the KYB Group’s functions. One
objective is growth by speeding up the expansion
of our operations on a global scale. Our activities
will also recognize the vital importance of the
people who work in monozukuri (manufacturing
expertise) operations and people who support these
operations.
The KYB Group is concentrating on monozukuri
and human resources development in unison as it
considers these issues to be priorities in order to
2. Compensation paid to the independent auditor Millions of yen
Category2014 2013
Compensation for audit certification
Compensation fornon-auditing services
Compensation for audit certification
Compensation for non-auditing services
KYB Corporation 57 22 62 21
Consolidated subsidiaries 20 — 8 —
Total 77 22 70 21
Thousands of U.S. dollar (Note)
Category2014
Compensation for audit certification
Compensation fornon-auditing services
KYB Corporation 553 214
Consolidated subsidiaries 194 —
Total 748 214
Note: U.S. dollar amounts were translated from Japanese yen, for convenience only, at ¥103=US$ 1, the approximate exchange rate prevailing on March 31, 2014.
3. Other Significant Compensation
Three consolidated subsidiaries, including KYB Americas
Corporation, have paid ¥100 million to KPMG International,
which belongs to the same network as the independent
auditor used by the Company, for audit certification and
other services for fiscal 2013.
16 17
KYB Corporation Annual Report 2014
Corporate Governance Risk Information
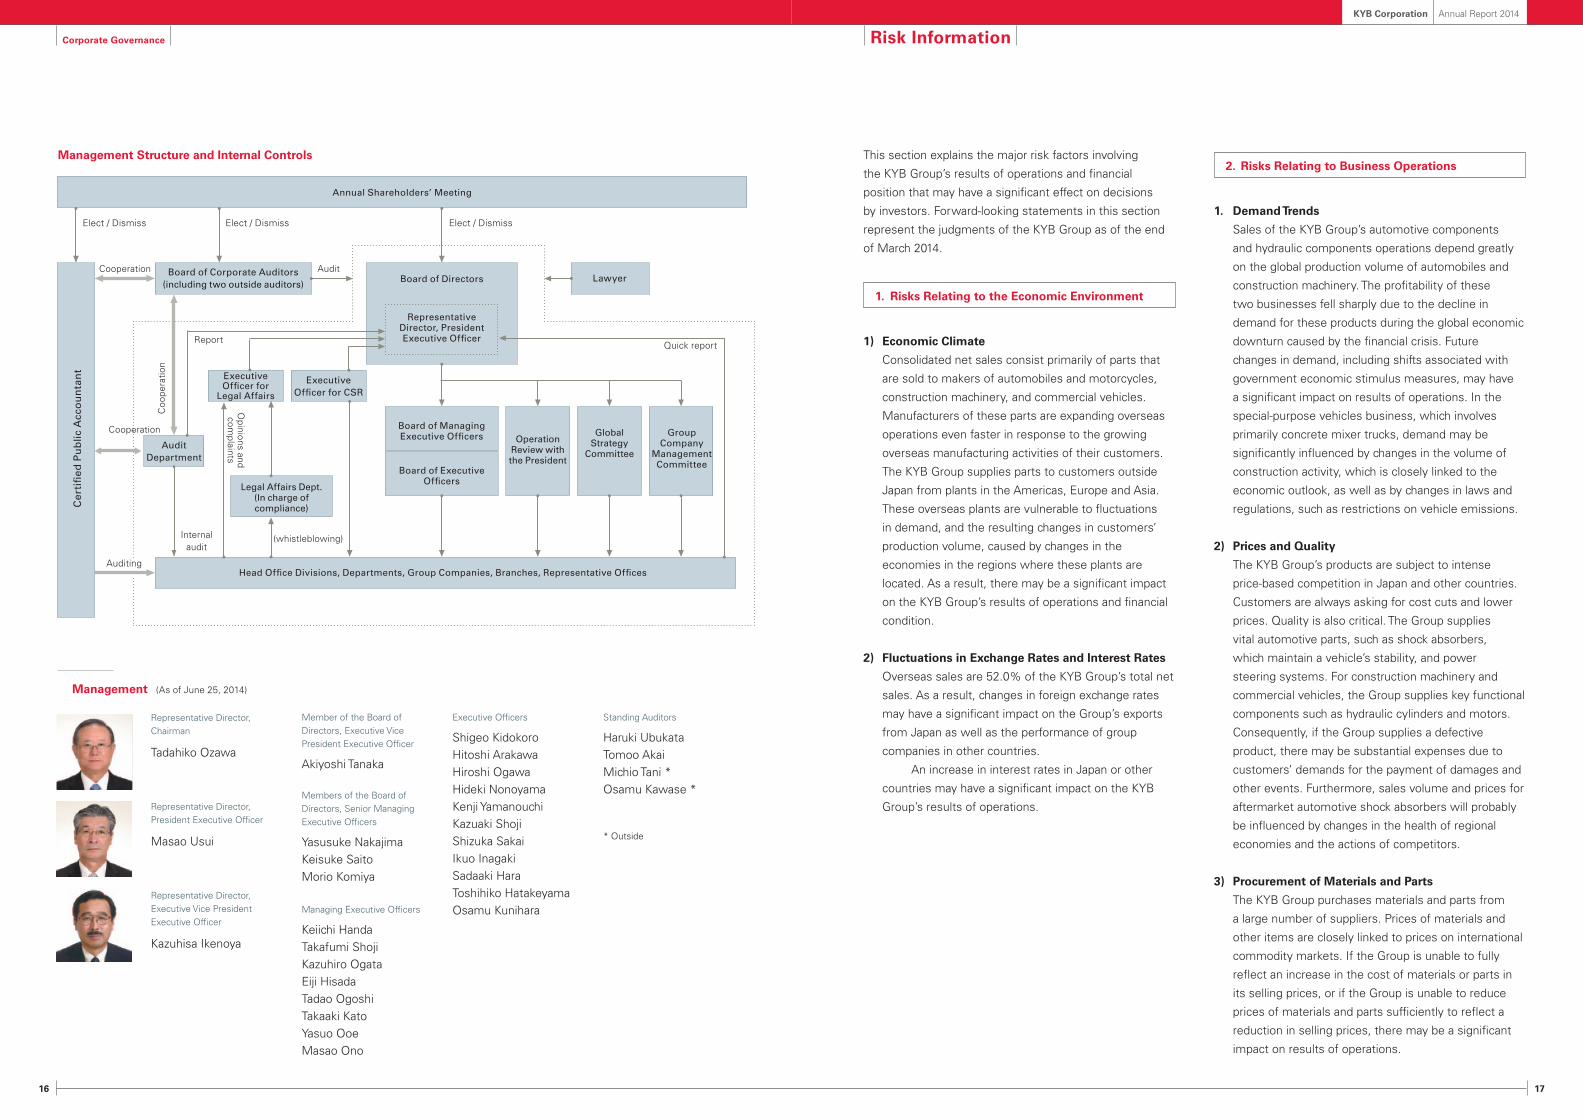
Management Structure and Internal Controls
Annual Shareholders’ Meeting
Elect / DismissElect / Dismiss
Audit
Report
Elect / Dismiss
Cooperation
Coo
pera
tion
Cooperation
Auditing
Internal audit
AuditDepartment
Board of ManagingExecutive Officers
Board of Corporate Auditors(including two outside auditors)
Manufacturing and sales of shock absorbers for automobiles
Aug. 2003 100.0%
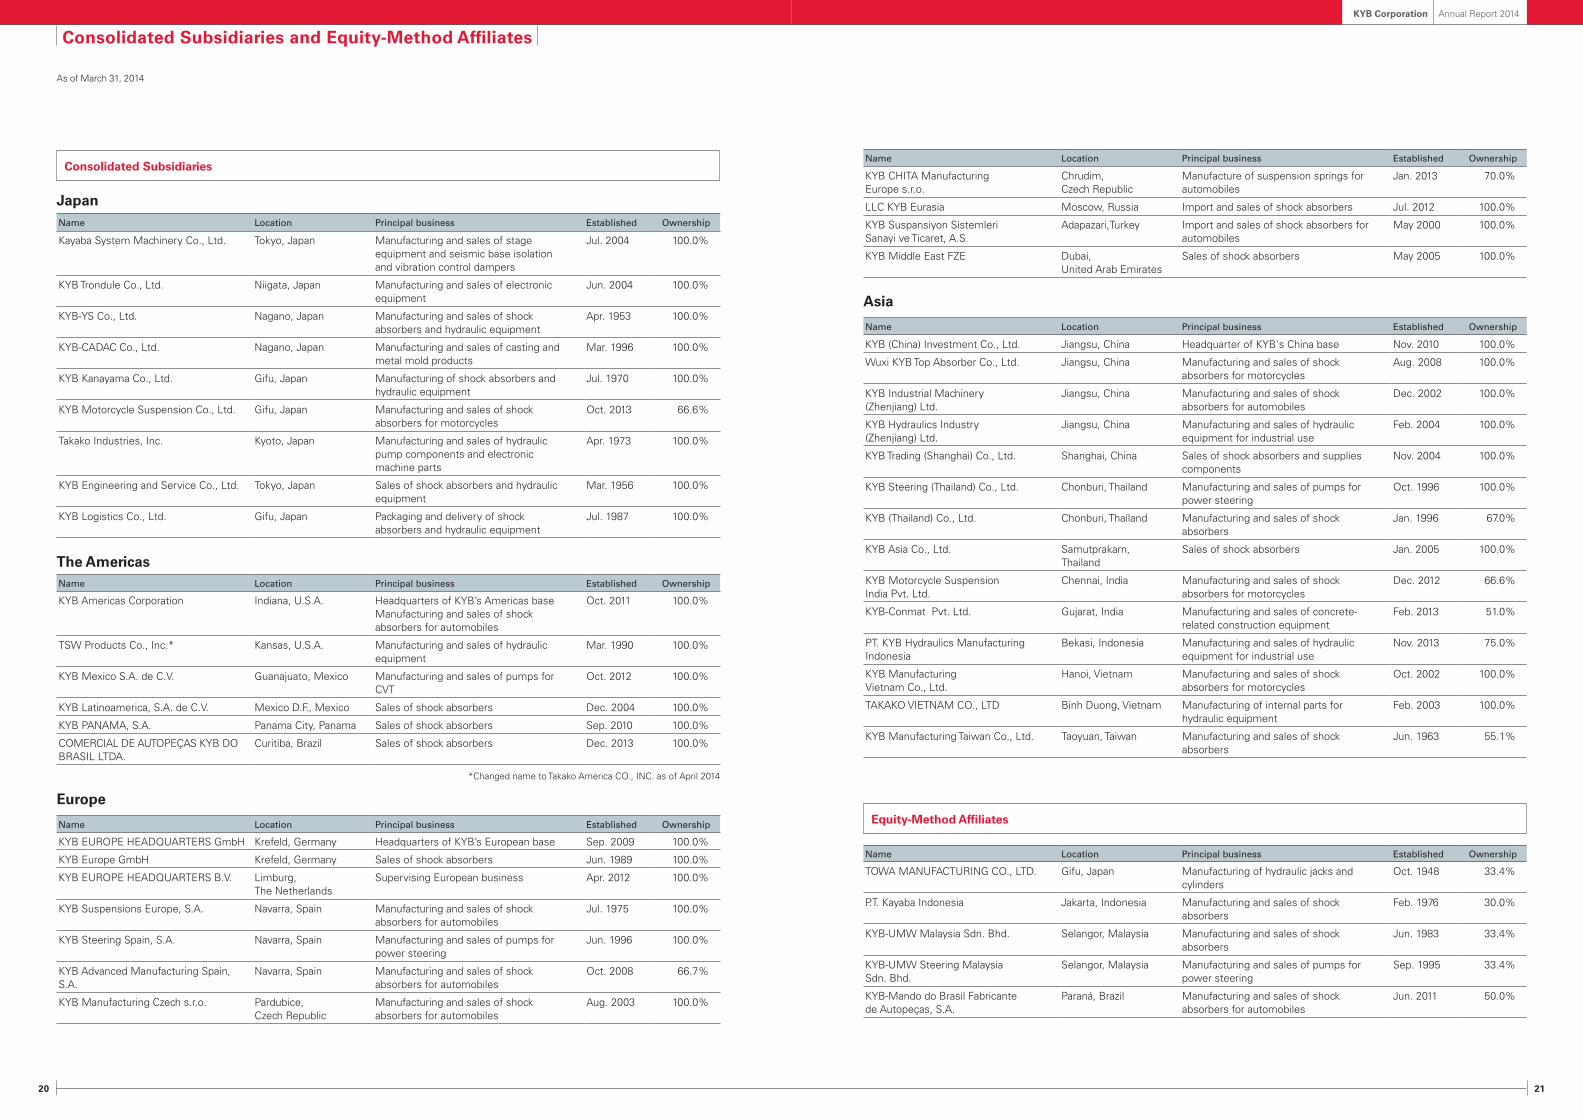
Name Location Principal business Established Ownership
KYB CHITA Manufacturing Europe s.r.o.
Chrudim, Czech Republic
Manufacture of suspension springs for automobiles
Jan. 2013 70.0%
LLC KYB Eurasia Moscow, Russia Import and sales of shock absorbers Jul. 2012 100.0%
KYB Suspansiyon Sistemleri Sanayi ve Ticaret, A.S.
Adapazari,Turkey Import and sales of shock absorbers for automobiles
May 2000 100.0%
KYB Middle East FZE Dubai, United Arab Emirates
Sales of shock absorbers May 2005 100.0%
Asia
Name Location Principal business Established Ownership
KYB (China) Investment Co., Ltd. Jiangsu, China Headquarter of KYB's China base Nov. 2010 100.0%
Wuxi KYB Top Absorber Co., Ltd. Jiangsu, China Manufacturing and sales of shock absorbers for motorcycles
Aug. 2008 100.0%
KYB Industrial Machinery (Zhenjiang) Ltd.
Jiangsu, China Manufacturing and sales of shock absorbers for automobiles
Dec. 2002 100.0%
KYB Hydraulics Industry (Zhenjiang) Ltd.
Jiangsu, China Manufacturing and sales of hydraulic equipment for industrial use
Feb. 2004 100.0%
KYB Trading (Shanghai) Co., Ltd. Shanghai, China Sales of shock absorbers and supplies components
Nov. 2004 100.0%
KYB Steering (Thailand) Co., Ltd. Chonburi, Thailand Manufacturing and sales of pumps for power steering
Oct. 1996 100.0%
KYB (Thailand) Co., Ltd. Chonburi, Thailand Manufacturing and sales of shock absorbers
Jan. 1996 67.0%
KYB Asia Co., Ltd. Samutprakarn, Thailand
Sales of shock absorbers Jan. 2005 100.0%
KYB Motorcycle Suspension India Pvt. Ltd.
Chennai, India Manufacturing and sales of shock absorbers for motorcycles
Dec. 2012 66.6%
KYB-Conmat Pvt. Ltd. Gujarat, India Manufacturing and sales of concrete-related construction equipment
Feb. 2013 51.0%
PT. KYB Hydraulics Manufacturing Indonesia
Bekasi, Indonesia Manufacturing and sales of hydraulic equipment for industrial use
Nov. 2013 75.0%
KYB Manufacturing Vietnam Co., Ltd.
Hanoi, Vietnam Manufacturing and sales of shock absorbers for motorcycles
Oct. 2002 100.0%
TAKAKO VIETNAM CO., LTD Binh Duong, Vietnam Manufacturing of internal parts for hydraulic equipment
Feb. 2003 100.0%
KYB Manufacturing Taiwan Co., Ltd. Taoyuan, Taiwan Manufacturing and sales of shock absorbers
Jun. 1963 55.1%
Equity-Method Affiliates
Name Location Principal business Established Ownership
TOWA MANUFACTURING CO., LTD. Gifu, Japan Manufacturing of hydraulic jacks and cylinders
Oct. 1948 33.4%
P.T. Kayaba Indonesia Jakarta, Indonesia Manufacturing and sales of shock absorbers
Feb. 1976 30.0%
KYB-UMW Malaysia Sdn. Bhd. Selangor, Malaysia Manufacturing and sales of shock absorbers
Jun. 1983 33.4%
KYB-UMW Steering Malaysia Sdn. Bhd.
Selangor, Malaysia Manufacturing and sales of pumps for power steering
Sep. 1995 33.4%
KYB-Mando do Brasil Fabricante de Autopeças, S.A.
Paraná, Brazil Manufacturing and sales of shock absorbers for automobiles
Jun. 2011 50.0%
22 23
KYB Corporation Annual Report 2014
59,449 (23.1%)
88,410 (34.4%)
62,679 (24.4%)
44,396 (17.3%)
1,979 (0.8%)
As of March 31, 2014
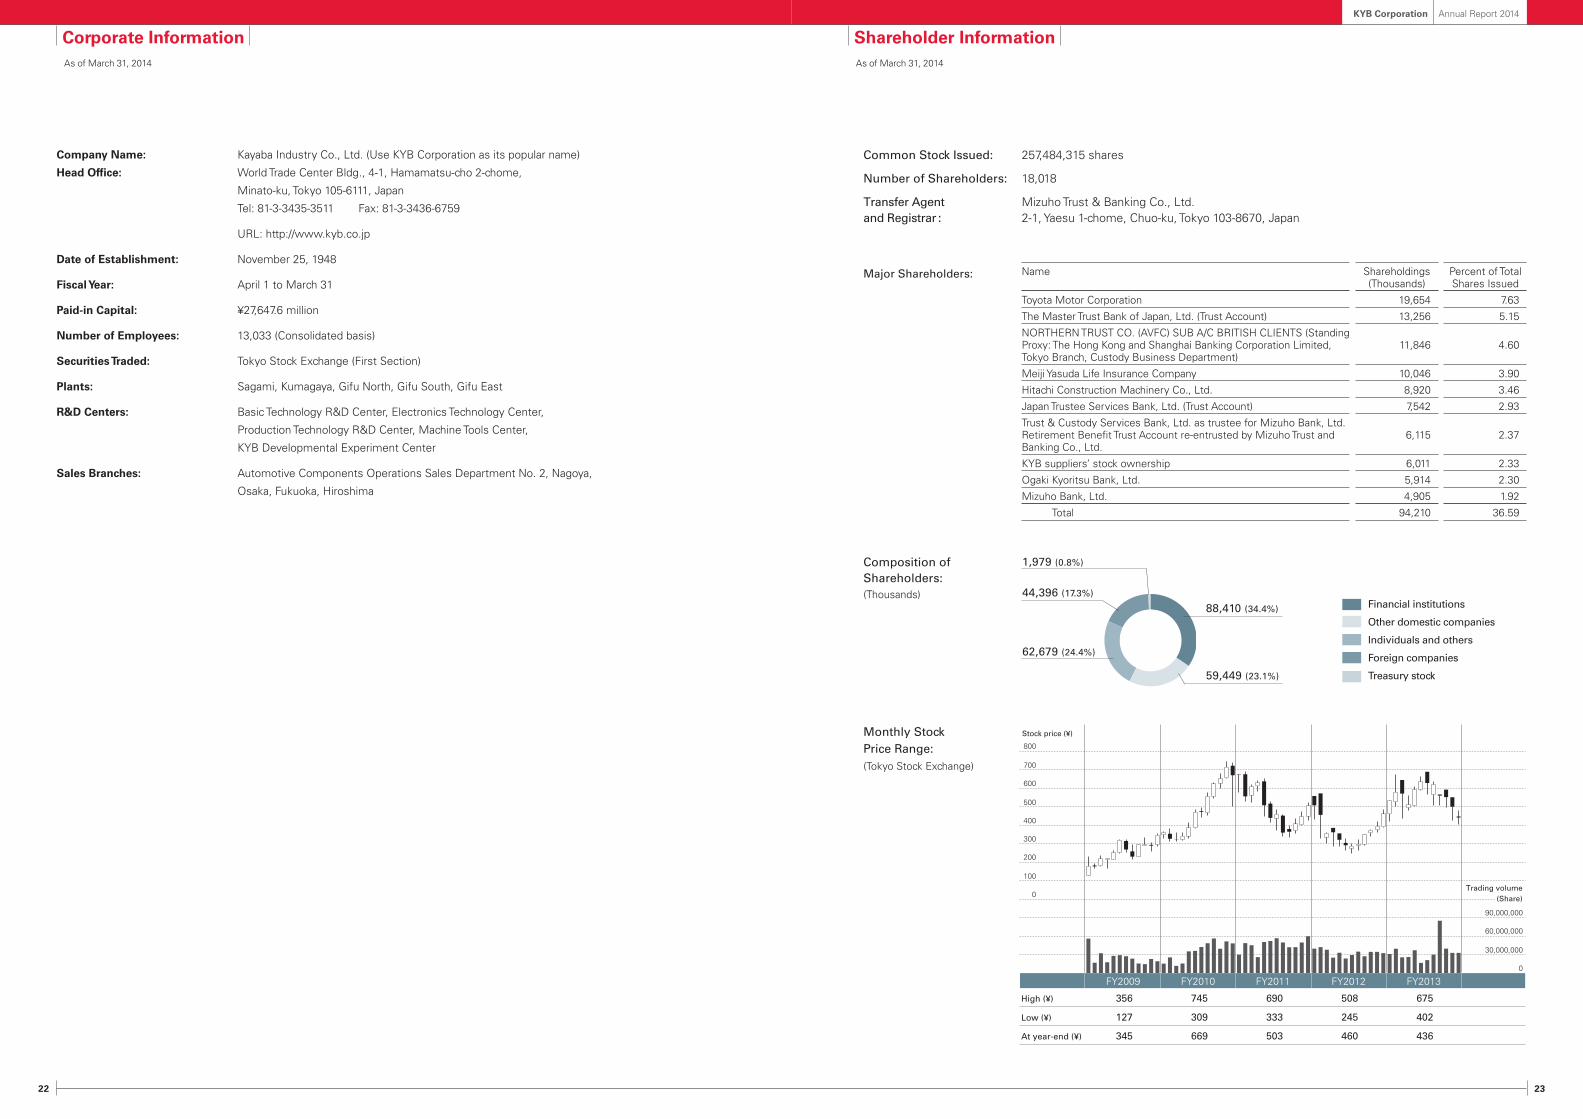
Company Name: Kayaba Industry Co., Ltd. (Use KYB Corporation as its popular name)
Head Office: World Trade Center Bldg., 4-1, Hamamatsu-cho 2-chome,
Minato-ku, Tokyo 105-6111, Japan
Tel: 81-3-3435-3511 Fax: 81-3-3436-6759
URL: http://www.kyb.co.jp
Date of Establishment: November 25, 1948
Fiscal Year: April 1 to March 31
Paid-in Capital: ¥27,647.6 million
Number of Employees: 13,033 (Consolidated basis)
Securities Traded: Tokyo Stock Exchange (First Section)
Plants: Sagami, Kumagaya, Gifu North, Gifu South, Gifu East
R&D Centers: Basic Technology R&D Center, Electronics Technology Center,
Production Technology R&D Center, Machine Tools Center,
KYB Developmental Experiment Center
Sales Branches: Automotive Components Operations Sales Department No. 2, Nagoya,
Osaka, Fukuoka, Hiroshima
Common Stock Issued: 257,484,315 shares
Number of Shareholders: 18,018
Transfer Agent Mizuho Trust & Banking Co., Ltd.and Registrar : 2-1, Yaesu 1-chome, Chuo-ku, Tokyo 103-8670, Japan
Major Shareholders:
Composition ofShareholders:(Thousands)
Monthly StockPrice Range:(Tokyo Stock Exchange)
Financial institutions
Other domestic companies
Individuals and others
Foreign companies
Treasury stock
400
500
600
800
Stock price (¥)
700
0
100
200
300
0
30,000,000
60,000,000
90,000,000
Trading volume(Share)
FY2009
High (¥)
Low (¥)
At year-end (¥)
356
127
345
745
309
669
690
333
503
508
245
460
675
402
436
FY2010 FY2011 FY2012 FY2013
As of March 31, 2014
Corporate Information Shareholder Information
Name Shareholdings (Thousands)
Percent of Total Shares Issued
Toyota Motor Corporation 19,654 7.63
The Master Trust Bank of Japan, Ltd. (Trust Account) 13,256 5.15
NORTHERN TRUST CO. (AVFC) SUB A/C BRITISH CLIENTS (Standing Proxy: The Hong Kong and Shanghai Banking Corporation Limited, Tokyo Branch, Custody Business Department)
11,846 4.60
Meiji Yasuda Life Insurance Company 10,046 3.90
Hitachi Construction Machinery Co., Ltd. 8,920 3.46
Japan Trustee Services Bank, Ltd. (Trust Account) 7,542 2.93
Trust & Custody Services Bank, Ltd. as trustee for Mizuho Bank, Ltd. Retirement Benefit Trust Account re-entrusted by Mizuho Trust and Banking Co., Ltd.
6,115 2.37
KYB suppliers’ stock ownership 6,011 2.33
Ogaki Kyoritsu Bank, Ltd. 5,914 2.30
Mizuho Bank, Ltd. 4,905 1.92
Total 94,210 36.59
24 25
KYB Corporation Annual Report 2014
Financial Section
Contents
25 Financial Highlights
26 Financial Review
28 Financial Statements
28 Consolidated Balance Sheets
30 Consolidated Statements of Income
31 Consolidated Statements of Comprehensive Income
32 Consolidated Statements of Changes in Net Assets
34 Consolidated Statements of Cash Flows
35 Notes to Consolidated Financial Statements
55 Independent Auditor’s Report
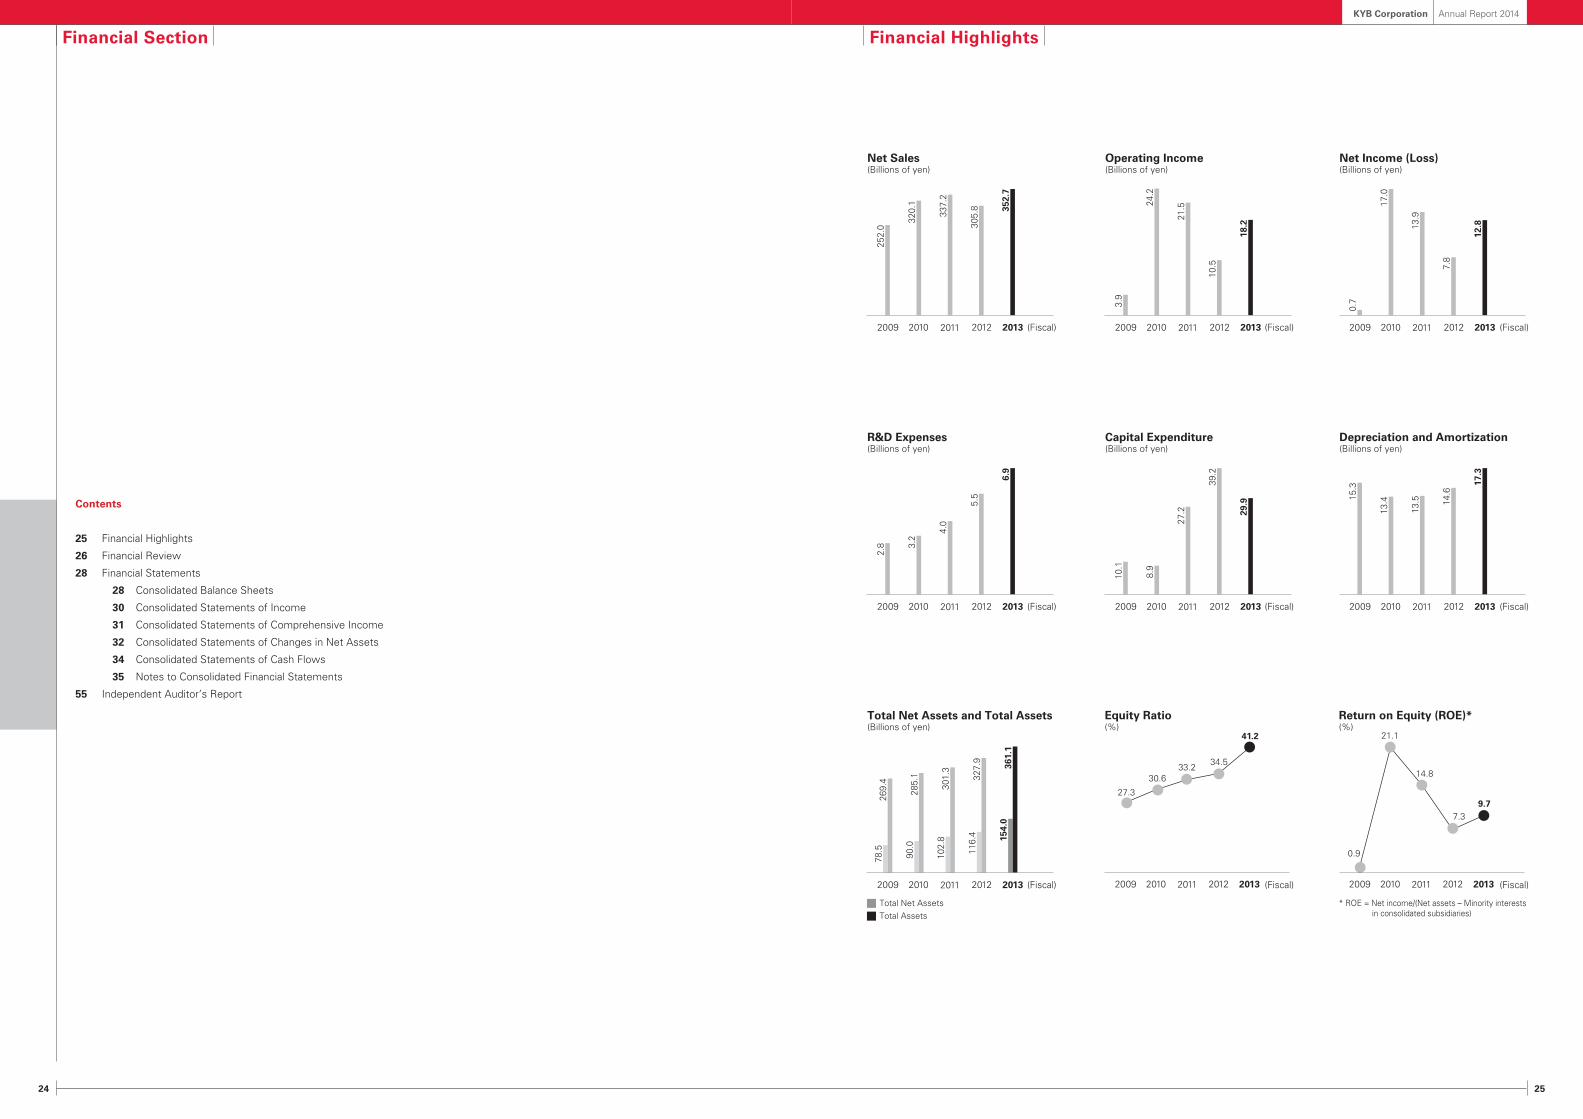
252.
0
320.
1
337.
2
305.
8 352.
7
3.9
24.2
21.5
10.5
18.2
0.7
17.0
13.9
7.8
12.8
2.8 3.
2
4.0
5.5
6.9
78.5
90.0
102.
8
116.
4 154.
0
269.
4
285.
1
301.
3
327.
9
361.
1
10.1
8.9
27.2
39.2
29.9 15
.3
13.4
13.5 14
.6
17.3
9.7
14.8
0.9
21.1
7.3
33.230.6
27.3
41.2
34.5
2009 (Fiscal) (Fiscal) (Fiscal)
(Fiscal) (Fiscal) (Fiscal)
(Fiscal) (Fiscal) (Fiscal)
2010 2011 2012 2013
Net Sales(Billions of yen)
2009 2010 2011 2012 2013
Operating Income(Billions of yen)
2009 2010 2011 2012 2013
Net Income (Loss)(Billions of yen)
2009 2010 2011 2012 2013
R&D Expenses(Billions of yen)
2009 2010 2011 2012 2013
Total Net Assets and Total Assets(Billions of yen)
2009 2010 2011 2012 2013
Capital Expenditure(Billions of yen)
2009 2010 2011 2012 2013
Depreciation and Amortization(Billions of yen)
Return on Equity (ROE)*(%)
2009 2010 2011 2012 2013
Equity Ratio(%)
2009 2010 2011 2012 2013
* ROE = Net income/(Net assets – Minority interests in consolidated subsidiaries)
Total Net AssetsTotal Assets
Financial Highlights
26 27
KYB Corporation Annual Report 2014
Cash Flows
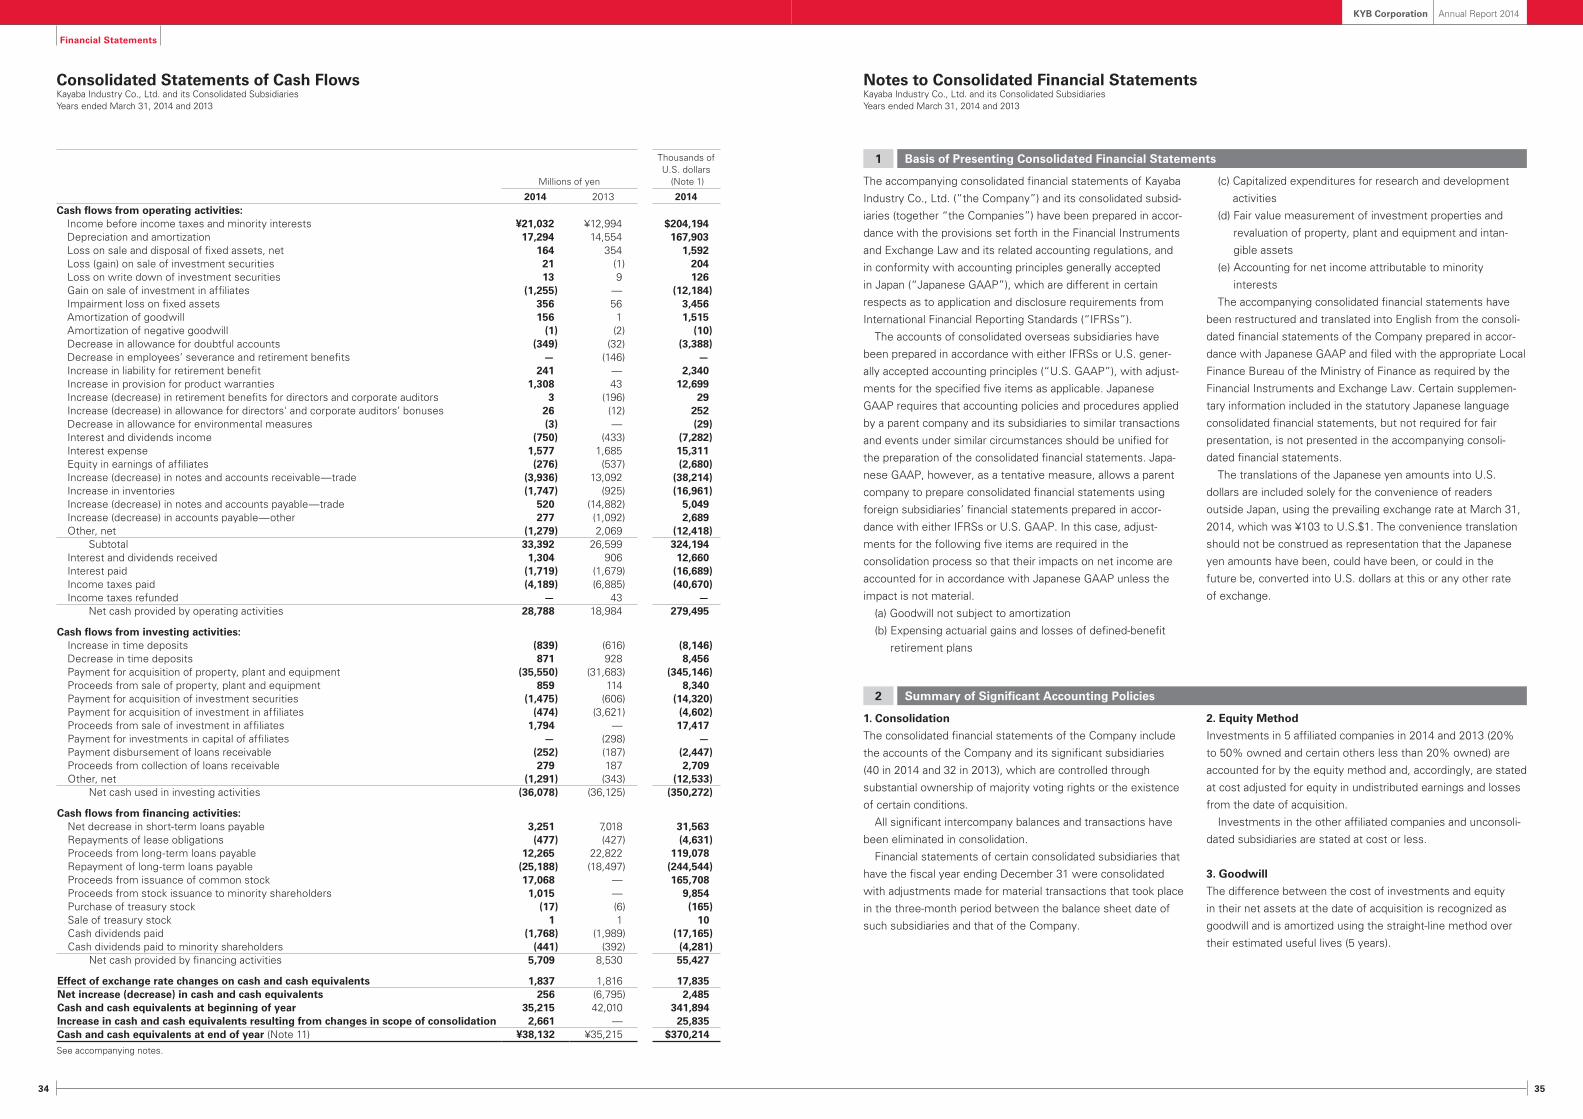
Net cash used in operating and investing activities was
¥7,290 million (US$70,777 thousand). The main reason
for the negative cash flow was expenses associated with
up-front investments to expand and upgrade production
facilities. Net cash provided by financing activities was
¥5,709 million (US$55,427 thousand). As a result, cash and
cash equivalents at end of year increased ¥2,917 million to
¥38,132 million (US$370,214 thousand).
Net cash provided by operating activities increased
51.6% to ¥28,788 million (US$279,495 thousand). Cash
was used by a ¥17,028 million increase in notes and
accounts receivable–trade, but cash was provided by a
¥15,402 million increase in notes and accounts payable–
trade, income before income taxes and minority interests
of ¥8,038 million, depreciation and amortization of ¥2,740
million, and other items.
Net cash used in investing activities decreased 0.1% to
¥36,078 million (US$350,272 thousand). The main use was
payment for acquisition of property, plant and equipment
totaling ¥35,550 million (US$345,146 thousand).
Net cash provided by financing activities was ¥5,709
million (US$55,427 thousand). There were proceeds of
¥17,068 million (US$165,709 thousand) from issuance
of common stock, a net decrease of ¥3,251 million
(US$31,563 thousand) in short-term loans payable, and net
repayments of ¥12,923 million (US$125,466 thousand) for
long-term loans payable.
Financial Review
Summary
In the automotive components segment, sales increased
18.5% to ¥218,948 million (US$2,125,709 thousand).
Sales of automotive shock absorbers were higher in
Japan. Overseas, there was a recovery in shock absorbers
in Europe, mainly in Germany and Scandinavia, and the
volume of shipments was strong in the United States.
Sales of aftermarket shock absorbers also increased.
The result was an increase in total shock absorber sales.
Sales of motorcycle shock absorbers were about the
same as one year earlier. Sales of automotive hydraulic
components, mainly for power steering, were also higher.
There were new orders for electric power steering
products and higher sales of CVT vane pumps.
In the hydraulic components segment, sales increased
9.9% to ¥115,485 million (US$1,121,214 thousand). Sales
of industrial hydraulic components, mainly for construction
machinery, increased in Japan as companies rushed to
make purchases prior to the April 2014 consumption
tax hike and before the enactment of tighter emissions
restrictions. Overseas sales of industrial hydraulic
components were also higher. This was mainly the result
of higher construction machinery shipments in China
and a small sales increase in the ASEAN region because
of the negative effects of sluggish oil prices and weaker
currencies. Sales of hydraulic equipment for aircraft
increased because of an increase in orders for spare parts.
In the other segment, which consists of special-
purpose vehicles, system products, electronic devices and
other products, sales increased 15.1% to ¥18,276 million
(US$177,437 thousand). This strong growth was backed
by growth in sales of special-purpose vehicles, mainly
concrete mixer trucks, due to the combined benefits
of demand associated with earthquake reconstruction
activities and replacement demand for older vehicles.
As a result, consolidated net sales increased 15.4% to
¥352,711 million (US$3,424,379 thousand).
Operating income increased 79.2% in the automotive
components segment, 87.9% in the hydraulic components
segment and 28.9% in the other segment. Total operating
income was up ¥7,696 million, or 73.5%, to ¥18,170 million
(US$176,408 thousand).
Non-operating income and expenses resulted in net
non-operating income of ¥2,862 million (US$27,786
thousand). Foreign exchange gain, net, was down ¥1,481
million but there was a ¥216 million increase in dividends
income, a ¥108 million decrease in interest expenses, and
gain of ¥1,255 million (US$12,184 thousand) on sale of
investment in affiliates.
Income before income taxes and minority interests
was ¥21,032 million (US$204,194 thousand). After income
taxes of ¥7,834 million (US$76,058 thousand) and minority
interests, net income was ¥12,761 million (US$123,893
thousand).
Financial Condition
Current assets increased mainly because of an increase in
notes and accounts receivable–trade, which were higher
due to the growth in sales. The increase in noncurrent
assets was primarily attributable to growth in property,
plant and equipment that resulted from speedy capital
expenditures to expand and upgrade manufacturing
facilities. As a result, total assets increased ¥33,171 million
to ¥361,083 million (US$3,505,660 thousand).
Total liabilities decreased ¥4,391 million to ¥207,086
million (US$2,010,544 thousand). The main changes were
an increase in notes and accounts payable–trade because
of sales growth and a decrease in loans payable.
Net assets increased ¥37,562 million to ¥153,997 million
(US$1,495,117 thousand) mainly because of increases in
common stock, capital surplus and retained earnings.
The increase in net assets raised the equity ratio 6.7
percentage points to 41.2% at the end of March 2014.
28 29
KYB Corporation Annual Report 2014
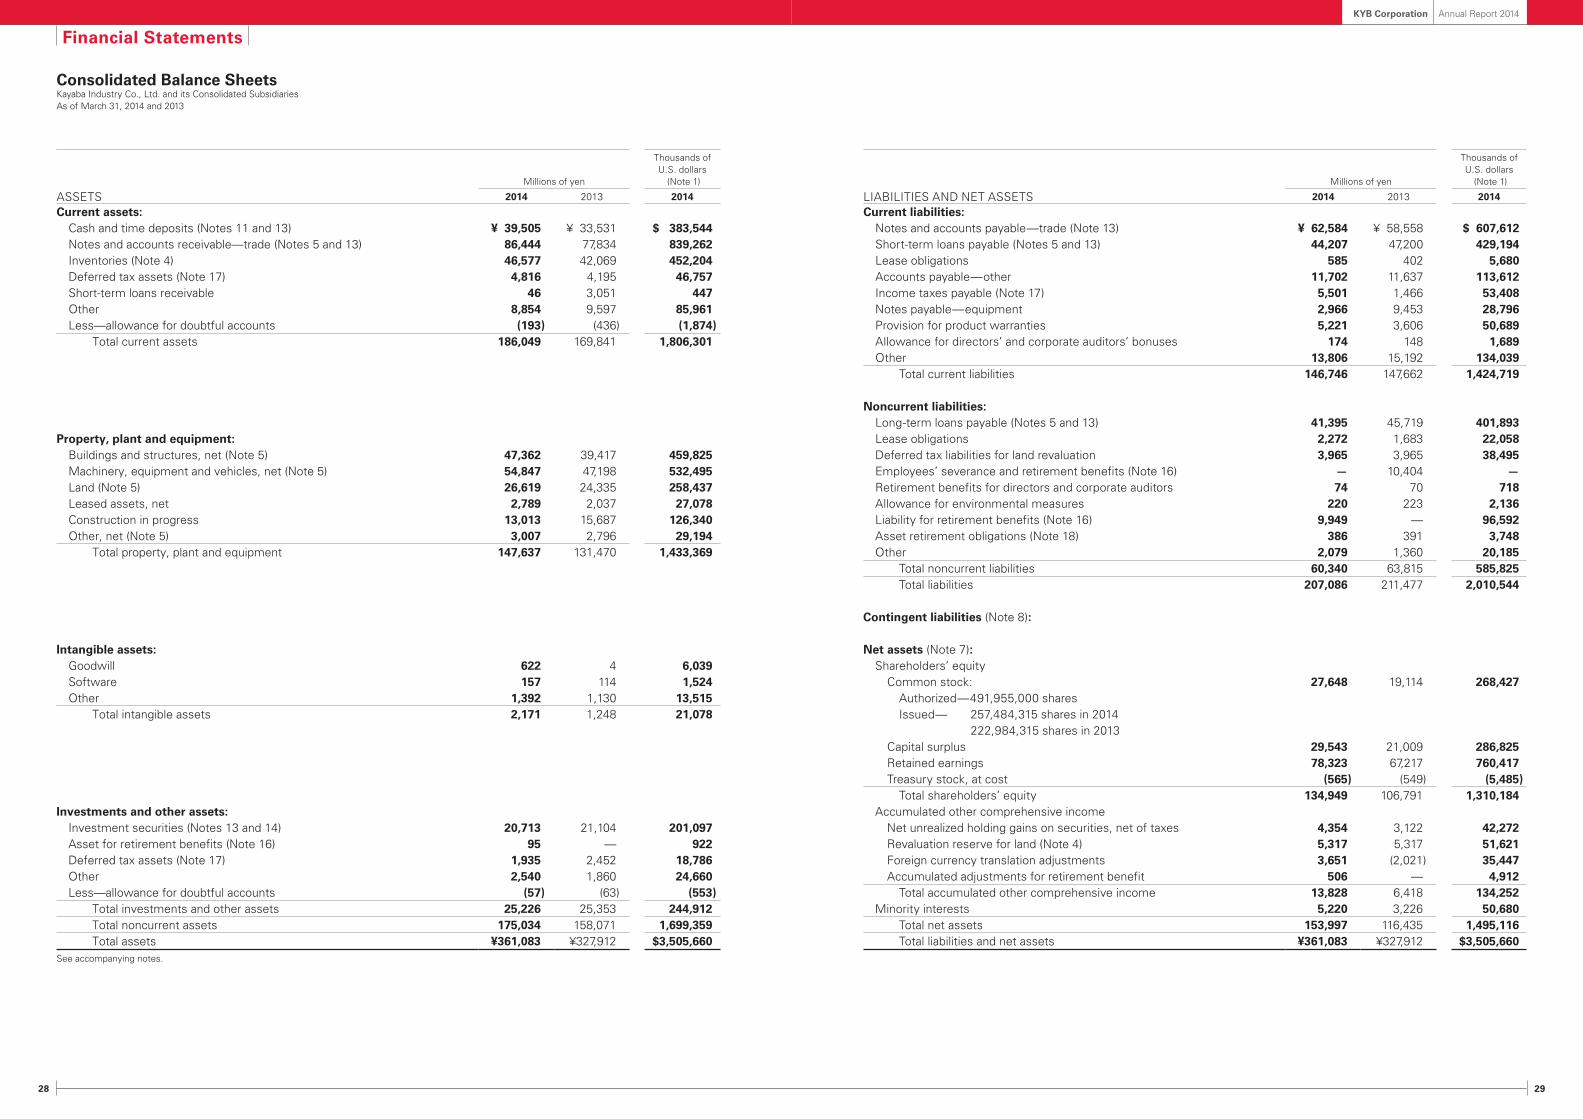
Consolidated Balance SheetsKayaba Industry Co., Ltd. and its Consolidated SubsidiariesAs of March 31, 2014 and 2013
Millions of yen
Thousands of U.S. dollars
(Note 1)
ASSETS 2014 2013 2014
Current assets: Cash and time deposits (Notes 11 and 13) ¥ 39,505 ¥ 33,531 $ 383,544 Notes and accounts receivable—trade (Notes 5 and 13) 86,444 77,834 839,262 Inventories (Note 4) 46,577 42,069 452,204 Deferred tax assets (Note 17) 4,816 4,195 46,757 Short-term loans receivable 46 3,051 447 Other 8,854 9,597 85,961 Less—allowance for doubtful accounts (193) (436) (1,874) Total current assets 186,049 169,841 1,806,301
Property, plant and equipment: Buildings and structures, net (Note 5) 47,362 39,417 459,825 Machinery, equipment and vehicles, net (Note 5) 54,847 47,198 532,495 Land (Note 5) 26,619 24,335 258,437 Leased assets, net 2,789 2,037 27,078 Construction in progress 13,013 15,687 126,340 Other, net (Note 5) 3,007 2,796 29,194 Total property, plant and equipment 147,637 131,470 1,433,369
Intangible assets: Goodwill 622 4 6,039 Software 157 114 1,524 Other 1,392 1,130 13,515 Total intangible assets 2,171 1,248 21,078
Investments and other assets: Investment securities (Notes 13 and 14) 20,713 21,104 201,097 Asset for retirement benefits (Note 16) 95 — 922 Deferred tax assets (Note 17) 1,935 2,452 18,786 Other 2,540 1,860 24,660 Less—allowance for doubtful accounts (57) (63) (553) Total investments and other assets 25,226 25,353 244,912 Total noncurrent assets 175,034 158,071 1,699,359 Total assets ¥361,083 ¥327,912 $3,505,660 See accompanying notes.
Millions of yen
Thousands of U.S. dollars
(Note 1)
LIABILITIES AND NET ASSETS 2014 2013 2014
Current liabilities: Notes and accounts payable—trade (Note 13) ¥ 62,584 ¥ 58,558 $ 607,612 Short-term loans payable (Notes 5 and 13) 44,207 47,200 429,194 Lease obligations 585 402 5,680 Accounts payable—other 11,702 11,637 113,612 Income taxes payable (Note 17) 5,501 1,466 53,408 Notes payable—equipment 2,966 9,453 28,796 Provision for product warranties 5,221 3,606 50,689 Allowance for directors’ and corporate auditors’ bonuses 174 148 1,689 Other 13,806 15,192 134,039 Total current liabilities 146,746 147,662 1,424,719
Noncurrent liabilities: Long-term loans payable (Notes 5 and 13) 41,395 45,719 401,893 Lease obligations 2,272 1,683 22,058 Deferred tax liabilities for land revaluation 3,965 3,965 38,495 Employees’ severance and retirement benefits (Note 16) — 10,404 — Retirement benefits for directors and corporate auditors 74 70 718 Allowance for environmental measures 220 223 2,136 Liability for retirement benefits (Note 16) 9,949 — 96,592 Asset retirement obligations (Note 18) 386 391 3,748 Other 2,079 1,360 20,185 Total noncurrent liabilities 60,340 63,815 585,825 Total liabilities 207,086 211,477 2,010,544
Contingent liabilities (Note 8):
Net assets (Note 7): Shareholders’ equity Common stock: 27,648 19,114 268,427 Authorized—491,955,000 shares Issued— 257,484,315 shares in 2014 222,984,315 shares in 2013 Capital surplus 29,543 21,009 286,825 Retained earnings 78,323 67,217 760,417 Treasury stock, at cost (565) (549) (5,485) Total shareholders’ equity 134,949 106,791 1,310,184 Accumulated other comprehensive income Net unrealized holding gains on securities, net of taxes 4,354 3,122 42,272 Revaluation reserve for land (Note 4) 5,317 5,317 51,621 Foreign currency translation adjustments 3,651 (2,021) 35,447 Accumulated adjustments for retirement benefit 506 — 4,912 Total accumulated other comprehensive income 13,828 6,418 134,252 Minority interests 5,220 3,226 50,680 Total net assets 153,997 116,435 1,495,116 Total liabilities and net assets ¥361,083 ¥327,912 $3,505,660
Financial Statements
30 31
KYB Corporation Annual Report 2014
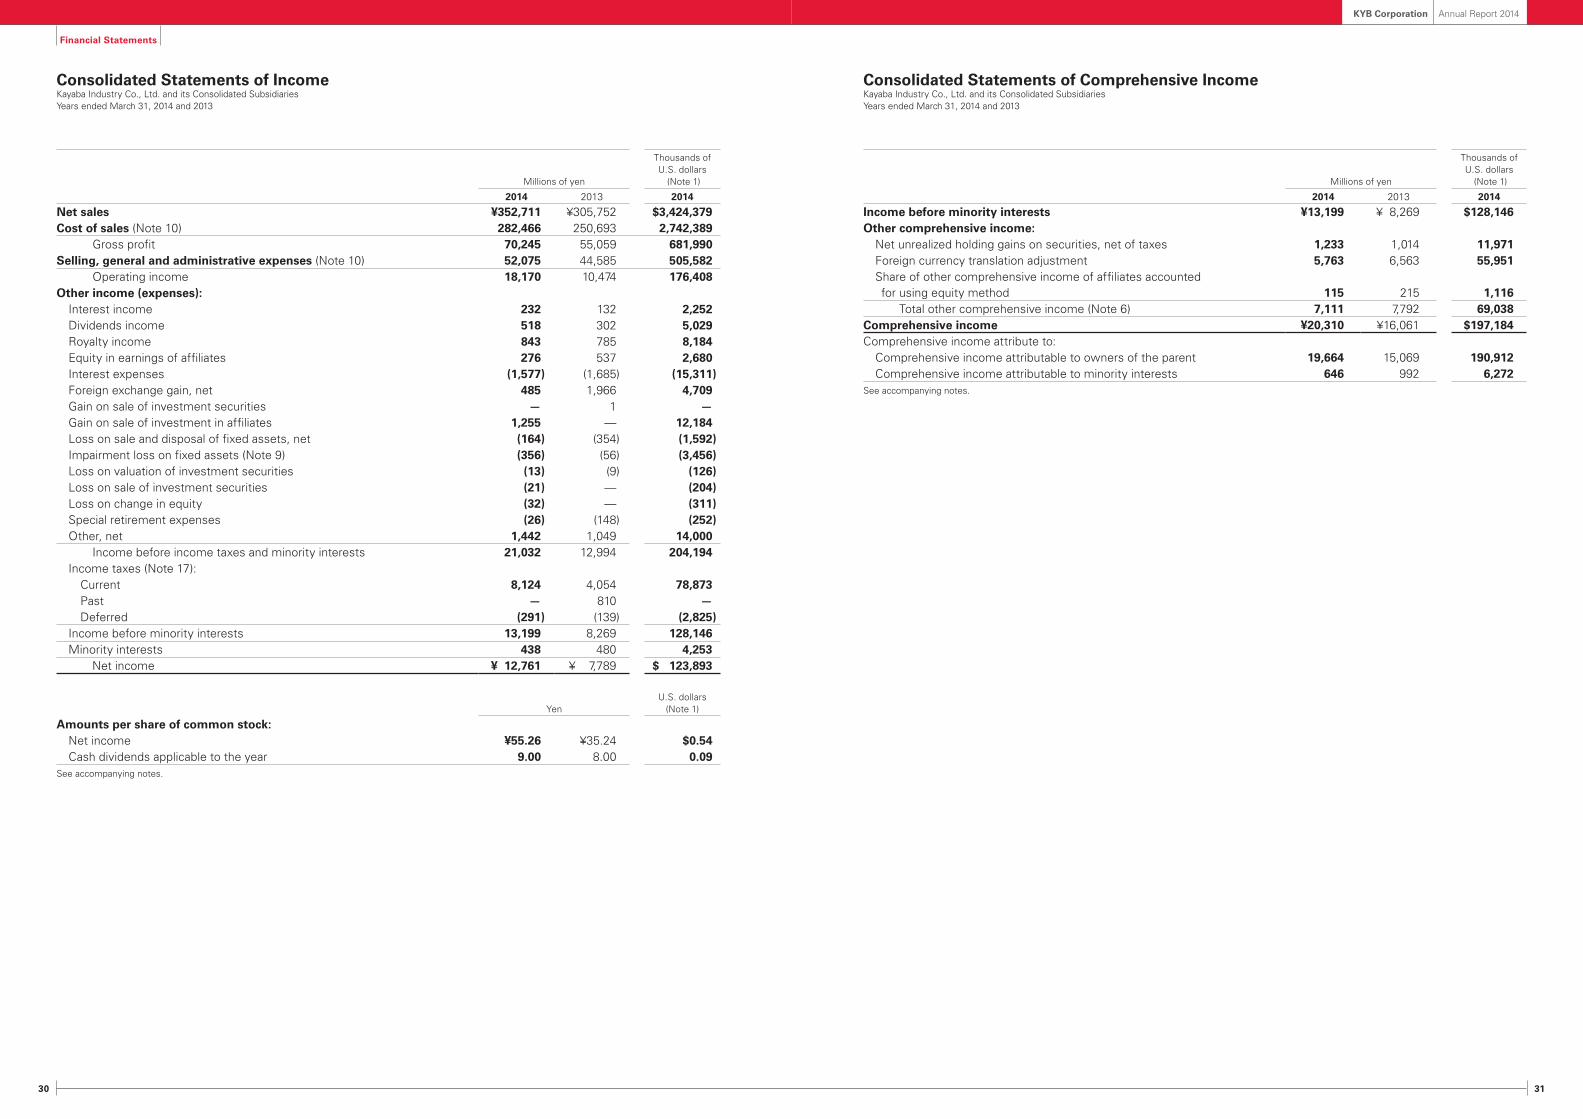
Consolidated Statements of IncomeKayaba Industry Co., Ltd. and its Consolidated SubsidiariesYears ended March 31, 2014 and 2013
Consolidated Statements of Comprehensive IncomeKayaba Industry Co., Ltd. and its Consolidated SubsidiariesYears ended March 31, 2014 and 2013
Financial Statements
Millions of yen
Thousands of U.S. dollars
(Note 1)
2014 2013 2014
Net sales ¥352,711 ¥305,752 $3,424,379 Cost of sales (Note 10) 282,466 250,693 2,742,389 Gross profit 70,245 55,059 681,990 Selling, general and administrative expenses (Note 10) 52,075 44,585 505,582 Operating income 18,170 10,474 176,408 Other income (expenses): Interest income 232 132 2,252 Dividends income 518 302 5,029 Royalty income 843 785 8,184 Equity in earnings of affiliates 276 537 2,680 Interest expenses (1,577) (1,685) (15,311) Foreign exchange gain, net 485 1,966 4,709 Gain on sale of investment securities — 1 — Gain on sale of investment in affiliates 1,255 — 12,184 Loss on sale and disposal of fixed assets, net (164) (354) (1,592) Impairment loss on fixed assets (Note 9) (356) (56) (3,456) Loss on valuation of investment securities (13) (9) (126) Loss on sale of investment securities (21) — (204) Loss on change in equity (32) — (311) Special retirement expenses (26) (148) (252) Other, net 1,442 1,049 14,000 Income before income taxes and minority interests 21,032 12,994 204,194 Income taxes (Note 17): Current 8,124 4,054 78,873 Past — 810 — Deferred (291) (139) (2,825) Income before minority interests 13,199 8,269 128,146 Minority interests 438 480 4,253 Net income ¥ 12,761 ¥ 7,789 $ 123,893
YenU.S. dollars
(Note 1)
Amounts per share of common stock: Net income ¥55.26 ¥35.24 $0.54 Cash dividends applicable to the year 9.00 8.00 0.09 See accompanying notes.
Millions of yen
Thousands of U.S. dollars
(Note 1)
2014 2013 2014
Income before minority interests ¥13,199 ¥ 8,269 $128,146 Other comprehensive income: Net unrealized holding gains on securities, net of taxes 1,233 1,014 11,971 Foreign currency translation adjustment 5,763 6,563 55,951 Share of other comprehensive income of affiliates accounted
for using equity method 115 215 1,116 Total other comprehensive income (Note 6) 7,111 7,792 69,038 Comprehensive income ¥20,310 ¥16,061 $197,184 Comprehensive income attribute to: Comprehensive income attributable to owners of the parent 19,664 15,069 190,912 Comprehensive income attributable to minority interests 646 992 6,272 See accompanying notes.
32 33
KYB Corporation Annual Report 2014
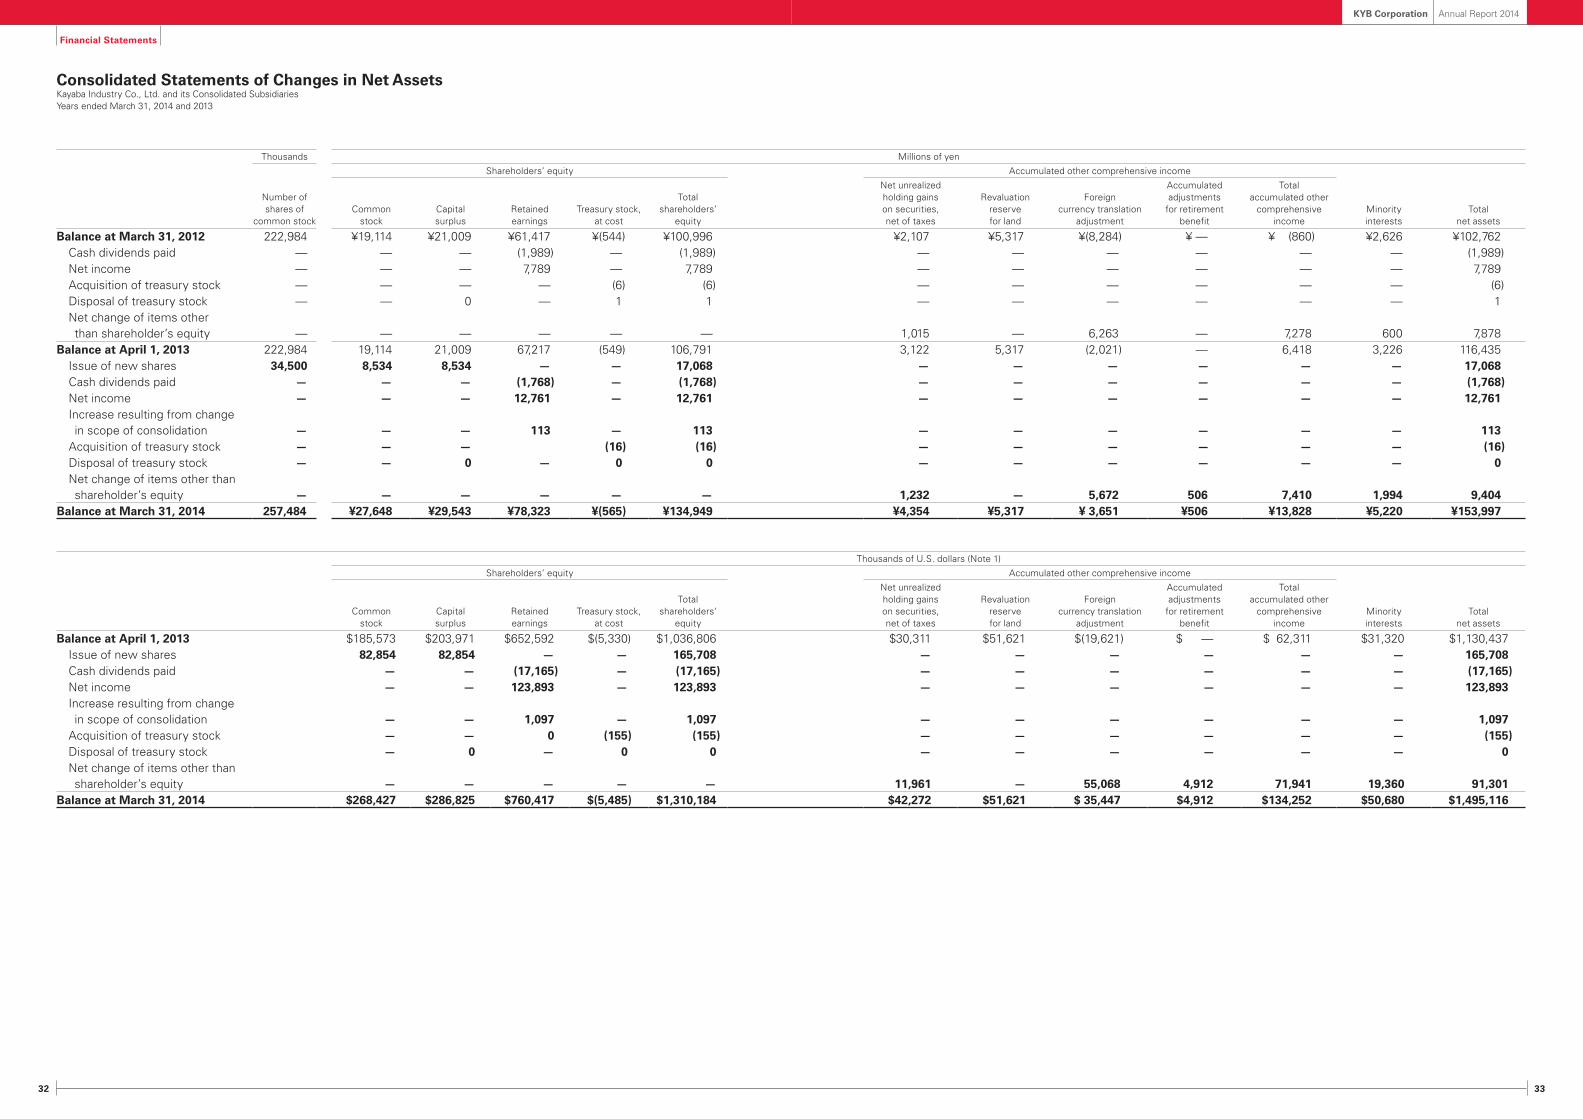
Consolidated Statements of Changes in Net AssetsKayaba Industry Co., Ltd. and its Consolidated SubsidiariesYears ended March 31, 2014 and 2013
Financial Statements
Thousands Millions of yen
Shareholders’ equity Accumulated other comprehensive income
Number of shares of
common stockCommon
stockCapital surplus
Retained earnings
Treasury stock, at cost
Total shareholders’
equity
Net unrealized holding gains on securities, net of taxes
Revaluation reserve for land
Foreign currency translation
adjustment
Accumulated adjustments
for retirement benefit
Total accumulated other
comprehensive income
Minority interests
Total net assets
Balance at March 31, 2012 222,984 ¥19,114 ¥21,009 ¥61,417 ¥(544) ¥100,996 ¥2,107 ¥5,317 ¥(8,284) ¥ — ¥ (860) ¥2,626 ¥102,762 Cash dividends paid — — — (1,989) — (1,989) — — — — — — (1,989) Net income — — — 7,789 — 7,789 — — — — — — 7,789 Acquisition of treasury stock — — — — (6) (6) — — — — — — (6) Disposal of treasury stock — — 0 — 1 1 — — — — — — 1 Net change of items other
Consolidated Statements of Cash FlowsKayaba Industry Co., Ltd. and its Consolidated SubsidiariesYears ended March 31, 2014 and 2013
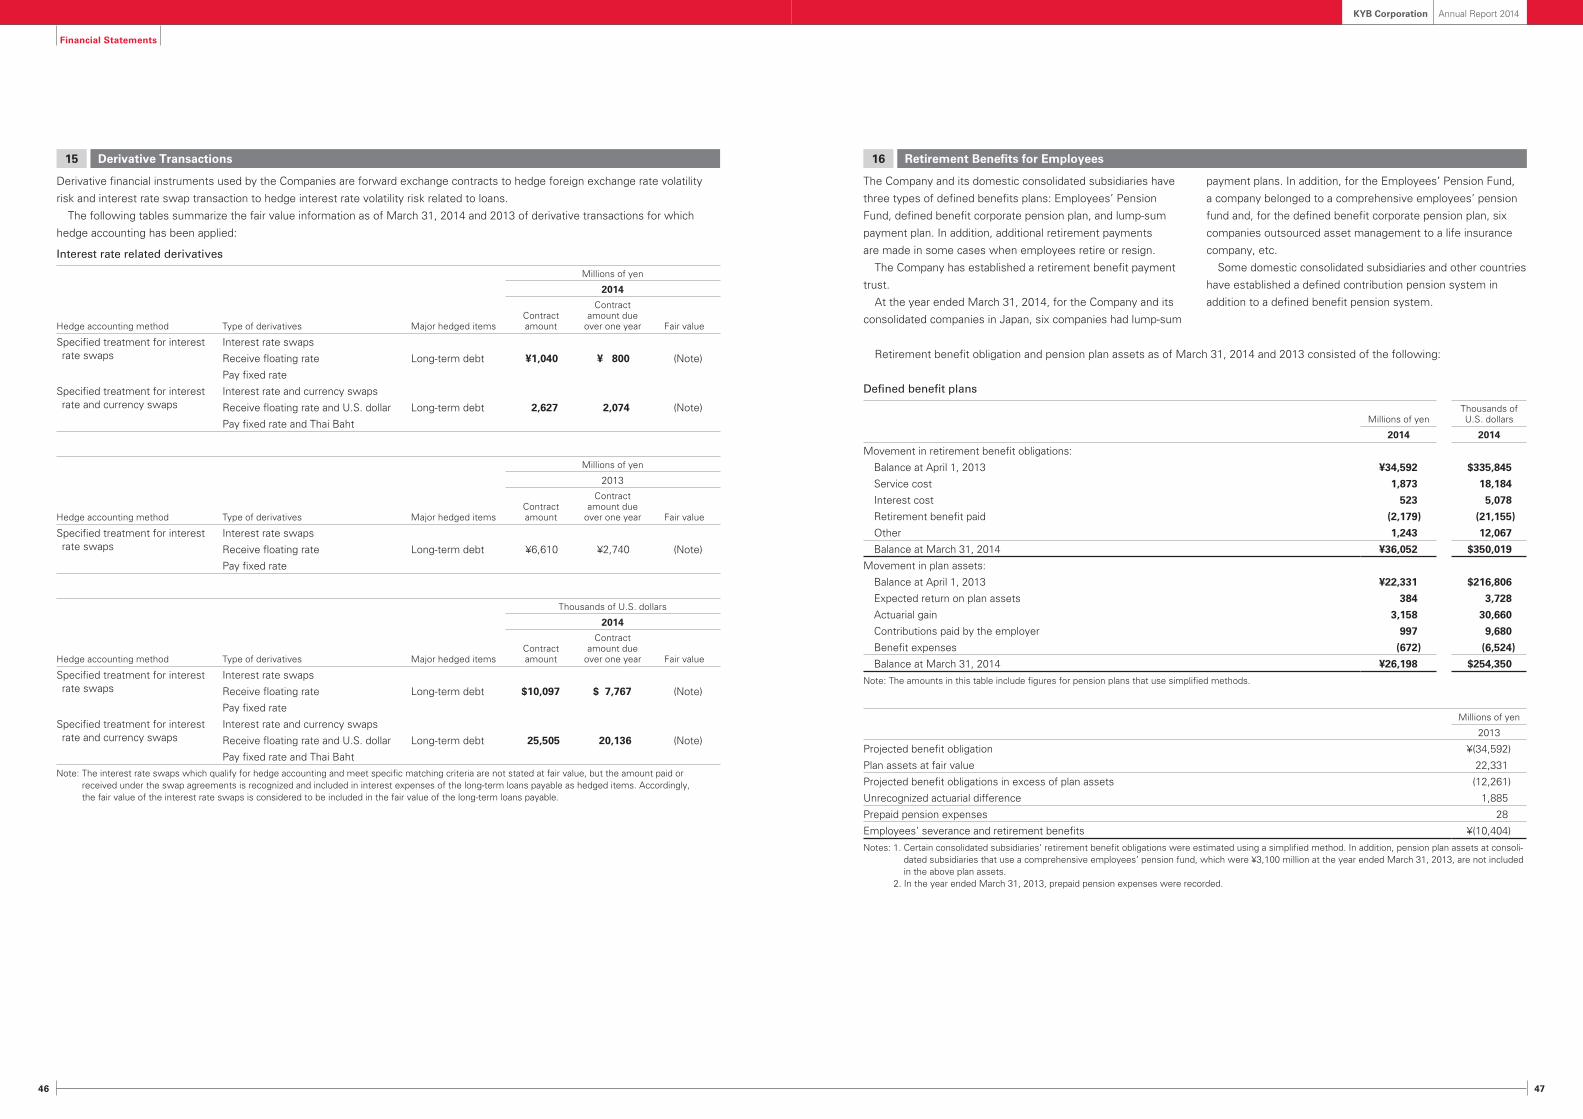
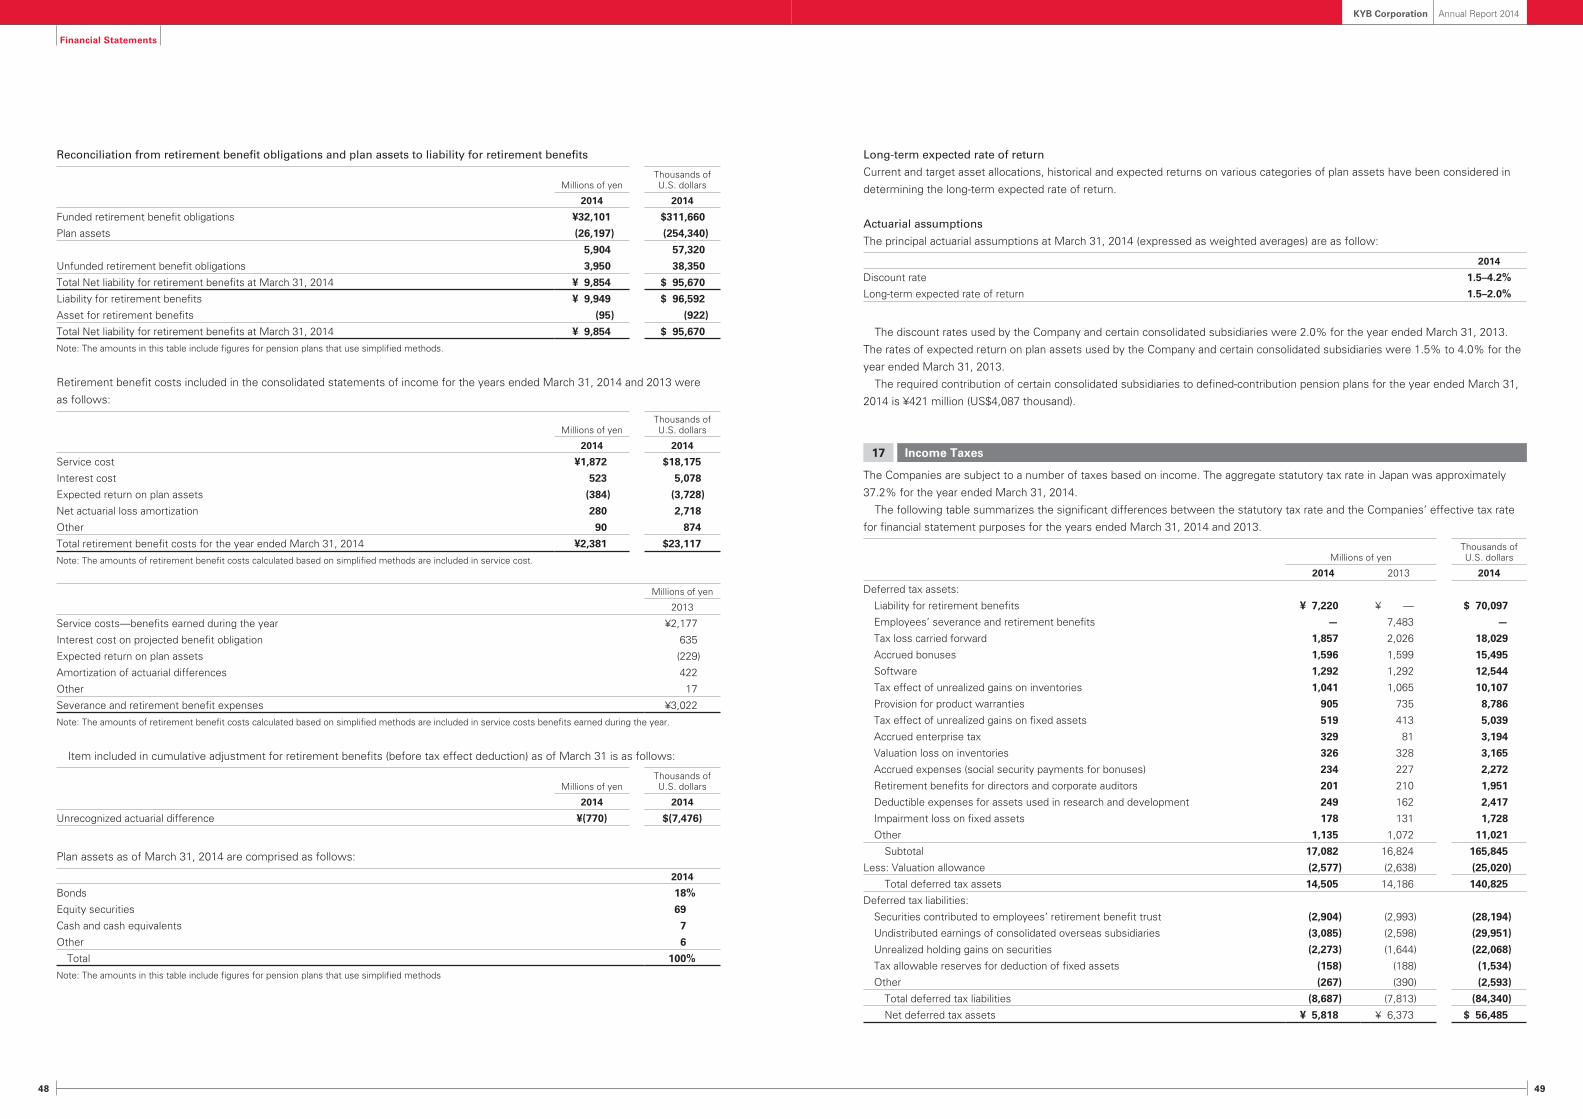
Notes to Consolidated Financial StatementsKayaba Industry Co., Ltd. and its Consolidated SubsidiariesYears ended March 31, 2014 and 2013
Millions of yen
Thousands of U.S. dollars
(Note 1)
2014 2013 2014Cash flows from operating activities: Income before income taxes and minority interests ¥21,032 ¥12,994 $204,194 Depreciation and amortization 17,294 14,554 167,903 Loss on sale and disposal of fixed assets, net 164 354 1,592 Loss (gain) on sale of investment securities 21 (1) 204 Loss on write down of investment securities 13 9 126 Gain on sale of investment in affiliates (1,255) — (12,184) Impairment loss on fixed assets 356 56 3,456 Amortization of goodwill 156 1 1,515 Amortization of negative goodwill (1) (2) (10) Decrease in allowance for doubtful accounts (349) (32) (3,388) Decrease in employees’ severance and retirement benefits — (146) — Increase in liability for retirement benefit 241 — 2,340 Increase in provision for product warranties 1,308 43 12,699 Increase (decrease) in retirement benefits for directors and corporate auditors 3 (196) 29 Increase (decrease) in allowance for directors' and corporate auditors’ bonuses 26 (12) 252 Decrease in allowance for environmental measures (3) — (29) Interest and dividends income (750) (433) (7,282) Interest expense 1,577 1,685 15,311 Equity in earnings of affiliates (276) (537) (2,680) Increase (decrease) in notes and accounts receivable—trade (3,936) 13,092 (38,214) Increase in inventories (1,747) (925) (16,961) Increase (decrease) in notes and accounts payable—trade 520 (14,882) 5,049 Increase (decrease) in accounts payable—other 277 (1,092) 2,689 Other, net (1,279) 2,069 (12,418) Subtotal 33,392 26,599 324,194 Interest and dividends received 1,304 906 12,660 Interest paid (1,719) (1,679) (16,689) Income taxes paid (4,189) (6,885) (40,670) Income taxes refunded — 43 — Net cash provided by operating activities 28,788 18,984 279,495
Cash flows from investing activities: Increase in time deposits (839) (616) (8,146) Decrease in time deposits 871 928 8,456 Payment for acquisition of property, plant and equipment (35,550) (31,683) (345,146) Proceeds from sale of property, plant and equipment 859 114 8,340 Payment for acquisition of investment securities (1,475) (606) (14,320) Payment for acquisition of investment in affiliates (474) (3,621) (4,602) Proceeds from sale of investment in affiliates 1,794 — 17,417 Payment for investments in capital of affiliates — (298) — Payment disbursement of loans receivable (252) (187) (2,447) Proceeds from collection of loans receivable 279 187 2,709 Other, net (1,291) (343) (12,533) Net cash used in investing activities (36,078) (36,125) (350,272)
Cash flows from financing activities: Net decrease in short-term loans payable 3,251 7,018 31,563 Repayments of lease obligations (477) (427) (4,631) Proceeds from long-term loans payable 12,265 22,822 119,078 Repayment of long-term loans payable (25,188) (18,497) (244,544) Proceeds from issuance of common stock 17,068 — 165,708 Proceeds from stock issuance to minority shareholders 1,015 — 9,854 Purchase of treasury stock (17) (6) (165) Sale of treasury stock 1 1 10 Cash dividends paid (1,768) (1,989) (17,165) Cash dividends paid to minority shareholders (441) (392) (4,281) Net cash provided by financing activities 5,709 8,530 55,427
Effect of exchange rate changes on cash and cash equivalents 1,837 1,816 17,835 Net increase (decrease) in cash and cash equivalents 256 (6,795) 2,485 Cash and cash equivalents at beginning of year 35,215 42,010 341,894 Increase in cash and cash equivalents resulting from changes in scope of consolidation 2,661 — 25,835 Cash and cash equivalents at end of year (Note 11) ¥38,132 ¥35,215 $370,214 See accompanying notes.
1 Basis of Presenting Consolidated Financial Statements
The accompanying consolidated financial statements of Kayaba
Industry Co., Ltd. (“the Company”) and its consolidated subsid-
iaries (together “the Companies”) have been prepared in accor-
dance with the provisions set forth in the Financial Instruments
and Exchange Law and its related accounting regulations, and
in conformity with accounting principles generally accepted
in Japan (“Japanese GAAP”), which are different in certain
respects as to application and disclosure requirements from
International Financial Reporting Standards (“IFRSs”).
The accounts of consolidated overseas subsidiaries have
been prepared in accordance with either IFRSs or U.S. gener-
ally accepted accounting principles (“U.S. GAAP”), with adjust-
ments for the specified five items as applicable. Japanese
GAAP requires that accounting policies and procedures applied
by a parent company and its subsidiaries to similar transactions
and events under similar circumstances should be unified for
the preparation of the consolidated financial statements. Japa-
nese GAAP, however, as a tentative measure, allows a parent
company to prepare consolidated financial statements using
foreign subsidiaries’ financial statements prepared in accor-
dance with either IFRSs or U.S. GAAP. In this case, adjust-
ments for the following five items are required in the
consolidation process so that their impacts on net income are
accounted for in accordance with Japanese GAAP unless the
impact is not material.
(a) Goodwill not subject to amortization
(b) Expensing actuarial gains and losses of defined-benefit
retirement plans
(c) Capitalized expenditures for research and development
activities
(d) Fair value measurement of investment properties and
revaluation of property, plant and equipment and intan-
gible assets
(e) Accounting for net income attributable to minority
interests
The accompanying consolidated financial statements have
been restructured and translated into English from the consoli-
dated financial statements of the Company prepared in accor-
dance with Japanese GAAP and filed with the appropriate Local
Finance Bureau of the Ministry of Finance as required by the
Financial Instruments and Exchange Law. Certain supplemen-
tary information included in the statutory Japanese language
consolidated financial statements, but not required for fair
presentation, is not presented in the accompanying consoli-
dated financial statements.
The translations of the Japanese yen amounts into U.S.
dollars are included solely for the convenience of readers
outside Japan, using the prevailing exchange rate at March 31,
2014, which was ¥103 to U.S.$1. The convenience translation
should not be construed as representation that the Japanese
yen amounts have been, could have been, or could in the
future be, converted into U.S. dollars at this or any other rate
of exchange.
2 Summary of Significant Accounting Policies
1. Consolidation
The consolidated financial statements of the Company include
the accounts of the Company and its significant subsidiaries
(40 in 2014 and 32 in 2013), which are controlled through
substantial ownership of majority voting rights or the existence
of certain conditions.
All significant intercompany balances and transactions have
been eliminated in consolidation.
Financial statements of certain consolidated subsidiaries that
have the fiscal year ending December 31 were consolidated
with adjustments made for material transactions that took place
in the three-month period between the balance sheet date of
such subsidiaries and that of the Company.
2. Equity Method
Investments in 5 affiliated companies in 2014 and 2013 (20%
to 50% owned and certain others less than 20% owned) are
accounted for by the equity method and, accordingly, are stated
at cost adjusted for equity in undistributed earnings and losses
from the date of acquisition.
Investments in the other affiliated companies and unconsoli-
dated subsidiaries are stated at cost or less.
3. Goodwill
The difference between the cost of investments and equity
in their net assets at the date of acquisition is recognized as
goodwill and is amortized using the straight-line method over
their estimated useful lives (5 years).
Financial Statements
36 37
KYB Corporation Annual Report 2014
Financial Statements
4. Foreign Currency Translation
Receivables and payables denominated in foreign currencies
are translated into Japanese yen at the year-end rates with
the resulting gain or loss included in the current statements
of income.
The balance sheets of consolidated overseas subsidiaries
are translated into Japanese yen at the year-end rates except
for shareholders’ equity accounts, which are translated at the
historical rates. The statements of income of consolidated
overseas subsidiaries are translated at average rates.
The resulting foreign currency translation adjustments are
presented in “Foreign currency translation adjustments”
and “Minority interests in consolidated subsidiaries” in the
consolidated balance sheets.
5. Cash and Cash Equivalents
In preparing the consolidated statements of cash flows, cash
on hand, readily available deposits and short-term highly liquid
investments with maturities not exceeding three months at
the time of purchase are considered to be cash and cash
equivalents.
6. Inventories
Inventories are stated at the lower of cost, determined mainly
by the periodic-average method, or net realizable value.
7. Securities
The Companies examine the intent of holding each security
and classify those securities as (a) equity securities issued by
subsidiaries and affiliated companies and (b) available-for-sale
securities. The companies do not have trading securities and
held-to-maturity debt securities.
Equity securities issued by subsidiaries and affiliated compa-
nies that are not consolidated or accounted for using the equity
method are stated at moving-average cost. Available-for-sale
securities with available fair market values are stated at fair
market value. Unrealized gains and losses on these securities
are reported, net of applicable income taxes, as a separate
component of net assets. Realized gains and losses on sales
of such securities are computed using moving-average cost.
Other securities with no available fair market value are stated
at moving-average cost.
8. Derivative Transactions and Hedge Accounting
Derivative financial instruments are stated at fair value and
gains or losses are recognized for changes in the fair value
unless derivative financial instruments are used for hedging
purposes.
If derivative financial instruments are used as hedges and
meet certain hedging criteria, the Companies defer recognition
of gains or losses resulting from changes in the fair value of
derivative financial instruments until the related losses or gains
on the hedged items are recognized.
However, if a forward foreign exchange contract is executed
to hedge a future transaction denominated in a foreign cur-
rency, the future transaction will be recorded using the con-
tracted forward rate and no gains or losses on the forward
foreign exchange contract are recognized.
Also, if interest rate swap contracts are used as hedges
and meet certain hedging criteria, the net amount to be paid
or received under the interest rate swap contract is added to
or deducted from the interest on the assets or liabilities for
which the swap contract was executed.
9. Property, Plant and Equipment
Property, plant and equipment are stated at cost except for
certain land used for business operation, which has been
revalued. Depreciation is computed by the declining-balance
method at rates based on the estimated useful lives, except
for buildings acquired on and after April 1, 1998, which are
depreciated using the straight-line method. Consolidated
overseas subsidiaries mainly use the straight-line method over
the estimated useful lives.
10. Intangible Assets
Intangible assets are amortized using the straight-line method.
Software costs used internally are amortized using the
straight-line method over the estimated useful lives mainly of
5 years.
11. Leased Assets
Finance leased assets that are not deemed to transfer owner-
ship of the leased property to the lessee are depreciated using
the straight-line method over the lease term with zero residual
value.
Finance leases commenced prior to April 1, 2008, and have
been accounting for as operating leases, continue to be
accounted for as operating leases with disclosure of certain
“as if capitalized” information.
12. Land Revaluation
Pursuant to the Law Concerning Revaluation of Land enacted
on March 31, 1998, land owned by the Company for business
operations was revalued at fair value as of March 31, 2002. Due
to the revaluation, the related unrealized gain, net of applicable
income taxes, was reported as “Revaluation reserve for land”
in shareholders’ equity. The revaluation reserve for land in net
assets is not available for dividends under the law.
According to the revised law, the Company and a certain
subsidiary are not permitted to revalue the land at any time,
even if the fair value of the land declines. Such unrecorded
revaluation loss amounted to ¥6,300 million (US$61,165 thou-
sand) and ¥6,175 million as of March 31, 2014 and 2013.
13. Allowance for Doubtful Accounts
Allowance for doubtful accounts is provided in an amount
sufficient to cover probable losses on collection. It consists of
the estimated uncollectible amount with respect to certain
identified doubtful receivables and an amount calculated using
the actual historical rate of losses.
14. Provision for Product Warranties
Provision for product warranties is provided for the aggregate
amount of the estimated cost of certain identified claims from
customers and an amount calculated using the historical rate
of sales to warranty.
15. Allowance for Directors’ and Corporate Auditors’
Bonuses
Allowance for directors’ and corporate auditors’ bonuses is
provided bonuses for the estimated amounts which the
Company is obligated to pay to directors and corporate auditors
subject to the resolution of the shareholders’ meeting.
16. Retirement Benefits for Directors and Corporate
Auditors
The directors and corporate auditors of certain consolidated
subsidiaries receive lump-sum payments upon termination
of their services under unfunded termination plans. The full
amount of such retirement benefits for directors and corporate
auditors is accrued in accordance with the internal rules. The
payments to directors and corporate auditors are subject to
the resolution of the shareholders’ meeting.
17. Allowance for Environmental Measures
Allowance for environmental measures is provided based
on estimated costs for the disposal of “PCB (Polychlorinated
Biphenyl)” as mandated by the Law Concerning Special
Measures against PCB Waste.
18. Accounting Policy of Net Defined Benefit Liability
The Company and certain consolidated subsidiaries provide two
types of employees’ severance and retirement benefit plans,
unfunded lump-sum payment plans and funded noncontributory
pension plans, under which all eligible employees are entitled
to benefits based on the level of wage and salary at the time of
retirement or termination, length of service and certain other
factors. Some subsidiaries have pension plans of their own.
The liabilities and expenses for employees’ severance
and retirement benefits are mainly determined based on the
amounts obtained by actuarial calculations.
The Company and certain consolidated subsidiaries mainly
recognize the liabilities for employees’ severance and retire-
ment benefits based on the amounts of projected benefit
obligation and the fair value of the plan assets as of each
balance sheet date.
In calculating the retirement benefit obligation, the method of
attributing expected benefit to the accounting period is based
on a straight-line basis.
Actuarial gains and losses are recognized in the consolidated
statements of income in equal amounts over the average of the
estimated remaining service lives (11 to 15 years), commencing
with the succeeding period.
(Change in Accounting Policy)
Effective from the year ended March 31, 2014, the Company
and its domestic subsidiaries have applied the Accounting
Standard for Retirement Benefits (ASBJ Statement No. 26,
May 17, 2012 (hereinafter, the “Statement No. 26”)) and
Guidance on Accounting Standard for Retirement Benefits
(ASBJ Guidance No. 25, May 17, 2012 (hereinafter, the
“Guidance No. 25”)), except the article 35 of the Statement
No.26 and the article 67 of the Guidance No. 25 and actuarial
gains and losses and past service costs that are yet to be
recognized have been recognized and the difference between
retirement benefit obligations and plan assets has been recog-
nized as a liability for retirement benefits.
In accordance with the article 37 of the Statement No. 26,
the effect of the change in accounting policies arising from
initial application has been recognized in accumulated
adjustments for retirement benefit in accumulated other
comprehensive income.
As a result of the application, an asset for retirement benefits
in the amount of ¥94 million (US$913 thousand) and a liability
for retirement benefits in the amount of ¥9,949 million
(US$96,592 thousand) have been recognized and accumulated
other comprehensive income has increased by ¥506 million
(US$4,913 thousand), at the current fiscal year.
19. Research and Development
Expenses relating to research and development activities are
charged to the statement of income as incurred.
20. Stock Issue Expense
Stock issue expense is charged to the statement of income
as incurred.
38 39
KYB Corporation Annual Report 2014
Financial Statements
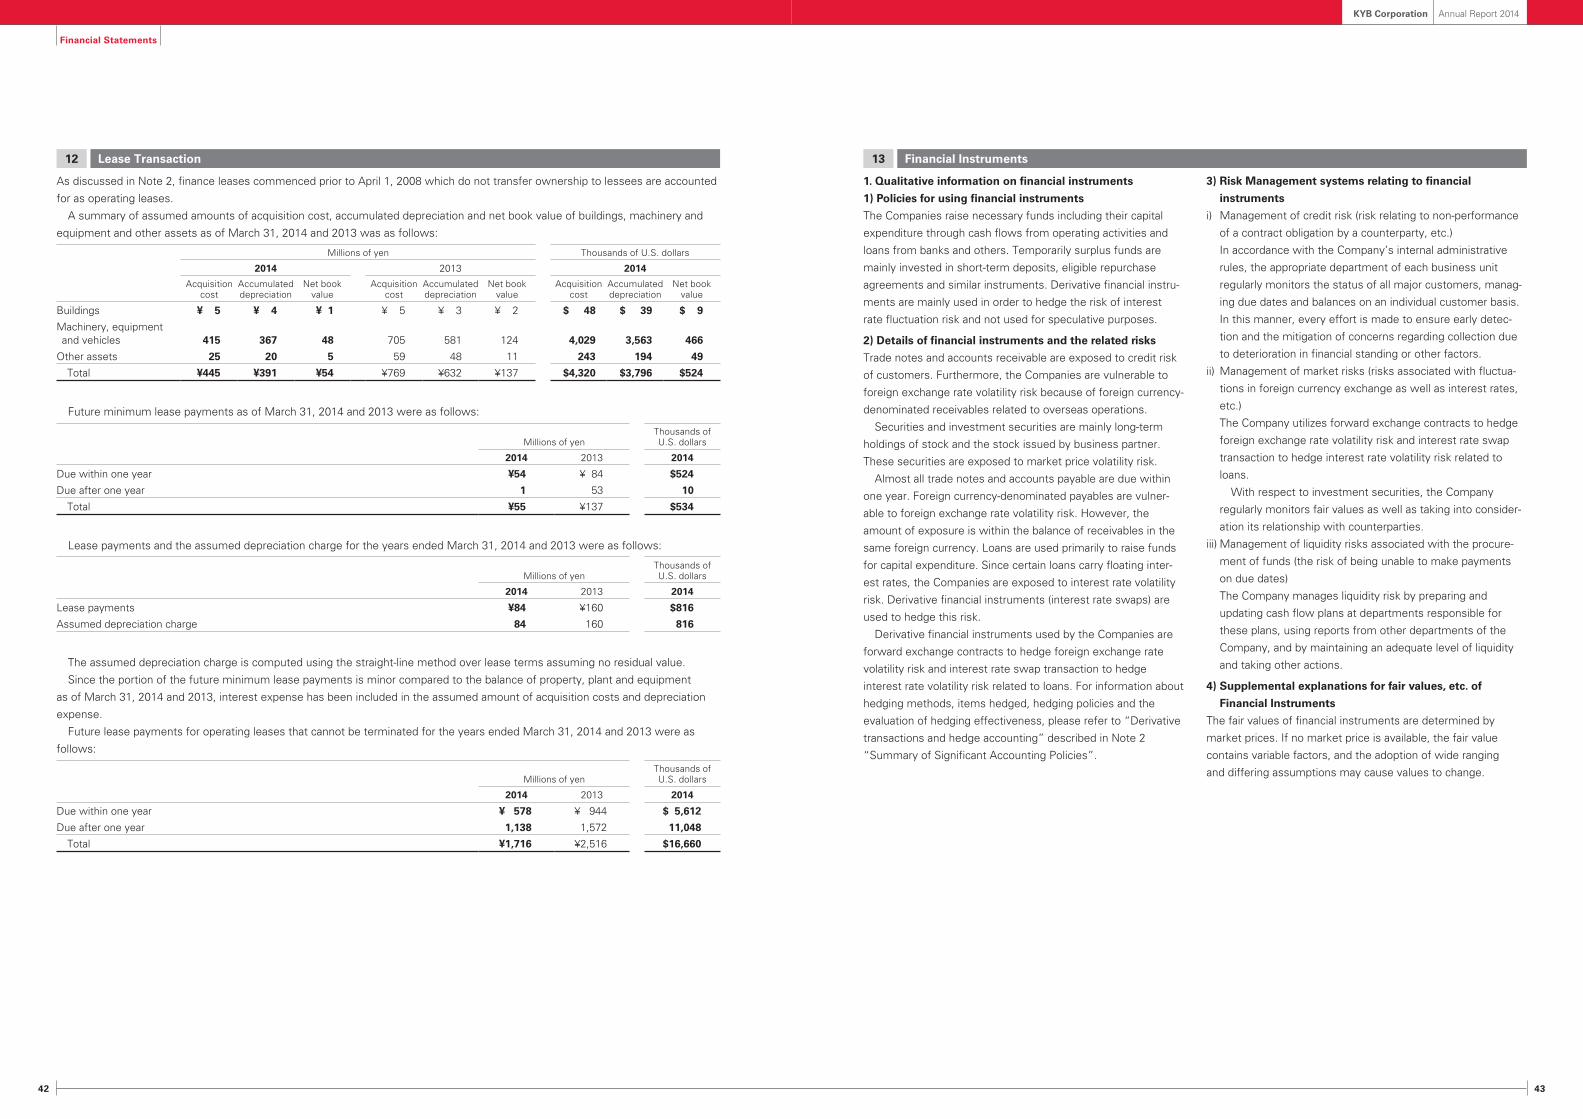
4 Inventories
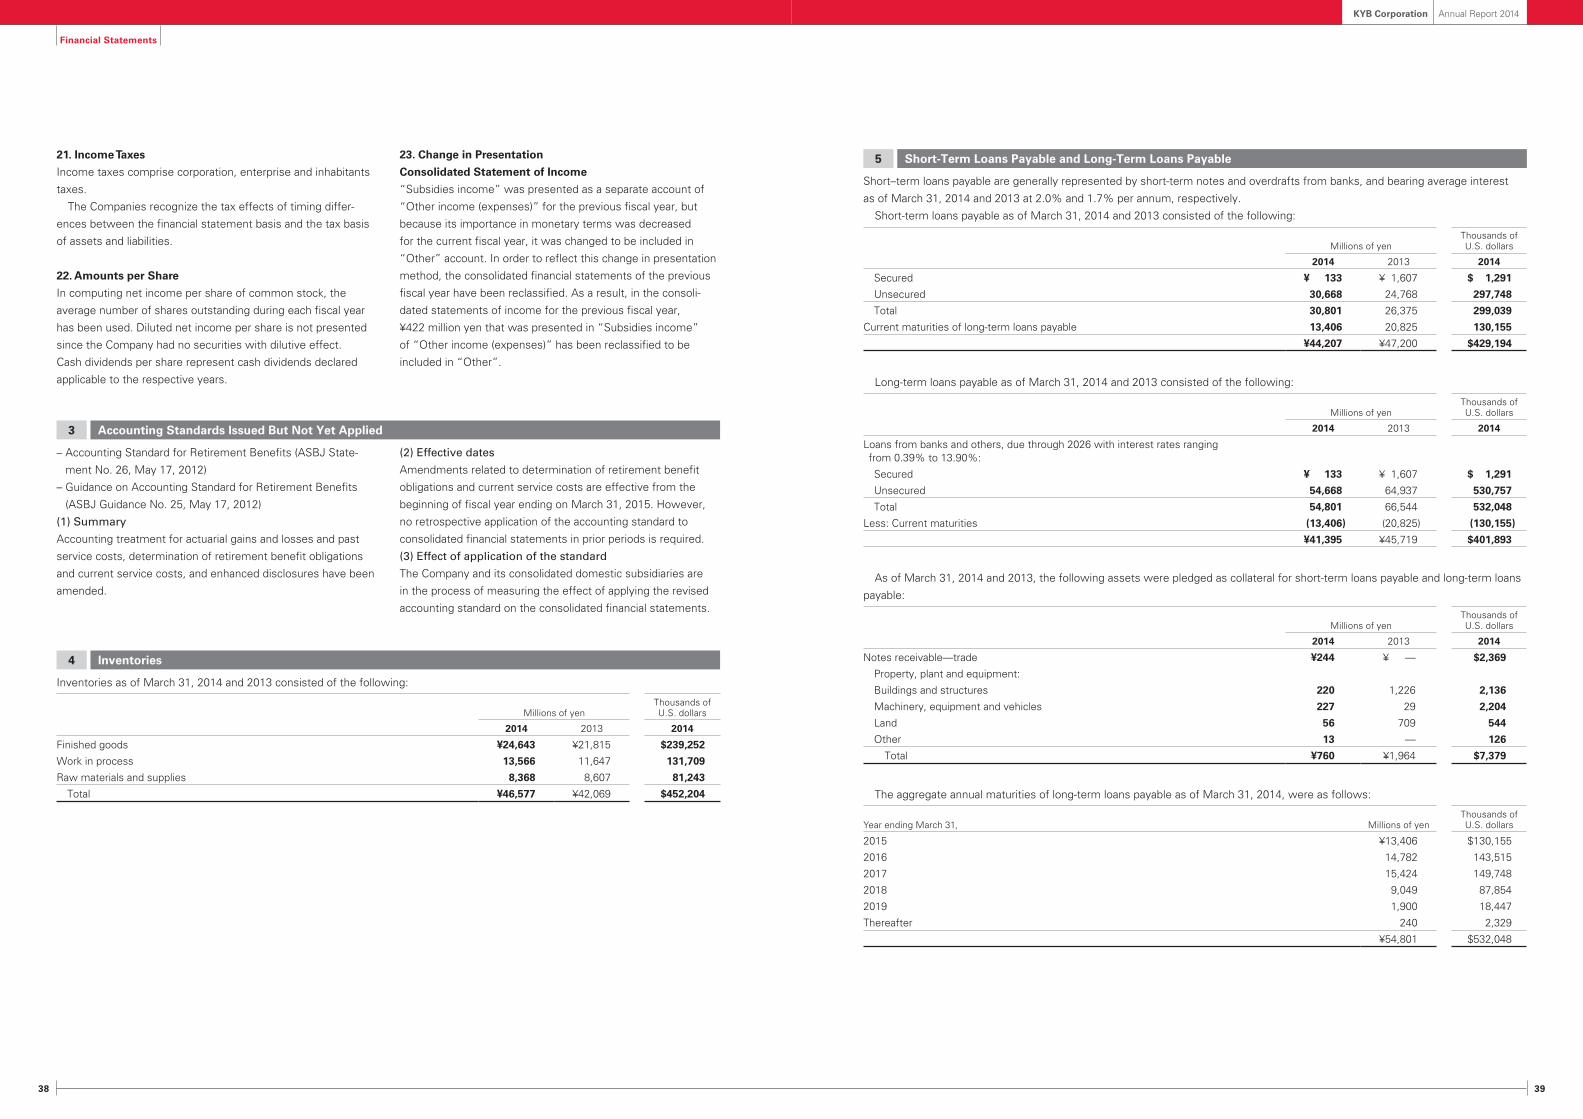
Inventories as of March 31, 2014 and 2013 consisted of the following:
Millions of yenThousands of U.S. dollars
2014 2013 2014
Finished goods ¥24,643 ¥21,815 $239,252
Work in process 13,566 11,647 131,709
Raw materials and supplies 8,368 8,607 81,243
Total ¥46,577 ¥42,069 $452,204
5 Short-Term Loans Payable and Long-Term Loans Payable
Short–term loans payable are generally represented by short-term notes and overdrafts from banks, and bearing average interest
as of March 31, 2014 and 2013 at 2.0% and 1.7% per annum, respectively.
Short-term loans payable as of March 31, 2014 and 2013 consisted of the following:
Millions of yenThousands of U.S. dollars
2014 2013 2014
Secured ¥ 133 ¥ 1,607 $ 1,291
Unsecured 30,668 24,768 297,748
Total 30,801 26,375 299,039
Current maturities of long-term loans payable 13,406 20,825 130,155
¥44,207 ¥47,200 $429,194
Long-term loans payable as of March 31, 2014 and 2013 consisted of the following:
Millions of yenThousands of U.S. dollars
2014 2013 2014
Loans from banks and others, due through 2026 with interest rates ranging from 0.39% to 13.90%:
Secured ¥ 133 ¥ 1,607 $ 1,291
Unsecured 54,668 64,937 530,757
Total 54,801 66,544 532,048
Less: Current maturities (13,406) (20,825) (130,155)
¥41,395 ¥45,719 $401,893
As of March 31, 2014 and 2013, the following assets were pledged as collateral for short-term loans payable and long-term loans
payable:
Millions of yenThousands of U.S. dollars
2014 2013 2014
Notes receivable—trade ¥244 ¥ — $2,369
Property, plant and equipment:
Buildings and structures 220 1,226 2,136
Machinery, equipment and vehicles 227 29 2,204
Land 56 709 544
Other 13 — 126
Total ¥760 ¥1,964 $7,379
The aggregate annual maturities of long-term loans payable as of March 31, 2014, were as follows:
Year ending March 31, Millions of yenThousands of U.S. dollars
2015 ¥13,406 $130,155
2016 14,782 143,515
2017 15,424 149,748
2018 9,049 87,854
2019 1,900 18,447
Thereafter 240 2,329
¥54,801 $532,048
21. Income Taxes
Income taxes comprise corporation, enterprise and inhabitants
taxes.
The Companies recognize the tax effects of timing differ-
ences between the financial statement basis and the tax basis
of assets and liabilities.
22. Amounts per Share
In computing net income per share of common stock, the
average number of shares outstanding during each fiscal year
has been used. Diluted net income per share is not presented
since the Company had no securities with dilutive effect.
Cash dividends per share represent cash dividends declared
applicable to the respective years.
23. Change in Presentation
Consolidated Statement of Income
“Subsidies income” was presented as a separate account of
“Other income (expenses)” for the previous fiscal year, but
because its importance in monetary terms was decreased
for the current fiscal year, it was changed to be included in
“ Other” account. In order to reflect this change in presentation
method, the consolidated financial statements of the previous
fiscal year have been reclassified. As a result, in the consoli-
dated statements of income for the previous fiscal year,
¥422 million yen that was presented in “Subsidies income”
of “Other income (expenses)” has been reclassified to be
included in “Other”.
3 Accounting Standards Issued But Not Yet Applied
– Accounting Standard for Retirement Benefits (ASBJ State-
ment No. 26, May 17, 2012)
– Guidance on Accounting Standard for Retirement Benefits
(ASBJ Guidance No. 25, May 17, 2012)
(1) Summary
Accounting treatment for actuarial gains and losses and past
service costs, determination of retirement benefit obligations
and current service costs, and enhanced disclosures have been
amended.
(2) Effective dates
Amendments related to determination of retirement benefit
obligations and current service costs are effective from the
beginning of fiscal year ending on March 31, 2015. However,
no retrospective application of the accounting standard to
consolidated financial statements in prior periods is required.
(3) Effect of application of the standard
The Company and its consolidated domestic subsidiaries are
in the process of measuring the effect of applying the revised
accounting standard on the consolidated financial statements.
40 41
KYB Corporation Annual Report 2014
Financial Statements
6 Notes to Statements of Comprehensive Income
Amounts reclassified to net income (loss) in the current period that were recognized in other comprehensive income in the current
or previous periods and tax effects for each component of other comprehensive income are as follows:
Millions of yenThousands of U.S. dollars
2014 2013 2014
Net unrealized holding gains on securities, net of taxes:
Amount arising during the year ¥1,895 ¥1,543 $18,398
Reclassification adjustments 0 0 0
Before tax effect 1,895 1,543 18,398
Tax effect (662) (529) (6,427)
Net unrealized holding gains on securities, net of taxes 1,233 1,014 11,971
(1) Cash and time deposits $ 383,544 $ 383,544 $ —
(2) Notes and accounts receivables—trade 839,262 839,262 —
(3) Investment securities 154,398 154,398 —
Assets 1,377,204 1,377,204 —
(4) Notes and accounts payables—trade 607,612 607,612 —
(5) Short-term loans payable 299,039 299,039 —
(6) Long-term loans payable (including current portion) 532,048 533,980 1,932
Liabilities $1,438,699 $1,440,631 $1,932
Notes: 1. Method of calculation of fair value of financial instruments and information concerning securities and derivative transactions Assets: (1) Cash and time deposits, and (2) Notes and accounts receivables—trade The fair value approximates the book value because of their short-term maturities. Therefore, the fair value is recognized using the book value. (3) Investment securities The fair value of these securities is based on their stock market price. Liabilities: (4) Notes and accounts payables—trade, and (5) Short-term loans The fair value approximates the book value because of their short-term maturities. Therefore, the fair value is recognized using the book value. (6) Long-term loans payable (including current portion) The fair value of long-term loans payable is based on the present value by discounting expected repayments of principal and interest in the remain-
ing period using an assumed interest rate on an equivalent new loan. The fair value of interest rate swaps for which the special treatment is applied is included in the fair value of long-term bank loans, as such swaps are treated as a single item incorporating the hedged long-term bank loans. The special treatment under Japanese GAAP may be applied for interest rate swap contracts that meet certain hedging criteria (see (7) below). In the special treatment, the net amount to be paid or received under the interest rate swap contract is added to or deducted from the interest on debts for which the swap contract is executed.
Derivatives: (7) Derivative transactions Interest rate swaps that use the special treatment are processed as a single unit with long-term loans payable that have been hedged.
Consequently, the fair values of these swaps are included in the fair values of the applicable long-term loans payable (see (6) above). 2. Financial instruments for which obtaining an estimated fair value is deemed to be extremely difficult
Millions of yenThousands of U.S. dollars
Category 2014 2013 2014
Unlisted equity securities ¥ 57 ¥ 95 $ 553
Securities in unconsolidated subsidiaries and affiliates 4,753 8,135 46,146
The above stocks are not included in “(3) Investment Securities” due to the extreme difficulty of determining a fair value because there are no market prices.
Financial Statements
3. The aggregate maturities subsequent to March 31, 2014 and 2013 for financial assets are as follows:
Millions of yen
2014 2013
Due within one year
Due after one year
and within five years
Due after five years
and within ten years
Due over ten years
Due within one year
Due after one year
and within five years
Due after five years
and within ten years
Due over ten years
Cash and time deposits ¥ 39,505 ¥— ¥— ¥— ¥ 33,531 ¥ — ¥ — ¥ —
Specified treatment for interest rate and currency swaps
Interest rate and currency swaps
Receive floating rate and U.S. dollar Long-term debt 25,505 20,136 (Note)
Pay fixed rate and Thai BahtNote: The interest rate swaps which qualify for hedge accounting and meet specific matching criteria are not stated at fair value, but the amount paid or
received under the swap agreements is recognized and included in interest expenses of the long-term loans payable as hedged items. Accordingly, the fair value of the interest rate swaps is considered to be included in the fair value of the long-term loans payable.
Retirement benefit obligation and pension plan assets as of March 31, 2014 and 2013 consisted of the following:
Defined benefit plans
Millions of yenThousands of U.S. dollars
2014 2014
Movement in retirement benefit obligations:
Balance at April 1, 2013 ¥34,592 $335,845
Service cost 1,873 18,184
Interest cost 523 5,078
Retirement benefit paid (2,179) (21,155)
Other 1,243 12,067
Balance at March 31, 2014 ¥36,052 $350,019
Movement in plan assets:
Balance at April 1, 2013 ¥22,331 $216,806
Expected return on plan assets 384 3,728
Actuarial gain 3,158 30,660
Contributions paid by the employer 997 9,680
Benefit expenses (672) (6,524)
Balance at March 31, 2014 ¥26,198 $254,350
Note: The amounts in this table include figures for pension plans that use simplified methods.
Millions of yen
2013
Projected benefit obligation ¥(34,592)
Plan assets at fair value 22,331
Projected benefit obligations in excess of plan assets (12,261)
Unrecognized actuarial difference 1,885
Prepaid pension expenses 28
Employees’ severance and retirement benefits ¥(10,404)
Notes: 1. Certain consolidated subsidiaries’ retirement benefit obligations were estimated using a simplified method. In addition, pension plan assets at consoli-dated subsidiaries that use a comprehensive employees’ pension fund, which were ¥3,100 million at the year ended March 31, 2013, are not included in the above plan assets.
2. In the year ended March 31, 2013, prepaid pension expenses were recorded.
16 Retirement Benefits for Employees
The Company and its domestic consolidated subsidiaries have
three types of defined benefits plans: Employees’ Pension
Fund, defined benefit corporate pension plan, and lump-sum
payment plan. In addition, additional retirement payments
are made in some cases when employees retire or resign.
The Company has established a retirement benefit payment
trust.
At the year ended March 31, 2014, for the Company and its
consolidated companies in Japan, six companies had lump-sum
payment plans. In addition, for the Employees’ Pension Fund,
a company belonged to a comprehensive employees’ pension
fund and, for the defined benefit corporate pension plan, six
companies outsourced asset management to a life insurance
company, etc.
Some domestic consolidated subsidiaries and other countries
have established a defined contribution pension system in
addition to a defined benefit pension system.
48 49
KYB Corporation Annual Report 2014
Financial Statements
Reconciliation from retirement benefit obligations and plan assets to liability for retirement benefits
Impairment loss on fixed assets 107 3,349 3,456 — 3,456 — 3,456
Increase in property, plant and equipment and intangible assets 178,553 92,165 270,718 20,030 290,748 (379) 290,369
Amortization of goodwill and negative goodwill 0 — 0 1,505 1,505 — 1,505
Notes: 1. “Other” includes “special-purpose vehicles” and “System Products and Electronic Equipment” that are not included in the two reportable segments. 2. All amounts of adjustment of segment profits are the elimination of intersegment transactions. 3. All amounts of adjustment of segment assets are the elimination of intersegment transactions. 4. Segment profits have been reconciled with operating income in the consolidated statement of income. 5. The increase in property, plant and equipment and intangible assets includes long-term prepaid expenses.
3. Related Information
(a) Information about products and services
The information about products and services for the years ended March 31, 2014 and 2013 was omitted since same information is
disclose in “1. Segment information”.
(b) Information about geographic region
The information about geographic region as of and for the years ended March 31, 2014 and 2013 was as follows:
Millions of yen
2014
Japan Europe U.S.A. ChinaSouth East
Asia Other areas Total
Net sales ¥169,249 ¥60,711 ¥37,802 ¥25,676 ¥24,966 ¥34,307 ¥352,711
Notes: 1. Net sales are based on the locations of customers and categorized by countries and areas. 2. Property, plant and equipment are based on the locations and categorized by countries and areas. 3. Regions are based on geographic proximity.
(c) Information about major customers
The information about major customers for the years ended March 31, 2014 and 2013 was not disclosed since net sale to any
customer was less than 10% of the amount of net sales in consolidated statement of income.
54 55
KYB Corporation Annual Report 2014
Financial Statements
(d) Information about impairment loss on fixed Assets by reportable segments
The information about impairment loss on fixed assets by reportable segment for the years ended March 31, 2014 and 2013 was
omitted since same information is disclosed in the reportable segments.
3. Amortization of Goodwill and Unamortized Balance of Goodwill by Reportable Segments
Amortization of goodwill and unamortized balance of goodwill by reportable segments for the years ended March 31, 2014 and
2013 were as follows:
Millions of yen
2014
Reportable segment
Automotive Components
Hydraulic Components Subtotal Other Total
Goodwill
Amortization ¥1 ¥— ¥1 ¥155 ¥156
Unamortized balance 3 — 3 620 623
Negative goodwill
Amortization ¥1 ¥— ¥1 ¥ — ¥ 1
Unamortized balance — — — — —
Millions of yen
2013
Reportable segment
Automotive Components
Hydraulic Components Subtotal Other Total
Goodwill
Amortization ¥1 ¥— ¥1 ¥— ¥1
Unamortized balance 4 — 4 — 4
Negative goodwill
Amortization ¥2 ¥— ¥2 ¥— ¥2
Unamortized balance 1 — 1 — 1
Thousands of U.S. dollars
2014
Reportable segment
Automotive Components
Hydraulic Components Subtotal Other Total
Goodwill
Amortization $10 $— $10 $1,505 $1,515
Unamortized balance 29 — 29 6,020 6,049
Negative goodwill
Amortization $10 $— $10 $ — $ 10
Unamortized balance — — — — —
21 Subsequent Event
On June 25, 2014, the shareholders of the Company authorized the following appropriation of retained earnings as of March 31,
2014:
Millions of yenThousands of U.S. dollars
2014 2014
Cash dividends, ¥5.0 (US$0.05) per share ¥1,278 $12,408