51
KZN PSEDS PROFILING DISTRICT ECONOMIC DRIVERS UMKHANYAKUDE DISTRICT MUNICIPALITY A SPATIAL ECONOMIC OVERVIEW MARCH 2012

KZN PSEDS
PROFILING DISTRICT ECONOMIC DRIVERS
UMKHANYAKUDE DISTRICT MUNICIPALITY
A SPATIAL ECONOMIC OVERVIEW
MARCH 2012

KZN DEPARTMENT OF ECONOMIC DEVELOPMENT &
TOURISM
PROFILING DISTRICT ECONOMIC DRIVERS
PHASE 5 – SPATIAL ECONOMIC OVERVIEW
UMKHANYAKUDE DISTRICT MUNICIPALITY
MARCH 2012
PREPARED FOR:
COSMAS HAMADZIRIPI
KZN Department of Economic Development
and Tourism
Private Bag X9152
Pietermaritzburg
3200
Tel: 033 – 264 2781
Email: [email protected]
PREPARED BY:
ROGER DAVIS, KEVAN ZUNCKEL
AND TINDALL KRUGER
Isikhungusethu (Pty) Ltd
3 Poole Avenue
Pietermaritzburg
3200
Tel: 033 – 342 5741
e-mail: [email protected]
PSEDS: PROFILING DISTRICT ECONOMIC DRIVERS UMKHANYAKUDE DISTRICT MUNICIPALITY
ISIKHUNGUSETHU
MARCH 2012
i
TABLE OF CONTENTS
1. BACKGROUND AND APPROACH ...................................................................................................... 1
1.1. OBJECTIVES FOR REPORT ................................................................................................................... 1
1.2. APPROACHES TO COMPILING THE REPORT ....................................................................................... 1
2. DISTRICT ECONOMIC OVERVIEW ..................................................................................................... 2
2.1. INTRODUCTION ................................................................................................................................. 2
2.2. SPATIAL ECONOMIC FEATURES ......................................................................................................... 2
2.3. DISTRICT ECONOMIC CONTRIBUTION ............................................................................................... 4
2.4. DISTRICT ECONOMIC STRUCTURE ..................................................................................................... 5
3. A MAJOR COMPANY OVERVIEW ...................................................................................................... 6
3.1. INTRODUCTION ................................................................................................................................. 6
3.2. SECTORS AND PRODUCTS – A GENERAL PERSPECTIVE ..................................................................... 6
3.3. COMPANIES INTERVIEWED ............................................................................................................... 8
3.4. SECTORS AND PRODUCTS – A SURVEYED COMPANY PERSPECTIVE ............................................... 10
3.5. SPATIAL DISTRIBUTION OF SURVEYED COMPANIES ........................................................................ 11
3.6. KEY CHARACTERISTICS OF INTERVIEWED COMPANIES ................................................................... 15
3.7. MAJOR COMPANIES SURVEYED ...................................................................................................... 15
3.8. UMKHANYAKUDE COMPANIES EXPORTING .................................................................................... 16
3.9. INFRASTRUCTURE CHALLENGES ...................................................................................................... 16
3.10. OTHER CHALLENGES .................................................................................................................... 18
3.11. INTERVIEWEE COMMENTS .......................................................................................................... 19
3.12. A PERSPECTIVE OF ECONOMIC DRIVERS BASED ON COMPANY SURVEY .................................... 19
4. A MUNICIPAL CAPITAL INVESTMENT PERSPECTIVE ........................................................................ 21
4.1. INTRODUCTION ............................................................................................................................... 21
4.2. CAPITAL INVESTMENT IN THE DISTRICT .......................................................................................... 21
4.3. MUNICIPALITY IDENTIFIED CHALLENGES ........................................................................................ 23
4.4. ADDRESSING THE CHALLENGES ....................................................................................................... 24
4.5. A PUBLIC SECTOR INVESTMENT PERSPECTIVE ................................................................................ 24
5. A NATURAL RESOURCES OVERVIEW .............................................................................................. 25
5.1. INTRODUCTION ............................................................................................................................... 25
5.2. CONDITION OF NATURAL CAPITAL AND THE QUALITY OF ECOSYSTEM SERVICES .......................... 25
5.3. ECOSYSTEM RESOURCE LINKAGES .................................................................................................. 30
5.4. THE RESILIENCE OR VULNERABILITY OF ECONOMIC DRIVERS AND THE OPPORTUNITIES AND
CONSTRAINTS TO GROWTH ........................................................................................................................ 31
6. FINDINGS AND RECOMMENDATIONS ............................................................................................ 32
6.1. CORE FINDINGS ............................................................................................................................... 32
6.2. KEY SPATIAL ECONOMIC FEATURES ................................................................................................ 32
6.3. A CHANGING SPATIAL ECONOMIC DEVELOPMENT STRUCTURE .................................................... 33
6.4. RECOMMENDATIONS ON GOVERNMENT INTERVENTIONS ............................................................ 33
PSEDS: PROFILING DISTRICT ECONOMIC DRIVERS UMKHANYAKUDE DISTRICT MUNICIPALITY
ISIKHUNGUSETHU
MARCH 2012
ii
ANNEXURES:
ANNEXURE A: UMKHANYAKUDE DISTRICT - COMPANY DISTRIBUTION BY SECTOR IN LOCAL MUNICIPALITIES
ANNEXURE B: ECONOMIC DRIVERS AND THE ENVIRONMENTAL OPPORTUNITIES AND CONSTRAINTS TO
GROWTH
LIST OF TABLES
TABLE 3.1: COMPANIES INTERVIEWED .............................................................................................................................. 9
TABLE 3.2: STRUCTURE OF SAMPLE PER SECTOR AND SUB-SECTOR ............................................................................... 10
TABLE 3.3: MAJOR COMPANIES SURVEYED BASED ON NUMBER OF PEOPLE EMPLOYED .............................................. 15
TABLE 3.4: UMKHANYAKUDE EXPORTS ........................................................................................................................... 16
TABLE 3.5: UTILITY CHALLENGES ..................................................................................................................................... 17
TABLE 3.6: TRANSPORT CHALLENGES .............................................................................................................................. 17
TABLE 4.1: HISTORIC, CURRENT AND FUTURE CAPITAL INVESTMENTS IN DISTRICT ECONOMIC DEVELOPMENT .......... 22
TABLE 5.1: THE REAL VALUE OF NATURAL CAPITAL PER SPECIFIC HABITAT TYPES IN THE UMKHANYAKUDE DISTRICT.. 26
TABLE 5.2: THE PROPORTIONAL SPREAD OF ECOSERVICE SCORE CATEGORIES ACROSS UMKHANYAKUDE IN HECTARES
AND PERCENTAGES ........................................................................................................................................................... 26
TABLE 5.3: THE PROPORTIONATE SPREAD OF BROAD LAND COVER TYPES THROUGH THE UMKHANYAKUDE DISTRICT
EXPRESSED AS A PERCENTAGE OF TOTAL AREA ............................................................................................................... 26
TABLE 5.4: WATER BALANCE FIGURES FOR THE PHONGOLA, MKUZE AND IMFOLOZI RIVER SYSTEMS .......................... 29
LIST OF DIAGRAMS
DIAGRAM 2.1: 2010 GROSS VALUE ADDED ....................................................................................................................... 4
DIAGRAM 2.2: 2010 GROSS VALUE ADDED TOTAL GVA OF R6 452 M .............................................................................. 5
DIAGRAM 3.1: KEY CHARACTERISTICS OF INTERVIEWED COMPANIES............................................................................ 15
DIAGRAM 3.2: OTHER CHALLENGES ................................................................................................................................ 18
DIAGRAM 6.1: UMKHANYAKUDE ECONOMIC DRIVERS ................................................................................................... 36
LIST OF MAPS
MAP 2.1: SPATIAL ECONOMIC FEATURES .......................................................................................................................... 3
MAP 3.1: SPATIAL DISTRIBUTION OF SURVEYED COMPANIES BY ECONOMIC SECTORS ................................................. 11
MAP 3.2: SPATIAL DISTRIBUTION OF SURVEYED COMPANIES BY NUMBER OF PEOPLE EMPLOYED .............................. 12
MAP 3.3: SPATIAL DISTRIBUTION OF SURVEYED COMPANIES BY TURNOVER PER YEAR ................................................ 13
MAP 3.4: SPATIAL DISTRIBUTION OF SURVEYED COMPANIES BY AGE OF COMPANY (YEAR) ......................................... 14
MAP 5.1: UMKHANYAKUDE DISTRICT LAND COVER ........................................................................................................ 27
MAP 5.2: UMKHANYAKUDE DISTRICT POTENTIAL TO DELIVER ECOSYSTEM GOODS AND SERVICES.............................. 27
MAP 5.3: A MAP ILLUSTRATING THE PHONGOLA, MKUZE AND IMFOLOZI CATCHMENTS THAT DRAIN THE ZULULAND
DISTRICT (PINK) AND FLOW INTO AND THROUGH THE UMKHANYAKUDE DISTRICT (BRIGHT GREEN) ............................ 28
MAP 5.4: AN EXTRACT FROM THE NATIONAL MAP ILLUSTRATING THE SPREAD OF ALIEN INVASIVE PLANTS,
TRANSFORMED LAND COVER, AND AREAS WHERE JOBS HAVE BEEN CREATED .............................................................. 30
PSEDS: PROFILING DISTRICT ECONOMIC DRIVERS UMKHANYAKUDE DISTRICT MUNICIPALITY
ISIKHUNGUSETHU
MARCH 2012
1
1. BACKGROUND AND APPROACH
1.1. OBJECTIVES FOR REPORT
The overall vision for this project is to provide reliable data at district municipal level to inform and update
the provincial PSEDS as the basis for planning future economic development and growth in the province.
The linkage between economic development, spatial development frameworks and natural resource
availability is fundamental to future sustainable development.
The overarching objective of this project, as contained in the terms of reference for this brief, is “...to
extensively profile the economic drivers and resource endowments (natural capital) of the ten KwaZulu-
Natal Districts plus the eThekwini Metro”. As noted above this will be undertaken with the view to
updating the PSEDS and informing planning and decision making in government.
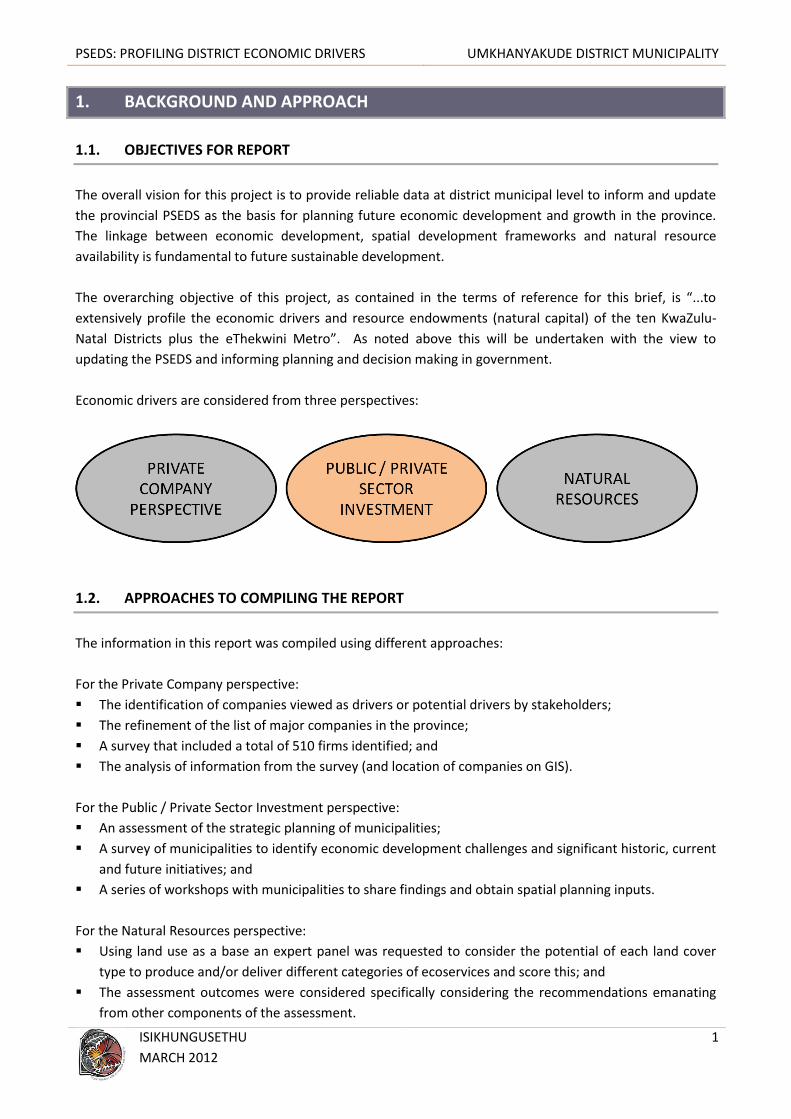
Economic drivers are considered from three perspectives:
1.2. APPROACHES TO COMPILING THE REPORT
The information in this report was compiled using different approaches:
For the Private Company perspective:
The identification of companies viewed as drivers or potential drivers by stakeholders;
The refinement of the list of major companies in the province;
A survey that included a total of 510 firms identified; and
The analysis of information from the survey (and location of companies on GIS).
For the Public / Private Sector Investment perspective:
An assessment of the strategic planning of municipalities;
A survey of municipalities to identify economic development challenges and significant historic, current
and future initiatives; and
A series of workshops with municipalities to share findings and obtain spatial planning inputs.
For the Natural Resources perspective:
Using land use as a base an expert panel was requested to consider the potential of each land cover
type to produce and/or deliver different categories of ecoservices and score this; and
The assessment outcomes were considered specifically considering the recommendations emanating
from other components of the assessment.

PSEDS: PROFILING DISTRICT ECONOMIC DRIVERS UMKHANYAKUDE DISTRICT MUNICIPALITY
ISIKHUNGUSETHU
MARCH 2012
2
2. DISTRICT ECONOMIC OVERVIEW
2.1. INTRODUCTION
An initial overview of the district economy is provided in this section of the report. The aim is to provide a
contrast within which the sample survey of companies was undertaken. The District economy is considered
in terms of the following:
Spatial Economic Features
District Economic Contribution
District Economic Structure
2.2. SPATIAL ECONOMIC FEATURES
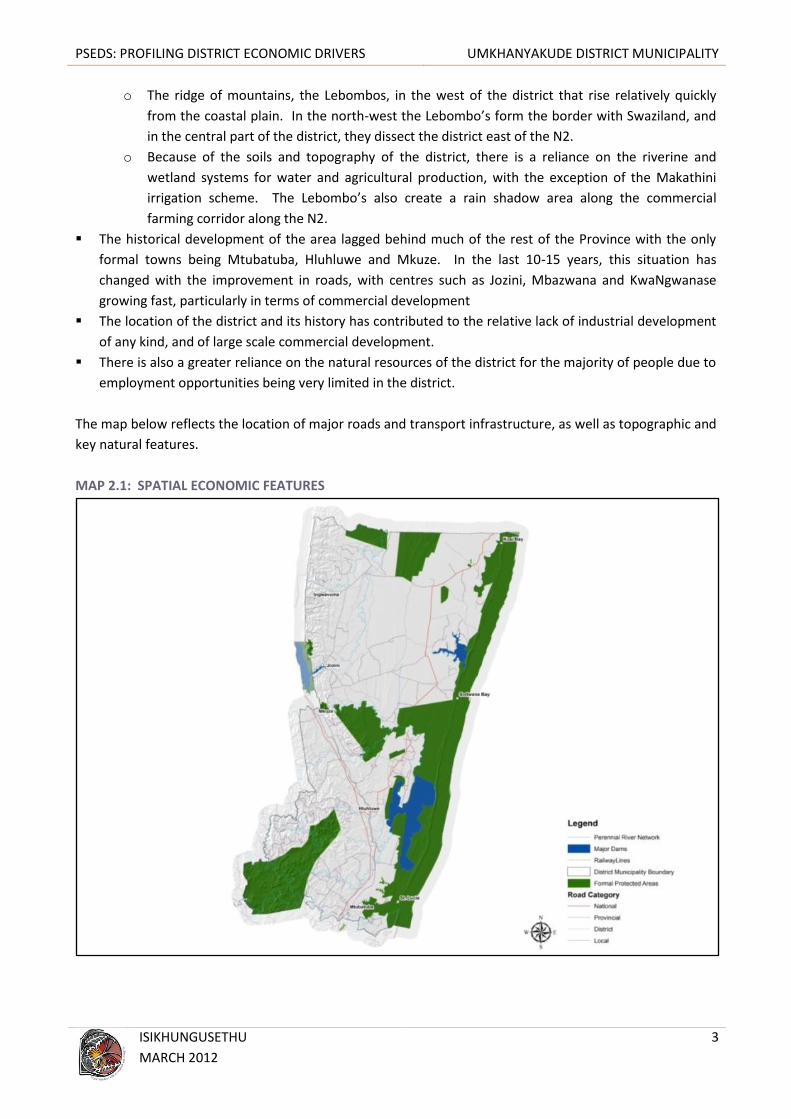
Key spatial features of the Umkhanyakude District impacting on economic development include:
The district shares international borders with two countries: Mozambique in the north and Swaziland
along its north-western boundary.
The N2 corridor from Mtubatuba in the south towards Mkuze and on to Pongola and Swaziland in the
north is the major route in the region
The Lubombo SDI corridor (MR439) was upgraded in the late 1990s to a tar road – extending from
Hluhluwe through to Mbazwana to join the only other tar road in the region at Pelindaba, before
heading north east through KwaNgwanase (Manguzi) to the Mozambique border at Farazel. This
corridor has opened up an area which was previously only accessible on unsurfaced dirt roads.
The road from the N2, up the pass over the Lebombo Mountains through Jozini and north to the T-
junction (Bambanana) of the road from Ingwavuma to KwaNgwanase.
The rail link running parallel to the N2 which comes from Durban, through the region to Swaziland.
The dominant land tenure of the district is communal tenure under Ingonyama Trust lands. The only
privately owned commercial farms lie in a narrow strip along the N2 from Mtubatuba to Mkuze.
The district covers 12 848 km2 of which over 21% is under proclaimed conservation area – mostly
under the auspices of Isimangaliso Wetlands Park, a World Heritage Site, with smaller reserves falling
under the jurisdiction of Ezemvelo KZN Wildlife.
The physical characteristics of the district play a major role in the location of economic activity. These
characteristics include:
o The vast coastal plain which is part of the Mozambique coastal plain, comprising largely sandy
soils – part of which is known as the Makathini Flats.
o The unique hydrology of the area with large coastal lake systems (St Lucia, Sibaya, Kosi),
wetland systems (Muzi swamps, Mkuze riverine wetland swamp system, Pongola River
floodplain pans and wetlands system as well as the wetland/riverine system feeding the Kosi
Lakes).
o The Pongola River which has been dammed at Jozini to form the vast Pongolapoort / Jozini dam
which feeds a system of canals which form the Makathini Irrigation Scheme
PSEDS: PROFILING DISTRICT ECONOMIC DRIVERS UMKHANYAKUDE DISTRICT MUNICIPALITY
ISIKHUNGUSETHU
MARCH 2012
3
o The ridge of mountains, the Lebombos, in the west of the district that rise relatively quickly
from the coastal plain. In the north-west the Lebombo’s form the border with Swaziland, and
in the central part of the district, they dissect the district east of the N2.
o Because of the soils and topography of the district, there is a reliance on the riverine and
wetland systems for water and agricultural production, with the exception of the Makathini
irrigation scheme. The Lebombo’s also create a rain shadow area along the commercial
farming corridor along the N2.
The historical development of the area lagged behind much of the rest of the Province with the only
formal towns being Mtubatuba, Hluhluwe and Mkuze. In the last 10-15 years, this situation has
changed with the improvement in roads, with centres such as Jozini, Mbazwana and KwaNgwanase
growing fast, particularly in terms of commercial development
The location of the district and its history has contributed to the relative lack of industrial development
of any kind, and of large scale commercial development.
There is also a greater reliance on the natural resources of the district for the majority of people due to
employment opportunities being very limited in the district.
The map below reflects the location of major roads and transport infrastructure, as well as topographic and
key natural features.
MAP 2.1: SPATIAL ECONOMIC FEATURES

PSEDS: PROFILING DISTRICT ECONOMIC DRIVERS UMKHANYAKUDE DISTRICT MUNICIPALITY
ISIKHUNGUSETHU
MARCH 2012
4
2.3. DISTRICT ECONOMIC CONTRIBUTION
In overall terms the Umkhanyakude District makes a limited contribution to the economy of KwaZulu-
Natal, i.e. R6,452 billion of a total of R267 billion or 2.4% of the provincial economy.
Based on the 2010 GVA figures there is no sector in the provincial economy in terms of which
Umkhanyakude can be viewed as a provincial driver.
The comparative figures suggest that government services and the wholesale and retail trade, catering
and accommodation are the dominant contributors to the economy. This is reflected in the GVA
figures and in the number of firms involved, for instance in the tourism/accommodation business.
Manufacturing is the third highest contributor; this is primarily through the contribution of the sugar
mill at Mtubatuba, rather than any robust manufacturing sector in the district.
While agriculture is a critical sector in terms of food security, the commercial component to agriculture
in the district is very small.
DIAGRAM 2.1: 2010 GROSS VALUE ADDED
Source: Quantec 2010

PSEDS: PROFILING DISTRICT ECONOMIC DRIVERS UMKHANYAKUDE DISTRICT MUNICIPALITY
ISIKHUNGUSETHU
MARCH 2012
5
2.4. DISTRICT ECONOMIC STRUCTURE
The diagram reflects the economic structure of the Umkhanyakude District based on 2010 GVA figures.
As reflected in the previous section the dominance of the government and wholesale and retail trade is
evident.
Once again, although manufacturing is also shown to contribute substantially to the GVA, it is stressed
that this is from relatively small number of firms.
It is important to note that of the two sectors generally viewed as the “drivers” of the economy, viz.
tourism (included in wholesale and retail) and agriculture, the latter makes a significantly lower
contribution to the economy when compared to the contributions of tourism / accommodation which
is an important part of the wholesale/retail trade sector in the district.
DIAGRAM 2.2: 2010 GROSS VALUE ADDED TOTAL GVA OF R6 452 M
Source: Quantec 2010
It should be noted that the GVA data (above) does not necessarily have a bearing on companies in the
sample which were identified as drivers. The criteria used to identify drivers was different to the method
used to formulate the GVA. This must be born in mind when analysing key sectors and companies that drive
the economy. For example, agriculture, and tourism companies dominate the “top companies” of the
sample whilst manufacturing and services dominate the GVA sectors.
PSEDS: PROFILING DISTRICT ECONOMIC DRIVERS UMKHANYAKUDE DISTRICT MUNICIPALITY
ISIKHUNGUSETHU
MARCH 2012
6
3. A MAJOR COMPANY OVERVIEW
3.1. INTRODUCTION
The basis of the major company interviews was a comprehensive questionnaire that extracted a range of
information from companies deemed to be drivers, or companies belonging to sectors driving the
economy. It must be noted that a number of companies perceived to be potential drivers chose not to
participate in the survey. This District report reflects on the following information relating to major
companies in order to provide a basis for future spatial economic development planning in the District:
Companies Interviewed
Sectors and Products
Spatial Distribution of Companies
Key Characteristics of Companies
Major Companies
Companies Exporting
Infrastructure and Other Challenges
Interviewee Comments
Synthesis
Based on the above information a “major company perspective” of economic drivers is provided.
3.2. SECTORS AND PRODUCTS – A GENERAL PERSPECTIVE
3.2.1. MANUFACTURING SECTOR
The manufacturing sector contributes 17% to the economy of the district. However, this level of
contribution comes from a relatively small number of firms, dominated by the Umfolozi sugar mill at
Mtubatuba. Apart from agricultural processing, there is very little in the way of manufacturing in the
district
3.2.2. AGRICULTURAL SECTOR
Agriculture is a critical component of the economy in terms of land use and food security, but
contributes relatively little (only 9%) to the district economy. One of the reasons for this relatively low
% is that the food security component of subsistence does not form part of the GVA determination
process.
The measurable commercial contribution largely comes from the narrow corridor of commercial
farmland (sugar cane, timber in the south, and game farms) that runs along the N2
It has the potential to contribute significantly more, given the presence of the Jozini Dam and the
Makathini Irrigation Scheme. For various reasons, however, this irrigation scheme has been fraught
with problems and has not lived up to expectations despite numerous plans and projects such as the
very short lived operation of the cotton gin on the Flats. This is being addressed through the Makathini
PSEDS: PROFILING DISTRICT ECONOMIC DRIVERS UMKHANYAKUDE DISTRICT MUNICIPALITY
ISIKHUNGUSETHU
MARCH 2012
7
Integrated Development Plan which was initiated through the MEC oversight committee for the
Lebombo SDI and the Economic Cabinet Cluster.
The irrigable area of the Makathini scheme is around 10 – 13 000 ha. However, the total area of what
is generally known as the Makathini (in both Jozini and uMhlabuyalingana local municipalities) totals
over 450 000 ha, which a recent study has shown to include just over 407 000 ha of grazing area and a
possible area of about 33 000 ha which could produce rainfed crops (IDP Review, 2011-12, p.55)
Subsistence / food-security agriculture is practiced throughout the region, but is concentrated most
along the Pongola floodplain and in and around the coastal lake wetland systems. While this used to be
a sustainable agricultural regime, the population pressure is now causing serious environmental
problems to the Pongola floodplains and to the wetlands which, around Manguzi for example, have
resulted in the drying up of some of the riverine systems feeding the lake. The clearing of swamp forest
vegetation to make way for agriculture sets up a chain reaction in terms of environment with
biodiversity decreasing and degradation increasing.
3.2.3. TOURISM SECTOR
This forms part of the wholesale and retail trade sector which is second only to the government sector
in terms of economic contribution to the district (19%)
Given the large area under conservation management because of the uniqueness of the natural
environment, this sector is likely to remain as a major player in the district economy, despite recent
setbacks with the global recession and the decline in foreign visitors.
3.2.4. COMMERCIAL SECTOR
Note: The commercial sector in this context is used as a generic term for most businesses included the
following sectors (as defined by the Standard Industrial Classification): (1) financial intermediation,
insurance, real estate, and business services, (2) wholesale and retail trade (excl. Hotels and restaurants),
(3) community, social and personal services.
The commercial sector, underdeveloped for a long time, has grown fast over the past ten to fifteen
years, with centres such as Jozini, Mbazwana, Manguzi and Mkuze more than tripling the number of
businesses in all three towns.
This is largely due to the establishment, by large scale developers, of shopping centre precincts with
anchor tenants which has brought in, for the first time, national chain stores into these rural towns.
While this has had positive downstream effects in that they bring more people into the towns due to
the range of goods and services at relatively more competitive prices, it has also had a negative effect
on the small, independent shop owners who cannot compete with the prices of the larger chain stores.
To a certain extent, such development has created a ‘sameness’ in character throughout the small
towns in the district, whereas before, there were distinct differences between these nodes.

PSEDS: PROFILING DISTRICT ECONOMIC DRIVERS UMKHANYAKUDE DISTRICT MUNICIPALITY
ISIKHUNGUSETHU
MARCH 2012
8
3.2.5. GOVERNMENT SECTOR
The government sector is the largest contributor to the district economy – just over 19%
This has a negative and a positive side to it: it is never healthy to have an economy that is dominated
by government service income rather than primary producing sectors such as agriculture and
manufacturing. However, the positive aspect is that with the stated policy to bring government closer
to the people, the number and range of government services (offices and personnel) in not just the
main towns, but also in some of the smaller rural nodes, has brought income into the region that was
not there before. This has contributed to the growth of the commercial sector across the district.
However, the government sector does not offer opportunity for growth; in addition, while it has clearly
contributed to the growth in commercial activity, many of the civil servants live elsewhere and go to
their homes outside of the district on weekends. There is still not the kind of support services and
infrastructure, particularly such things as schools and social facilities, to keep professional people in the
area as permanent residents.
3.3. COMPANIES INTERVIEWED
A total of 17 companies were interviewed in the Umkhanyakude District in order to obtain a better
understanding of the types of major firms, their characteristics and challenges faced by them. The list
below reflects the name of the company interviewed, the annual turnover, employment, product/service
delivered and the sector to which it relates (in terms of the Standard Industrial Classification [SIC]). This list
should serve as a basis for the District to develop and maintain a major company database. The following
categorisations were used:
Company Turnover categorised in terms of: Small (less than R5m), Medium (R5m to R100m) and Large
(R100m+);
Company Employment categorised in terms of: Small (less than 20 people), Medium (21 to 100 people)
and Large (100+ people).

PSEDS: PROFILING DISTRICT ECONOMIC DRIVERS UMKHANYAKUDE DISTRICT MUNICIPALITY
ISIKHUNGUSETHU
MARCH 2012
9
TABLE 3.1: COMPANIES INTERVIEWED (SEE ANNEXURE A FOR DETAIL ON DISTRIBUTION OF SAMPLE IN LOCAL MUNICIPALITIES)
COMPANY NAME 2010 ANNUAL T/O
(REVENUE OR SALES) EMPLOYEES RANGE PRODUCT CATEGORY
Agriculture, hunting, forestry and fishing
Umfolozi Sugar Planters Ltd Not provided Large Sugar and Related
Senekal Boerdery Large Large Agricultural Commodities
Mjindi Farms Small Medium Farming Services
Community, social and personal services
Mkuze Game Reserve Not provided Medium Tourism Accommodation +
Thanda Private Lodge Not provided Not confirmed Tourism Accommodation +
Zululand Rhino Reserve Small Large Wildlife Tourism
Financial intermediation, insurance, real estate and business services
First National Bank Hluhluwe Medium Medium Financial Services
Manufacturing
Umfolozi Sugar Mill Large Large Sugar and Related
Wholesale and retail trade; repair of motor vehicles, motor cycles and personal and household goods; hotels and restaurants
Jock Morrison & Sons Medium Medium Retail
Spar Kwangwanase Medium Medium Retail
Jozini Tiger Lodge Medium Medium Tourism Accommodation +
Maputaland Lodge Small Small Tourism Accommodation +
Ghost Mountain Inn Small Medium Tourism Accommodation +
Kosi Bay Lodge Small Medium Tourism Accommodation +
Lala Lapa Lodge Not provided Small Tourism Accommodation +
Mbazwana Inn Not provided Small Tourism Accommodation +
Shemula Lodge Not provided Small Tourism Accommodation +
PSEDS: PROFILING DISTRICT ECONOMIC DRIVERS UMKHANYAKUDE DISTRICT MUNICIPALITY
ISIKHUNGUSETHU
MARCH 2012
10
3.4. SECTORS AND PRODUCTS – A SURVEYED COMPANY PERSPECTIVE
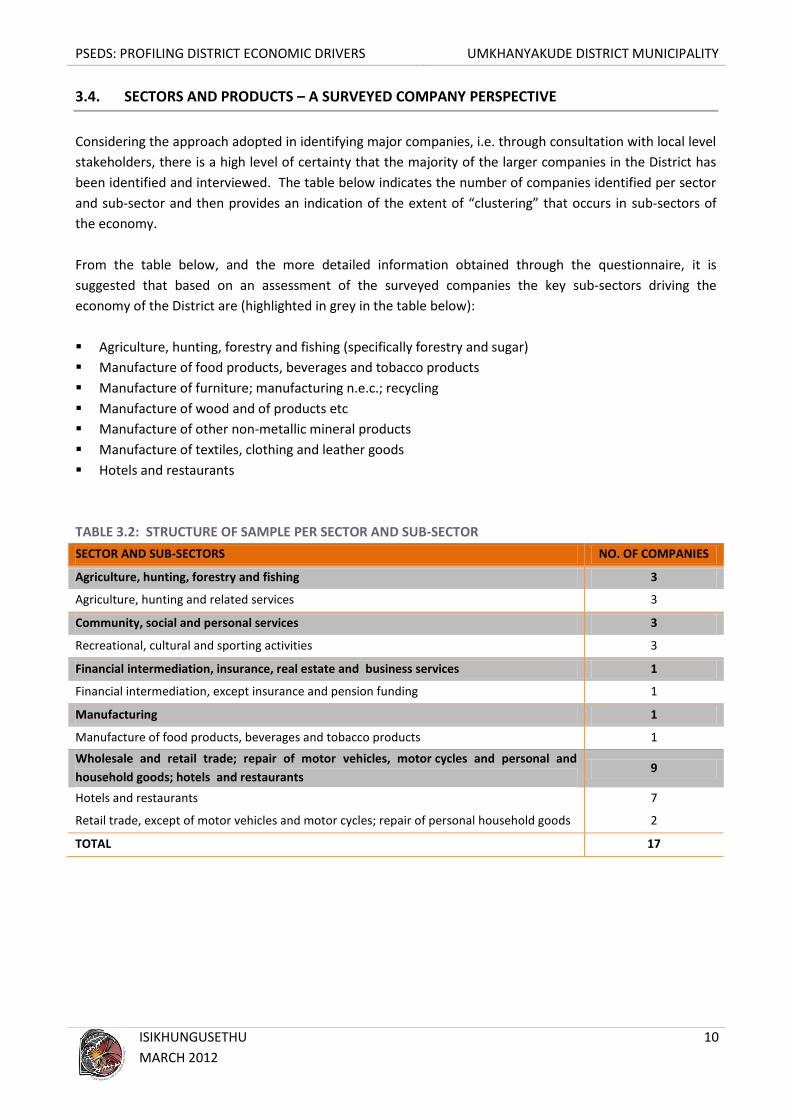
Considering the approach adopted in identifying major companies, i.e. through consultation with local level
stakeholders, there is a high level of certainty that the majority of the larger companies in the District has
been identified and interviewed. The table below indicates the number of companies identified per sector
and sub-sector and then provides an indication of the extent of “clustering” that occurs in sub-sectors of
the economy.
From the table below, and the more detailed information obtained through the questionnaire, it is
suggested that based on an assessment of the surveyed companies the key sub-sectors driving the
economy of the District are (highlighted in grey in the table below):
Agriculture, hunting, forestry and fishing (specifically forestry and sugar)
Manufacture of food products, beverages and tobacco products
Manufacture of furniture; manufacturing n.e.c.; recycling
Manufacture of wood and of products etc
Manufacture of other non-metallic mineral products
Manufacture of textiles, clothing and leather goods
Hotels and restaurants
TABLE 3.2: STRUCTURE OF SAMPLE PER SECTOR AND SUB-SECTOR
SECTOR AND SUB-SECTORS NO. OF COMPANIES
Agriculture, hunting, forestry and fishing 3
Agriculture, hunting and related services 3
Community, social and personal services 3
Recreational, cultural and sporting activities 3
Financial intermediation, insurance, real estate and business services 1
Financial intermediation, except insurance and pension funding 1
Manufacturing 1
Manufacture of food products, beverages and tobacco products 1
Wholesale and retail trade; repair of motor vehicles, motor cycles and personal and
household goods; hotels and restaurants 9
Hotels and restaurants 7
Retail trade, except of motor vehicles and motor cycles; repair of personal household goods 2
TOTAL 17

PSEDS: PROFILING DISTRICT ECONOMIC DRIVERS UMKHANYAKUDE DISTRICT MUNICIPALITY
ISIKHUNGUSETHU
MARCH 2012
11
3.5. SPATIAL DISTRIBUTION OF SURVEYED COMPANIES
SECTORS
The companies surveyed are scattered throughout the district as many are place dependent (tourism or
agricultural assets), so are found in rural areas and not just the town nodes.
Mtubatuba is the oldest commercial town and dominated the district in terms of institutional
(municipal), commercial and industrial development.
It is still the prime industrial location due to the presence of the Umfolozi Sugar Mill at Riverview;
however, although still an important transport hub (bus and taxi, as well as rail), its commercial sector
is no longer so dominant given the growth of Hluhluwe, Mkuze, Jozini, Mbazwana and KwaNgwanase.
MAP 3.1: SPATIAL DISTRIBUTION OF SURVEYED COMPANIES BY ECONOMIC SECTORS

PSEDS: PROFILING DISTRICT ECONOMIC DRIVERS UMKHANYAKUDE DISTRICT MUNICIPALITY
ISIKHUNGUSETHU
MARCH 2012
12
EMPLOYMENT
The total number of people within the district is approximately 614 000 (Stats SA 2007 / IDP 2011-12)
Employment in the district is low with only about 12.7% of the population in formal employment.
More than 70% of the population lives on less than R 800 per month with 80% living below the poverty
line.
Sources of employment are: farming, trade, government, transport and tourism; however, employment
is concentrated in the tertiary, services sector.
The low level of agricultural and manufacturing employment indicates a low level of development and
economic diversification.
It should be noted, that from a demographic study undertaken as part of the Spatial Development
Framework Review in 2009, the population trend in the district is a move from the deeper rural areas
into the rural nodes (secondary and tertiary) and to the main towns. While this is to be expected, it is
important to note that the demographic shift is not all outside the district with people going to the
main cities such as Durban or the closer Richards Bay/Empangeni area; there is also a shift within
Umkhanyakude as people choose to move, presumably to be able to access basic services and facilities
and because of a greater possibility of employment.
Considering a total estimated 2010 formal sector employment of 55 819 (Quantec 2010) people in the
District, the 16 companies in the Umkhanyakude District that supplied the information on number of
people employed (the sample), employs an estimated 2 106 people representing 3.8% of the formal
employment of the District.
MAP 3.2: SPATIAL DISTRIBUTION OF SURVEYED COMPANIES BY NUMBER OF PEOPLE EMPLOYED

PSEDS: PROFILING DISTRICT ECONOMIC DRIVERS UMKHANYAKUDE DISTRICT MUNICIPALITY
ISIKHUNGUSETHU
MARCH 2012
13
TURNOVER
Those firms with a turnover of more than R100 million are related to commercial agriculture – the large
Senekal Boerdery farming holdings and the Umfolozi Sugar Mill.
The impact of the sugar industry on the District economy is confirmed through the turnover figures of
the single sugar mill in the area and the singular contribution it makes to manufacturing in the district.
On a provincial level the survey established that major retailers generally have a turnover of between
R50 million and R100 million and employs between 50 and 100 people. Considering that most urban
areas have a number of major retailers the wholesale and retail sector makes an important
contribution to the District economy.
35% of the respondents did not reply to the question on turnover which formed the largest percentage
of responses to the question.
Of those that did provide information, 30% were in the R 1 – 5 million turnover category, with the next
largest being in the R 50-100 million category comprising large-scale retailers in the district.
MAP 3.3: SPATIAL DISTRIBUTION OF SURVEYED COMPANIES BY TURNOVER PER YEAR

PSEDS: PROFILING DISTRICT ECONOMIC DRIVERS UMKHANYAKUDE DISTRICT MUNICIPALITY
ISIKHUNGUSETHU
MARCH 2012
14
COMPANY AGE
5 out of the 17 companies did not respond to this question.
Of the respondents, nearly 24% of the companies had been in operation for less than 10 years.
Nearly 18% have a record of between 80 – 100 years in business.
The next category is those businesses have been operating between 11 – 20 years.
This suggests that there are a few companies who have managed to stay successful and keep going for
decades; but the remainder are relatively new.
MAP 3.4: SPATIAL DISTRIBUTION OF SURVEYED COMPANIES BY AGE OF COMPANY (YEAR)

PSEDS: PROFILING DISTRICT ECONOMIC DRIVERS UMKHANYAKUDE DISTRICT MUNICIPALITY
ISIKHUNGUSETHU
MARCH 2012
15
3.6. KEY CHARACTERISTICS OF INTERVIEWED COMPANIES
OBSERVATIONS:
Major companies in Umkhanyakude supply a diverse range of products and services.
Nearly 42% of the companies that provided annual turnover information fall within the under R50
million turnover category.
The majority of major firms identified employ between 20 and 100 persons.
DIAGRAM 3.1: KEY CHARACTERISTICS OF INTERVIEWED COMPANIES
3.7. MAJOR COMPANIES SURVEYED
The table below lists the major companies in Umkhanyakude based primarily on number of people
employed.
TABLE 3.3: MAJOR COMPANIES SURVEYED BASED ON NUMBER OF PEOPLE EMPLOYED
COMPANIES LISTED EMPLOY BETWEEN 1 000 AND 42 PEOPLE
NO COMPANY OVERVIEW
1 Senekal Boerdery The list of major employers relate to the agriculture, tourism /
conservation and then the retail sector. Four of the 10 major
employers are tourism / accommodation firms, the only KwaZulu-
Natal District where this sector is dominant in terms of
employment. Agriculture also features with major farms in the
area employing in excess of a 1 000 people. The presence of
retailers, the Kwangwanase Spar and Jock Morrison & Sons,
suggest that this sector is a major employer in the District as each
rural centre is home to multiple retailers serving the substantial
rural population.
2 Zululand Rhino Reserve
3 Umfolozi Sugar Mill
4 Umfolozi Sugar Planters Ltd
5 Spar Kwangwanase
6 Jozini Tiger Lodge
7 Jock Morrison & Sons
8 Mkuze Game Reserve
9 Ghost Mountain Inn
10 Mjindi Farms
PSEDS: PROFILING DISTRICT ECONOMIC DRIVERS UMKHANYAKUDE DISTRICT MUNICIPALITY
ISIKHUNGUSETHU
MARCH 2012
16
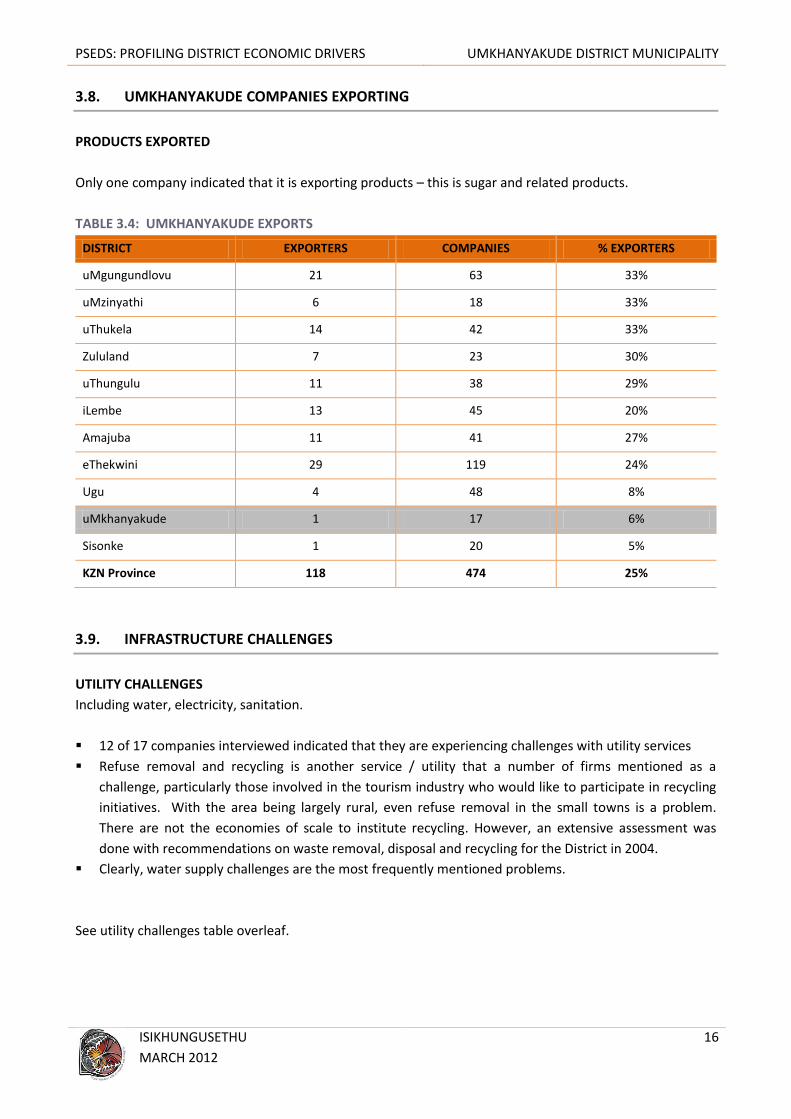
3.8. UMKHANYAKUDE COMPANIES EXPORTING
PRODUCTS EXPORTED
Only one company indicated that it is exporting products – this is sugar and related products.
TABLE 3.4: UMKHANYAKUDE EXPORTS
DISTRICT EXPORTERS COMPANIES % EXPORTERS
uMgungundlovu 21 63 33%
uMzinyathi 6 18 33%
uThukela 14 42 33%
Zululand 7 23 30%
uThungulu 11 38 29%
iLembe 13 45 20%
Amajuba 11 41 27%
eThekwini 29 119 24%
Ugu 4 48 8%
uMkhanyakude 1 17 6%
Sisonke 1 20 5%
KZN Province 118 474 25%
3.9. INFRASTRUCTURE CHALLENGES
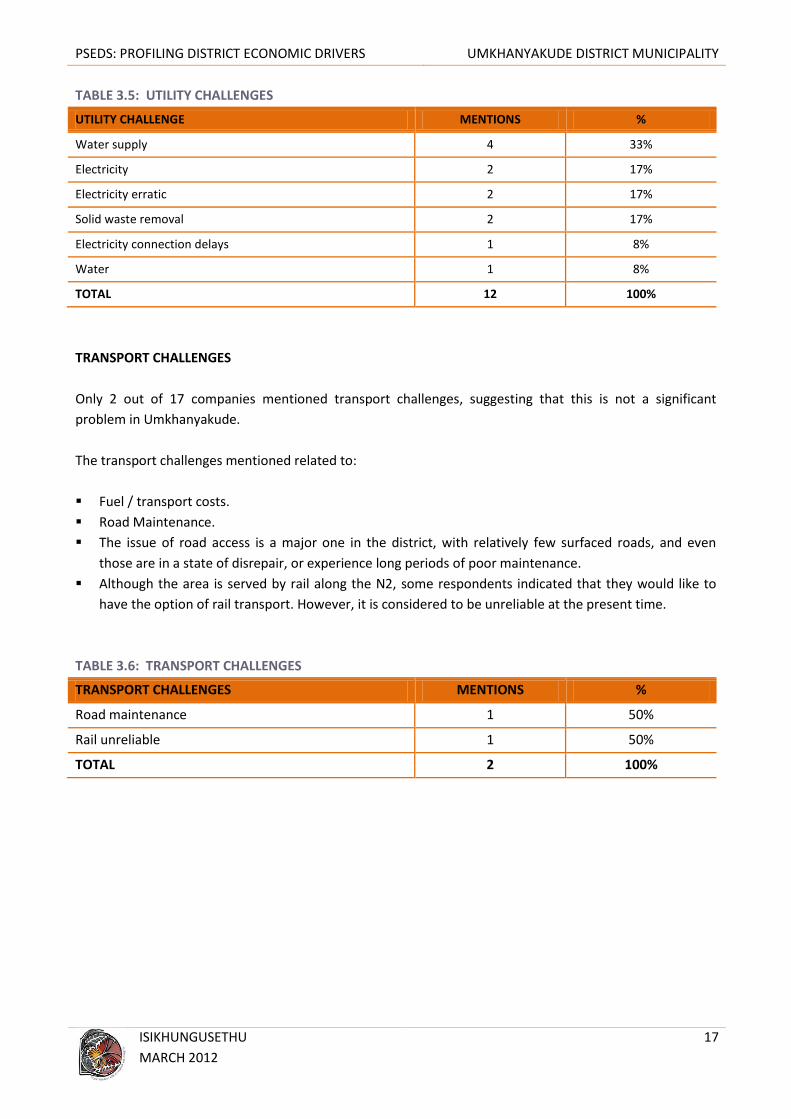
UTILITY CHALLENGES
Including water, electricity, sanitation.
12 of 17 companies interviewed indicated that they are experiencing challenges with utility services
Refuse removal and recycling is another service / utility that a number of firms mentioned as a
challenge, particularly those involved in the tourism industry who would like to participate in recycling
initiatives. With the area being largely rural, even refuse removal in the small towns is a problem.
There are not the economies of scale to institute recycling. However, an extensive assessment was
done with recommendations on waste removal, disposal and recycling for the District in 2004.
Clearly, water supply challenges are the most frequently mentioned problems.
See utility challenges table overleaf.
PSEDS: PROFILING DISTRICT ECONOMIC DRIVERS UMKHANYAKUDE DISTRICT MUNICIPALITY
ISIKHUNGUSETHU
MARCH 2012
17
TABLE 3.5: UTILITY CHALLENGES
UTILITY CHALLENGE MENTIONS %
Water supply 4 33%
Electricity 2 17%
Electricity erratic 2 17%
Solid waste removal 2 17%
Electricity connection delays 1 8%
Water 1 8%
TOTAL 12 100%
TRANSPORT CHALLENGES
Only 2 out of 17 companies mentioned transport challenges, suggesting that this is not a significant
problem in Umkhanyakude.
The transport challenges mentioned related to:
Fuel / transport costs.
Road Maintenance.
The issue of road access is a major one in the district, with relatively few surfaced roads, and even
those are in a state of disrepair, or experience long periods of poor maintenance.
Although the area is served by rail along the N2, some respondents indicated that they would like to
have the option of rail transport. However, it is considered to be unreliable at the present time.
TABLE 3.6: TRANSPORT CHALLENGES
TRANSPORT CHALLENGES MENTIONS %
Road maintenance 1 50%
Rail unreliable 1 50%
TOTAL 2 100%

PSEDS: PROFILING DISTRICT ECONOMIC DRIVERS UMKHANYAKUDE DISTRICT MUNICIPALITY
ISIKHUNGUSETHU
MARCH 2012
18
3.10. OTHER CHALLENGES
Other challenges that emerged out of the interviews were:
Issues concerning labour and the availability of skills; one of the factors that contribute to the lack of
skilled labour is the difficulty in retaining professional and skilled people in an area which is seen as
relatively remote with limited services, particularly good schools and other social facilities. Many of the
professional civil servants who work in the area do not consider it their home, but only stay for the
working week and go to their homes elsewhere in the Province on the weekends.
It is of concern that so many respondents mentioned corruption and illegal activity as being a factor.
The high profile of the natural environment and the dependency of the major tourism sector on this
environment place environmental issues high on the list of concerns.
The recession, economic conditions and government policy and procedures all contribute to challenges
in the district, as they do across KZN.
DIAGRAM 3.2: OTHER CHALLENGES
PSEDS: PROFILING DISTRICT ECONOMIC DRIVERS UMKHANYAKUDE DISTRICT MUNICIPALITY
ISIKHUNGUSETHU
MARCH 2012
19
3.11. INTERVIEWEE COMMENTS
Some of the general observations made by respondents regarding the District economy included:
Most respondents had problems with infrastructure and utilities.
The poor skills base puts a brake on economic growth, with difficulty in attracting and retaining the kind
of skills needed to help drive economic growth.
There is unrealised potential in irrigated agriculture on the Makathini Flats.
There is also underutilised potential in the game farming industry with venison and other game
products.
Development needs to take place around Hluhluwe to ensure future sustainable growth.
The district economy is poor with relatively low diversity: farming, hunting and tourism are the main
drivers of the economy, with farming or agriculture operating well below its potential.
Linked to the above comment was one which stated that the town of Mkuze does not have the
potential to expand if the agricultural sector does not expand. Money made in the agricultural sector
would create more jobs and this would increase local income circulation. There is “huge potential on
the Senekal farm and the Myeni tribal land which could potentially employ another 2000+ people in
Mkuze directly”.
While this is not directly from interviewee’s comments, the comment above concerning Mkuze could
be repeated for Hluhluwe in terms of agricultural development, including looking at agricultural
possibilities in the Makhasa / Mnqobokazi / Nibela areas. As mentioned throughout the report, the
unrealised agricultural potential of the Makathini Flats could greatly increase local income circulation in
the Jozini, Mbazwana, Bambanana, Mseleni and the Ubombo centres.
A large number of people are subsistence farmers and find the current increases in basic foods and fuel
very difficult to survive.
There was criticism of the municipality in not being sufficiently effective in addressing infrastructure
problems to help uplift the communities in the district.
3.12. A PERSPECTIVE OF ECONOMIC DRIVERS BASED ON COMPANY SURVEY
Based on the Quantec figures, and through the identification of major companies in the Umkhanyakude
District, it is evident that the major sector driving the District economy is the government, wholesale and
retail and manufacturing sectors. Tourism fulfils an important role in the local economy as part of the
wholesale and retail and accommodation sector.
On the basis of the findings of this project, the following sectors have been identified as being the key
economic drivers in the Umkhanyakude District. Following the categorisation of companies provided by
McCarthy in the introduction to the provincial report on this project the following is noted:
Older more established companies with a sizeable number of employees and annual turnover in the
Umkhanyakude context. These companies are located in the following sectors:
PSEDS: PROFILING DISTRICT ECONOMIC DRIVERS UMKHANYAKUDE DISTRICT MUNICIPALITY
ISIKHUNGUSETHU
MARCH 2012
20
o Agriculture:
Farming relating to various agricultural commodities
o Manufacturing :
Processing of agricultural products
o Tourism:
Established large scale tourism facilities
Many smaller tourism and accommodation facilities
The newer smaller perhaps more dynamic companies creating a ‘churn’ effect in the district (i.e. having
an impact) include those located in the following sectors:
o Services:
Government
o Trade:
Wholesale and retail
Tourism and hospitality
It is noted by McCarthy that companies in these sectors are important for the future economic growth of
the economy of Umkhanyakude in that they are often recent entrants into the market outside of the
‘traditional box’. In a sense they are therefore ‘testing the economic waters’ and if they succeed will be the
forerunners of a range of new sectors in the district.
PSEDS: PROFILING DISTRICT ECONOMIC DRIVERS UMKHANYAKUDE DISTRICT MUNICIPALITY
ISIKHUNGUSETHU
MARCH 2012
21
4. A MUNICIPAL CAPITAL INVESTMENT PERSPECTIVE
4.1. INTRODUCTION
In order to consider District drivers from the perspective of municipalities a questionnaire was issued to
each municipality. The information gathered through these interviews and presented in this section
includes:
A Project Based Perspective
o Historic and Current Projects
o Future Projects
Municipality Identified Challenges
Addressing the Challenges
A Public Sector Investment Perspective
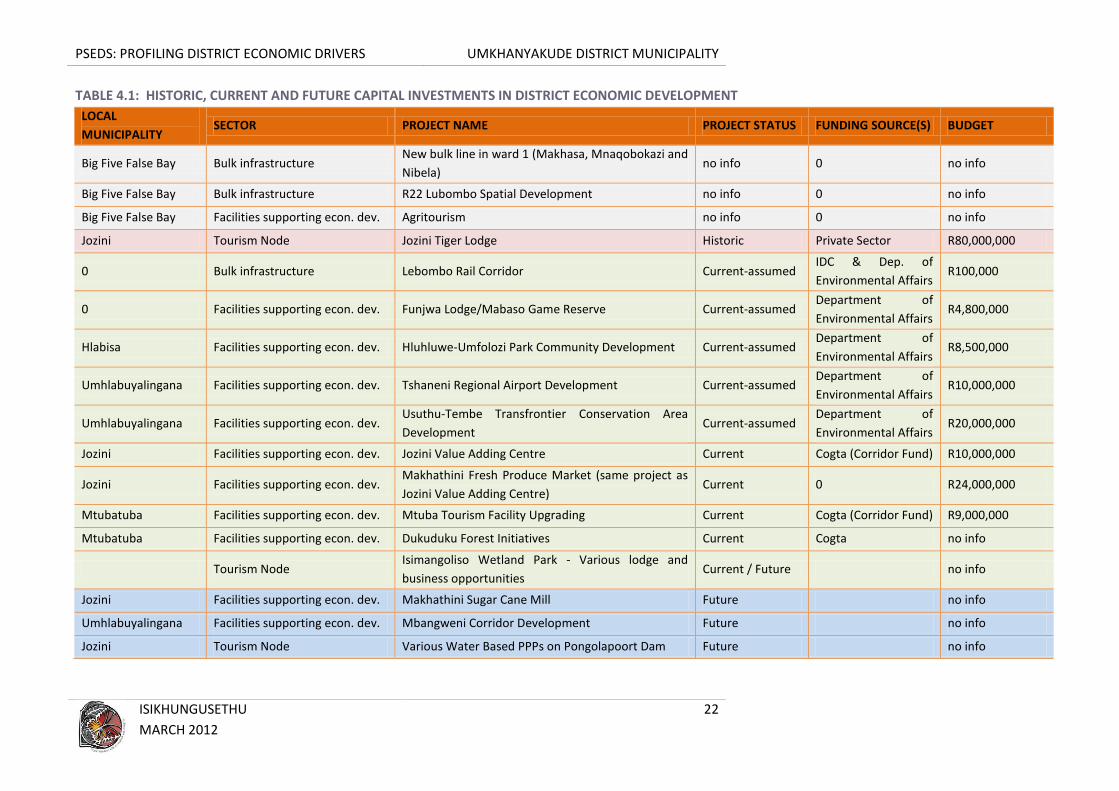
4.2. CAPITAL INVESTMENT IN THE DISTRICT
For this initiative the focus was on identifying major (focus on R20m plus) capital investment projects in the
District falling in the following categories:
New nodes / developments: including tourism, commercial and industrial nodes.
Bulk infrastructure supporting economic development: including bulk infrastructure (excluding
reticulation) for water and electricity and other infrastructure related to solid waste.
Link and major access infrastructure supporting economic development including roads, airports and
taxi ranks amongst others.
Facilities supporting economic development including sport stadiums, markets, trading centres and the
like.
PSEDS: PROFILING DISTRICT ECONOMIC DRIVERS UMKHANYAKUDE DISTRICT MUNICIPALITY
ISIKHUNGUSETHU
MARCH 2012
22
TABLE 4.1: HISTORIC, CURRENT AND FUTURE CAPITAL INVESTMENTS IN DISTRICT ECONOMIC DEVELOPMENT
LOCAL
MUNICIPALITY SECTOR PROJECT NAME PROJECT STATUS FUNDING SOURCE(S) BUDGET
Big Five False Bay Bulk infrastructure New bulk line in ward 1 (Makhasa, Mnaqobokazi and
Nibela) no info 0 no info
Big Five False Bay Bulk infrastructure R22 Lubombo Spatial Development no info 0 no info
Big Five False Bay Facilities supporting econ. dev. Agritourism no info 0 no info
Jozini Tourism Node Jozini Tiger Lodge Historic Private Sector R80,000,000
0 Bulk infrastructure Lebombo Rail Corridor Current-assumed IDC & Dep. of
Environmental Affairs R100,000
0 Facilities supporting econ. dev. Funjwa Lodge/Mabaso Game Reserve Current-assumed Department of
Environmental Affairs R4,800,000
Hlabisa Facilities supporting econ. dev. Hluhluwe-Umfolozi Park Community Development Current-assumed Department of
Environmental Affairs R8,500,000
Umhlabuyalingana Facilities supporting econ. dev. Tshaneni Regional Airport Development Current-assumed Department of
Environmental Affairs R10,000,000
Umhlabuyalingana Facilities supporting econ. dev. Usuthu-Tembe Transfrontier Conservation Area
Development Current-assumed
Department of
Environmental Affairs R20,000,000
Jozini Facilities supporting econ. dev. Jozini Value Adding Centre Current Cogta (Corridor Fund) R10,000,000
Jozini Facilities supporting econ. dev. Makhathini Fresh Produce Market (same project as
Jozini Value Adding Centre) Current 0 R24,000,000
Mtubatuba Facilities supporting econ. dev. Mtuba Tourism Facility Upgrading Current Cogta (Corridor Fund) R9,000,000
Mtubatuba Facilities supporting econ. dev. Dukuduku Forest Initiatives Current Cogta no info
Tourism Node Isimangoliso Wetland Park - Various lodge and
business opportunities Current / Future no info
Jozini Facilities supporting econ. dev. Makhathini Sugar Cane Mill Future no info
Umhlabuyalingana Facilities supporting econ. dev. Mbangweni Corridor Development Future no info
Jozini Tourism Node Various Water Based PPPs on Pongolapoort Dam Future no info
PSEDS: PROFILING DISTRICT ECONOMIC DRIVERS UMKHANYAKUDE DISTRICT MUNICIPALITY
ISIKHUNGUSETHU
MARCH 2012
23
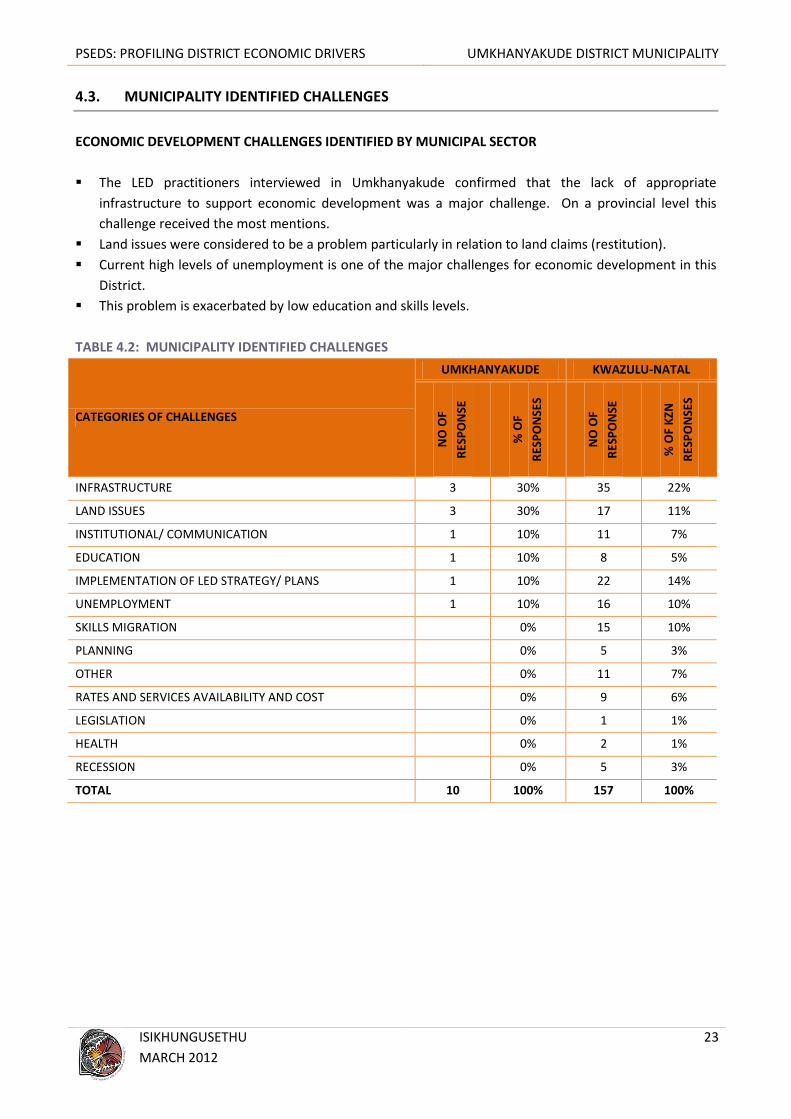
4.3. MUNICIPALITY IDENTIFIED CHALLENGES
ECONOMIC DEVELOPMENT CHALLENGES IDENTIFIED BY MUNICIPAL SECTOR
The LED practitioners interviewed in Umkhanyakude confirmed that the lack of appropriate
infrastructure to support economic development was a major challenge. On a provincial level this
challenge received the most mentions.
Land issues were considered to be a problem particularly in relation to land claims (restitution).
Current high levels of unemployment is one of the major challenges for economic development in this
District.
This problem is exacerbated by low education and skills levels.
TABLE 4.2: MUNICIPALITY IDENTIFIED CHALLENGES
CATEGORIES OF CHALLENGES
UMKHANYAKUDE KWAZULU-NATAL
NO
OF
RES
PO
NSE
% O
F
RES
PO
NSE
S
NO
OF
RES
PO
NSE
% O
F K
ZN
RES
PO
NSE
S
INFRASTRUCTURE 3 30% 35 22%
LAND ISSUES 3 30% 17 11%
INSTITUTIONAL/ COMMUNICATION 1 10% 11 7%
EDUCATION 1 10% 8 5%
IMPLEMENTATION OF LED STRATEGY/ PLANS 1 10% 22 14%
UNEMPLOYMENT 1 10% 16 10%
SKILLS MIGRATION
0% 15 10%
PLANNING
0% 5 3%
OTHER
0% 11 7%
RATES AND SERVICES AVAILABILITY AND COST
0% 9 6%
LEGISLATION
0% 1 1%
HEALTH
0% 2 1%
RECESSION
0% 5 3%
TOTAL 10 100% 157 100%
PSEDS: PROFILING DISTRICT ECONOMIC DRIVERS UMKHANYAKUDE DISTRICT MUNICIPALITY
ISIKHUNGUSETHU
MARCH 2012
24
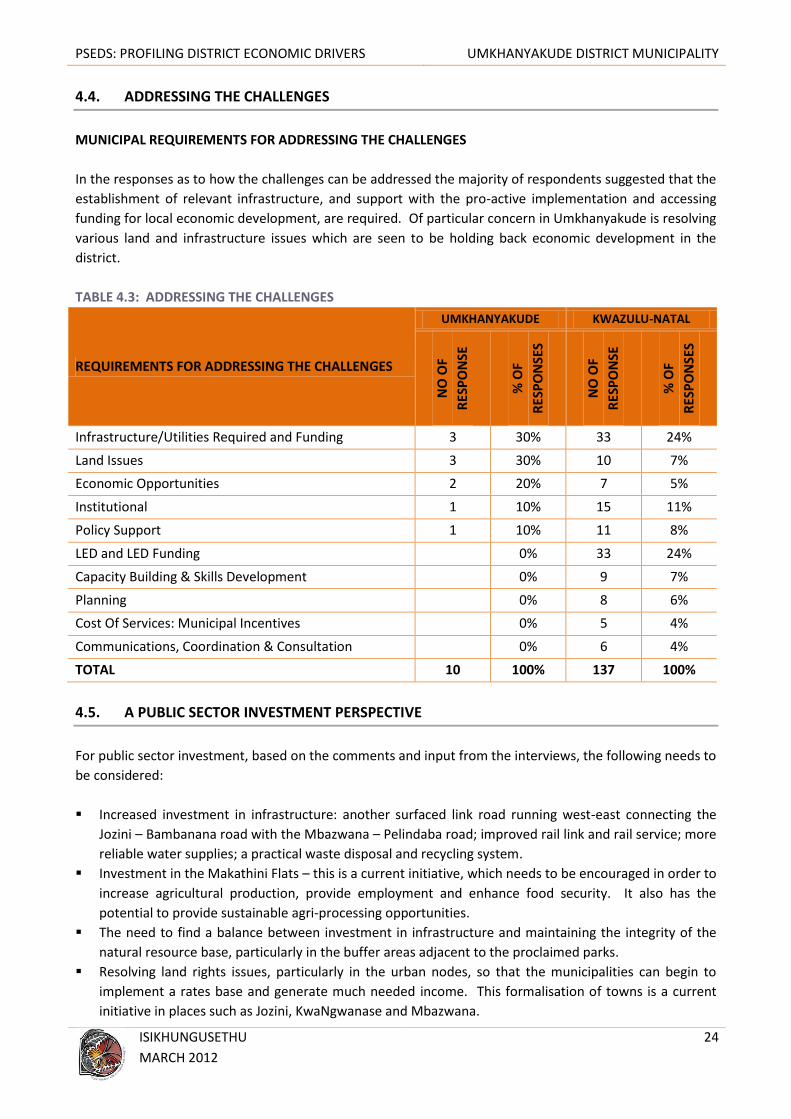
4.4. ADDRESSING THE CHALLENGES
MUNICIPAL REQUIREMENTS FOR ADDRESSING THE CHALLENGES
In the responses as to how the challenges can be addressed the majority of respondents suggested that the
establishment of relevant infrastructure, and support with the pro-active implementation and accessing
funding for local economic development, are required. Of particular concern in Umkhanyakude is resolving
various land and infrastructure issues which are seen to be holding back economic development in the
district.
TABLE 4.3: ADDRESSING THE CHALLENGES
REQUIREMENTS FOR ADDRESSING THE CHALLENGES
UMKHANYAKUDE KWAZULU-NATAL
NO
OF
RES
PO
NSE
% O
F
RES
PO
NSE
S
NO
OF
RES
PO
NSE
% O
F
RES
PO
NSE
S
Infrastructure/Utilities Required and Funding 3 30% 33 24%
Land Issues 3 30% 10 7%
Economic Opportunities 2 20% 7 5%
Institutional 1 10% 15 11%
Policy Support 1 10% 11 8%
LED and LED Funding
0% 33 24%
Capacity Building & Skills Development
0% 9 7%
Planning
0% 8 6%
Cost Of Services: Municipal Incentives
0% 5 4%
Communications, Coordination & Consultation
0% 6 4%
TOTAL 10 100% 137 100%
4.5. A PUBLIC SECTOR INVESTMENT PERSPECTIVE
For public sector investment, based on the comments and input from the interviews, the following needs to
be considered:
Increased investment in infrastructure: another surfaced link road running west-east connecting the
Jozini – Bambanana road with the Mbazwana – Pelindaba road; improved rail link and rail service; more
reliable water supplies; a practical waste disposal and recycling system.
Investment in the Makathini Flats – this is a current initiative, which needs to be encouraged in order to
increase agricultural production, provide employment and enhance food security. It also has the
potential to provide sustainable agri-processing opportunities.
The need to find a balance between investment in infrastructure and maintaining the integrity of the
natural resource base, particularly in the buffer areas adjacent to the proclaimed parks.
Resolving land rights issues, particularly in the urban nodes, so that the municipalities can begin to
implement a rates base and generate much needed income. This formalisation of towns is a current
initiative in places such as Jozini, KwaNgwanase and Mbazwana.

PSEDS: PROFILING DISTRICT ECONOMIC DRIVERS UMKHANYAKUDE DISTRICT MUNICIPALITY
ISIKHUNGUSETHU
MARCH 2012
25
5. A NATURAL RESOURCES OVERVIEW
5.1. INTRODUCTION
There exists a strategic link between the state of the District’s natural capital, its ability to deliver
ecoservices and the extent to which this provides resilience to the economy and/or makes it
vulnerable. The interviews with major companies in the district confirmed that certain of the companies
sampled (economic drivers) were ignorant of this strategic link and that they are operating under the
assumption that the natural resources upon which they depend, either directly or indirectly, are infinitely
available. Also, it needs to be highlighted that many economic drivers are ignorant of the societal costs
caused by the generation of environmental externalities for which they are not taking responsibility for. In
addition to this, there are also opportunity costs as a result of lost opportunities, e.g. decline in the viability
of the Pongola fisheries due to inconsistent flooding regime (29 below). Similarly the fisheries potential of
the Kosi lakes system is under threat due to over – fishing from ‘gill netting’.
With the above as background this section:
Considers the quality of ecosystem goods and services in the District;
Provides an overview of ecosystem resources (including allocating a value to the ecosystem resources);
Illustrates the ecosystem resource linkages between this District and other Districts in KwaZulu-Natal;
and
Highlighting the range of economic opportunities and constraints emanating from the future utilisation
of ecosystem resources.
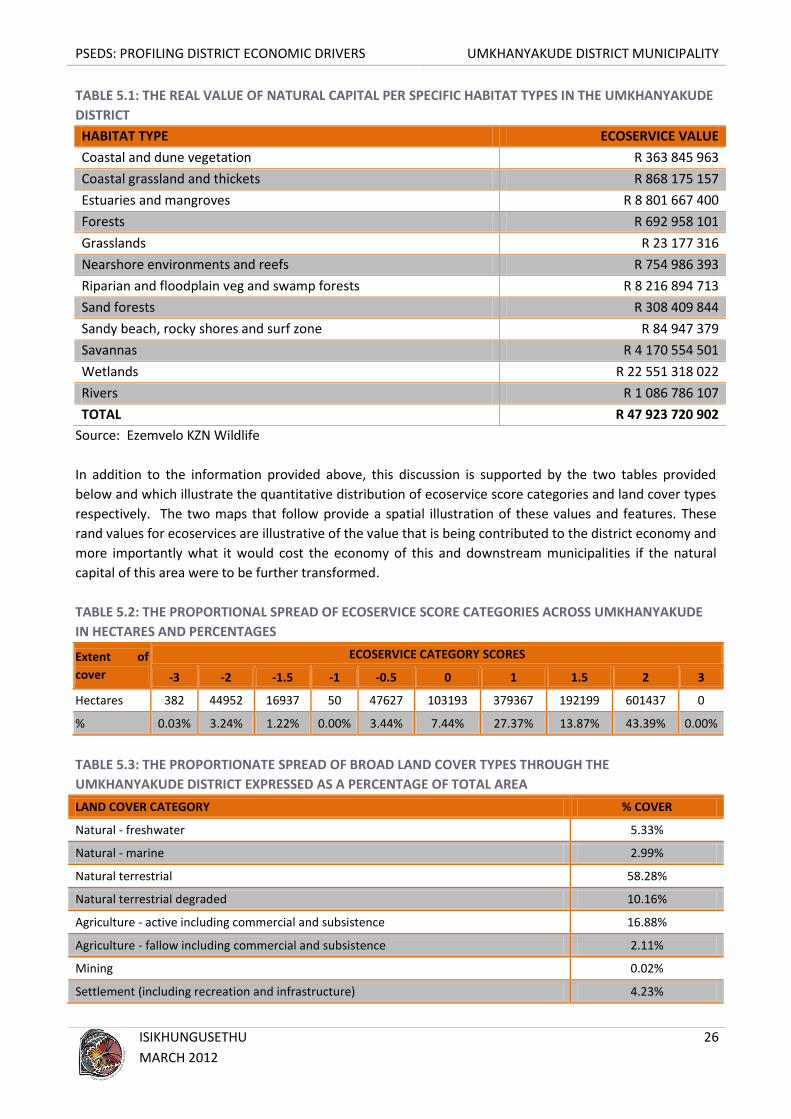
5.2. CONDITION OF NATURAL CAPITAL AND THE QUALITY OF ECOSYSTEM SERVICES
The condition of natural capital in the Umkhanyakude District is reported on here with the aid of a number
of tables and maps. The first of the tables presents a breakdown of the biodiversity value in real monetary
terms in relation to the proportional contribution to the Provincial value and the surface area covered by
the District. Thereafter summary tables showing the ecoservice and the land cover values are presented.
These are followed by maps which illustrate this spatially with land cover being followed by the distribution
of ecoservice score allocations.
Ezemvelo KZN Wildlife completed an exercise, reported on in detail in the Provincial report, which used the
values derived for the ecoservices produced and delivered from a variety of natural habitat types in the
Province (EKZNW, 2011). The outputs of this exercise were then used to extract the value for each of the
Districts and these are presented in table format below (see table 5.1). This value for Umkhanyakude
equates to 32.02% of the total value for the Province which must be considered in the context of the
District making up 14.69% of the Province’s surface area. It must be noted that these figures provide an
indicative value for the District having been derived from figures at a Provincial scale. Any assumptions and
related errors made at the Provincial scale are therefore somewhat greater at the District level. A more
refined exercise would need to be done for each District in order to provide a more accurate picture.
However, the fact that the value of natural capital is more than twice that of the proportional extent of the
District is a very significant feature which implies that the basis for the economy of the district is stable and
that there may be room for growth.
PSEDS: PROFILING DISTRICT ECONOMIC DRIVERS UMKHANYAKUDE DISTRICT MUNICIPALITY
ISIKHUNGUSETHU
MARCH 2012
26
TABLE 5.1: THE REAL VALUE OF NATURAL CAPITAL PER SPECIFIC HABITAT TYPES IN THE UMKHANYAKUDE
DISTRICT
HABITAT TYPE ECOSERVICE VALUE
Coastal and dune vegetation R 363 845 963
Coastal grassland and thickets R 868 175 157
Estuaries and mangroves R 8 801 667 400
Forests R 692 958 101
Grasslands R 23 177 316
Nearshore environments and reefs R 754 986 393
Riparian and floodplain veg and swamp forests R 8 216 894 713
Sand forests R 308 409 844
Sandy beach, rocky shores and surf zone R 84 947 379
Savannas R 4 170 554 501
Wetlands R 22 551 318 022
Rivers R 1 086 786 107
TOTAL R 47 923 720 902
Source: Ezemvelo KZN Wildlife
In addition to the information provided above, this discussion is supported by the two tables provided
below and which illustrate the quantitative distribution of ecoservice score categories and land cover types
respectively. The two maps that follow provide a spatial illustration of these values and features. These
rand values for ecoservices are illustrative of the value that is being contributed to the district economy and
more importantly what it would cost the economy of this and downstream municipalities if the natural
capital of this area were to be further transformed.
TABLE 5.2: THE PROPORTIONAL SPREAD OF ECOSERVICE SCORE CATEGORIES ACROSS UMKHANYAKUDE
IN HECTARES AND PERCENTAGES
Extent of
cover
ECOSERVICE CATEGORY SCORES
-3 -2 -1.5 -1 -0.5 0 1 1.5 2 3
Hectares 382 44952 16937 50 47627 103193 379367 192199 601437 0
% 0.03% 3.24% 1.22% 0.00% 3.44% 7.44% 27.37% 13.87% 43.39% 0.00%
TABLE 5.3: THE PROPORTIONATE SPREAD OF BROAD LAND COVER TYPES THROUGH THE
UMKHANYAKUDE DISTRICT EXPRESSED AS A PERCENTAGE OF TOTAL AREA
LAND COVER CATEGORY % COVER
Natural - freshwater 5.33%
Natural - marine 2.99%
Natural terrestrial 58.28%
Natural terrestrial degraded 10.16%
Agriculture - active including commercial and subsistence 16.88%
Agriculture - fallow including commercial and subsistence 2.11%
Mining 0.02%
Settlement (including recreation and infrastructure) 4.23%

PSEDS: PROFILING DISTRICT ECONOMIC DRIVERS UMKHANYAKUDE DISTRICT MUNICIPALITY
ISIKHUNGUSETHU
MARCH 2012
27
MAP 5.1: UMKHANYAKUDE DISTRICT LAND COVER
MAP 5.2: UMKHANYAKUDE DISTRICT POTENTIAL TO DELIVER ECOSYSTEM GOODS AND SERVICES
PSEDS: PROFILING DISTRICT ECONOMIC DRIVERS UMKHANYAKUDE DISTRICT MUNICIPALITY
ISIKHUNGUSETHU
MARCH 2012
28
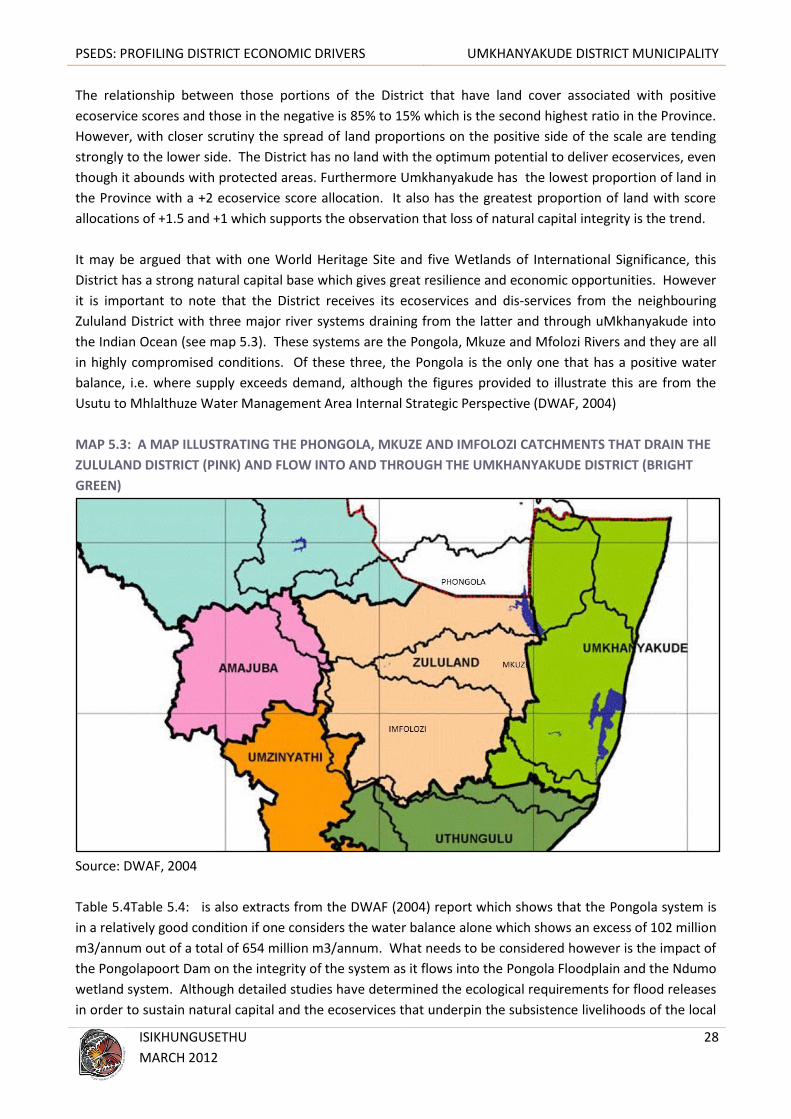
The relationship between those portions of the District that have land cover associated with positive
ecoservice scores and those in the negative is 85% to 15% which is the second highest ratio in the Province.
However, with closer scrutiny the spread of land proportions on the positive side of the scale are tending
strongly to the lower side. The District has no land with the optimum potential to deliver ecoservices, even
though it abounds with protected areas. Furthermore Umkhanyakude has the lowest proportion of land in
the Province with a +2 ecoservice score allocation. It also has the greatest proportion of land with score
allocations of +1.5 and +1 which supports the observation that loss of natural capital integrity is the trend.
It may be argued that with one World Heritage Site and five Wetlands of International Significance, this
District has a strong natural capital base which gives great resilience and economic opportunities. However
it is important to note that the District receives its ecoservices and dis-services from the neighbouring
Zululand District with three major river systems draining from the latter and through uMkhanyakude into
the Indian Ocean (see map 5.3). These systems are the Pongola, Mkuze and Mfolozi Rivers and they are all
in highly compromised conditions. Of these three, the Pongola is the only one that has a positive water
balance, i.e. where supply exceeds demand, although the figures provided to illustrate this are from the
Usutu to Mhlalthuze Water Management Area Internal Strategic Perspective (DWAF, 2004)
MAP 5.3: A MAP ILLUSTRATING THE PHONGOLA, MKUZE AND IMFOLOZI CATCHMENTS THAT DRAIN THE
ZULULAND DISTRICT (PINK) AND FLOW INTO AND THROUGH THE UMKHANYAKUDE DISTRICT (BRIGHT
GREEN)
Source: DWAF, 2004
Table 5.4Table 5.4: is also extracts from the DWAF (2004) report which shows that the Pongola system is
in a relatively good condition if one considers the water balance alone which shows an excess of 102 million
m3/annum out of a total of 654 million m3/annum. What needs to be considered however is the impact of
the Pongolapoort Dam on the integrity of the system as it flows into the Pongola Floodplain and the Ndumo
wetland system. Although detailed studies have determined the ecological requirements for flood releases
in order to sustain natural capital and the ecoservices that underpin the subsistence livelihoods of the local

PSEDS: PROFILING DISTRICT ECONOMIC DRIVERS UMKHANYAKUDE DISTRICT MUNICIPALITY
ISIKHUNGUSETHU
MARCH 2012
29
people, these regimes have not been followed. Flood releases are determined now by the virtue of crop
selection and growing seasons and, together with other socio-economic dynamics, this has caused a
significant deterioration in the quality of the natural capital and a decline in the system’s ability to deliver
ecoservices (Lankford et al, 2010).
TABLE 5.4: WATER BALANCE FIGURES FOR THE PHONGOLA, MKUZE AND IMFOLOZI RIVER SYSTEMS
Yield and Abstractions in m3/annum River System
Pongola Mkuze iMfolozi
Available Water
Local yield 645 33 51
Transfer in 0 33 0
Total 645 66 51
Water requirements
Local requirements 255 78 80
Transfer out 38 0 18
Flood plain releases 250
Total 543 78 98
Balance 102 -12 -47
Source: DWAF, 2004
What the above table also shows is that the Mkuze and iMfolozi catchments are stressed in that they have
a negative water balance. This implies that there are therefore significant natural capital constraints on the
economy of these two areas within the District, and that it would be in the interest of the District to engage
with DWA and upstream land and water users to turn this situation around. The possibilities exist that if
alternative economic activities such as nature and culture-based tourism are maintained and even grown,
increased income from these could be used to incentivise more sustainable land and water use upstream of
these operations.
A very real illustration of the value of well managed natural capital is in the Hluhluwe Dam that is within the
Hluhluwe/iMfolozi Game Reserve and which has the lowest sediment load of any dam in the country. This
is as a direct result of the fact that much of the river above the dam flows through this protected area. The
diminished levels of ecoservices emanating from the subsistence land use outside of the protected area are
then absorbed by the intact natural capital in the protected area. At this point in time it is estimated that
dredging costs are approximately R5 to R10/m3 of silt, and if a comparison is made with similar
impoundments elsewhere in the country, it will be possible to calculate the value of the saving that is being
made. The relevance of this saving must also be seen in the light of the demand that is placed on this
system through the concentration of commercial agricultural activities that exist below the dam and Lake St
Lucia.
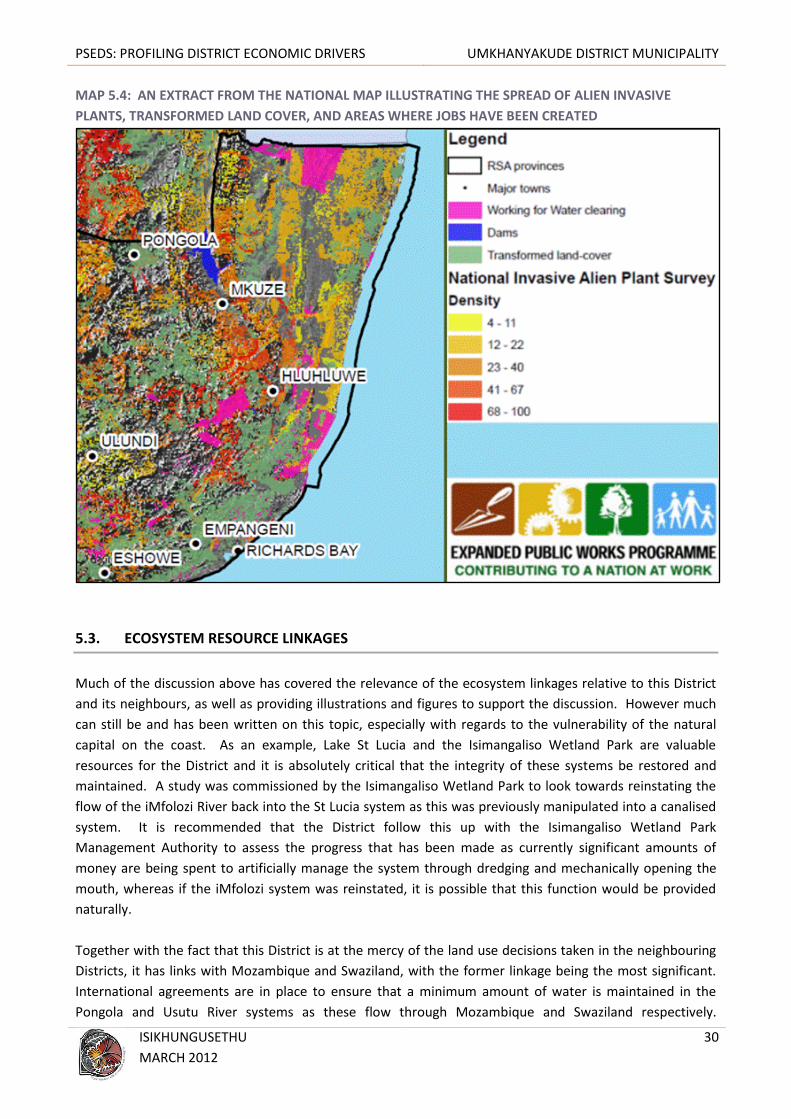
An added constraint that is related to the condition of natural capital in the District has to do with the
spread of alien invasive plants as illustrated in map 5.4 below. Although the level of infestations is
moderate, the extent is wide spread. Some of the alien invasive plant species that are part of these
infestations are particularly vigorous in their ability to spread and the District needs to be active in efforts
to eradicate these plants and win back valuable natural capital. Importantly this offers opportunities for
employment as can be seen by the pink shaded areas which illustrate portions where alien plant clearing
efforts have and are already in place.
PSEDS: PROFILING DISTRICT ECONOMIC DRIVERS UMKHANYAKUDE DISTRICT MUNICIPALITY
ISIKHUNGUSETHU
MARCH 2012
30
MAP 5.4: AN EXTRACT FROM THE NATIONAL MAP ILLUSTRATING THE SPREAD OF ALIEN INVASIVE
PLANTS, TRANSFORMED LAND COVER, AND AREAS WHERE JOBS HAVE BEEN CREATED
5.3. ECOSYSTEM RESOURCE LINKAGES
Much of the discussion above has covered the relevance of the ecosystem linkages relative to this District
and its neighbours, as well as providing illustrations and figures to support the discussion. However much
can still be and has been written on this topic, especially with regards to the vulnerability of the natural
capital on the coast. As an example, Lake St Lucia and the Isimangaliso Wetland Park are valuable
resources for the District and it is absolutely critical that the integrity of these systems be restored and
maintained. A study was commissioned by the Isimangaliso Wetland Park to look towards reinstating the
flow of the iMfolozi River back into the St Lucia system as this was previously manipulated into a canalised
system. It is recommended that the District follow this up with the Isimangaliso Wetland Park
Management Authority to assess the progress that has been made as currently significant amounts of
money are being spent to artificially manage the system through dredging and mechanically opening the
mouth, whereas if the iMfolozi system was reinstated, it is possible that this function would be provided
naturally.
Together with the fact that this District is at the mercy of the land use decisions taken in the neighbouring
Districts, it has links with Mozambique and Swaziland, with the former linkage being the most significant.
International agreements are in place to ensure that a minimum amount of water is maintained in the
Pongola and Usutu River systems as these flow through Mozambique and Swaziland respectively.

PSEDS: PROFILING DISTRICT ECONOMIC DRIVERS UMKHANYAKUDE DISTRICT MUNICIPALITY
ISIKHUNGUSETHU
MARCH 2012
31
Umkhanyakude is in a position to be influenced by and to influence the ability of the Pongola River to
deliver as per the international agreement. This international linkage is listed here as it illustrates the
importance of the ecosystem linkages that literally flow through the District. It is important that these are
noted and that they are factored into planning to sustain and possible grow the economy.
The fact that the District can boast the presence of a World Heritage Site and five wetlands of international
significance, i.e. Lake St Lucia, Turtle Beaches/Coral Reefs of Tongaland, Lake Sibaya, Kosi Bay and Ndumo;
as well as the Pongola River Floodplain with its associated wetlands and pans; makes this District a
significant tourism destination. Each of these features are vulnerable to the ramifications of land use
adjacent to and beyond their borders. These dynamics need to be well understood and managed to ensure
that their negative impact on these features is brought under control and that the economic benefits they
bring to the District are not compromised. The dynamics alluded to here have been discussed above,
namely the negative water balance and the impact of impoundments, as well as the spread of alien invasive
plants.
A further threat to the integrity of the natural capital of the district is the land use system where areas
which should not be settled on developed have been occupied for a variety of social, economic and political
reasons (eg. East bank Ndumo Game Reserve).
5.4. THE RESILIENCE OR VULNERABILITY OF ECONOMIC DRIVERS AND THE OPPORTUNITIES
AND CONSTRAINTS TO GROWTH
According to Section 3.12 there are a number of economic drivers that are categorised according to those
that are established and those that are emerging. The discussion in this Section will consider each of these
in terms of how the current condition of natural capital and related ecoservices either presents
opportunities and/or constraints per sector. The sectors that are considered are:
Established:
o Agriculture:
Farming relating to various agricultural commodities
o Manufacturing :
Processing of agricultural products
o Tourism:
Established large scale tourism facilities
Many smaller tourism and accommodation facilities
Emerging:
o Services:
Government
o Trade:
Wholesale and retail
Tourism and hospitality
For more detail see Annexure B.

PSEDS: PROFILING DISTRICT ECONOMIC DRIVERS UMKHANYAKUDE DISTRICT MUNICIPALITY
ISIKHUNGUSETHU
MARCH 2012
32
6. FINDINGS AND RECOMMENDATIONS
6.1. CORE FINDINGS
From the interviews with major businesses and LED practitioners limited structural changes in the
economy of the Umkhanyakude District over the past two decades could be identified (a structural
change is defined as a “long-term widespread change of the fundamental structure (of an economy),
rather than micro-scale or short-term output and employment”).
The health of the economy of the District is still dependent on industries established well over 100
years ago relating to the sugar industry.
An encouraging sign is the emergence of smaller companies engaging in tertiary sector activities over
the past 20 years, but this should not be viewed as a structural change.
The primacy of the government sector in the district economy is not a healthy sign even though it has
contributed to the emergence of a much more dynamic commercial sector in the rural towns.
The natural capital of the District is largely intact, but is under increasing pressure in some places,
particularly along the riverine and wetland areas. There is also increasing pressure around the coastal
lakes and along the coast in the Isimangaliso Wetland Park where local communities still live and where
there has been conflict over illegal tourism developments.
6.2. KEY SPATIAL ECONOMIC FEATURES
A number of key spatial economic features of the Umkhanyakude District must be acknowledged before
recommendations are considered:
The relatively limited major infrastructural features: there is the N2 with an associated underutilised
and unreliable rail link, and the two secondary corridors through Jozini and Bambanana to
KwaNgwanase and from Hluhluwe, through Mbazwana and Pelindaba to KwaNgwanase; the other
major infrastructural facility is the almost unused Jozini Dam which has never realised even a fraction of
its potential.
The structure that is in place for the Makathini Irrigation Scheme which has never been used to
anything close to its potential, despite having been in existence for over 40 years.
The relatively intact natural capital of the district is a key economic resource for tourism and eco-
tourism related activities.
The relatively low levels of development with no real primary town.
The dominance of Ingonyama Trust areas under communal tenure presents both opportunities and
challenges.
The Pongola River floodplain and the wetland and swamp systems associated with the coastal lakes and
systems such as the Muzi swamps and Mkuze river wetland system, all present opportunity for
agriculture with increasing encroachment into these sensitive features; all are therefore seen as an
agricultural economic resource, as well as a tourism economic resource, while at the same time having
an intrinsic environmental value in terms of the ecosystem goods and services they provide. Some of
these areas are in danger of increasing degradation; if this is not managed, then those natural
resources may not, in the future, be able to provide ANY of the economic or ecosystem values that they
currently provide.

PSEDS: PROFILING DISTRICT ECONOMIC DRIVERS UMKHANYAKUDE DISTRICT MUNICIPALITY
ISIKHUNGUSETHU
MARCH 2012
33
6.3. A CHANGING SPATIAL ECONOMIC DEVELOPMENT STRUCTURE
On a regional level some major initiatives have the potential to influence the spatial economic structuring
of the Umkhanyakude District and potentially bring about structural changes, viz.
The development of the Makathini Flats, if the Makathini Flats Integrated Development Plan or Master
Plan is followed through.
Reinforcing the work done under the auspices of the Lebombo Spatial Development Initiative which
played a key role in opening up the eastern area of the district in terms of all-weather access as well as
the Transfrontier Park initiative with both Mozambique and Swaziland.
Realising the potential of the Isimangaliso Wetland Park in terms of both the tourism economy as well
as ensuring that the natural asset value is not compromised, particularly given its World Heritage
Status.
The importance of the private conservation initiatives in the region which bring in much needed income
to the economy; this includes the Phinda Reserve, the newly established Zululand Rhino Reserve and
various game farms.
Each of the above will require specific spatial planning responses.
6.4. RECOMMENDATIONS ON GOVERNMENT INTERVENTIONS
6.4.1. SUPPORT CATALYTIC PROJECTS
Support the implementation of “catalytic” projects (or as a first step confirming the feasibility thereof). The
currently identified catalytic projects are:
The Makathini Irrigation Scheme and dryland production: In 2006, the KZN Department of Agriculture
and Environment Affairs commissioned the Makathini Master Plan: Implementation Plan for the
development of the agricultural areas in the two local municipalities of Jozini and uMhlabuyalingana in
the Umkhanyakude District Municipal Area. The principal focus of the Master Plan was agriculture as
“there is a strong interest in agriculture among … residents, and people have a vision where they are
involved in crop and livestock production activities”. Concern in not being able to reach this vision
centred on the lack of capacity to support agricultural development, particularly in the fields of
business management and marketing; as well as concerns over the loss of indigenous crops through
extensive agricultural development in the area. The recommendations made were as follows:
Establishment of up to 10 000 ha of land under irrigation for the production of crops, including cotton
and winter rotation of vegetables as well as fruit trees.
The development of rain-fed cropping systems, mainly on the eastern side of the study area in order to
produce various vegetables at household scale.
The establishment of livestock production cooperatives to develop the commercial livestock industry in
the area, including slaughter and meat processing facilities and a meat marketing system.
Establishment of development nodes at Jozini, Bambanana, Manguzi and Mbazwana which will support
agricultural development in the region.

PSEDS: PROFILING DISTRICT ECONOMIC DRIVERS UMKHANYAKUDE DISTRICT MUNICIPALITY
ISIKHUNGUSETHU
MARCH 2012
34
Establishment of agri-villages at Makathini, ePhondweni and Ndumo to support local agricultural
production.
Development of a supporting infrastructure for agriculture in the region at a projected cost of R857
million. This includes:
The strategic upgrade of roads to improve access to markets.
The establishment of pack houses at the agri-villages and development nodes.
The establishment of a fresh produce market at Makathini for marketing and distributing fresh
produce.
The establishment of a feedlot and improved pastures at KwaZamazama, south of ePhondweni.
The establishment of an abattoir and meat-processing facilities near Bhambanana, and
The implementation of a suitable transport system for moving agricultural produce to markets.
A production scenario was developed to assess the production potential of the area and the following
figures emerged (2006 Makathini Master Plan): A total of R 1.1203 billion could be expected from
agriculture (R 351 million from irrigated crops, R 712 million from rain-fed crops; R 16.6 million from
aquaculture and R 39.8 million from livestock) subject to a capital investment estimate is for development
costs of R 857 million. “It therefore appears that the full-scale implementation of agricultural production
projects in the study area will be a strong motivation for stimulating economic growth in the region and
consequently improving the livelihoods of people living there” (Executive Summary, pp 1 & 2). However, it
is now 2012 and the Makathini scheme and projects did not feature in any of the business interview
feedbacks. It is therefore clear that there must be other factors holding up the implementation of the
plans. Before investing public funds in the proposed infrastructure, there needs to be a thorough
understanding of what the issues are that have prevented this development from realising its potential at
any time in the past 40 years, and what the key issues are that require addressing before millions are spent
on project support infrastructure.
Conservation - Isimangaliso Wetland Park and Transfrontier parks: this is another major catalytic
project in the region – the establishment of Isimangaliso Wetland Park as a World Heritage Site and
setting up internal plans for the park including use zones and rehabilitation of certain areas of the Park.
This initiative needs to be supported and built on as does the Usuthu-Tembe transfrontier conservation
initiative. These are the main attractions for the area.
Lubombo Spatial Development Initiative: this SDI was launched (as a development catalyst) in the mid-
1990s and was responsible for a number of things, most important of which was the upgrading and
alignment of MR 439 into a main, all weather tarred access road from Hluhluwe to KwaNgwanase
(Manguzi). This opened up the eastern areas and created a different dynamic in the region. The efforts
and remaining plans or programmes from the LSDI need to be investigated and supported.
Private sector initiatives: there should be liaison and cooperation between government and the private
sector, particularly those large farming and conservation enterprises that contribute so much towards
the GVA of the district. There are farmers who have offered their services in terms of providing certain
infrastructure. This needs to be investigated further to understand what projects the government can
support in a public-private partnership if they will enhance employment and income levels in the
region.
Formalisation of towns: this has been mentioned as a recommendation of the Makathini Master Plan,
but deserves to be highlighted again. Through such formalisation, municipalities can begin to charge
rates, which will help at least, to secure some local income for infrastructural development. The

PSEDS: PROFILING DISTRICT ECONOMIC DRIVERS UMKHANYAKUDE DISTRICT MUNICIPALITY
ISIKHUNGUSETHU
MARCH 2012
35
message is therefore clear: there is a need to work with existing initiatives and not create any new
institutional frameworks. Support needs to be given to enhance these major projects and programmes
in the district.
The Jozini Dam: although an essential water source for the realisation of the Makathini Master Plan, the
dam has additional eco-tourism potential which is largely unexploited.
Tshaneni Regional Airport at Mkuze: upgrading of the airport will provide an important link for tourism
in the region and allied to that, to business - agriculture and commercial.
An attempt to better understand the potential impact of key initiatives on the District economy is
presented overleaf in Diagram 6.1.

PSEDS: PROFILING DISTRICT ECONOMIC DRIVERS UMKHANYAKUDE DISTRICT MUNICIPALITY
ISIKHUNGUSETHU
MARCH 2012
36
DIAGRAM 6.1: UMKHANYAKUDE ECONOMIC DRIVERS

PSEDS: PROFILING DISTRICT ECONOMIC DRIVERS UMKHANYAKUDE DISTRICT MUNICIPALITY
ISIKHUNGUSETHU
MARCH 2012
37
6.4.2. PLAN FOR LONG TERM GROWTH
Government should support planning for the long term growth of the economy of the area. This long term
planning should include:
Creating a better network of all-weather roads – particularly a central west-east route on the Makathini
Flats;
The upgrading of the rail link;
The establishment of sustainable tourism opportunities in the rural areas linked to the many and varied
existing tourism resources and the natural capital of the area;
The identification and packaging of opportunities for future industrial development mainly based on
agro-processing;
The diversification and expansion of the agricultural sector in the District particularly on the Makathini
Flats with its irrigation potential.
Re-instantly the link between the Mfolosi River and the Isimangaliso Wetland Park.
6.4.3. ADDRESS THE CHALLENGES
The central challenge for the future of the District - and one that effects all plans, programmes and
development projects - will be how to sustain and grow both the agricultural and tourism potential without
destroying the natural resource base on which everybody depends. This district is fairly unique in that its
natural resource base is relatively untouched (at least until about 20 years ago) and it is only recently that
there has been ever increasing pressure on the resources with attendant problems of environmental stress
and degradation (e.g. the drying up of feeder streams around the Kosi Lake System due to cultivation down
into the wetland areas and up to river banks).
This district has probably experienced more research and planning than any other in KZN and yet remains
poor and undeveloped, despite the considerable expenditure already on public infrastructure (the Jozini
dam and associated irrigation infrastructure, the Jozini – Ndumo – KwaNgwanase tar road which was built
in the early 1980s, the Lubombo SDI road – MR439 built in the late 1990’s, the Isimangaliso Wetland Park
infrastructure upgrades) as well as a substantial increase in private initiatives – game lodges,
accommodation establishments etc.
It is critical that any development initiative spends sufficient time beforehand to understand the local
dynamics so that projects can be designed to be appropriate to local conditions. The right balance must be
reached between the desire for development and a better life for its residents, and destroying its main
competitive advantage – its natural environment.
6.4.4. ADDRESS NATURAL RESOURCE CONSTRAINTS
The District has significant economic opportunities by virtue of the prevalence of protected areas and
related tourism facilities and operations. However, all of these protected areas are threatened by the
reduced integrity of natural capital on the basis of the management and manipulation of the river systems
that flow into the District, with two of the three main systems already showing a negative water balance.
In addition to this the presence of alien invasive plants is wide spread, and while this is creating job
PSEDS: PROFILING DISTRICT ECONOMIC DRIVERS UMKHANYAKUDE DISTRICT MUNICIPALITY
ISIKHUNGUSETHU
MARCH 2012
38
opportunities, it is a dynamic that has the potential to significantly impact on the viability of nature-based
tourism operations.
A substantial portion of the District is under subsistence agriculture and such land use practises tend to be
linked with degradation of the natural capital upon which these livelihood strategies are based. Strong
interventions are required to support subsistence based livelihoods and to ensure that they are sustainable.

PSEDS: PROFILING DISTRICT ECONOMIC DRIVERS UMKHANYAKUDE DISTRICT MUNICIPALITY
ISIKHUNGUSETHU
MARCH 2012
39
ANNEXURE A: UMKHANYAKUDE DISTRICT - COMPANY DISTRIBUTION BY SECTOR IN LOCAL
MUNICIPALITIES

PSEDS: PROFILING DISTRICT ECONOMIC DRIVERS UMKHANYAKUDE DISTRICT MUNICIPALITY
ISIKHUNGUSETHU
MARCH 2012
40
LIST: COMPANY DISTRIBUTION IN LOCAL MUNICIPALITY
COMPANY NAME LOCAL PRODUCT CATEGORY
First National Bank Hluhluwe Big Five False Bay Financial Services
Jock Morrison & Sons Big Five False Bay Retail
Mkuze Game Big Five False Bay Tourism Accommodation +
Thanda Private Lodge Big Five False Bay Tourism Accommodation +
Ghost Mountain Inn Jozini Tourism Accommodation +
Jozini Tiger Lodge Jozini Tourism Accommodation +
Mjindi Farms Jozini Farming Services
Senekal Boerdery Jozini Agricultural Commodities
Zululand Rhino Res Jozini Wildlife Tourism
Umfolozi Sugar Mill Mtubatuba Sugar and Related
Kosi Bay Lodge Umhlabuyalingana Tourism Accommodation +
Lala Lapa Lodge Umhlabuyalingana Tourism Accommodation +
Maputaland Lodge Umhlabuyalingana Tourism Accommodation +
Mbazinana Inn Umhlabuyalingana Tourism Accommodation +
Spar Kwangwanase Umhlabuyalingana Retail
Shemula Lodge Umkhanyakude Tourism Accommodation +
Umfolozi Sugar Planters Ltd Umkhanyakude Sugar and Related

PSEDS: PROFILING DISTRICT ECONOMIC DRIVERS UMKHANYAKUDE DISTRICT MUNICIPALITY
ISIKHUNGUSETHU
MARCH 2012
41
ANNEXURE B: ECONOMIC DRIVERS AND THE ENVIRONMENTAL
OPPORTUNITIES AND CONSTRAINTS TO GROWTH
RETAILERS – OPPORTUNITIES AND CONSTRAINTS
OPPORTUNITIES CONSTRAINTS
Embrace the opportunities inherent in the ‘green
economy’ in terms of;
o Ensuring that their own operations are
sustainable, and
o Offering products and services that meet the
objective of the development of a ‘green
economy’.
Engage with agencies that promote sustainability and
enhance operational efficiencies which will reduce
operating costs while providing marketing benefits.
Collectively put pressure on the relevant provincial
government agencies to enhance the condition of the
province’s natural capital to increase resilience and
decrease vulnerability.
Increasing operating costs based on the increasing
costs of accessing potable water.
Infrastructure failure due to flood damage resulting
in transportation limitations for the movement of
stock as well as the inability of staff to get to work.
Increased staff sick leave due to increasing health
problems related to water quality issues.
Increased costs of imports and exports through the
Durban Harbour through increased costs associated
with Transnet having to invest more in dredging
sediments and managing water quality problems.
Limits to growth due to current levels of over-
exploitation of natural capital and increased value of
that which remains untransformed.
BANKING AND FINANCIAL SERVICES – OPPORTUNITIES AND CONSTRAINTS
OPPORTUNITIES CONSTRAINTS
Embrace the opportunities inherent in the ‘green
economy’ in terms of;
o Ensuring that their own operations are
sustainable, and
o Offering products and services that meet the
objective of the development of a ‘green
economy’.
Engage with agencies that promote sustainability and
enhance operational efficiencies which will reduce
operating costs while providing marketing benefits.
Collectively put pressure on the relevant provincial
government agencies to enhance the condition of the
province’s natural capital to increase resilience and
decrease vulnerability.
Ensure the integration of sustainability principles in to
developments through insisting on full risk
assessment and sustainable management in all
development funding applications
Failure to understand the risk that depleted natural
capital places on the sustainability of developments
increases the risk associated with the financing of
such.
Failure to embrace the need to engage with the
‘green economy’ will result in lost marketing
benefits as well as increased operating costs.
Financing un-sustainable developments.

PSEDS: PROFILING DISTRICT ECONOMIC DRIVERS UMKHANYAKUDE DISTRICT MUNICIPALITY
ISIKHUNGUSETHU
MARCH 2012
42
MANUFACTURING – OPPORTUNITIES AND CONSTRAINTS
OPPORTUNITIES CONSTRAINTS
Emergence of the green economy presents an
abundance of new technology that can assist
manufacturing plants to become more efficient and
sustainable.
Sustainable operations offer improved marketing
profiles that provide a competitive advantage.
Reduced operational footprint in terms of energy,
water and waste will increase the lifespan of
manufacturing operations.
Declining access to water of an adequate quality.
Reduced water quantity decreases systems ability to
dilute manufacturing related effluents and increases
the risk of liabilities.
Reduced catchment integrity increases the risk of
flooding for those manufacturing plants adjacent to
large systems like the uThukela.
Agri-processing plants are vulnerable to declining
productivity associated with unsustainable farming
practices.
Movement of processed goods is dependent on the
absence of flood damage to the many river
crossings, either moving north to Richards Bay or
south to eThekwini. The loss of catchment integrity
in the inland sections of the District, as well as in
uMgungundlovu and uMzinyathi, places this
infrastructure at increased risk.
PETROLEUM COMPANIES – OPPORTUNITIES AND CONSTRAINTS
OPPORTUNITIES CONSTRAINTS
Off-set impacts emanating from the off-shore buoy
on the marine and coastal environment by investing
in conservation projects of equal or greater value
than the damaged that has been caused in the past
and that could be caused in the future. Such
conservation projects should be directly related to
the enhancement of natural capital capacity to deal
with potential spillages from this facility.
Invest in R&D associated with alternative and
renewable energy generation.
Invest in technologies that ensure that all
externalities from the refining process are
internalised.
The predicted impacts of climate change,
particularly the rise in sea level and an increased
occurrence of extreme weather events increases the
vulnerability of the off-shoe buoy and the position
of the refineries.
Road and rail routes are vulnerable to extreme
weather events which have the potential of
disrupting the distribution of petroleum products.
To a certain extent, the NMPP may also be
compromised if the crossing of drainage lines has
not been sufficiently adequate to ensure no damage
during times of flooding.
Increased awareness of the environmental
externalities associated with the production and use
of petroleum products especially if this sector
continues to drive ‘business as usual’.

PSEDS: PROFILING DISTRICT ECONOMIC DRIVERS UMKHANYAKUDE DISTRICT MUNICIPALITY
ISIKHUNGUSETHU
MARCH 2012
43
AGRI-PROCESSING – OPPORTUNITIES AND CONSTRAINTS
OPPORTUNITIES CONSTRAINTS
Embrace the opportunities inherent in the ‘green
economy’ in terms of;
o Ensuring that their own operations are
sustainable, and
o Offering products and services that meet the
objective of the development of a ‘green
economy’.
Engage with agencies that promote sustainability and
enhance operational efficiencies which will reduce
operating costs while providing marketing benefits.
Collectively put pressure on the relevant provincial
government agencies to enhance the condition of the
province’s natural capital to increase resilience and
decrease vulnerability.
Increasing operating costs based on the increasing
costs of accessing potable water.
Infrastructure failure due to flood damage resulting
in transportation limitations for the movement of
stock as well as the inability of staff to get to work.
Increased staff sick leave due to increasing health
problems related to water quality issues.
Increased costs of imports and exports through the
Durban Harbour through increased costs associated
with Transnet having to invest more in dredging
sediments and managing water quality problems.
Limits to growth due to current levels of over-
exploitation of natural capital and increased value of
that which remains untransformed.
AGRICULTURE – OPPORTUNITIES AND CONTRAINTS
OPPORTUNITIES CONSTRAINTS
SUGAR
Job creation through natural capital restoration work,
particularly regarding the eradication of alien invasive
plants, reclamation of wetlands, and natural
rehabilitation of soils, i.e. reinstating the organic
matter content.
The removal and rehabilitation of areas currently
under unpermitted plantations.
The release of water, previously consumed by
plantations, to alternative uses (including the
ecological reserve) downstream, especially estuaries.
Through the introduction of more sustainable
operations, agro-chemical loads leached into river
systems will decline.
Decreased production costs through the
implementation of sustainable farming principles.
Improved marketing opportunities through
association and implementation of sustainable
farming programmes.
Unsustainable change to natural soil characteristics,
e.g. loss of nutrients, loss of soil fauna, change in
chemical composition and structure, leading to the
loss of opportunities for alternative productive land
use and rehabilitation potential.
Upstream water reduction activities, i.e. timber and
sugar plantations, are placing constraints on
downstream capacity for economic expansion.
Stream reduction decreases dilution capacity of river
systems and therefore exacerbates downstream
water quality issues which translates into increased
health risks and treatment costs.
Reduced water quantity limits downstream
abstraction opportunities.
Increased sediment loads from cleared
compartments and road networks resulting in loss of
natural capital integrity.
No further land available for expansion of the
industry.
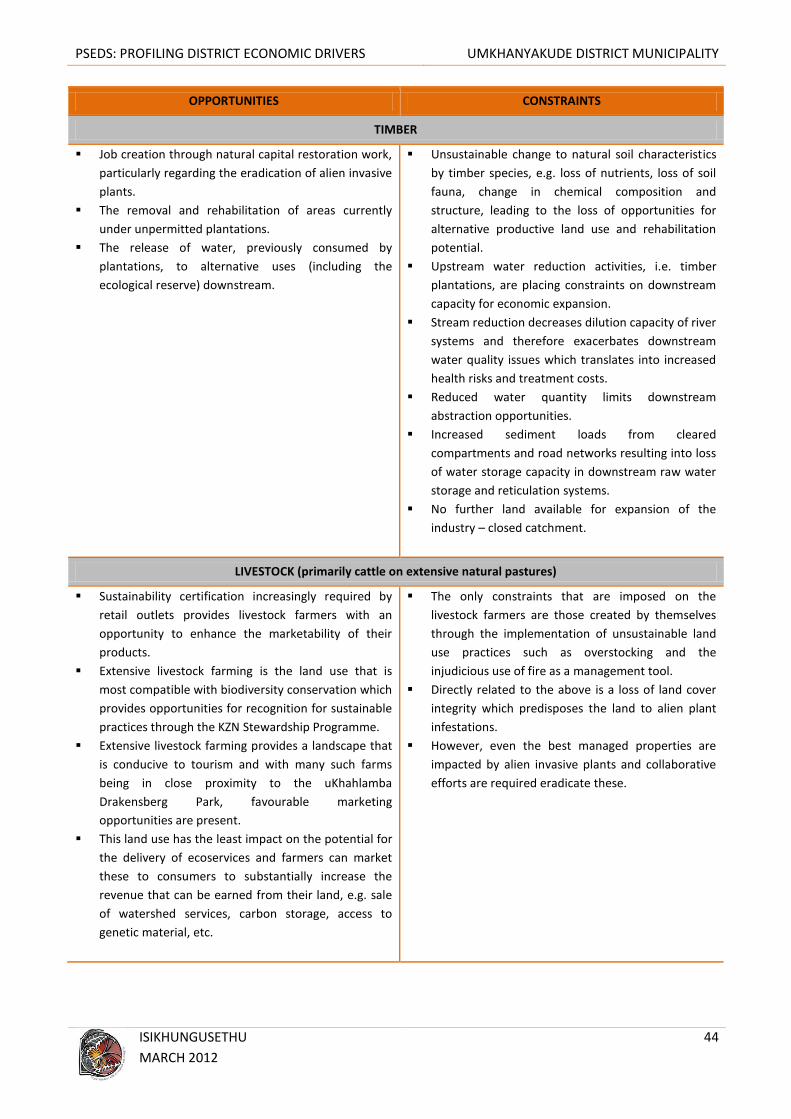
PSEDS: PROFILING DISTRICT ECONOMIC DRIVERS UMKHANYAKUDE DISTRICT MUNICIPALITY
ISIKHUNGUSETHU
MARCH 2012
44
OPPORTUNITIES CONSTRAINTS
TIMBER
Job creation through natural capital restoration work,
particularly regarding the eradication of alien invasive
plants.
The removal and rehabilitation of areas currently
under unpermitted plantations.
The release of water, previously consumed by
plantations, to alternative uses (including the
ecological reserve) downstream.
Unsustainable change to natural soil characteristics
by timber species, e.g. loss of nutrients, loss of soil
fauna, change in chemical composition and
structure, leading to the loss of opportunities for
alternative productive land use and rehabilitation
potential.
Upstream water reduction activities, i.e. timber
plantations, are placing constraints on downstream
capacity for economic expansion.
Stream reduction decreases dilution capacity of river
systems and therefore exacerbates downstream
water quality issues which translates into increased
health risks and treatment costs.
Reduced water quantity limits downstream
abstraction opportunities.
Increased sediment loads from cleared
compartments and road networks resulting into loss
of water storage capacity in downstream raw water
storage and reticulation systems.
No further land available for expansion of the
industry – closed catchment.
LIVESTOCK (primarily cattle on extensive natural pastures)
Sustainability certification increasingly required by
retail outlets provides livestock farmers with an
opportunity to enhance the marketability of their
products.
Extensive livestock farming is the land use that is
most compatible with biodiversity conservation which
provides opportunities for recognition for sustainable
practices through the KZN Stewardship Programme.
Extensive livestock farming provides a landscape that
is conducive to tourism and with many such farms
being in close proximity to the uKhahlamba
Drakensberg Park, favourable marketing
opportunities are present.
This land use has the least impact on the potential for
the delivery of ecoservices and farmers can market
these to consumers to substantially increase the
revenue that can be earned from their land, e.g. sale
of watershed services, carbon storage, access to
genetic material, etc.
The only constraints that are imposed on the
livestock farmers are those created by themselves
through the implementation of unsustainable land
use practices such as overstocking and the
injudicious use of fire as a management tool.
Directly related to the above is a loss of land cover
integrity which predisposes the land to alien plant
infestations.
However, even the best managed properties are
impacted by alien invasive plants and collaborative
efforts are required eradicate these.

PSEDS: PROFILING DISTRICT ECONOMIC DRIVERS UMKHANYAKUDE DISTRICT MUNICIPALITY
ISIKHUNGUSETHU
MARCH 2012
45
OPPORTUNITIES CONSTRAINTS
DAIRY
Generation of energy from waste, e.g. biogas.
Rural nature of the operation lends itself to a
diversification through the introduction of farm-based
tourism opportunities.
Enhanced operation efficiencies lend themselves to
recognition and certification thus providing improved
marketability and access to discerning and
sustainable markets
Reduced access to water for irrigation of pastures as
well as for the milking process through the loss
catchment integrity.
Potential liability for impacts on water quality
downstream of farm based on the leaching of agro-
chemicals from irrigated pastures, as well as from
the dairy operations themselves, i.e. eutrophication.
COMMERCIAL CROPS (Irrigated and dryland)
Job creation through natural capital restoration
work, particularly regarding the eradication of alien
invasive plants, reclamation of wetlands, and natural
rehabilitation of soils, i.e. reinstating the organic
matter content.
The removal and rehabilitation of areas currently
under unpermitted crops.
The release of water, previously consumed by crops,
to alternative uses (including the ecological reserve)
downstream.
Through the introduction of more sustainable
operations, agro-chemical loads leached into river
systems will decline.
Decreased production costs through the
implementation of sustainable farming principles.
Access to water through reduced catchment integrity
upstream of farms.
Loss of arable land through accelerated erosion and the
spread of alien invasive plants.
Reduced soil fertility through excessive crop production
leading to a reduction in productivity and increased
operating costs.
Reduced water holding capacity of the soil due to
unsustainable farming practices
SUBSISTENCE AGRICULTURE
Carefully selected portions of Ingonyama Trust land
which have the potential to support both subsistence
and small holder commercial production.
The high levels of unemployment need to be
converted into high levels of occupation related to
food production, processing and marketing.
The enhancement of current communal land
management systems by introducing value to
different types of land use (PDA).
Well managed communal lands will present an
attractive landscape that has the potential to host a
variety of tourism operations, e.g. the Umgano
Project.
Communal tenure and unplanned land allocation
systems.
Concentration of existing subsistence agriculture
and settlement activities within inappropriate
locations, e.g. wetlands and flood plains.
Poor land use practices leading to accelerated soil
loss, the spread of alien invasive plants and the loss
of natural capital.
The overriding cultural significance of the cultural
value of livestock which prevents sustainable
management thereof with resultant over-grazing
and associated impacts.

PSEDS: PROFILING DISTRICT ECONOMIC DRIVERS UMKHANYAKUDE DISTRICT MUNICIPALITY
ISIKHUNGUSETHU
MARCH 2012
46
TOURISM – OPPORTUNITIES AND CONSTRAINTS
OPPORTUNITIES CONSTRAINTS
Environmental accreditation programmes such as the
‘Blue Flag Beach’ programme offers significant
benefits by acting as an added attraction to a market
that is becoming increasingly aware of environmental
issues and standards.
Reinstate natural capital along the coastline such as
dune, flood plain and estuarine vegetation to increase
the diversity of attractions and the resilience of the
coastline and associated infrastructure.
The coastline has been significantly transformed by
linear urban development and has lost much of
natural features which cause the loss of appeal and
well as increased vulnerability to extreme weather
events.
The concentration of industry, commerce and
residential developments along the coast and rivers
increases the threat of water quality issues and the
loss of tourism revenues.
Unchecked land transformation and degradation
continues to impact on catchment integrity with
resultant loss of watershed services and reduced
viability for the maintenance of standards required
to meet accreditation standards.
Predicted climate change related impacts such as
the rise in sea level and increased incidents of
extreme weather events places significant
constraints on both existing and potential new
tourism infrastructure.
OPPORTUNITIES CONSTRAINTS
Proximity to the uKhahlamba Drakensberg Park World
Heritage Site.
Linkages with Lesotho through the Maloti
Drakensberg Transfrontier Project and the Maloti
Drakensberg Route.
The bulk of the landscape still untransformed or
hosting agricultural activities which lend themselves
to an aesthetic appeal for a diversity of tourism
attractions.
Extreme topography, clean air and relatively clean
water make the area attractive to major sporting
events such as the Drak Challenge and the Sani2Sea.
Cultural Heritage features such as the Reichenau
Mission add to the diversity of attractions.
Unsustainable land management outside of the
uKhahlamba Drakensberg Park World Heritage Site
quickly reduces the quality of natural capital and its
ability to deliver ecoservices such as clean water.
The virulent spread of alien invasive plants.
Cross-border crime detracts from an enabling and
attractive environment to accommodate tourism
activities and operations.
PSEDS: PROFILING DISTRICT ECONOMIC DRIVERS UMKHANYAKUDE DISTRICT MUNICIPALITY
ISIKHUNGUSETHU
MARCH 2012
47
GOVERNMENT – OPPORTUNITIES AND CONTRAINTS
OPPORTUNITIES CONSTRAINTS
The application of NRM and EPWP (Extended Public
Work Programme) funds to address threats to natural
capital integrity such as the eradication of alien
invasive plants and the restoration of erosion gullies,
thus generating ‘green jobs’.
The creation of an enabling environment for and
facilitating the implementation of green technologies
such as rain water harvesting and biogas generation
for both disadvantaged communities as well as
commercial operations.
Increased ability to deliver basic services through
improved condition of natural capital and the delivery
of ecoservices such as clean water, increased winter
base flows, reduced flood risk, access to medicinal
plants natural building material and fuel wood.
Decreased health risks through improved catchment
integrity as discussed above, as well as improved air
quality.
Local government capacity in terms of natural
capital management.
Limited cooperative governance capacity required
across local government boundaries, across Depts.
as well as across sectors.
The virulent spread of alien invasive plants.
Unsustainable land use practices that dominate the
District.
Cross-border crime, primarily the theft of livestock
places this land use in jeopardy and in danger of
being replaced by more unsustainable options, as
well as impacting on tourism and sound natural
capital management.
MINING - OPPORTUNITIES AND CONTRAINTS
OPPORTUNITIES CONSTRAINTS
IDWALA CARBONATES
The mine has the opportunity of engaging with
upstream land owners and users with a view to
improving catchment integrity that will increase
winter base flow in both river systems and decrease
potential liability from pollution caused by storm
water runoff from their site.
Loss of catchment integrity upstream from their
operation makes them vulnerable to flooding
considering their position immediately adjacent to
and within the floodplain for the Umzimkulwana
River.
Close proximity to the mouth of the river system
increases the risk of liability for water quality issues
associated with their operations.
The loss of riparian vegetation translates into the
loss of an important buffer between their
operations and the river.


![Data Profiling Guide - start [Gerardnico] · PDF fileData Profiling Guide. Informatica PowerCenter Data Profiling Guide ... available at http:](https://static.documents.pub/doc/80x56/5aa4fb3a7f8b9ab4788c93d6/data-profiling-guide-start-gerardnico-profiling-guide-informatica-powercenter.jpg)


