Annual Report / Masterpieces We are passionate about creating fine chocolates. And our technical advisers, all of them trained pastry chefs, take pride in sharing their extensive know-how and boundless creativity with our artisan customers at our 13 Chocolate Academies located around the world. Their masterpieces, a delight for both the eye and the palate, are showcased in this annual report.
Transcript
Annual Report
2009
/10
MasterpiecesWe are passionate about creating fine chocolates.And our technical advisers, all of them trainedpastry chefs, take pride in sharing their extensiveknow-how and boundless creativity with ourartisan customers at our 13 Chocolate Academieslocated around the world. Their masterpieces,a delight for both the eye and the palate, areshowcased in this annual report.
IBrief
Strong year,dynamic growth:sales volume +7.6%, EBIT+7.9%*, net profit 13.5%*
Barry Callebaut is organized into different regions: Region Europe (incl. Western andEastern Europe), Region Americas and Region Asia-Pacific. The globally managed GlobalSourcing & Cocoa business is reported as a separate segment like a region. There arefour different product groups: Cocoa Products, Food Manufacturers Products, Gourmet &Specialties Products and Consumer Products.
Europe Asia-PacificAmericas Global Sourcing &Cocoa
Food Manufacturers,Gourmet, Consumer
57.7% of consolidatedsales volume
Food Manufacturers,Gourmet
22.3% of consolidatedsales volume
+4.1%
+8.3%
+15.6%
+6.3%
Volume growth vs.prior year
EBIT growth vs.prior year(in local currencies)
Food Manufacturers,Gourmet
3.7% of consolidatedsales volume
Cocoa
16.3% of consolidatedsales volume
+15.5%
+87.6%1
+8.2%
+5.4%1 Excluding one-off gain on the sale of the Asian Consumer business in the prior year.
3Key figures Barry Callebaut Group
Barry Callebaut AGSPI Swiss Performance Index
SPI Small & Mid-Cap IndexDow Jones Euro Stoxx Food & Beverage Index
for the fiscal year ended August 31, 2009/10 2008/09Change (%)
in localcurrencies
in reportingcurrency
Income statementSales volume Tonnes 7.6% 1,305,280 1,213,610Sales revenue CHF m 11.3% 6.8% 5,213.8 4,880.2EBITDA1 CHF m 5.8% 3.2% 470.7 456.1Operating profit (EBIT) CHF m 7.9% 5.6% 370.4 350.8Net profit for the year CHF m 13.5% 10.9% 251.7 226.9Cash flow2 CHF m 9.5% 457.8 418.1EBIT per tonne CHF 0.3% (1.8%) 283.8 289.1
Balance sheetTotal assets CHF m 1.6% 3,570.8 3,514.8Net working capital3 CHF m (4.5%) 964.9 1,010.1Non-current assets CHF m (1.8%) 1,405.8 1,432.2Net debt CHF m (7.6%) 870.8 942.7Shareholders’ equity4 CHF m 3.7% 1,302.3 1,255.6
RatiosEconomic value added (EVA) CHF m 13.7% 147.7 129.9Return on invested capital (ROIC)5 % 14.8% 13.9%Return on equity (ROE) % 19.6% 18.1%Debt to equity ratio % 66.9% 75.1%
SharesShare price at fiscal year end CHF 22.5% 703 574EBIT per share (issued) CHF 5.6% 71.6 67.8Basic earnings per share6 CHF 10.5% 48.6 44.0Cash earnings per share7 CHF 9.3% 88.6 81.1Payout per share8 CHF 12.0% 14.0 12.5
OtherEmployees 0.3% 7,550 7,525
1 EBIT+depreciation of property, plant and equipment+amortization of intangible assets2 Operating cash flow before working capital changes3 Includes current assets and liabilities related to commercial activities and current provisions4 Total equity attributable to the shareholders of the parent company5 EBIT x (1–effective tax rate)/average capital employed6 Based on the net profit for the year attributable to the shareholders of the parent company/basic shares outstanding
7 Operating cash flow before working capital changes/basic shares outstanding8 Par value reduction instead of a dividend; 2009/10 as proposed by the Board of Directorsto the Annual General Meeting
Sales revenue CHF m 5.1% 0.6% 1,534.6 1,525.7Gourmet & Specialties Products CHF m 19.4% 14.3% 707.6 619.0Consumer Products CHF m (4.6%) (8.8%) 827.0 906.7
EBITDA CHF m 1.8% (1.1%) 183.1 185.2EBIT CHF m 1.9%3 (0.8%)3 146.0 147.2
1 Certain comparatives have been reclassified to conform with the current period’s presentation2 +87.6% in local currencies (+85.0% in CHF) excl. the one-off gain on the sale of the AsianConsumer business in prior year
3 +16.0% in local currencies (+12.9% in CHF) excl. the one-off gain on the sale of the AsianConsumer business in prior year
6
Based on Barry Callebaut’s financial targets for the period 2009/10 through 2012/131,the company aims to significantly outperform the global chocolate market. BarryCallebaut’s ambitious growth strategy is based on three pillars: expansion, innovationand cost leadership.
Strategy
Expansion Barry Callebaut intends to accelerate the growth of its Gourmet business.With regard to the industrial customers, the company wants to strengthen its position inthe mature markets ofWestern Europe and North America.In recently entered emerging markets like Russia, China, Japan, Mexico and Brazil, BarryCallebaut aims to develop their full potential. Lastly, the company will carefully evaluatehow to enter other emerging markets.Implementing existing outsourcing volumes and strategic partnerships as well as securingfurther outsourcing deals with regional and local food manufacturers will remain anessential part of the business strategy.
Innovation Barry Callebaut is recognized as the reference for innovation in the chocolate industry.Dedicated R&D teams around the world focus on two different areas: Fundamentalresearch into the health-enhancing properties of the cocoa bean and pro-active researchand development leading to cutting-edge cocoa and chocolate products such as thedevelopment of the Controlled Fermentation technology. The applied R&D teams, on theother hand, support customers to improve their products and recipes as well as theirproduction processes on their own production lines.In total, Barry Callebaut’s R&D department manages about 1,750 projects, runs almost7,600 trials and conducts more than 400 technical visits with its customers every year.
Cost leadership Cost leadership is an important reason why for example international customers out-source chocolate production to Barry Callebaut. The company is continuously improvingits operational efficiency by upgrading the technology and achieving higher scale effectsthrough better capacity utilization, by optimizing product flows, logistics and inventorymanagement, as well as by reducing energy consumption and lowering fixed costs. Intotal, manufacturing costs per tonne in fiscal year 2009/10 were reduced by another 5%(in local currencies).
1 These targets are on average 6–8% volume growth per annum and average EBIT growth in local currencies at least in line withvolume growth – barring any major unforeseen events.
7Highlights
December 2009Barry Callebautcompleted the acqui-sition of the Spanishchocolate makerChocovic, S.A., specializ-ing in specialty productsfor industrial andartisanal customers.
January 2010Launch of multiple-certification project –UTZ, Rainforest Allianceand other productcertification labels –with cocoa farmercooperatives in IvoryCoast in responseto market needs andtrends.
March 2010Barry Callebaut andthe Malaysian CocoaBoard signed a Mem-orandum of Under-standing on a collabor-ative research projectto increase the value ofMalaysian cocoa beanswith the ControlledFermentation method.
May 2010Barry Callebautinaugurated a newchocolate factorylocated in Extrema,Minas Gerais, nearSão Paulo, Brazil – thecompany’s first choc-olate factory in SouthAmerica.
During theWorldExhibition in ShanghaifromMay until October,Barry Callebaut actedas the unique supplierto Godiva, Neuhaus andGuylian at the BelgianChocolate Corner.
August 2010Barry Callebaut extend-ed the successful farmerprogram “QualityPartner Program” (QPP)from Ivory Coast tococoa-farming regionsin Cameroon, the fourthlargest cocoa producerin Africa.
September 2010Barry Callebaut signeda long-term global sup-ply agreement withKraft Foods Inc., makingBarry Callebaut thekey global cocoa andindustrial chocolatesupplier to the world’ssecond largest foodcompany.
Barry Callebaut has made significant investments in building a foundationfor continued success. This fiscal year was marked by milestones that set thestage for superior performance and growth in the future.
8
Our visionBarry Callebaut is the heart and engine of the chocolate industry.
Our goal is to be No. 1 in all attractive customer segments and in all major worldmarkets.
Our heritage, our knowledge of the chocolate business – from the cocoa bean tothe finest finished products –make us the business partner of choice for the entire foodindustry, from individual artisans to industrial manufacturers and global retailers.
We seek to apply our constantly evolving expertise to helping our customers growtheir businesses, and we are passionate about creating and bringing to market new,healthy products that taste good, delight all senses, and are fun to enjoy.
Our strength comes from the passion and expertise of our people for whom westrive to create an environment where learning and personal development is ongoing,entrepreneurship is encouraged, and creativity can flourish.
Our valuesCustomer focus By anticipating market trends and investing time and effort to fully
understand customer needs, we go to great lengths to provide products and solutions ofsuperior value through a business partnership with every customer that is characterizedby professionalism and mutual trust.
Passion Our pride in what our company does inspires and motivates us to give ourbest at work. We are eager to learn about our business and to share our know-how andenthusiasm with others.
EntrepreneurshipWith the goal to create superior customer value, we constructivelychallenge the status quo and explore opportunities to innovate: new eating trends, newmarkets, new ideas for products and services, and new ways of doing business. We arewilling to take controlled risks and are determined to persevere.
Team spiritWhether in the field, on the shop floor or in administration –we are oneteam, sharing a common purpose and common goals. All members of this team activelyengage in open communication and idea sharing and are committed to working togetherto achieve our common goals across the whole organization.
IntegrityWe show respect for our fellow teammembers and all our stakeholders andare honest, trustworthy, and open-minded in all our business activities and relationships.We live up to high ethical standards that promote fairness, equality, and diversity.
As a food manufacturer, Barry Callebaut has a funda-mental responsibility to ensure the safety and qualityof our products. As an international company withoperations in 26 countries, we recognize that ourbusinesses have an influence on the livelihoods ofmany people around the world. Accordingly, westrive to contribute responsibly to the communitieswhere we operate.
][
Vision and values
9
Barry Callebaut, headquartered in Switzerland, resulted from the merger betweenBelgian chocolate producer Callebaut and French chocolate maker Cacao Barry in 1996.The merger combined Cacao Barry’s know-how in procurement and initial processingof cocoa beans with Callebaut’s extensive experience in producing and marketingchocolate products. Since 1998, Barry Callebaut has been listed on the SIX SwissExchange.
Today, the company is a fully integrated chocolate company with a global presence.It provides comprehensive chocolate solutions to the entire food industry. As theoutsourcing partner of choice, Barry Callebaut has an estimated 40% share of volumesin the open market. It is present in 26 countries, currently operates 43 productionfacilities, employs about 7,500 people and generated sales of CHF 5.2 billion in fiscalyear 2009/10.
1999 Acquisition of Carma AG in Switzerland2002 Acquisition of the Stollwerck Group in Germany2003 Acquisition of Dutch Group Graverboom B.V. (including Luijckx B.V.)2003 Acquisition of Brach’s Confections Holding, Inc. in the U.S.2004 Acquisition of the vending mix business of AM Foods in Sweden2005 Opening of a chocolate factory in California, U.S.2007 Opening of a chocolate factory in Chekhov, Russia2007 Divestment of Brach’s Confections Holding, Inc., U.S.2007 Signing of major long-term outsourcing contracts with Nestlé,
Hershey’s and Cadbury2007 Acquisition of a cocoa factory in Pennsylvania, U.S.2008 Opening of a chocolate factory in Suzhou, China2008 Opening of a sales office and Chocolate Academy in Mumbai, India2008 Acquisition of a 60% stake in KLK Cocoa in Malaysia2008 Sale of African Consumer business2008 Opening of four Chocolate Academies in Suzhou, China;
Zundert, The Netherlands; Chekhov, Russia; and Chicago, U.S.2008 Acquisition of IBC, specialist in decorations, in Kortrijk-Heule, Belgium2008 Outsourcing agreement with Morinaga in Japan and start of
production in new factory2008 Acquisition of a 49% stake in Biolands, Tanzania2009 Opening of a chocolate factory in Monterrey, Mexico2009 Sale of Asian Consumer business to Hershey’s2009 Distribution agreement signed with Bunge Alimentos in Brazil2009 Acquisition of Danish vending mix company Eurogran2009 Acquisition of Spanish chocolate maker Chocovic, S.A.2010 Opening of a chocolate factory in Extrema, Brazil2010 Signing of a major global supply agreement with Kraft Foods Inc.
136 Contacts, Financial calendar and Forward-looking statement
Q The global chocolatemarket declined for the first time inmore than a decade in the pre-viousfiscal year. Has it returned to positive growth and howdid Barry Callebaut performunder the given market conditions?
Andreas Jacobs, Chairman Until April 2010, the global chocolate confectionery market was flat in volume terms.Thereafter, it began to recover but, with a slight plus of 0.3%,1 it has still not returnedto its previous long-term average growth rate of 2–3%per year.Our industry was facedwith volatile and high rawmaterial prices.Barry Callebaut navigated very well throughthese challenges:At +7.6%,our sales volume again significantly outperformed the glob-al chocolate market. Despite the continued pressure from the combined cocoa ratio2
on profitability, we generated a strong operating profit growth of 7.9% in local curren-cies (+5.6% in CHF) and achieved an excellent net profit growth of 13.5% (+10.9%in CHF).
Q What were the most important factors in reaching your targets amid such a challeng-ing market environment?
Juergen B. Steinemann, CEO First and foremost, we have a strong global footprint, which makes us an attractivepartner for our international customers as we can serve them with a comprehensiverange of products around the world. Besides that, we can offer a broad range of prod-ucts to regional customers.We clearly benefited from our targeted expansion to emerg-ing chocolate markets,most of which performed very well. Emerging markets will be-come increasingly important in compensating for lower growth rates in more maturemarkets. In our Gourmet business we have powerful international brands withCallebaut and Cacao Barry that offer great chocolate products with convenient appli-cations. Last but not least, our cost leadership as well as our innovation power roundoff all these success factors.
Q Do you see any need to reprioritize your corporate strategy?AJ The past two truly challenging years confirmed that our strategy has served us well in
growing and developing our business.Therefore, we do not see the need for a revolu-tion but rather an evolution: One of our strategic pillars, “geographic expansion”, wasin particular need of some fine-tuning because we also see opportunities to expand inscale, breadth and depth.We intend to accelerate the growth of our Gourmet business.With regard to industrial customers, we want to strengthen our position in the maturemarkets of Western Europe and North America. In the emerging markets that wehave recently entered, we aim to develop their full potential. Lastly, we will carefullyevaluate how to enter other emerging markets. Implementing existing outsourcing
Strong year with dynamic top- andbottom-line growth
12 Interview with theChairman and the CEO
Market conditions in fiscal year 2009/10 were challenging with a still rather fragileworld economy, a flat global chocolate market, high raw material prices and importantcurrency fluctuations. Barry Callebaut’s growth strategy, together with a robust businessmodel, efficiency gains as well as tight cost control allowed the company to achieve topresults: sales volume up 7.6%, EBIT +7.9% and net profit +13.5% (both in local currencies).Barry Callebaut will further refine its existing growth strategy in order to broaden as wellas deepen the expansion of its business.
1 Source: Nielsen, September 2009–August 20102 The (forward) combined cocoa ratio is the combined sales price for cocoa butter and cocoa powder relative to the cocoa bean price.
volumes and strategic partnerships as well as securing further outsourcing deals withlocal and regional food manufacturers will remain an essential part of our businessstrategy.
Q You mentioned Gourmet as one of your key growth areas. Can you tell us more aboutyour strategy going forward?
JBS We intend to further strengthen the global leadership of our Gourmet & Specialtiesbusiness. It is very different from our industrial business:We are talking about differ-ent customers, needs, products, and market mechanisms.We are now in the process ofcombining the best of both worlds, i.e. we are positioning our Gourmet business as“ independent from but interdependent”with our industrial business.This means thatwe have appointed dedicatedmanagement teams inWestern Europe andNorthAmer-ica, our biggest markets,who will get their own profit and loss responsibility within theRegion to even better steer the implementation of the Gourmet strategy. We willbetter segment the different customer groups andmarkets and adapt our product rangeto meet their needs.At the same time, Gourmet will remain interdependent with theGroup’s industrial factories and benefit from their scope and manufacturing efficien-cy. Looking further ahead, we will develop Callebaut and Cacao Barry into globalGourmet brands and build our marketing activities around them.
Q You recently announced that Barry Callebaut had become Kraft Foods’ key cocoa andindustrial chocolate supplier. Do you still see outsourcing and strategic partnerships asa trend?
JBS Weare very pleased about this major long-term partnership agreement with the world’ssecond largest food company. It is our first global agreement and the first one thatinvolves our entire value chain.We were only able to secure it by making a coordinat-ed team effort across all regions, functions and product groups – and because we arefully dedicated to cocoa and chocolate.This contract confirms the trend towards out-sourcing and long-term partnership agreements. However, we are not only focusingon gaining large, global volumes; we are also keen on securing long-term contractswith major local or regional food manufacturers.
Interview with the 13Chairman and the CEO
“We do not see the need for a revolution but rather anevolution of our strategy. One of our strategic pillars,‘geographic expansion’, was in particular need of somefine-tuning because we also see opportunities toexpand in scale, breadth and depth.”
Andreas JacobsChairman of the Board of Directors
Q There is increasing concern over insufficient cocoa supplies. Do you share these concerns?AJ We still see a lot of unsustainable agricultural practices,mainly inWestAfrica, that have
led to lower yields and quality. To address this situation, we started working directlywith cooperatives and are training cocoa farmers on how to improve crop yields andquality:We initiated our very own Quality Partner Program (QPP) in Ivory Coast in2005 and recently extended it to Cameroon. We are a major shareholder in someother farmer programs:Biolands inTanzania and Bio United in Sierra Leone.Beyondthat, our new, unique Controlled Fermentation method will give us access to superior-quality cocoa beans and increase yields.
Q Your activities seem to focus primarily on the quality of the cocoa beans – but not onworking practices. What are you doing to eliminate child labor on cocoa farms?
AJ Wedo not own any cocoa farms but we fully acknowledge our responsibility.We strong-ly condemn slavery and abusive labor practices that exploit children or put them in ahazardous or harmful work environment.We believe that poverty is the main reasonwhy farmers resort to abusive child labor practices.We are convinced that improvingcocoa farmer livelihoods is imperative in the fight against poverty. For a decade,Barry Callebaut has been working in concert with other leading companies and inde-pendent organizations to improve the social conditions of cocoa farmers.We will notbe able to end poverty in Africa by ourselves but we can contribute to a bettermentof the situation – and with our active presence in these countries and our programswe will continue to do so.
Q What key trends do you see in the chocolatemarket, andwithwhat kind of innovationswill you respond to them?
JBS As many of our customers are currently struggling to pass the high raw material costson to retailers, we see a strong move towards cost-efficient product solutions and agrowing interest in compounds and fillings, areas where we have expanded our offer-ing.Health-conscious consumers want more permissibility when eating chocolate. Forthis growing group, we offer applications that are free from allergens, for example, orthat contain higher levels of cocoa flavanols as well as functional ingredients.We havea full range of rebalanced chocolate – alternatives with less fat, sugar and calories.Werecently launched three innovations: A reformulated 100% dairy-free alternative tomilk chocolate, the first chocolate with Stevia – a natural sugar substitute withouta laxative effect –, as well as the first batches of chocolate based on Controlled Fer-mentation for premium chocolatiers.
Q What does Barry Callebaut do to attract and retain qualified employees to support itsgrowth ambitions?
AJ Themost important resourcewe have inmaking high performance happen is our people.It is our aim to give all employees a chance to realize their full potential by offeringthem opportunities to broaden their skills and experiences and by providing them struc-
14 Interview with theChairman and the CEO
Interview with the 15Chairman and the CEO
“Our strategic priorities will be accelerating the growthof our Gourmet business, implementing recent out-sourcing and strategic partnership agreements, settingthe stage for the next wave of geographic growth inemerging markets, and enhancing our organizationalstructures for further successful growth.”
tured feedback on their performance. While we want to continue to attract talentedpeople from outside to bring in new ideas, we are committed to developing more ofour future leadership from within.
At this point, I would like to thank all our employees for their excellent work.Withouttheir great dedication to our company, we would not have been able to achieve thesegratifying results. Sincere thanks also go to our highly esteemed customers and share-holders.
Q What challenges do you see for the coming fiscal year 2010/11, and can you confirm yourperformance targets?
JBS We are cautiously optimistic with regard to the economic situation.We believe thatgrowth will continue to pick up even though the pace of recoverymight vary geograph-ically. As a consequence, we assume that the global chocolate market will only growapproximately 1–2%, i.e. still below the long-term average of 2–3% per annum.Weexpect raw material prices to stay above the historical averages and to remain vola-tile. Our strategic priorities will be accelerating the growth of our Gourmet business,implementing recent outsourcing and strategic partnership agreements, setting thestage for the next wave of geographic growth in emerging markets, and enhancing ourorganizational structures for further successful growth.We will also focus on securingour long-term supply of cocoa beans, the foundation of our business. With our fine-tuned strategy, we are confident that we will be able to achieve our financial targets3
for the extended period 2009/10 through 2012/13.
3 These targets are on average 6–8% volume growth per annum and average EBIT growth in local currencies at least in line with volume growth –barring any major unforeseen events.
Juergen B. SteinemannChief Executive Officer
Philippe Vancayseele, Master Pastry Chef, Chocolate AcademyWieze, Belgium:“Making pralines in the ‘Chocolate Corner’ of the Belgian pavilion at theWorld Expo2010 in Shanghai, China, will remain a lasting memory for me. We received about30,000 visitors every day. Asians are crazy about good quality chocolate; many camejust for one praline! TheWorld Expo was a unique opportunity for us to delightmillions of Asian consumers with our fine Belgian chocolates.”
18 Board of Directorsand Executive Committee
Board of Directors and Executive Committee
Additional information:www.barry-callebaut.com/organization and www.barry-callebaut.com/board
Board of Directors
Andreas Jacobs, Chairman
Andreas Schmid, Vice Chairman
Rolando Benedick
James L. Donald
Markus Fiechter
Stefan Pfander
UrsWidmer
General Counsel & Corporate Secretary
RolandMaurhofer
The Board of Directors proposes to the Annual General Meeting of the Shareholders thatJakob Baer be elected as newmember of the Board of Directors.
Philippe Bertrand, Master Pastry Chef and decorated as “Meilleur Ouvrier de France”,Chocolate Academy Meulan, France: “The latest trends are crunchy, fondant anda dash of ‘exotic’ ingredients, such as Yusu, a Japanese citrus fruit, Matcha green tea orWasabi. I am sure they will be associated with speciality chocolates such as plantationand origin chocolates. On the other hand, chocolate products with a long history or thatare associated with a family of cocoa growers are also being discovered.”
Europe – Strong performance amidstchallenging market conditions
“After bottoming out by the end of calendar year 2009, the chocolate confectionerymarkets inWestern Europe saw a stagnating first semester followed by a second halfwith slightly increasing consumption – Eastern Europe still shows negative growthrates. Thanks to our strong footprint in most of the European countries as well as ourbalanced portfolio ranging from artisanal Gourmet customers to large corporateaccounts, we weathered the challenging economic environment with adverse currencyeffects and fierce competition in our Food Manufacturers business very well.”
In total, Barry Callebaut increased its sales volume in Region Europe by 4.1% to753,011 tonnes. In local currencies, sales revenue outperformed the volume growth(+4.8%), but was negatively affected by currency translation effects and decreased toCHF 3,042.0 million or by 0.5% in CHF. Operating profit (EBIT) in the region rosestrongly to CHF 268.7 million, up 8.3% in local currencies (+6.3% in CHF), thanks toefficiency gains, slight margin improvements and strict cost control.
Overall, themajor chocolate confectionerymarkets inWestern Europe reported a 0.9%growth rate led by Germany (+2.3%) and Italy (+1.6%), while the U.K. and Franceslightly contracted. Eastern Europe showed a drop of 5.3%, driven by declines inRussia (–7.4%) and Ukraine (–10.7%).1
Western Europe – Particularly successful in specialties productsIn the FoodManufacturers business,we saw very strong growth in our decorations busi-ness and increasing demand for nut and specialties products as well as for compoundsand fillings. These are attractive market segments on which we will focus more in thenear future. We experienced increasing demand for certified chocolate and growinginterest in our ownQuality Partner Program (QPP).The long-term global supply agree-ment we signed with Kraft Foods Inc. confirms the trend towards outsourcing and stra-tegic partnerships.
In December 2009, Barry Callebaut closed the acquisition of Spanish chocolatemaker Chocovic; the full integration was completed in July 2010. Chocovic significant-ly strengthened our market position with respect to compounds and fillings and madeus the leader for industrial as well as artisanal products in Spain and Portugal. Choco-vic’s specialties activities also contributed to the development of new business inother regions.
1 Source: Nielsen, September 2009–August 2010
The contribution from the Gourmet & Specialties Products business was particularlynoteworthy. The European gourmet markets recovered after having been hit by therecession.The bakery/pastry and confectionery segment showed a stronger upturn thanthe HORECA (hotels, restaurants, catering) business. Our distributors and artisansmaintained a low stock policy due to uncertainties about the strength of the recoveryas well as still tight credit lines from their banks.As a result of the acquisition of Choco-vic, market share gains, organizational optimization and a strong focus on both exist-ing customers as well as new business opportunities, Barry Callebaut was able toachieve considerable growth in sales volume as well as revenue.
Following the trend towards the increasing popularity of at-home consumption, BarryCallebaut launched a new series of 13 ready-to-use Gourmet products under theCacao Barry brand for the domestic kitchen. In partnership with Lenôtre, the ambas-sador of French gastronomy across the world, this“HomeCooking”product series waslaunched in France and will soon be launched in other European countries.
With the acquisition of Chocovic, we now have a new Chocolate Academy in Spain,expanding the network to six representations all over Europe with a total of 12 tech-nical advisers and 100 Ambassadors, who inspire the 20,000 professionals attendingthe more than 300 demonstrations and 100 training courses organized throughout theyear.
The sales volume of our Beverages division grew very strongly, driven by the acqui-sition of Eurogran. The company has now been successfully integrated into BarryCallebaut within a challenging time schedule and is already exceeding the plannedsynergies.Beverages has proven to be a highly attractive market – especially in Europe,where Barry Callebaut is now the market leader.A strong trend during this fiscal yearwas seen in the growing interest of our customers to develop cocoa-based capsulesolutions for tabletop coffee machines.
In line with its strategic objective, theConsumer Products business was able to increaseits sales in major markets outside Germany and improved its country portfolio. Westarted a process of carving out our consumer business from our other activities inorder to put it on a stand-alone basis,which will facilitate the eventual divestment.Ourplan remains unchanged to focus on our industrial and artisanal business and divestour consumer activities.
Report by Regions 23Europe
Additional information:www.barry-callebaut.com/gourmet and www.cacao-barry.com and www.chocolate-academy.com andwww.barry-callebaut.com/beverages and www.barry-callebaut.com/consumers
Key figures for Region Europe
Change % 2009/10 2008/09*in local
currenciesin reporting
currency
Sales volume Tonnes 4.1% 753,011 723,099Sales revenue CHF m 4.8% (0.5%) 3,042.0 3,056.3EBITDA CHF m 7.1% 4.1% 324.1 311.4EBIT CHF m 8.3% 6.3% 268.7 252.7
* Restated figures due to first-time application of IFRS 8.
Eastern Europe – Strong growth despite still challenging market conditionsOverall, the economic environment in the Eastern Europe Region is improving, butstill below our growth expectations.The chocolate confectionerymarket sufferedmuchmore than inWestern Europe.1 In contrast, Barry Callebaut’s overall volume and salesrevenue in the region grew at a double-digit pace compared to the previous fiscal year.The combination of outsourcing, new business gains due to increased sales efforts incountries such as Turkey and the former Soviet countries (CIS) as well as the contin-ued geographic expansion of our Gourmet & Specialties Products business led to thispositive result. In addition, intensified sales efforts in the market of Hungary paid offin the form of double-digit volume growth. The most important growth driver was –as in the last fiscal year – Poland, but even Russia managed to deliver positive growthdespite the difficult conditions.
As the purchasing power of consumers is growing, demand for more innovative andpremium products is also increasing.We have noticed that new trends have not alwaysoriginated from the big multinationals; sometimes they came from local, fast growingplayers. To support this development, we will continue to invest in more local R&Dpeople.
In our Food Manufacturers business, we achieved a double-digit increase in volumesand profits in an overall declining market thanks to more efficient operations anda better product mix.With the market picking up in Russia in the last quarter of fiscalyear 2009/10, Barry Callebaut generated slightly positive growth in an overall toughmarket.We noted additional business originating from the CIS countries, where newplayers have invested in high quality chocolate confectionery. In the ice cream busi-ness, we see more players using real chocolate instead of compound.
Russia and the CIS countries showed very strong volume growth in our Gourmet &Specialties Products business as we extended our product portfolio and furtherexpanded our distribution network. Overall, Barry Callebaut increased volumes bydouble digits in this product group.While we achieved our ambitious growth targets inTurkey and Poland, Greece suffered from the country’s financial difficulties.
1 Source: Nielsen, September 2009–August 2010
24 Report by RegionsEurope
Additional information:www.barry-callebaut.com/foodmanufacturers and www.barry-callebaut.com/gourmet
Filip De ReymaekerPresident Eastern Europe
Report by Regions 25Americas
Additional information:www.barry-callebaut.com/foodmanufacturers and www.barry-callebaut.com/gourmet
Americas – Substantialgrowth in a mixed market environment
The mature economies of the United States and Canada slowly returned to positiveGDP growth after being hit hard by the financial crisis.However, consumer confidencesoftened and the economic recovery stalled in the second half of the fiscal year. In con-trast, the developing regions of Brazil and Mexico showed consistent strength. Brazilnavigated the crisis relatively well and its 2010 GDP growth is expected to accelerateto 6.4%. Mexico was strongly affected by the crisis, but is projected to rebound toa growth rate of 4.3% for 2010.Growth potential in the Latin American region lookspromising at an estimated 4.2% per annum over the 2011–2012 period,1 which bolstersour confidence in our recent expansions in Mexico and Brazil.
Chocolate consumption in the United States dipped to low levels in early 2010 but re-bounded strongly in the third quarter of our fiscal year; overall, the chocolate marketin the United States grew by 2.7%. We also benefited from growth in the Brazilianchocolate market, where volumes increased by 3.5%.2
Region Americas achieved strong overall sales volume growth of 15.6% to 291,399tonnes, driven by long-term outsourcing and supply agreements with key CorporateAccounts as well as through broad-based growth in our Gourmet business. Regionalsales revenuewas just shy of the CHF 1 billion mark at CHF 998.2 million, correspond-ing to an increase of 15.7% in local currencies (+10.8% in CHF) versus last year.Operating profit (EBIT) rose considerably by 6.3% in local currencies (+7.2% in CHF)and amounted to CHF 92.5 million, positively influenced by the volume growth in boththe Food Manufacturers and the Gourmet & Specialties Products business, partlyoffset by infrastructure investments to support the ongoing growth, including the start-up costs for the new factory in Brazil.
The inauguration of our new chocolate factory in Extrema, Minas Gerais, Brazil, onMay 27, 2010 marked another milestone in Barry Callebaut’s strategy to selectivelyexpand its geographic presence to those emerging markets that offer above-averagegrowth opportunities.The combination of our new chocolate factory with our existingcocoa factory in Ilhéus,Bahia, rounds off our local, integrated footprint and we are now
1 Source: TheWorld Bank, summer 20102 Source: Nielsen, September 2009–August 2010
“Despite aggressive competition and overall soft economic market conditions, BarryCallebaut achieved solid results in Region Americas. In fiscal year 2009/10, we roundedoff our strong manufacturing footprint in the region with capacity expansions at existingfacilities and with the inauguration of our first chocolate factory in South Americain May 2010. Barry Callebaut is now in a favorable position to tap a tremendous marketpotential – not only in Brazil but throughout the entire region.”
David S. JohnsonCEO and President Americas
26 Report by RegionsAmericas
well positioned to become the No. 1 chocolate supplier to Brazil’s fast growing foodservice industry, which includes restaurants, fast food restaurants, bakeries, pastryshops, in-store bakeries, caterers, hotels, chocolatiers, hospitals and school canteens.These markets offer Barry Callebaut significant growth opportunities.
The success of our ChocolateAcademy in Chicago continued.Our staff of profession-al chefs and technical advisers conducted formal training courses for artisans, pastrychefs and other professional users, providing a forum to improve their skills and tech-niques while informing them of the latest chocolate-making trends.
The Food Manufacturers Products business volume grew by double-digits, driven bylarge key accounts, leading to an overall gain in market share.Barry Callebaut’s strongglobal presence enabled us to win further business volume with customers based inRegionAmericas who were looking to Barry Callebaut tomeet their worldwide needs,of which our recently announced deal with Kraft Foods Inc. is a good example. Inaddition to base-business growth, our corporate innovations continue to drive special-ties sales, strengthening our overall image as a leader in the cocoa and chocolateindustry. One new launch this year was our ACTICOA™ chocolate, which provideshigh cocoa flavanol products for health-conscious consumers.
Over the period under review, the NorthAmerican food service market served by ourGourmet team experienced an onlymodest recovery from the economic crisis in termsof overall volume.However, theGourmet & Specialties Products business clearly out-performed general economic trends thanks to substantial growth in higher-end importbrands such as Callebaut and Cacao Barry. Moving forward, we are expanding ourGourmet & Specialties business in LatinAmerica with a combination of local brandsand Callebaut and Cacao Barry imports.
Key figures for Region Americas
Change % 2009/10 2008/09*in local
currenciesin reporting
currency
Sales volume Tonnes 15.6% 291,399 252,159Sales revenue CHF m 15.7% 10.8% 998.2 901.1EBITDA CHF m 7.0% 7.1% 108.1 100.9EBIT CHF m 6.3% 7.2% 92.5 86.3
* Restated figures due to first-time application of IFRS 8.
Additional information:www.chocolate-academy.com and www.barry-callebaut.com/foodmanufacturers and www.barry-callebaut.com/gourmet
Report by Regions 27Asia-Pacific
Asia-Pacific – A stronggrowth story continues
“The general growth dynamics in Asia did not translate into higher chocolate consumptionin all markets in fiscal year 2009/10: While some chocolate markets such as China, India,Indonesia and Malaysia showed significant growth, Japan – one of the major markets –was flat. Throughout the region, the market for compound is still growing faster than forchocolate. However, our Gourmet business will continue to benefit from demand forhigh-quality chocolate as more companies upgrade from compound to chocolate andfrom further expansion in the HORECA (hotels, restaurants, catering) sector.”
Additional information:www.barry-callebaut.com/foodmanufacturers and www.barry-callebaut.com/gourmet
In 2009 economic growth rates in Asia-Pacific were mixed, ranging from a GDPdecline of 5.2% in Japan to an impressively resilient growth rate of around 9% forChina. In 2010,GDP growth in the region is expected to range between 4.5% and 9.5%.1
The regional chocolate confectionerymarket grew by 4.0%,2much faster than the glob-al market, and we expect it to keep growing at the same pace. The launch of severalinnovative products such as rebalanced andACTICOA™ chocolate strengthened ourposition in Asia-Pacific as innovation leader.
In Region Asia-Pacific, Barry Callebaut increased its sales volume by 15.5% to 47,984tonnes.Sales revenuewent up by 23.2% in local currencies (+21.4% in CHF) and camein at CHF 211.1 million. Key drivers for this strong growth were a higher demand forquality chocolate, including the company’s imported EuropeanGourmet products, andmarket share gains.Due to the disposal of theAsian consumer business in the previousfiscal year, operating profit (EBIT) decreased by 27.4% in local currencies (–28.4%in CHF) and amounted to CHF 20.9 million.Without this one-off effect, EBIT grew87.6% in local currencies (+85.0% in CHF).
The volumes in our Food Manufacturers business grew at double-digit rate. In China,the economy is booming and so is the chocolate confectionery market, growing onaverage at 8.2%.2Both ourmultinational as well as local customers showed a very goodperformance.The other main growth markets were Korea, Malaysia andAustralia.
In our Gourmet & Specialties Products business, we saw strong demand for bothEuropean brands as well as for the local brands – both showed double-digit growth inalmost every market.
1 Source: TheWorld Bank, summer 20102 Source: Nielsen, September 2009–August 2010
Maurizio DecioPresident Asia-Pacific
Key figures for Region Asia-Pacific
Change % 2009/10 2008/09*in local
currenciesin reporting
currency
Sales volume Tonnes 15.5% 47,984 41,544Sales revenue CHF m 23.2% 21.4% 211.1 173.9EBITDA CHF m (26.3%) (27.5%) 26.2 36.1EBIT CHF m (27.4%)1 (28.4%)1 20.9 29.2
* Restated figures due to first-time application of IFRS 8.1 +87.6% in local currencies (+85.0% in CHF) excluding the one-off gain on the saleof the Asian Consumer business in the prior year.
Natascha Schwarzer, Master Pastry Chef, Chocolate Academy Zurich, Switzerland:“When I created this dessert, I was thinking about how the different textures, flavorsand colors I was putting together would blend and complement each other, enhancingthe final product; I was also thinking about the people who would actually be enjoyingmy composition. I’m hoping the patrons ordering this dessert are filled with eageranticipation and I am definitely aiming for a ‘wow’ effect when it is served.”
30 Global Sourcing & Cocoa
Global Sourcing & Cocoa – Creating valuethrough our core ingredients
“With our strong presence in cocoa origin countries, we have direct access to our mainraw material: high-quality cocoa beans. As in the previous fiscal year, we saw volatilecocoa markets and new historical highs driven by fears of a poor crop and heavy specula-tive buying. Having the adequate tools and teams in place, we dealt very well with thischallenging situation. Interest in organic cocoa leveled off but demand from customersswitching to certified products such as Rainforest Alliance, UTZ Certified or Fair Tradeincreased considerably.”
The globally managed Global Sourcing & Cocoa business is now reported as a sepa-rate operating segment like a Region.On the one hand, the segment is responsible forthe global procurement of our high-quality raw materials such as cocoa, sugar, dairyproducts, oils, fats, nuts and other ingredients as well as packaging material. On theother hand, Global Sourcing & Cocoa is the global cocoa production unit for semi-finished products such as cocoa liquor, cocoa butter and cocoa powder.We sell abouthalf of these products to our industrial customers, who use them in their products, andthe other half is for our own use.
Global Sourcing & Cocoa strongly increased the volume of cocoa products soldto third-party customers by 8.2% to 212,886 tonnes. North and South America werethe top performers, with both showing double-digit growth. Sales revenue came inat CHF 962.5 million – a significant increase in local currencies of 29.9% (+28.5% inCHF) – due to both higher cocoa bean prices and higher volumes. Operating profit(EBIT) grew by 5.4% in local currencies (+3.9% in CHF) to CHF 54.5 million, posi-tively influenced by the good management of our butter and powder activities.
Managing the volatile raw material marketsCocoa prices were very volatile this fiscal year. Jumping aggressively in the initialmonths, the terminal market price for cocoa in London reached a 33-year high in Julybut then fell back to close at GBP 1,954 per tonne onAugust 31, 2010, around last year’slevel. The markets were concerned about the size of the 2009/10 crop in Ivory CoastandGhana, accountable for over 50% of the world’s cocoa production.These concernsdid not materialize and there was even a small surplus. The quality of this year’s cropwas relatively good and did not significantly deviate from the 2008/09 crop. There isstrong evidence that the crop in Ivory Coast will grow during the coming year and thatthe world crop for 2010/11 will close with a surplus.
Since raw materials account for about 70% of our costs, their market prices representone of the major risks in our core business. Barry Callebaut navigated its way throughthe volatile cocoa markets quite well and limited its exposure to price fluctuations byapplying a variety of sourcing strategies and risk management tools, such as vendorassessment, price hedging through cocoa derivatives, futures and physical forwardcontracts as well as arbitrage management. Using a Historical Value at Risk EngineModel, we also kept our overall financial risk exposure to commodity price risks with-in the limits defined by the Board of Directors.
Steven RetzlaffPresident Global Sourcing & Cocoa
Global Sourcing & Cocoa 31
Moving up the cocoa supply chainBarry Callebaut does not own any cocoa farms but it has intensified its efforts to movecloser to the farmer. Direct sourcing puts us in the best position to control the qualityof our beans. It is our goal to move upstream in the cocoa supply chain and furtherincrease the proportion of directly sourced cocoa.With our Quality Partner Program(QPP), for example, we now work directly with 48 cooperatives representing some40,000 cocoa farmers in Ivory Coast, the largest cocoa-producing country in the world.Since we started the program in 2005, we have more than tripled the beans sourcedfrom QPP cooperatives and this growth will accelerate in the coming fiscal year. InAugust 2010, we launched QPP in Cameroon.Another example is Biolands in Tanza-nia. Since 2008, we have held a 49% stake in the company, one of the largest produc-ers of certified organic cocoa in Africa. Barry Callebaut has supported the expansionof Biolands’ farmer-centric model to Sierra Leone.Biolands has registered several thou-sands of farmers under its direct sourcing model. During fiscal year 2009/10, BarryCallebaut directly sourced 65% of its cocoa beans from cooperatives, intermediariesand government bodies in the cocoa origin countries.
Powder and butter prices challenging for pressing marginsWe saw high demand for cocoa powder since the market segments using cocoa powderas an ingredient – mainly the bakery, ice cream and beverage industries – did notsuffer as much from the global economic crisis as the chocolate confectionery market,where cocoa butter is used to a great extent. Due to the stagnation in the global choc-olate market, cocoa butter stocks further increased. As a result, the combined cocoaratio1 was under pressure because the high cocoa powder prices could not compensateor the low cocoa butter prices. The combined cocoa ratio showed a recent improve-ment but it is too early to say whether this will last.
1 The (forward) combined cocoa ratio is the combined sales price for cocoa butter and cocoa powder relative to the cocoa bean price.
Additional information:www.barry-callebaut.com/cocoa-to-chocolate and www.barry-callebaut.com/csr and www.qualitypartnerprogram.com
Sales volume Tonnes 8.2% 212,886 196,808Sales revenue CHF m 29.9% 28.5% 962.5 748.9EBITDA CHF m 5.8% 3.6% 75.2 72.6EBIT CHF m 5.4% 3.9% 54.5 52.5
* Restated figures due to first-time application of IFRS 8.
32 Corporate Social Responsibility
Sharpening our focus, stepping upour commitment
Cocoa – Empowering cocoa farmers to increase incomes and improve family livelihoodsCocoa is a typical product of the tropics and very labor-intensive: About 4.5 millionsmallholder cocoa farmers in about 30 countries situated around the equator producemore than 3.5 million tonnes of cocoa every year.Without cocoa, there is no chocolate.Therefore, helping to ensure sustainability in the cocoa sector is an imperative for us.This is why we work with cocoa farmers to improve crop yields and quality, therebyenhancing farmer incomes and improving family livelihoods. It is a win-win businesspartnership: farmers can earnmore and improve their livelihoods through higher yieldsand better quality; we benefit by having sufficient quantities of quality cocoa to meetour ambitious growth strategy; and consumers benefit from sustainably producedchocolate. Improving farmer livelihoods is key in the fight against poverty; poverty isthe main reason for unfair labor practices, including abusive child labor. Ensuring re-sponsible labor practices is a major concern of our industry and consumers worldwide.
Signature Program: Quality Partner Program (QPP) in Ivory Coast and CameroonExCo program champion: Juergen Steinemann, CEO
Environment – Conserving energy to reduce our impact on the environmentWe share one planet, and need to make wise use of its natural resources. Processingcocoa and making chocolate is energy-intensive and requires a lot of transport. Asa responsible company, we need to do our part to reduce overall energy consumptionin our factories and facilities, reduce our carbon emissions and increase our use of“green” energy.
Signature Program: Energy managementExCo program champion: Dirk Poelman, Chief Operating Officer
“Corporate Social Responsibility (CSR) or sustainability goes beyond making a profit.It requires a balance between social, environmental and economic goals – or People,Planet, Profit. In alignment with our strategy and business objectives, our ExecutiveCommittee (ExCo) has made the strategic choice to focus on three spheres of activity:Cocoa, Environment and Employees. To ensure measurable progress, the ExCo hasdefined so-called ‘signature programs’ for each sphere and named an ExCo memberto serve as each program’s champion.”
Additional information:www.barry-callebaut.com/csr and www.qualitypartnerprogram.com
Gaby TschofenVice President Corporate Communications & CSR
Corporate Social Responsibility 33
Employees – Developing our people to help our company continue to prosper and growIt is our people who make Barry Callebaut competitive and successful. It is in ourinterest to give all our employees a chance to realize their full potential by offeringdevelopment and training opportunities and providing regular feedback on their per-formance. While we want to continue to attract talented people from the outside togain new ideas, we are committed to developing more of our future leaders fromwithin.
Signature Program: Performance Management & Development Program PMDPExCo program champion: David S. Johnson, CEO and President Americas
As the heart and engine of the chocolate industry, we are committed to taking the leadin empowering cocoa farmers to become more productive, in becoming as energy-efficient as possible as a company, and in developing our people. This CSR roadmapwill guide our actions so we can continue to grow responsibly.
Assuming responsibility – also in industry partnershipsAs a member of the World Cocoa Foundation (WCF), we help fund research anddevelopment programs that benefit farmers in the cocoa-growing regions of Africa,SoutheastAsia and theAmericas.We also support the SustainableTree Crops Program(STCP). Since 2000, STCP has been working to improve the economic and social well-being of tree crop farmers inWest and Central Africa and the environmental sustain-ability of their agricultural systems. Barry Callebaut also joined with theWorld CocoaFoundation and the Bill & Melinda Gates Foundation to improve the livelihoods ofcocoa-farming households in Ivory Coast, Ghana, Nigeria, Cameroon and Liberia.
QPP – Quality cocoafor a better life
Our Quality Partner Program (QPP)works to enable cocoa farmers toimprove the quality of their farms sothey can produce more and better-quality beans and thereby increasetheir incomes and improve their live-lihoods. Today,weworkwith 48 coop-eratives representing some 40,000cocoa farmers in Ivory Coast.Our QPPtargets are:
– Increase the number of QPPmember cooperatives, as wellas the volume and the qualityof the beans they harvest
– Every QPP cooperative has afarmer field school by 2014
– Every QPP cooperative has itsown nursery in place by 2015
Committed to minimizingthe environmental impact
Barry Callebaut strives to be as ener-gy-efficient as possible by conservingenergy, reducing carbon emissionsand using more “green” energy. Weseek to continuously improve theperformance in every plant, createawareness amongst our employeesregarding our environmental foot-print and comply with all relevantlaws, rules and regulations in thecountries where we operate. The tar-gets we want to reach by 2013:
– 20% reduction of energyconsumption per tonne
– 20% reduction of carbonemissions per tonne
– 20% of energy to come fromrenewable sources
Employee developmentBarry Callebaut is a fascinating com-pany to work for: Globally active andmaking adelicious product everybodylikes – chocolate. We want to engageour employees in contributing to ourcompany’s high performance stan-dards and offer development oppor-tunities to gain the necessary skillsand experiences for today’s businesschallenges, but also to prepare ourfuture leaders. Our employee targetsare:
The key elements of our Corporate Social Responsibility (CSR) roadmap:
Abhiru Biswas, Master Pastry Chef, Chocolate Academy Mumbai, India: “I was inspiredby a class called ‘Creative Art on the Plate’ during training at Hotel School. I also watchedonline demonstrations by French pastry chefs who had acquired the title of ‘MeilleurOuvrier de France’ and I admired their skills. My own passion was enhanced by theexpertise of these distinguished French pastry chefs, and I now try to fuse French andIndian Patisserie.”
36 Operations & Supply ChainOSCO
Expanding our footprint and increasingour operational efficiency
“Barry Callebaut’s factory network currently consists of 43 factories. We extended ourfactory base during this fiscal year in order to close some geographical gaps as wellas to access new, emerging markets: The inauguration of our Brazilian chocolate factoryin Extrema in May 2010 puts us in a better position to unlock the attractive growthpotential of the South American chocolate market. Focused continuous improvementinitiatives contributed to an increase in overall efficiency and a reduction in manu-facturing costs per tonne.”
In addition to building our first chocolate factory in South America, we increased thecapacity of some of our existing plants: For instance, we added a liquid chocolate linein Pennsauken,U.S., as well as in Lodz, Poland, and installed a drops line in Singapore.
In the course of this fiscal year, Barry Callebaut invested a total of CHF 119.3 millionin the extension, maintenance as well as optimization of the factory base. By speedingup our efficiency, we were able to reduce manufacturing costs per tonne of activity by5%1 in this fiscal year.
In order tomake our continuous improvement process more effective,we began a proj-ect with an external specialist to increase Barry Callebaut’s manufacturing efficiencyand introduce standardized and uniformly structured work processes. This project isnow underway at selected pilot plants in each region. During the implementation,a team of local Barry Callebaut employees at each site is being trained that will laterimplement this new way of working at the other plants in their region.
Four focus areas of our continuous improvement programFirst, Barry Callebaut is taking action to ensure the continuous improvement of itsquality standards. All our factories worldwide must fulfill BRC standards by the endof 2011 – BRC stands for British Retail Consortium and is one of the five food safetystandards recognized by the Global Food Safety Initiative, a platform that regroupsglobal retailers and a large number of food manufacturers.Today, 60% of our factorieshave already achieved BRCGradeA certification.The majority of them are located inEurope.
1 In local currencies
Operations & Supply Chain 37OSCO
Raw materials represent about 70% of our total costs. Therefore, secondly, we haveinitiated special projects in the main regions in order to optimize the use of thesematerials and to reduce waste.
A third focus area of continuous improvement is energy and the reduction of carbonemissions: Processing cocoa and making chocolate is energy-intensive.As a responsiblecompany,we aim to reduce Barry Callebaut’s energy consumption and increase our useof renewable energy.This will reduce overall carbon emissions originating from our ac-tivities.Three main targets were defined, to be realized by the end of fiscal year 2013:
20% reduction of energy consumption per tonne20% reduction of carbon emissions per tonne20% of energy to come from renewable sources
With a 4% reduction in our overall energy use per tonne at the end of year one,we areslightly behind our target of 5% yearly savings. However, since some of the energyefficiency improvements were not realized until the second half of the year, we expectto catch up in meeting our target in the coming months. This fiscal year, we were ableto reduce our carbon emissions by 4% per tonne,mainly from the reduction of energyconsumption. By increasing the share of renewable energy sources, we will be able tospeed up the reduction in carbon emissions and reach our 4-year goals. For instance,we are already using cocoa shells to produce steam.To extend this, we are optimizingthe efficiency of our shell burners, review the possibilities to extend our capacity toproduce steam based on this bio mass and we are setting up a test plant for theproduction of bio gas, based on the fermentation of cocoa shells.This will be tested inSan Pedro in Ivory Coast.
Themaintenance management system – our fourth focus area –which we began to im-plement this fiscal year, has already been rolled out at 12 sites in the Group.This toolwill also allow us to improve the purchasing of our spare parts through volume pool-ing in the different regions. Compared to last year, we were able to reduce our totalmaintenance costs by 4% per tonne.
Reducing energyconsumption and costswith new technology
Barry Callebaut routinely invests innew technology to reduce its energyneeds. During this fiscal year, ourteam of process engineers success-fully developed a totally new tech-nology for breaking cocoa beans thatcan reduce the yearly gas consump-tion of a single liquor-making line by1,830 megawatt hours or an equiva-lent of 340 tonnes of CO2. This appli-cation has already been successfullyintroduced at our cocoa factory inLouviers, France, and the global roll-out is planned for all our cocoa facto-ries over the next two years.
Significant outputimprovement in Cameroon
We implemented a project in our fac-tory inDouala, Cameroon, to enhanceproduct quality and output volume. Itled to anumber of improvements:Theimplementation of preventive main-tenance and operating procedures,the upgrade and tuning of existingfactory equipment as well as techni-cal training to increase knowledge atstaff andoperator level. Thanks to thisproject, we were already able to in-crease output by 20% versus prioryear. In addition, new investmentswere recommended,whichwill be putin place in fiscal year 2010/11.
Optimizing transport flowsWith the acquisition of the Chocovicchocolate factory, customerswhohadpreviously been supplied from Bel-gium and France can now be servedfrom Spain. This has reduced averagetransport distances by 700 km pertonne, improved service levels thanksto reduced lead times – and produced160 tonnes of CO2 emission savings.Replacing conventional road trans-portwith intermodal solutions– com-bining road, rail and waterway net-works – reduced the cost per km forlong distances and also enabled usto put in place more environmentallyfriendly flows.
38 Customers and Business Units
Barry Callebaut and its customers –Partnering for success
Barry Callebaut works in close partnership with its approximately 6,000 industrialcustomers and tens of thousands of artisanal customers worldwide. Our ability toproduce a comprehensive and unique range of specially tailored products –manufac-tured from almost 2,000 recipes – that meet our customers’ specifications trulysets us apart from the competition.
Additional information:www.barry-callebaut.com/foodmanufacturers and www.barry-callebaut.com/gourmet and www.barry-callebaut.com/consumers
Of the large number of projects we had the pleasure to conclude with our customersduring this fiscal year, we would like to highlight some examples in each of the differ-ent product groups:
Food Manufacturers Products:Barry Callebaut’s role as chocolate supplier to the world-renowned Belgian chocolatemakers Godiva,Guylian and Neuhaus during theWorld Expo in Shanghai from Mayuntil October 2010 generated much attention – both from customers and the media.Every day, 30,000 visitors at the Belgian pavilion were delighted by the exquisite choc-olate creations of Belgian artisanal chocolatiers.
Gourmet & Specialties Products:Hotel Chocolate is one of the fastest growing chocolate retail businesses in Europeand the world. Ever since it was founded 15 years ago, it has been brazenly committedto bringing quality and innovation to the high street and is now present in the U.K.,the U.S. and the Middle East. Barry Callebaut is proud to be Hotel Chocolate’s keysupplier, fuelling its growth and helping it overcome many challenges from the supplychain to product development, in particular their change from solid to liquid supply.
Consumer Products:Käfer is an internationally acclaimed brand of premium products for connoisseurs andgourmets all over the world. Stollwerck is proud to be the sole licensee of the entireline of Käfer chocolate. Together with Käfer, it developed an exquisite portfolio ofpralines and truffles that is now being launched in the German food retail sector.Presented in an especially designed display, it enables retailers to expand their gour-met expertise and enhance their offering on the premium confectionery shelf.
Customers and Business Units 39
Weput customers first,which is why we are very proud to serve some of the best-knownnames in the food industry:
Chocolat Frey (Switzerland) “As the No. 1 producer in the Swiss chocolate market, wedon’t view Barry Callebaut as a conventional supplier but rather as a business partner –which is also why we decided to become involved in Barry Callebaut’s Quality PartnerProgram.With this program, Barry Callebaut gives us precise information on the originof the beans and we can be assured that the farmers receive a fair price.”
Cacao Fine Chocolates (Australia) “Undoubtedly, Barry Callebaut is our preferredsupplier of premium chocolate.With its Australian and international support team, wenever have to go far for assistance and knowledge. The relationship between BarryCallebaut and us has been built on a mutual understanding of the importance of qualityand service, two priorities that very much go hand in hand.”
J.CO Donuts & Coffee (Singapore) “Barry Callebaut delivers the finest of theirpremium quality products with a consistency that we can always trust while providingexcellent customer service for its clientele.We are proud to have Barry Callebaut as oursupplier.”
Magnat 100% chocolate (Russia) “As the leading, most indulgent brand in theRussian ice creammarket,we searched the world for the best chocolate for our ice cream.Only Barry Callebaut chocolate was able to satisfy our needs and the tastes of Russianice cream lovers. Barry Callebaut is our strategic and most valuable partner.”
To serve our customersmost effectively, Barry Callebaut is organized by region. There arefour different product groups: Cocoa Products, Food Manufacturers Products, Gourmet& Specialties Products and Consumer Products.
Industrial Business
Cocoa Products Food ManufacturersProducts
Processing cocoa into semi-finished goods that arepartly sold to industrialcustomers and partly usedfor in-house needs.
Providing chocolate tomultinational and nationalbranded consumer goodsmanufacturers who incor-porate these ingredientsin their consumer products.
Business Segment
Product Group
Activity
Food Service/Retail Business
Gourmet &Specialties Products
Consumer Products
Providing chocolate prod-ucts that are specificallydesigned for artisanal andprofessional users suchas chocolatiers, bakers andpastry chefs as well as forthe Food Service industry,which includes restaurants,in-store bakeries, caterers,hotels and canteens.
Supplying global retailerswith private label andbranded products. In orderto help bring innovations tothe market, Barry Callebautalso has its own local con-sumer brands: Sarotti (Ger-many), Jacques (Belgium)and Alprose (Switzerland).
Jérôme Landrieu, Master Pastry Chef, Chocolate Academy Chicago, Illinois, U.S.:“I sometimes feel that chefs lose sight of the end consumer when making their chocolatecreations. It was therefore clear to me and my team that we also needed to offer non-professional-level classes to teach consumers about our premium chocolates. Local grocerystores and markets are now carrying our Callebaut products, and we are offeringconsumers courses to develop and refine their palates.”
42 Innovation
Detecting trends and developingwinning products for our customers
Barry Callebaut is the only global cocoa and chocolate manufacturer with an integrat-ed R&D network.We operate 15 R&D centers worldwide, where we conduct appliedR&D for our customers.The innovation and applied R&D teams use 14 pilot facilitiesand 15 application labs to conduct small-scale test runs producing high-quality cocoaand chocolate products, to make end applications, and to improve products and reci-pes for our customers and their production processes.
Key market trends that drive our R&D effortsWe expect cocoa raw material prices to rise in the coming years. Because of this, wehave to find newways tomanufacture products with the same quality, but at lower costs.Many of our customers are increasingly moving towards cost-efficient product solu-tions and we see a growing interest in compounds and fillings, where we already havethe broadest assortment of products in the industry for every possible application.On the other hand, indulgence remains the best rationale for premium chocolate prod-ucts.That is why we also notice that many of our key customers are focusing on the de-velopment of “premium-praline-type” products with multiple ingredients for sale inmass retail.With our broad specialty assortment as well as our capabilities in fillings,inclusions, new texture elements and decorations, we are well positioned to success-fully support our customers.
Although chocolate is the ultimate comfort food, consumers are interested in health-ier alternatives to standard chocolate:More and more, they are choosing products thatare free from allergens or that have“cleaner labels”– like gluten-free, lactose-free, andwithout artificial colors and aromas. Alternatives also include chocolates with higherlevels of cocoa flavanols or functional ingredients. Increasing obesity levels are anacknowledged health issue worldwide. Barry Callebaut needs to actively developindulgent chocolate alternatives containing fewer calories, less fat and less sugar –we call these applications “rebalanced”. This fiscal year, we conducted more than200 customer projects in this area.
“At Barry Callebaut, we have dedicated innovation teams proactively developing andoffering innovative products in response to emerging consumer trends. There arealso regional Research & Development (R&D) teams that focus on the requests andinquiries of our several thousand customers worldwide, addressing their needs asrapidly as possible. We call these applied R&D teams. In total, our R&D departmentmanages about 1,750 projects a year and runs almost 7,600 trials in their questfor success. Furthermore, we conduct more than 400 technical visits to instruct ourcustomers on how to use our products more efficiently.”
Innovation 43
Controlled Fermentation – Reinventing premium chocolate from the ground upOver the past few years, Barry Callebaut worked intensively on enhancing cocoafermentation.This year, we introduced a revolutionary new method under the bannerof Controlled Fermentation aimed at producing chocolate with even more authenticand intense cocoa flavors. Through patented, unique fermentation techniques, BarryCallebaut manages to yield superior cocoa quality. Cocoa beans produced by Con-trolled Fermentation have a fruitier, more intense flavor pallet, can be tailored todeliver exclusive tastes – at customers’ requests – and can also have a higher concen-tration of healthy, functional components such as cocoa flavanols. This new fermen-tation method also brings advantages to cocoa farmers themselves since better qualityleads to lower rejection rates from bean processors and thus higher income for farmers.
Barry Callebaut has implemented the Controlled Fermentation process in a numberof plantations acrossAfrica as part of our Quality Partner Program and our collabora-tion with Biolands. Barry Callebaut also signed a Memorandum of Understandingwith the Malaysian Cocoa Board: Controlled Fermentation will allow us to match thetaste of Indonesian cocoa with the taste ofWest African cocoa since many consumersin Europe and North America are used to the flavor ofWest African cocoa.
Further expanding our R&D resourcesWe added four new pilot lines and application laboratories this year. Besides the newfacilities in Extrema (Brazil), Port Klang (Malaysia) and Osaka (Japan), we openeda new cocoa-processing pilot line and an application laboratory in Louviers (France),making Barry Callebaut the only company worldwide to operate these facilities sideby side. This gives us the possibility to create new prototypes and innovations for ourcustomers, ranging from the processing of the cocoa beans to the finished chocolate.
We are very proud to have launched several major product innovations exclusively forthree Gourmet customers during the fiscal year:
Dairy-free alternative tomilk chocolate
Barry Callebaut found an ideal part-ner in Celtic Chocolates, one ofIreland’s leading chocolatiers andproviders of gourmet chocolate forpeople with allergies and food in-tolerances, to develop and launch a100% dairy-free alternative to milkchocolate. It is the perfect solutionfor adults and children with a milkallergy or lactose intolerance whowere unable to indulge in milk choc-olate before as well as for the in-creasing number of peoplewith foodintolerances.
Premium chocolate forpremium confectioners
The renownedDutchpremiumchoco-late specialist Visser Chocolade isBarry Callebaut’s first customer forchocolate made with cocoa beansespecially treated with the com-pany’s unique Controlled Fermenta-tion method. Chocolate made fromthese specially cured cocoa beans isthe ideal ingredient for demandingchocolate professionals like VisserChocolade.The unique chocolate alsooffers a new look for premium choco-late, where even dark, cocoa-richchocolate has a lighter color like milkchocolate.
First chocolate sweetenedwith Stevia extract
Stevia, a plant native to subtropicaland tropical regions, is widely knownfor its sweet leaves,which canbeusedas a natural sugar substitute. BarryCallebaut has been the first to launchchocolate sweetened with Steviaextract without a laxative effect onan industrial scale – a unique sellingproposition. Barry Callebaut launchedthe chocolate exclusively with Cava-lier, a renowned family-owned com-pany in Belgium that has exclusivelyproduced chocolate products with noadded sugar since 1996.
Marcin Pazdzior, Master Pastry Chef, Chocolate Academy Lodz, Poland: “I graduatedfrom the Culinary School in my hometownWroclaw, Poland; then I acquired professionalexpertise in one of the best pastry shops and hotels in town. In the courses I teach forour artisanal customers, I try to emphasize that the most important factor when workingwith chocolate is devotion. Devotion always leads to success.”
Shaping careers andgrowing future leaders
46 Employees
Additional information:www.barry-callebaut.com/careers and www.barry-callebaut.com/learning
It is our employees who make Barry Callebaut successful. To achieve our ambitiousbusiness goals,we need to define clear targets for each employee and prepare them forthe future challenges in our demanding business environment. With the new PMDP,we have developed a business tool that helps to align the efforts and targets of indi-viduals with the strategic priorities and goals of our company.We strongly believe thatoffering excellent personal development and career opportunities is the fuel for ourfuture success. That is why the PMDP emphasizes the personal development andcareer aspirations of our bonus-eligible employees. In addition, it helps each employeeto understand how his or her job fits within the broader mission of Barry Callebautand how success is ultimately defined.
An important tool for personal development and…The PMDP is a business steering instrument for Barry Callebaut. It is closely tied tothe business planning cycle and the company’s overall targets.As of fiscal year 2010/11,the PMDP is initiated at the beginning of each fiscal year with a performance reviewmeeting between managers and employees. In this discussion, employee performanceis assessed and the relevant targets for the new fiscal year are defined.
A central aspect of the newly introduced PMDP is a discussion of the employees’development. Together with their manager, employees identify their talents, experi-ences and skills in order to determine appropriate development actions, includinginternal and external training.Targeted employee development supports our high-per-formance culture and helps to determine what steps are to be taken next in individualcareer planning.
…Barry Callebaut’s succession planningThe PMDP will also play an important role in Barry Callebaut’s succession planningas this input enables us to detect our high performing leaders.At Barry Callebaut, weaim to grow the majority of our leaders from within. The PMDP will support us inidentifying and promoting outstanding people for management positions from withinthe company.
“Barry Callebaut’s business environment constantly demands higher performance.The most important resource in making performance happen is our employees.As a company, we want to help them to be prepared for the increasing responsibilitiesthat are required of them as our business continues to grow. That is why we strength-ened the current performance management process by creating the new PerformanceManagement & Development Process (PMDP), which gives us greater strategic controlof our personnel development activities and also serves as a powerful instrument forsuccession planning.”
Europe 4,959Americas 1,462Asia-Pacific 492Africa 637
Number of employees: 7,550
Average seniorityin years
Europe 13.5Americas 8.9Asia-Pacific 5.0Africa 9.5
Personnel expensesin CHF million
2009/10 488.52008/09 489.62007/08 520.3
66%
19%
8% 12%
28%
60%
Yourfuture@BC: Starting a challenging career with the global market leaderBarry Callebaut recently repositioned its trainee program Yourfuture@BC. Theprogram offers talented university graduates the opportunity to work in differentpositions within Barry Callebaut in order to acquire business knowhow and to preparethem for challenging international careers as functional specialists. It is divided intotwo to three assignments. Participants are offered the opportunity to work abroad andin several positions within one of our five functional areas: Sales &Marketing, Finance& Controlling, Sourcing, Innovations and Operations. Yourfuture@BC also offers ex-cellent development opportunities through training courses and feedback sessions witha personal coach and a mentor.
Two former trainees talk about the experience they gained in their specific field andwhat their next career steps after program completion will be:
Maa Adoma Addae-Afoakwa, Graduate Trainee, Ghana“I never thought I would cut cocoa beans myself! Being in the program hashelped me a lot to understand Barry Callebaut’s business – from the saidcocoa beans to the finished product on retail shelves.While working in differ-ent countries like Ghana, Ivory Coast, France and the U.K., I also gained lots
of insights with respect to the different cultures. I am now looking forward to continu-ingmy career within Barry Callebaut in the area of project implementation inmy homecountry Ghana.”
Frédéric DeWolf, Graduate Trainee, Barry Callebaut Belgium“I now have a very good idea of how our company is organized.The programalso helpedme to further developmy career visions. In the coming years, I planto focus on building my commercial skills and becoming more familiar withour products from an application point of view by understanding our custom-
ers and markets better – which I will do in my new function as Product Manager forour Food Manufacturers business in Eastern Europe. I think this is an ideal startingpoint.”
7%
Excellence Award 2010 –Rewarding peak performance
The Excellence Award recognizes managers and their teams who are willing to go theextra mile, who are putting all their passion into their work and, thus, have madea positive impact on the company in the fiscal year. The seven Excellence Award 2010winners were nominated by their Presidents.
48 Employees
And the winners are:
Bernard Castermant, Plant Manager, Dijon – for successfully managing a complexplant in difficult economic circumstances.
Alain Freymond, Cocoa Trader, Zurich – for coming up with a specific cocoa pricingsolution that meets the expectations of our customer Kraft and leverages Barry Calle-baut’s strengths.
An Parrein, Manager Applied R&D Europe, Wieze – for implementing and bringingto market the complex project of certified cocoa and chocolate products with differentinternal and external stakeholders.
Gaby Tschofen, VP Corporate Communications & CSR, Zurich – for having done anoutstanding job in developing Barry Callebaut’s communications strategy and shapingthe image and reputation of our company among our various stakeholders, both internaland external, in the past nine years.
Philippe Janvier, Vice President Sales & Trade Marketing Gourmet Western Europe,Meulan – for successfully turning around the Food Service business in Europe and thusincreasing our Gourmet results.
Jean-Olivier Tasté, Vice President Global Accounts Food Manufacturers Europe,Wieze – for his remarkable contribution to the successful achievement of the globalsupply agreement with Kraft.
Sarah O’Neil, Director of Sales andMarketing Corporate Accounts FoodManufactur-ers North America, Chicago – for playing a critical support role in securing the Kraft deal,having always been there with her knowledge and problem-solving skills.
The Excellence Award winners 2010From left: Bernard Castermant, Alain Freymond, An Parrein, Gaby Tschofen, Philippe Janvier, Jean-Olivier Tasté and Sarah O’Neil
Employees 49
Additional information:www.barry-callebaut.com/award and www.barry-callebaut.com/csr and www.barry-callebaut.com/codeofconduct
Chairman’s Award 2010For outstanding employee personalities
The annual Chairman’s Award recognizes employees who have been with Barry Callebautfor a number of years and have demonstrated outstanding performance at work, aswell as a strong social commitment in their local communities. They are individuals whoembody the Barry Callebaut values of customer focus, passion, entrepreneurship, teamspirit and integrity.
The Chairman’sAward was inaugurated in 1995 by Klaus Jacobs, the former Chairmanof Jacobs Holding AG and founder of Barry Callebaut. Since then, the Chairman’sAward has been given to a selected number of employees each year.
In 2010, fourteen Barry Callebaut employees from eleven countries received the awardand were invited together with their spouses or partners to come to Switzerland to begiven the award by ChairmanAndreas Jacobs and CEO Juergen Steinemann.
The 2010 winners are:Back, from left: Christian Böcker (Sweden), Juergen Steinemann (CEO), Maciej Moritz (Poland), Rene Nkwamen (Cameroon),Hervé Raoul Koffi (Ivory Coast), Andreas Jacobs (Chairman), Michael Lohde (Germany), Geert Bosteels (Belgium)
Front, from left: EstherWälchli (Switzerland), Cristina Podico (Italy), MiriamMadrigal (U.S.), Elena Rossi (Italy), Ana CarolinaBomfim Silva (Brazil), Anna Maria Lagrow (U.S.), Andrew Duong (U.S.). Not in the picture: Alicia Lim (Singapore)
Customer focus. Passion. Entrepreneurship. Team spirit. Integrity.
Our company values reflect how we strive to interact withcolleagues, with external business partners, with all our stakehold-ers. They reflect how we believe business should be done –responsibly. Every Barry Callebaut employee is an ambassador ofthe company. We expect all employees to behave in ways thatdemonstrate our company values and to show social responsibilityand good citizenship in business dealings. The principlesand guidelines for behavior are set forth in our Code of Conduct.
Contents
52 Interviewwith the CFO
54 Financial Review
56 Consolidated Financial Statements
56 Consolidated Income Statement
57 Consolidated Statement of Comprehensive Income
58 Consolidated Balance Sheet
59 Consolidated Cash Flow Statement
61 Consolidated Statement of Changes in Equity
62 Summary of Accounting Policies
70 Notes to the Consolidated Financial Statements
113 Report of the Statutory Auditor
114 5-Year Overview
52 Konzernrechnung
Q How did Barry Callebaut manage to achieve double-digit net profit growth despite therelatively weak economic environment?
Victor Balli The key is to generate top-linemomentum and grow sales volumesmuch faster than themarket. If we can continuously reduce manufacturing and logistics costs per tonne atthe same time and keep overhead costs stable – both a major focus of our company foryears – we can create a strong basis for profitable growth.
Q With the level of top-line growth you have achieved,would it be possible to showan evengreater operating leverage?
VB If the Group continues to grow volumes at the current pace, it is difficult to increaseprofits even faster.We are constantly investing in new factories or expanding existinglines and operations. As the outsourcing partner of choice we cannot afford to makeany mistakes. As such we need to invest in quality and services as well. Over time,though, we should be able to further optimize current processes and achieve betterleverage.
Q How do you manage the volatility of raw material prices and other risks within thebusiness?
VB First of all, for about 80% of our sales we run a business model that allows us to pass onfluctuations in costs of raw material prices to our customers.We quote market pricesto our customers and once we receive an order, we hedge the underlying raw materi-als needed. Similarly, we constantly eliminate all transactional currency exchange risksthrough our central treasury department. My risk department monitors commodityprices and currency exposures on a regular basis using a Value at Risk (VaR) model.
Q Your net financial expenses are going down year by year. Will this continue?VB This fiscal year, we benefited from lower average interest rates, a flat net debt and our
stable financing structure.This should continue for at least another year.While there isno refinancing pressure,we constantly monitor the financial and capital markets to lookfor windows of opportunity to further improve our capital structure and the averageterm of our financing.
52 Interview with the CFO
The CFO’s view
“Competitive financing and tax cost, focuson working capital plus daily managementof risks are vital for our growth strategy.”
Victor BalliChief Financial Officer
Konzernrechnung 53
Q Following a review of Barry Callebaut’s annual accounts by SIX Swiss Exchange, you haveannounced that you will modify the company’s accounting model. What effect will thishave and when will it be applied?
VB The review showed that there are different expert views on how to best apply IFRS onour business model.While Barry Callebaut was cleared of all charges, we nonethelessdecided to adapt a less controversial accounting model effective fiscal year 2010/11, inline with the Group’s strategy of increased sourcing in the origin countries. In the newmodel, we will value inventories at the lower of cost and net realizable value. Thecocoa price risks related to inventories exceeding firm chocolate sales commitmentswill be hedged with cocoa futures in a fair value hedge relationship. I expect the revisedmodel to produce essentially the same result for the income statement as today.
Q Information Management is also under your responsibility. What contribution did thisdepartment make to the overall Group?
VB The IT/IM department is an important pillar for the fast development of our business.Without the appropriate systems we would not be able to cope with the speed of ourgrowth. Most of our factories and operations worldwide run on a common SAP plat-form.This allows us to smoothly add new factories and create transparency and trace-ability along the entire supply chain.We have continuously increased IT/IM investmentsover the past years and they now run at about CHF 30 million per annum; at the sametime, IT operating expenses were kept flat.
Q What is your main focus for fiscal year 2010/11?VB Besides achieving our guidance in terms of growth and profitability, we will continue
to closely monitor and reduce our working capital. At the same time, we will try tosimplify and centralize our support and overhead processes.Finally, securing long-termcredit facilities at competitive terms, maintaining our attractive tax rate plus findingand keeping good talents are a permanent focus of my teams.
Interview with the CFO 53
New program “Capital Excellence” startedIn view of our fast growth combined with the high volatility of raw material prices, pressure from customers paying laterand attempts of suppliers to reduce credit terms, Barry Callebaut initiated a program called “Capital Excellence” this fiscalyear. The objective is to reduce working capital by 20% over 3 years on a comparable basis. The program is driven by finan-cial controllers but operational business people are also heavily involved. It is also part of the bonus incentive plan of mostmanagers. In the first year, we made good progress in inventory and receivables management while payables need furtherimprovement.
Specific actions and achievementsa) Inventories (days sales in inventory)
Stocks were significantly reduced thanks to a focus on better planning and review of inventory levels needed. There wasan overall reduction of 11.7 days of sales coverage.
b) Receivables (days sales outstanding)Average days outstanding were reduced by 1.4; there was a strong focus on reducing overdues and optimizing the collec-tion process including electronic invoicing/EDI.
c) Payables (days payable outstanding, DPO)Despite a substantial increase in awareness within our purchasing organization, we only marginally improved DPOs.It was difficult to renegotiate existing contracts and payment terms need to be benchmarked against potential increasesin price. We plan to introduce supply chain financing to improve our payable situation next year.
Overall “Capital Excellence” achieved a positive impact of CHF 114 million (or 11.3% of net working capital) on average overthe past year, excluding fluctuations of foreign exchange rates and rawmaterial prices.
54 Konzernrechnung
Financial Review
Consolidated Income StatementSales volume showed solid growth of 7.6% from 1,213,610 tonnes to1,305,280 tonnes, to which all regions and both the Industrial and theFood Service/Retail Products contributed. In the Food Service/Retail Products, the growth recorded in Gourmet & Specialties Pro-ducts more than compensated for the decline in the ConsumerProducts business.The latter was affected by the disposal of our busi-ness in Asia during the prior year. Additionally, there was a shift ofvolumes between the Product Groups (from Food Manufacturers toConsumer Products) due to restatements of prior year figures in linewith the segment reporting changes introduced in 2009/10.
Revenue from sales and services grew by 6.8% fromCHF 4,880.2million to CHF 5,213.8 million. The positive impact of the high rawmaterial prices, namely for cocoa, on revenue were largely offset bysignificant foreign currency translation effects. Adjusted for theseeffects, revenues from sales and services grew by 6.5%, driven by thevolume increase as pointed out above.
Gross profit increased by 4.0% to CHF 736.2 million fromCHF 707.8 million in prior year. Gross profit was negatively affectedby translation effects and the low combined cocoa ratio throughoutthe year but the volume growth, in particular the disproportionatelyhigh growth of the higher margin Gourmet business,more than com-pensated for these effects. In local currencies, gross profit grew by6.3%.
Gross profit in relation to revenue from sales and services edgeddown to 14.1% from 14.5% in the prior year. Gross profit per tonnereceded slightly by 3.3% to CHF 564 from CHF 583 the year before.This is mainly due to translation effects as most currencies weakenedagainst the Group’s reporting currency, the Swiss franc.
Marketing and sales expenses amounted to CHF 120.8 million,almost constant compared to prior year (CHF 120.3 million).Addi-tional costs coming from acquisitions and the growth in sales werepartly compensated for by positive foreign currency effects and part-ly by cost-saving measures, without compromising on the Group’sstrategy to strengthen customer relationships.
General and administration expenses decreased slightly toCHF 248.8 million from CHF 250.6 million.The effects from growthand acquisitions were offset by cost savings and positive effects fromthe currency translation.
Other income in the amount of CHF 20.5 million was recordedcompared to CHF 34.4 million in prior year. In both years, thisposition included operating but non-sales-related income items, suchas gains on disposals of subsidiaries and assets, sales of waste pro-ducts and income generated by the Group’sTraining Center, SchlossMarbach. Prior year’s figure included the gain on disposal of theAsian Consumer business.
Other expenses amounted to CHF 16.6 million compared toCHF 20.5 million in the prior year. This position comprises restruc-turing costs, litigation and severance payments, impairment chargesand losses on sales of property, plant and equipment and other non-recurring items.
Operating profit (EBIT) increased by 5.6% to CHF 370.4 million,compared to CHF 350.8 million in the prior year. Excluding the im-pact from foreign currency translation, the EBIT growth amountedto 7.9%.All regions and product groups made a positive contributionto EBIT;also to EBIT growth all contributed except for RegionAsia-Pacific and the Consumer Products Group, which benefited from thenon-recurring gain on the sale of the Asian Consumer business inprior year. The biggest absolute contribution to EBIT came fromRegion Europe in terms of geography and from FoodManufacturersin terms of product groups.The biggest contributions to EBIT growthcame from Region Europe and the Gourmet Product Group.
EBIT per tonne receded slightly to CHF 283.8 from CHF 289.1due to currency translation effects. The decline of EBIT per tonnein Global Sourcing & Cocoa (due to the effects of the combinedcocoa ratio development) and Asia (due to the non-recurring gainon the sale of the Consumer business in prior year) were compensa-ted for by a higher EBIT per tonne in the other regions. This is theresult of expenses growing at a slower rate than volume due to tightcost control and scale effects on overhead costs. In local currencies,EBIT per tonne edged up by 0.3%.
Financial income declined to CHF 2.0 million from CHF 5.9 mil-lion in the preceding year as a result of both lower interest incomeand the absence of gains on derivative financial instruments this year.
Financial expenses were significantly lower at CHF 83.1 millioncompared to CHF 97.5 million in the prior year.This decrease resul-ted mainly from lower average interest rates on the floating rate debtand currency translation effects, which, however, were partly offsetby losses on derivative financial instruments related to the hedgingof interest rates.
Result from investment in associates and joint ventures amoun-ted to CHF –0.2 million compared to CHF 0.5 million in the year be-fore and contains the Group’s share in equity movements of equity-accounted investees, i.e. participations in companies, over which theGroup has significant influence but not control.
54 Financial Review
Konzernrechnung 55
Income taxes increased to CHF 37.3 million from CHF 32.7 mil-lion in prior year. This is mainly the result of a higher profit beforeincome taxes whereas the Group’s effective tax rate was almost con-stant at 12.9% compared to 12.6% the year before.
Net profit for the year amounted to CHF 251.7 million, a stronggrowth of 10.9% compared CHF 226.9 million in prior year. In localcurrencies, the increase amounted to 13.5%.This is the result of thehigher operating result and lower net financial expenses. Net profitfor the year attributable to the shareholders of the parent companyamounted to CHF 251.2 million, compared to CHF 226.9 million inthe precedent year.
Basic earnings per share increased by 10.5% to CHF 48.62, upfrom CHF 43.99 last year. Cash earnings per share, defined as ope-rating cash flow before working capital changes divided by basicshares outstanding, showed a considerable improvement of 9.3% toCHF 88.60 up from CHF 81.05 in prior year.
Consolidated Balance Sheet and financing structureTotal assets at the end of August 2010 stood at CHF 3,570.8 million,an increase of CHF 56.0 million or 1.6% compared to CHF 3,514.8million one year before. This is mainly the result of higher assetsrequired due to the growth of the business, partly compensated forby currency translation effects and operational improvements relatedto working capital management.
Net working capital was further reduced by CHF 45.2 million or4.5% to CHF 964.9 million at the end of August 2010 compared toCHF 1,010.1 million at the end of the prior year.This is the result ofthe favorable impact from foreign currency translation and opera-tional improvements, partly offset by higher inventories, receivablesand other current assets resulting from the volume growth and byhigher net derivative financial assets and liabilities.
Net debt at August 31, 2010 decreased by CHF 71.9 million toCHF 870.8 million from CHF 942.7 million in prior year, benefitingfrom currency effects due to the strong Swiss franc.The weighted ave-rage maturity of the Group’s total debt portfolio including undrawncommitted facilities decreased from 6 to 5 years.
Equity – including equity attributable to the shareholders of theparent company and non-controlling interests – increased byCHF 47.1 million or 3.7% to CHF 1,303.2 million from CHF 1,256.1million at the end ofAugust 2009.Equity attributable to the sharehol-ders of the parent company amounted to CHF 1,302.3 million com-pared to last year’s CHF 1,255.6 million.The debt-to-equity ratio im-proved from 75.1% to 66.9% and the solvency ratio improved from35.7% to 36.5%.The increase in equity and the improvement of theaforementioned key figures resulted from the positive impact of netprofit on equity, although this was offset to a large extent by signifi-cant foreign currency translation impacts and the repayment of sharecapital in lieu of a dividend. The return on invested capital (ROIC)increased to 14.8% from 13.9% in the prior year.
Consolidated Cash Flow StatementOperating cash flow before working capital changes improved con-siderably by 9.5% to CHF 457.8 million compared to CHF 418.1 mil-lion in the prior year.
The cash outflow for working capital changes was significantlyhigher mainly due to the higher cash outflow for inventories as a re-sult of the business growth and high raw material prices, partly offsetby higher payables. Cash outflow for interest and taxes on the otherhand was lower than in prior year.
This resulted in an overall decline in the Net cash flow fromoperating activities (including working capital changes) to CHF 177.7million down from CHF 240.6 million the year before.
Net cash flow from investing activities amounted to CHF –156.1million, compared to CHF –138.9 million in the preceding year.Thisyear’s amount included the cash outflow of CHF –36.2 million for theacquisition of a business in Spain and deferred payments for earlieracquisitions (prior year CHF –16.9 million for acquisition andCHF 17.2 million from the disposal of subsidiaries).The biggest out-flow in both years, however, related to capital expenditures for oper-ations such as capacity expansions, replacements,modernizations andInformation Technology (CHF –145.1 million in the current andCHF –144.4 million in the prior year).This position also includes pro-ceeds from the sale of assets (CHF 19.6 million in the current andCHF 2.4 million in the prior year) as well as some other minor items.
Net cash flow from financing activities amounted to CHF –23.0million compared to CHF –78.1 million in prior year. This positionmainly includes the net proceeds from the issue of new debt inthe amount of CHF 47.4 million (in prior year repayment ofCHF –10.1 million), the repayment of share capital of CHF –64.6 mil-lion (in prior year CHF –59.4 million) and the net purchase/sale oftreasury shares in the amount of CHF –5.7 million (prior yearCHF –8.8 million).
Financial Review 55
56 Konzernrechnung
Consolidated IncomeStatement
56 ConsolidatedFinancial Statements
for the fiscal year ended August 31, Notes 2009/10 2008/09in thousands of CHF
Revenue from sales and services 5,213,779 4,880,177
Cost of goods sold (4,477,608) (4,172,355)
Gross profit 736,171 707,822
Marketing and sales expenses (120,781) (120,324)General and administration expenses (248,794) (250,608)Other income 6 20,456 34,357Other expenses 7 (16,641) (20,494)
Operating profit (EBIT) 370,411 350,753
Financial income 8 2,021 5,904Financial expenses 9 (83,122) (97,493)Result from investments in associates and joint ventures 17 (225) 484
Profit before income taxes 289,085 259,648
Income tax expenses 10 (37,342) (32,723)
Net profit for the year 251,743 226,925of which attributable to:– shareholders of the parent company 251,226 226,907– non-controlling interest 517 18
Earnings per share 11
Basic earnings per share (CHF/share) 48.62 43.99Diluted earnings per share (CHF/share) 48.47 43.85
Consolidated 57Financial Statements
Consolidated Statement ofComprehensive Income
for the fiscal year ended August 31, Notes 2009/10 2008/09in thousands of CHF
Net profit for the year 251,743 226,925Cash flow hedges 14 (3,580) (6,339)Tax effect on cash flow hedges 1,585 2,566Currency translation differences (138,026) (86,930)Other comprehensive income for the year, net of tax (140,021) (90,703)
Total comprehensive income for the year 111,722 136,222of which attributable to:– shareholders of the parent company 111,309 136,257– non-controlling interest 413 (35)
58 ConsolidatedFinancial Statements
Assets
as of August 31, Notes 2010 2009in thousands of CHF
Current assetsCash and cash equivalents 17,360 33,993Short-term deposits 750 2,137Trade receivables and other current assets 12 587,380 524,847Inventories 13 1,186,231 1,294,545Current income tax assets 2,760 5,489Derivative financial assets 14 370,580 221,649Total current assets 2,165,061 2,082,660
Equity 25Share capital 197,494 262,119Retained earnings and other reserves 1,104,787 993,437Total equity attributable to the shareholders of the parent company 1,302,281 1,255,556Non-controlling interest 882 589Total equity 1,303,163 1,256,145Total liabilities and equity 3,570,847 3,514,847
Consolidated Balance Sheet
Consolidated 59Financial Statements
Cash flows from operating activities
for the fiscal year ended August 31, Notes 2009/10 2008/09in thousands of CHF
Profit before income taxes 289,085 259,648Adjustments for:Depreciation of property, plant and equipment 15 77,861 82,309Amortization of intangible assets 18 22,428 23,065Impairment of property, plant and equipment 7, 15 – 566Recognition of negative goodwill on acquisitions 1 – (1,502)(Gain) on disposal of property, plant and equipment, net (6,152) (30)(Gain) on sale of subsidiary 2 – (17,950)Foreign exchange (gain) loss (15,852) 28,408Fair value (gain) loss on derivative financial instruments (58,016) (47,183)Fair value (gain) loss on hedged firm commitments (82,503) (76,721)Fair value (gain) loss on inventories 160,038 57,951Write-down of inventories 13 4,768 5,462Increase (decrease) of allowance for doubtful receivables (1,384) 3,024Increase (decrease) of provisions 2,615 16,033Increase (decrease) of employee benefit obligations (6,078) (8,455)Equity-settled share-based payments 4, 24 5,716 11,577Result from investments in associates and joint ventures 225 (484)(Interest income) 8 (2,021) (3,883)Interest expenses 9 67,061 86,223
Operating cash flow before working capital changes 457,791 418,058
(Increase) decrease in trade receivables and other current assets (24,513) (24,199)(Increase) decrease in inventories (143,387) (9,307)Increase (decrease) in trade payables and other current liabilities 2,025 (19,004)Use of provisions (11,151) (4,231)Cash generated from operations 280,765 361,317
Net cash flow from operating activities 177,744 240,643
Consolidated Cash FlowStatement
60 ConsolidatedFinancial Statements
Consolidated Cash FlowStatement
Cash flows from investing activities
for the fiscal year ended August 31, Notes 2009/10 2008/09in thousands of CHF
Purchase of property, plant and equipment 15 (119,258) (113,314)Proceeds from sale of property, plant and equipment 19,580 2,370Purchase of intangible assets 18 (25,850) (31,129)Proceeds from sale of intangible assets – 61Acquisition of subsidiaries, net of cash acquired 1 (36,199) (16,938)Acquisition of associates and joint ventures – (164)Proceeds from disposal of subsidiaries 2 – 17,198Purchase of short-term deposits – (1,396)Proceeds from sale of short-term deposits 1,309 175Purchase of other non-current assets (141) (589)Proceeds from sale of other non-current assets 2,453 2,048Interest received 1,986 2,787Net cash flow from investing activities (156,120) (138,891)
Cash flows from financing activities
for the fiscal year ended August 31, 2009/10 2008/09in thousands of CHF
Proceeds from the issue of short-term debt 112,546 94,493Repayment of short-term debt (136,198) (246,946)Proceeds from the issue of long-term debt 151,820 149,077Repayment of long-term debt (80,750) (6,748)Capital reduction and repayment 25 (64,619) (59,392)Purchase of treasury shares 25 (5,988) (8,808)Sale of treasury shares 307 –Dividends paid to non-controlling interest 25 (120) (68)Effect of change in non-controlling interest 25 – 300Net cash flow from financing activities (23,002) (78,092)
Effect of exchange rate changes on cash and cash equivalents 617 5,559Net increase (decrease) in cash and cash equivalents (761) 29,219
Cash and cash equivalents at the beginning of the fiscal year 4,655 (24,564)Cash and cash equivalents at the end of the fiscal year 3,894 4,655Net increase (decrease) in cash and cash equivalents (761) 29,219
Cash and cash equivalents 17,360 33,993Bank overdrafts (13,466) (29,338)Cash and cash equivalents as defined for the cash flow statement 3,894 4,655
Consolidated 61Financial Statements
Attributable to the shareholders of the parent company
Sharecapital
Treasuryshares
Retainedearnings
Hedgingreserves
Cumulativetranslationadjustments
Total Non-con-trollinginterest
Totalequity
in thousands of CHF
As of August 31, 2008 321,574 (13,604) 908,320 (1,219) (39,149) 1,175,922 392 1,176,314Currency translation adjustments (86,877) (86,877) (53) (86,930)Effect of cash flow hedges (note 14) (6,339) (6,339) (6,339)Taxes recognized in equity (note 14, 19) 2,566 2,566 2,566Other comprehensive income, net of tax (3,773) (86,877) (90,650) (53) (90,703)Net profit for the year 226,907 226,907 18 226,925Total comprehensive income for the year 226,907 (3,773) (86,877) 136,257 (35) 136,222Capital reduction and repayment (59,455) 63 (59,392) (59,392)Movements of non-controlling interest (note 25) – 232 232Purchase of treasury shares (8,808) (8,808) (8,808)Equity-settled share-based payments 17,799 (6,222) 11,577 11,577As of August 31, 2009 262,119 (4,613) 1,129,068 (4,992) (126,026) 1,255,556 589 1,256,145Currency translation adjustments (137,922) (137,922) (104) (138,026)Effect of cash flow hedges (note 14) (3,580) (3,580) (3,580)Taxes recognized in equity (note 14, 19) 1,585 1,585 1,585Other comprehensive income, net of tax (1,995) (137,922) (139,917) (104) (140,021)Net profit for the year 251,226 251,226 517 251,743Total comprehensive income for the year 251,226 (1,995) (137,922) 111,309 413 111,722Capital reduction and repayment (64,625) 6 (64,619) (64,619)Movements of non-controlling interest (note 25) – (120) (120)Purchase of treasury shares (5,988) (5,988) (5,988)Sale of treasury shares 329 (22) 307 307Equity-settled share-based payments 7,081 (1,365) 5,716 5,716As of August 31, 2010 197,494 (3,191) 1,378,913 (6,987) (263,948) 1,302,281 882 1,303,163
Consolidated Statementof Changes in Equity
Organization and business activityBarry CallebautAG (“The Company”) was incorporated onNovem-ber 24, 1994 under Swiss law, having its head office in Zurich, Switzer-land, at Pfingstweidstrasse 60. Barry Callebaut AG is registered inSwitzerland and has been listed on the SIX Swiss Exchange (BARN,ISIN Number: CH0009002962) since 1998. As of August 31, 2010,Barry Callebaut’s market capitalization based on issued shares wasCHF 3,632million (August 31, 2009:CHF 2,968million).TheGroup’sultimate parent is Jacobs Holding AG with a share of 50.11% of theshares issued (August 31, 2009: 50.21%).
Barry CallebautAG and its subsidiaries (“The Group”) is one ofthe world’s leading cocoa and chocolate companies, serving the foodindustry, from food manufacturers to professional users of chocolate(such as chocolatiers, pastry chefs or bakers) to global retailers. TheGroup offers a broad and expanding range of chocolate and othercocoa-based products with numerous recipes. It also provides a com-prehensive range of services in the fields of product development,processing, training and marketing. The Group is fully vertically in-tegrated along the entire value chain: from sourcing of raw materialsto finished products on the shelf.
The principal brands under which the Group operates are BarryCallebaut, Callebaut, Cacao Barry, Carma, Luijckx, Van Leer andVan Houten for chocolate products; Barry Callebaut, Bensdorp,VanHouten and Chadler for cocoa powder; Bensdorp, Van Houten,Caprimo and Ögonblink for vending mixes; Sarotti, Alpia, JacquesandAlprose for consumer products.
The principal countries, in which the Group operates, includeBelgium, Brazil, Cameroon, Canada, China, Côte d’Ivoire, France,Germany, Ghana, Italy, Japan, Malaysia, Mexico, the Netherlands,Poland, Russia, Singapore, Spain, Sweden, Switzerland, the UnitedKingdom and the U.S.
Basis of presentationThe consolidated financial statements of the Group have been pre-pared in accordance with International Financial Reporting Stan-dards (IFRS) and comply with Swiss law.
For consolidation purposes, Barry Callebaut AG and its sub-sidiaries prepare financial statements using the historical cost basisas disclosed in the accounting policies below, except for themeasure-ment at fair value of derivative financial instruments, hedged firmcommitments and inventories and except for defined benefit obli-gation that is accounted for according to the projected unit creditmethod.
The prior year’s Consolidated Balance Sheet has been reclassi-fied to conform with the current period’s presentation, whereasfinancial assets of CHF 0.4 million (2009:CHF 0.5 million) have beencombined with other non-current assets.
Management assumptions and significant estimatesThe preparation of financial statements requires management tomake judgments, estimates and assumptions that affect the appli-cation of accounting policies and the reported amounts of assets,liabilities, income and expenses.Actual results may differ from theseestimates.
Estimates and underlying assumptions are reviewed on an on-going basis. Revisions to accounting estimates are recognized in theperiod in which the estimate is revised and in any future periodsaffected.
In particular, information about significant areas of estimationuncertainty and critical judgments in applying accounting policiesthat have the most significant effect on the amount recognized in thefinancial statements are described below:
Note 1 Acquisitions – Fair value measurementNote 13 Inventories – Application of broker-trader exemptionNote 14 Derivative financial instruments and hedging activities –
Designation of inventory as a hedging instrumentNote 18 Goodwill –Measurement of the recoverable amounts
of cash-generating unitsNote 19 Deferred tax assets and liabilities – Utilization of tax lossesNote 24 Employee benefit obligation –Measurement of defined
benefit obligations
Scope of consolidation/SubsidiariesThe consolidated financial statements of the Group include all theassets, liabilities, income and expenses of Barry Callebaut AG andthe companies which it controls. Control is presumed to exist whena company owns, either directly or indirectly, more than 50% of thevoting rights of a company’s share capital or otherwise has thepower to exercise control over the financial and operating policies ofa subsidiary so as to obtain the benefits from its activities. Non-con-trolling interest are shown as a component of equity in the balancesheet and the share of the net profit attributable to non-controllinginterest is shown as a component of the net profit for the period inthe Consolidated Income Statement. Newly acquired companies areconsolidated from the date control is transferred (the effective dateof acquisition), using the purchase method. Subsidiaries disposed ofare included up to the effective date of disposal.
All intragroup balances and unrealized gains and losses orincome and expenses arising from intragroup transactions are elimi-nated in preparing the consolidated financial statements.Unrealizedgains arising from transactions with associates and jointly controlledentities are eliminated to the extent of the Group’s interest in theentity.Unrealized losses are eliminated in the sameway as unrealizedgains, but only to the extent that there is no evidence of impairment.
Purchases and disposals of non-controlling interest in subsidiariesThe Group applies the policy of treating transactions with non-controlling interest equal to transactions with equity owners of theGroup. For purchases from non-controlling interest, the differencebetween consideration paid and the relevant share acquired of thecarrying value of net assets of the subsidiary is recorded in equity.Gains or losses on disposal to non-controlling interest are also re-corded in equity.
Summary ofAccounting Policies
62 ConsolidatedFinancial Statements
Consolidated 63Financial Statements
Options over existing non-controlling interestThe Group accounts for written put options over existing non-con-trolling interest in derecognizing the non-controlling interest andrecords instead a liability to the extent of the put option exercise price,discounted to the balance sheet date. Should the option expire with-out being exercised by theminority shareholders, the liability is derec-ognized and non-controlling interest is recorded.
Investments in associates and joint venturesAssociates are those companies in which the Group has significantinfluence but not control.This is normally presumed when theGroupholds between 20% and 50% of the voting power of another entity.Joint ventures are those entities over whose activities the Group hasjoint control, established by contractual agreement and requiringunanimous consent for strategic financial and operating decisions.Associates and joint ventures are accounted for using the equitymethod (equity-accounted investees) and are recognized initially atcost. The Group’s investment includes goodwill identified on acqui-sition, net of any impairment losses.The consolidated financial state-ments include the Group’s share of the income and expenses andequity movements of equity-accounted investees from the date thatsignificant influence or joint control commences until the datesignificant influence or joint control ceases.
Foreign currency transactionsThe functional currency of theGroup’s entities is the currency of theirprimary economic environment. In individual companies, trans-actions in foreign currencies are recorded at the rate of exchange atthe date of transaction.Monetary assets and liabilities denominatedin foreign currencies are translated into respective functional curren-cies at the exchange rate prevailing at the year-end date.Any resul-ting exchange gains and losses are taken to the income statement.If related to commercial transactions or to themeasurement of finan-cial instruments in coverage of commercial transactions, such foreigncurrency gains and losses are classified as cost of goods sold. Other-wise, foreign currency gains and losses are classified as financialincome and financial expense.
Foreign currency translationFor consolidation purposes, assets and liabilities of subsidiariesreporting in currencies other than Swiss francs are translated toSwiss francs using year-end rates of exchange. Income and expensesare translated at the average rates of exchange for the year. Diffe-rences arising from the translation of financial statements using theabove method are recorded as cumulative translation adjustmentsin equity.
Major foreign exchange rates
Closing rate Average rate Closing rate Average rate2009/10 2008/09
Cash and cash equivalentsCash and cash equivalents comprise of cash on hand, checks, bankbalances and unrestricted bank deposit balances with an originalmaturity of 90 days or less. Bank overdrafts that are repayable ondemand and form an integral part of the Group’s cash managementare included as a component of cash and cash equivalents for thepurpose of the Consolidated Cash Flow Statement.
Trade receivables and other current assetsTrade receivables are stated at amortized cost, less anticipatedimpairment losses. Impairment provision for receivables representthe Group’s estimates of incurred losses arising from the failure orinability of customers to make payments when due.These estimatesare assessed on an individual basis, taking into account the agingof customers’ balances, specific credit circumstances and the Group’shistorical default experience. If the Group is satisfied that norecovery of the amount owing is possible, the receivable is written offand the provision related to it is reversed.
TheGroupmaintains an asset-backed securitization program fortrade receivables, transferring the contractual rights to the cash flowsof third-party trade receivables at their nominal value minus adiscount.These receivables are derecognized from the balance sheet.The net amount reported under other current assets (see note 12) orother current liabilities (see note 21) is the amount of the discountminus the receivables already collected at the balance sheet date butnot yet remitted to the asset-purchasing company.
Derivative financial instruments and hedging activitiesThe nature of its business exposes the Group to a variety of risks.TheGroup’s overall risk management program acknowledges volatility ofmarkets and seeks to minimize the potential adverse effects on thefinancial performance of theGroup in a cost-efficientmanner.Furtherinformation on risk management can be found under note 26.
The Group uses derivative financial instruments in accordancewith its risk management policies to hedge its exposure to chocolatesales (related commodity price risks), which consist of the price riskof cocoa and other commodities such as dairy, sweeteners and nuts,foreign exchange risks and interest rate risks arising from opera-tional, financing and investment transactions.
TheGroup’s purchasing and sourcing center frequently buys andsells cocoa beans and other chocolate ingredients for the purpose ofgenerating a profit from short-term fluctuations in price or dealer’smargin. The practice of net cash settlement of commodity purchaseand sale contracts results in these contracts qualifying as derivativefinancial instruments.
Following the Group’s risk management policy, generally theoperating group companies do not hold derivative financial instru-ments for trading purposes.
Derivative financial instruments are accounted for at fair valuewith fair value changes recognized in the income statement.
Hedge accountingFor manufacturing and selling of their products, the operating com-panies require commodity raw materials such as cocoa beans andsemi-finished cocoa products as well as non-cocoa components suchas dairy, sweeteners and nuts.The value of the Group’s open sales andpurchase commitments and inventory of raw materials changes con-tinuously in line with price movements in the respective commoditymarkets. The Group uses commodity futures, forward contractsand inventory to manage price risks associated with the firm salescommitments of industrial chocolate (Contract Business – see riskmanagement note 26).
The Group and its subsidiaries enter into sales and purchasingcontracts denominated in various currencies and consequently areexposed to foreign currency risks, which are hedged by the Group’streasury department or – in case of legal restrictions – with localbanks. The Group’s interest rate risk is managed with interest ratederivatives.
Hedge accounting is applied to derivatives that are effective inoffsetting the changes in fair value or cash flows of the hedged items.The hedge relation is documented and the effectiveness of suchhedges is tested at regular intervals, at least on a semi-annual basis.
Fair value hedging – for commodity price risks and foreign currencyexchange risks related to the Contract Business
Generally, fair value hedge accounting is applied to hedge theGroup’sexposure to changes in fair value of a recognized asset or liability oran unrecognized firm commitment or an identified portion of such anasset, liability or firm commitment, that is attributable to a particularrisk, e.g. commodity price risks, and that could affect profit or loss. Forfair value hedges, the carrying amount of the hedged item is adjustedfor gains and losses attributable to the risk being hedged, the deriva-tive (hedging instrument) is remeasured at fair value and gains andlosses from both are taken to the income statement.When an unrec-ognized firm commitment is designated as a hedged item, the sub-sequent cumulative change in the fair value of the firm commitmentattributable to the hedged risk is recognized as an asset or liabilitywith a corresponding gain or loss in the income statement.The chan-ges in the fair value of the hedging instrument are also recognized inthe income statement.
For the chocolate price risk related to the sales contract of in-dustrial chocolate (Contract Business), the firm sales commitments,including cocoa and non-cocoa components, such as sweeteners, dairyand nuts, are designated as the hedged items while the forwardpurchase commitments and Contract Business inventories related tococoa and non-cocoa components as well as cocoa future contractsare designated as the hedging instruments.The hedging instruments(purchase side) as well as the hedged items (sales side) are measuredat fair value at the balance sheet date. The components of salescontracts represent commodities and are quoted in an active marketor are reliably determinable. The fair values thus calculated for thehedged items are recorded under the position “Fair value of hedgedfirm commitments” included in trade receivables and other currentassets or trade payables and other current liabilities depending onwhether the resulting amount is positive or negative.The fair values
thus calculated for the hedging instruments are recorded underthe position “Derivative financial assets” or “Derivative financialliabilities” depending on whether the resulting amount is positive ornegative.
For foreign currency exchange risks related to the firm sales com-mitments of industrial chocolate (Contract Business), fair valuehedge accounting is also applied.The hedge relationship is betweenthe unrecognized firm sales commitment (hedged item) and theforeign currency forward sales contract (hedging instrument). Thechanges in fair value of the hedging instrument are recognized inthe income statement.The cumulative change in the fair value of thefirm sales commitment attributable to the foreign currency risk isrecognized as an asset or liability with a corresponding gain or lossin the income statement.
Cash flow hedging – for interest rate risksIn general, Barry Callebaut applies cash flow hedge accounting forinterest rate derivatives, converting a portion of floating rate borro-wings to fixed rate borrowings.
Interest rate derivatives hedging exposures to variability in cashflows of highly probable forecasted transactions are classified as cashflow hedges. For each cash flow hedge relationship, the effective partof any gain or loss on the derivative financial instrument is recognizeddirectly in equity. Gains or losses that are recognized in equity aretransferred to the income statement in the same period in which thehedged exposure affects the income statement. The ineffective partof any gain or loss is recognized immediately in the income statementat the time hedge effectiveness is tested.
Hedge accounting is discontinued when the hedging instrumentexpires or is sold, terminated or exercised, or no longer qualifies forhedge accounting.At that point in time, any cumulative gain or losson the hedging instrument recognized in equity is kept in equityuntil the forecasted transaction occurs. If a hedged transaction is nolonger expected to occur, the net cumulative gain or loss recognizedin equity is immediately transferred to the income statement.
No hedge accounting designationThe Group’s purchasing and sourcing center and the In-house Bankof the Group fair value their derivative financial instruments withoutapplying hedge accounting.
Price List Business commodity risk hedging is based on fore-casted sales volume and excluded from hedge accounting, as noderivatives can be clearly designated to the forecasted price list sales.Therefore, these derivatives are carried at fair value with fair valuechanges recognized in the income statement.
In respect of the foreign exchange exposure of a recognizedmonetary asset or liability, no hedge accounting is applied.Any gainor loss on the financial derivative used to economically hedge thisrisk is recognized in the income statement thus compensating thegains and losses that arise from the revaluation of the underlyingasset or liability.
64 ConsolidatedFinancial Statements
Accounting Policies
Consolidated 65Financial Statements
InventoriesThe Group principally acquires cocoa beans, any semi-finished pro-ducts resulting from cocoa beans (such as cocoa liquor, butter, cakeor powder), other raw materials such as sweeteners, dairy and nutsand has industrial chocolate inventories with the purpose of sellingthem in the near future and generating a profit from fluctuations inprice or broker-traders’ margin. The Group therefore acts as a bro-ker-trader of such commodities and these inventories are measuredat fair value less costs to sell in accordance to the broker-traderexemption per IAS 2.5 (Inventories).
Other inventories, such as finished consumer products and otheritems related to the Price List Business are stated at the lower of costand net realizable value. The cost of inventories comprises the costsof materials, direct production costs including labor costs and anappropriate proportion of production overheads and factory depre-ciation. For movements in inventories, the average cost method isapplied. Net realizable value is defined as the estimated selling priceless costs of completion and direct selling and distribution expenses.
Assets held for sale and liabilities directly associated withassets held for saleLong-term assets and related liabilities are classified as held for saleand shown on the balance sheet in a separate line as “Assets held forsale” and “Liabilities directly associated with assets held for sale” ifthe carrying amount is to be realized by selling, rather than using, theassets. This is conditional upon the sale being highly probable tooccur and the assets being ready for immediate sale. For a sale to beclassified as highly probable, the following criteria must be met:management is committed to a plan to sell the asset, the asset is mar-keted for sale at a price that is reasonable in relation with its currentfair value and the completion of the sale is expected to occur within12 months.
Assets held for sale are measured at the lower of their carryingamount or the fair value less costs to sell. From the time they areclassified as “held for sale”, depreciable assets are no longer depre-ciated or amortized.
Financial assetsFinancial assets are accounted for in accordance with IAS 39, Fin-ancial Instruments: Recognition and Measurement. Accordingly,financial assets are classified into the following categories: held-to-maturity, at fair value through profit or loss, loans and receivables andavailable-for-sale. Financial assets with fixed or determinable pay-ments and fixed maturity that the Group has the positive intent andability to hold to maturity except for loans and receivables originatedby the Group are classified as held-to-maturity investments. Financialassets acquired principally for the purpose of generating a profit fromshort-term fluctuations in price are classified as at fair value throughprofit or loss. All other financial assets, excluding loans and recei-vables, are classified as available-for-sale.
All purchases and sales of financial assets are recognized on thetrade date. Financial assets are recognized when the Group becomesa party to the contractual provisions and are initially measured at fairvalue,which is the consideration given for them,plus transaction costsin the case of financial assets and liabilities not at fair value throughprofit or loss.Available-for-sale and fair value through profit or lossinvestments are subsequently carried at fair value by reference totheir quoted market price at the balance sheet date, without anydeduction for transaction costs that the Group may incur on theirsale or other disposal.
Gains or losses onmeasurement to fair value of available-for-saleinvestments are included directly in equity until the financial asset issold, disposed of or impaired, at which time the gains or losses arerecognized in net profit or loss for the period.
Held-to-maturity investments and loans and receivables arecarried at amortized cost using the effective interest rate method.
Financial assets are derecognized, using the weighted averagemethod,when theGroup loses control of the contractual rights to thecash flows of the assets or when the Group sells or otherwise dis-poses of the contractual rights to the cash flows, including situationswhere the Group retains the contractual rights but assumes a con-tractual obligation to pay the cash flows that comprise the financialasset to a third party. Such control is lost when the rights and bene-fits specified in the contract are realized, expired, or are surrendered.
Intangible assets
GoodwillGoodwill on acquisitions is the excess of acquisition-date fair valueof total consideration transferred and the acquisition-date fair valueof assets, liabilities and contingent liabilities. Following initial recog-nition, goodwill is measured at cost less any accumulated impairmentlosses. Goodwill is reviewed for impairment annually or morefrequently if events or changes in circumstances indicate that thecarrying value may be impaired.
Negative goodwill is recognized directly in the income statement.At the acquisition date, any goodwill acquired is allocated to each ofthe cash-generating units expected to benefit from the combination’ssynergies.
Impairment is determined by assessing the recoverable amountof the cash-generating unit to which the goodwill relates.Where therecoverable amount of the cash-generating unit is less than thecarrying amount, an impairment loss is recognized.Where goodwillforms part of the cash-generating unit and part of the operation with-in that unit is disposed of, the goodwill associated with the operationdisposed of is included in the carrying amount of the operation whendetermining the gain or loss on disposal of the operation. Goodwilldisposed of in this circumstance is measured on the basis of the rela-tive values of the operation disposed of and the portion of the cash-generating unit retained.
Research and development costsResearch costs are expensed as incurred, whereas product develop-ment costs are only expensed as incurred when it is considered im-possible to quantify the existence of a market or future cash flows forthe related products or processes with reasonable assurance.
Development costs for projects relate to software, recipes andinnovation and are capitalized as an intangible asset if it can be de-monstrated that the project is expected to generate future economicbenefits. Development costs previously recognized as an expense arenot recognized as an asset in a subsequent period.Development coststhat have been capitalized are amortized on a straight-line basis overthe period of their expected useful life. The amortization periodsadopted do not exceed five years.
Other intangible assets
Other acquired intangible assets include patents, trademarks, brandnames and licenses. Patents and licenses are amortized over theirperiod of validity. All other intangible assets are amortized on astraight-line basis over their anticipated useful life not exceeding20 years.
Property, plant and equipmentProperty, plant and equipment are measured at the acquisition orconstruction cost less accumulated depreciation and accumulatedimpairment losses. A straight-line method of depreciation is appliedthrough the estimated useful life. Estimated useful lives of majorclasses of depreciable assets are:
Buildings (including warehouses and installations) 20 to 50 yearsPlant and machinery 10 to 20 yearsOffice equipment, furniture and motor vehicles 3 to 10 years
Maintenance and repair expenditures are charged to the incomestatement as incurred.
The carrying amounts of property, plant and equipment arereviewed at least at each balance sheet date to assess whether theyare recoverable in the form of future economic benefits. If the re-coverable amount of an asset has declined below its carrying amount,an impairment loss is recognized to reduce the value of the assets toits recoverable amount. In determining the recoverable amount ofthe assets, expected cash flows are discounted to their present value.
Leased assetsLeases are classified as finance leases whenever the terms of the leasetransfer substantially all the risks and rewards of ownership to thelessee.
Assets held under finance leases are stated as assets of theGroupat the lower of their fair value and the present value of the minimumlease payments at inception of the lease, less accumulated deprecia-tion and impairment losses.The corresponding liability to the lessoris included in the balance sheet as a finance lease obligation. Financecosts are charged to the income statement over the term of therelevant lease so as to produce a constant periodic interest charge onthe remaining balance of the obligations for each accounting period.
Leases where a significant portion of the risks and rewards ofownership are retained by the lessor are classified as operatingleases. Rentals payable under an operating lease are charged to theincome statement on a straight-line basis over the term of the lease.
Financial liabilitiesFinancial liabilities are initially recognized at fair value, net of trans-action costs, when the Group becomes a party to the contractualprovisions.They are subsequently carried at amortized cost using theeffective interest rate method. A financial liability is removed fromthe balance sheet when the obligation is discharged, cancelled, orexpires.
ProvisionsProvisions are recognized when theGroup has a present legal or con-structive obligation as a result of past events and it is probable thatan outflow of resources will be required to settle the obligation, anda reliable estimate thereof can be made. Provisions are recorded foridentifiable claims and restructuring costs. Restructuring provisionsmainly comprise employee termination payments. Specific provisionsfor restructuring costs are recorded at such time as the managementapproves the decision to restructure and a formal plan for restructur-ing is communicated.
Employee benefit obligations/Post-employment benefitsThe liabilities of the Group arising from defined benefit obligationsand the related current service costs are determined on an actuarialbasis using the projected unit credit method.
Actuarial gains and losses are recognized in the income statementover the remaining working lives of the employees to the extent thattheir cumulative amount exceeds 10% of the greater of the presentvalue of the obligation and of the fair value of plan assets.
For defined benefit plans, the actuarial costs charged to theincome statement consist of current service cost, interest cost, expec-ted return on plan assets and past service cost, gains or losses relatedto curtailments or early settlements as well as actuarial gains orlosses to the extent they are recognized.The past service cost for theenhancement of pension benefits is accounted for over the periodthat such benefits vest.
Some benefits are also provided by defined contribution plans;contributions to such plans are charged to the income statementas incurred.
Post-retirement benefits other than pensionsCertain subsidiaries provide healthcare and insurance benefits fora portion of their retired employees and their eligible dependents.The cost of these benefits is actuarially determined and included inthe related function expenses over the employees’ working lives.Therelated liability is also included in the position Employee benefits.
66 ConsolidatedFinancial Statements
Accounting Policies
Consolidated 67Financial Statements
Employee stock ownership programFor the employee stock ownership program, treasury shares are used.In accordance with IFRS 2, the compensation costs in relation withshares granted under the employee stock ownership program arerecognized in the income statement over the vesting period at theirfair value as of the grant date.
Other long-term employee benefitsOther long-term employee benefits represent amounts due to em-ployees under deferred compensation arrangements mandated bycertain jurisdictions in which the Group conducts its operations.Benefit cost is recognized on an actuarial basis in the income state-ment.The related liability is included in other long-term liabilities.
Share capital/Purchase of own sharesWhere the Company or its subsidiaries purchase the Company’sshares, the consideration paid including any attributable transactioncosts is deducted from equity as treasury shares.Where such sharesare subsequently sold or reissued, any consideration received isincluded in equity.
DividendsDividends on ordinary shares are recognized as a liability when theyare approved by the shareholders.
TaxesCurrent income taxes are recognized based on taxable income,whereas other taxes such as non-recoverable taxes withheld on divi-dends, management fees and royalties received or paid are reportedunder other expense. Non-recoverable withholding taxes are onlyaccrued if distribution by subsidiary companies is foreseen.
Income taxes are calculated in accordance with the tax regula-tions in effect in each country.
The Group recognizes deferred income taxes using the balancesheet liability method. Deferred income tax is recognized on alltemporary differences arising between the tax values of assets andliabilities and their values in the consolidated financial statements.Deferred income tax assets are recognized to the extent it is probablethat future taxable profit will be available against which the tempo-rary differences can be utilized. Deferred income tax assets andliabilities are calculated using tax rates that are expected to applyto the period when the asset is realized or the liability is settled,based on tax rates and laws that have been enacted or substantivelyenacted at the balance sheet date.
Revenue recognitionRevenues from sales and services consist of the net sales turnover ofsemi-processed and processed goods and services related to food-processing.
Revenues from the sale of goods are recognized when the signi-ficant risks and rewards of ownership of the goods have been trans-ferred to the buyer,which is mainly upon shipment.Appropriate pro-visions are made for all additional costs to be incurred in connectionwith the sales including the cost of returns. Additionally, gains and
losses related to derivative financial instruments used for hedgingpurposes are recognized in revenues in accordance with the policiesset out in this section.
Revenues and costs related to trading of rawmaterials,which arefair valued, are netted. Interest income is recognized as it accrues onan effective yield basis, when it is determined that such income willflow to theGroup.Dividends are recognized when the right to receivepayment is established.
Government grantsProvided there is reasonable assurance that they will be irrevocablyreceived, grants relating to capital expenditure are deducted fromthe cost of property, plant and equipment and thus recognized in theincome statement on a straight-line basis over the useful life ofthe asset.
Other grants that compensate the Group for expenses incurredare deferred and recognized in the income statement over the periodnecessary tomatch themwith the costs they are intended to compen-sate.
Segment reportingOperating segments are reported in a manner consistent with theinternal reporting provided to the chief operating decision-maker.The chief operating decision-maker, who is responsible for allocatingresources and assessing performance of the operating segments, hasbeen identified as the Group’s Executive Committee.
For more details refer to “Changes in accounting policies” – IFRS 8.
Changes in accounting policies
Amended International Financial Reporting Standards and Inter-pretations which became effective for this financial year
IFRS 3 (Revised) – Business Combinations (effective July 1, 2009)The revised standard has been adopted for acquisitions after Septem-ber 1, 2009. Therefore, the Group has not included acquisition-related expenses in the consideration paid.For further details on busi-ness combinations refer to note 1 “Acquisitions”.
The amendments to IFRS 7 expand the disclosures required inrespect of fair value measurements and liquidity risk.The Group haselected not to provide comparative information for these expandeddisclosures in the current year in accordance with the transitionalreliefs offered in these amendments. Disclosures in these financialstatements (note 26) have been modified to reflect the InternationalAccounting Standards Board’s clarification (as part of Improvementsto IFRSs [2009]).
IFRS 8 – Operating Segments (effective January 1, 2009)IFRS 8 supersedes IAS 14 “Segment Reporting”. The new standardrequires that reportable segments are identified consistent with theinternal information upon which the chief operating decision-maker(CODM) is allocating the resources and assessing the performanceof the operating segments. The Group has identified the ExecutiveCommittee as the CODM. It reviews the segments Global Sourcing& Cocoa, Western Europe, Eastern Europe, Americas and Asia-Pacific. For the purpose of the consolidated financial statements,Western Europe and Eastern Europe were aggregated. GlobalSourcing & Cocoa has in the old format of the segment reporting(IAS 14) been allocated to the regions. The prior-year figures havebeen restated accordingly. In addition to the operating segments, in-formation for the following product groups is also disclosed: CocoaProducts, Food Manufacturer Products, Gourmet & SpecialtiesProducts and Consumer Products.
IAS 1 (Revised) – Presentation of Financial Statements(effective January 1, 2009)
The Group has opted to present a separate statement of compre-hensive income in addition to the consolidated income statement.Furthermore, the standard includes non-mandatory changes of thetitles of the financial statements. The Group has chosen the optionto maintain the existing titles.
IAS 23 (Revised) – Borrowing Costs (effective January 1, 2009)The revised standard eliminates the option of recognizing borrowingcosts immediately as an expense, to the extent that they are directlyattributable to the acquisition, construction or production of aqualifying asset. Capitalization of such directly attributable costs isnowmandatory.This revised standard had no material impact on theGroup’s consolidated financial statements.
IAS 27 (Revised) – Consolidated and Separate Financial Statements(effective July 1, 2009)
The revised standard requires that effects of all transactions with non-controlling interest are to be recorded in equity if there is no changein control.These transactions will no longer result in goodwill or gainsand losses.The standard also specifies the accounting treatment whencontrol is lost.Any remaining interest in the entity is remeasured tofair value, and a gain or loss is recognized as a profit or loss. TheGroup has changed its accounting policy accordingly.
IFRIC 18 – Transfer of Assets from Customers (effective July 1, 2009)This interpretation clarifies the circumstances in which the definitionof an asset within the scope of IFRIC 18 is met, and how to recognizethe asset and measure its cost on initial recognition. The Group willapply the interpretation to transactions which meet the respectivecriteria.As of August 31, 2010, no such transaction exists.
Improvements to IFRS (effective January 1/July 1, 2009)Several standards have been modified on miscellaneous points. Nomaterial impacts on the Group’s consolidated financial statementswere identified.
The following standards and interpretations that became effective infiscal year 2009/10 are not relevant to the Group’s operations:• IFRS 2 Amendment – Share-based payments, Vesting conditionsand cancellation
• IAS 32 Amendment – Financial Instruments: Presentation andIAS 1 Presentation of Financial Statements, puttable financialinstruments and obligations arising on liquidation
• IFRIC 15 –Agreements for the construction of real estate• IFRIC 16 – Hedges of a net investment in a foreign operation• IFRIC 17 – Distributions of non-cash assets to owners• Improvements to IFRS 2010
Amended International Financial Reporting Standards and Inter-pretations, not yet effective for the Group and not early adoptedThe following standards and amendments to existing standards havebeen published and are mandatory for the Group’s accountingperiods beginning on or after September 1, 2010, but the Group hasnot early adopted them:
IFRS 9 – Financial Instruments (effective January 1, 2013)This standard introduces new requirements for the classificationand measurement of financial assets. All recognized financial assetsthat are currently in the scope of IAS 39 will be measured at eitheramortized cost or fair value. The standard gives guidance on how toapply the measurement principles.A fair value option is available asan alternative to amortized cost measurement.All equity investmentswithin the scope of IFRS 9 are to be measured on the consolidatedbalance sheet at fair value with the default recognition of gains andlosses in profit or loss. Only if the equity instrument is not held fortrading, an irrevocable election can be made at initial recognition to
68 ConsolidatedFinancial Statements
Accounting Policies
Consolidated 69Financial Statements
measure it at fair value through other comprehensive income withonly dividend income recognized in profit or loss. All derivativeswithin the scope of IFRS 9 are required to be measured at fair value.This includes derivatives that are settled by the delivery of unquotedequity instruments, however, in limited circumstances cost may be anappropriate estimate of fair value. The Group has not yet decidedwhether or not it will early adopt the standard. Thus, potentialimpacts on the Group’s consolidated financial statements were notyet fully assessed.
Improvements for IFRS (effective January 1, 2010)Several standards have been modified on miscellaneous points.Theyare not going to have a material impact to the Group’s consolidatedfinancial statements. The Group will apply these changes for theaccounting period starting September 1, 2010.
Interpretations and amendments to existing standards, not yeteffective and not relevant for the Group’s operations
IFRS 2 – Share-based payments (effective January 1, 2010)These amendments clarify the accounting for group-settled share-based payment transactions. In these arrangements, the subsidiaryreceives goods or services from employers or suppliers, but its parentor another entity in the group must pay those suppliers. An entitythat receives goods or services in a share-based arrangement mustaccount for those goods or services no matter which entity in thegroup settles the transaction and no matter whether the transactionis settled in shares or cash. The IASB additionally clarified that inIFRS 2 a “group” has the same meaning as in IAS 27 – Consolidatedand Separate Financial Statements.
IAS 32 – Financial Instruments: Classification of rights issued(effective February 1, 2010)
Under the amendment rights, options and warrants otherwisemeeting the definition of equity instruments in IAS 32 issued toacquire a fixed number of an entity’s own non-derivative equityinstruments for a fixed amount in any currency are classified asequity instruments provided the offer is made pro-rata to all existingowners of the same class of the entity’s own non-derivative equityinstruments.
IAS 24 – Related party disclosures (effective January 1, 2011)The revised standard simplifies the disclosures requirements forentities that are controlled, jointly controlled or significantly influ-enced by a government and clarifies the definition of a related party.A reporting entity might be exempted from the general disclosurerequirements set out in IAS 24 in relation to related party trans-actions and outstanding balances (including commitments), if certainrequirements are met.
IFRIC 14 – Prepayments of a minimum funding requirement(effective January 1, 2011)
Under the amended IFRIC 14, if there is a minimum funding require-ment for contributions relating to future service, the economic be-nefit available as a reduction in future contributions (and, therefore,the surplus that should be recognized as an asset) is comprised of:(a) any amount that reduces future minimum funding requirementcontributions for future services because the entity made a prepay-ment; and (b) the estimated future service cost in each period less theestimated minimum funding requirement contributions that wouldbe required for future service in that period if there were no prepay-ment of those contributions as described in (a).
The interpretation addresses divergent accounting by entities issuingequity instruments in order to extinguish all or part of a financialliability (often referred to as debt-for-equity swaps).An entity shouldmeasure the equity instruments issued as extinguishment of thefinancial liability at their fair value on the date of extinguishment ofthe liability, unless the fair value is not reliably measureable.
Notes to theConsolidated Financial Statements
Changes in the scope of consolidationThe scope of consolidation has during the fiscal year 2009/10 changed as follows:
Acquisitions
Name and location of company acquired Date of first consolidation Acquired stakeTrade & Trade S.A., Spain December 23, 2009 100%
Disposals
Name and location of company disposed Date of deconsolidation Disposed stakenone
1. Acquisitions 2009/10
In fiscal year 2009/10, the following acquisitions/business combinations took place:
On December 23, 2009, the Group obtained control of Chocovic Group, a Spanish chocolate manufac-turing group, by acquiring 100% of the shares and voting interests of Trade & Trade, S.A, ChocovicGroup’s ultimate parent.As a result of the acquisition, the Group is expected to further expand its corebusiness with industrial and artisanal customers as well as its geographic presence, mainly in SouthernEurope.
The following summarizes the major classes of consideration transferred:
in thousands of CHF 2009/10
ConsiderationCash paid 23,374Consideration offset with receivables from seller 16,870Consideration deferred 15,835Total consideration transferred 56,079
The deferred payments are contractually due at the first and fifth anniversary of the closing date. Mostof the deferred payment is due short-term.The consideration due on the fifth anniversary of the closingshall be offset with indemnification claims by the Group. No pre-existing relationships were settled inthis transaction.
The agreements with the seller do not contain arrangements for contingent considerations.
The Group expensed acquisition-related costs, such as fees for due diligence work and lawyers, ofCHF 1.1 million over the course of the project immediately in the Consolidated Income Statement(included inGeneral and administration expenses), of which CHF 0.7 million was recognized in the priorfiscal year.
70 ConsolidatedFinancial Statements
Consolidated 71Financial Statements
in thousands of CHF 2009/10
Recognized amounts of identifiable assets acquired and liabilities assumedCash and cash equivalents 2,218Trade receivables and other assets 42,031Inventories 8,684Property, plant and equipment 6,786Intangible assets 6,291Deferred income tax assets 290Bank overdrafts (7,625)Trade payables and other current liabilities (20,247)Deferred income tax liabilities (1,012)Other non-current liabilities (6,166)Total identifiable net assets 31,250Goodwill 24,829Total consideration at fair value 56,079
The goodwill of CHF 24.8 million arising from the acquisition is attributable to the skills and technicaltalents of Chocovic work force, synergies expected to be achieved from integrating the company into theGroup’s existing business and economies of scale expected from combining the operations of the Groupand Chocovic Group. None of the goodwill recognized is expected to be deductible for income taxpurposes.
The fair value of trade receivables and other assets is CHF 42.0 million and includes trade receivableswith a fair value of CHF 18.3 million.The gross contractual amount of trade receivables due is CHF 20.8million, of which CHF 2.5 million is expected to be uncollectible.
The Group has not yet finished the valuation of the defined benefit obligations as the actuarial valuationreports were not yet available.
Contingent liabilities of CHF 2.7million have been recognized for potential outflow of resources embody-ing economic benefits arising from past events.The liabilities have not been discounted as the settlementis expected to take place within 12months.As ofAugust 31, 2010, there has been no change in the amountsrecognized at the acquisition date, as there has been no change in the range of outcomes or assumptionsused to develop the estimates.
The selling shareholders have contractually agreed to indemnify Barry Callebaut for amounts that maybecome payable in respect of certain above-mentioned past events.An indemnification asset of CHF 0.8million, equivalent to the fair value of the indemnified liability, has been recognized by the Group.The indemnification asset is deducted from consideration transferred for the business combination.As is the case with the indemnified liability, there has been no change in the amount recognized forthe indemnification asset as atAugust 31, 2010, as there has been no change in the range of outcomes orassumptions used to develop the estimate of the liability.
The revenue included in the Consolidated Income Statement since December 23, 2009, contributed byChocovic Group, was CHF 42.5 million. Chocovic Group has also contributed profit of CHF 3.1 millionover the same period.
Had Chocovic Group been consolidated from September 1, 2009, it would have contributed revenue ofCHF 72.1 million and net profit for the year of CHF 4.4 million to the Consolidated Income Statement.
The initial accounting for the acquisitions of International Business Company (IBC) and the businessfrom the Japanese confectionery Morinaga & Co. Ltd in the comparable period which were determinedprovisionally, have been completed in the meantime.The finalization of the purchase accounting of theEurogran acquisition led to a minor adjustment of CHF 0.5 million from Goodwill to Brand names.
2008/09In fiscal year 2008/09, the following acquisitions/business combinations took place:
International Business Company (IBC) BVBAOn October 1, 2008, the Group closed the transaction to acquire 100% of the share capital in IBC, aBelgian company active in the chocolate decoration market. The company mainly serves customers inthe Group’s Gourmet & Specialties business in Europe and was therefore integrated in the FoodService/Retail Business segment and the geographical Region Europe, respectively. Goodwill resultingfrom that transaction has also been allocated to those segments.
Morinaga Tsukaguchi factoryOn December 1, 2008, the Group has acquired assets from the Japanese confectionary Morinaga & Co.Ltd and entered into a long-term supply agreement with Morinaga & Co. Ltd. Due to the substance ofthe acquisition agreement entered into with Morinaga, the Group has concluded that the acquisitionqualifies as a business combination in the scope of IFRS 3.The business was subsequently integrated inthe Group’s Industrial Business segment and the geographical Region Asia-Pacific since the businessdoes generate its sales solely in Asia. The accounting for the transaction has led to a negative goodwillwhich was immediately recognized in the Consolidated Income Statement.
Eurogran A/SOn June 1, 2009, the Group has closed the acquisition of the Danish beverage company Eurogran A/Swith a subsidiary in United Kingdom. The Danish operations were integrated in the Group’s beveragebusiness. The business acquired serves customers in Europe, consequently it was integrated into theGroup’s Food Service/Retail segment and the geographical Region Europe, respectively. Goodwillresulting from this acquisition was allocated to the same segments as well.
Acquisitions
in thousands of CHF
Pre-acquisi-tion carryingamounts2008/09
Fair valueadjustments2008/09
Recognizedvalues onacquisition2008/09
Inventories 7,010 (985) 6,025Trade receivables and other assets 9,758 (81) 9,677Property, plant and equipment 16,795 1,209 18,004Intangible assets – 3,731 3,731Other current liabilities and deferred income (12,331) (817) (13,148)Deferred tax, net (610) (1,872) (2,482)Other non-current liabilities (6,227) (57) (6,284)
Fair value of assets and liabilities acquired 14,395 1,128 15,523
Goodwill on acquisition 24,890Negative goodwill on acquisition (1,502)
Consideration, recognized as current andnon-current liability (18,742)
Consideration, paid in cash1 20,169
Cash and cash equivalents less bank overdrafts (net) acquired (2,657)
Cash outflow for acquisition of subsidiaries, net of cashand bank overdrafts acquired 17,512
1 Includes legal and consultancy fees of CHF 1.1 million
72 ConsolidatedFinancial Statements
Notes
Consolidated 73Financial Statements
The goodwill amounting to CHF 24.9 million reflects the value of highly skilled staff, the immediateaccess to manufacturing resources, supply chain and profound knowledge of the regional market cha-racteristics. The acquisitions allow the Group to leverage on these factors and use related synergies forits strategically targeted regional and business expansion path.
The negative goodwill recognized is related to the acquisition of the Tsukaguchi factory and is mainlythe result of differences between the value at which property, plant and equipment were acquired andtheir fair value assessed by the Group and reflecting the business plan underlying the acquisition.
The effect of last year’s acquisitions on the Group’s sales were approximately CHF 42 million on netsales revenue andCHF 5.3million on net profit from continuing operations.Had the acquisitions occurredon September 1, 2008, the Group’s net sales revenue would have been approximately CHF 4,923 millionand the net profit from continuing operations approximately CHF 229 million.
2. Disposals
Disposals in 2009/10
No subsidiaries were disposed of in 2009/10.
Disposals in 2008/09
Van Houten (Singapore) Pte LtdOn February 28, 2009, Barry Callebaut has sold its Consumer Products subsidiary Van Houten(Singapore) Pte Ltd, domiciled in Singapore, to The Hershey Company and has also licensed theVan Houten brand name and trademarks to Hershey’s for use in relation to the sale of consumerproducts in Asia-Pacific, the Middle East, andAustralia/New Zealand.
The transaction resulted in a total gain of CHF 17.9 million (net of transaction costs).
in thousands of CHF 2009/10 2008/09
Current assets 3,907Property, plant and equipment 5Financial liabilities (1,308)Other liabilities (2,447)Net assets disposed of – 157
Costs to sell (628)Profit/(loss) on current year’s disposals 17,950Total disposal consideration – 17,479
Cash and cash equivalents and bank overdrafts (net) disposed of (281)Cash inflow on disposals – 17,198
3. Segment information
External segment reporting is based on the internal organizational and management structure, aswell as on the internal information reviewed regularly by the Chief Operating Decision Maker. BarryCallebaut’s Chief Operating DecisionMaker has been identified as the Executive Committee, consistingof the Group Chief Executive Officer, the Chief Financial Officer and the Presidents of the RegionsEurope,Americas and Global Sourcing & Cocoa as well as the Chief Operating Officer and the ChiefInnovation Officer.
Financial information by reportable segments
Global Sourcing & Cocoa Europe Americasin thousands of CHF 2009/10 2008/091 2009/10 2008/091 2009/10 2008/091
Revenues from external customers 962,596 748,899 3,041,943 3,056,318 998,173 901,075Revenues from transactions with other operating segmentsof the Group 2,138,833 1,944,585 54,772 44,119 – –
Total assets 1,538,286 1,426,612 1,443,612 1,520,697 593,921 574,141Additions to property, plant, equipment and intangible assets (27,349) (36,330) (48,997) (36,892) (41,706) (44,120)
1 Certain comparatives have been reclassified to conformwith the current period’s presentation
The Executive Committee considers the business from a geographic view and, hence, Presidents wereappointed for each region. Since the Group’s sourcing and cocoa activities operate independently ofthe regions, the Global Sourcing & Cocoa business is reviewed by the Chief Operating Decision Makeras an own segment in addition to the geographical RegionsWestern Europe, Eastern Europe,AmericasandAsia-Pacific. For the purpose of the consolidated financial statements, the RegionsWestern Europeand Eastern Europe were aggregated since the businesses are similar and meet the criteria for aggre-gation. Furthermore, the Executive Committee also views the Corporate function independently. Thefunction Corporate consists mainly of headquarters services to other segments and does not generaterevenues. Thus, the Group reports Corporate as a reconciling item between the segments and the con-solidated figures.
Segment revenue, segment results (operating profit EBIT) and segment assets correspond to theGroup’sconsolidated financial statements. Financial income and expense, the Group’s interest in the profit ofassociates and joint ventures accounted by the equity method and income taxes are not allocated to therespective segment for internal management purposes. These items can be found below in the reconci-liation of the EBIT to the net profit for the year.
The following table shows the reconciliation of EBIT to net income for the year as reported in theConsolidated Income Statement:
Reconciliation of EBIT to net profit for the year
in thousands of CHF 2009/10 2008/09
Operating profit 370,411 350,753Financial income 2,021 5,904Financial expense (83,122) (97,493)Result from investments in associates and joint ventures (225) 484Profit before income taxes 289,085 259,648Income taxes (37,342) (32,723)Net profit for the year 251,743 226,925
The segment Global Sourcing & Cocoa is responsible for the procurement of ingredients for chocolateproduction (mainly cocoa; sugar, dairy and nuts are also common ingredients) and the Group’s cocoaprocessing business. Most of the revenues of Global Sourcing & Cocoa are generated with the othersegments of the Group. The business conducted in the regions consists of chocolate production forindustrial customers, hotel, restaurants and cafeterias (gourmet business) and to a lesser extent,consumer products.
The revenues generated by Global Sourcing & Cocoa with other segments are conducted on an arm’slength basis. For internal purposes, some of its operational profits are allocated to the regions which actas major customers of Global Sourcing & Cocoa.
Additional entity-wide disclosures
Information on geographical regionsThe entity is domiciled in Switzerland; however, its major revenues are generated in other countries.The following table shows revenues and non-current assets excluding deferred tax assets and pensionassets allocated to the entity’s country of domicile and the major countries where the Group is genera-ting revenues and/or to those countries where the non-current assets as defined above are material.
Revenues Non-current assetsin thousands of CHF 2009/10 2008/09 2009/10 2008/09
Information on product groupsThe Group has numerous products that are sold to external customers. Therefore, for internal reviewby the Chief Operating Decision Maker, information on products is aggregated on a business level.Thefollowing table breaks down external revenues into product groups:
Wages and salaries (376,359) (372,074)Compulsory social security contributions (89,679) (92,430)Equity-settled share-based payments (5,716) (11,577)Expenses related to defined benefit plans (15,607) (12,671)Contributions to defined contribution plans (1,058) (825)Increase in liability for long service leave (36) (61)Total personnel expenses (488,455) (489,638)
5. Research and development expenses
in thousands of CHF 2009/10 2008/09
Total research and development expenses (16,990) (19,378)
Research and development costs not qualifying for capitalization are directly charged to the Consoli-dated Income Statement and are reported under Marketing and sales expenses and General andadministration expenses.
6. Other income
in thousands of CHF 2009/10 2008/09
Gain on disposal of property, plant and equipment 6,177 1,615Group training centers, museums, outlets and rental income 3,799 3,522Sale of shells of cocoa beans and waste 3,198 3,285Litigations, claims and insurance 2,902 1,923Release of unused provisions and accruals 1,678 837Gain on disposal of subsidiaries (note 2) – 17,950Recognition of negative goodwill on acquisitions (note 1) – 1,385Other 2,702 3,840Total other income 20,456 34,357
7. Other expenses
in thousands of CHF 2009/10 2008/09
Restructuring costs (8,916) (9,947)Loss on sale of waste (2,088) (2,910)Litigations and claims (1,741) (1,518)Costs related to chocolate museums (1,022) (696)Loss on sale of property, plant and equipment (25) (1,585)Impairment on property, plant and equipment (note 15) – (566)Other (2,849) (3,272)Total other expenses (16,641) (20,494)
78 Konzernrechnung
8. Financial income
in thousands of CHF 2009/10 2008/09
Interest income 2,021 3,883Gains on derivative financial instruments – 2,021Total financial income 2,021 5,904
In prior year, gains on derivative financial instruments amounted to CHF 2.0 million and, among other,comprise the fair value change of the free-standing interest rate derivatives for 2008/09.
9. Financial expenses
in thousands of CHF 2009/10 2008/09
Interest expenses (67,061) (86,223)Loss on derivative financial instruments (6,664) –Structuring fees (1,560) (1,207)Charges on undrawn portion of committed credit facilities (1,485) (1,709)
Total interest expenses (76,770) (89,139)Bank charges and other financial expenses (4,417) (5,079)Foreign exchange losses, net (1,935) (3,275)Total financial expenses (83,122) (97,493)
Interest expenses include the net cost of interest rate swaps and result from paying fixed interest ratesin exchange for receiving floating interest rates. Interest expenses for 2009/10 also include interest paidunder the asset-backed securitization program for trade receivables of an amount of CHF 3.5 million(2008/09: CHF 3.9 million).
Loss on derivative financial instruments amounted to CHF 6.7 million and, among other, comprise thefair value change of the free-standing interest rate derivatives for 2009/10.
Structuring fee expenses are mainly attributable to the EUR 850 million Revolving Credit Facility andthe EUR 350 million Senior Bond (see note 23) and represent the related amortization charges.
The charges on the undrawn portion of the committed EUR 850million Revolving Credit Facility amountto CHF 1.5 million for 2009/10 (2008/09: CHF 1.7 million).
78 ConsolidatedFinancial Statements
Notes
Konzernrechnung 79
10. Income tax expenses
in thousands of CHF 2009/10 2008/09
Current income tax expenses (46,801) (32,312)Deferred income tax income/(expenses) 9,459 (411)Total income tax expenses (37,342) (32,723)
Reconciliation of income tax expenses
in thousands of CHF 2009/10 2008/09
Profit before income taxes 289,085 259,648Expected income tax expenses at weighted average applicable tax rate (48,996) (49,705)Non-tax deductible expenses (3,492) (3,550)Tax deductible items not qualifying as an expense under IFRS 16,262 17,592Tax exempt income 2,355 2,770Income recognized for tax declarations purposes only (1,392) (1,684)Prior period related items (6,458) 1,439Changes in tax rates 1,014 2,351Losses carried forward not yet recognized as deferred tax assets (5,221) (7,929)Tax relief on losses carried forward formerly not recognized as deferred tax assets 8,586 5,993Total income taxes (37,342) (32,723)
For the reconciliation as above, the Group determines the expected income tax rate by weightingthe applicable tax rates in the jurisdictions concerned based on the mix of the profit before taxes perjurisdiction, resulting for 2009/10 in a weighted average applicable tax rate of 16.95% (2008/09 : 19.14%).
The applicable expected tax rate per company is the domestic corporate income tax rate applicable tothe profit before taxes of the company for fiscal year 2009/10.The decrease of the weighted average appli-cable tax rate is due to the more favorable company mix of the profit before taxes.
The tax relief on tax losses carried forward formerly not recognized as deferred tax assets amounts toCHF 8.6 million for the year 2009/10. The amount consists of CHF 4.6 million utilization of tax lossescarried forward previously not recognized and CHF 4.0 million tax losses carried forward recognizedas a deferred tax asset for the first time during the year 2009/10.
11. Earnings per share
in CHF 2009/10 2008/09
Basic earnings per share (CHF/share) 48.62 43.99Diluted earnings per share (CHF/share) 48.47 43.85
The following amounts of earnings have been used as the numerator in the calculation of basic anddiluted earnings per share:
in thousands of CHF 2009/10 2008/09
Net profit for the year attributable to ordinary shareholders,used as numerator for basic earnings per share 251,226 226,907
After-tax effect of income and expenses on dilutive potential ordinary shares – –Adjusted net profit for the year used as numerator for diluted earnings per share 251,226 226,907
Consolidated 79Financial Statements
80 Konzernrechnung
The following numbers of shares have been used as the denominator in the calculation of basic anddiluted earnings per share:
2009/10 2008/09
Weighted average number of shares issued 5,170,000 5,170,000Weighted average number of treasury shares held 2,978 11,981Weighted average number of ordinary shares outstanding, used as denominatorfor basic earnings per share 5,167,022 5,158,019
Equity-settled share-based payments 16,196 16,944Adjusted weighted average number of ordinary shares, used as denominatorfor diluted earnings per share 5,183,218 5,174,963
12. Trade receivables and other current assets
as of August 31, 2010 2009in thousands of CHF
Trade receivables 314,636 349,416Fair values of hedged firm commitments 98,651 42,534Prepayments 72,063 28,713Other current assets 7,915 8,966Accrued income 4,123 2,760Receivables from related parties 2 192Other taxes and receivables from government 55,990 62,710Loans and other receivables 34,000 29,556Total trade receivables and other current assets 587,380 524,847
The Group runs an asset-backed securitization program, whereby trade receivables are sold at theirnominal value minus a discount in exchange for cash.The net amount of the sold receivables is CHF 255.1million as of August 31, 2010 (2009: CHF 262.4 million), and was derecognized from the balance sheet.
Aging of trade receivables
as of August 31, 2010 2009in thousands of CHF
Total trade receivables 334,650 372,008Less impairment provision for trade receivables (20,014) (22,592)Total trade receivables 314,636 349,416
Of which:Not overdue 269,092 276,232Impairment provision for trade receivables not overdue (144) (653)Past due less than 90 days 35,427 54,178Impairment provision for trade receivables past due less than 90 days (347) (396)Past due more than 90 days 30,131 41,598Impairment provision for trade receivables past due more than 90 days (19,523) (21,543)Total trade receivables 314,636 349,416
The trade receivables are contractually due within a period of one to 120 days.
The individually impaired receivables mainly relate to customers,which are in difficult economic situations.
80 ConsolidatedFinancial Statements
Notes
Konzernrechnung 81
Movements in impairment provision for trade receivables
in thousands of CHF 2009/10 2008/09
as of September 1, 22,592 20,514Additions 7,171 7,783Amounts written of as uncollectible (3,850) (4,279)Unused amounts reversed (2,330) (209)Currency translation adjustment (3,569) (1,217)
as of August 31, 20,014 22,592
Based on historic impairment rates and expected performance of the customers’ payment behavior, theGroup believes that the impairment provision for trade receivables sufficiently covers the risk of default.Based on an individual assessment on the credit risks related with other receivables, the Group identi-fied no need for an impairment provision. Details on credit risks can be found in note 26.
13. Inventories
as of August 31, 2010 2009in thousands of CHF
Cocoa bean stocks 369,758 436,754Semi-finished and finished products 698,243 722,986Other raw materials and packaging materials 118,230 134,805Total inventories 1,186,231 1,294,545
Thereof stocks carried at fair value less costs to sellCocoa bean stocks 351,064 420,179Semi-finished and finished products 539,752 555,267Other raw materials 50,998 58,219Total stocks carried at fair value less costs to sell 941,814 1,033,665
Barry Callebaut applies the broker-trader exemption in accordance with IAS 2.5 for the ContractBusiness and therefore measures its Contract Business inventories at fair value less costs to sell. BarryCallebaut fulfills the requirement of a broker-trader as it holds inventories with the purpose of genera-ting a profit from short-term fluctuations in price or dealer’s margin. All commodities, includingindustrial chocolate, are valued based on the raw material prices at the balance sheet date.
In the Price List Business Barry Callebaut is committed to sell its products at a fixed price over a certainperiod of time, i.e. the period of validity of the respective price list. Inventories dedicated to the PriceList Business are therefore measured at the lower of cost or net realizable value.
As of August 31, 2010, inventories amounting to CHF 19.1 million (2009: CHF 5.8 million) are pledgedas security for financial liabilities.
In fiscal year 2009/10, inventory write-downs of CHF 4.8 million were recognized as expenses(2008/09: CHF 5.5 million).
Consolidated 81Financial Statements
82 Konzernrechnung
14. Derivative financial instruments and hedging activities
Derivative financial instruments consist of items used in a cash flow hedging model, items used in a fair valuehedging model and fair valued instruments, for which no hedge accounting is applied.
For detailed information on fair value measurement refer to note 26, Fair Value – Hierarchy.
82 ConsolidatedFinancial Statements
Notes
Konzernrechnung 83
Effect of cash flow hedges on equity
Interest rate risk Total hedging reservein thousands of CHF
as of August 31, 2008 (1,219) (1,219)
Movements in the period:Gains/(losses) taken into equity (6,380) (6,380)Transfer to the Consolidated Income Statement for the period (22) (22)Taxes 2,566 2,566Currency translation adjustment 63 63
as of August 31, 2009 (4,992) (4,992)
Movements in the period:Gains/(losses) taken into equity (6,465) (6,465)Transfer to the Consolidated Income Statement for the period 1,801 1,801Taxes 1,585 1,585Currency translation adjustment 1,084 1,084
as of August 31, 2010 (6,987) (6,987)
Cash flow hedgesIn the course of fiscal year 2009/10, the Group entered into interest rate derivatives (exchanging floatinginto fixed interest rates) according to the guidelines stipulated in the Group’s Treasury Policy (refer tonote 26). In order to avoid volatility in the income statement, the interest rate derivatives have been putin cash flow hedge relationship reflecting the underlying currency mix of the Group’s debt portfolio.Thefollowing table provides an overview over the periods in which the cash flow hedges are expected toimpact the Consolidated Income Statement (before taxes):
Total net (3,035) (4,921) 555 (7,401) (5,598) (2,960) – (8,558)
Consolidated 83Financial Statements
84 ConsolidatedFinancial Statements
Fair value hedgesFair value hedges include forward purchase commitments, cocoa future contracts and inventories at fairvalue less cost to sell designated as the hedging instruments for commodities related to firm salescommitments as well as in relation to foreign currency risks.
For the fair value hedge relationship of the Contract Business, the Group also considers its relatedinventories carried at fair value less costs to sell as hedging instruments. Inventories held in accordancewith the broker-trader exemption have essentially similar characteristics to a derivative financial instru-ment on commodities and therefore qualify as hedging instrument in accordance with Barry Callebaut’sbusiness model in the Contract Business.The amount of fair value adjustments to inventories onAugust31, 2010, was CHF -78.1 million (2009: CHF 78.2 million).
All financial derivatives and the hedged items are marked at fair value. For fair value hedges, theGroup recorded a loss on hedging instruments of CHF 92.8 million for fiscal year 2009/10 (2008/09: lossof CHF 49.0 million) and a gain on hedged items of CHF 92.8 million (2008/09: gain of CHF 49.0 million).The fair value at balance sheet date of the hedged firm commitments under the fair value hedge accoun-ting model – being the related firm sales commitments in respect of sales price risk (including cocoa com-ponents and non-cocoa components, such as sweeteners, dairy and nuts) and the related sales and pur-chase contracts with respect to foreign currency risks – is outlined in the table hedged firm commitmentsbelow. The balance of these items at balance sheet date is presented under trade receivables and othercurrent assets (see note 12) and trade payables and other current liabilities (see note 21), respectively.
Hedged firm commitments
in thousands of CHF Assets Liabilities Assets Liabilitiesas of August 31, 2010 2009
Commodity price risk(cocoa and other ingredients) – sales contracts 91,406 41,174 40,852 95,979
Total fair value of hedged firm commitments 98,651 41,755 42,534 101,572
Other – no hedge accountingThis position contains the fair values of derivative financial instruments of the Group’s purchasing andsourcing center and the Group’s Treasury center, which are not designated for hedge accounting.
Notes
Consolidated 85Financial Statements
15. Property, plant and equipment
2009/10
Land andbuildings
Plant andmachinery
Officeequipment,furniture andmotor vehicles
Underconstruction
Total
in thousands of CHF
At costas of August 31, 2009 606,490 1,408,051 144,002 40,546 2,199,089Change in Group structure – acquisitions 80 5,595 275 836 6,786Additions 12,241 50,624 7,517 48,876 119,258Disposals (26,520) (17,188) (2,441) – (46,149)Currency translation adjustments (63,213) (146,098) (17,327) (3,733) (230,371)Reclassifications from under construction 2,100 20,720 1,361 (24,181) –Other reclassifications 189 30 (219) – –
as of August 31, 2010 531,367 1,321,734 133,168 62,344 2,048,613
as of August 31, 2009 319,830 888,114 118,687 – 1,326,631
Net as of August 31, 2009 286,660 519,937 25,315 40,546 872,458
As required by the accounting standards, the Group periodically reviews the remaining useful lives ofassets recognized in property, plant and equipment.
There was no impairment loss in property, plant and equipment in fiscal year 2009/10(2008/09: CHF 0.6 million).
Repair and maintenance expenses for the fiscal year 2009/10 amounted to CHF 65.0 million(2008/09: CHF 61.9 million).
The fire insurance value of property, plant and equipment amounted to CHF 2,749.8 million as ofAugust 31, 2010 (2009: CHF 2,866.9 million).
As of August 31, 2010, plant and equipment held under financial leases amounted to CHF 2.9 million(2009: CHF 0.2 million). The related liabilities are reported under short-term and long-term debt(see notes 20 and 23).
As of August 31, 2010, no financial liabilities were secured by means of mortgages on properties(2009: none).
Notes
Consolidated 87Financial Statements
16. Obligations under finance leases
Minimum lease payments Present value of minimumlease payments
as of August 31, 2010 2009 2010 2009in thousands of CHF
Amounts payable under finance leaseswithin one year 673 40 637 35in the second to fifth year inclusive 1,027 72 895 68more than five years 457 – 359 –
Total amount payable under finance leases 2,157 112 1,891 103Less: future finance charges (266) (9) – –Present value of lease obligations 1,891 103 1,891 103Amount due for settlement next 12months (note 20) 637 35Amount due for settlement after 12months (note 23) 1,254 68
The Group entered into finance leasing arrangements for various assets. The weighted average term offinance leases entered into is 5.8 years (2008/09: 4.7 years).The average effective interest rate was 4.7%(2008/09: 3.2%). Interest rates are fixed at the contract date. All leases are on a fixed repayment basisand no arrangement has been entered into for contingent rental payment.
Net carrying amount ofproperty, plant andequipment under financelease
as of August 31, 2010 2009in thousands of CHF
Land and buildings 1,286 –Plant and machinery 936 74Furniture, equipment and motor vehicles 696 172Total assets under financial lease 2,918 246
17. Investments in associates and joint venturesThe carrying amount of investments in associates and joint ventures changed as follows:
in thousands of CHF 2009/10 2008/09
as of September 1 , 4,038 3,528Acquisition of associates and joint ventures – 165Share of (loss)/profit (225) 484Exchange differences (334) (139)as of August 31, 3,479 4,038
The Group’s investments in associates and joint ventures are attributable to the following companies:
Ownership in % 2009/10 2008/09
as of August 31,African Organic Produce AG, Switzerland 49 49Biolands International Ltd, Tanzania 49 49Shanghai Le Jia Food Service Co. Ltd, China 50 50Pastelería Totel, S.L., Spain 20 20Bombones y Chocolates Semar, S.L., Spain 20 20
88 ConsolidatedFinancial Statements
Summarized financial information in respect of theGroup’s associates and joint ventures is set out below.
in thousands of CHF 2010 2009
Total current assets 12,584 17,157Total non-current assets 6,334 6,291Total current liabilities 13,187 16,230Total non-current liabilities 2,943 2,845Net assets as of August 31, 2,788 4,373Group’s share of net assets of associates and joint ventures 3,479 4,038
in thousands of CHF 2009/10 2008/09
Total revenue 34,143 33,799Total profit for the period (477) 708Group’s share of profits of associates and joint ventures (225) 484
18. Intangible assets
2009/10Goodwill Brand
namesDevelopmentcosts
Other Total
in thousands of CHF
At costas of August 31, 2009 411,843 38,134 194,960 14,585 659,522Change in Group structure – acquisitions 24,372 6,749 – – 31,121Additions – – 23,974 1,876 25,850Disposals – – (598) – (598)Currency translation adjustments (7,079) (821) (26,614) (1,011) (35,525)
as of August 31, 2010 429,136 44,062 191,722 15,450 680,370
as of August 31, 2009 – 26,335 132,899 6,604 165,838
Net as of August 31, 2009 411,843 11,799 62,061 7,981 493,684
Additions to development costs amount to CHF 24.0 million in fiscal year 2009/10 (2008/09: CHF 30.6million). In both years additions mainly included costs related to various projects of internally generatedsoftware. Furthermore, costs related to recipes and innovations of CHF 2.5 million were capitalized asdevelopment costs.
The remaining amortization period for brand names varies between three and five years, for softwarebetween two and five years and for other including patents between four and fourteen years. Theamortization charge is included in the positionGeneral and administration expenses in the ConsolidatedIncome Statement.
Impairment testing for cash-generating units containing goodwillThe carrying amount of goodwill for the Group amounts to CHF 429.1 million (2008/09: CHF 411.8 mil-lion).The allocation to the segments is as follows:
as of August 31, 2010in million of CHF
Global Sourcing & Cocoa 149.5Western Europe 248.9Americas 25.2Asia-Pacific 5.5Total 429.1
The Group has reorganized its internal reporting to better reflect its organizational structure and theCompany’s strategic goal to expand its activities in high-growth countries in order to increase its globalpresence. As a result, there have been changes in the composition of cash-generating units (CGU) towhich goodwill has been allocated and hence, to the external segment reporting. Goodwill had to bereallocated to the newly determined CGUs at which goodwill is monitored for internal managementpurposes.
The goodwill impairment testing was based on the new CGUs and the related assumptions.The testingfor the previous year was not re-performed.The allocation of goodwill had been made in respect of busi-ness segments in prior years and was as follows:
Goodwill acquired in a business combination is allocated to the respective segment that is expected tobenefit from the synergies of the combination, at acquisition date. The segments represent the lowestlevel within the entity at which the goodwill is monitored for internal management purposes.Due to theGroup’s fully integrated business in the regions, the segments are identified as the lowest level of iden-tifiable cash inflows.Thus, the impairment test is performed on a segment level.
For the impairment test, the recoverable amount of a CGU is based on its value in use and is comparedto the carrying amount of the corresponding CGU. Future cash flows are discounted using a pre-tax ratethat reflects current market assessments based on the weighted average cost of capital (WACC).
The Group performs its impairment test during the fourth quarter of the fiscal year.This approach waschosen since theMid-Term Plan covering the next three fiscal years is updated annually at the beginningof the fourth quarter.The Mid-Term Plan is based on the assumption that there are no major changes tothe Group’s organization. The residual value is calculated from an estimated continuing value, which isprimarily based on the third year of the Mid-Term Plan.The terminal growth rate used for determiningthe residual value does not exceed the expected long-term growth rate of the industry.
Key assumptions used for value-in-use calculations
2010 Discount rate Terminal growth rate
Global Sourcing & Cocoa 9.5% 1.5%Western Europe 9.3% 1.0%Americas 10.7% 0.9%Asia-Pacific 9.5% 3.8%
Based on the impairment tests, no need for recognition of impairment losses in fiscal year 2009/10 hasbeen identified.
The key sensitivities in the impairment test are theWACC as well as the terminal growth rate.Therefore,the Group has carried out a sensitivity analysis, containing various scenarios.Taking reasonable possiblechanges in key assumptions into account, no impairment losses have been revealed.
90 ConsolidatedFinancial Statements
Notes
Konzernrechnung 91
19. Deferred tax assets and liabilities
Movement in deferred tax assets and liabilities
Invento-ries
Property,plant,equipment/intangibleassets
Otherassets
Provisions Otherliabilities
Tax losscarry-forwards
Total
in thousands of CHF
as of August 31, 2008 (10,247) (39,153) (7,930) 111 3,690 34,406 (19,123)Charged to the income statement 2,540 (8,967) 1,475 (13,123) 4,525 13,139 (411)Charged to equity – – – – 2,566 – 2,566Effect of acquisitions – (2,406) – 129 (205) – (2,482)Effect of disposals – – – – – (46) (46)Currency translation effects 472 5,024 528 (57) (866) (2,142) 2,959as of August 31, 2009 (7,235) (45,502) (5,927) (12,940) 9,710 45,357 (16,537)
Charged to the income statement 5,032 (7,262) (6,221) 13,401 (1,035) 5,544 9,459Charged to equity – – – – 1,585 – 1,585Effect of acquisitions – (1,697) (110) – 1,085 – (722)Currency translation effects 159 5,722 109 684 (1,877) (5,942) (1,145)as of August 31, 2010 (2,044) (48,739) (12,149) 1,145 9,468 44,959 (7,360)
The effect of acquisitions for fiscal year 2009/10 is related to the fair value measurement at acquisitionof Chocovic.
Recognized deferred tax assets and liabilitiesThe recognized deferred tax assets and liabilities, without taking into consideration the offsetting ofbalances within the same tax jurisdiction, are attributable to the following:
Assets Liabilities Net Assets Liabilities Netas of August 31, 2010 2009in thousands of CHF
Reflected in the balance sheet 51,361 (58,721) 51,918 (68,455)
Consolidated 91Financial Statements
92 Konzernrechnung
Tax loss carry-forwards excluded from recognition of related deferred tax assetsTax loss carry-forwards not recognized as deferred tax assets have the following expiry dates:
as of August 31, 2010 2009in thousands of CHF
ExpiryWithin 1 year 189 8,278After 1 up to 2 years 1,549 2After 2 up to 3 years 2,396 2After 3 up to 10 years 58,716 56,955After 1 0 years 213,353 222,547Unlimited 284,981 340,577Total unrecognized tax losses carried forward 561,184 628,361
Tax losses carried forward are assessed for future recoverability based on business plans and projectionsof the related companies.Those are capitalized only if the usage within a medium period is probable.
Tax losses carried forward utilized during the year 2009/10 were CHF 41.7 million (2008/09: CHF 28.5million). The tax relief hereon amounted to CHF 12.8 million, of which CHF 8.2 million were alreadyrecognized as a deferred tax asset in the year before (2008/09: CHF 8.4 million of which CHF 4.0 mil-lion were already recognized as a deferred tax asset in the year before).
As ofAugust 31, 2010, the Group had unutilized tax losses carried forward of approximately CHF 711.5million (August 31, 2009: CHF 775.0 million) that are available for offset against future taxable income.
Of the total tax losses carried forward, an amount of CHF 150.3 million has been recognized for deferredtaxation purposes resulting in a deferred tax asset of CHF 45.0 million (2008/09: CHF 146.7 millionrecognized resulting in a deferred tax asset of CHF 45.4 million).
20. Bank overdrafts and short-term debt
Carrying amounts Fair valuesas of August 31, 2010 2009 2010 2009in thousands of CHF
Bank overdrafts 13,466 29,338 13,466 29,338Commercial Paper 69,570 194,699 69,570 194,699Short-term bank debts 105,157 27,775 105,157 27,775Short-term portion of long-term bank debts (note 23) 552 342 552 342Interest-bearing loans from employees 22 34 22 34Finance lease obligations (note 16) 637 35 637 35Short-term debt 175,938 222,885 175,938 222,885
Bank overdrafts and short-term debt 189,404 252,223 189,404 252,223
The decrease in the outstanding amount under the Group’s domestic Commercial Paper Program ispartially offset by an increase of the drawn amounts under the Revolving Credit Facility (note 23).
92 ConsolidatedFinancial Statements
Notes
Konzernrechnung 93
Short-term financial liabilities are mainly denominated in EUR, XAF and BRL as shown in the tablebelow:
Split per currency Amount Interest range Amount Interest rangein thousands of CHF from to from toas of August 31, 2010 20091
Total bank overdrafts and short-term debt 189,404 252,223
21. Trade payables and other current liabilities
as of August 31, 2010 20091
in thousands of CHF
Trade payables 460,442 427,371Fair value of hedged firm commitments (note 14) 41,755 101,572Related parties 3,531 2,609Accrued wages and social security 75,854 88,351Other taxes and payables to governmental authorities 19,752 16,366Accrued expenses 52,586 69,083Deferred income 3,141 10,868Liability put option over existing non-controlling interest 31,188 –Other payables 81,288 116,220Total trade payables and other current liabilities 769,537 832,440
1 Certain comparatives have been reclassified to conform with the current period’spresentation.
As disclosed in notes 9 and 12, the Group participates in a program where receivables are sold to a finan-cial institution and derecognized from the balance sheet. Amounts payable to the financial institutionamounted as of August 31, 2010 to CHF 22.8 million (2009: CHF 32.9 million), consisting of thebalance of receivables collected before the next roll-over date of CHF 44.2 million (2009: CHF 58.8 mil-lion), less discounts on receivables sold of CHF 21.4 million (2009: CHF 25.9 million). These amountsare included in other payables.
Other payables also consist of outstanding ledger balances with commodity brokers.
The seller of the in 2007/08 acquired stake in Barry Callebaut Malaysia Sdn Bhd (BCM), KL-KepongIndustrial Holdings Sdn Bhd, has a put option (CHF 31.2 million) exercisable between the second andthe fifth anniversary of the closing of the acquisition of BCM (i.e. April 30, 2008), which, if exercised,would require Barry Callebaut to purchase the remaining 40% of BCM.The put exercise price is fixedin USD. The agreement gives Barry Callebaut a call option, exercisable in the identical time frame, toacquire the remaining 40% of the shares at fair value.The call option has a fair value close to zero.
Consolidated 93Financial Statements
94 Konzernrechnung
22. Provisions
2009/10 Restruc-turing
Litigation &claims
Other Total
in thousands of CHF
Balance as of August 31, 2009 10,467 3,834 6,652 20,953Change in Group structure -acquisition 500 775 3,439 4,714Additions 4,435 574 4,666 9,675Usage (7,920) (648) (2,582) (11,150)Release of unused provisions (61) (165) – (226)Currency translation adjustments (1,235) (385) (927) (2,547)as of August 31, 2010 6,186 3,985 11,248 21,419
of which:Current 5,846 3,395 6,317 15,558Non-current 340 590 4,931 5,861
2008/09 Restruc-turing
Litigation &claims
Other Total
in thousands of CHF
Balance as of August 31, 2008 525 4,930 4,066 9,521Change in Group structure -acquisition – – 494 494Additions 10,079 1,071 5,039 16,189Usage – (2,073) (2,652) (4,725)Release of unused provisions – (156) – (156)Reclassification (133) 133 – –Currency translation adjustments (4) (71) (295) (370)as of August 31, 2009 10,467 3,834 6,652 20,953
of which:Current 10,249 3,135 3,367 16,751Non-current 218 699 3,285 4,202
RestructuringDuring fiscal year 2009/10, CHF 7.9 million of restructuring provisions have been used (2008/09: none).
Litigation & claimsThe amount includes provisions for certain litigations and claims that have been set up to cover legaland administrative proceedings that arise in the ordinary course of business. In management’s opinion,after taking appropriate legal advice, the outcome of these legal claims will not give rise to any signifi-cant loss beyond the amounts provided as of August 31, 2010.
Other provisionsOther provisions relate mainly to amounts that have been provided to cover the negative outcome ofonerous contracts.
94 ConsolidatedFinancial Statements
Notes
Konzernrechnung 95
23. Long-term debt
Carrying amounts Fair valuesas of August 31, 2010 2009 2010 2009in thousands of CHF
Total long-term debt 699,516 728,293 718,646 692,718
On July 13, 2007, the Group issued a 6% Senior Note with maturity in 2017 for an amount of EUR 350million.The Senior Note has been issued at a price of 99.005%, and include a coupon step-up clause of0.25% (limited to 1.00%) per downgraded notch by one or more rating agencies. It ranks completelypari passu with the Group’s EUR 850 million Revolving Credit Facility. The Senior Notes being issuedby Barry Callebaut Services NV are guaranteed by Barry Callebaut AG and certain of its subsidiaries.
On July 12, 2007, theGroup amended and restructured the syndicated EUR 850million Revolving CreditFacility, leading to a 5-year multi-purpose single tranche facility with two extension options (in 2008 and2009) to be agreed upon by the participating banks at their sole discretion.The first extension option hasbeen exercised successfully for 83% of the total amount leading to a prolongation of the maturity dateby one year to 2013, whereas the remaining 17% has been kept at the initial maturity date in 2012.The Group did refrain from exercising the second extension option in line with the prevailing marketcircumstances. The Revolving Credit Facility being issued by Barry Callebaut Services N.V. is guaran-teed by Barry Callebaut AG and certain of its subsidiaries.
As a result, the maturity profile of the long-term debt can be summarized as follows:
The weighted average maturity of the total debt decreased from 4.5 years to 3.5 years. Considering thatthe short-term debt is fully covered with the committed Revolving Credit Facility, the average maturityof the total debt stands at 4.9 years from a liquidity point of view.
Consolidated 95Financial Statements
96 Konzernrechnung
Long-term financial liabilities are to a major extent denominated in EUR and at fixed interest rates.The part of the long-term debt reported at floating interest rates relates to the drawings on the syndi-cated facility in EUR and CAD.
Split per currency Amount Interest range Amount Interest rangeas of August 31, from to from toin thousands of CHF 2010 2009
A. Pension and other long-term employment benefit plansThe Group has, apart from the legally required social security schemes, numerous independent pensionplans. Inmost cases, these plans are externally funded in vehicles that are legally separate from theGroup.For certain Group companies, however, no independent assets exist for defined benefit pension plansand other long-term employment plans. In these cases, the related liability is included in the balancesheet.
The amounts recognized in the balance sheet are determined as follows:
Defined benefit pensionplans
Other long-termemployment benefit plans
as of August 31, 2010 2009 2010 2009in thousands of CHF
Present value of funded obligations 229,610 202,666 – –Fair value of plan assets (144,177) (151,719) – –Excess of liabilities (assets) of funded obligations 85,433 50,947 – –
Present value of unfunded obligations 66,538 69,089 19,325 19,988
Net unrecognized actuarial gains (losses) (65,136) (17,790) (1,231) 106
Net employee benefit obligations recognized in the balance sheet 86,835 102,246 18,094 20,094thereof recognized as an asset (185) (361) – –thereof recognized as a liability 87,020 102,607 18,094 20,094
96 ConsolidatedFinancial Statements
Notes
Konzernrechnung 97
The changes in the present value of the defined benefit obligations are as follows:
Defined benefit pensionplans
Other long-termemployment benefit plans
in thousands of CHF 2009/10 2008/09 2009/10 2008/09
The movement in the fair value of plan assets is as follows:
Defined benefit pensionplans
Other long-termemployment benefit plans
in thousands of CHF 2009/10 2008/09 2009/10 2008/09
Opening fair value of plan assets 151,719 167,121 – –Expected return 8,447 10,025 – –Actuarial gains (losses) (6,527) (18,191) – –Contributions by employer 6,911 7,214 – –Contributions by employees 3,261 3,232 – –Exchange differences on foreign plans (9,094) (7,597) – –Benefits paid (10,540) (10,085) – –Closing fair value of plan assets 144,177 151,719 – –
Composition of plan assets
Defined benefit pension plansas of August 31, 2010 2009in thousands of CHF
Equities 53,021 66,510Bonds 25,883 18,957Cash and other assets 65,273 66,252Total fair value of plan assets 144,177 151,719
The plan assets do not include ordinary shares issued by the Company nor any property occupied by theGroup or one of its affiliates.
Consolidated 97Financial Statements
98 Konzernrechnung
The amounts recognized in profit or loss are as follows:
Defined benefit pensionplans
Other long-termemployment benefit plans
in thousands of CHF 2009/10 2008/09 2009/10 2008/09
Current service costs 8,820 9,404 788 883Interest on obligation 14,972 15,267 736 626Expected return on plan assets (8,447) (10,025) – –Net actuarial losses (gains) recognized in year 576 (740) 1,821 170Past service cost 368 488 – –Losses (gains) on curtailments and settlements (756) – (10) (170)Contributions by employees (3,261) (3,232) – –First-time recognition of pension assets – – – –Total defined benefit expenses 12,272 11,162 3,335 1,509
Actual return on plan assets 1,918 (8,167)
The service cost for 2010/11 are expected to amount to CHF 8.3 million. The expected return on planassets is based on market expectations and composition of plan assets.
in thousands of CHF 2009/10 2008/09
Total defined contribution expenses 1,058 825
The defined benefit expenses are recognized in the following line items in the Consolidated IncomeStatement:
in thousands of CHF 2009/10 2008/09
Cost of goods sold (7,380) (6,302)Marketing and sales expenses (1,255) (594)General and administration expenses (5,494) (4,130)Research and development expenses (389) (310)Other income (8) 697Other expenses (1,081) (2,032)Total defined benefit expenses recognized in income statement (15,607) (12,671)
Weighted average assumptions used
Defined benefit pensionplans
Other long-termemployee benefit plans
in % 2009/10 2008/09 2009/10 2008/09
Discount rate 4.1% 6.2% 4.0% 6.0%Expected return on plan assets 5.7% 5.9% – –Expected rate of salary increase 1.1% 0.7% 2.1% 1.5%Medical cost trend rates – – 5.0% 5.0%
98 ConsolidatedFinancial Statements
Notes
Konzernrechnung 99
Additional historical information
Defined benefit plansin thousands of CHF 2009/10 2008/09 2007/08 2006/07
Present value of defined benefit obligations 315,473 291,744 300,549 323,740Fair value of plan assets (144,177) (151,719) (167,121) (182,024)Funding deficit of the plans 171,296 140,025 133,428 141,716
Experience adjustments arising from plan liabilities (17,719) (9,427) 6,573 5,151Experience adjustments arising from plan assets (6,529) (18,191) (15,018) (338)
The significant increase of the funding deficit of the defined benefit plans has significantly been influencedby the sharp decrease of the discount rates used to determine the present value of the defined benefit obli-gations.The long-term interest rates for the local currencies in which the defined benefit plans are expressedwere at a historically low level on the closing date of the fiscal year 2009/10 and have recovered significant-ly afterwards. Therefore, the funding deficit as per August 31, 2010 and the movement in comparison toprior year 2008/09 should be interpreted with the necessary prudence.
B. Equity compensation benefitsEmployee Stock Ownership ProgramShares are granted to participants according to individual contracts and the current Employee StockOwnership Program. The Nomination & Compensation Committee determines the number and priceof shares granted at its discretion. In the past, the price for the granted shares has been zero.The sharesgranted are entitled to full shareholders rights upon vesting. The vesting periods are ranging betweenone and three years. In case of resignation or dismissal, the initially granted but not yet vested sharesbecome forfeited.The Group currently uses treasury shares for this program.
The fair value of the shares granted is measured at the market price at grant date. 15,260 shares weregranted in fiscal year 2009/10 (15,007 shares in 2008/09). The fair value of the shares at grant date isrecognized over the vesting period as a personnel expense. For 2009/10 the amount recognized (beforetaxes) was CHF 5.7 million with a corresponding increase in equity (2008/09: CHF 11.6 million). Theaverage fair value for the shares granted during the fiscal year 2009/10 amounted to CHF 581(2008/09: CHF 518).
25. Equity
Share capital
as of August 31, 2010 2009 2008in thousands of CHF
Share capital is represented by 5,170,000 authorizedand issued shares of each CHF 38.20 fully paid in(in 2009: 50.70; in 2008: 62.20) 197,494 262,119 321,574
The issued share capital is divided into 5,170,000 registered shares with a nominal value of CHF 38.20each (CHF 50.70 as ofAugust 31, 2009).All of the issued shares are fully paid and validly issued and arenot subject to calls for additional payments of any kind.
Instead of a dividend, the Annual General Meeting held on December 8, 2009, resolved a share capitalreduction and repayment of CHF 12.50 per share resulting in a total share capital reduction ofCHF 64.6 million (December 2008: capital reduction and repayment of CHF 11.50 per share resulting ina total share capital reduction of CHF 59.5 million).The respective repayment took place inMarch 2010.
The Company has one class of shares, which carries no right to a fixed dividend.
Consolidated 99Financial Statements
100 Konzernrechnung
Treasury shares are valued at weighted average cost and, in accordance with IFRS, have been deductedfrom equity. The fair value of the treasury shares as of August 31, 2010, amounted to CHF 3.3 million(2009: CHF 4.0 million).
As of August 31, 2010, the number of outstanding shares amounted to 5,165,239 (2009: 5,163,068)and the number of treasury shares to 4,761 (2009: 6,932). During this fiscal year, 9,174 shares have beenpurchased, 10,845 transferred to employees under the Employee StockOwnership Program and 500 sold(2008/09: 14,212 purchased and 23,734 transferred). In prior year, no treasury shares have been sold.
Retained earningsAs ofAugust 31, 2010, retained earnings contain legal reserves of CHF 42.7 million (2009: CHF 57.0 mil-lion), which are not distributable to the shareholders pursuant to Swiss law.
Hedging reserves comprise the effective portion of the cumulative net change in the fair value of cashflow hedging instruments related to hedged transactions that have not yet occurred.
Cumulative translation adjustments comprise all foreign currency differences arising from the translationof the financial statements of foreign operations.
Movements of non-controlling interest
in thousands of CHF 2009/10 2008/09
as of September 1, 589 392Non-controlling share of profits / (losses) 517 18Changes in ownership interest in subsidiariesSIC Cacaos SA – 300
26. Financial risk managementThe nature of its business exposes the Group to a variety of financial risks including the effects ofchanges in market prices (commodity prices, foreign exchange rates, interest rates) as well as credit risksand liquidity risks.
The Group’s overall strategy for managing these risks is consistent with the Group’s objectives to main-tain cost leadership, reduce earnings volatility in a cost-effective manner andminimize potential adverseeffects of such market exposures on the financial performance of the Group.The Group’s risk manage-ment continuously monitors the entities’ exposures to commodity price risk, interest rate risk andforeign currency risk as well as the use of derivative instruments.
The Group manages its business based on the following two business models:– Contract Business: Sales contracts for industrial, gourmet or consumer chocolate, where BarryCallebaut has entered into contracts with customers to deliver fixed quantities at fixed prices.These con-tractually fixed prices are generally based on the forward market prices of the raw material componentsvalid at the contract date for the forward delivery date, at which the chocolate is planned to be deliveredto the customers.– Price List Business:Barry Callebaut sets price lists for certain gourmet and consumer products.Theseprice lists are normally updated at intervals of six to twelve months. Customers buy products based onthe issued price lists without fixed commitments on quantities.
100 ConsolidatedFinancial Statements
Notes
Konzernrechnung 101
Commodity price risksThe Group’s purchasing and sourcing center operates as an integral part of the Group but also acts as abroker-trader in the sense that it makes sourcing and risk management decisions for the raw materialsbased on market expectations, separate from the manufacturing business and its third party sales com-mitments. Its objectives are to generate profits from fluctuations in commodity prices or broker-tradermargins.Additionally, the manufacturing of the Group’s products requires raw materials such as cocoabeans, sweeteners, dairy, nuts, oil and fats. Therefore, the Group is exposed to price risks relating to thetrading business as well as to the sale of chocolate.
The value of the Group’s open sales and purchase commitments and inventory of raw materials changescontinuously in line with price movements in the respective commodity markets.
The Group’s policy is to hedge its chocolate price risk which consists of the price risk of cocoa and othercommodities such as milk, sugar and nuts for open sales contracts of industrial chocolate (Contract Busi-ness). It uses commodity futures, commodity forward contracts and inventories to manage price risksassociated with firm sales commitments of industrial chocolate (Contract Business).The related accoun-t-ing treatment is explained in the section “Summary ofAccounting Policies” under the caption “Deriv-ative financial instruments and hedging activities”.
The Group Commodity Risk Committee (GCRC) is a committee consisting of key risk managementstakeholders of the Group who meet on a regular basis (at least every six weeks) to discuss GroupCommodity Risk Management issues.The GCRCmonitors the Group’s Commodity Risk Managementacti-vities and acts as the decision-taking body for the Group in this respect.The members of the GCRCinclude the Group’s Chief Executive Officer (CEO), the Group’s Chief Financial Officer (CFO) –acting as Chairman of the committee – the President of Global Sourcing &Cocoa and the Group’s Headof Risk Management (GRM).
The GCRC reports via the GRM to the Group’s Audit, Finance, Risk, Quality & ComplianceCommittee (AFRQCC) and must inform the latter about key Group Commodity Risk issues and thekey mitigation decisions taken. The AFRQCC reviews and approves GCRC requests and makes surethat the commodity risk management strategy is consistent with the Group’s objectives. It also sets theGroup’s Value at Risk (VaR) limit.TheAFRQCCmakes recommendations to the Board of Directors ifdeemed necessary and advises the Board of Directors on important riskmatters and/or asks for approval.
In order to quantify and manage the Group’s consolidated exposure to commodity price risks, theconcept of historical VaR is applied. The VaR concept serves as the analytical instrument for assessingthe Group’s commodity price risk incurred under normal market conditions.TheVaR indicates the losswhich, within a time horizon of 10 days for raw materials, will not be exceeded at a confidence level of95% using 7 years of historical market prices for each major raw material component.The VaR is com-plemented through the calculation of the expected shortfall and worst cases as well as the use of stresstest scenarios.However, liquidity and credit risks are not included in the calculation and theVaR is basedon a static portfolio during the time horizon of the analysis. The GCRC breaks down the Group VaRlimit into a VaR limit for the Sourcing unit as well as limits in metric tonnes for the other risk reportingunits.The Board of Directors is the highest approval authority for all Group Commodity Risk Manage-ment (GCRM) matters and approves the GCRM Policy as well as the Group VaR limit.
The VaR framework of the Group is based on the standard historical VaR methodology; taking 2,000days (equivalent to 7 years) of themost recent prices, based on which the day-to-day relative price changesare calculated. This simulation of past market conditions is not predicting the future movement incommodity prices. Therefore, it does not represent actual losses. It only represents an indication ofthe future commodity price risks. As of August 31, 2010, the Group had a VaR of CHF 10.8 million(2009: CHF 8.2 million) well within the Group limit. The nominal exposure to commodity price risks isshown under contractual maturities.
Consolidated 101Financial Statements
102 Konzernrechnung
Foreign currency risksThe Group operates across the world and consequently is exposed to multiple foreign currency risks,albeit primarily in EUR, GBP and USD. The Group actively monitors its transactional currency expo-sures and consequently enters into currency hedges with the aim of preserving the value of assets,commitments and anticipated transactions.The related accounting treatment is explained in the section“Summary of Accounting Policies” under the caption “Derivative financial instruments and hedgingactivities”.
All risks related to foreign currency exposures of assets and liabilities, certain unrecognized firmcommitments and highly probable forecasted purchases and sales are centralized within the Group’sIn-house Bank, where the hedging strategies are defined.
Accordingly, the consolidated currency exposures are hedged in compliance with the Group’s TreasuryPolicy, mainly by means of forward currency contracts entered into with high credit quality financialinstitutions. The Group’s Treasury Policy imposes a dual risk control framework of both open positionlimits and near-time fair valuation of the net currency exposures. Both levels of control are substantiallyinterlinked, avoiding excessive net currency exposures and substantial volatility in the income statement.
The Group’s Treasury department is supervised by the Group Finance Committee, which meets at leaston a monthly basis, to discuss Group Treasury risk management issues. The Group Finance Committeemonitors the Group’s foreign currency risk position and acts as a decision-taking body for the Groupin this respect. The Group Finance Committee consists of the Group’s CFO, the Group’s Head of RiskManagement, the Group’s Head of Treasury,Tax, Insurance and Legal and other Group Finance stake-holders.
The Group’s Treasury Policy giving guidance on treasury risk management including foreign currencyand interest rate risks is approved and annually reviewed by theAFRQCC.The Group’s Risk Manage-ment department reviews the consistency of theGroup’s treasurymanagement strategy with theGroup’sTreasury Policy and reports the status to the Group’s CFO periodically. The AFRQCC is informed bythe CFO about the status and important matters in their quarterly meetings and approves requests ofthe Group’s Finance Committee on important treasury risk matters including foreign currency risks forrecommendation to the Board of Directors.The Board of Directors is the highest approval authority forall Group Treasury Risk Management matters.
The table below provides an overview of the net exposure of EUR, GBP and USD against eachfunctional currency in the Group.According to the Group’s Treasury Policy, foreign exchange exposuresare hedged as from identification on an intra-day basis in line with the approved exposure limits. In caseof deviation from the agreed foreign exchange exposure limits, approval has to be sought from theGroup’s Finance Committee. Companies with the same functional currency are shown in one group.
Net foreign currency exposures
as of August 31, 2010 2009Net exposure in thousands of EUR GBP USD EUR GBP USDFunctional currency
In order to quantify and manage the Group’s consolidated exposure to foreign currency risks, the con-cept of historical VaR has been implemented for 2009/10. The VaR concept serves as the analyticalinstrument for assessing the Group’s foreign currency risk incurred under normal market conditions.The VaR indicates the loss, which, within a time horizon of 1 day, will not be exceeded at a confidencelevel of 95% using 7 years of historical market prices for each major currency pair. The VaR is comple-mented with the calculation of the expected shortfall and worst cases. The VaR is based on static expo-sures during the time horizon of the analysis. The simulation of past market conditions is not predictingthe future movement in foreign currency rates. Therefore, it does not represent actual losses. It onlyrepresents an indication of future foreign currency risks. As of August 31, 2010, the Group had a VaRof CHF 0.1 million (2009: CHF 0.3 million).
as of August 31, 2010 2009Value at Risk on net exposures in thousands of CHFTotal for the Group and per main exposure currencies
Interest rate risksTheGroup is exposed to changes in interest rates through its short- and long-term debt obligationsmainlylocated in and centralized at the Group’s In-house Bank. The Group’s In-house Bank provides thenecessary liquidity in the required functional currency towards all companies of theGroup.Consequently,the Group’s debt obligations are adjusted with the real currency mix of the Group’s liabilities in orderto reflect the correct exposure to interest rates.
It is the Group’s policy to manage its interest cost using an optimal mix of fixed and floating rate debt.This optimal mix is primarily determined by the level of the Group’s interest cover ratio and is achievedby entering into interest rate derivative instruments, in which it exchanges fixed and floating interestrates.
As described in the caption “Foreign currency risks”, the Group’s Finance Committee, which meets ona monthly basis, monitors the Group’s interest risk positions and acts as a decision-taking body for theGroup in this respect.
The Group’s Treasury Policy also covers the management of interest rate risks.As for foreign currencyrisks, the Group’s Risk Management department supervises the compliance of the treasury interest raterisk management strategy with the Group’s Treasury Policy and reports the status periodically to theGroup’s CFO, who informs theAFRQCC in their quarterly meetings.TheAFRQCC approves requestsfrom the Group Finance Committee on important treasury matters including interest rate risks andprovides recommendations thereon to the Board of Directors, which is the highest approval authorityfor all Group treasury matters.
Consolidated 103Financial Statements
104 Konzernrechnung
The following schedule provides an overview of all interest-bearing items per year-end closing.
as of August 31, 2010 2009in thousands of CHF
Fixed interest bearing itemsCarrying amount of financial liabilities 448,151 523,371Reclassification due to interest rate derivative 245,572 310,939Net fixed interest position 693,723 834,310
Floating interest bearing itemsCarrying amount of financial assets (18,110) (37,862)Carrying amount of financial liabilities 440,769 457,145Reclassification due to interest rate derivative (245,572) (310,939)Net floating interest position 177,087 108,344
Sensitivity analysis on interest rate risksThe following table shows the impact of a parallel shift of interest rates by 100 basis points (BP) up and25 BP down on the Group’s equity and income statement, net of tax. Due to lower interest rates, theunderlying assumptions for the sensitivity analysis have been aligned with prevailing market circum-stances.The calculation is performed on both, the portion of the outstanding debt (excluding the asset-backed securitization program; see notes 9 and 12) at floating interest rates and the outstanding deriva-tives exchanging floating into fixed interest rates at the respective year-end.This sensitivity analysis onlyindicates the potential impact for the respective fiscal year at the prevailing conditions in the financialmarkets. Consequently, it does not represent actual or future gains or losses, which are strictly managedand controlled, as clearly indicated in the Group’s Treasury Policy.
as of August 31, 2010 2009Impact onin thousands of CHF
Credit risk and concentration of credit riskCredit risk, i.e. the risk of counterparties defaulting, is controlled by the application of credit approvals,limits andmonitoring procedures.As ofAugust 31, 2010, the largest customer represents 10% (2009: 4%)whereas the 10 biggest customers represent 26% (2009: 18%) of trade receivables. Due to the diversegeographic and large customer base, the Group has no material credit risk concentration.
The extent of the Group’s credit risk exposure is represented by the aggregate balance of amounts recei-vable, reduced by the effects of netting arrangements, if any, with counterparties.The maximum nominalcredit risk exposure in the event all other parties fail to perform their obligation was CHF 750.4 millionas of August 31, 2010 (2009: CHF 649.3 million). The Group has insured certain credit risks through acredit insurance policy. Selected number of customers with significant outstanding amounts are coveredby that policy.
104 ConsolidatedFinancial Statements
Notes
Konzernrechnung 105
Liquidity riskLiquidity risk arises through a surplus of financial obligations over available financial assets due at anypoint in time. The Group’s liquidity is ensured by means of regular Group-wide monitoring and plan-ning of liquidity coordinated by the In-house Bank. For extraordinary financing needs, adequate creditlines with financial institutions have been arranged (see note 23).
Contractual maturitiesThe table below provides an overview of contractual maturities for financial liabilities and derivatives.
as of August 31, 2010 In the first year In the second tothe fifth year
1 The category “Fair value through profit and loss – trading”mainly includes derivatives held in subsidiaries with the broker/trader statusand does not mean that they are held for trading.
1 The category “Fair value through profit and loss – trading”mainly includes derivatives held in subsidiaries with the broker/trader statusand does not mean that they are held for trading.
2 Certain comparatives have been reclassified to conform with the current period’s presentation.
Notes
Fair Value – HierarchyAs of September 1, 2009, the fair valuemeasurements of financial assets and liabilities are classified usinga fair value hierarchy that reflects the significance of the inputs used in making the measurements.The fair value hierarchy has the following levels:
Level 1:The fair value is based on unadjusted, quoted prices in active markets which gives the best pos-sible objective indication for the fair value of a financial asset or liability.The assets and liabilities includedin this fair value hierarchy mainly consist of commodity futures.
Level 2:The estimation of the fair value is based on the results of a valuationmodel.The valuationmodelfor commodity derivatives includes quoted prices in active markets, recent arm’s length transactions ordealer and supplier quotes adjusted for the specific characteristics of the underlying commodities suchas the cost of carry, differentials for the properties and conversion yields. Corroborated market data isused for the valuation of foreign exchange and interest rate derivatives.
Level 3: The valuation models used are based on parameters and assumptions not observable on themarket.
The following table summarizes the use of level with regard to financial assets and liabilities:
as of August 31, 2010 Level 1 Level 2 Level 3 Totalin thousands of CHF
There have been no transfers between the levels during the fiscal year 2009/2010.
Consolidated 107Financial Statements
Capital managementIt is the Group’s policy to maintain a sound capital base to support the continued development ofthe business. The Board of Directors seeks to maintain a prudent balance between debt and equity. Incompliance with bank covenants, the minimal target solvency ratio (equity in % of total assets, adjustedfor derivative financial instruments on a netted basis) is set at 20%.
The target payout ratio to shareholders currently amounts to approximately 30% of the net profit for theyear in the form of a share capital reduction and repayment or dividend.The target ratio and the form ofthe payout recommended by the Board are reviewed on an annual basis and are subject to the decisionof the Annual General Meeting of Shareholders.
The Group’s subsidiaries have complied with applicable local statutory capital requirements.
27. Related partiesThe following shareholders hold a participation of more than 3% of the issued share capital of theGroup’s ultimate parent Barry Callebaut AG:
as of August 31, 2010 2009
Jacobs Holding AG, Zurich, Switzerland 50.11% 50.21%Renata Jacobs 8.48% 8.48%Nicolas and Philippe Jacobs1 6.14% 6.14%Nathalie Jacobs 3.07% 3.07%
1 Form a group of shareholders according to Swiss Stock exchange regulations as publishedin the Swiss Official Gazette of Commerce of February 4, 2008
Significant transactions and balances between the Group and related parties are as follows:
in thousands of CHF Nature of cost/revenue 2009/10 2008/09
Sales to related parties 173 476Pastelería Totel, S.L. Revenue from sales and services 173 476
Purchases from related parties (11,424) (9,554)African Organic Produce AG Cost of goods sold (11,424) (9,554)
Operating expenses charged by related parties (7,692) (8,746)Jacobs Holding AG Management services (1,650) (1,678)Adecco Group Human resources services (5,940) (6,886)Pastelería Totel, S.L. Management services (13)Biolands International Ltd Management services (67)Other (102) (102)
Trade receivables from related parties 2 192Jacobs Holding AG 2 2Adecco Group – 4Pastelería Totel, S.L. – 186
Trade payables to related parties 3,531 2,609Jacobs Holding AG 310 316Adecco Group 1,282 1,144African Organic Produce AG 1,882 1,097Biolands International Ltd – 33Other 57 19
Transactions with related parties were carried out on commercial terms and conditions at market prices.All receivables from related parties are non-interest bearing and their collection is expected within thenext twelve months.
108 ConsolidatedFinancial Statements
Notes
Consolidated 109Financial Statements
Compensation of key management personnelThe key management personnel are defined as the Board of Directors and the Executive CommitteeKey management compensation consists of the following:
Further details related to the requirements of the Swiss Transparency law (Art. 663bbis and 663c SwissCode of Obligations) are disclosed in note 6 in the Financial Statements of Barry Callebaut AG.
28. Commitments and contingencies
Capital commitments
as of August 31, 2010 2009in thousands of CHF
Property, plant and equipment 1,047 153Intangible assets 2,747 964Total capital commitments 3,794 1,117
Operating lease commitmentsOperating lease commitments represent rentals payable by the Group for certain vehicles, equipment,buildings and offices. Equipment and vehicle leases were negotiated for an average term of 3.6 years(2008/09: 3.0 years).
The future aggregate minimum lease payments under non-cancellable operating leases are due asfollows:
as of August 31, 2010 2009in thousands of CHF
In the first year 13,697 14,173In the second to the fifth year 37,096 37,237After five years 28,517 33,989Total future operating lease commitments 79,310 85,399
in thousands of CHF 2009/10 2008/09
Lease expenditure charged to the income statement 14,274 13,921
ContingenciesGroup companies are involved in various legal actions and claims as they arise in the ordinary course ofthe business. Provisions have been made, where quantifiable, for probable outflows. In the opinion ofthe management, after taking appropriate legal advice, the future settlements of such actions and claimswill not have a material effect on the Group’s financial position.
29. Group companiesThe principal subsidiaries of Barry Callebaut as of August 31, 2010, are the following:
Country Subsidiary Ownership in % Currency Capital
Switzerland Barry Callebaut Sourcing AG 100 CHF 2,000,000Barry Callebaut Schweiz AG 100 CHF 4,600,000Chocolat Alprose SA 100 CHF 7,000,000
Belgium Barry Callebaut Services N.V. 100 EUR 615,000,000Barry Callebaut Belgium N.V. 100 EUR 62,700,000International Business Company Belgium BVBA 100 EUR 65,000Pierre Iserentant SA 100 EUR 260,908
Brazil Barry Callebaut Brasil SA 100 BRL 26,114,993Cameroon Société Industrielle Camerounaise des Cacaos SA 78.35 XAF 1,147,500,000
SEC Cacaos SA 100 XAF 10,000,000Canada Barry Callebaut Canada Inc. 100 CAD 2,000,000China Barry Callebaut Suzhou Chocolate Ltd 100 USD 27,000,000
Barry Callebaut Suzhou Chocolate R&D Center 100 USD 2,000,000Côte d’Ivoire Société Africaine de Cacao SACO SA 100 XAF 25,695,651,316
Barry Callebaut Négoce SA 100 XAF 3,700,000,000Czechia Barry Callebaut Czech Republic s.r.o. 100 CZK 200,000Denmark Barry Callebaut Danmark APS 100 DKK 125,000
Eurogran A/S 100 DKK 3,000,000Ecuador Barry Callebaut Ecuador SA 100 USD 50,000France Barry Callebaut Manufacturing France SAS 100 EUR 6,637,540
Barry Callebaut France SAS 100 EUR 50,000,000Barry Callebaut Manufacturing Bourgogne SAS 100 EUR 2,000,000
Germany Barry Callebaut Deutschland GmbH 100 EUR 51,129Van Houten GmbH & Co KG 100 EUR 15,338,756C.J. van Houten & Zoon Holding GmbH 100 EUR 72,092,155Van Houten Beteiligungs AG & Co KG 100 EUR 99,975,000Stollwerck GmbH 100 EUR 20,500,000Stollwerck Schokoladenvertriebs GmbH 100 EUR 7,184,000Van Houten Beteiligungs GmbH 100 EUR 25,000Schloss Marbach GmbH 100 EUR 1,600,000
Ghana Barry Callebaut Ghana Ltd 100 USD 9,204,219Great Britain Barry Callebaut Manufacturing (UK) Ltd 100 GBP 15,467,852
Barry Callebaut UK Ltd 100 GBP 3,200,000Barry Callebaut Vending UK Ltd 100 GBP 40,000
Hong Kong Van Houten (Asia Pacific) Ltd 100 HKD 2India Barry Callebaut India 100 INR 10,000,000Italy Barry Callebaut Italia S.p.A. 100 EUR 104,000
Sweden Barry Callebaut Sweden AB 100 SEK 100,000Eurogran Nordic AB 100 SEK 100,000
The Netherlands Barry Callebaut Nederland B.V. 100 EUR 21,435,000Luijckx B.V. 100 EUR 18,242Hoogenboom Benelux BV 100 EUR 18,152Dings Décor B.V. 70 EUR 22,689
Turkey Barry Callebaut Eurasia Gida Sanayi VE Ticaret Ltd Sti 100 TRL 40,000USA Barry Callebaut Cocoa USA Inc. 100 USD 7,663
Barry Callebaut North America Holding Inc. 100 USD 100,001,000Barry Callebaut USA LLC. 100 USD 100,190,211
Barry Callebaut has some dormant companies which are not enclosed as principal subsidiaries, for example Barry Callebaut Belgium Consumer NV,Van Houten Service AG, Barry Callebaut Holding (UK) Ltd, Adis Holding Inc., Barry Callebaut USA Holding, Inc., Omnigest SAS, Alliance Cacao SA
112 ConsolidatedFinancial Statements
30. Risk assessment disclosure required by Swiss Law
Group Risk ManagementBarry Callebaut’s Group Risk Management (GRM) is a corporate function responsible for implemen-ting and managing all Group Risk Functions including the Enterprise Risk Management (ERM) underthe direction and as approvedby theAudit,Finance,Risk,Quality andComplianceCommittee (AFRQCC)of the Board of Directors.The Group’s ERM Framework is designed to create an aggregate view on allexisting major risks, enabling the Group to systematically evaluate, prioritize and control the Group’srisk portfolio. The ERM is based on the framework of the Committee for Sponsoring Organizations(COSO) and classifies risks into major five risk categories: Strategic, Market, Financial Reporting,Operating and Compliance/Legal Risks. The Group’s ERM is multidimensional in the form, that risksare identified, assessed and controlled not only directly from the legal entity but also from specializedCorporate Functions such as Quality Assurance, Sourcing and Cocoa, Group Finance and Treasury,Operations & Supply Chain Organization (OSCO), Information Management, Global Human Resour-ces, Innovations andResearch andDevelopment andGroup Insurance and supervised by theGRM.Riskassessments are the responsibility of line management but overseen and controlled by GRM. Thus,issues and risks on all levels can be identified, addressed and mitigated efficiently and effectively.
The results of the Group ERM are presented to theAFRQCC quarterly or immediately in the event ofan emergency individual risk issue.
Financial risk management is described in more detail in note 26.
31. Subsequent events
The Consolidated Financial Statements were authorized for issue by the Board of Directors onNovember 2, 2010, and are subject to approval by the Annual General Meeting of Shareholderson December 7, 2010.
Notes
Konzernrechnung 113Report of the Statutory Auditor 113
Report of the Statutory Auditor on the Consolidated Financial Statements to the General Meetingof Shareholders of
Barry Callebaut AG, ZurichAs statutory auditor, we have audited the accompanying consolidated financial statements of BarryCallebautAG,which comprise the income statement, statement of comprehensive income,balance sheet,cash flow statement, statement of changes in equity and notes on page 56 to 112 for the year endedAugust 31, 2010.
Board of Directors’ ResponsibilityThe board of directors is responsible for the preparation and fair presentation of the consolidated finan-cial statements in accordance with International Financial Reporting Standards (IFRS) and the require-ments of Swiss law.This responsibility includes designing, implementing andmaintaining an internal con-trol system relevant to the preparation and fair presentation of consolidated financial statements thatare free from material misstatement, whether due to fraud or error. The board of directors is furtherresponsible for selecting and applying appropriate accounting policies and making accounting estimatesthat are reasonable in the circumstances.
Auditor’s ResponsibilityOur responsibility is to express an opinion on these consolidated financial statements based on our audit.We conducted our audit in accordance with Swiss law and SwissAuditing Standards as well as Internation-al Standards on Auditing. Those standards require that we plan and perform the audit to obtain reason-able assurance whether the consolidated financial statements are free from material misstatement.
An audit involves performing procedures to obtain audit evidence about the amounts and disclosuresin the consolidated financial statements. The procedures selected depend on the auditor’s judgment,including the assessment of the risks of material misstatement of the consolidated financial statements,whether due to fraud or error. In making those risk assessments, the auditor considers the internalcontrol system relevant to the entity’s preparation and fair presentation of the consolidated financialstatements in order to design audit procedures that are appropriate in the circumstances, but not for thepurpose of expressing an opinion on the effectiveness of the entity’s internal control system.An auditalso includes evaluating the appropriateness of the accounting policies used and the reasonableness ofaccounting estimates made, as well as evaluating the overall presentation of the consolidated financialstatements.We believe that the audit evidence we have obtained is sufficient and appropriate to providea basis for our audit opinion.
OpinionIn our opinion, the consolidated financial statements for the year endedAugust 31, 2010 give a true andfair view of the financial position, the results of operations and the cash flows in accordance with Inter-national Financial Reporting Standards (IFRS) and comply with Swiss law.
Report on Other Legal RequirementsWe confirm that we meet the legal requirements on licensing according to the Auditor Oversight Act(AOA) and independence (article 728 CO and article 11 AOA) and that there are no circumstancesincompatible with our independence.
In accordance with article 728a paragraph 1 item 3 CO and SwissAuditing Standard 890,we confirm thatan internal control system exists, which has been designed for the preparation of consolidated financialstatements according to the instructions of the board of directors.
We recommend that the consolidated financial statements submitted to you be approved.
KPMGAG
Roger Neininger Marc ZieglerLicensed Audit Expert Licensed Audit ExpertAuditor in Charge
KPMG AG/SA, a Swiss corporation, is a subsidiary of KPMG Holding AG/SA,which is a subsidiary of KPMG Europe LLP and a member of the KPMG net-work of independent firms affiliated with KPMG International Cooperative(“KPMG International”), a Swiss legal entity.
Member of the Swiss Instituteof Certified Accountants and Tax Consultants
114 Konzernrechnung
5-Year Overview
114 5-Year Overview
Key Figures Barry Callebaut Group CAGR(%)14 2009/10 2008/09 2007/08 2006/07 2005/0615
Consolidated Income StatementSales volume Tonnes 7.5% 1,305,280 1,213,610 1,166,007 1,059,200 976,661Sales revenue CHF m 8.9% 5,213.8 4,880.2 4,815.4 4,106.8 3,713.2EBITDA1 CHF m 4.6% 470.7 456.1 443.7 427.1 392.5Operating profit (EBIT) CHF m 5.9% 370.4 350.8 341.1 324.0 295.0Net profit from continuing operations2 CHF m 7.3% 251.7 226.9 209.1 207.0 189.7Net profit for the year CHF m 8.2% 251.7 226.9 205.5 124.1 183.5Cash flow3 CHF m 7.1% 457.8 418.1 434.3 406.8 347.9EBIT/sales revenue % 7.1% 7.2% 7.1% 7.9% 7.9%EBIT per tonne CHF (1.5%) 283.8 289.1 292.5 305.9 302.0
Balance SheetTotal assets CHF m 6.2% 3,570.8 3,514.8 3,729.5 3,186.7 2,811.8Net working capital4 CHF m 1.2% 964.9 1,010.1 1,037.1 883.9 920.9Non-current assets CHF m 4.4% 1,405.8 1,432.2 1,423.7 1,211.3 1,184.9Net debt CHF m (1.0%) 870.8 942.7 1,041.2 930.2 906.9Shareholders’ equity5 CHF m 6.8% 1,302.3 1,255.6 1,175.9 1,059.1 999.2Capital expenditure6 CHF m 6.1% 145.1 144.4 249.9 153.1 114.7
RatiosEconomic Value Added (EVA) CHF m 8.8% 147.7 129.9 126.3 122.9 105.4Return on invested capital (ROIC)7 % 14.8% 13.9% 14.0% 14.3% 13.7%Return on equity (ROE) % 19.6% 18.1% 17.7% 19.5% 19.0%Debt to equity ratio % 66.9% 75.1% 88.5% 87.8% 90.8%Solvency ratio8 % 36.5% 35.7% 31.5% 33.2% 35.5%Interest coverage ratio9 2.3% 5.8 5.0 4.8 5.1 5.3Net debt/EBITDA (4.7%) 1.9 2.1 2.3 2.2 2.3CAPEX/sales revenue % 2.8% 3.0% 5.2% 3.7% 3.1%
SharesShare price at fiscal year-end CHF 6.4% 703 574 724 873 548EBIT per share (issued) CHF 5.8% 71.6 67.8 66.0 62.7 57.1Basic earnings per share10 CHF 7.3% 48.6 44.0 40.4 40.2 36.7Cash earnings per share11 CHF 7.3% 88.6 81.1 83.9 78.6 66.9Payout per share12 CHF 7.5% 14.0 12.5 11.5 11.5 10.5Payout ratio % 29% 28% 28% 29% 29%Price-earnings ratio at year-end13 (0.8%) 14.4 13.0 17.9 21.7 14.9Market capitalization at year-end CHF m 6.4% 3,631.9 2,967.6 3,743.1 4,510.8 2,833.2Number of shares issued 0.0% 5,170,000 5,170,000 5,170,000 5,170,000 5,170,000Total capital repayment CHF m 11.8% 64.6 59.5 59.5 54.3 41.4
1 EBIT + depreciation of property, plant and equipment +amortization of intangible assets
2 Net profit from continuing operations (including non-controlling interest)3 Operating cash flow before working capital changes4 Includes current assets and liabilities related to commercial activitiesand current provisions
5 Total equity attributable to the shareholders of the parent company6 Capital expenditure for property, plant and equipment and intangibleassets (excl. acquisitions)
7 EBIT x (1-effective tax rate)/average capital employed8 Total equity attributable to the shareholders of the parent company/total assets
9 EBITDA/net financial expense10 Based on the net profit for the year attributable to the shareholders of the parent company/
basic shares outstanding11 Operating cash flow before working capital changes/basic shares outstanding12 Par value reduction instead of a dividend; 2009/10 as proposed by the Board of Directors
to the Annual General Meeting13 Share price at year-end/basic earnings per share14 Compound annual growth rate15 Certain comparatives have been restated or reclassified to conform to the current period’s
presentation
Contents
116 Financial Statements of Barry Callebaut AG
116 Income Statement117 Balance Sheet118 Notes to the Financial Statements
121 Report of the Statutory Auditor
116 Konzernrechnung
for the fiscal year ended August 31, 2009/10 2008/09in CHF
IncomeDividend income 130,870,000 110,000,000Financial income 9,769,770 7,661,120License income 40,259,531 38,513,363Management fees 21,556,186 22,510,824Other income 8,885,175 15,466,509Total income 211,340,662 194,151,816
ExpensesPersonnel expenses (28,139,426) (33,478,497)Financial expenses (14,432,489) (13,290,633)Depreciation of property, plant and equipment (588,538) (770,364)Amortization of intangible assets (3,055,936) (12,702,883)License expenses – (570,990)Unrealized loss on treasury shares (2,119) (439,966)Other expenses (25,940,834) (26,888,636)Total expenses (72,159,342) (88,141,969)
Profit before taxes 139,181,320 106,009,847
Income taxes (2,095,374) (922,490)
Net profit for the year 137,085,946 105,087,357
Retained earnings
in CHF 2009/10 2008/09
Retained earnings as of September 1, 956,043,024 841,902,604(Increase) decrease of reserve for treasury shares 1,422,174 8,990,434Capital reduction on treasury shares 5,763 62,629Net profit 137,085,946 105,087,357Retained earnings as of August 31, 1,094,556,907 956,043,024
Income Statement
116 Financial Statementsof Barry Callebaut AG
Konzernrechnung 117
Assets
as of August 31, 2010 2009in CHF
Current assetsCash and cash equivalents 32,841 42,523Treasury shares 3,188,572 4,172,899Accounts receivable from Group companies 16,196,438 25,990,075Short-term loans granted to Group companies 425,308 19,357Other current assets 2,820,819 2,537,091Total current assets 22,663,978 32,761,945
Non-current assetsProperty, plant and equipment 1,243,716 1,562,389Financial assetsInvestments 1,853,772,715 1,723,177,978
Intangible assetsTrademarks 7,753,946 6,514,687Patents/Product development costs 2,861,710 2,016,984Other 912,163 543,806
Total non-current assets 1,866,544,250 1,733,815,844
Total assets 1,889,208,228 1,766,577,789
Liabilities and shareholders’ equity
as of August 31, 2010 2009in CHF
Current liabilitiesBank overdrafts 5,832 –Accounts payable to third parties 1,925,783 5,055,923Accounts payable to Group companies 10,795,931 5,385,251Accounts payable to shareholders 309,605 316,011Short-term loans from Group companies 405,887,809 359,149,996Accrued liabilities 16,193,986 15,559,877Accrued taxes 1,828,291 1,316,449Total liabilities 436,947,237 386,783,507
Total liabilities and shareholders’ equity 1,889,208,228 1,766,577,7891 The share capital as of August 31, 2010, consists of 5,170,000 fully paid-in sharesat a nominal value of CHF 38.20 (August 31, 2009: CHF 50.70)
Financial Statements 117of Barry Callebaut AG
Balance Sheet
118 Konzernrechnung
1. Liens, guarantees and pledges in favor of third partiesThe Company is a co-debtor for bank loans of max. EUR 850 million (CHF 1,098.6 million; 2008/09:CHF 1,293.7 million) obtained by Barry Callebaut Services N.V., Belgium, whereof the maximal liabi-lity is limited to the freely distributable retained earnings (CHF 1,094.6 million less 35% withholdingtax). Furthermore, the Company is also a co-debtor for the Senior Notes of EUR 350million (CHF 452.4million; 2008/09: CHF 532.7 million) issued by Barry Callebaut Services N.V., Belgium. Additionally,the Company issued several corporate guarantees for various credit facilities granted to direct andindirect subsidiaries for an amount of up to CHF 773.7 million (2008/09: CHF 713.9 million).
The Swiss Barry Callebaut entities form aVAT subgroup and, hence, every company participating in thesubgroup is liable for VAT debt of other subgroup participants.
2. Fire insurance value of property, plant and equipment
as of August 31, 2010 2009in CHF
Fire insurance value of property, plant and equipment 6,800,000 5,200,000
3. Investments
Name and domicile Share capital Purpose Percentage of investmentas of August 31, 2010 2009
Barry Callebaut Nederland B.V., EUR 21,435,000 Holding 100% 100%The Netherlands
Barry Callebaut Nigeria Ltd, NGN 10,000,000 Sales 1% 1%Nigeria
Barry Callebaut Schweiz AG, CHF 4,600,000 Production, Sales 100% 100%Switzerland
Barry Callebaut Services N.V.,1 EUR 615,000,000 In-house Bank 99.99% 99.99%Belgium
Barry Callebaut Sourcing AG, CHF 2,000,000 Sourcing 100% 100%Switzerland
BC Belgium Consumer N.V., EUR 61,500 Dormant 99.99% 99.99%Belgium
Chocolat Alprose SA, Switzerland CHF 7,000,000 Production, Sales 100% 100%C.J. Van Houten & Zoon Holding EUR 72,092,155 Holding 100% 100%GmbH, Germany
Luijckx B.V., The Netherlands EUR 18,242 Production, Sales 100% 100%Schloss Marbach GmbH EUR 1,600,000 Conference and 100% 100%Germany Training Center
Van Houten Service AG, CHF 100,000 Dormant 100% 100%Switzerland
1 In 2009/10 share capital was increased by EUR 86,290,000.
Investments are stated at cost less any provision for impairment.
4. Treasury sharesThe Company holds 4,761 treasury shares as of August 31, 2010 (2009: 6,932). In 2009/10, the Companybought 9,174 shares at an average price of CHF 652.65 per share (2008/09: 14,212 shares at an average priceof CHF 619.80) and transferred 10,845 shares at an average price of CHF 652.91 per share (2008/09: 23,734
Notes to the Financial Statements
118 Financial Statementsof Barry Callebaut AG
Konzernrechnung 119Financial Statements 119of Barry Callebaut AG
shares transferred at an average price of CHF 749.94). Furthermore, the Company sold 500 treasury sharesat an average price of CHF 613.50 (2008/09: none).As of August 31, 2010, the treasury shares have beenvalued at average price of CHF 669.73 per share (2008/09: average price of CHF 601.98 per share).
5. Significant shareholders
as of August 31, 2010 2009
Jacobs Holding AG, Zurich, Switzerland 50.11% 50.21%Renata Jacobs 8.48% 8.48%Nicolas and Philippe Jacobs1 6.14% 6.14%Nathalie Jacobs 3.07% 3.07%
1 Form a group of shareholders according to Swiss Stock exchange regulations as publishedin the Swiss Official Gazette of Commerce of February 4, 2008
6. Disclosures according to Art. 663bbis and 663c Code of Obligations
Remuneration of key management1 for the fiscal year 2009/10
in thousands of CHFBoard of Directors (BoD) Compen-
sation fixCompen-sationvariable
Othercompen-sation2
Numberof shares3
Value ofshares4
Totalremunera-tion 09/10
Totalremunera-tion 08/09
Andreas JacobsChairman/Delegate
325.0 – – 360 208.8 533.8 480.3
Andreas SchmidVice ChairmanMember of the AFRQCC5
160.0 – 53.5 180 104.4 317.9 376.7
Rolando BenedickMember of the NCC6
105.0 – 23.8 180 104.4 233.2 208.2
James L. DonaldMember of the NCC
112.5 – – 180 104.4 216.9 222.3
Markus Fiechter7Member of the AFRQCC
– – – – – – -–
Stefan PfanderChairman of the NCC
135.0 – – 180 104.4 239.4 204.8
UrsWidmerChairman of the AFRQCC
127.5 – 23.2 180 104.4 255.1 210.5
Total remunerationBoard of Directors 965.0 – 100.5 1,260 730.8 1,796.3 1,702.8
Highest individualremuneration withinExecutive Committee:Juergen B. SteinemannCEO Barry Callebaut Group 1,000.0 1,011.1 680.4 3.750 2,175.0 4,866.5 n/a 9
There were no termination payments nor payments to former members of the Board of Directors orExecutive Committee during the fiscal year.
As of August 31, 2010, no loans or credits to members of the Board of Directors or ExecutiveCommittee or parties closely related to them are outstanding.
120 Konzernrechnung
Holdings of shares10
Number ofShares
2009/10
Number ofShares
2008/09Board of DirectorsAndreas Jacobs (Chairman) 11,12 2,341 1,200Andreas Schmid (Vice Chairman) 12,330 12,150Rolando Benedick 1,500 1,320James L. Donald 180 –Markus Fiechter – –Stefan Pfander 780 600UrsWidmer 980 800Senior Management TeamJuergen B. Steinemann, CEO Barry Callebaut Group 93 –Victor Balli, CFO Barry Callebaut Group 906 310Massimo Garavaglia, PresidentWestern Europe 2,300 3,000David S. Johnson, President Americas 2,320 1,800Steven Retzlaff, President Global Sourcing & Cocoa 650 150Dirk Poelman, Chief Operations Officer 4,280 n/aHans P. Vriens, Chief Innovation Officer 2,250 n/a
1 Key management is defined as Board of Directors (BoD) and Executive Committee(since November 2009, formerly Senior Management Team [SMT])
2 Including social security and pension contributions, as well as other benefits3 Number of shares granted in relation to the fiscal year under review; vesting subject to meeting
service and/or performance conditions4 Value defined as closing share price at grant date, which might be historical rates before
the fiscal year under review5 Audit, Finance, Risk, Quality & Compliance Committee6 Nomination & Compensation Committee7 No compensation paid. Services rendered by Markus Fiechter as a member of the BoD
are covered by the service fee charged by Jacobs Holding AG (see note 27 in the ConsolidatedFinancial Statements of Barry Callebaut Group)
8 Disclosure relates to the Executive Committee as in place on August 31, 2010, i.e. JuergenB.Steinemann, Victor Balli, Massimo Garavaglia, Steven Retzlaff, Dirk Poelman, Hans Vriens andDavid S. Johnson. The prior year comparative number is related to the SMT and includes theremuneration for the prior CEO Patrick De Maeseneire for his services rendered in 2008/09 aswell as the remuneration paid to Andreas Jacobs for assuming the role of CEO a.i. The ExecutiveCommittee members Hans Vriens and Dirk Poelman were not members of the SMT in prior year
9 The highest individual remuneration in 2008/09was related to the prior CEOPatrick De Maeseneire and amounted to CHF 6.2million.
10 Including shares of related parties to the individual BoD/Executive Committee member11 Excluding the 50.11% participation held by Jacobs Holding AG12 On August 31, 2009, a related party to Andreas Jacobs held 5,000 call options with a strike price
of CHF 545 and an expiry date of September 7, 2009.
7. Risk assessment disclosuresBarry Callebaut AG as the ultimate parent of the Barry Callebaut Group, is fully integrated into theGroup-wide RiskManagement (GRM) process and the respective Enterprise RiskManagementModel.The GRM process consists of reporting quarterly to the Audit, Finance, Risk, Quality and ComplianceCommittee (AFRQCC) on identified risks, events and respective response by the management. Theprocesses and actions to identify the risks and remediation are identified by specialized corporatefunctions (Commodity management, Treasury, Legal, Internal Audit, Quality, Operations and SupplyChain, etc.) under the GRM program, supported by the legal entities and divisions concerned. TheseGroup function departments are responsible to monitor those procedures and processes and ensureeffective measures while Group risk manager oversee the global process.
The Group’s general Risk Management process and the Financial Risk Management in particular isdescribed in the Group’s consolidated financial statements in notes 30 and 26, respectively.
8. Subsequent eventsThere are no further events after the balance sheet date to be disclosed.
Appropriation of available earningsThe Board of Directors proposes to carry forward the balance of retained earnings of CHF 1,094,556,907.
120 Financial Statementsof Barry Callebaut AG
Notes to the Financial Statements
Konzernrechnung 121Report of the Statutory Auditor 121
Report of the Statutory Auditor on the Financial Statements to the General Meeting of Shareholders of
Barry Callebaut AG, ZurichAs statutory auditor, we have audited the accompanying financial statements of Barry Callebaut AG,which comprise the income statement, balance sheet and notes on pages 116 to 120 for the year endedAugust 31, 2010.
Board of Directors’ ResponsibilityThe board of directors is responsible for the preparation of the financial statements in accordance withthe requirements of Swiss law and the company’s articles of incorporation. This responsibility includesdesigning, implementing and maintaining an internal control system relevant to the preparation offinancial statements that are free from material misstatement, whether due to fraud or error.The boardof directors is further responsible for selecting and applying appropriate accounting policies andmaking accounting estimates that are reasonable in the circumstances.
Auditor’s ResponsibilityOur responsibility is to express an opinion on these financial statements based on our audit. Weconducted our audit in accordance with Swiss law and SwissAuditing Standards.Those standards requirethat we plan and perform the audit to obtain reasonable assurance whether the financial statements arefree from material misstatement.
An audit involves performing procedures to obtain audit evidence about the amounts and disclosuresin the financial statements. The procedures selected depend on the auditor’s judgment, including theassessment of the risks of material misstatement of the financial statements, whether due to fraud orerror. In making those risk assessments, the auditor considers the internal control system relevant to theentity’s preparation of the financial statements in order to design audit procedures that are appropriatein the circumstances, but not for the purpose of expressing an opinion on the effectiveness of theentity’s internal control system.An audit also includes evaluating the appropriateness of the accountingpolicies used and the reasonableness of accounting estimates made, as well as evaluating the overallpresentation of the financial statements.We believe that the audit evidence we have obtained is suffi-cient and appropriate to provide a basis for our audit opinion.
OpinionIn our opinion, the financial statements for the year ended August 31, 2010 comply with Swiss law andthe company’s articles of incorporation.
Report on Other Legal RequirementsWe confirm that we meet the legal requirements on licensing according to the Auditor Oversight Act(AOA) and independence (article 728 CO and article 11 AOA) and that there are no circumstancesincompatible with our independence.
In accordance with article 728a paragraph 1 item 3 CO and SwissAuditing Standard 890,we confirm thatan internal control system exists, which has been designed for the preparation of financial statementsaccording to the instructions of the board of directors.
We further confirm that the proposed appropriation of available earnings complies with Swiss law andthe company’s articles of incorporation.We recommend that the financial statements submitted to yoube approved.
KPMGAG
Roger Neininger Marc ZieglerLicensed Audit Expert Licensed Audit ExpertAuditor in Charge
KPMG AG/SA, a Swiss corporation, is a subsidiary of KPMG Holding AG/SA,which is a subsidiary of KPMG Europe LLP and a member of the KPMG net-work of independent firms affiliated with KPMG International Cooperative(“KPMG International”), a Swiss legal entity.
Member of the Swiss Instituteof Certified Accountants and Tax Consultants
Contents
124 Corporate Governance
134 Glossary
136 Contacts, Financial calendar and Forward-looking statements
124 Konzernrechnung
Group structure and shareholdersThe organization of the Barry Callebaut Group has a structurewhich is divided into three different regions: Region Europe (incl.Western and Eastern Europe), Region Americas and Region Asia-Pacific. The globally managed Global Sourcing & Cocoa business is
reported as a separate segment like a region.There are four differentproduct groups: Cocoa Products, Food Manufacturers Products,Gourmet & Specialties Products and Consumer Products.The follow-ing chart provides an overview of the operational Group structureas of November 4, 2010:
The information that follows is provided in accordance with the Directive onInformation Relating to Corporate Governance issued by the SIX Swiss Exchange.The principles and rules of Corporate Governance as practiced by Barry Callebautare laid down in the Articles of Incorporation, the Regulations of the Board andthe Charters of the Board Committees. These are reviewed regularly by the Boardof Directors and adapted as needed.
Information about the stock listing, principal subsidiaries and signif-icant shareholders of Barry Callebaut is given on pages 62, 70, 108,110 and 111 of the Consolidated Financial Statements and on pages118, 119 and 120 of the Financial Statements of Barry CallebautAG.There are no cross-shareholdings equal to or higher than 5% of theissued share capital.
Capital structure
The information required by the SIX Corporate Governance Direc-tive regarding the capital structure is given in note 25 (share capital,movements in the share capital) of the Consolidated Financial State-ments. The company has no convertible bonds outstanding. In thepast three years, the Group’s capital structure has not changed.
Additional information:www.barry-callebaut.com/corporate_governance and www.barry-callebaut.com/organization
Corporate Governance
124 Corporate Governance
Board of DirectorsChairmanAndreas Jacobs
AFRQCC**AFRQCC ChairmanUrsWidmer
NCC***NCC ChairmanStefan Pfander
CEOJuergen B. Steinemann*
CFOVictor Balli*
Quality AssuranceWilly Geeraerts
Chief Operations OfficerDirk Poelman*
GourmetOlivier Schucht
Global Sourcing & CocoaSteven Retzlaff*
Western EuropeMassimo Garavaglia*
Eastern EuropeFilip De Reymaeker
Corporate Communications & CSRGaby Tschofen
Head of Global Human ResourcesBarbara Becker
Chief Innovation OfficerHans P. Vriens*
AmericasDavid S. Johnson*
Asia-PacificMaurizio Decio
Internal AuditKarel Diepenhorst
General Counsel &Corporate SecretaryRoland Maurhofer
* Member of the Executive Committee** AFRQCC: Audit, Finance, Risk, Quality & Compliance Committee (see page 128)*** NCC: Nomination & Compensation Committee (see page 128)
Konzernrechnung 125Corporate Governance 125
Andreas JacobsChairman of the Board since 2005, member of the Boardsince 2003, German national
In December 2005,Andreas Jacobs (1963) was appointed Chairmanof the Board of Barry Callebaut AG. He had served as a member ofthe Board since 2003.
Since 1992, Andreas Jacobs has been an independent entre-preneur with a stake in several companies (Minibar AG, Baar; andAcentic GmbH) plus minority interests in several other companies.From 1991 to 1993,Andreas Jacobs worked as a consultant and proj-ect manager at The Boston Consulting Group in Munich. He is alsoChairman of Jacobs Holding AG, Chairman of Infront Sports &Media AG and member of the Board of Adecco SA.
Andreas Jacobs studied law at the Universities of Freiburg imBreisgau,Munich andMontpellier and subsequently obtained a post-graduate degree in European competition law (Dr. iur.) from theUni-versity of Freiburg im Breisgau.Afterwards, he obtained a Master ofBusiness Administration from Insead in Fontainebleau.
Andreas SchmidVice Chairman, member of the Board since 1997,Swiss national
Andreas Schmid (1957) was appointed CEO of Jacobs Holding AGin 1997. In 1999, he became Chairman of the Board and CEO ofBarry CallebautAG. In June 2002, he handed over the CEO functionbut continued to assume the responsibility of Chairman until Decem-ber 2005. Since then he has been Vice Chairman of the Board.
He started his career in 1984 at Union Bank of Switzerland.Following a position as assistant to a Swiss industrialist, he was CEOand Managing Director of Kopp Plastics (PTY) Ltd in South Africafrom 1989 to 1992. He then worked for the Jacobs Group in variousstaff and line functions until 1993.From 1993 to 1997, Andreas Schmidwas President of the Mövenpick Consumer Goods Division and amember of the worldwide Group Executive Board of Management.Between 2002 and 2006, he chaired the Board of Kuoni Travel Hold-ing AG. He was a member of the Board of Adecco SA from 1999 to2004 and amember of theAdvisory Board of the Credit SuisseGroupfrom 2001 to 2007, before the Advisory Board was dissolved.
Andreas Schmid is Chairman of Oettinger Davidoff Group andFlughafen Zürich AG. He is Chairman of the Supervisory Board ofSymrise AG, Chairman of the Board of Directors of gategroupHoldingAGandmember of theBoard ofDirectors ofKarl SteinerAG.
Andreas Schmid holds a Master’s degree in law and studiedeconomics at the University of Zurich.
Name Nationality Function Member since
Andreas Jacobs German Chairman 2003Andreas Schmid Swiss Vice Chairman 1997Rolando Benedick Swiss Director 2001James L. Donald U.S. Director 2008Markus Fiechter Swiss Director 2004Stefan Pfander German Director 2005UrsWidmer Swiss Director 2004
Additional information:www.barry-callebaut.com/board and www.barry-callebaut.com/regulations
Board of DirectorsThe Board of Directors is ultimately responsible for the policies andmanagement of Barry Callebaut.The Board establishes the strategic,accounting, organizational and financing policies to be followed, andappoints the Executive Committee, to which the Board of Directorshas delegated the operational management of Barry Callebaut.Besides its non-transferable and inalienable duties, the Board hasretained certain competencies as set forth in the Company’s InternalRegulations, which are publicly accessible on the Barry Callebautwebsite.
As ofAugust 31, 2010, the Board of Directors consisted of seven non-executive members. Each Director is elected by the shareholdersof Barry CallebautAG at the General Meeting for a term of office ofone year and may be re-elected to successive terms.
126 Konzernrechnung
Rolando BenedickDirector since 2001, Swiss national
Rolando Benedick (1946) was appointed CEO of the Manor Groupin 1989, which includes Manor department stores, FLY SwitzerlandandAthleticum Sportmarkets: three chains belonging toMaus FrèresHolding, as well as China-basedHerma Ltd. In 2000, he was appoint-ed Chairman of the Board. From 2006 to December 2007, he servedas Executive Chairman. In January 2008, he passed on his responsi-bilities as Executive Chairman to his successor and continued to serveas Chairman of the Board until the end of 2008.
Rolando Benedick joined the Manor Group in 1970 after com-pleting his secondary studies and various trainee programs atrenowned retail groups in Germany,France and Switzerland. In 1970,he was given responsibility for the planning and construction of thenew shopping center inMonthey.He then became director of the Sionstore.Hewas Chief Executive of the Innovazione chain inTicino from1973 to 1989.
Rolando Benedick is Chairman of the Manor Sud SA and Execu-tive Chairman of Valora Holding AG. He is a member of the Super-visory Board of the Galfa Group (Galleries Lafayette, Monoprix,Laser). In addition, he serves as a non-executive Board memberof “Messe Schweiz”MCH Group AG, the Gottlieb Duttweiler Insti-tute (GDI) and of the Chamber of Commerce “beider Basel”. He isChairman of the “Leopard Club” Locarno and of the “FreiwilligerMuseumsverein Basel” (FMB).
James L. DonaldDirector since 2008, U.S. national
James “Jim” L. Donald (1954) has been President and CEO ofHaggen, Inc., a 33-store Pacific Northwest grocery company basedin Bellingham since September 2009. He also serves as a BoardMember of RiteAid Corporation,one of the leading drugstore chainsin the U.S. with more than 4,900 stores in 31 states.
James Donald was President & Chief Executive Officer ofStarbucks Corporation from April 2005 to January 2008. FromOctober 2002 to March 2005, James Donald served as Presidentof Starbucks, North America. Under his leadership, Starbucks ex-perienced strong growth and performance. From October 1996 toOctober 2002, James Donald served as Chairman, President & ChiefExecutive Officer of Pathmark Stores, Inc., a USD 4.6 billion regionalsupermarket chain located in NewYork, New Jersey and Pennsylva-nia. Prior to that time, he held a variety of senior management posi-tions with Albertson’s, Inc., Safeway, Inc. andWal-Mart Stores, Inc.
James L.Donald graduated with a Bachelor’s degree in BusinessAdministration from Century University,Albuquerque, NewMexico.
Markus FiechterDirector since 2004, Swiss national
Markus Fiechter (1956) has been CEO of Jacobs Holding AG sinceSeptember 2004.
He started his career as Assistant Professor in Chemistry at theUniversity of Applied Sciences in Horw, Lucerne. From 1984 until1991, he held various managerial positions at Mettler ToledoAG.
From 1991 to 1994, he worked for The Boston Consulting Groupas a Manager at the Zurich office. From 1994 to 2004, he was CEOof theMinibar Group.Markus Fiechter isVice President of the Boardof Directors of Valora Holding AG and a member of the Board ofDirectors of Minibar AG.
Markus Fiechter holds a Master’s degree in Chemical Engineer-ing from the Federal Institute ofTechnology in Zurich (ETH) and anMBA from the University of St. Gallen.
126 Corporate Governance
Corporate Governance 127
Stefan PfanderDirector since 2005, German national
Stefan Pfander (1943) started his career in 1971 as Product Managerwith General Foods GmbH in Elmshorn,Germany, and later workedfor Mars Inc. (as Marketing Manager for Effem GmbH, Verden,Germany, as Marketing Director for Kal Kan Foods Inc., Los Ange-les, U.S.). In 1981 he joined theWm.Wrigley Jr. Company as Manag-ing Director initially responsible for Germany later Europe, MiddleEast,Africa and India building leading market positions forWrigleyin over 40 countries. Until January 2006, he was Chairman EuropeandVice President of theWm.Wrigley Jr. Company in Chicago,U.S.
Stefan Pfander is a Supervisory Board Member of MaxingvestAG (Holding company, Beiersdorf AG, Tchibo GmbH), DeputyChairman of the Supervisory Boards of GfK SE (market researchinstitute) and Chairman of the advisory board ofTreofan GmbH.Healso serves as a member on the Board of Directors of Sweet GlobalNetwork e.V. (international confectionery trade association).
Stefan Pfander holds a degree in Economics from the Universityof Hamburg.
UrsWidmerDirector since 2004, Swiss national
UrsWidmer (1941) is an attorney at law with a practice in Küsnacht,Zurich.
Urs Widmer’s professional career began as an assistant to theExecutive Board of Alusuisse. In 1974, he joined ATAG Ernst &Young,where he held various positions.From 1974 to 1980,he workedin the legal department and was promoted to Department Headin 1980. In 1984, he was appointed a member of the Executive Boardof ATAG debis Informatik AG. In 1986, he was appointed GeneralManager ofATAGWirtschaftsinformationHoldingAG andmemberof the Group Executive Board ofATAGErnst &YoungAG.He waselected amember of the Board of Directors ofATAGErnst &YoungAG in 1988 and the Delegate of the Board of Directors in 1990. Hejoined the Executive Board of Ernst &Young Europe in Brussels in1991 and the Global Executive Board of Ernst &Young Internation-al, NewYork and London, in 1994. In 1995, he assumed the positionof Delegate and Chairman of the Board of Directors of Ernst &Young Holding AG. From 1998 to 2002, Urs Widmer was Chairmanof the Board of Directors of Ernst &YoungAG.
Urs Widmer has served as Chairman of the Board of Directorsof Vontobel Holding AG and Bank Vontobel AG since 2005. Heis also a member of the Board of Directors of Helvetia HoldingAG.He is a trustee of various foundations such as Technopark Founda-tion and Zoo Zurich.
Urs Widmer earned a doctorate from the Faculty of Law atZurich University.
Functioning of the BoardThe Board of Directors constitutes itself at its first meeting sub-sequent to theOrdinaryGeneralMeeting.The Board elects its Chair-man and itsVice Chairman. It meets as often as business requires, butat least four times per fiscal year.The meetings usually take place inZurich. If possible, the Board meets once per year at one of theBarry Callebaut production sites and combines this meeting with avisit of the local operation. During this last fiscal year, the Board ofDirectors met six times for regular Board meetings. Four meetingslasted approximately six hours, two meetings lasted three hours, oneof which took place in the form of a conference call. In the year un-der review the Board held one of the regular meetings in the contextof a two-day visit to the production sites in Pennsauken, New Jersey,and Eddystone, Pennsylvania, both in the U.S.
The Chairman invites the members to the meetings in writing,indicating the agenda and the motion for resolution thereto. Theinvitations are sent out at least ten business days prior to the meet-ing. Each member of the Board can request the Chairman to call ameeting without undue delay. In addition to the materials for meet-ings, the Board members receive monthly financial reports.
At the request of one member of the Board, members of theExecutive Committee shall be invited to attend meetings.The Boardof Directors can determine by majority vote that other third parties,for example external consultants, may attend part or all of the meet-ing. In the past fiscal year, the CEO, the CFO and, depending on theagenda items, other members of the Executive Committee or man-agement were present at all Board and Committee meetings.
Resolutions are adopted by a simple majority of the Boardmem-bers present or represented. Members may only be represented bya fellow Board member. In the event of a tie vote, the proposal isdeemed to be not resolved.Resolutions made at the Board meetingsare documented through written minutes of the meeting.
Directors may request any information necessary to fulfill theirduties. Outside of meetings, any Director may request informationfrom members of the Executive Committee concerning the Group’sbusiness development. Requests for information must be addressedto the Chairman of the Board.
The Board of Directors has formed the following committees:Audit, Finance, Risk, Quality & Compliance CommitteeUrsWidmer (Chairman), Andreas Schmid and Markus Fiechter
The primary task of theAudit, Finance, Risk,Quality & ComplianceCommittee (AFRQCC) is to assist the Board in carrying out its re-sponsibilities and make recommendations for the Board’s policy de-cisions as they relate to the company’s accounting policies, financialreporting, internal control system, legal and regulatory compliancefunctions and quality management. In addition, to ensure financialrisk management, theAFRQCC reviews the basic risk managementprinciples and guidelines, reviews the hedging and financing strate-gies, reviews the bases upon which the Board of Directors determinesrisk tolerance levels and trading limits, and reviews the appropriate-ness of the risk management instruments and techniques employed.
The Audit, Finance, Risk, Quality & Compliance Committeeassists the Board of Directors in fulfilling its oversight responsibilityof the external auditors. The specific steps involved in carrying outthis responsibility include recommending the external auditors, re-viewing their qualifications and independence, approving the auditfees, overseeing the external audit coverage, specifying how theexternal auditors report to the Board and/or the Audit Committee,assessing additional non-audit services, reviewing accounting policiesand policy decisions, and reviewing the annual financial statementsand related notes.
The scope of internal auditing encompasses the examination andevaluation of the adequacy and effectiveness of the organization’ssystem of internal control and the quality of performance in carryingout assigned responsibilities. The internal audit function reports tothe Chairman of the AFRQCC. Significant findings of internalaudits are presented and reviewed in the meetings of the AFRQCCand of the Board of Directors. In the last fiscal year, no internalaudit task was carried out by a third party.
The external auditors attended onemeeting of theAudit,Finance,Risk, Quality & Compliance Committee in fiscal year 2009/10.
The AFRQCC meets as often as business requires, but at leastthree times per fiscal year.The meetings usually take place in Zurich.In the last fiscal year, the committee met five times. The meetingslasted for approximately two hours. One of the meetings took placein the context of the Board’s visit to the production sites in Pennsauken,New Jersey, and Eddystone, Pennsylvania, both in the U.S. Onemeeting took place in the form of a conference call.
Nomination & Compensation CommitteeStefan Pfander (Chairman), Rolando Benedick, James Donald
The responsibilities of the Nomination & Compensation Committee(NCC) are to make recommendations to the Board with respectto the selection, nomination, compensation, evaluation, and, whennecessary, the replacement of key executives. The NCC establishesjointly with the CEO a general succession planning and developmentpolicy.The committee also reviews remuneration paid tomembers ofthe Board of Directors, ensures a transparent Board and ExecutiveCommittee nomination process, and is responsible for monitoringand managing potential conflicts of interest involving executivemanagement and Board members.
The NCC meets as often as business requires, but at least threetimes per fiscal year. The meetings usually take place in Zurich. Inthe last fiscal year, the committee met four times.The meetings lastedfor approximately two hours. One of the meetings took place in thecontext of the Board’s visit to the production sites in Pennsauken,New Jersey, and Eddystone, Pennsylvania, both in the U.S.
128 Corporate Governance
Executive CommitteeAs of November 2009, the former Senior Management Team hasbeen extended by two additional members and renamed to Execu-tive Committee which is headed by the Chief Executive Officer. Forexternal activities of the members of the Executive Committee seetheir curriculum vitae.
Juergen B. SteinemannChief Executive Officer, German national
Juergen B.Steinemann (1958) was appointed Chief ExecutiveOfficerof Barry Callebaut AG inAugust 2009.
Before joining Barry Callebaut, Juergen Steinemann served as amember of the Executive Board of Nutreco and as Chief OperatingOfficer since October 2001. Nutreco, quoted on the Official Marketof Euronext Amsterdam, is an international animal nutrition andfish feed company, headquartered in the Netherlands.
From 1999 to 2001, Juergen Steinemann served as CEO of Uni-lever’s former subsidiary Loders Croklaan,which produced andmar-keted specialty oils and fats for the chocolate, bakery and functionalfoods industry.Between 1990 and 1998, Juergen Steinemann was withthe former Eridania Beghin-SayGroup,where he held various seniorpositions in business-to-business marketing and sales, ultimately inthe “Corporate Plan et Stratégie” unit at the head office in Paris.
Juergen Steinemann graduated from his economics/businessstudies at the European Business School in Wiesbaden, Germany,London, and Paris in 1985.
Victor BalliChief Financial Officer, Swiss national
Victor Balli (1957) was appointed Chief Financial Officer and mem-ber of the Executive Committee of Barry CallebautAG in February2007.
Before joining Barry Callebaut, Victor Balli was with Minibarsince 1996. He began his career at Minibar as CFO and additionallyheld the position of CEOEMEA as of 2005.During this time he alsoserved as executive director and board member of several groupcompanies of Niantic, a family investment holding.From 1991 to 1995,he worked as a Principal with Adinvest AG, a corporate financeadvisory company with offices in Zurich, San Francisco, New York,and London. From 1989 to 1991, Victor Balli served as Directorof Corporate Finance with Marc Rich & Co. Holding in Zug. Hestarted his professional career in 1985 working as a FinancialAnalyst& Business Development Manager with EniChem International SAin Zurich and Milan.
Victor Balli holds a Master’s degree in Economics from the Uni-versity of St. Gallen and a Master’s degree as a Chemical Engineerfrom the Swiss Federal Institute of Technology in Zurich.
Name Function Nationality Member since
Juergen B. Steinemann Chief Executive Officer German 2009Victor Balli Chief Financial Officer Swiss 2007Massimo Garavaglia Western Europe Italian 2004David S. Johnson Americas U.S. 2009Steven Retzlaff Global Sourcing & Cocoa U.S./Swiss 2008Dirk Poelman Chief Operations Officer Belgian 2009Hans P. Vriens Chief Innovation Officer Dutch 2009
Massimo GaravagliaPresidentWestern Europe, Italian national
MassimoGaravaglia (1966) was appointed PresidentWestern Europein June 2009, and is a member of the Executive Committee of BarryCallebaut AG.
From 1990 to 1992, Massimo Garavaglia was sales manager foran Italian food products importer. Joining Callebaut Italia S.p.A. in1992, he served as country manager for Italy. After the merger be-tween Callebaut and Cacao Barry in 1996, he was Barry Callebaut’scountry manager for Italy until 2003. From 2003 until September2004, he was Manager Mediterranean Countries/Middle East/East-ern Europe. From September 2004 until 2006, he was President FoodManufacturers. From September 2006 to April 2009, he served asPresident Americas.
Massimo Garavaglia holds a Master’s degree in Economics andBusiness Administration from Bocconi University, Milan.
David S. JohnsonCEO and President Americas, U.S. national
David S. Johnson (1956) was appointed CEO and President Ameri-cas in May 2009, and is a member of the Executive Committee ofBarry Callebaut AG.
Before joining Barry Callebaut, David Johnson served as CEOand member of the board for Michael Foods, Inc., a food processorand distributor headquartered in Minnetonka, Minn., U.S.
From 1986 to 2006,David Johnson was with Kraft Foods Global,Inc., the second largest food and beverage company in the world.At Kraft Foods, he held several senior positions in different divisions,including marketing, strategy, operations, procurement and generalmanagement. His last position was President Kraft North Americaand Corporate Officer Kraft Foods Global, Inc.He started his careerin 1980 at RJR Nabisco.
David Johnson is a member of the board of directors of ArthurJ.Gallagher & Co, an international insurance brokerage and riskmanagement company with headquarters in Itasca, Ill., U.S.
David Johnson holds both a Bachelor’s and Master’s degree inbusiness from the University ofWisconsin.
Dirk PoelmanChief Operations Officer, Belgian national
Dirk Poelman (1961) was appointed Chief Operations Officer in Sep-tember 2006 and member of the Executive Committee in November2009.Since 1984,he has been working with Callebaut –whichmergedwith Cacao Barry in 1996 – in various positions and countries: firstas Engineering Manager, then as Production Manager, OperationsDirector and Chief Manufacturing Officer.
In 1997, Dirk Poelman became Executive Vice President Opera-tions responsible for the operations of the total Group and a mem-ber of the Senior Management Team. In 2004, he was appointedVice President Operations and Research & Development.
Dirk Poelman holds an industrial engineering degree in electro-mechanics from the Catholic Industrial High School inAalst,Belgium.
Steven RetzlaffPresident Global Sourcing & Cocoa, U.S. and Swiss national
Steven Retzlaff (1963) was appointed President Global Sourcing &Cocoa and member of the Executive Committee of Barry CallebautAG in January 2008.
Steven Retzlaff started his career in 1987 at KPMG PeatMarwick, San Francisco, as an auditor. From 1990 to 1993, he workedas a Supervising Audit Senior and Audit Manager for KPMG Fides,Zurich. He then joined JMP Newcor AG, Zug, as Director of Euro-pean Finance and Operations, where he worked for three years.
Steven Retzlaff joined Barry Callebaut as CFO of BarryCallebaut SourcingAG in 1996.From 1999 to 2001,he served as CFOSwiss Operations (BC Sourcing AG and BC SwitzerlandAG). From2001 to 2003, he was CFO of the business unit Cocoa, Sourcing &Risk Management and from 2003 to 2004 he worked as the CocoaDivision Head. In 2004, he was appointed President Sourcing &Cocoa andmember of the SeniorManagementTeam in Zurich.FromSeptember 2006 until December 2007, he focused on developing theGroup’s global compound business.
StevenRetzlaff is a Certified PublicAccountant (CPA) and holdsa Bachelor of Arts in Economics from Whitman College. He alsostudied at the Institute of European Studies in Madrid and at Inseadin Fontainebleau.
130 Corporate Governance
Corporate Governance 131
Hans P. VriensChief Innovation Officer, Dutch national
Hans P. Vriens (1965) was appointed to the position of Chief Inno-vation Officer and member of the Management Team in December2005. Since November 2009, Hans Vriens has been a member of theExecutive Committee.
From 2001 to 2005, Hans Vriens was active as the owner ofVF&CO.B.V. inAmsterdam,Netherlands, a holding company whichinvests in and develops new consumer brands for itself and for third-party customers.Activities include consulting for large multinationalcompanies in functional foods, a partnership selling an energy drinkin a new packaging concept, as well as the production and distribu-tion of a functional dairy product.
Prior to this, Hans Vriens served as Executive Board Memberresponsible for Sales, Marketing and Interactive at EM-TV & Mer-chandising AG in Munich, Germany, and was active in various non-executive board positions in related media companies.
From 1994 to 1999, he held various functions with Red BullGmbH, among which Managing Director for Red Bull NorthAmer-ica in Los Angeles, U.S. From 1989 to 1994, Hans Vriens worked asBrand Manager for Procter & Gamble in Austria and in Germany.He started his career in brandmanagement andmarketing withMars/Effems in Spain and in the Netherlands.
Hans Vriens holds a BBA in Marketing from the NijenrodeBusinessUniversity inBreukelen,Netherlands,anMBAinMarketing/International Business from the University of Oregon, U.S., andreceived Post Graduate Education at Stanford University, U.S.
Compensation, shareholdings and loansThe Board of Directors has the final responsibility for the remunera-tion of the Directors and the Executive Committee.The Nomination&Compensation Committee assists the Board in fulfilling its respon-sibility by evaluating the remuneration strategy and proposing indi-vidual compensation packages for the Executive Committee mem-bers and other key members of the management.
The Nomination & Compensation Committee ensures thatBarry Callebaut offers an overall remuneration package which isaligned with corporate and individual performance andmarket prac-tice, in order to attract and retain Directors and Executives with thenecessary skills. The current remuneration scheme is not linked toany external benchmarks.For the Board it is based on fixed directors’fees and the granting of Barry Callebaut AG shares.
The topmanagement remuneration framework of Barry Callebautconsists of four elements:fixed base salary, short-term cash-based in-centives related to EBIT/EVA/Working Capital targets in the fiscalyear under review (target incentive 50% to 100% of base salary),long-term incentives in the form of share allocations (valued at 70%to 125% of base salary) and benefits (valued at 10% to 20% of basesalary).The short-term bonus criteria for the members of the Execu-tive Committee are for the CEO andCFO:GroupEVA,GroupEBIT,Working Capital and Earnings per Share (each weighted with 25%),and for the other members of the Executive Committee: RegionalEBIT or Group EBIT respectively for the corporate functions(weighted with 50%), as well as Working Capital (weighted with25%) and Strategic Targets relating to the Region/Corporate Func-tion (weighted with 25%). The granting of shares is based on adeferred share plan scheme. Participants are granted a number ofshares, of which 80% are granted without being linked to perfor-mance criteria. The shares vest as follows in three tranches: 30%after one year, 30% after two years and 40% after three years,of which half of the third tranche (20%) are subject to achieving theperformance criteria defined by the Nomination & CompensationCommittee. The performance criteria for the grants made in thefiscal year under review are based on the earnings per share of BarryCallebaut shares.
On a yearly basis, usually at the November Board meeting, theBoard, upon recommendation of the NCC, decides on the perfor-mance-related cash bonuses relating to the previous fiscal year andthe compensation system for the coming calendar year.
For details regarding the compensation, shareholdings and loansof the members of the Board of Directors and the Executive Com-mittee during the last fiscal year see note 6 in the Financial State-ments of Barry Callebaut AG.
Barry Callebaut and Jacobs HoldingAG, Zurich, have agreed toexecute administrative service agreements, under which JacobsHold-ing AG offers to Barry Callebaut certain management and consul-tancy services. In the fiscal year 2009/10, the total compensation paidby Barry Callebaut under these agreements amounted to CHF 1.7million.The contract is yearly renewable.
Shareholders’ participationEach share of Barry Callebaut AG carries one vote at the GeneralMeeting.Voting rights may be exercised only after a shareholder hasbeen registered in the Barry Callebaut AG share register as a share-holder with voting rights.
No shareholder holding more than 5% of the share capital maybe registered as a shareholder with voting rights with respect to theshares such shareholder holds in excess thereof. For purposes of the5% rule, groups of companies and groups of shareholders acting inconcert or otherwise related are considered to be one shareholder.
Shareholders may register their shares in the name of a nomineeapproved by Barry CallebautAG andmay exercise their voting rightsby giving instructions to the nominee to vote on their behalf.
However, a nominee holding more than 3% of the share capitalwill be registered as nominee for shareholders with voting rights onlyif it discloses the identity of each beneficial owner of shares claiming0.5% or more of the share capital. No nominee holding more than8% of the share capital may be registered as a shareholder withrespect to the excess shares. The Board of Directors may, however,on a case-by-case basis, permit some or all of the excess shares to beregistered with voting rights. In fiscal year 2009/10, no such exceptionwas granted by the Board of Directors.
A resolution passed at the General Meeting with a majority of atleast two-thirds of the shares represented at such meeting is requiredto lift the restrictions on the transferability of registered shares.
Shareholders may be represented at the General Meeting byproxy.Proxy holders must themselves be shareholders, or be appoint-ed by Barry Callebaut, independent representatives nominated byBarry Callebaut AG, or a depository institution.
The Articles of Incorporation follow the majority rules and theprovisions on convocation prescribed by the Swiss law concerninggeneral meetings of shareholders.
Shareholders with voting rights holding shares representing intotal at least 0.25% of the share capital or the voting rights have theright to request in writing – giving at least 60 days’ notice – thata specific proposal be discussed and voted upon at the next GeneralMeeting.
Shareholders registered in the share register with voting rightsat the date specified in the invitation will receive an invitation to theAnnual General Meeting.
Change of control and defense measuresAn investor who acquires 331⁄3% of all voting rights has to submita take-over offer for all shares outstanding, according to the SwissStock Exchange Law. Barry Callebaut has not elected to change oropt out of this rule.
The employment contracts of two members of the ExecutiveCommittee have a fixed minimum duration of three years, ending2012 and 2013 respectively,while the employment contracts with theremainingmembers of the Executive Committee are open-ended andcontain notice periods of 6 to 12 months, during which they are en-titled to full compensation.
132 Corporate Governance
Konzernrechnung 133
External auditorsAt the Annual General Meeting of Barry Callebaut AG on Decem-ber 8, 2005, the shareholders voted to appoint KPMG AG, Zurich,as statutory auditors. The statutory auditors are appointed annuallyby the General Meeting for a one-year term of office. The currentauditor in charge has exercised this function since fiscal year 2005/06.
For the fiscal year 2009/10, the remuneration for the audit of theaccounting records and the financial statements of Barry CallebautAG, and the audit of the consolidated financial statements, amountedto CHF 2.6 million.This remuneration is evaluated by theAFRQCCin view of the scope and the complexity of the Group. The perfor-mance of the auditors is monitored by the AFRQCC, to which theypresent a detailed report on the result of the audit of the Group.Prior to the presentation to the AFRQCC, the lead auditor reviewsthe audit findings with the Chairman of the AFRQCC without thepresence of any members of the management.
KPMG received a total amount of CHF 0.2 million for addition-al services, i.e. for transaction and other advisory (incl. due diligence).Adequate measures for the avoidance of potential conflicts of inter-ests between the different services provided byKPMGwere observed.
Information policyBarry Callebaut is committed to continuous and open communi-cation with its shareholders, potential investors and other stakehold-ers based on the principles of transparency and equal treatment, i.e.simultaneous provision of price-sensitive information and no selec-tive disclosure.
The Group provides detailed information on its business activi-ties and financial performance in its annual and half-year reports andpress releases, at the conferences for media and financial analysts aswell as at the Annual General Meeting. Further, representatives ofthe Group regularly meet (potential) investors in personal meetingsas well as present Barry Callebaut at industry events and investorconferences.
Presentations are also made available on the Group’s website,which is updated continuously. The financial calendar for the fiscalyear 2010/11 and contacts are given on page 136.
AACTICOA™A process developed by BarryCallebaut which conserves to avery high degree the polyphenolsnaturally present in the cocoabean, that may otherwizedestroyed during the chocolateproduction process.
BBiolandsBiolands in Tanzania is the largestAfrican exporter of certified organ-ic cocoa. Barry Callebaut acquireda 49% stake in Biolands in 2008.Biolands is working directly withsmallholders, in order to guaran-tee them fair prices and to helpthem improve the quality andvalue of their production. Theyhave another framer project inSierra Leone.
ButterRefers to cocoa butter, the fatof the cocoa bean.
CCocoa butter ratioPrice of 1 metric tonne of cocoabutter relative to the price of1 metric tonne of cocoa beans.
Cocoa powder ratioPrice of 1 metric tonne of cocoapowder relative to the priceof 1 metric tonne of cocoa beans.
Combined cocoa ratioCombined sales prices for cocoabutter and cocoa powder relativeto the cocoa bean price.
CompoundConsists of a blend of sugar, vege-table oil, cocoa liquor, powderand/or butter and other products.Vegetable oil is substituted forcocoa butter to reduce the prod-uct cost and to develop specialmelting profiles.
ConcheA large tank with a powerfulstirring device inside that kneadsthe chocolate mixture slowlyover a long time. Contact with air,heat and friction results in several
different physical and chemicalprocesses, necessary for thefinal taste and mouthfeel of thechocolate.
Controlled FermentationBarry Callebaut developed a wayto “control” and optimize cocoafermentation. With the so-calledControlled Fermentation method,defined micro-organisms providea consistent, predictable and100% “superior grade” cocoa beanquality. This in turn leads to im-proved flavor characteristics, zero-default cocoa beans, enhancedlevels of functional components(e.g. flavanols), and improved pro-cessability.
CriolloCriollo is known as the princeamong cocoa trees. This varietyis fragile and produces smallharvests. It grows primarily inSouth and Central America,and accounts for only 10% of theworld crop. The cocoa has a palecolor and a unique aroma. It isused in the production of high-quality chocolate and for blending.
DDark chocolateDark chocolate is chocolate thatcontains more than 43% cocoasolids coming from cocoa liquor,powder and/or butter. This is thechocolate most often used forpremium chocolate confections.Besides cocoa ingredients itcontains sugar, vanilla, and oftenlecithin.
DryingAfter fermentation, the beansstill contain 60%moisture, whichmust be reduced to 8% or lessin order to ensure optimum con-servation during storage andtransportation. Drying can eitherbe done by spreading the beansout in the sun or by placing themon a heated surface or by hotair. Thorough drying avoids theformation of molds.
DutchingA treatment used during themaking of cocoa powder in which
cocoa solids are treated withan alkaline solution to neutralizeacidity. This process darkensthe cocoa and develops a milderchocolate flavor.
EEBITOperating profit (Earnings BeforeInterest and Taxes).
EBITDAOperating profit beforedepreciation and amortization(Earnings Before Interest, Taxes,Depreciation and Amortization).
FFairtradeThe Fairtrade Labelling Organiza-tions International (FLO) arrangesdirect contracts with thousandsof small manufacturers, traders,importers and exporters of food-stuffs, and ensures that they arepaid a higher price for their prod-ucts. Barry Callebaut is certifiedby the FLO-CERT to produce arange of Fairtrade cocoa and choc-olate products. These productsare manufactured with raw mate-rials purchased from Fairtrademanufacturers.
FermentationFermentation is an essential anddelicate stage in cocoa beanprocessing. Beans and pulp areheaped in piles, covered withbanana leaves or put in boxes andleft to ferment for several days.During fermentation the beanslose their natural bitterness andastringency.
FlavanolA specific type of polyphenol,known for its antioxidant activity.
ForasteroForastero are the most commonlygrown and used cocoa beans.Compared to Criollo, Forastero isa stronger tree that is easierto cultivate and produces largeryields. They make up about 90%of the world’s production and aregrown mainly inWest Africa.The cocoa has a pungent aroma.
Glossary
134 Glossary
Konzernrechnung 135Glossary 135
IIndustry ProtocolAlso known as Harkin-EngelProtocol. The Protocol was signedin 2001 by cocoa and chocolatemanufactuers, industry and tradeassociations, government organi-zations and NGOs in response toreports of children working underabusive labor conditions on cocoafarms inWest Africa. The signerscondemned abusive labor practic-es, in particular the worst forms ofchild labor as defined by the Inter-national Labor Organization (ILO),and committed to work together toaddress the issue. Barry Callebautis a signer of the Protocol.
LLiquorAlso known as cocoa liquor orcocoa mass. The thick liquid pastethat is produced in the grindingprocess.
MMilk chocolateChocolate with at least 25% cocoasolids coming from cocoa liquor,powder and/or butter to whichpowdered milk, sugar, vanilla, andlecithin has been added. Goodmilk chocolate contains 30%chocolate liquor. Premiummilkchocolate contains even more.
MoldingThe process of creating figuresand shapes out of chocolate.Chocolate is melted to 45°C, thencooled below its crystallizationpoint, then heated again to 30°C.Following this tempering process,the chocolate is poured ontothe inner surface of the molds,also heated to 30°C. After cooling,the final product is unmoldedto reveal a glossy chocolate figure.
NNibThe center of the cocoa bean.
PPolyphenolsCocoa beans contain polyphenolsof unusually high quality and
effectiveness. Polyphenols areantioxidants. By inhibiting oxida-tion, they protect body cells fromdamage caused by the oxidativeeffects of free radicals, which con-tribute to the aging process and tocertain heart and brain diseases.
PowderRefers to cocoa powder and isthe product that remains when abig part of the cacao butter isremoved from the cocoa liquor.
QQuality Partner programBarry Callebaut’s program withcocoa cooperatives in Côte d’Ivoire.The goal is to provide farmerswith access to better training inagricultural techniques andhow to manage their businessand personal finances, as well asaccess to healthcare for them-selves and their families, and sen-sitization about child labor issuesand the importance of schoolingfor their children. The trainingenables farmers to improve thequality of their farms and busi-ness practices and to deliver moreand better-quality cocoa beansfor which they will earn more.
RRainforest AllianceThe Rainforest Alliance works toconserve biodiversity and ensuresustainable livelihoods bytransforming land-use practices,business practices and consumerbehavior.
RoastingRoasting is a heating processaimed at developing the chocolatearoma. Roasting certain foods notonly makes themmore digestible,but also more aromatic. Cocoabeans are roasted to a greater orlesser extent depending on whatthey are being used for. Cocoapowder needs more intense roast-ing, whereas chocolate requiresfiner roasting.
SSemi-finished productsExamples include cocoa liquor,
cocoa butter and cocoa powder.Also called cocoa products.
SteviaStevia is a natural sugar substi-tute that is obtained from theStevia plant (Stevia RebaudianaBertoni) that does not have a laxa-tive effect. When refined, Steviaextract has between 100 and 400times the sweetness of ordinarysugar while having zero calories.
SugarSugar is the largest commodityon the world market, followed bycoffee and cocoa. It is used asone of the main ingredients forchocolate (up to 55%).
TTrinitarioTrinitario beans are a cross ofCriollo and Forastero cocoa. It hascharacteristics of both: the treesare easy to cultivate and the cocoabeans have a strong, but relativelyrefined aroma.
UUTZUTZ CERTIFIED Good Inside isdedicated to creating an open andtransparent marketplace foragricultural products. Founded in2002, UTZ CERTIFIED has been apioneer in the field of certificationand traceability of coffee supplychains. Based on this success, it isdeveloping sustainability modelsfor other sectors, such as cocoa,tea and palm oil.
VViscosityThe measure of the flow charac-teristics of a melted chocolate.
Vegetable fatsSometimes used as a less expen-sive alternative to cocoa butter inchocolate products.
WWhite chocolateWhite chocolate is made fromcocoa butter (at least 20%), pow-dered milk, sugar, and vanilla. Itcontains no cocoa liquor or powder.
136 Konzernrechnung
Forward-looking statements
Certain statements in this Annual Report 2009/10 regarding the business of Barry Callebaut are of aforward-looking nature and are therefore based on management’s current assumptions about futuredevelopments. Such forward-looking statements are intended to be identified by words such as“believe,”“estimate,” “intend,” “may,” “will,” “expect,” and “project” and similar expressions as they relate to thecompany.Forward-looking statements involve certain risks and uncertainties because they relate to futureevents. Actual results may vary materially from those targeted, expected or projected due to severalfactors.The factors that may affect Barry Callebaut’s future financial results are discussed in thisAnnualReport. Such factors are, among others, general economic conditions, foreign exchange fluctuations,competitive product and pricing pressures as well as changes in tax regimes and regulatory developments.The reader is cautioned to not unduly rely on these forward-looking statements that are accurate onlyas of November 4, 2010. Barry Callebaut does not undertake to publish any update or revision of anyforward-looking statements.
Financial calendar
Date
Annual General Meeting 2009/10, Zurich December 7, 20103-month key sales figures 2010/11 January 12, 2011Half-year results 2010/11, Zurich April 1, 20119-month key sales figures 2010/11 June 30, 2011Year-end results 2010/11, Zurich November 10, 2011Annual General Meeting 2010/11, Zurich December 8, 2011
Contacts
Barry Callebaut head officeBarry Callebaut AGWest-ParkPfingstweidstrasse 608005 Zurich, SwitzerlandPhone +41 43 204 04 04Fax +41 43 204 04 00www.barry-callebaut.com


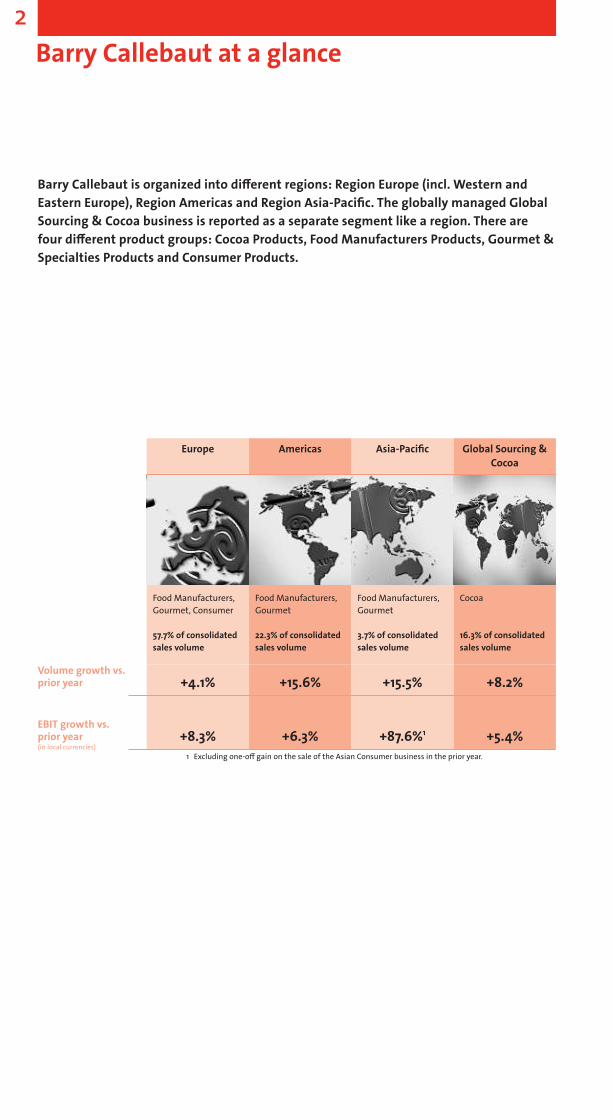
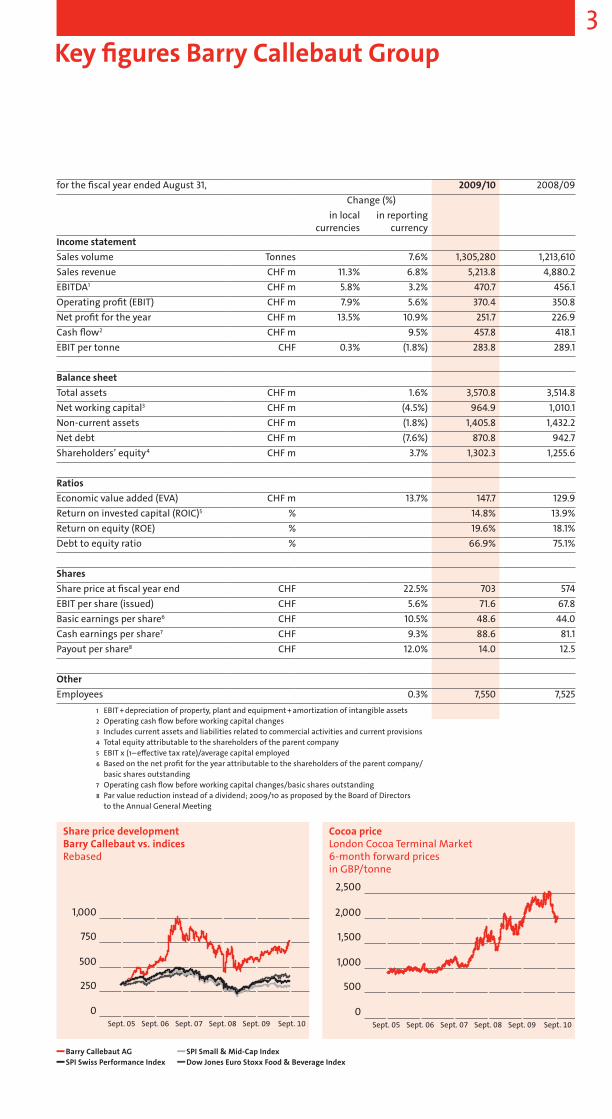

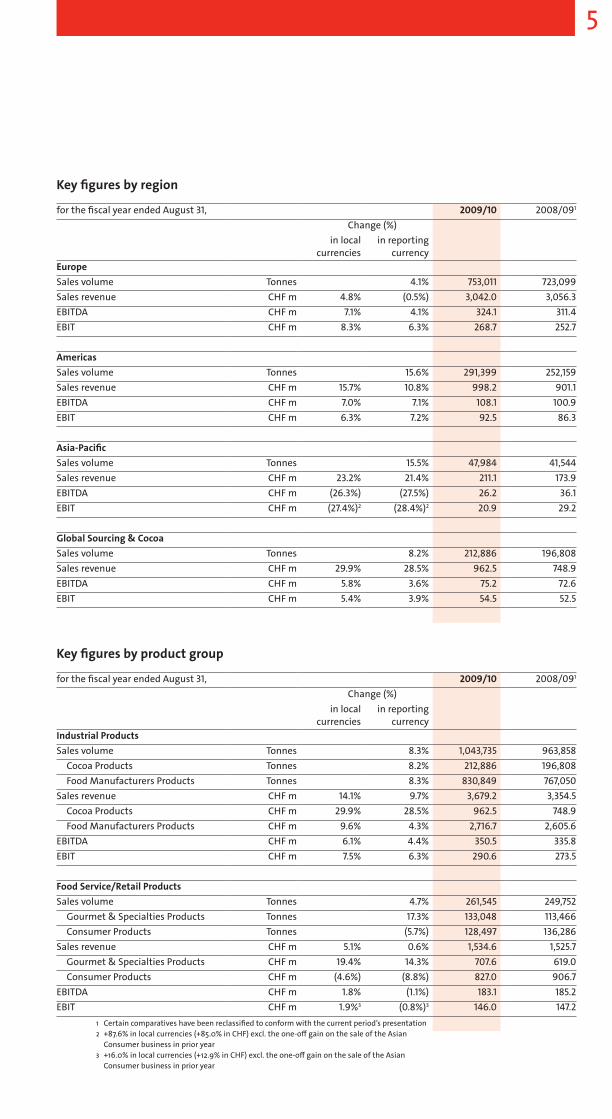

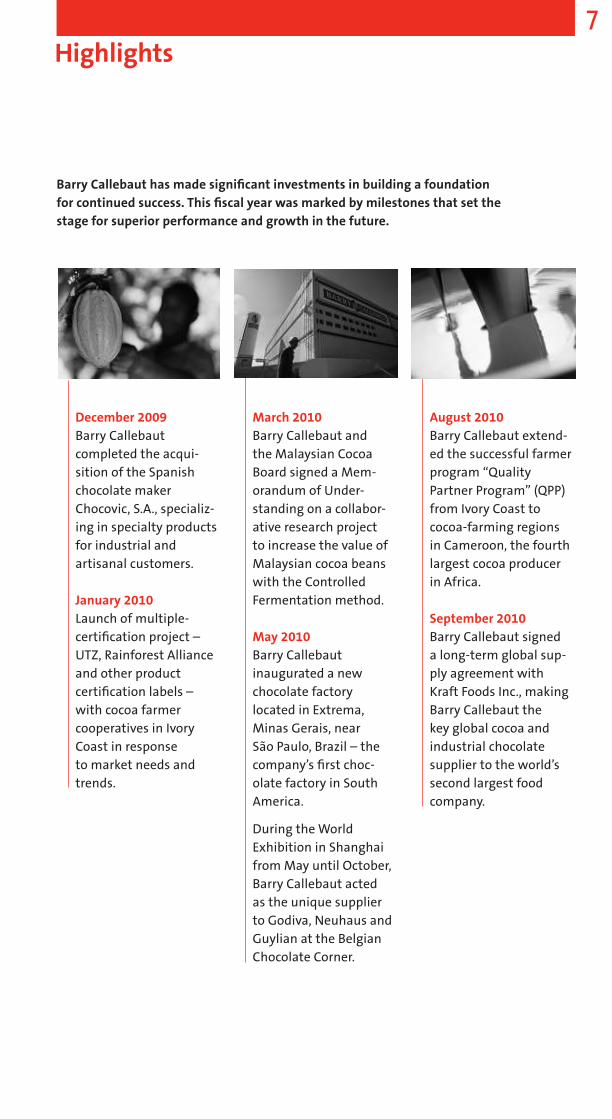


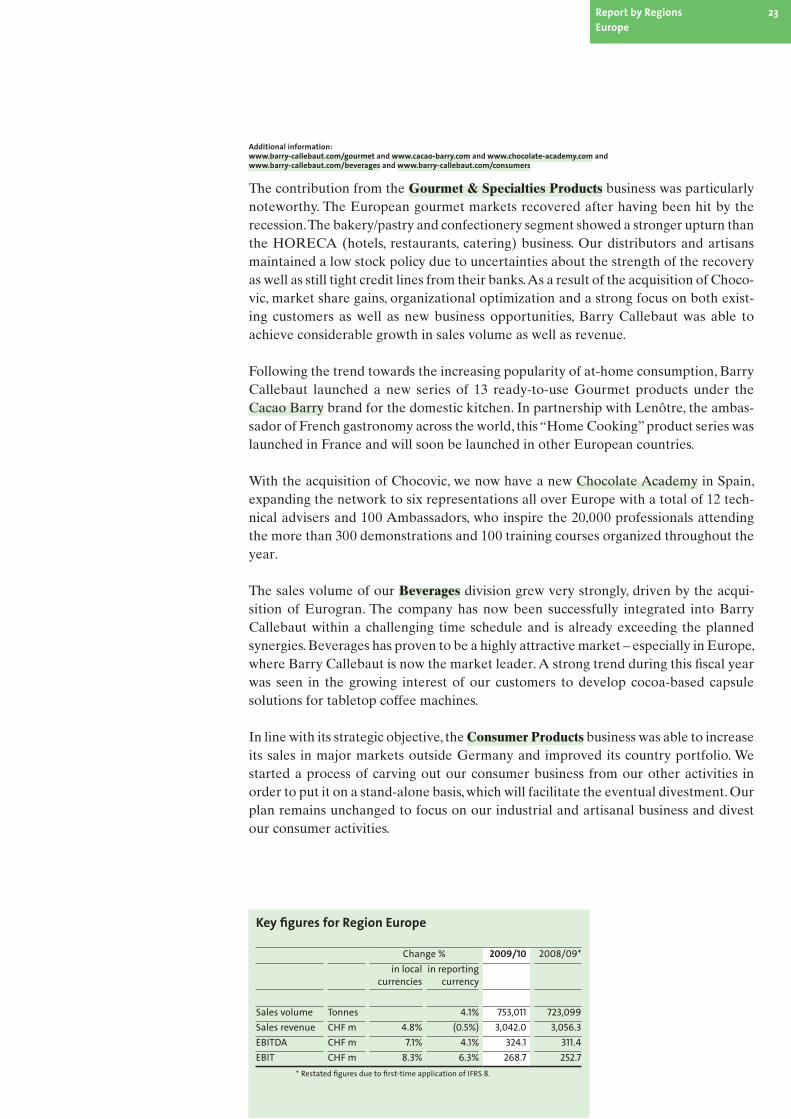


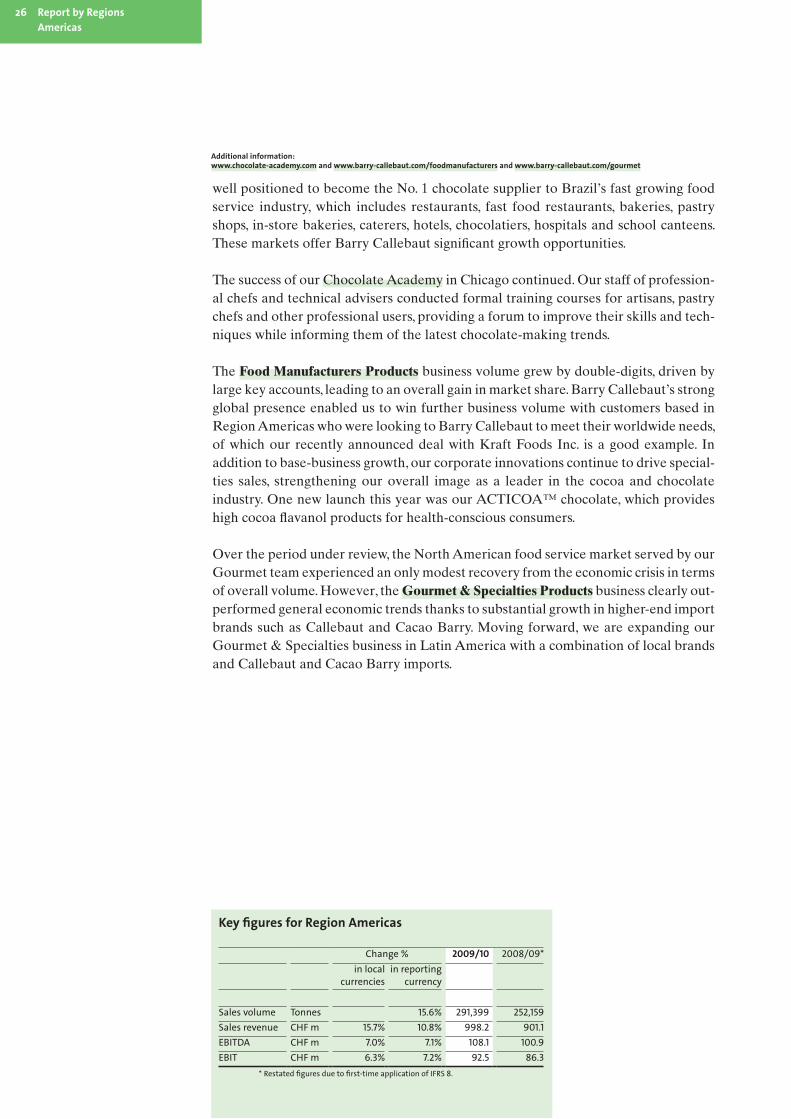


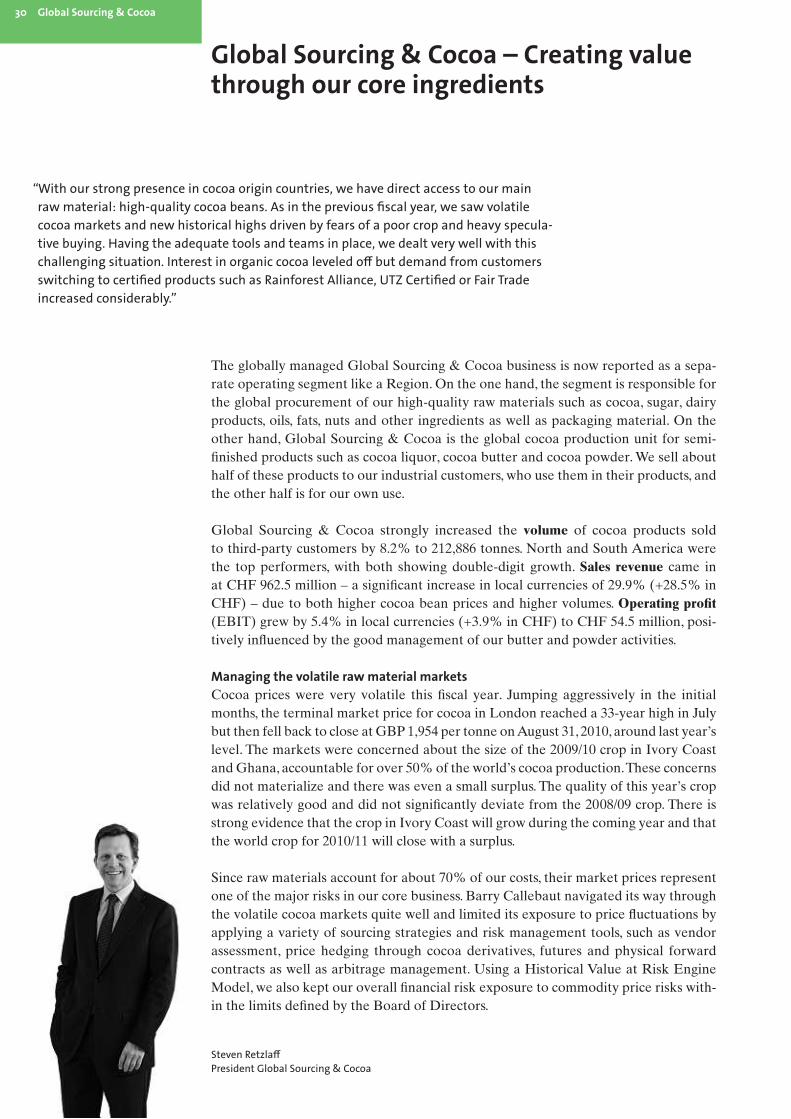
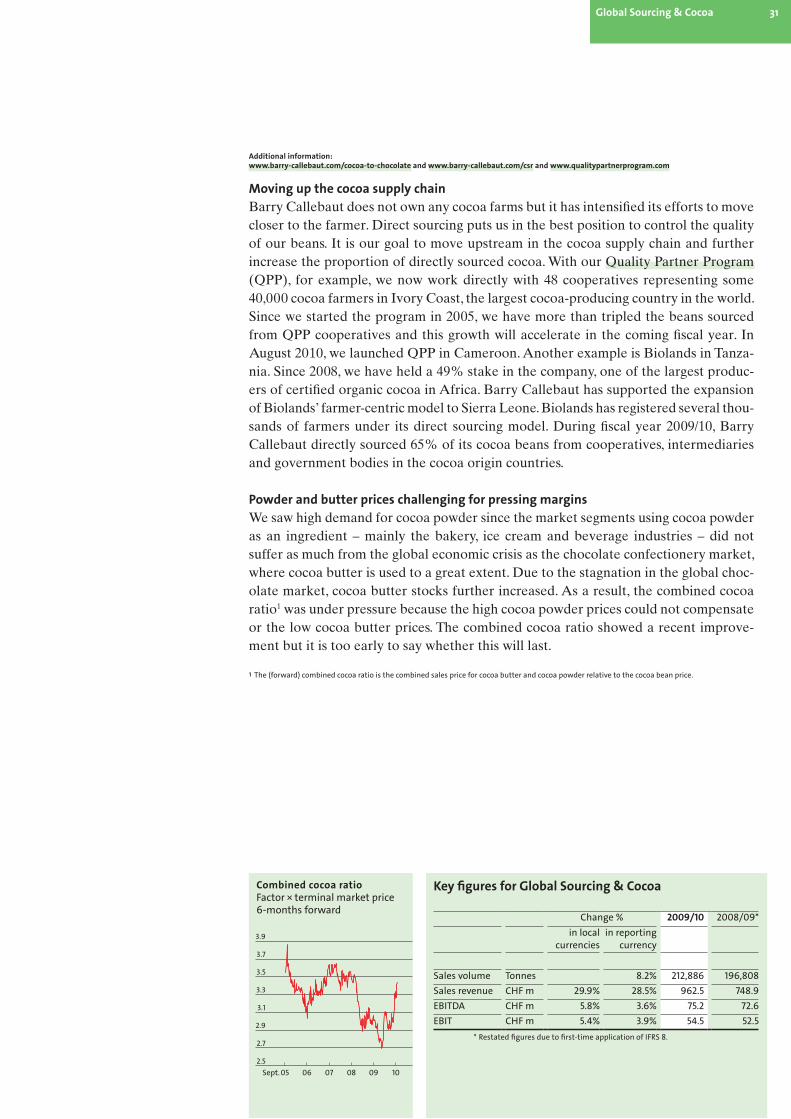
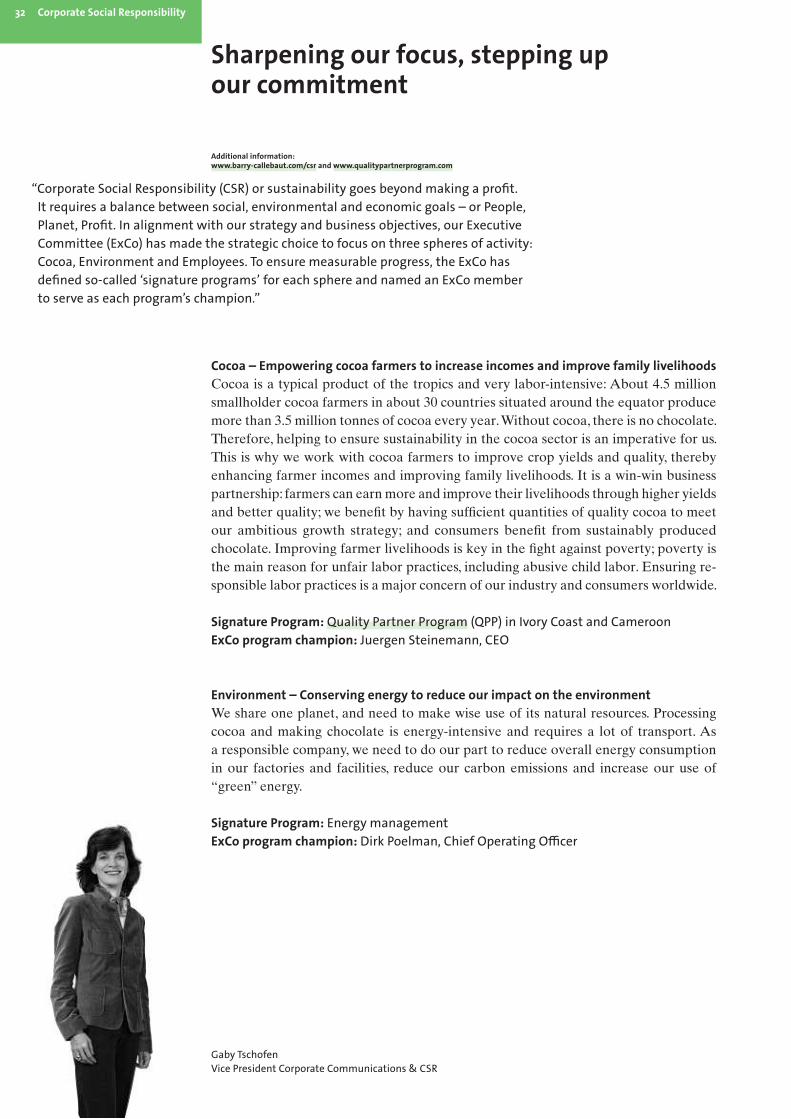
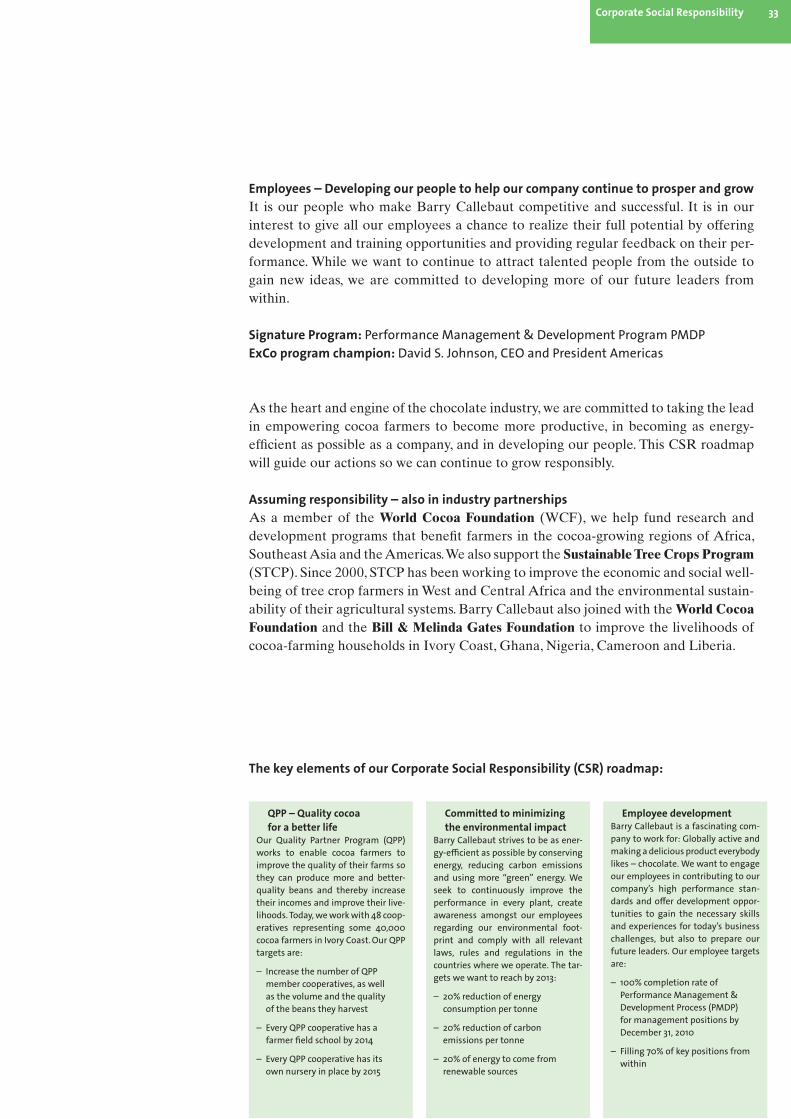


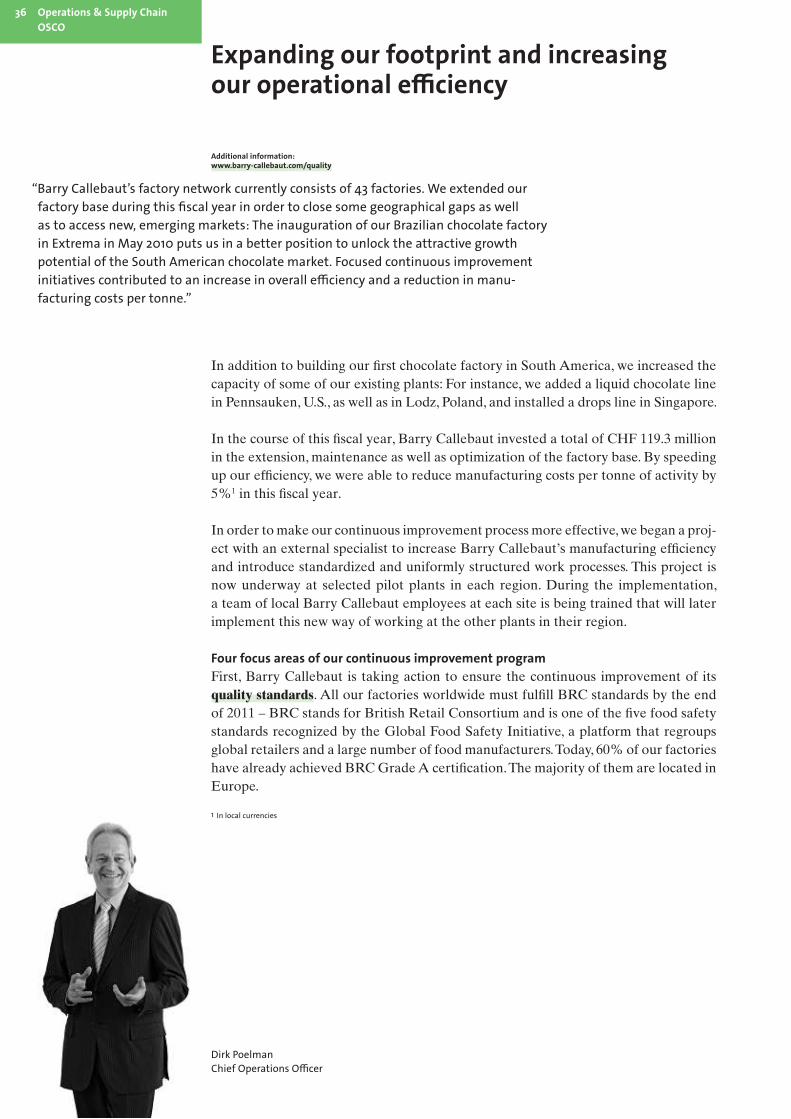

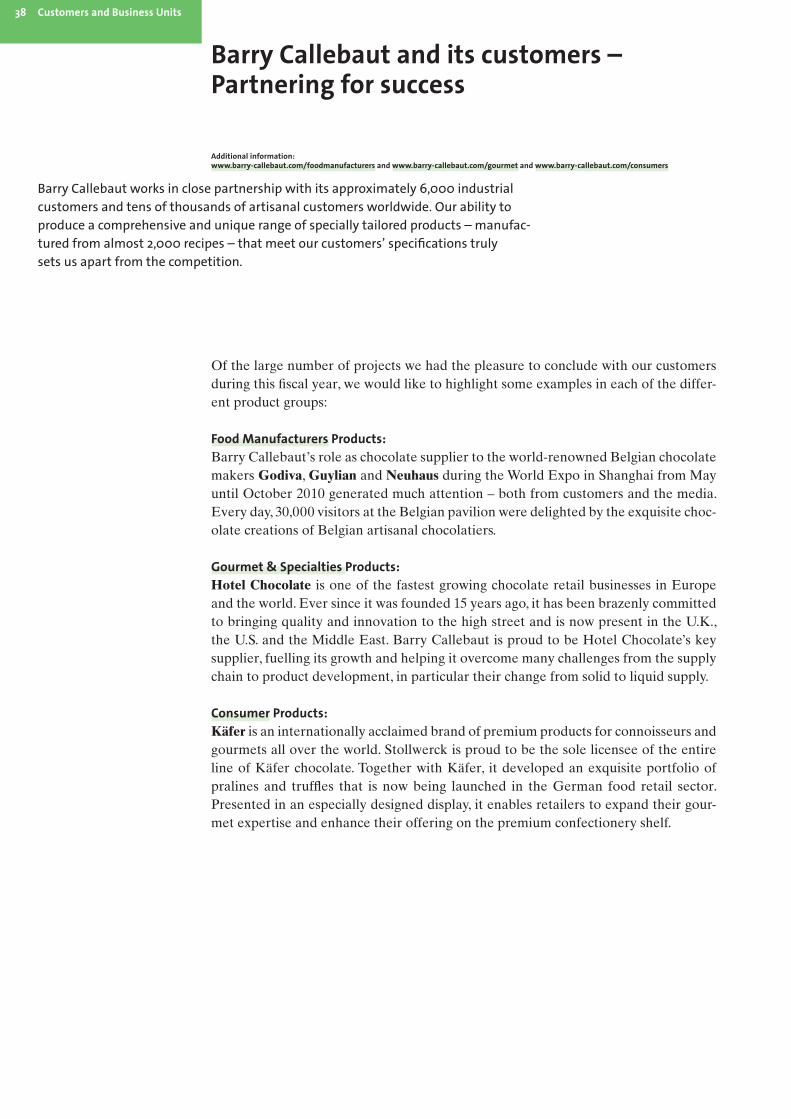


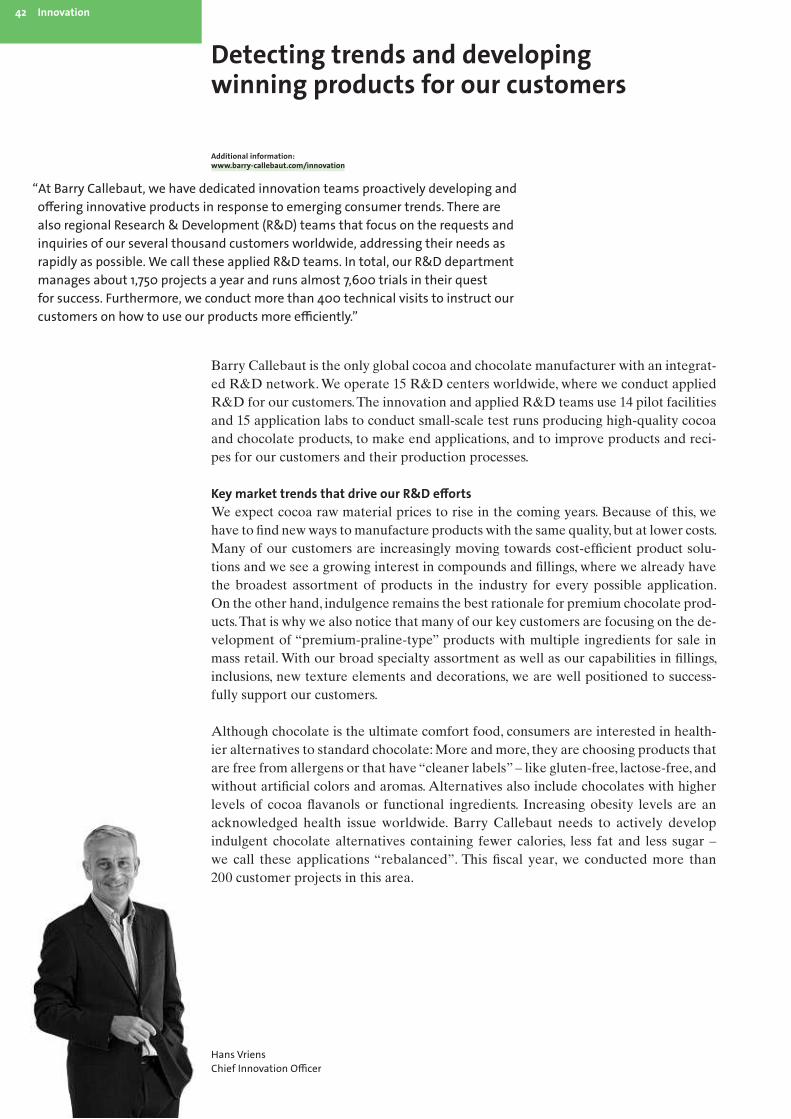


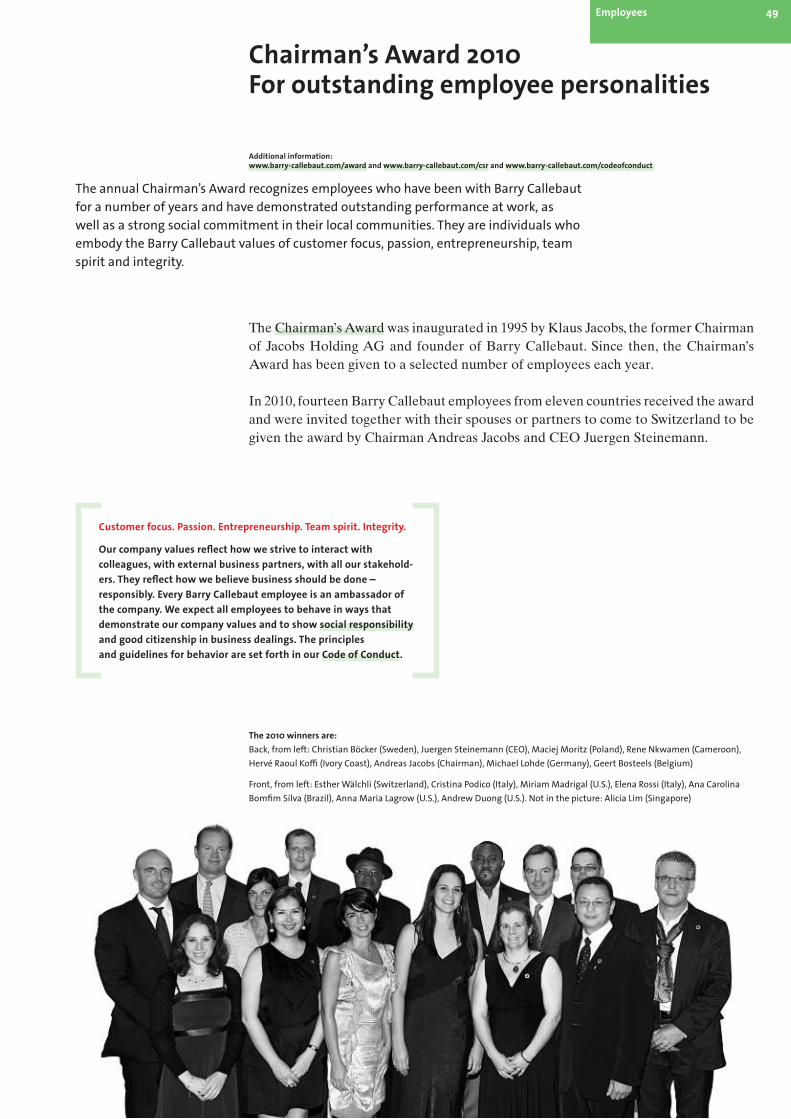


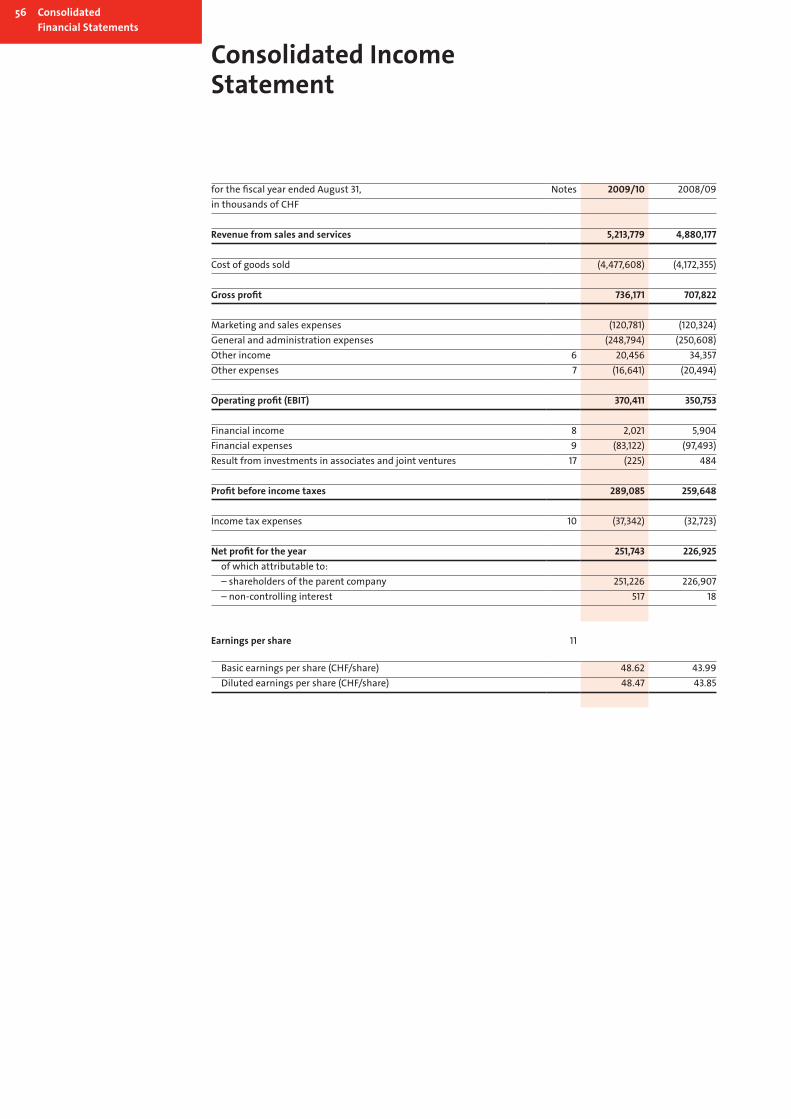
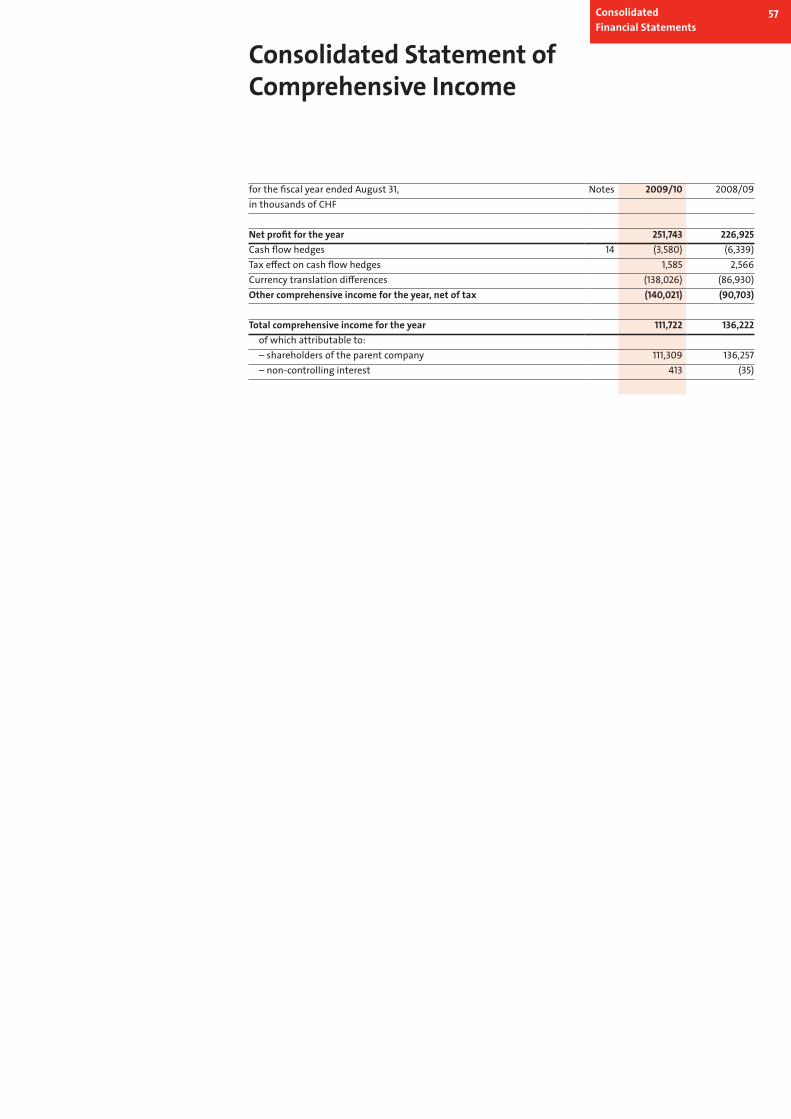
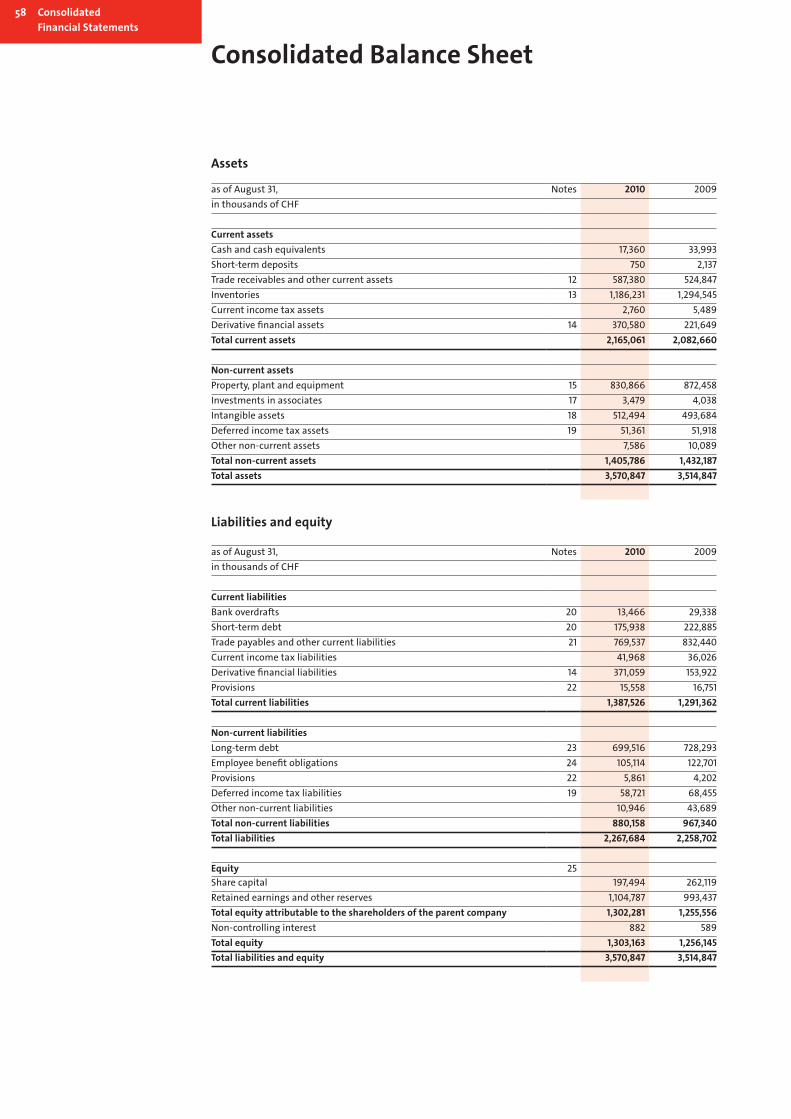

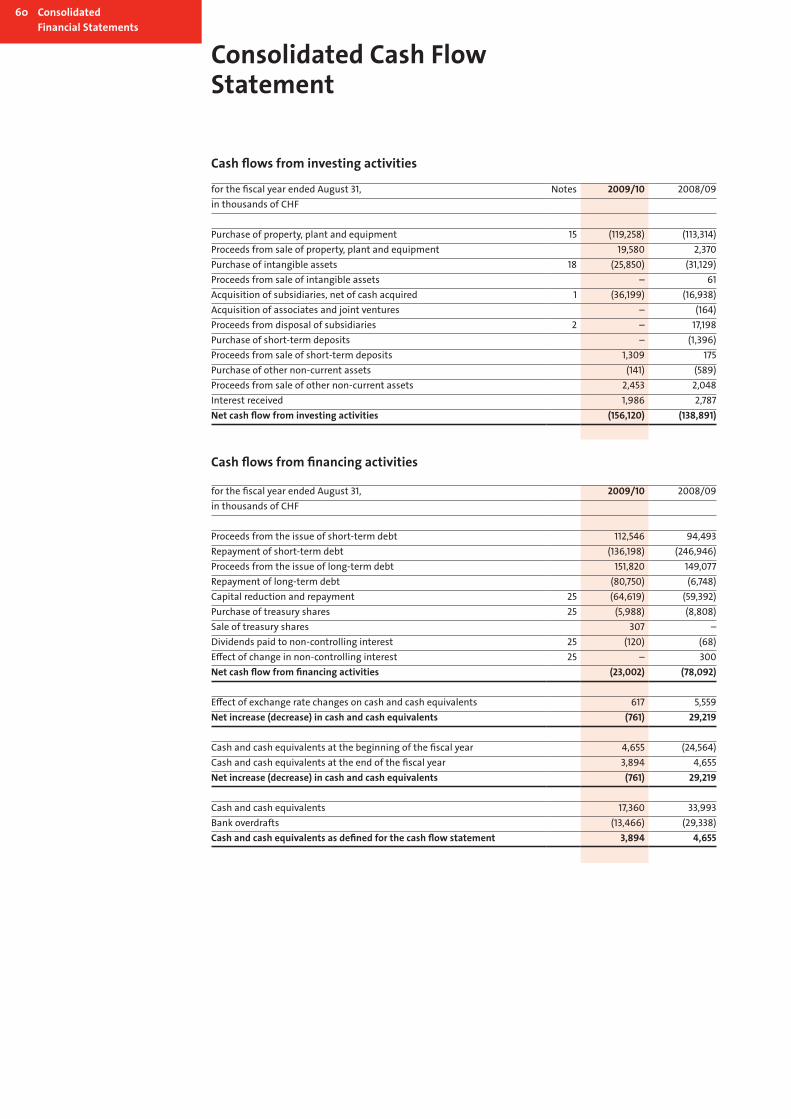
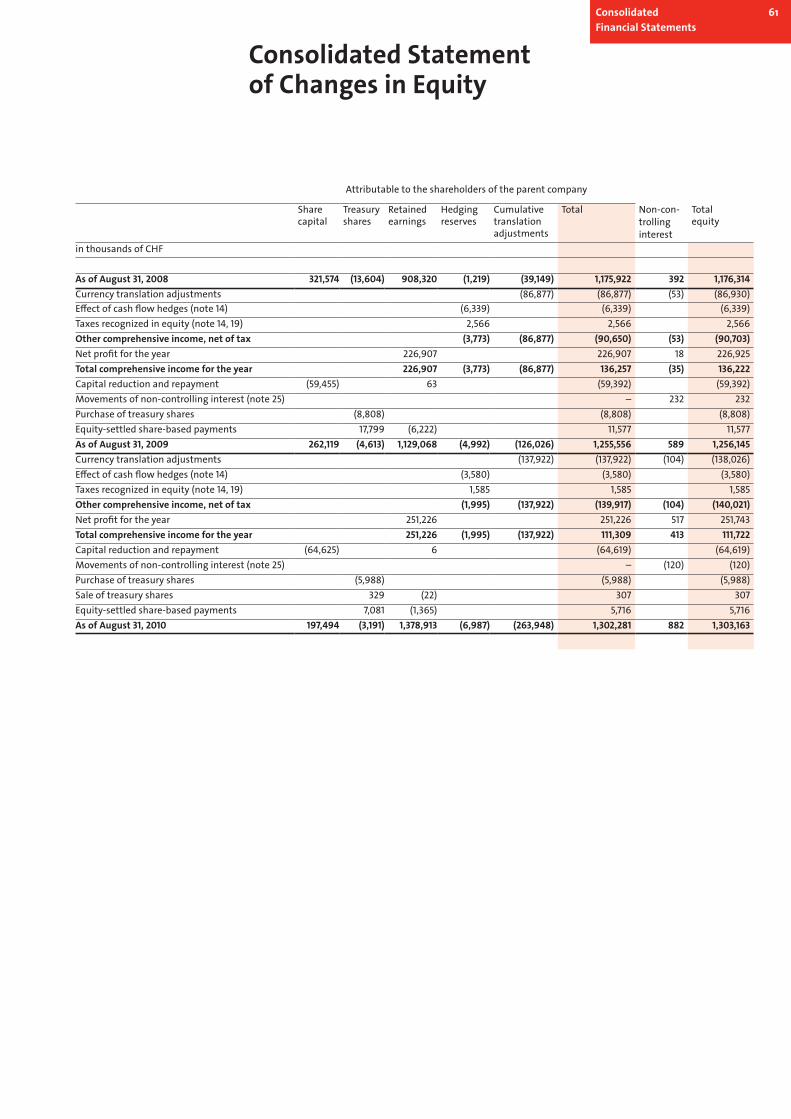


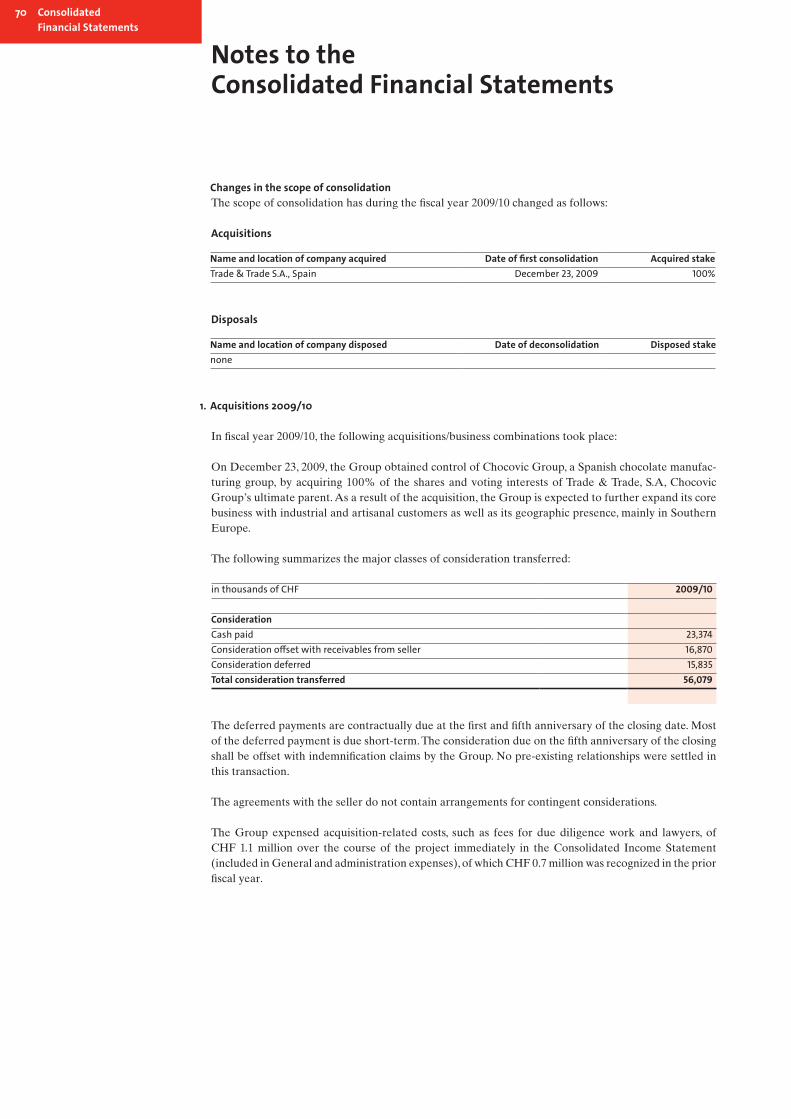
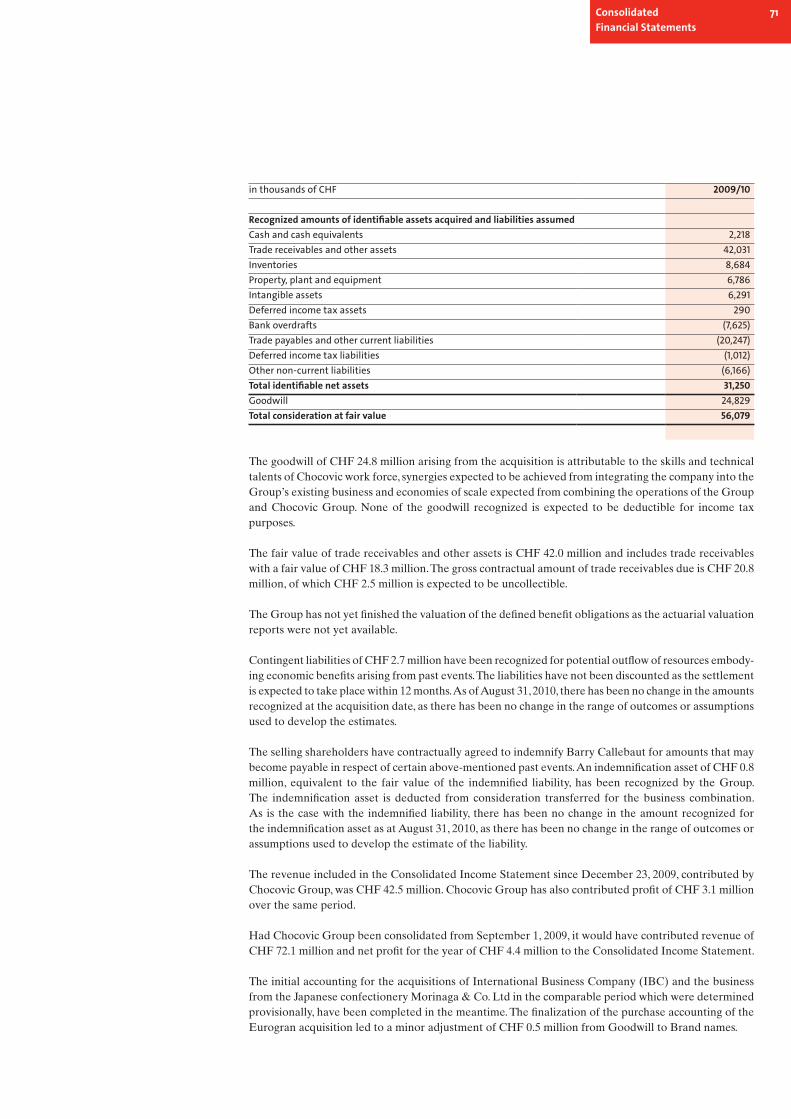

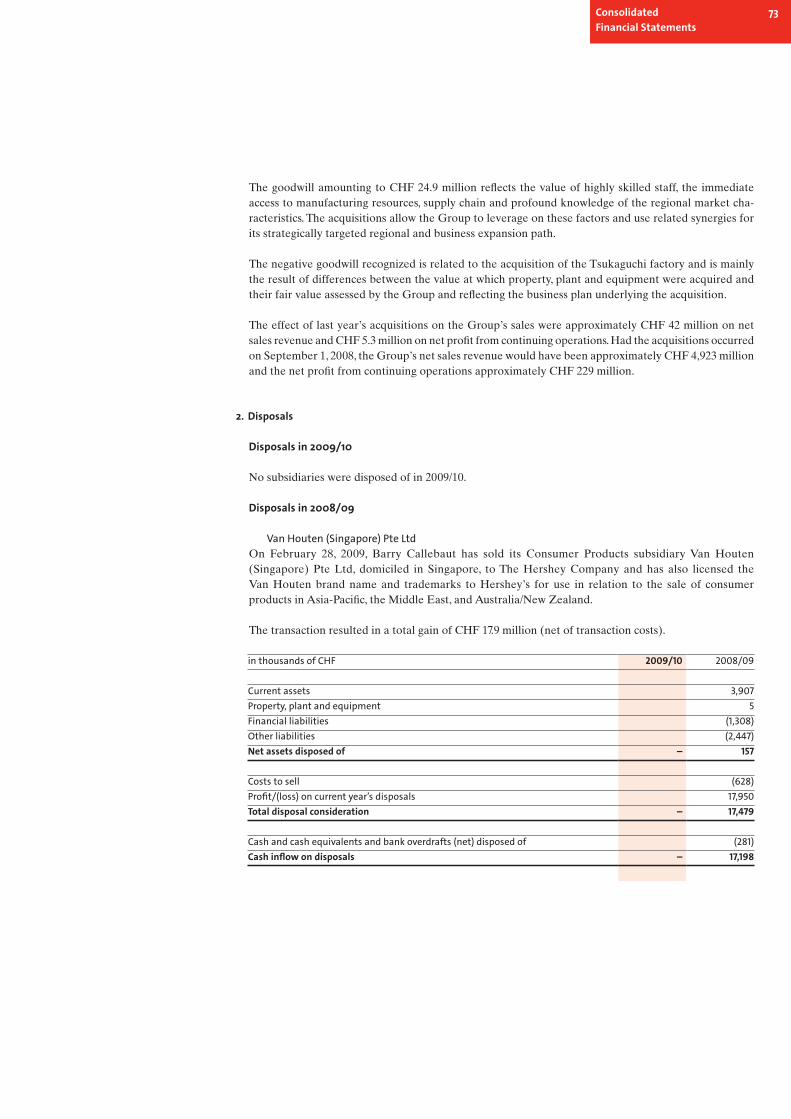
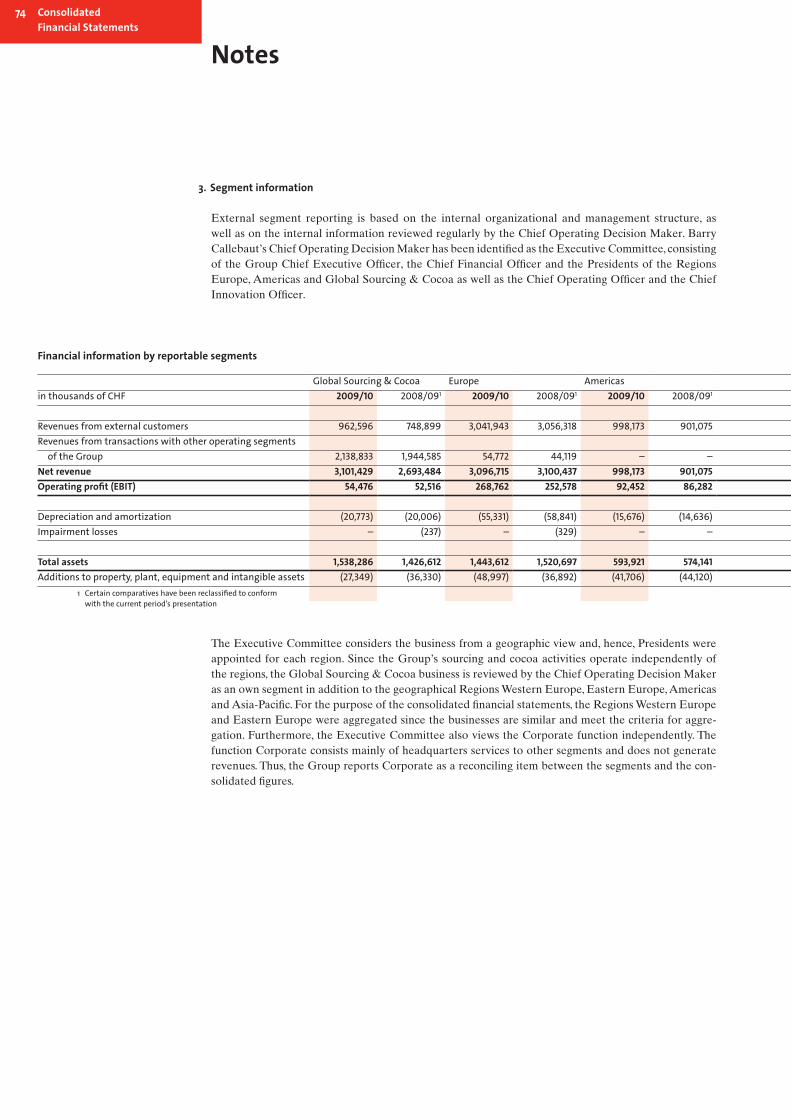
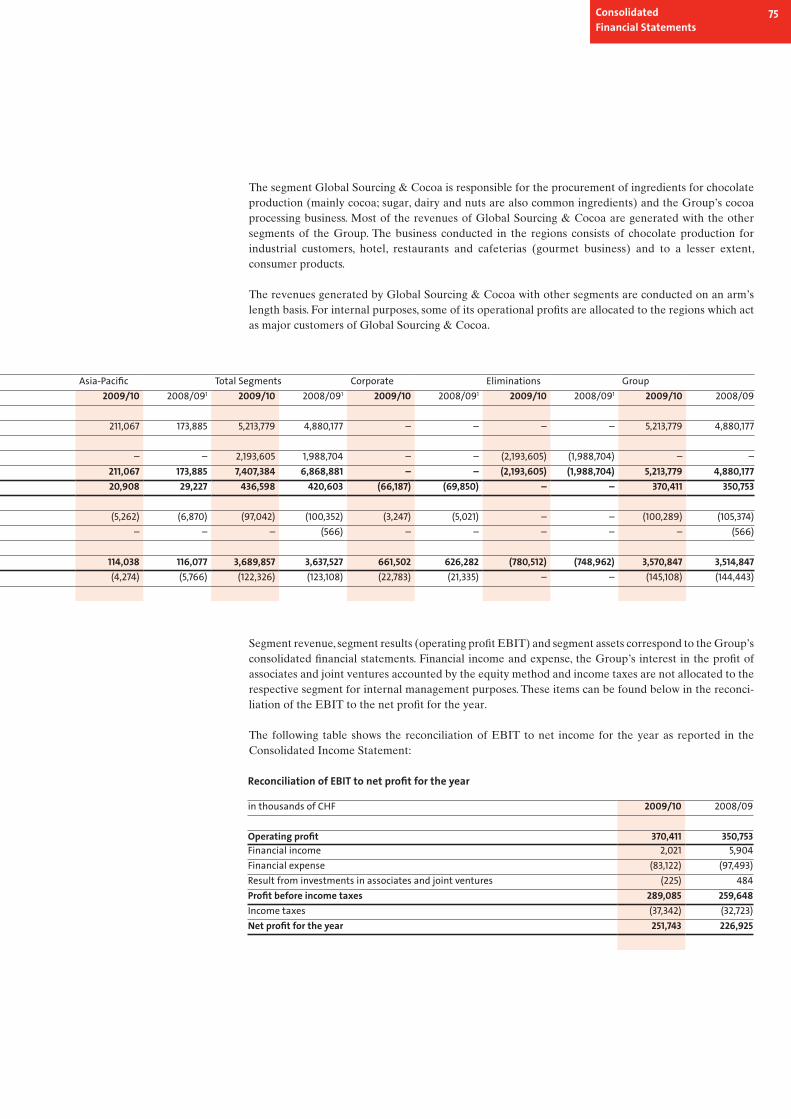
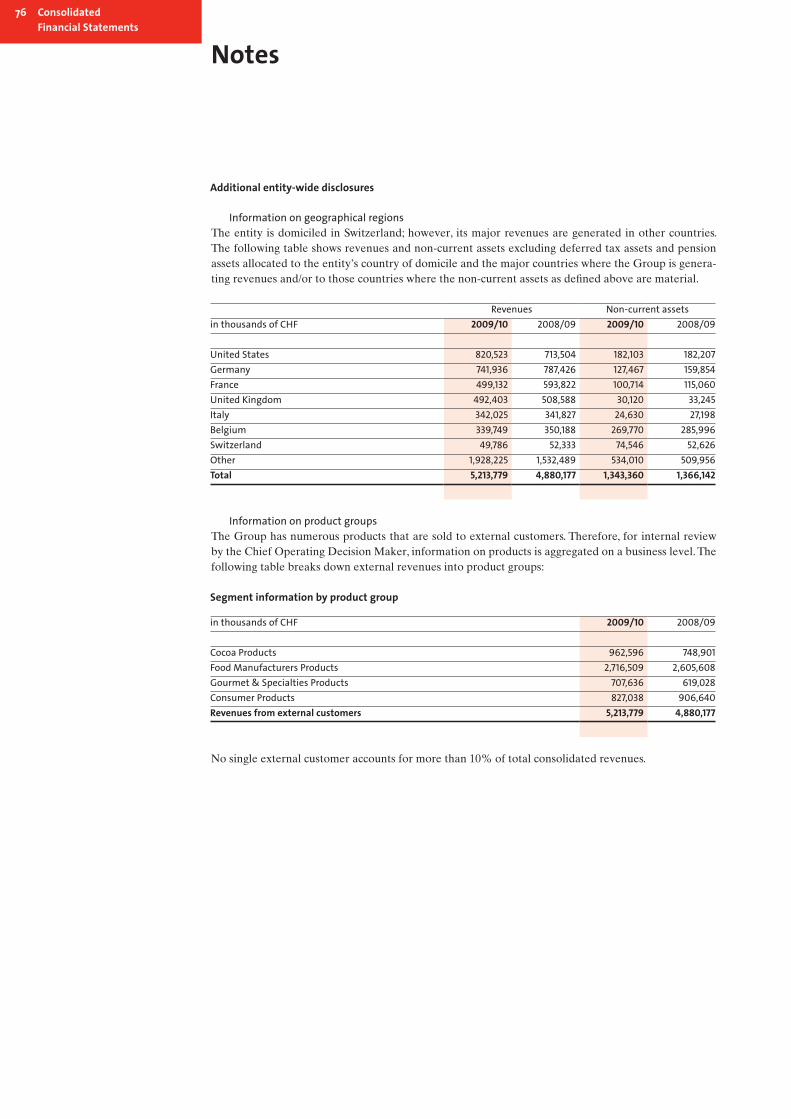


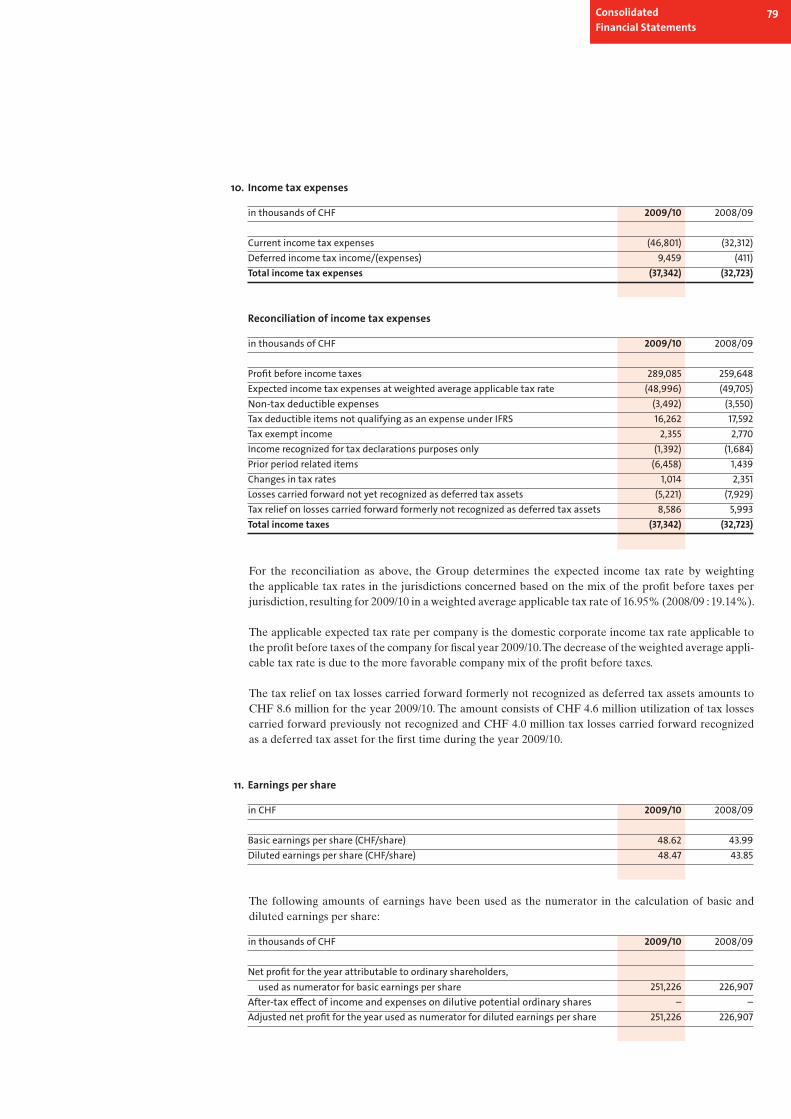
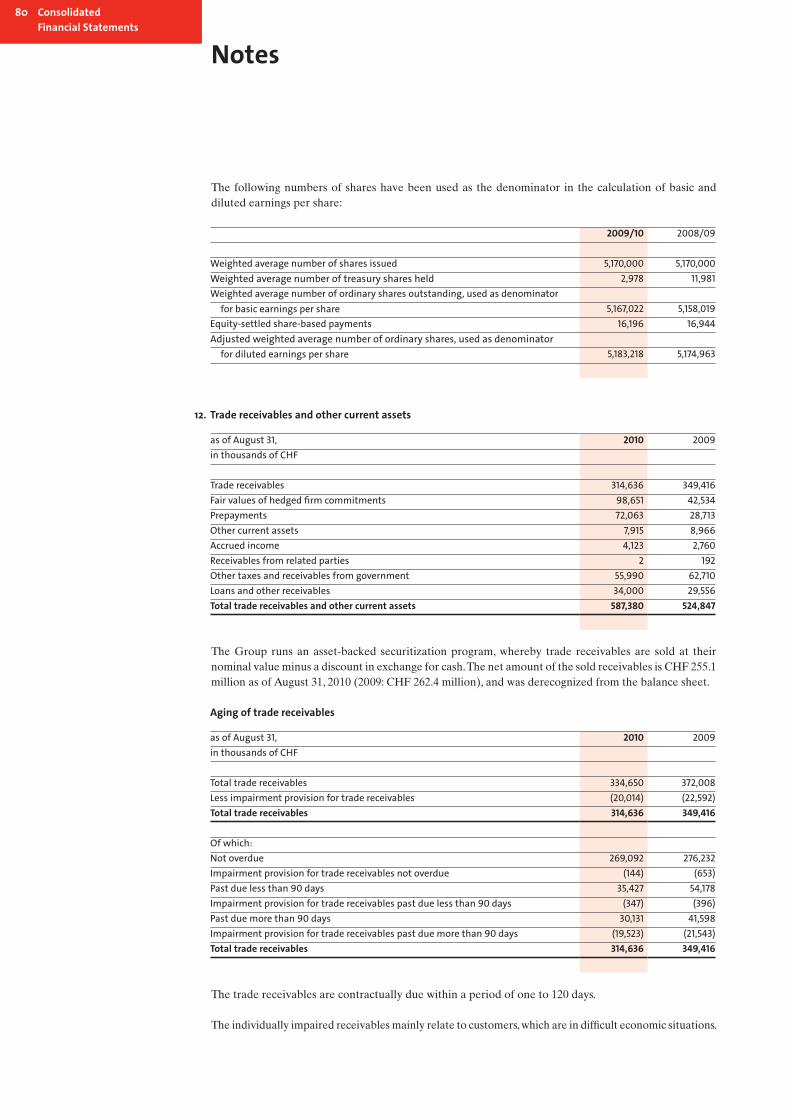
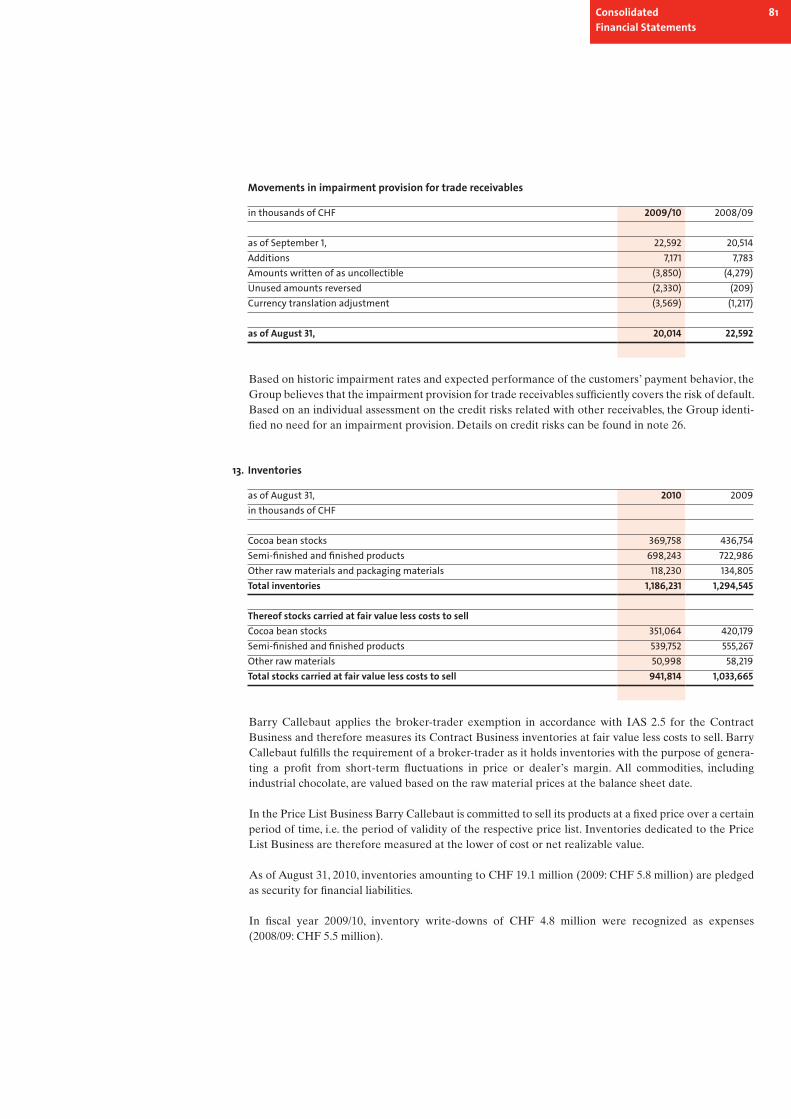
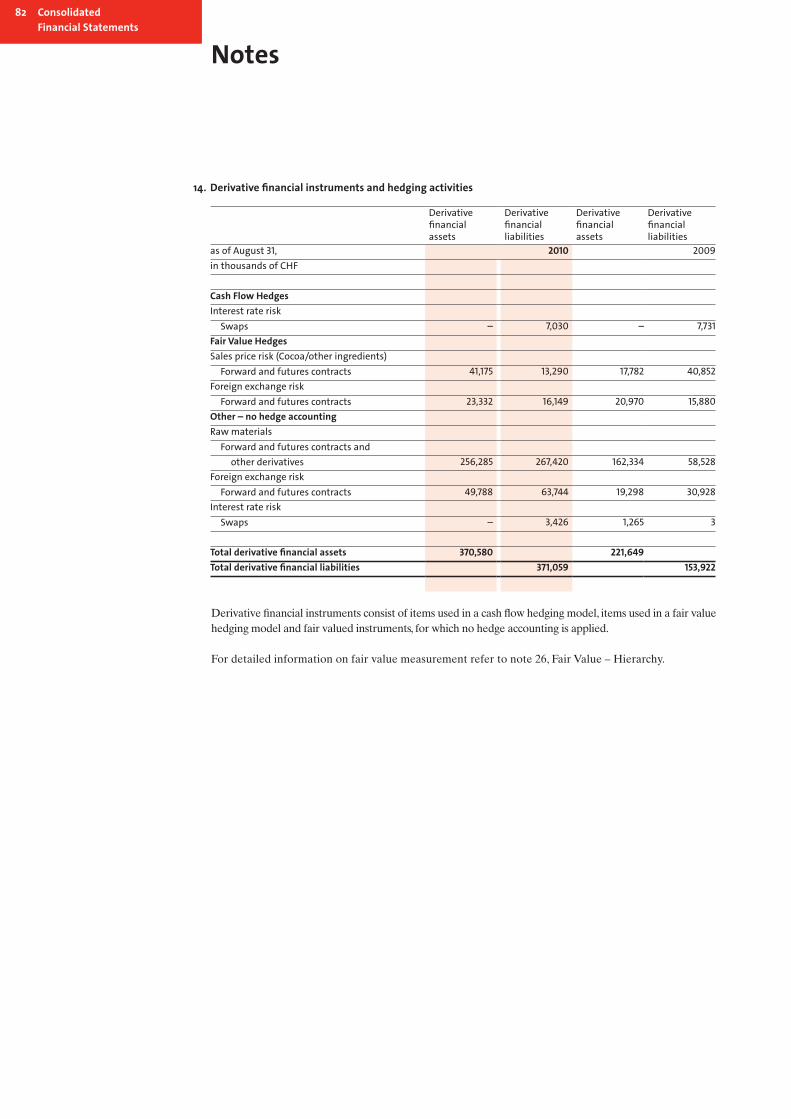
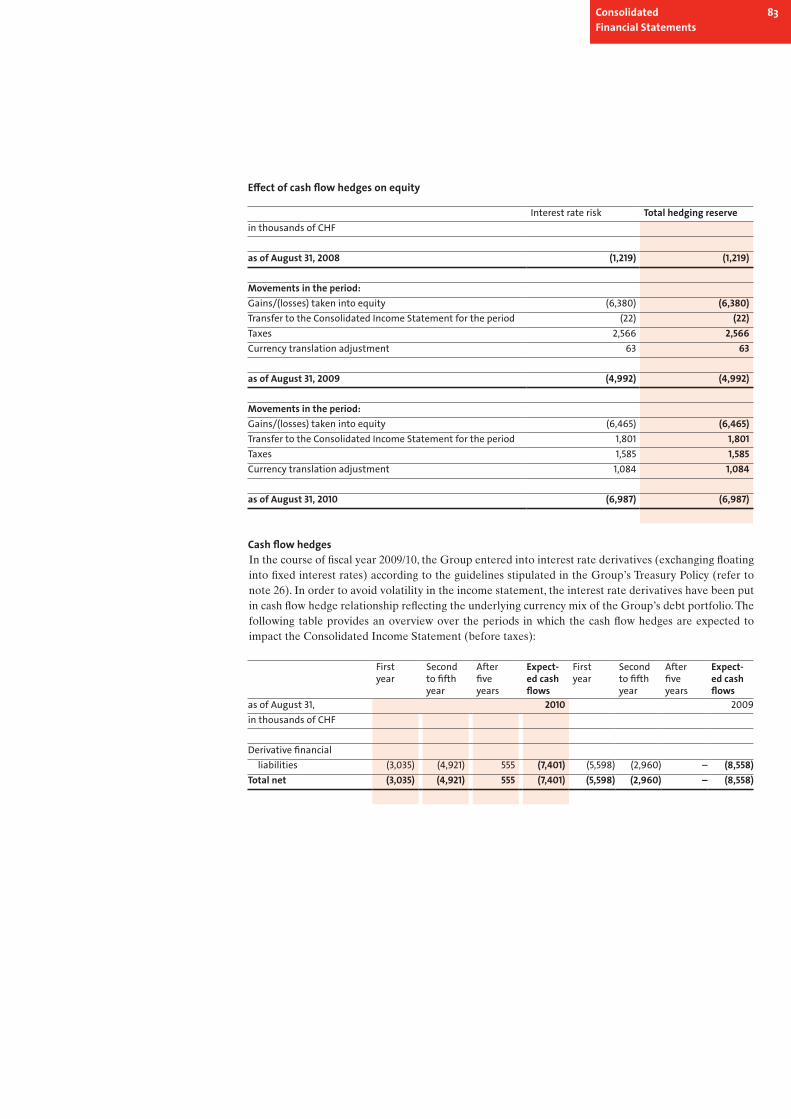

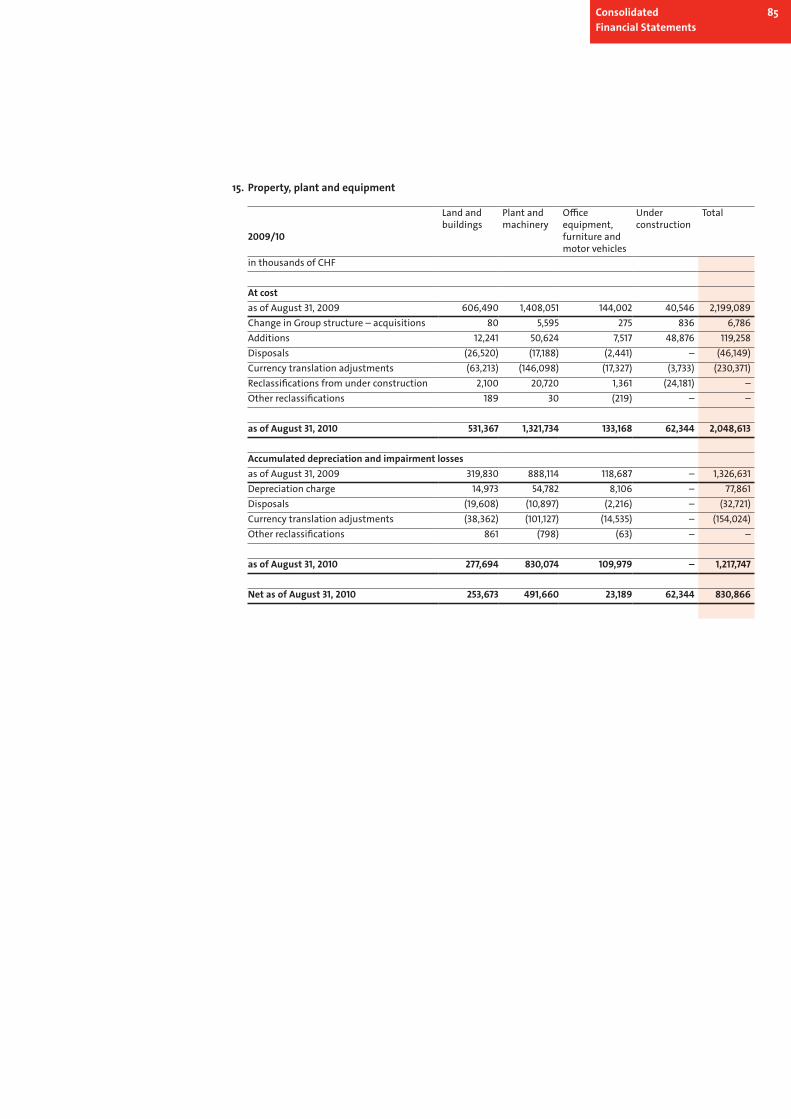
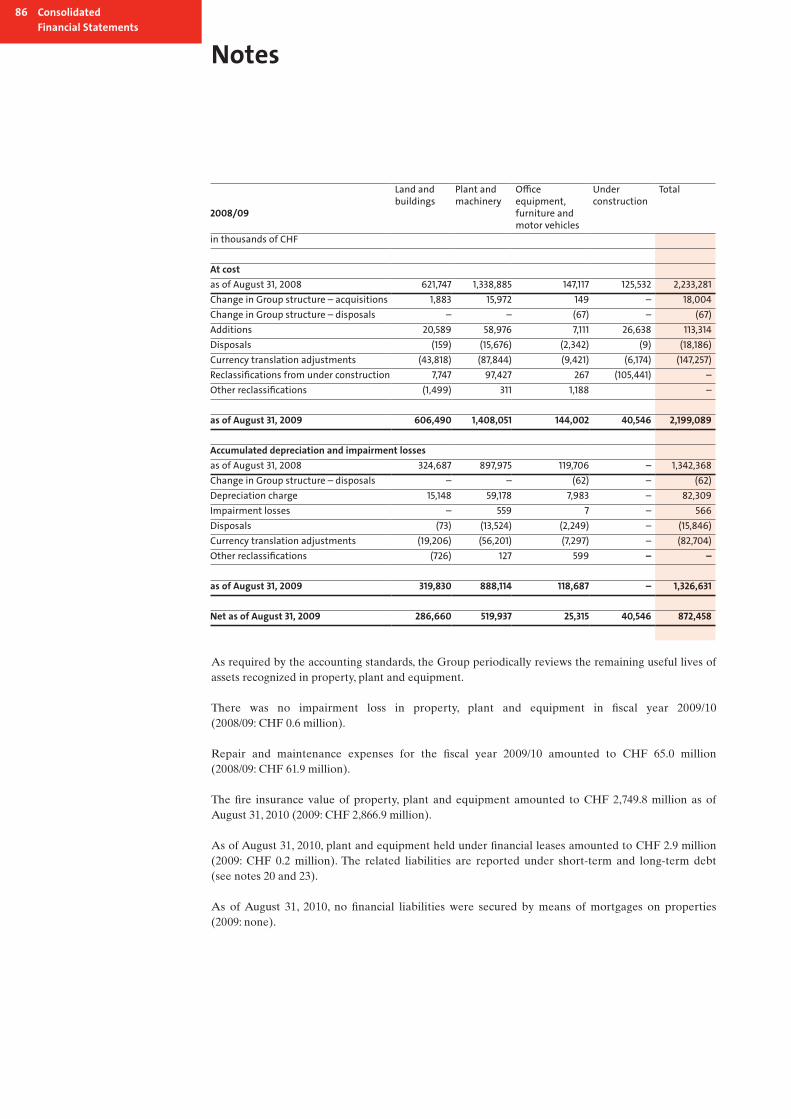

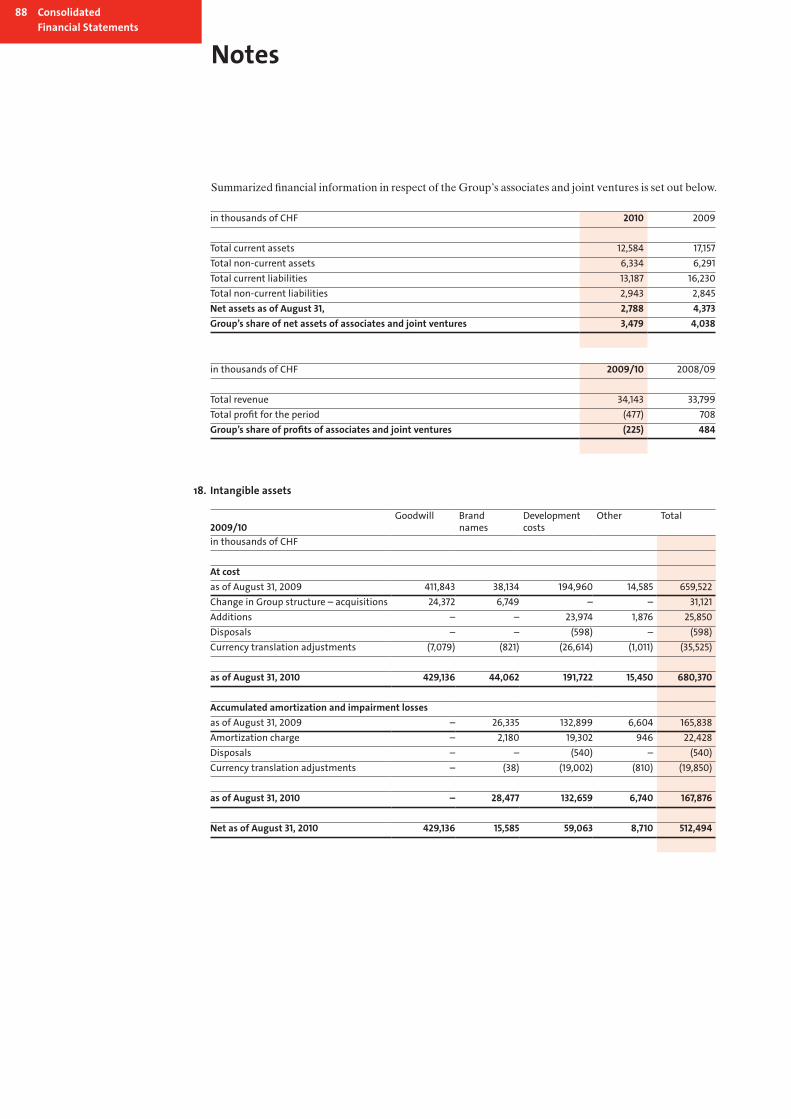
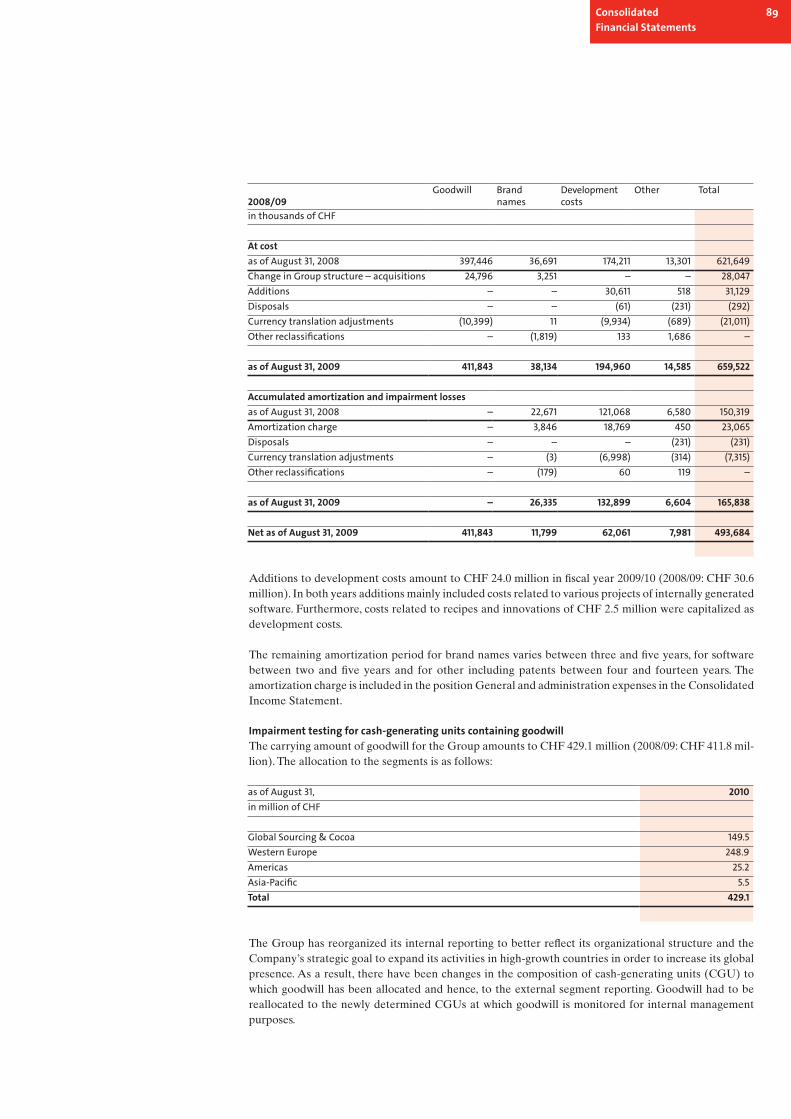
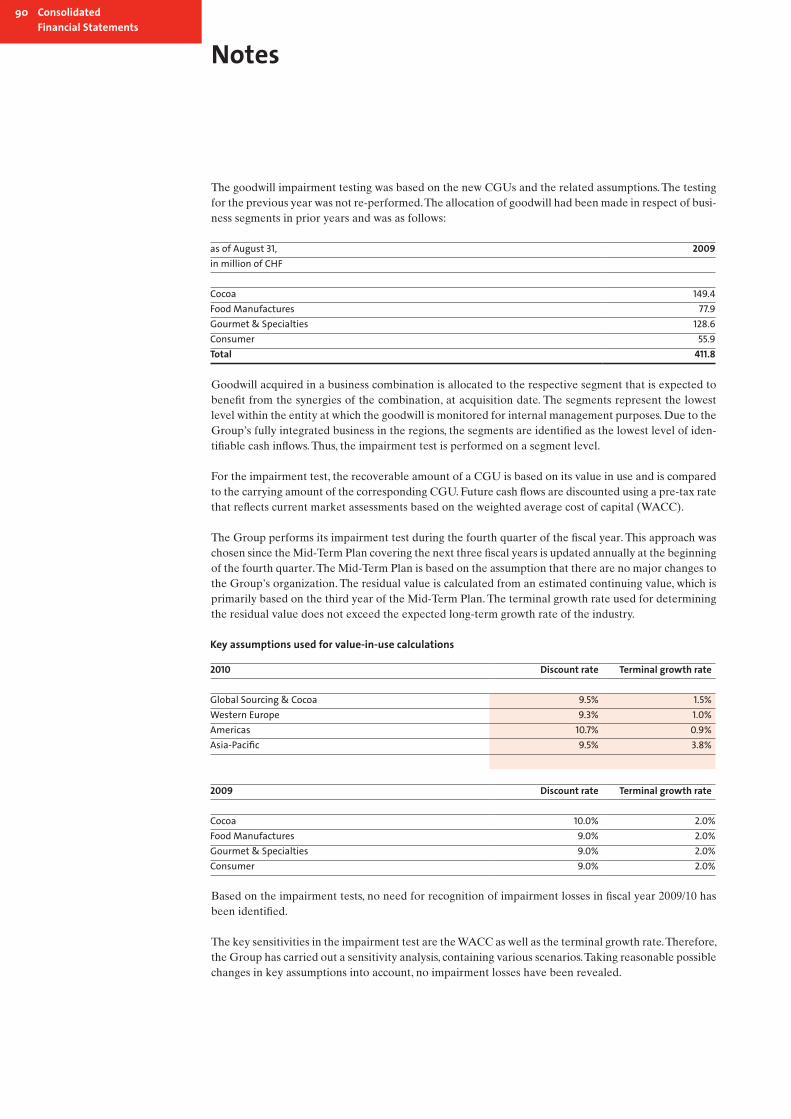
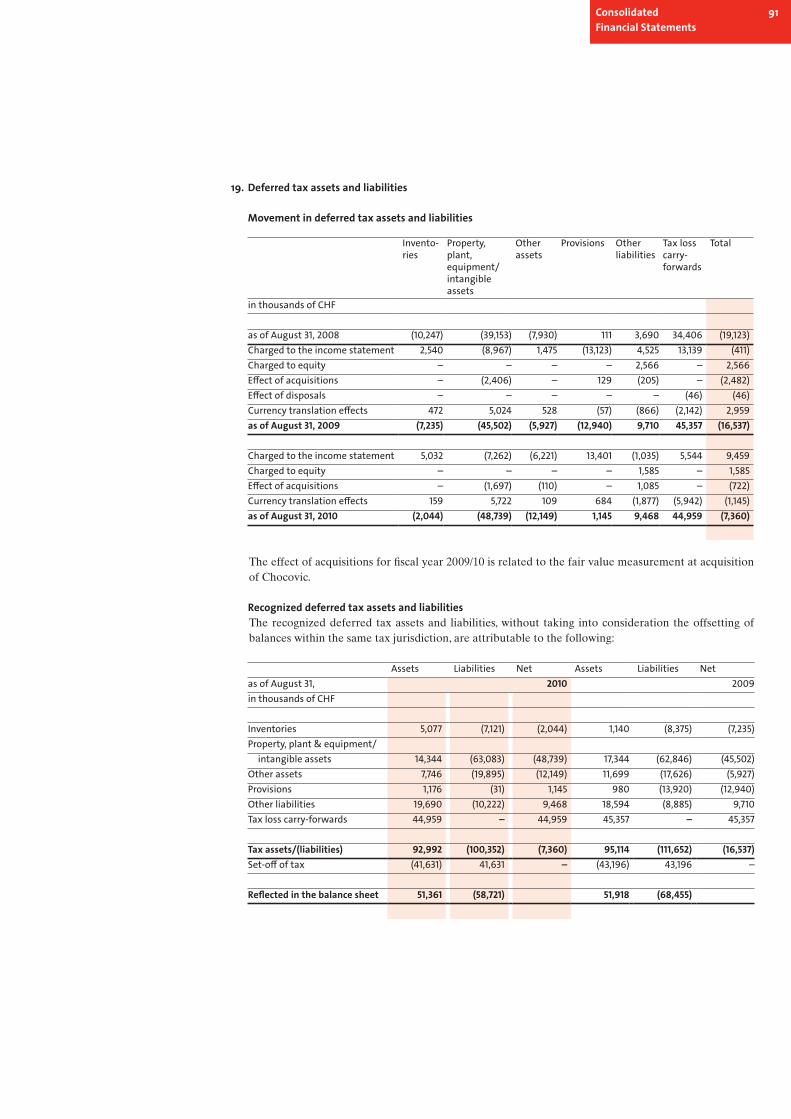
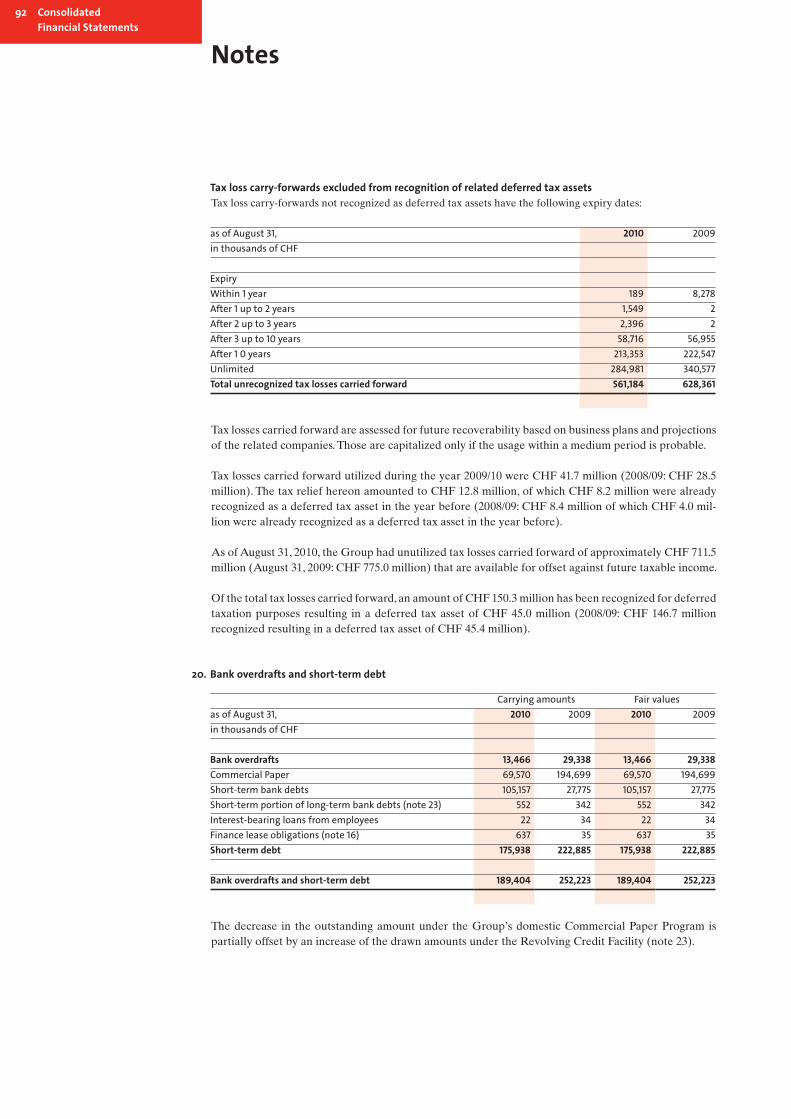
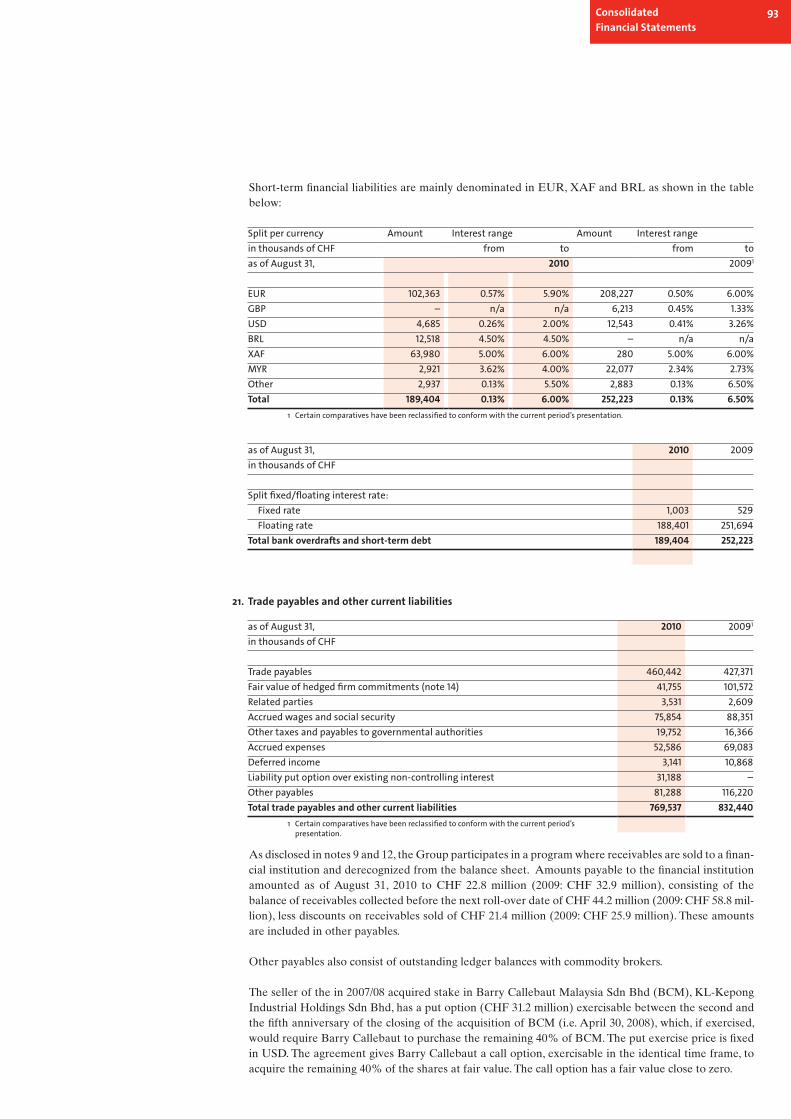
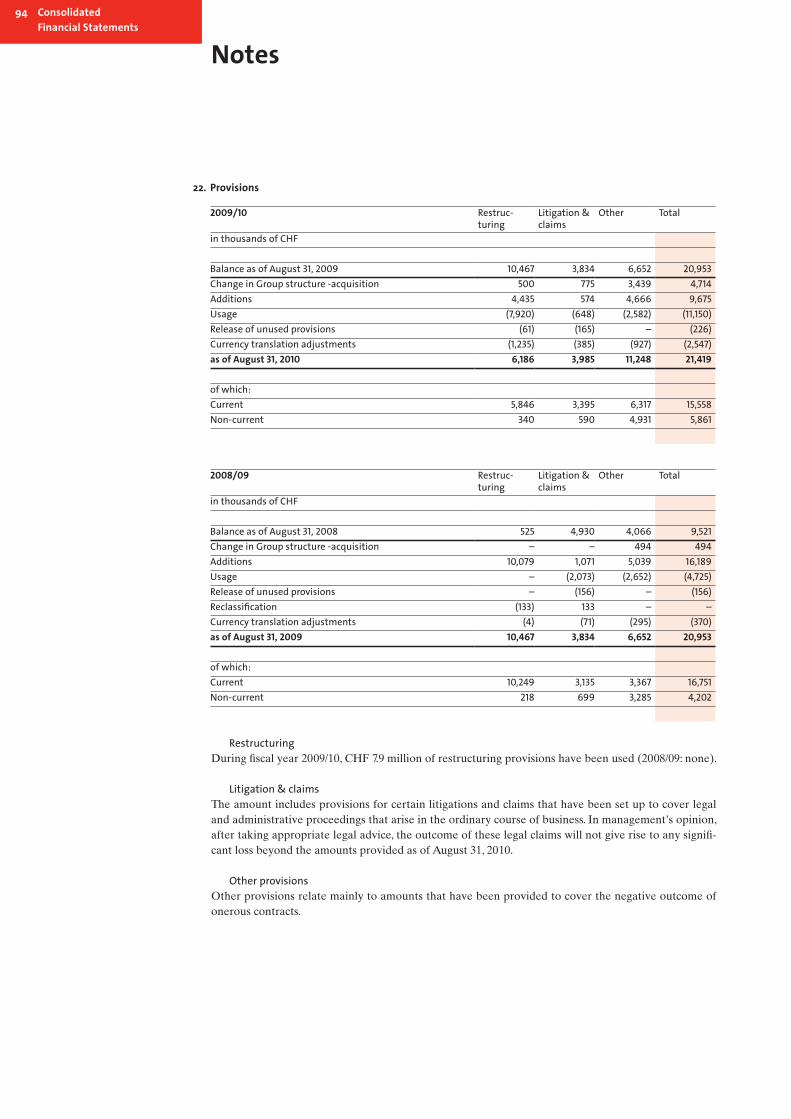
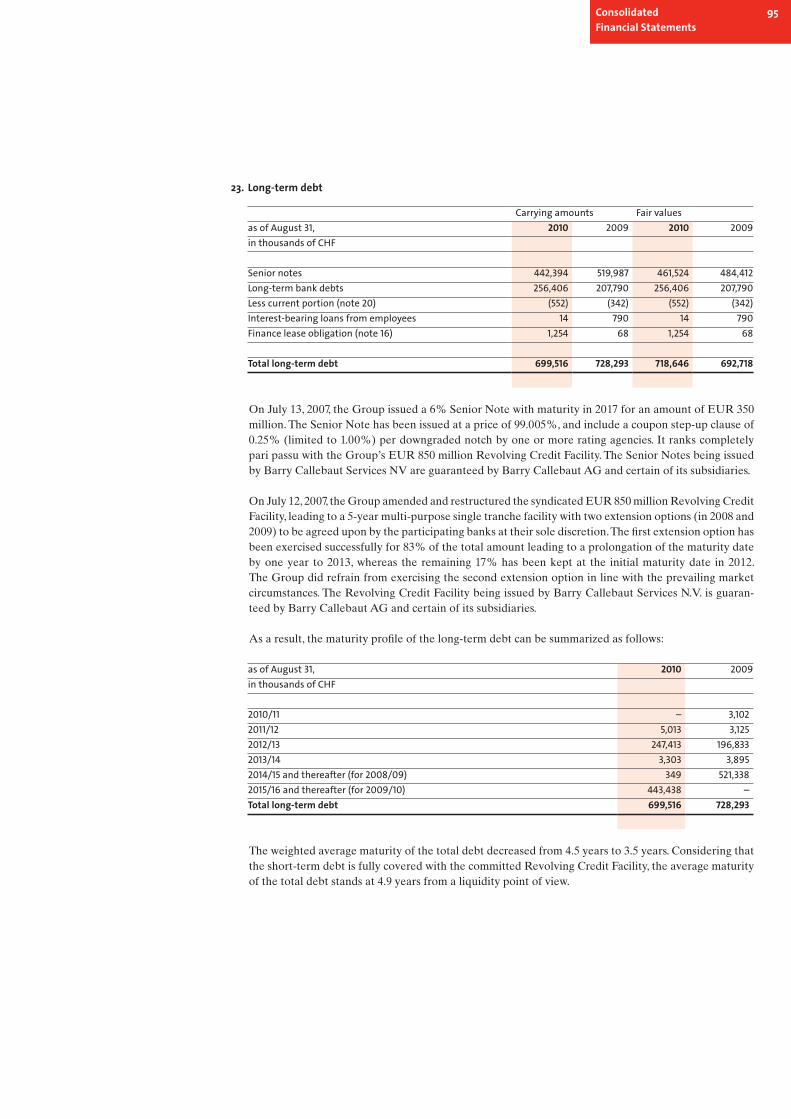
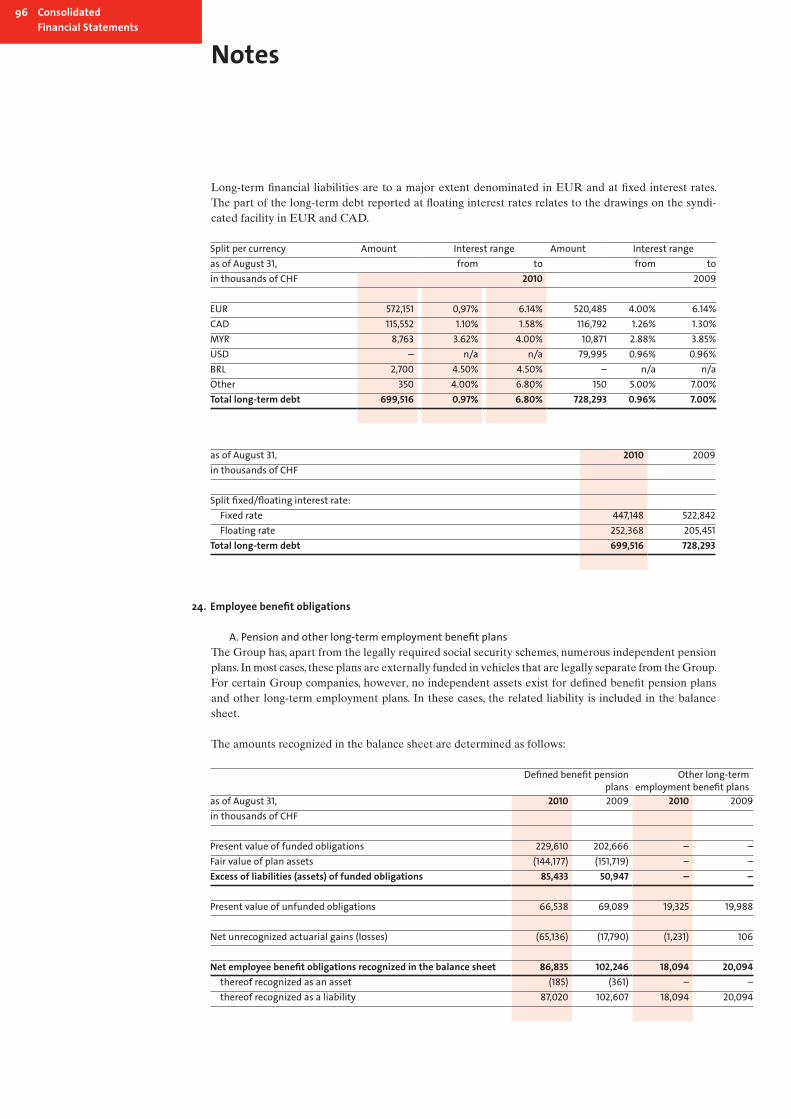
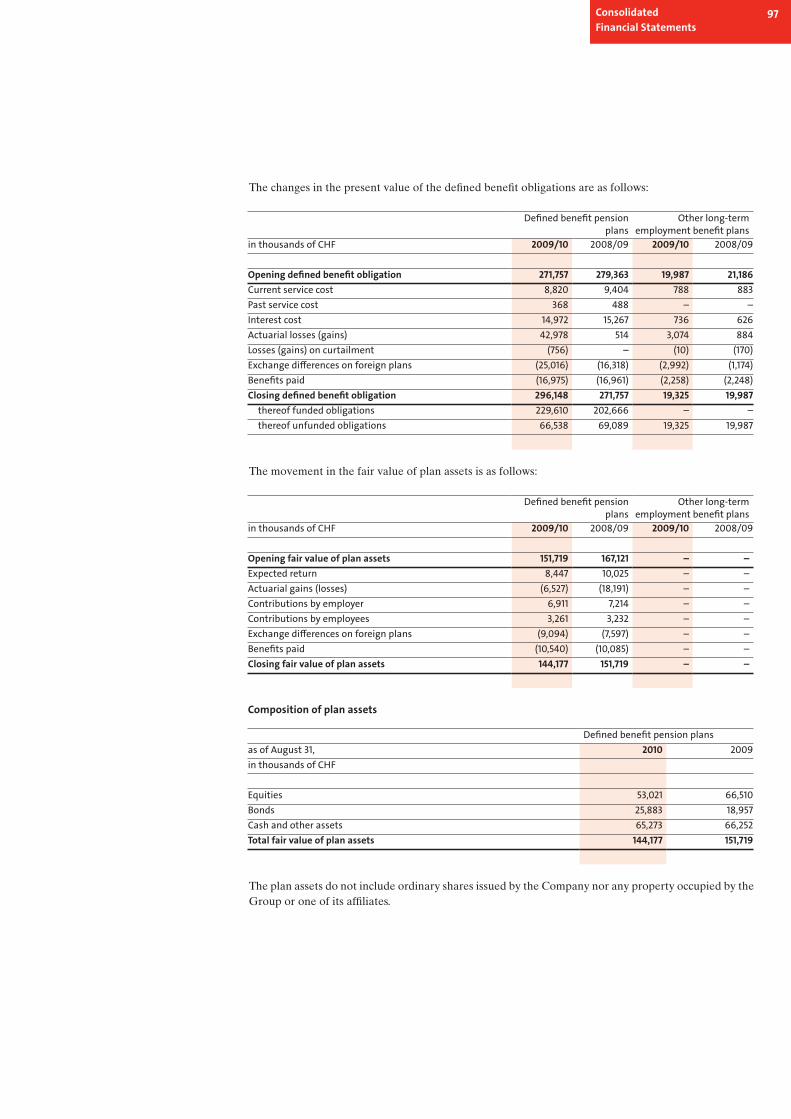
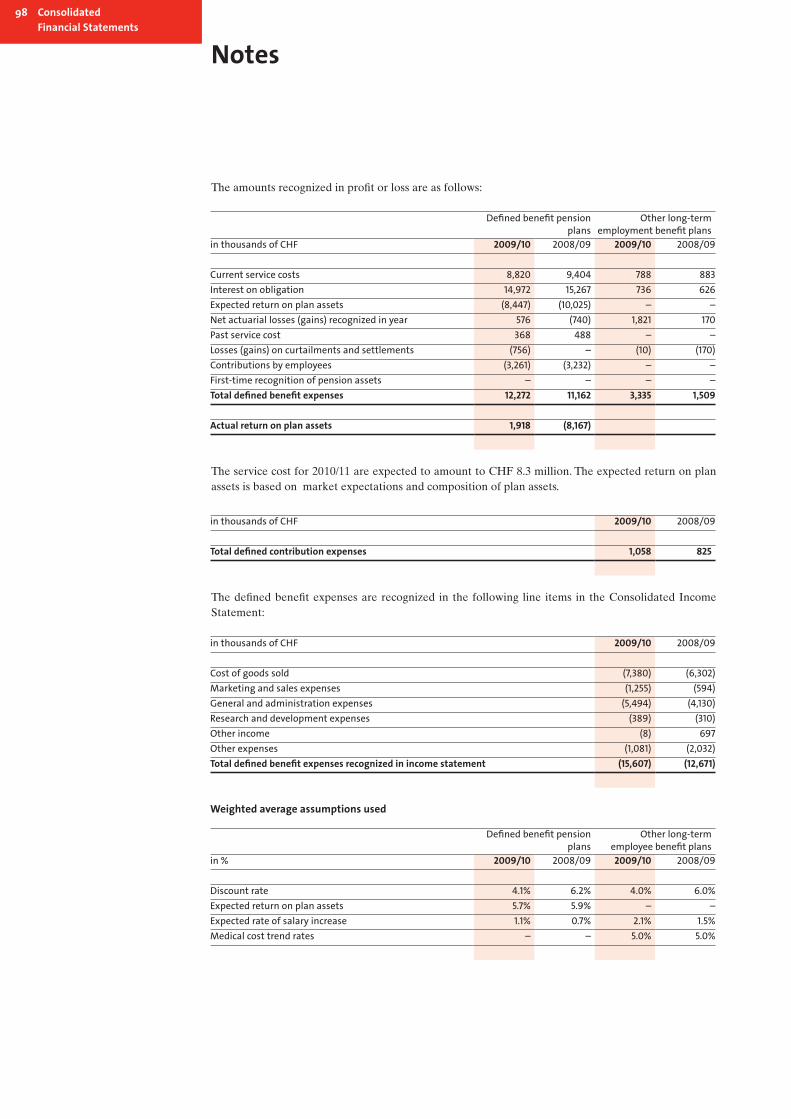
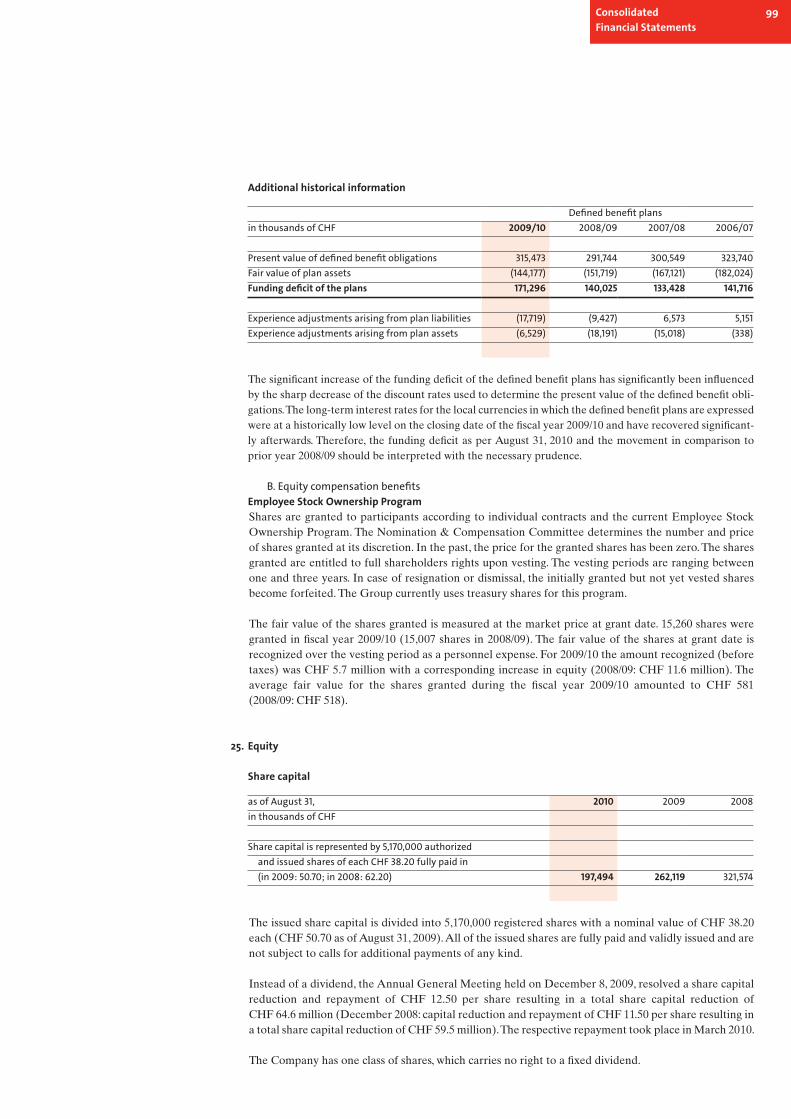
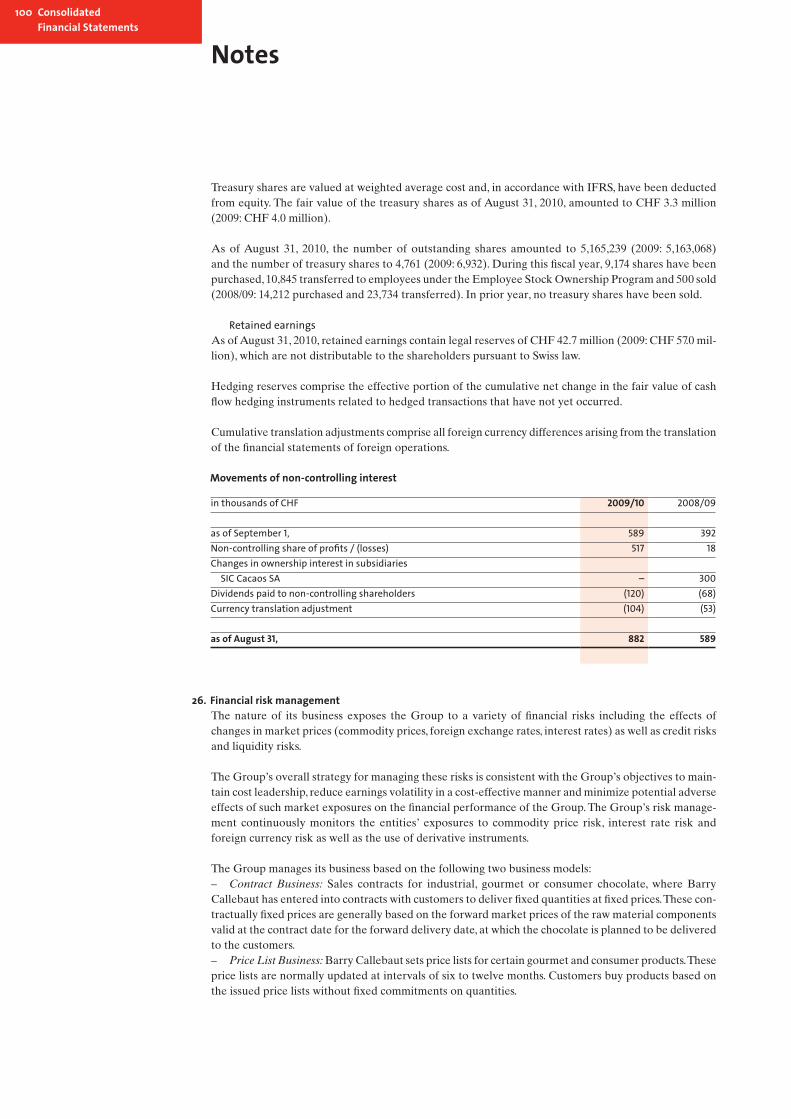
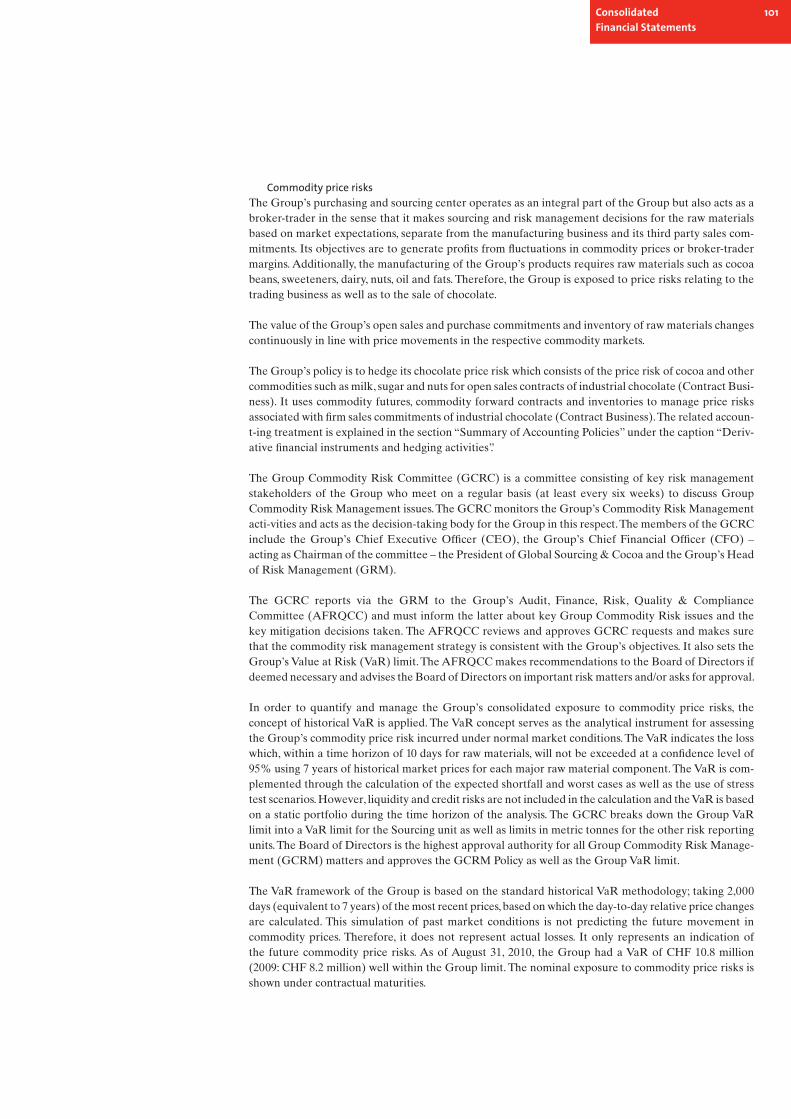
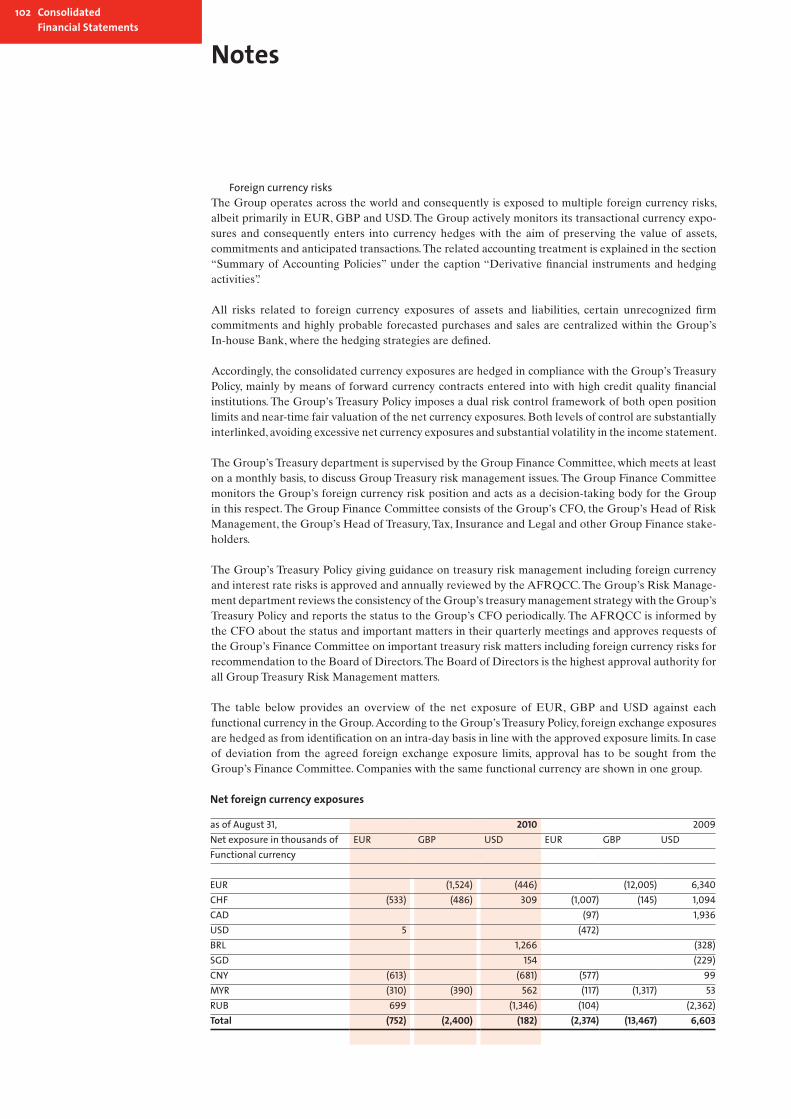
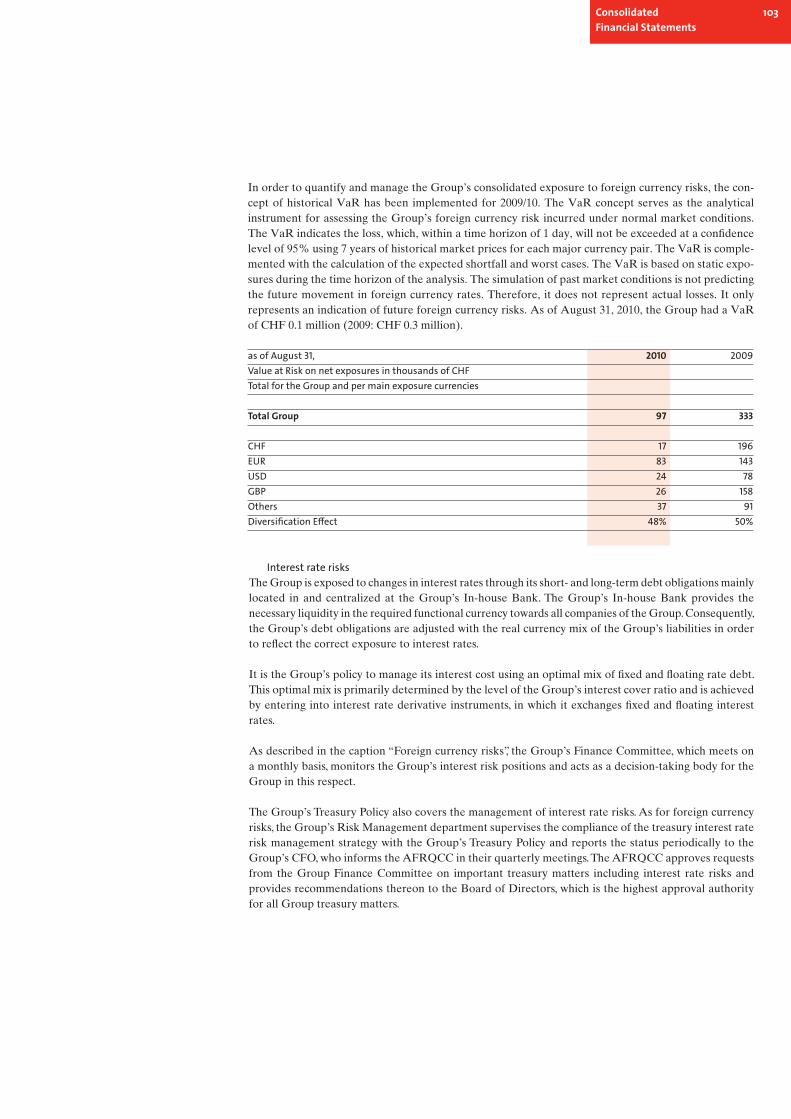
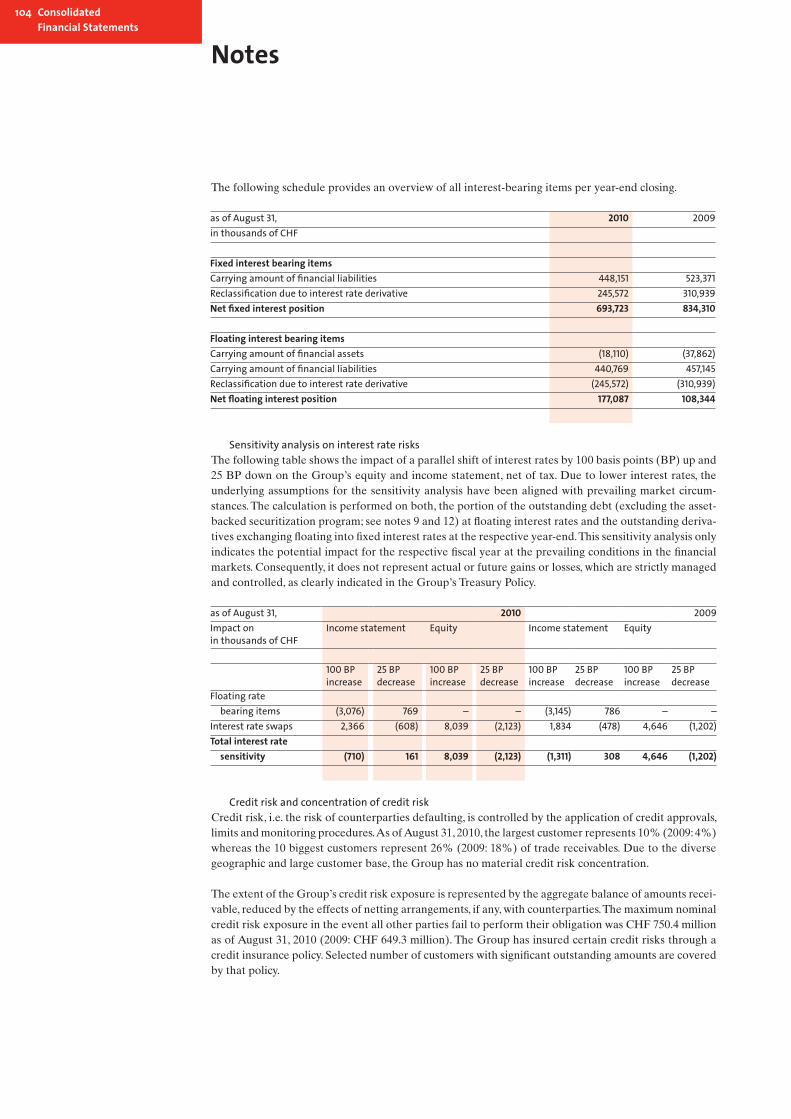
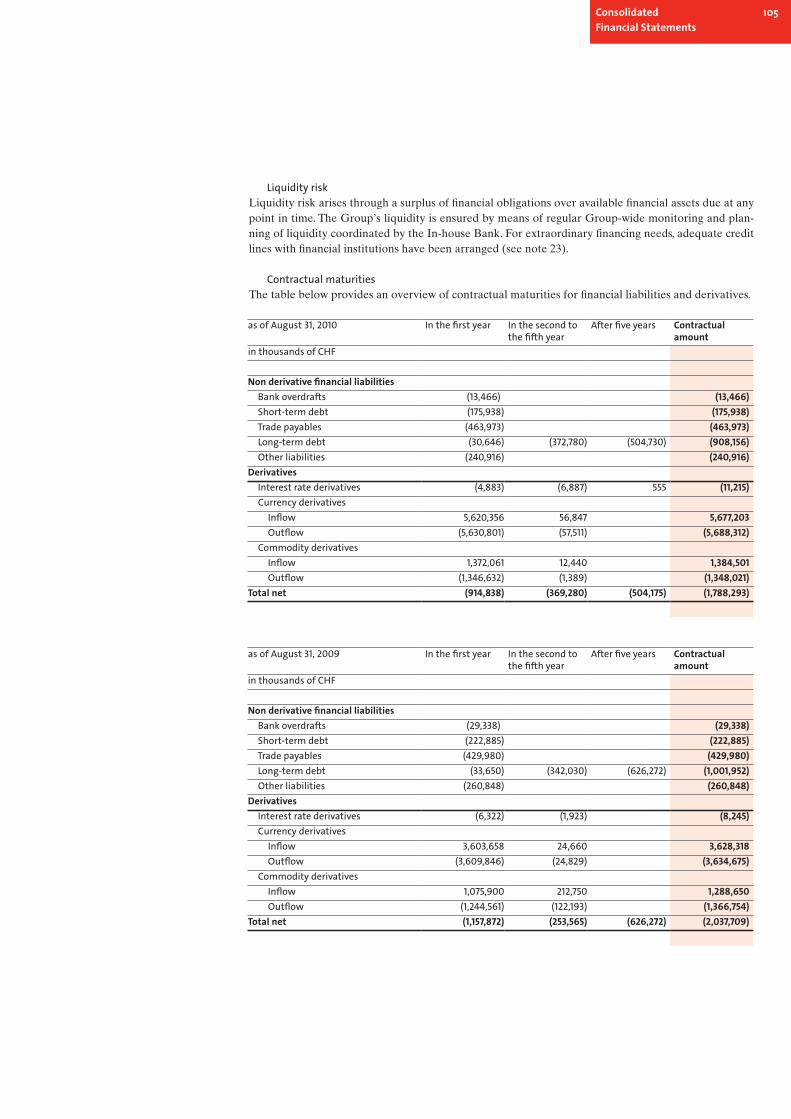

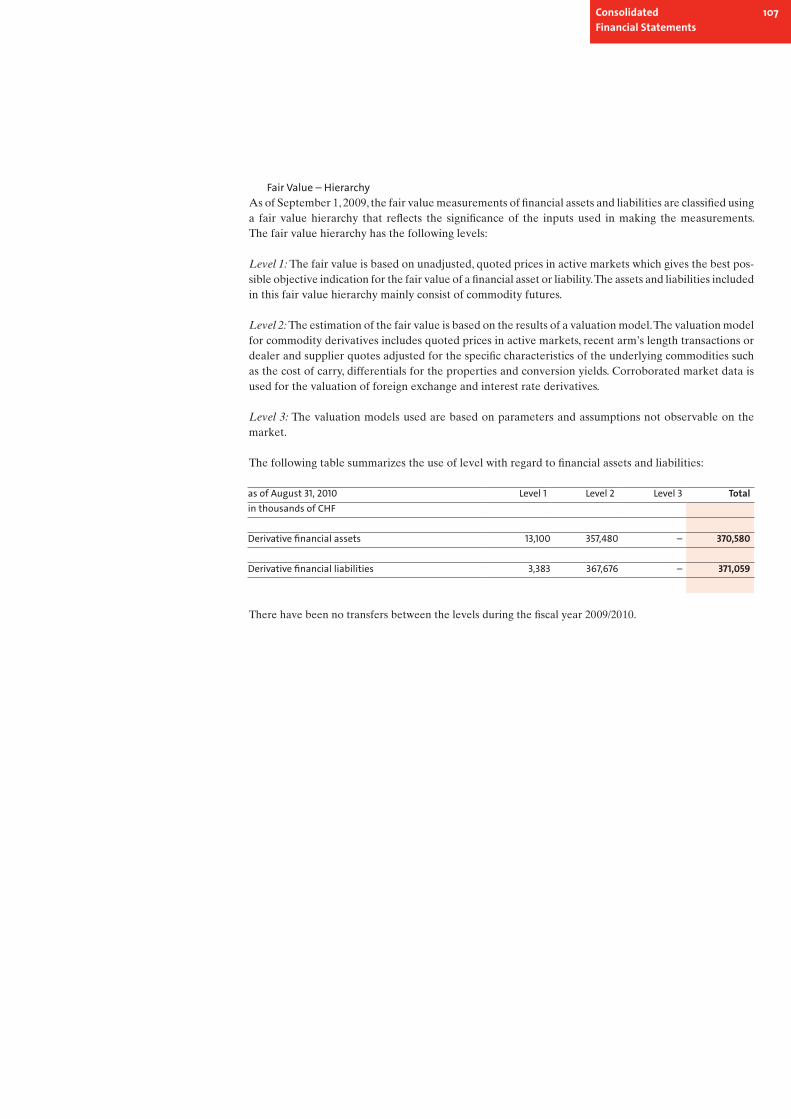
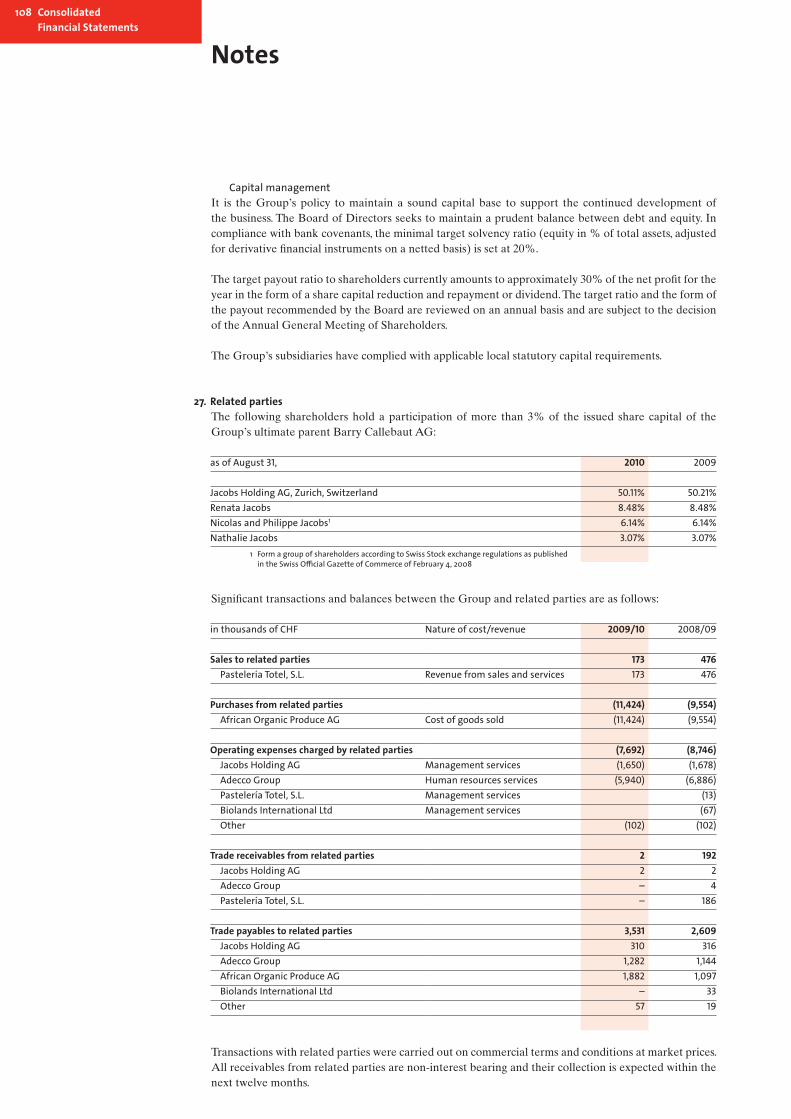
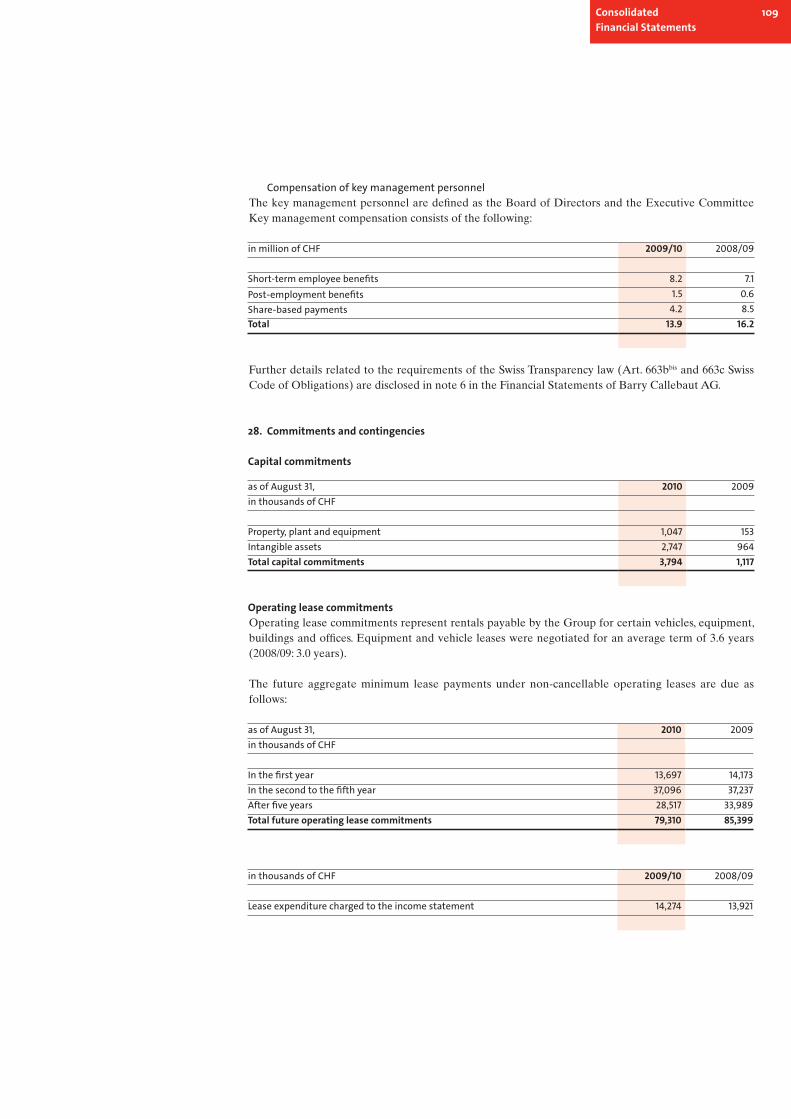
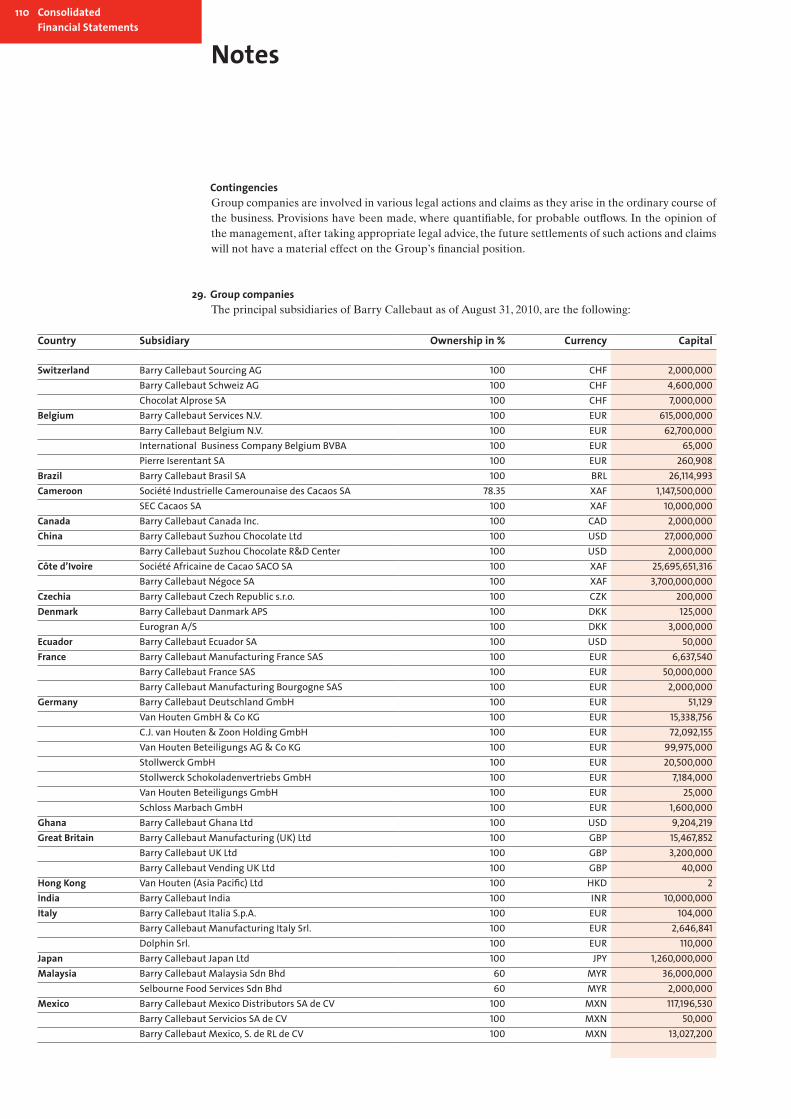
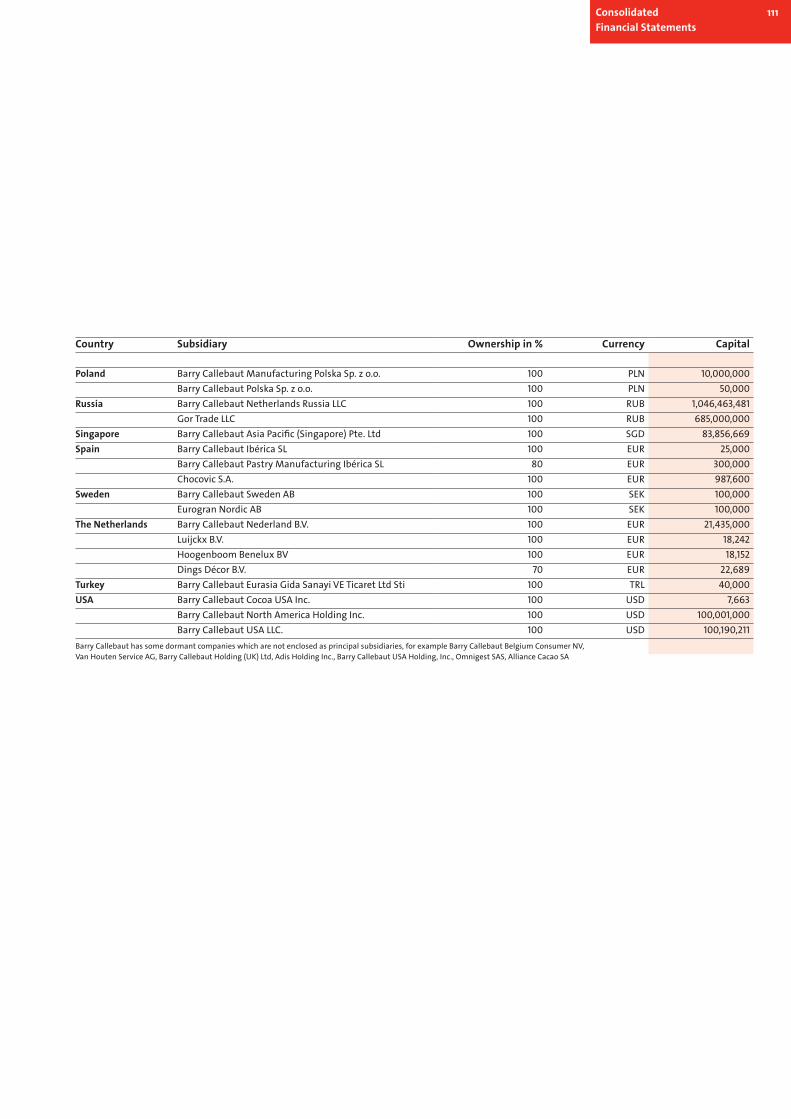

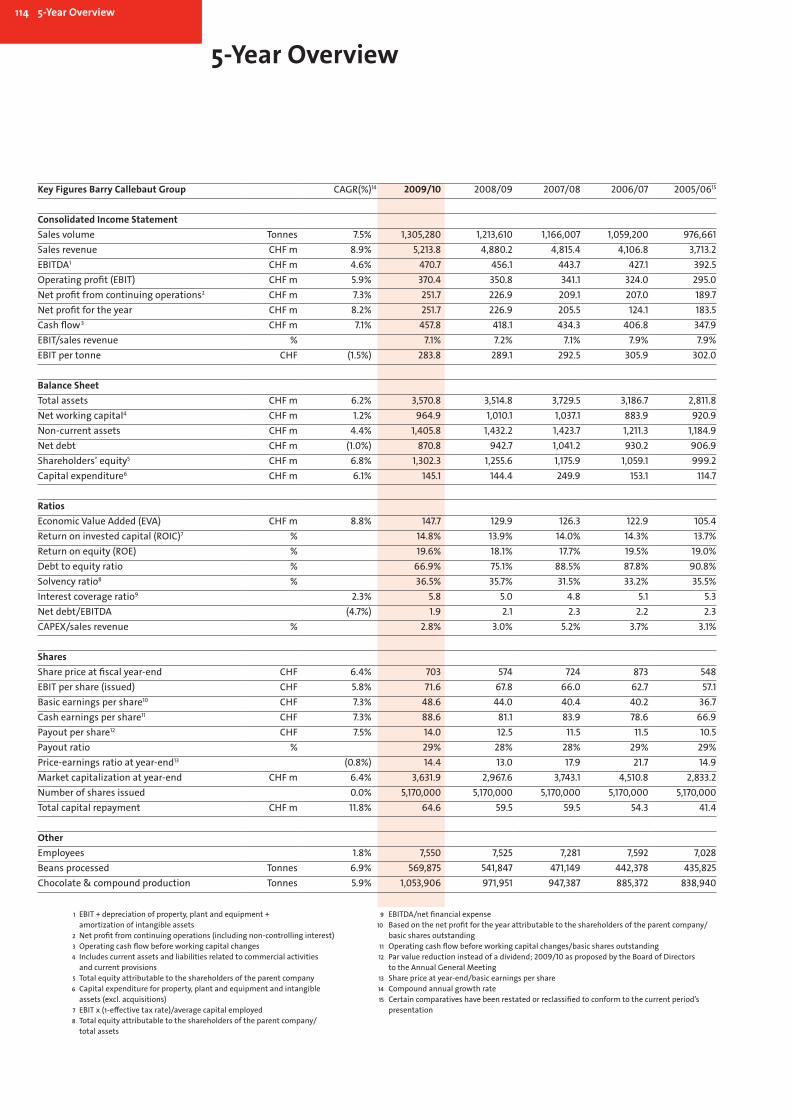

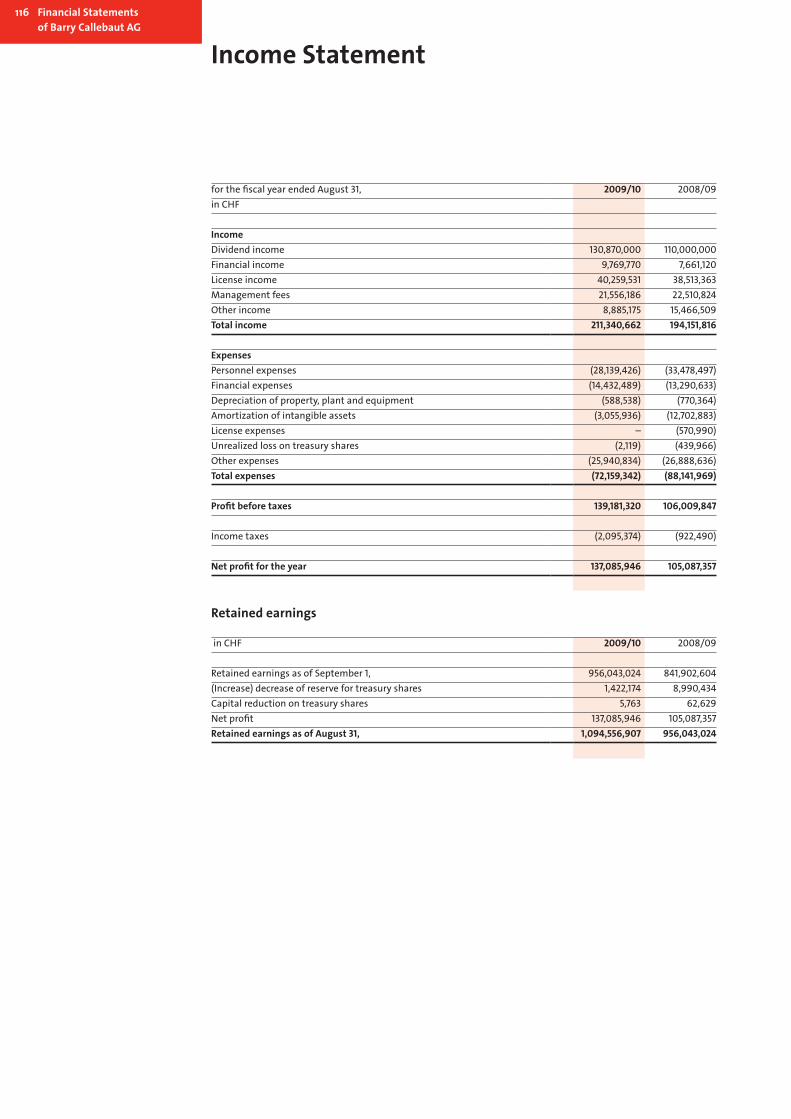
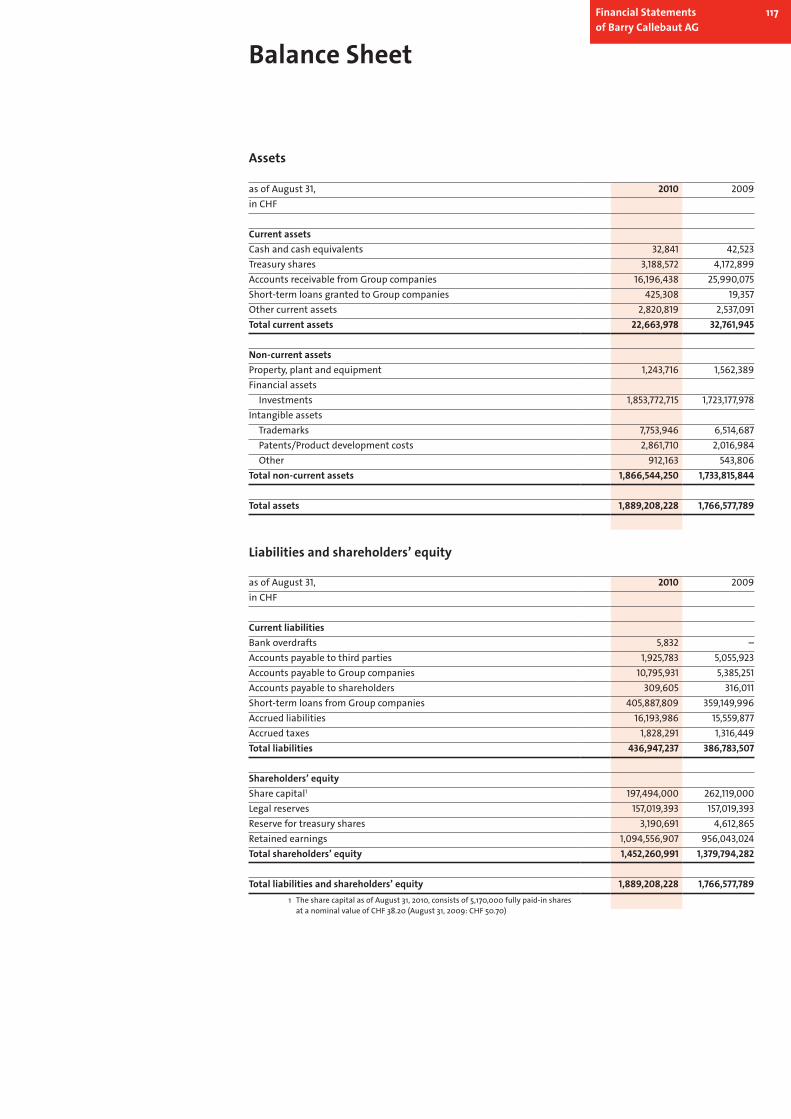

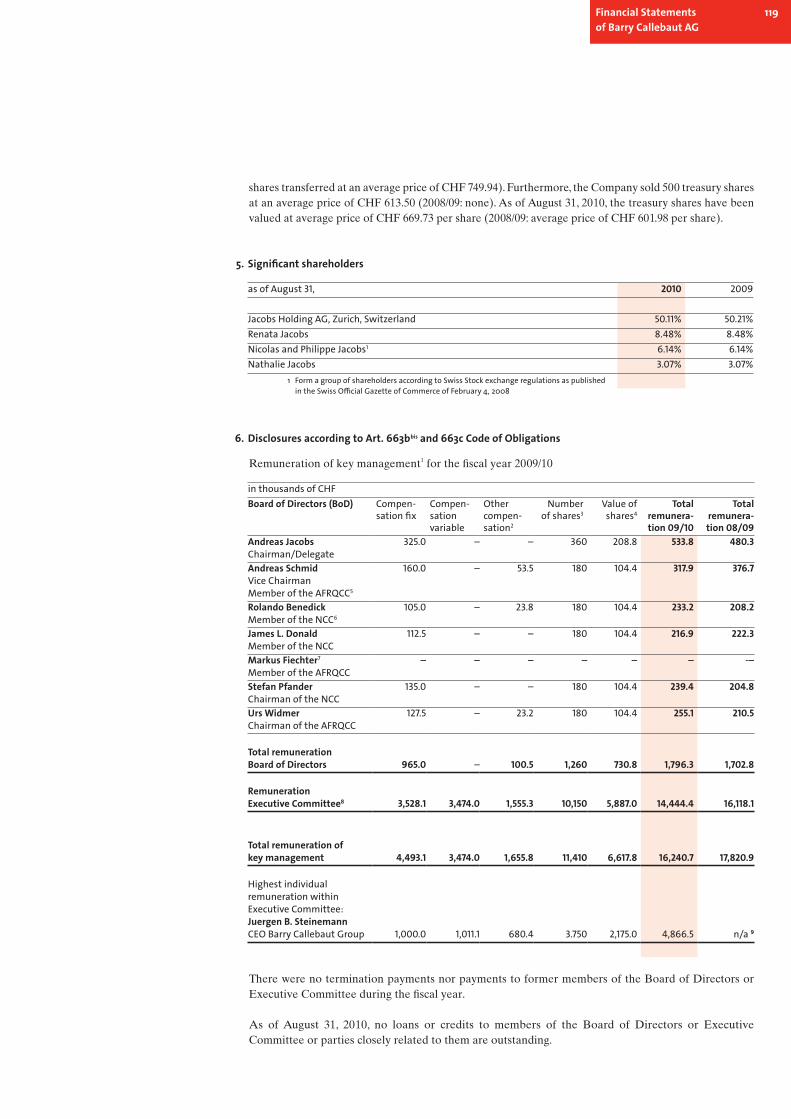
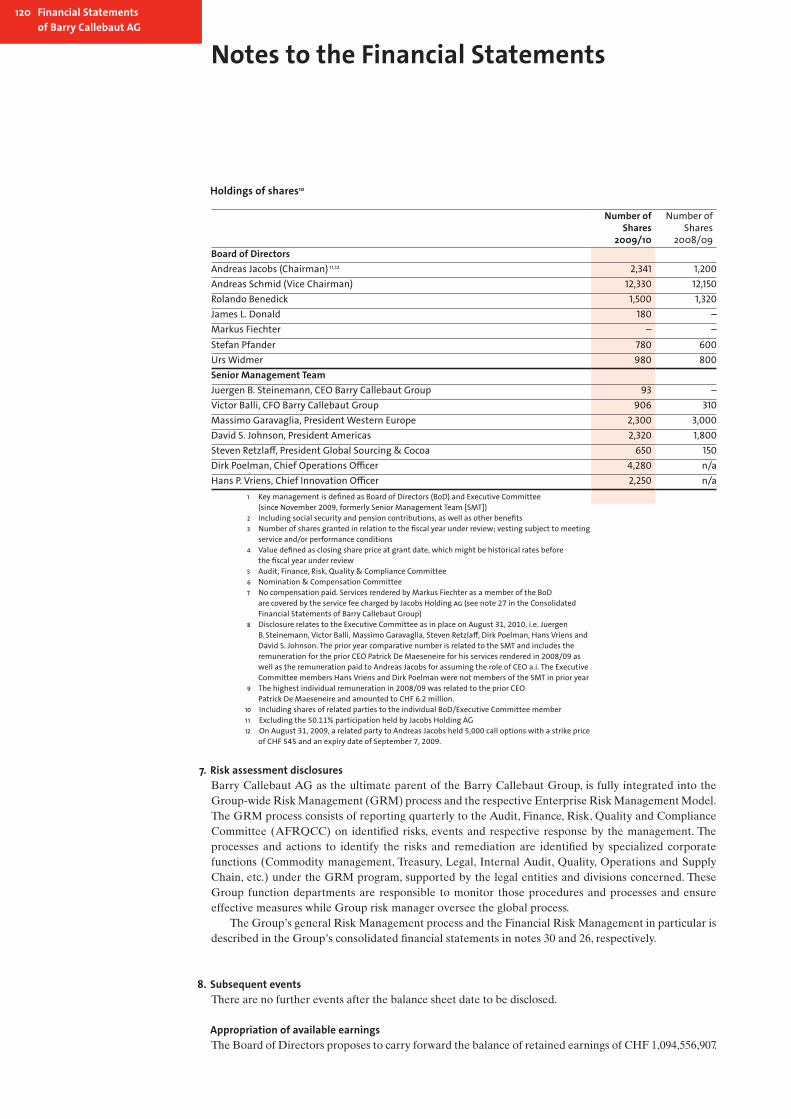


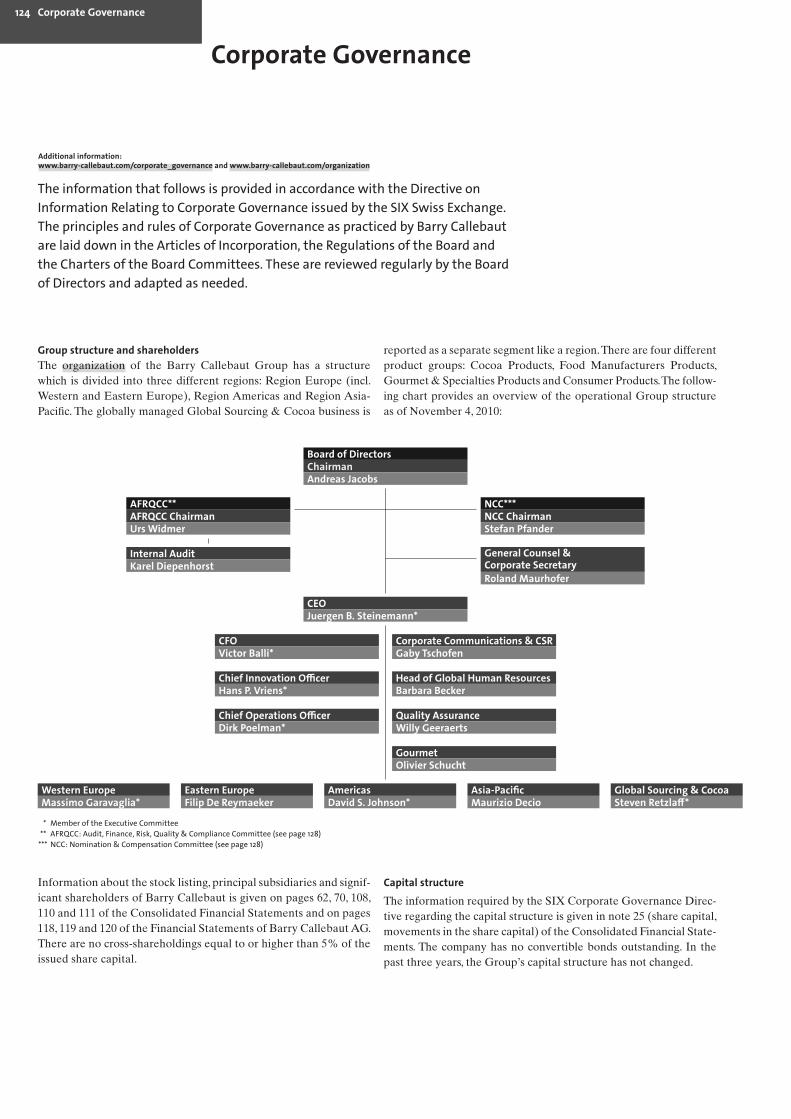


![[200.10] Stare druki BARCLAY ą ł ś ł Pozna 1743.](https://static.documents.pub/doc/80x56/61790c4780be520a4c29fef2/20010-stare-druki-barclay-pozna-1743.jpg)


