a. Closethesystem_prjifitisstillopened.Thenopentheamp_1900projectandschematic:s_final.
b. Savethes_finalschematicwithanewname:hb_basic.ThendeleteallthesimulationandmeasurementcomponentsandtheinputTerm.Beginbuildingthesetupshownhere.
c. InsertaP_1Tone(Sources‐FreqDomainpalette)fortheRFinput.
d. Insert4pinlabels(nodenames)Vin,Vout.VCandVBasshownsothatthevoltageswillbeavailableinthedataset.
e. SettheRFsourceasshown:Freq=1900MH.Also,removeremovethepolarfunctionsothatonlythedbm‐to‐wattswattsfunctionremains:P=dbmtow(40).Also,renamerenamethesourceRF_source.TheportnumberisdefineddefinedbyNum=1.
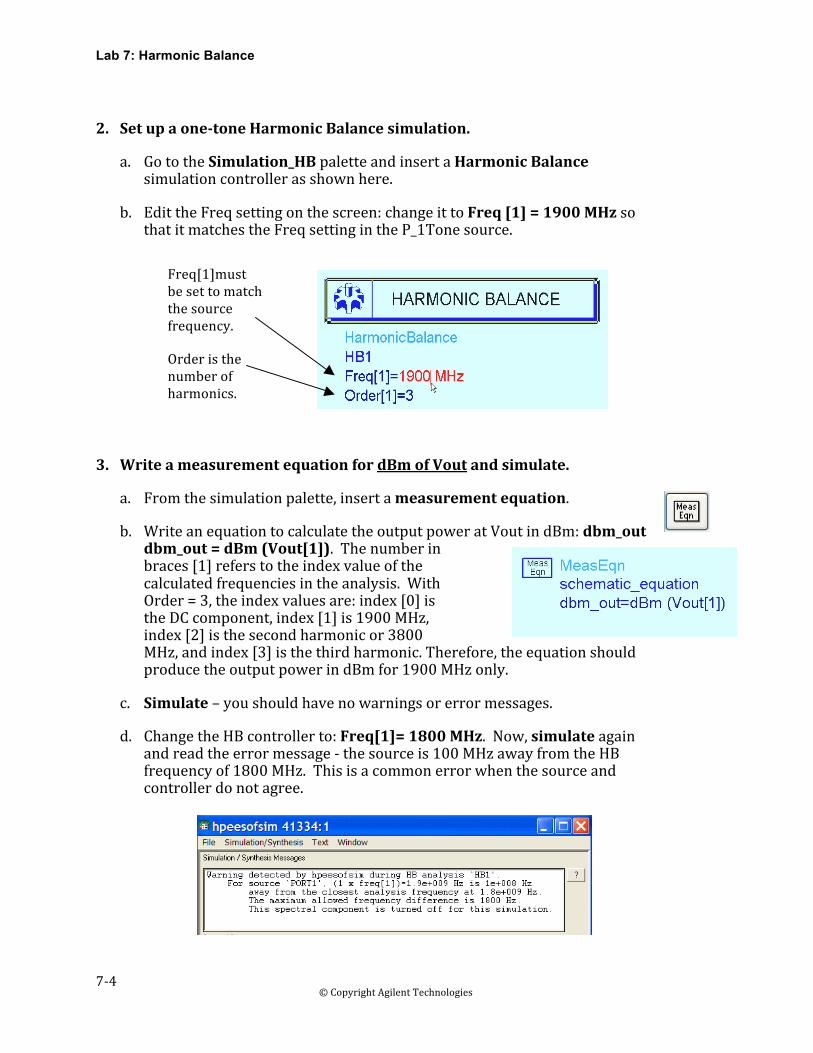
a. Fromthesimulationpalette,insertameasurementequation.
b. WriteanequationtocalculatetheoutputpoweratVoutindBm:dbm_outdbm_out=dBm(Vout[1]).Thenumberinbraces[1]referstotheindexvalueofthecalculatedfrequenciesintheanalysis.WithOrder=3,theindexvaluesare:index[0]istheDCcomponent,index[1]is1900MHz,index[2]isthesecondharmonicor3800MHz,andindex[3]isthethirdharmonic.Therefore,theequationshouldproducetheoutputpowerindBmfor1900MHzonly.
c. Simulate–youshouldhavenowarningsorerrormessages.
d. ChangetheHBcontrollerto:Freq[1]=1800MHz.Now,simulateagainandreadtheerrormessage‐thesourceis100MHzawayfromtheHBfrequencyof1800MHz.Thisisacommonerrorwhenthesourceandcontrollerdonotagree.
a. Inthedatadisplay,plotdBmofVout.Also,insertalistofdbm_out.Wheneveryouwriteameasurementequation,itwillappearinthedataset.Thetwovaluesshouldbethesameasshownhere.
b. Putamarkeronthefundamentalandverifythatyouramplifierhasabout35dBofGainwithoutputpowerindBm=‐4.876at1900MHz.
c. Insertastackedrectangularplotandinserttwodatatracesastimedomainsignals:VinandVout.Thets(timeseries)functionoperatesonHBandtransformsitintothetimedomain.Inthiscase,youcanseethattheamplifierdoesnotinvertthesignalasyoumightexpect.Thesewillbetwoseparateplotsinoneframe.Putmarkersonthesametimepointasshown.
d. EdittheY‐axislabelonthetracebychangingVouttoVCandchangingVintoVBasshownhere.Nowyoucanseetheinversion.Thismeansthatthematchingnetworkprobablyhasagreateffectonthephase.
a. InsertalistofMixandVoutasshownhere.WheneveraHBsimulationisperformed,aMixtable(indexvalues)iscreatedinthedataset.NoticethatVoutisalwayscomplex(magandangle),unlessyouoperateonitusingdB,dBm,etc.Inthenextsteps,youwilllearnhowtowriteequationstodisplayoroperateonspecifictonesintheMixtable.Thisisespeciallyusefulformultipletonesormixers.
b. EditthefirstlistandaddVin.ThenselectTraceOptionsandandeditVinbytypinginthedBmfunction:dBm(Vin)andclickandclickOK.NoticethatwheneveryoueditatraceorinsertaninsertanequationthebuttonsappearforVariableInfo(dependencies)orFunctionHelp(manuals).
c. Yourlistshouldnowcontaintheschematicequationdbm_outandtheexpressiondBm(Vin)forallfrequencies.frequencies.Now,editthedBm(Vin)databyinsertingtheinsertingtheindexvalue[1]intheVinargumentasshown–shown–nowyougetthevalueofVinattheindexvalueorvalueor1900MHz.
d. Insertthe[1]inthedbm_outequation‐itbecomesinvalidbecauseitwasindexedas{1}ontheschematic.
e. Remove[1]fromtheinvaliddbm_outequationtomakeitvalidagain.
f. InsertthecursorinthedBm(Vin[1])expressionandaddacommaand50asshownhere.ThesecondargumentinthedBmfunctionisZin.Ifnoargumentisgiven,thedefaultis50ohms.Therefore,nochangeshouldoccur.Undothecommafifty(,50)sothatitreadsdBm(Vin[1]again.
a. EdittheHarmonicBalancecontrollerandselecttheselecttheOutputtabandchecktheboxforPinPinCurrents(shownhere)andclickOK.ThiswillThiswilladdallthevaluesofcurrenttothedatasetdataset–youwillbeusingtheinputpincurrentinsteadofacurrentprobe.
b. Simulateagain.Whenfinished,gotothesameDataDisplayandwriteanequationfortheinputcurrentwhichusesthetotalcurrentthroughtheinputinductor.Todothis,usetheeditor:writeI_in=andtheninserttheinductorcurrentasshownhere:
c. WriteanotherequationtocalculateZinusingVinVinandI_inat1900MHzasshownhere.TheninsertinsertalistoftheZ_inequation.Noticethecomplexcompleximpedanceisnot50ohms!
d. WriteanequationtocalculateaveragedeliveredpowerusingthenodevoltageVinandtheinputcurrentequationI_in:
e. EdityourearlierlistofdBm(Vin[1])anddeletedbm_outandaddtheequationP_del_dBm.Also,addanotherVintraceandeditthetraceexpressiontoread:dBm(Vin[1],Z_in).Nowyouhavethreewaysofcomputinginputpowertocompare.Noticethattwoofthevaluesarethesame:
a. Saveallyoucurrentwork:schematicanddatadisplay.Thensavetheschematicwithanewname:hb_compression.Afterward,closethehb_basicdatadisplay.
b. Inthenewschematic,deactivatetheHB1controller.
c. GototheSimulationXDBpaletteandinserttheXDBcontroller.EditthecontrolleronscreensothatFreq[1]andGCinputandoutputfrequenciesareall1.9GHzasshown.TheparameterGC_XdB=1meansthatthetestwillbefor1dBcompression.Later,ifyouwanted3or6dBcompression,simplychangethevalue.
d. IntheSimulationSetup,changetheDatasetnametohb_xdbandthenSimulate.
e. Whenthedatadisplayopens,insertalistofofinpwrandoutpwr.Theneditdirectlyontheonthelistbyinsertingabracketedone[1]after[1]aftereachdataitemasshownhere.IfIfdesired,titletheplotasshown.Youjustjustperformeda1dBgaincompressiontestintestinonlyafewseconds!Becausethisamplifierisbiasedquitehigh,the1dBcompressionpointoccurswhentheinputinputpowerisabout–30dBmasshownhere.here.Inthenextsteps,youwillmodifythetheschematicandsetupapowersweepwithwithharmonicbalance–anotherwaytotesttestcompression!
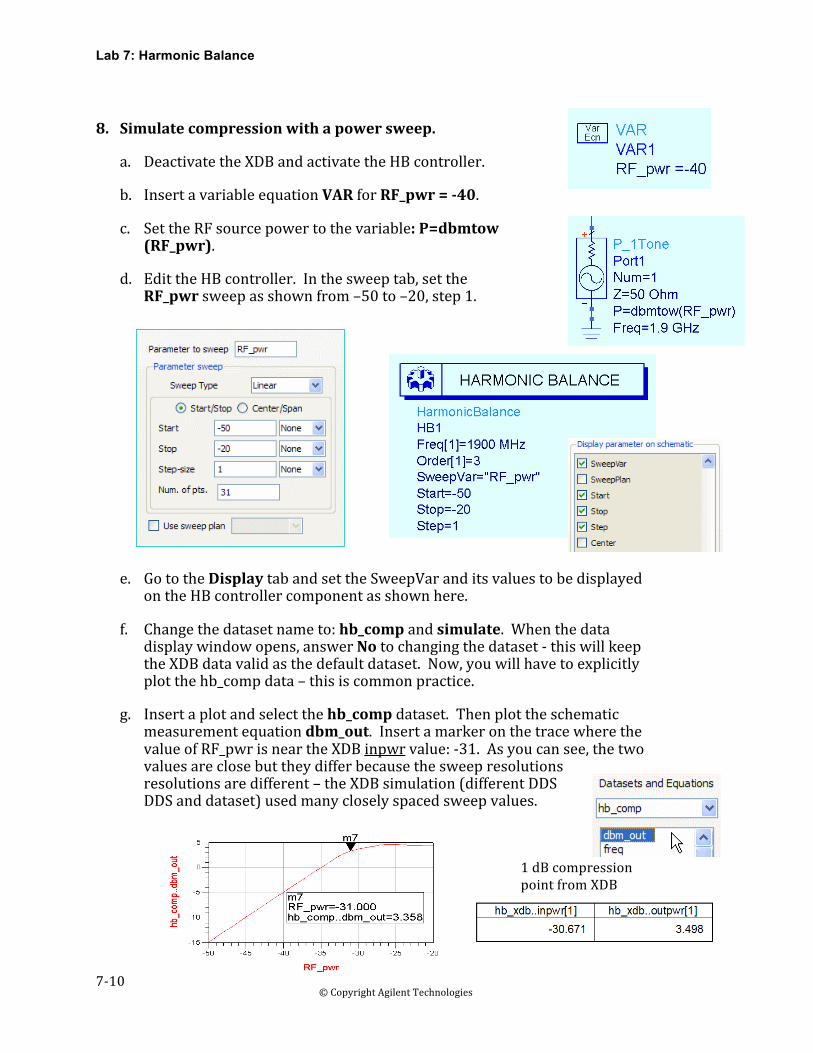
c. SettheRFsourcepowertothevariable:P=dbmtow(RF_pwr).
d. EdittheHBcontroller.Inthesweeptab,settheRF_pwrsweepasshownfrom–50to–20,step1.
e. GototheDisplaytabandsettheSweepVaranditsvaluestobedisplayedontheHBcontrollercomponentasshownhere.
f. Changethedatasetnameto:hb_compandsimulate.Whenthedatadisplaywindowopens,answerNotochangingthedataset‐thiswillkeeptheXDBdatavalidasthedefaultdataset.Now,youwillhavetoexplicitlyplotthehb_compdata–thisiscommonpractice.
g. Insertaplotandselectthehb_compdataset.Thenplottheschematicmeasurementequationdbm_out.InsertamarkeronthetracewherethevalueofRF_pwrisneartheXDBinpwrvalue:‐31.Asyoucansee,thetwovaluesareclosebuttheydifferbecausethesweepresolutionsresolutionsaredifferent–theXDBsimulation(differentDDSDDSanddataset)usedmanycloselyspacedsweepvalues.
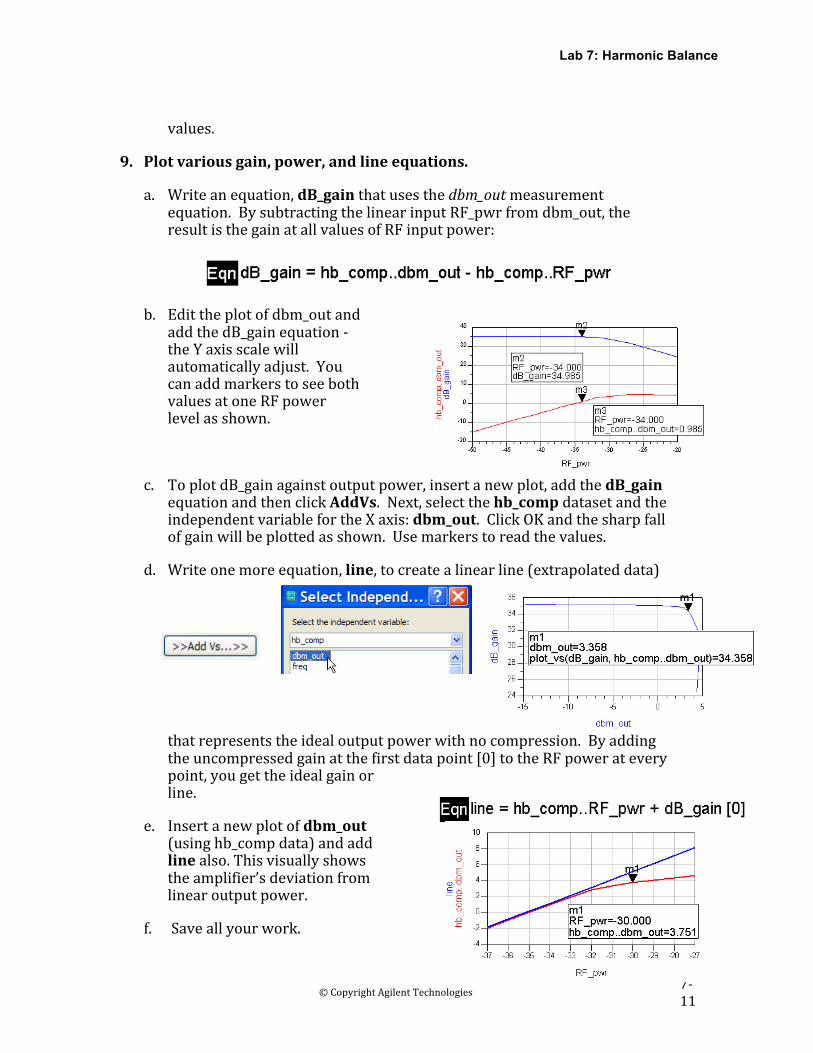
a. Writeanequation,dB_gainthatusesthedbm_outmeasurementequation.BysubtractingthelinearinputRF_pwrfromdbm_out,theresultisthegainatallvaluesofRFinputpower:
b. Edittheplotofdbm_outandaddthedB_gainequation‐theYaxisscalewillautomaticallyadjust.YoucanaddmarkerstoseebothvaluesatoneRFpowerlevelasshown.
c. ToplotdB_gainagainstoutputpower,insertanewplot,addthedB_gainequationandthenclickAddVs.Next,selectthehb_compdatasetandtheindependentvariablefortheXaxis:dbm_out.ClickOKandthesharpfallofgainwillbeplottedasshown.Usemarkerstoreadthevalues.
d. Writeonemoreequation,line,tocreatealinearline(extrapolateddata)
c. ChangethesourcetoaP_nTone.Editthesourcesothatithastwotones:Freq[1]and[2]withRF_pwrforeachasshownhere.
d. EdittheHarmonicBalancecontrollerasshownherebyaddinganotherfrequency,Freq[2],andthevaluesasshown,usingthespacingvariable/2.Also,setOrder=4forbothandsetMaxOrder=8.Inthiscase,thetwoRFtonesarespaced5MHzapart(channelspacing).
e. RemovetheRF_pwrsweepfromthecontrollerbyerasingiton‐screenorinthedialoganddisplay.Also,removeanyothercontrollersorunwantedcomponentsandsavethedesignagain.
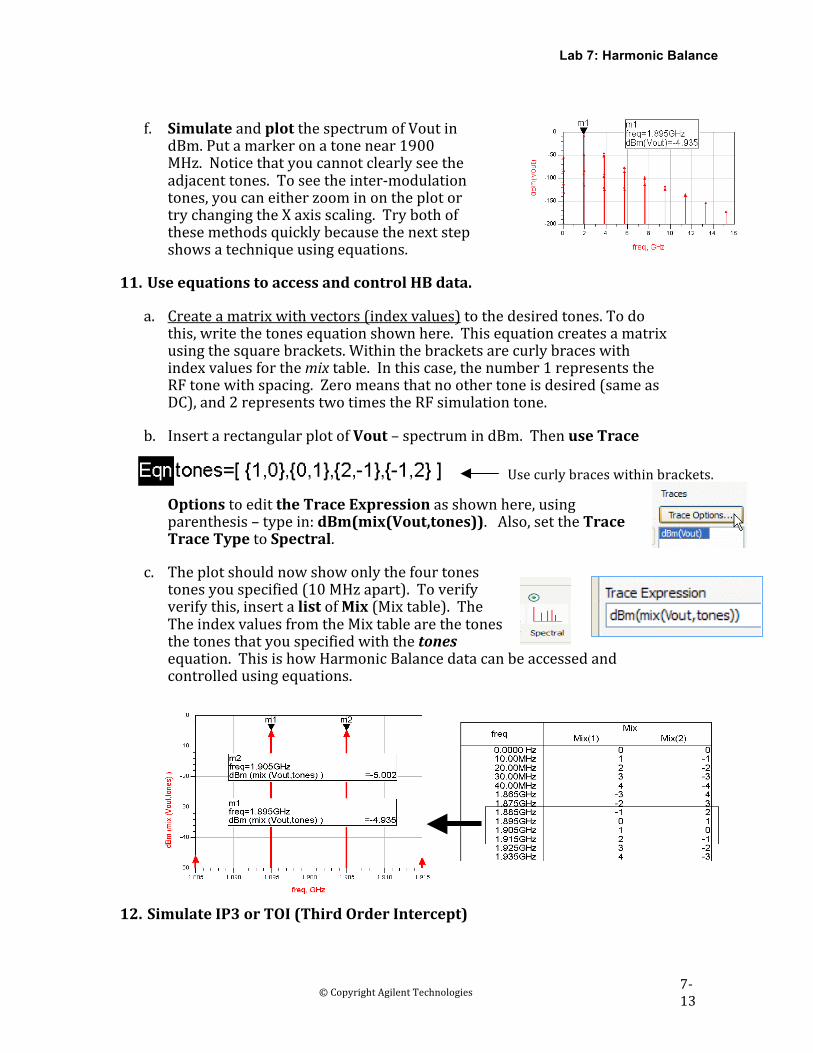
f. SimulateandplotthespectrumofVoutindBm.Putamarkeronatonenear1900MHz.Noticethatyoucannotclearlyseetheadjacenttones.Toseetheinter‐modulationtones,youcaneitherzoominontheplotortrychangingtheXaxisscaling.Trybothofthesemethodsquicklybecausethenextstepshowsatechniqueusingequations.
11. UseequationstoaccessandcontrolHBdata.
a. Createamatrixwithvectors(indexvalues)tothedesiredtones.Todothis,writethetonesequationshownhere.Thisequationcreatesamatrixusingthesquarebrackets.Withinthebracketsarecurlybraceswithindexvaluesforthemixtable.Inthiscase,thenumber1representstheRFtonewithspacing.Zeromeansthatnoothertoneisdesired(sameasDC),and2representstwotimestheRFsimulationtone.
b. InsertarectangularplotofVout–spectrumindBm.ThenuseTrace
c. Theplotshouldnowshowonlythefourtonestonesyouspecified(10MHzapart).Toverifyverifythis,insertalistofMix(Mixtable).TheTheindexvaluesfromtheMixtablearethetonesthetonesthatyouspecifiedwiththetonesequation.ThisishowHarmonicBalancedatacanbeaccessedandcontrolledusingequations.
a. Onthehb_2Toneschematic,inserttwoHarmonicBalanceIP3outmeasurementequations:onefortheupperandoneforthelowerspacedtone.Manymeasurementsrequiretwo‐tonessonametheinstancesupperandlowerasshownhere.
b. Notethedefaultnodelabel(vout),vectors{1,0},andimpedance50.Tomatchthesevaluestoyourcircuit,changevouttoVout(uppercaseV).ThensettheindexvaluestocorrespondtoyourMixtableshownherefromthelastsimulation(onlylower_toineedstochange).
c. ChecktheequationstobesuretheyarecorrectandthenSimulate.
d. IntheDataDisplay,listthetwomeasurementequationvaluesasshownhere.RemovetheindependentvariableusingPlotOptions.HeretheamplifierTOIvaluesappearreasonableandalmostsymmetrical.
e. AsanexerciseincontrollingdatawithADSfunctions,writeanequationintheDataDisplayforthesamemeasurementasshownhere.Thenlistit(my_toi)asshownhere.Yougetthesameresultsbecauseyouusethesamefunction:ip3_out.Theonlydifferenceisthatthisisafterthesimulation.Also,thisequationisusedintheoptionalstepattheendofthislab.
f. PlotthespectrumofVoutindBmandthenzoominontheplottoseethetwotonesyoujustsimulated.Putmarkersontheupperfundamentalandthe3rdordertone–theseshouldmatchthefrequencyvaluesintheMixtable.
a. Usingthesamehb_2Tonedesign,setuptheHBsimulationcontrollertosweeptheRFpowerasshownherefrom–45to–30dBm.Youalreadytested1dBcompression(about–31dBmRFinputpower)andyoujustfinishedmeasuringTOIwhich(about15dBm).
b. Simulateandwatchthechangesinthedatadisplay.
c. Editthemy_toilisttoincludetheindependentdata(RF_pwr).Thenincreasethelistsizesothatallthevaluesappear.Asyoucansee,TOIbeginstochangegreatlyasRF_pwrmoveshigher.However,thechangeisnotlinear.Thenextstepwillshowthiswithmorerefinement.
d. Changethelistofmy_toitoarectangularplot(PlotOptions‐clicktheplottypeicon).Then,onthesameplot,insertVoutindBmandeditthetraceexpressiontoreturntheupperRFtoneasshownhere.NowyoucanseehowtheTOImeasurementtrackswiththattone:
e. AddonemoreVouttracetotheplot.Again,editthetrace(TraceExpression)sothatisbecomestheupper3rdorderproduct:
dBm(mix(Vout,{2,1}))
f. Yourplotshouldnowlookliketheoneshownhere.ItshouldcontaintheupperRF_freq,theupper3rdorderproduct,andtheequationmy_toi(uppertoi).Now,editthemy_toitraceandselectPlotAxesasshownhere.ThenselectRightYaxisforthistraceandwatchthechange.
g. YourplotshouldnowhavetheTOIvaluefromyourequationontheRightYaxisandthetwotonesusedtocalculateTOIontheleft.Now,usePlotOptions,selectYAxis,andremovetheAutoScale(uncheckthebox).ThenincreasetheMaxto10andclickOK.Finally,placeamarkeronthepointwheretheslopeofthetwotonesisnolonger3:1.Asyoucansee,IP3wascalculatedinthecorrectregion.However,afterthemarker,the3rdorderproductbeginstoriseatasharperrate.ThisisagoodexampleofusingADStolearnmoreabouttheperformanceofyourdesign,beyondthespecification.