CMPEN270 – Digital Design Lab Lab8 – Clock Divider Penn State Erie, The Behrend College 1 Discussion The purpose of this lab is to understand the principle of a clock divider and be able to design a clock divider to meet a particular clocking frequency requirement. The concept of hazards will be explored in order to demonstrate the need to gate the outputs of combinational logic circuits before feeding them into sequential circuits. The fundamental component utilized in all the experiments in this lab is the 28-bit counter whose entity description is given in Listing 1. entity Counter generic(N: integer:=4); port( clk,reset : in std_logic; cw: in std_logic; q : out std_logic_vector(N-1 downto 0)); end Counter; Listing 1: The entity description of the counter used in Lab 8. The counter’s Q output increments on every rising edge of the clock when reset=1 and cw=1. A rising edge of the clock is a transition from logic 0 to logic 1. Table 1 lists all possible combinations of inputs to the counter and their effect on the output Q+. res et clk c w Q+ 0 x x 0 1 0,1,fal ling x Q 1 rising 0 Q 1 rising 1 Q+ 1 Table 1: The truth table describing the behavior of the counter in Listing 1. Note that Q+ is the value that the counter will have after the rising edge of the clock. For example if Q=0101 2 and the counter was about to count-up then Q+ = 0110 2 . 1
Transcript
CMPEN270 – Digital Design LabLab8 – Clock Divider
Penn State Erie, The Behrend College
1 DiscussionThe purpose of this lab is to understand the principle of a clock divider and be able to design a clock divider to meet a particular clocking frequency requirement. The concept of hazards will be explored in order to demonstrate the need to gate the outputs of combinational logic circuits before feeding them into sequential circuits. The fundamental component utilized in all the experiments in this lab is the 28-bit counter whose entity description is given in Listing 1.
entity Counter generic(N: integer:=4); port( clk,reset : in std_logic;
cw: in std_logic; q : out std_logic_vector(N-1 downto 0));
end Counter;
Listing 1: The entity description of the counter used in Lab 8.
The counter’s Q output increments on every rising edge of the clock when reset=1 and cw=1. A rising edge of the clock is a transition from logic 0 to logic 1. Table 1 lists all possible combinations of inputs to the counter and their effect on the output Q+.
reset clk cw Q+0 x x 01 0,1,falling x Q1 rising 0 Q1 rising 1 Q+1
Table 1: The truth table describing the behavior of the counter in Listing 1.
Note that Q+ is the value that the counter will have after the rising edge of the clock. For example if Q=01012 and the counter was about to count-up then Q+ = 01102.
A clock divider is a circuit which takes as input a high frequency clock source and generates a slower clock frequency as an output. The ratio between the input clock frequency and the output clock frequency is called the frequency divisor.
There are two main ways to build clock dividers, using a counter or using a counter and comparator. Both of these methods are examined in this lab using the circuit shown in Figure 1. The frequency divisor for a clock divider constructed from just a counter is always a power of 2. For example you could generate a 250,000Hz clock signal from a 4,000,000Hz source using the most significant bit of a 4-bit counter. A clock divider built using a counter and a comparator can have any integer frequency divisor. For example, you could generate a 255,397Hz clock signal from a 4,000,000Hz clock source using a 18-bit counter and an 18-bit comparator. From this discussion, it should be clear that the additional flexibility of the second type of clock divider comes at the expense of additional hardware.
1
Figure 1: The clock divider datapath used in lab 8. The pins of the CPLD are listed as “pxx’, where “xx” is the pin number.
2 PreLabThe clock signal shown in Figure 2 is typical; half of the time the clock is at logic 1 and half of the time it is at logic 0. This is referred to as a 50% duty cycle. Typically the clock source comes from a high frequency crystal oscillator. On our PLTD-3 board there is a metallic 4Mhz clock available in the upper left corner of the board. Note that these are decimal hertz, so the crystal oscillates 4,000,000 times a second. Assume the clock signal in Figure 2 is driving the clock input of a 4-bit counter which operates according to Table 1.Complete the timing diagram in Figure 1.
Figure 2: A timing diagram of a 4-bit counter.
2
After completing the timing diagram in Figure 2, complete Table 2. Use the values for the first four rows of Table 2 to extrapolate the frequencies for q16, q20, and q24.
period Frequencyclk 4,000,000 hzq0q1q2q3q16q20q24
Table 2: Properties of the waveforms in Figure 2.
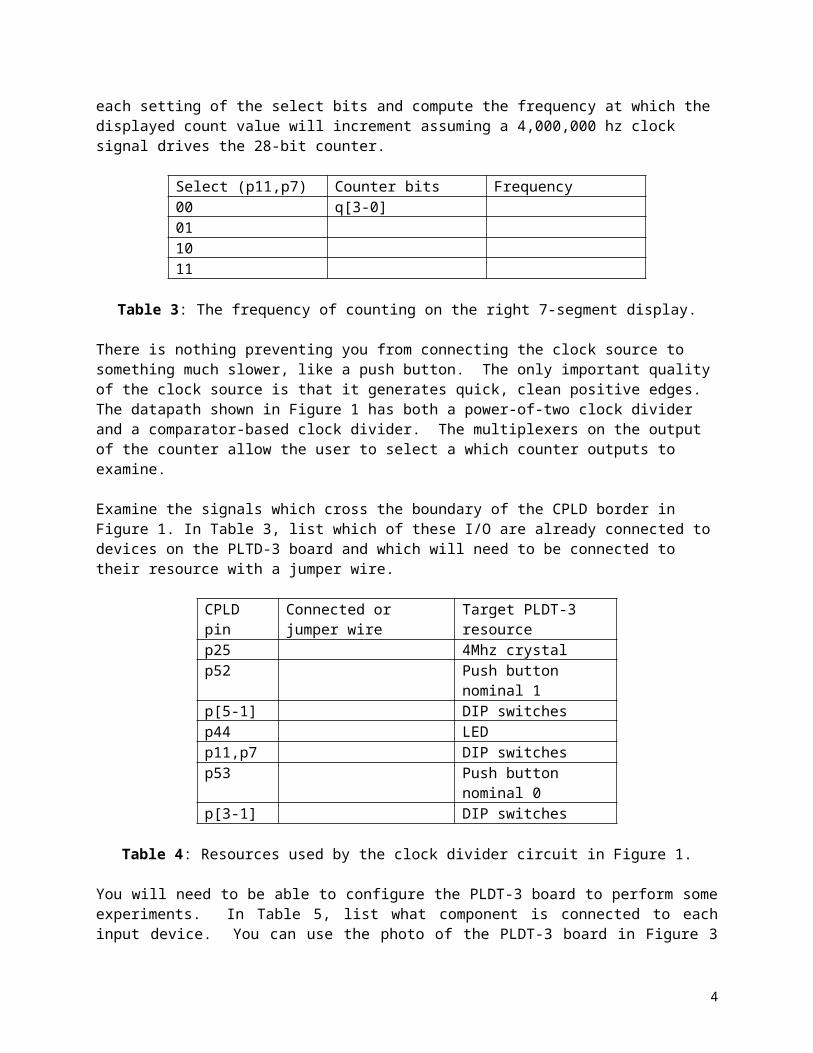
The left 7-segment display is connected to 4-bits of the counter. Switching p11 and p7 will change the rate at which the displayed count value increments. In Table 3 list which counter bits are selected for each setting of the select bits and compute the frequency at which the displayed count value will increment assuming a 4,000,000 hz clock signal drives the 28-bit counter.
Table 3: The frequency of counting on the right 7-segment display.
There is nothing preventing you from connecting the clock source to something much slower, like a push button. The only important quality of the clock source is that it generates quick, clean positive edges. The datapath shown in Figure 1 has both a power-of-two clock divider and a comparator-based clock divider. The multiplexers on the output of the counter allow the user to select a which counter outputs to examine.
Examine the signals which cross the boundary of the CPLD border in Figure 1. In Table 3, list which of these I/O are already connected to devices on the PLTD-3 board and which will need to be connected to their resource with a jumper wire.
Table 4: Resources used by the clock divider circuit in Figure 1.
You will need to be able to configure the PLDT-3 board to perform some experiments. In Table 5, list what component is connected to each input device. You can use the photo of the PLDT-3 board in Figure
3
3 to determine the connections of the buttons. For each input device describe, in the “Effect when pressed/toggled” column, what effect manipulating the input device will have on the clock divider datapath shown in Figure 1.
CPLD pin Connection in datapath Effect when pressed/toggledRight-most 5 toggle switchesLeft-most 2 toggle switchesRed push button (p53)Black push button (p52)
Table 5: Switches and their effect on the configuring the PLDT-3.
A glitch is a momentary deviation from the correct logic output. Glitches are especially common on the outputs of circuits built using a bit-slice methodology like comparators. If an output which glitches is attached to an edge sensitive input like a clock, then its quite possible that several clock events will be sensed by the edge sensitive input when only a single edge was intended. In order to isolate a circuit from a glitching signal it is sufficient to place a flip flop between the glitching signals and an intended source. The reason that this works is that the glitches are momentary deviations with duration much less than a clock cycle. This allows the offending signal to stabilize before the next clock edge arrives, which will latch the now stabilized signal value into the state of the flip flop.
3 InLabThe datapath shown in Figure 1 is available as a precompiler module, lab8.jed, on the class web page. Download the lab8.jed file posted and program the CPLD on the PLTD-3 boards. Do this by launching the iMPACT and then proceed as usual. Wire up the buttons and crystal according to Figure 3.
Figure 3: The PLDT-3 board configured for Lab8.
4
After the program is downloaded experiment with the switches and clock sources to see how they affect the count rate displayed on the 7-segment display.
While you could get reasonable measurements on the clock frequency using a watch, to get meaningfully accurate measurements you need to use some instrumentation in the lab – the oscilloscope. Connect the ground lead of the Oscilloscope to a ground pin on the PLDT-3 board and connect the probe lead to P44. Use the switches to select the counter outputs listed in Table 6. Use the calculations from Table 2 to fill in the frequencies in the Theoretical column. Use the frequency measuring capability of the O’scopes to complete the Measured column. Compute the % error as the difference between the two measurements divided by the theoretical value.
Table 6: The theoretical and measured frequencies of the 28-bit counter.
There will be times when its tempting to use the output of a comparator as clock input of a counter as shown in Figure 1. As discussed in the prelab, the problem with this is that a comparator’s outputs are prone to glitching. If a glitching signal were connected to a counters clock input when it was told to count up, the counter would count up several times for each “positive edge”. Use the dip switches connected to the mux in order to switch between the various clocking sources. In Table 7 record is an output does or does not glitch. If an output glitches, use the count rate to determine how many positive edges it produces on each glitch.
Clock Source Glitch How many edgesGFFGLFFLEFFE
Table 7: The glitching behavior of a comparator output.
4 Lab ReportEach team of two students will turn in a single lab report with a cover page and both pre-labs stapled to the back of the report. The scoring rubric of the lab is given in Table 8.


![Lab8 - Texas Christian Universitycsfaculty.tcu.edu/10403/NLab8/Lab8.pdf · Lab8 will use a Java one-dimensional array to construct a an array from collection of ( i.e. BMIUsers[]).](https://static.documents.pub/doc/80x56/5ed831120fa3e705ec0e019e/lab8-texas-christian-lab8-will-use-a-java-one-dimensional-array-to-construct-a.jpg)
