34
2015 Labour Market Plan A Multi-Year Plan for Labour Market Development in Hamilton October 2015
| Date post: | 27-Jul-2016 |
| Category: |
Documents |
| Upload: | cyndi-ingle |
| View: | 217 times |
| Download: | 0 times |

2015Labour Market PlanA Multi-Year Plan for Labour Market Development in Hamilton
October 2015

Workforce Planning Hamilton | 2015 Labour Market Plan
Acknowledgments Workforce Planning Hamilton would like to acknowledge our partners and other key stakeholders for their contributions to this report. The labour market intelligence presented here is much richer because of your contributions. WPH would also like to thank our partners from across the community for their collective and individual action in support of the priorities.
Contact WPH to obtain this report in a larger print format.
This Employment Ontario project is funded by the Ontario Government.
This document may be freely quoted and reproduced without obtaining the permission of Workforce Planning Hamilton provided that no changes whatsoever are made to the text and Workforce Planning Hamilton is acknowledged as author. The information presented in this report is current at the time of printing.
The views expressed in this document do not necessarily reflect those of the Government of Canada or the Government of Ontario.
a member of
2015Labour Market PlanA Multi-Year Plan for Labour Market Development in Hamilton

Workforce Planning Hamilton | 2015 Labour Market Plan
Executive Summary ....................... 4
Overview of the Plan and its Objectives .......................................
Methodology: The Labour Market Planning Process ..................
Update of Hamilton’s Labour Market Conditions ......................... 8
Trends Over Time: Unemployment, Employment and Participation ........................ 8
Migration Characteristics ...... 10
Top Industries by Employment ............................... 11
Top Occupational Groups by Employment ......................... 12
Job Postings Data ..................... 14
Skill Level ..........................................
Canadian Business Patterns Data ..................................
Labour Supply Analysis of Job Seeking Clients ...................... 17
Employer Consultations....................
Update on Local Labour Market Plan 2014-2015 ....................
Priorities and Actions for 2015-2017 ......................................
Conclusion ...........................................
Appendix A – Employment and Training Agencies Consulted for Analysis of EO Data................ 33
Appendix B – List of Participating Service Organizations in Community Consultation ............ 35
List of Figures
Figure 1 Labour Force showing Employment Levels, Unemployment Levels and Unemployment Rates, Hamilton CMA, Annual Average, 2008-2014 ...................................... 9
Figure 2 Participation Rates, Employment Rates, and Unemployment Rates, Hamilton CMA, Annual Average, 2008-2014 ...................................... 9
Figure 3 Number of Job Postings by Month, Hamilton, 2014 (Vicinity Data); Unemployment Rate, Hamilton, 2014 ............................. 13
Figure 4 Job Postings by Skill Level in Hamilton, 2014 ............... 14
Figure 5 Clients by Age, Hamilton, 2012-2015 .................... 18
Figure 6 Clients by Designated Groups (Self-Identified), Hamilton, 2012-2015 .................... 19
List of Tables
Table 1 Migration Characteristics by Age Groups, 2008 to 2013, Hamilton ............................. 10
Table 2 Top 10 Industries by Employment, Hamilton CMA ................................................ 11
Table 3 Top 10 Occupational Groups By Employment, Hamilton CMA .............................. 12
Table 4 Top 10 Occupations by Job Postings, Hamilton, 2014 ................................................ 13
Table 5 Hamilton Businesses With/Without Employees, June 2015 ........................................ 14
Table 6 Hamilton Businesses by Employee Size Range, June 2015 ...................................... 15
Table 7 Hamilton’s Top Industries by Number of Businesses with Employees, June 2015 ...................................... 15
Table 8 Hamilton’s Sectors by Number of Businesses with and without Employees, June 2015 ........................................ 16
Table 9 Hamilton’s Top Industries by Businesses Without Employees, June 2015 ...................................... 17
Table 10 Overview of Client Data, Hamilton, 2012-2015 ....... 17
Table 11 Clients by Education Level, Hamilton and Ontario, 2012-2015 .................................... 17
Table of Contents

Workforce Planning Hamilton | 2015 Labour Market Plan4
Executive SummaryWorkforce Planning Hamilton’s (WPH) 2015 Labour Market Plan (LMP) involves revisiting our multi-year plan that was established last year with full support from key labour market stakeholders. Our annual LMP is the result of WPH’s evidence-based planning process that documents Hamilton’s current labour market conditions and annually updates a plan that captures key labour market issues and priority actions. The LMP identifies the need for collaborative action from education and training institutions, businesses, industry associations, labour, as well as government. Meeting current and future labour market needs requires our collective attention and absolute efforts.
Looking at current trends, it is becoming increasingly clear that Hamilton has emerged from the recession of the late 2000s. There are many new construction projects completed or underway. From the new Light Rail Transit announcement earlier this year, to the increasing number of condo towers under construction in the core, as well as McMaster’s investment in the new Continuing Education Centre and the David Braley Health Sciences Centre also in the downtown, Hamilton’s economy continues to perform well. In fact, according to a Colliers International Report1 released earlier in 2015, Hamilton is the best place to invest for businesses. It has many key attributes such as affordable commercial properties and is recognized as having a well-educated labour force.
Examining the top 10 industries by employment in the city yields a great deal of information about the local labour market and showcases the diversity of the economy as the top ten include a representation of both goods and service producing sectors. Data from Statistics Canada shows that Trade (retail and wholesale) continues to be the top industry of employment in Hamilton, representing 16% of all employment. Health care and social assistance is the second most employed industry (12% of all employment) only slightly above Manufacturing. This is a recent shift, and it shows the ever increasing importance of the health care sector. Together these three industries are very important to our local economy as they employ 40% of all people working.
A recent report by Workforce Planning Hamilton, Putting the Puzzle Together: Skills Alignment in Hamilton’s Transforming Economy, shows that the skill levels of prevalent occupations are increasing. From 2001-2011 employment in occupations requiring post-secondary education increased over 10% in Hamilton. Almost two-thirds (60.6%) of labour demand in Hamilton requires a postsecondary level of education. Sectors showing the greatest evidence of skills mismatch include Manufacturing; Health Care and Social Assistance; Professional, Scientific and Technical Services; Finance Insurance, Real Estate, Leasing and Construction.
An ever-increasing number of job seeking clients are using Employment Services (ES) and Literacy and Basic Skills (LBS) programs. The largest increases are over the three year period, where ES clients have grown by 41.1% and LBS clients have grown by 31.1%. Service providers attribute this increase to the increased marketing and increased awareness of services especially among youth due to programs such as the Youth Employment Fund.
Looking at current
trends, it is becoming
increasingly clear that
Hamilton has emerged
from the recession of the
late 2000s.
1 Colliers International, Cities of Opportunity (August 2015).

5Workforce Planning Hamilton | 2015 Labour Market Plan
Understanding employer needs is vital to the labour market planning process and WPH’s annual employer survey provides valuable information on the current labour market demand.
• Hamilton employers have a positive outlook as almost half of all respondents see their organization growing and 87% plan on hiring in the next year. 92% hired at least one position in the past year.
• 22% of employers said skills requirement will increase by a significant extent in five years, and 60% said it would increase by a moderate extent.
• The majority of employers find recruitment a somewhat challenging issue, and about a third find it very challenging.
• The most commonly cited occupations in demand were: IT professionals; Journeypersons and Apprentices; Labourers in manufacturing; Administrative support workers; Customer service representative.
WPH established key priorities in the fall of 2014 and has been working with partners to move a variety of initiatives forward to address these key labour market challenges. Once again we hosted partners from across the community at a Labour Market Plan consultation to consider the priorities and the progress on the action plan. Based on the evidence presented and their knowledge of the local labour market there was agreement that the priorities established in 2014 were still valid. Revisions and adjustments to the action plan were recorded.
SOFT SKILLS DEVELOPMENTIdentified need in building fundamental soft skills for new labour market entrants and those with barriers to employment.
DESIGNATED GROUPS ENGAGEMENT WITH THE LABOUR MARKETDesignated groups (including youth, immigrants, persons with disabilities, visible minorities and Aboriginals) face specific and unique challenges to finding employment.
UNDERSTANDING INCREASING AND EVOLVING SKILLS REQUIREMENTSTechnological advancement across all industries requires multi-skilled workers at all levels who are adaptable, flexible and willing to learn.
EXPLORING OPPORTUNITIES IN HAMILTON’S DIVERSIFYING ECONOMYBroaden job seekers’ awareness of the growth of opportunities of SMEs and different work environments (including part-time, contract and shift- work) through labour market information and other resources.
Hamilton’s Multi-Year Labour Market Priorities
WPH thanks all partners and stakeholders for their contribution to this report and looks forward to the opportunities it presents for collaborative action.
Business, Labour & Community:Planning for Prosperity

Workforce Planning Hamilton | 2015 Labour Market Plan6
Overview of the Plan and its Objectives As Hamilton’s economy modifies and adapts to local and global forces it is important to take time to consider our workforce needs. Manufacturing, once a key driver in the local economy, had been supplanted by a diverse array of sectors that require new and different skill sets. Advanced Manufacturing still plays a critical role in the city, but many emerging clusters such as the Creative Industries and Clean Technology are becoming increasingly important here in Hamilton. The downtown core also continues its renaissance where many small businesses are opening and the expanding arts scene continues to draw in people from outside of the community.
This evolution in our local economy makes it more important than ever to have accurate local labour market information. Making sure that the skills of Hamilton’s workforce are properly aligned to meet the needs of its employers is crucial. The annual Labour Market Plan (LMP) is the result of Workforce Planning Hamilton’s evidence-based planning process that documents Hamilton’s current labour market conditions and annually updates a plan that captures key labour market issues and priority actions.
The 2015 LMP involves revisiting our multi-year plan that was established last year with full support from key labour market stakeholders. It is important to note that the LMP does not belong to government, nor does it belong to any particular group or organization. There is a need for collaborative action from education and training institutions, businesses, industry associations, labour, as well as government. Meeting current and future labour market needs requires our collective attention and absolute efforts.
Workforce Planning Hamilton thanks those who helped to make this report possible. Without the input from employers and the employment and training community, this plan would not be possible.
Advanced Manufacturing
still plays a critical role
in the city, but many
emerging clusters
such as the Creative
Industries and Clean
Technology are becoming
increasingly important
Mission: WPH is a leader in local workforce development providing evidence-based analysis and engaging a broad range of labour market stakeholders.
Vision: WPH is a leader in transforming local labour market information into workforce planning solutions that contribute to a prosperous and diverse Hamilton community.
Workforce Planning Hamilton (established 1997) is a catalyst for economic and labour market development, building solutions and engaging multi-stakeholder alliances. To achieve results for our community in the area of labour market development we work in partnership with a broad range of stakeholders including business, labour and other community partners. We are a member of Workforce Planning Ontario, a network of 26 labour market planning regions covering Ontario. WPH is funded by Employment Ontario – the Ministry Training, Colleges and Universities.
Visit our website www.workforceplanninghamilton.ca to review our many research reports, project activities and other publications.
ABOUT Workforce Planning Hamilton

7Workforce Planning Hamilton | 2015 Labour Market Plan
Methodology: The Labour Market Planning Process The planning process for the 2015 Labour Market Plan involved analysis of local labour market indicators, as well as consultations from key stakeholders in the community. The key stages of the planning process are outlined here.
Update on Hamilton’s current labour market conditions An ongoing literature review, combined with a comprehensive data analysis, gives an evidenced-based foundation on which to base key stakeholder consultations. The following data sources were used to develop the update of the labour market: Labour Force Survey, 2015 Hire Learning Survey, Canadian Business Patterns Data, and Vicinity Jobs’ online job vacancies
Labour supply analysis of job-seeking clientsFor the third year, the Ministry of Training, Colleges and Universities provided WPH with aggregated client data from the Employment Ontario system for the year April 2014-March 2015. WPH used this data to form the basis for a discussion with employment and training service providers about local service issues including gaps, overlaps, and underserved populations. The issues identified through the labour supply analysis were brought forward with the employer consultations results to the community event in September 2015 to plan coordinated actions to address the issues.
Employer consultations A part of WPH’s priority around exploring opportunities in Hamilton’s diversifying economy, WPH surveyed employers across Hamilton through the annual Hire Learning Survey. The Hire Learning Survey collects information on a range of labour issues, such as labour turnover, hard-to-fill positions, recruitment difficulties, current and future skills shortages, as well as any issues in training and education practices.
Community consultationWPH hosted the broad employment and training community for a consultation held in September 2015. Representatives from community stakeholder organizations attended the consultation. This year we reviewed the four key priorities outlined last year and adjusted the plan based on feedback from the community.
1
2
3
4

Workforce Planning Hamilton | 2015 Labour Market Plan8
UPdATe Of HAMILTOn’s LABOUr MArkeT COndITIOns
Update of Hamilton’s Labour Market Conditions Workforce Planning Hamilton takes an evidence-based approach to labour market planning. Our first step in updating the plan is to review key annual labour market indicators. This data was used as a guide for consultations with community stakeholders. An overview of key indicators and trends is presented here.
Looking at current trends, it is becoming increasing clear that Hamilton has emerged from the recession of the late 2000s. There are many new construction projects completed or underway. From the new Light Rail Transit announcement earlier this year, to the increasing number of condo towers under construction in the core, as well as McMaster’s investment in the new Continuing Education Centre and the David Braley Health Sciences Centre also in the downtown, Hamilton’s economy continues to perform well. In fact, according to a Colliers International Report1 released earlier in 2015, Hamilton is the best place to invest for businesses. It has many key attributes such as affordable commercial properties and is recognized as having a well-educated labour force.
A recent Conference Board of Canada report2 noted that Hamilton will have one of the highest growth rates compared to other communities in the province. Commencing with the cluster approach taken in the early 2000s, the diversification of Hamilton’s economy has had a positive impact on employment opportunities.
Labour Market Trends over Time: Unemployment, Employment and Participation Hamilton’s unemployment rate has been steadily decreasing since the recession in 2009. In fact, it is the lowest it has been in ten years. The community is seeing a growing labour force (people who are either employed or looking for work). In the Hamilton CMA the number of people employed has increased from 374,800 in 2013 to 383,700 in 2014.
1 Colliers International, Cities of Opportunity (August 2015).2 Conference Board of Canada, Economic Insights Into 13 Metropolitan Economies (Spring 2015).
Hamilton is the
bestplace to invest for
businesses

9Workforce Planning Hamilton | 2015 Labour Market Plan
Figure 1. Labour Force showing Employment Levels, Unemployment Levels and Unemployment Rates, Hamilton CMA, Annual Average, 2008-2014 (Labour Force Survey)
For a number of years we have observed that while the labour force and employment is growing, when population growth is factored in, the labour force participation and employment rates have been declining. This can be attributed to a number of factors including an aging population and a decline in youth participation in the labour force. In 2014, as shown in Figure 2, the labour force participation and employment rates actually increased for the first time since the recession. This is more evidence that Hamilton’s economy is on the rebound as the labour market continues to gain momentum.
When compared to the experience of the province overall, the Hamilton labour market is seen in an even better light. For Ontario in 2014 the labour force and employment rates continued to fall. The labour force participation rate (65.8%) is at its lowest point ever since the 2000s. The unemployment rate for Ontario, while having decreased since the recession, is still higher than Hamilton’s unemployment rate (7.3% vs 5.8%). It has yet to recover to pre-recession levels.
Figure 2. Participation Rates, Employment Rates, and Unemployment Rates, Hamilton CMA, Annual Average, 2008-2014 (Labour Force Survey)
8
Labour Market Trends over Time: Unemployment, Employment and Participation Hamilton’s unemployment rate has been steadily decreasing since the recession in 2009. In fact, it is the lowest it has been in ten years. The community is seeing a growing labour force (people who are either employed or looking for work). In the Hamilton CMA the number of people employed has increased from 374,800 in 2013 to 383,700 in 2014. Figure 1. Labour Force showing Employment Levels, Unemployment Levels and Unemployment Rates, Hamilton CMA, Annual Average, 2008-2014 (Labour Force Survey)
For a number of years we have observed that while the labour force and employment is growing, when population growth is factored in, the labour force participation and employment rates have been declining. This can be attributed to a number of factors including an aging population and a decline in youth participation in the labour force. In 2014, as shown in Figure 2, the labour force participation and employment rates actually increased for the first time since the recession. This is more evidence that Hamilton’s economy is on the rebound as the labour market continues to gain momentum.
When compared to the experience of the province overall, the Hamilton labour market is seen in an even better light. For Ontario in 2014 the labour force and employment rates continued to fall. The labour force participation rate (65.8%) is at its lowest point ever since the 2000s. The unemployment rate for Ontario, while having decreased since the recession, is still higher than Hamilton’s unemployment rate (7.3% vs 5.8%). It has yet to recover to pre-recession levels.
370.3 369.8 369.1 375.1 376.6 374.8 383.7
23.9 34.2 31.4 26.3 26.8 25.8 23.7
6.1%
8.5%7.6%
6.6% 6.6% 6.4%5.8%
0.0%
2.0%
4.0%
6.0%
8.0%
10.0%
300
350
400
450
500
2008 2009 2010 2011 2012 2013 2014
Une
mpl
oym
ent R
ate
Empl
oym
ent (
Thou
sand
s)
Employment Unemployment Unemployment rate
9
Figure 2. Participation Rates, Employment Rates, and Unemployment Rates, Hamilton CMA, Annual Average, 2008-2014 (Labour Force Survey)
Migration Characteristics
Table 1. Migration Characteristics by Age Groups, 2008 to 2013, Hamilton (Taxfiler)
Age Group In-migrants Out-migrants Net-migrants
0-17 20,661 15,760 4,901 18-24 13,606 11,061 2,545 25-44 40,805 33,567 7,238 45-64 16,295 14,643 1,652 65+ 6,075 6,010 65
Total 97,442 81,041 16,401
Migration characteristics show positive growth for Hamilton’s population. From 2008-2013 Hamilton has seen a total of 16,401 net-migrants. All age groups saw an increase in the number of net-migrants. Approximately 70% of net-migration in Hamilton comes from people of typical working age (18-64 years), with the other 30% of net-migration from children and youth who will contribute to a next generation workforce. In fact, the second largest increase in net-migrants (4,901) was from the 0-17 age group. It is important to note that Hamilton typically receives a steady number of new immigrants each year. Approximately 3,213 permanent residents came to Hamilton in 2013.
The top three source regions where the most people migrate from are: Halton (4532 people), Toronto (1984), and Peel (1934). Two of these three are also among the regions where most people from
66.5%
64.0%
62.4%60.3%
0.0%
2.0%
4.0%
6.0%
8.0%
10.0%
54.0%56.0%58.0%60.0%62.0%64.0%66.0%68.0%70.0%
2008 2009 2010 2011 2012 2013 2014
Une
mpl
oym
ent R
ates
Part
icip
atio
n an
d Em
ploy
men
t Ra
tes
Participation Rate Employment Rate Unemployment Rate

Workforce Planning Hamilton | 2015 Labour Market Plan10
Migration Characteristics
Migration characteristics show positive growth for Hamilton’s population. From 2008-2013 Hamilton has seen a total of 16,401 net-migrants. All age groups saw an increase in the number of net-migrants. Approximately 70% of net-migration in Hamilton comes from people of typical working age (18-64 years), with the other 30% of net-migration from children and youth who will contribute to a next generation workforce. In fact, the second largest increase in net-migrants (4,901) was from the 0-17 age group. It is important to note that Hamilton typically receives a steady number of new immigrants each year. Approximately 3,213 permanent residents came to Hamilton in 2013.
The top three source regions where the most people migrate from are: Halton (4532 people), Toronto (1984), and Peel (1934). Two of these three are also among the regions where most people from Hamilton migrate to: Halton (2431 people), Niagara (1816), and Toronto (1583). Most regions have a positive net in-migration.
Table 1. Migration Characteristics by Age Groups, 2008 to 2013, Hamilton (Taxfiler)
Age Group In-migrants Out-migrants Net-migrants
0-17 20,661 15,760 4,901
18-24 13,606 11,061 2,545
25-44 40,805 33,567 7,238
45-64 16,295 14,643 1,652
65+ 6,075 6,010 65
Total 97,442 81,041 16,401
Approximately
3,213permanent residents came to Hamilton in 2013.

11Workforce Planning Hamilton | 2015 Labour Market Plan
Top Industries by Employment
Examining the top 10 industries by employment in the city yields a great deal of information about the local labour market. Table 2 showcases the diversity of the economy as the top ten include a representation of both goods and service producing sectors.
Trade (retail and wholesale) continues to be the top industry of employment in Hamilton, representing 16% of all employment. Health care and social assistance is the second most employed industry (12% of all employment) only slightly above Manufacturing. This is a recent shift, and it shows the ever increasing importance of the health care sector. Together these three industries are very important to our local economy as they employ 40% of all people working.
The top three industries by employment all experienced slight declines in employment over the last 5 year period. This is because our time series begins in 2009. This was at the peak of employment for Hamilton, just prior to the recession and many industries were at their highest points of employment at that time. For 2015, we may move to a positive growth rate since the impact of the recession will no longer be a factor in this time series analysis.
Looking at year over year changes for these three industries shows that Trade grew by 4,100 people or 6.6%. Total employment in Hamilton grew by 8,900 and almost half of the growth came from this one industry sector. Manufacturing grew for the first time in 5 years, albeit by a small increase, 0.4%, This demonstrates that Manufacturing is still a key driver in Hamilton’s economy. Health declined in employment for the first time in four years, by 1,900 people or 4.0%.
Table 2. Top 10 Industries by Employment, Hamilton CMA (Labour Force Survey)
IndustryEmployment 2014 Annual
Average
% of Total Employment
% Change 2009-2014
Ontario % Change 2009-2014
Location Quotient
Trade (retail and wholesale) 62,400 16% -6% 4% 1.07
Health care and social assistance*
47,500 12% -1% 14% 1.07
Manufacturing* 46,800 12% -8% -3% 1.12
Educational services 29,500 8% 18% 10% 1.07
Professional, scientific and technical services*
29,300 8% 46% 17% 0.94
Construction 27,900 7% 16% 13% 1.07
Accommodation and food services
25,000 7% 3% 17% 1.00
Finance, insurance, real estate and leasing
21,900 6% -17% 7% 0.77
Business, building and other support services
19,300 5% 23% 20% 1.03
Transportation and warehousing*
19,000 5%-5% 4% 1.04
Total employed 383,700 100% 4% 7%
* denotes part of a City of Hamilton Economic Development key cluster

Workforce Planning Hamilton | 2015 Labour Market Plan12
Finance, insurance, real estate and leasing is the industry with the largest year-over-year decline losing almost one fifth of all its employment, 4,300 people. In last year’s LMP report this industry showed growth over the five year period 2008-2013 (9.5%), but this one year drop erased most of this growth.
Professional, scientific, technical services continue to be the fastest growing sector in Hamilton, as from 2009-2014 it grew significantly higher than Ontario (46% vs 17%). The next industry that saw the greatest growth was Business, building and support services (23%). This industry comprises of ‘Management of Companies and Enterprises’ (NAICS 55) and ‘Administrative and Support, Waste Management and Remediation Services’ industries. The year over year changes in growing and declining sectors illustrates the constant evolution of local labour markets.
Location Quotient (LQ) measure the degree of concentration of an industry in Hamilton compared to Ontario. A LQ of “1” means that the number of jobs in that industry in Hamilton is exactly the same proportion as found in Ontario as a whole. A LQ of “2” would mean that the industry has twice the proportion of jobs in Hamilton compared to Ontario, while “0.5” would mean half. Table 2 illustrates that Hamilton has a substantial greater employment concentration in many of the top 10 industries. The top three industries in Hamilton in terms of employment and Construction have the greatest employment concentrations compared to Ontario, with Manufacturing being the most at 1.12.
Top Occupational Groups by Employment Table 3. Top 10 Occupational Groups By Employment, Hamilton CMA (Labour Force Survey)
Occupational GroupEmployment 2014
Employment Average% Change 2009-2014
Ontario % Change 2009-2014
Sales and service occupations 99,000 7% 12%
Business, finance and administrative occupations 67,700 4% 3%
Trades, transport and equipment operators and related occupations
52,300 -3% 5%
Management occupations 36,100 1% -8%
Occupations in social science, education, government service and religion
33,000 3% 5%
Health occupations 28,000 -3% 17%
Natural and applied sciences and related occupations 26,300 16% 20%
Occupations unique to processing, manufacturing and utilities 21,800 0% 10%
Occupations in art, culture, recreation and sport 13,000 49% 7%
Occupations unique to primary industry 6,500 -21% 8%
Total employed, all occupations 383,700 4% 7%
Professional, scientific, technical services continue to be the growing sector in Hamiltonfastest

13Workforce Planning Hamilton | 2015 Labour Market Plan
Taking a closer look at the occupational make-up of Hamilton we note that Sales and service occupations continue to be the top occupational group in both Hamilton and Ontario. According to Table 3, approximately a quarter of all people working Hamilton work in sales and service jobs. Online job vacancy statistics also show that sales and service occupations are the most common type of job vacancy each quarter. This may speak to a high degree of churn (the number of people moving from job to job) of this occupational group. It also reflects the reality of the labour market, as it is one of the fastest growing occupational groups.
Locally Natural and applied sciences and related occupations had the second highest growth rate from 2009-2014 at 16% and employs 26,300 people. Most people in this occupation work in the Professional, scientific, technical services industry sector, which aligns with the 46% growth rate seen in the sector overall. According to the WPH report Putting the Puzzle Together: Skills Alignment in Hamilton’s Transforming Economy, 49.2% of the people in the Professional, scientific, technical services industry are university educated. This sector needs to be reviewed for potential skills shortages issues considering that only 30.3% of the population in Hamilton has a university degree.
The occupation with the highest growth rate shows an experience that is unique to Hamilton. Occupations in arts, culture, recreation and sport grew 49% over the last five years. That is significantly higher than the provincial figure of 7%. This highlights our community’s strength as a hub for arts-related industries. Growth is anticipated to be sustained as the City recently doubled the funding available to arts organizations.
Job Postings DataWPH releases quarterly reports on the job vacancies in Hamilton, called Help Wanted in Hamilton. The vacancy data shows that in 2014 there were 22,088 online job postings in Hamilton. The greatest number of job postings were advertised in March. However, between October and December there was a decrease in job postings.
Figure 3. Number of Job Postings by Month, Hamilton, 2014 (Vicinity Data); Unemployment Rate, Hamilton, 2014 (Labour Force Survey)
13
Figure 3. Number of Job Postings by Month, Hamilton, 2014 (Vicinity Data); Unemployment Rate, Hamilton, 2014 (Labour Force Survey)
Among the postings, 13,269 postings from Vicinity Data were categorized as either full-time, part-time or both. Of those, 73% of job adverts were for full-time positions. The only occupation that had more part-time openings than full-time were Health occupations (NOC 3).
Table 4. Top 10 Occupations by Job Postings, Hamilton, 2014 (Vicinity Data)
Rank Occupation # of Postings
% of Total
1 3012 - Registered nurses and registered psychiatric nurses 1488 9%
2 0621 - Retail and wholesale trade managers 664 4%
3 6411 - Sales and account representatives - wholesale trade (non-technical) 543 3% 4 6552 - Other customer and information services representatives 537 3%
5 7511 - Transport truck drivers 472 3%
6 6421 - Retail salespersons 464 3% 7 6235 - Financial sales representatives 445 3% 8 7621 - Public works and maintenance labourers 425 2% 9 4412 - Home support workers, housekeepers and related occupations 376 2%
10 7311 - Construction millwrights and industrial mechanics 332 2% Total Job Postings (classified) 17237 33%
The top 10 jobs postings for 2014 comprise 33% of all classified job postings. Registered nurses and registered psychiatric nurses had the largest number of job postings with 1488 adverts while Retail and wholesale trade managers followed with 664 job postings. Again, this emphasizes the significance of the health care sector in Hamilton. These are related to the top 10 occupational groups in Table 3 or the industry in Table 2.
33.544.555.566.57
750950
1150135015501750195021502350
Janu
ary
Febr
uary
Mar
ch
Apr
il
May
June July
Aug
ust
Sept
embe
r
Oct
ober
Nov
embe
r
Dec
embe
r
# of Job Postings Per Month
Unemployment Rate

Workforce Planning Hamilton | 2015 Labour Market Plan14
Among the postings, 13,269 postings from Vicinity Data were categorized as either full-time, part-time or both. Of those, 73% of job adverts were for full-time positions. The only occupation that had more part-time openings than full-time were Health occupations (NOC 3).
The top 10 jobs postings for 2014 comprise 33% of all classified job postings. Registered nurses and registered psychiatric nurses had the largest number of job postings with 1488 adverts while Retail and wholesale trade managers followed with 664 job postings. Again, this emphasizes the significance of the health care sector in Hamilton. These are related to the top 10 occupational groups in Table 3 or the industry in Table 2.
Skill LevelsA recent report by Workforce Planning Hamilton, Putting the Puzzle Together: Skills Alignment in Hamilton’s Transforming Economy, shows that the skill levels of prevalent occupations are increasing. From 2001-2011 employment in occupations requiring post-secondary education increased over 10% in Hamilton. Almost two-thirds (60.6%) of labour demand in Hamilton requires a postsecondary level of education. Sectors showing the greatest evidence of skills mismatch include Manufacturing; Health Care and Social Assistance; Professional, Scientific and Technical Services; Finance Insurance, Real Estate, Leasing and Construction.
Figure 4. Job Postings by Skill Level in Hamilton, 2014
Table 4. Top 10 Occupations by Job Postings, Hamilton, 2014 (Vicinity Data)
Rank Occupation # of Postings % of Total
1 3012 - Registered nurses and registered psychiatric nurses 1488 9%
2 0621 - Retail and wholesale trade managers 664 4%
3 6411 - Sales and account representatives - wholesale trade (non-technical) 543 3%
4 6552 - Other customer and information services representatives 537 3%
5 7511 - Transport truck drivers 472 3%
6 6421 - Retail salespersons 464 3%
7 6235 - Financial sales representatives 445 3%
8 7621 - Public works and maintenance labourers 425 2%
9 4412 - Home support workers, housekeepers and related occupations 376 2%
10 7311 - Construction millwrights and industrial mechanics 332 2%
Total Job Postings (classified) 17237 33%
Job Postings By Skill Level:Job postings found between 01/01/2014 AND 12/31/2014
A: University Education 5080 23%B: College or Vocational Education or Apprenticeship Training 5366 24.30%C: Secondary School and/or Occupation‐Specific Training 4967 22.50%D: On‐the‐job Training or No Formal Education Required 1824 8.30%Z: Unknown 4851 22%Grand Total 22088
Skill LevelA: University Education 5080B: College or Vocational Education or Apprenticeship Training 5366C: Secondary School and/or Occupation‐Specific Training 4967D: On‐the‐job Training or No Formal Education Required 1824
Note: A total of 17, 237 postings remain after unkown are removed (4,851)
0
1000
2000
3000
4000
5000
6000
A: University Education B: College or VocationalEducation or
Apprenticeship Training
C: Secondary Schooland/or Occupation‐Specific Training
D: On‐the‐job Training orNo Formal Education
Required
Number opf Job Postings
Job Postings by Skill Level, Hamilton, 2014

15Workforce Planning Hamilton | 2015 Labour Market Plan
Business Counts DataCanadian Business Patterns has been renamed Canadian Business Counts by Statistics Canada. Along with the new name came other methodological changes that make it impossible to do time-series comparisons. This year’s analysis reflects this change and is different than previous LMP, as we are limited to a snap shot approach. This data is still valuable as it helps us better understand labour demand from the perspective of a number of businesses.
There are 43,367 businesses in Hamilton as of June 2015. Just over two-thirds of them are businesses without employees. While this is a significant share of owner-operated businesses, it is actually slightly lower than the Ontario figure by two percent.
When looking at the businesses by employee size and range (see Table 6) it is clear that the large majority of businesses employ less than 50 people (95% in Hamilton and Ontario). In fact, looking at the share of even smaller businesses, 87% of businesses have less than 20 people comparable to Ontario as a whole.
Table 5. Hamilton Businesses With/Without Employees, June 2015 (Canadian Business Counts)
Region Total Without employees Total With employees
Hamilton 43,367 29,050 14,317
Hamilton Share 100% 67% 33%
Ontario 1,426,531 980,531 446,020
Ontario Share 100% 69% 31%
Table 6. Hamilton Businesses by Employee Size Range, June 2015 (Canadian Business Counts)
Employee Size RangeHamilton Ontario
Total Share Share
Total, with employees 14317 100% 100%
1-4 7841 54.8% 57.7%
5-9 2778 19.4% 17.8%
10-19 1822 12.7% 11.5%
20-49 1220 8.5% 8.2%
50-99 366 2.6% 2.6%
100-199 166 1.2% 1.3%
200-499 91 0.6% 0.7%
500 + 33 0.2% 0.3%
There are 43,367
businesses in Hamilton
as of June 2015.

Workforce Planning Hamilton | 2015 Labour Market Plan16
Businesses by Industry
Table 7 shows the top 5 subsectors by total number of employers (with employees). Indeterminate businesses were not included in these rankings, as they are not a current driving force for employment (although they may be in the future). Comprising almost 10% of all businesses, Professional, scientific and technical services is the top industry by number of businesses, followed by Ambulatory health care services and Specialty trade contractors.
Businesses by Sector
Table 8 shows the number of businesses by the goods producing and service producing sector. There appears to be a significant larger amount of businesses that are in the service producing sector but that is expected as close to 70%3 of people employed are in the service industry. One difference between these two is that there is a larger share of businesses with employees among the goods producing sector (41%) than the service producing sector (34%). The service producing sector has more owner operated businesses.
3 Labour Force Survey
Table 7. Hamilton’s Top Industries by Number of Businesses with Employees, June 2015 (Canadian Businesses Counts)
Detailed Industry Total Businesses % of Employment
541 - Professional, scientific and technical services
1346 9.4%
621 - Ambulatory health care services
1263 8.8%
238 - Specialty trade contractors 1209 8.4%
722 - Food services and drinking places
940 6.6%
561 - Administrative and support services
632 4.4%
Table 8. Hamilton’s Sectors by Number of Businesses with and without Employees, June 2015 (Canadian Businesses Counts)
SectorNumber of Businesses
Without employees
With Employees
Good Producing Sector
6530 3939 2591
Share 100% 60% 40%
Service Producing Sector
32188 21359 10829
Share 100% 66% 34%

17Workforce Planning Hamilton | 2015 Labour Market Plan
Self-Employment
The number of businesses with no employees can be interpreted as represented the self-employed in the community. As seen from Table 5, 67% of businesses in Hamilton are owner-operated. Table 9 shows the top 5 sub-sectors among businesses without employees. Real estate compromises 21% of owner operated businesses, followed by Professional, scientific and technical services. Real estate understandably tops the list as the sub-sector consists of thousands of self-employed real estate agents.
Table 9. Hamilton’s Top Industries by Businesses Without Employees, June 2015 (Canadian Businesses Patterns Data)
Detailed Industry Total Businesses % of Employment
531 - Real estate 6217 21%
541 - Professional, scientific and technical services 3018 10%
238 - Specialty trade contractors 1719 6%
621 - Ambulatory health care services 1601 6%
561 - Administrative and support services 1125 4%
67% of businesses in Hamilton are owner-operated

Workforce Planning Hamilton | 2015 Labour Market Plan18
Labour Supply Analysisof Job Seeking ClientsFor the third consecutive year, the Ministry of Training, Colleges and Universities provided WPH with aggregated client data sets for the period April 2014 to March 2015. While Employment Ontario recipients do not encompass the entire unemployed population, the data sets do provide insights into the subset of job seekers accessing services. The data presented here is derived from this subset of job seekers.
To provide greater context to the numbers, WPH presented this information to employment service providers in the community and solicited their comments by means of a survey. See Appendix A for a list of participating organizations.
Note: Previous reports have included data from the City of Hamilton Community and Emergency Services that includes Ontario Works recipients. This year the information was not available.
Overview
As shown in Table 10, Hamilton continues to see an increase in Employment Service (ES) and Literacy and Basic Skills (LBS) clients. The largest increases are over the three year period, where ES clients have grown by 41.1% and LBS clients have grown by 31.1%. Service providers attribute this increase to the increased marketing and increased awareness of services especially among youth due to programs such as the Youth Employment Fund.
Service providers report that this increase in clients has created some staffing challenges to maintain a high level of customer service. For certain agencies there has been a shift in priorities such as less one-on-one time, and using more intense job searches for certain clients with higher barriers.
Second Career clients and new apprenticeship registrations have dropped over the three years. During consultations with Employment Ontario (EO) agencies, regarding Second Career, there seemed to be many reasons for this decline. Some service providers suggested that clients preferred to go directly to training institutions rather than go through
Table 10. Overview of Client Data, Hamilton, 2012-2015
Employment Ontario 2012-2013 2013-2014 2014-2015
Year-Over-Year (2013/2014-2014/2015)
Over Three Years (2012/2013-2014/2015)
% Change Hamilton
% Change Ontario
% Change Hamilton
% Change Ontario
Employment Ontario - Unassisted Resource and Information Clients
N/A 13,918 11,979 -13.9% -3.0% N/A N/A
Employment Ontario - Employment Service Assisted
4,292 5,872 6,054 3.1% 2.7% 41.1% 9.2%
Employment Ontario - Literacy and Basic Skills
816 969 1070 10.4% 1.4% 31.1% 31.4%
Employment Ontario - Second Career
321 326 284 -12.9% -12.0% -11.5% -17.7%
Apprenticeship - New Registrations 1591 1548 1290 -16.7% -7% -19% -20%

19Workforce Planning Hamilton | 2015 Labour Market Plan
the Second Career process. As well, the Second Career program was designed to reskill displaced workers and with the lower unemployment rate the demand for retraining is currently not as great. Also mentioned was low awareness of the program and the challenges that clients have with the program structure and related employment supports.
Comments from service providers regarding the decline in apprenticeship registrations note lack of awareness about the benefits of the working in the skill trades; a need for more employers to provide apprenticeship opportunities or better information on what specific skills are needed among apprentices.
In a recent WPH report, Skills in the Manufacturing Sector in Hamilton, our research showed that many manufacturing employers are in need of skilled trades workers. In fact, the number of young skilled trades workers when compared to workers over the age of 45 were low. For some skilled trades occupations the data showed that there were no workers under the age of 25. This will no doubt create recruitment challenges in the future for manufacturing employers as there are few workers being trained as replacements to address retirements.
Age Distribution of ClientsFigure 5. Clients by Age, Hamilton, 2012-2015
There has been a large increase in the number of younger ES and LBS clients, 15-24 years of age, especially over the last three years. This large increase can be partially attributed to the Youth Employment Fund (YEF), which allowed employers to hire youth workers with employer support in the form of financial incentives. The YEF program was positively received among ES agencies as many youth were able to find placements and gain valuable work experience. While the funding has ended for YEF there is a new program, Youth Job Connection, which was launched on October 1, 2015 that will continue to help youth build skills and find employment. This will take place through programs such as pre-employment training that will support soft skills development, a deficit identified by many employers.
Year-over-year there was a decline in clients aged 45-64 years using ES agencies. Through the consultation process employer service providers suggested that the decline may be related to the fact that some of these jobseekers were finding employment through their own networks. It was also suggested that they may be accepting lower paid, less secure employment opportunities that they may have not considered in the past. It was also suggested that there are more job opportunities available in the community as our unemployment rate continues to fall and labour market conditions tighten.
Newcomer Visible Min Persons witAboriginal GNewcomer Visible Min Persons witAboriginal Group2012/2013 391 532 396 82 15 24 91 472013‐2014 422 589 469 96 40 61 187 642014/2015 488 711 474 138 63 86 284 81
15‐24 25‐44 45‐64 65 and olde15‐24 25‐44 45‐64 65 and older2012/2013 934 2029 1298 31 209 391 143 102013‐2014 1257 2755 1818 42 304 457 188 182014/2015 1544 2809 1661 40 321 510 222 15
ES Clients LBS Clients
ES Services LBS Services
0
100
200
300
400
500
600
700
800
Newcomer VisibleMinority
Persons withDisability
AboriginalGroup
Newcomer VisibleMinority
Persons withDisability
AboriginalGroup
ES Clients LBS Clients
Employment Ontario Clients ‐ Designated Groups
2012/2013
2013‐2014
2014/2015
0
500
1000
1500
2000
2500
3000
15‐24 25‐44 45‐64 65 and older
ES Services
2012/2013
2013‐2014
2014/2015
0
100
200
300
400
500
600
15‐24 25‐44 45‐64 65 and older
LBS Services
Employment Ontario Clients ‐ Age Breakdown

Workforce Planning Hamilton | 2015 Labour Market Plan20
It should be noted that this decrease among clients aged 45-64 years were not seen in LBS agencies. There continued to be increases in all age groups in every year, except for the oldest clients, 65 years and over.
Designated GroupsFigure 6. Clients by Designated Groups (Self-Identified), Hamilton, 2012-2015
Clients belonging to designated groups continued to increase in both ES and LBS agencies. Feedback from service providers in last year’s report noted that these clients are difficult to serve and require more time and resources and this was noted again in this year’s consultation.
One group that was frequently mentioned by service providers as presenting a significant challenge in terms of service was persons with a disability (PWD). This group according to service providers had the greatest barriers to employment. Service provider feedback suggested that they lack staff who are able to deal with the additional supports that they require. Additional resources like incentives for hiring were recommended as potential solutions for employment service agencies to meet the needs of this client group. Also recommended was the need for retention and job maintenance support for PWD.
Newcomers were also mentioned as a group that present service challenges. Service providers noted the fact that the lack of communication skills in English is often a barrier to employment for this group. Also noted was their expectations around employment were often very high, e.g. wage rate.
Newcomer Visible Min Persons witAboriginal GNewcomer Visible Min Persons witAboriginal Group2012/2013 391 532 396 82 15 24 91 472013‐2014 422 589 469 96 40 61 187 642014/2015 488 711 474 138 63 86 284 81
15‐24 25‐44 45‐64 65 and olde15‐24 25‐44 45‐64 65 and older2012/2013 934 2029 1298 31 209 391 143 102013‐2014 1257 2755 1818 42 304 457 188 182014/2015 1544 2809 1661 40 321 510 222 15
ES Clients LBS Clients
ES Services LBS Services
0
100
200
300
400
500
600
700
800
Newcomer VisibleMinority
Persons withDisability
AboriginalGroup
Newcomer VisibleMinority
Persons withDisability
AboriginalGroup
ES Clients LBS Clients
Employment Ontario Clients ‐ Designated Groups
2012/2013
2013‐2014
2014/2015
0
500
1000
1500
2000
2500
3000
15‐24 25‐44 45‐64 65 and older
ES Services
2012/2013
2013‐2014
2014/2015
0
100
200
300
400
500
600
15‐24 25‐44 45‐64 65 and older
LBS Services
Employment Ontario Clients ‐ Age Breakdown

21Workforce Planning Hamilton | 2015 Labour Market Plan
Education
Clients with a University degree increased the most over the last three years (51%) and much higher than the Ontario increase (12%). Service providers suggested that this increase was in part due to the YEF program and an increase in the number of newcomer clients. At the same time the general level of education across the population is increasing. The LBS stream shows that post-secondary as a learner’s goal path increased by 23%, significantly higher than the Ontario figure (2%). As well, the outcome at exit of ‘in education’ increased by 29% year over year. Many LBS service providers have said that they have been delivering the message that more education is important to their clients, and that clients are listening.
The EO data shows that more clients seeking service have completed post-secondary education. Feedback from employers tells us that these individuals should have less difficulty in finding employment with skills and credential requirements on the rise. Service providers tell us that often clients with a post-secondary credential do not have a degree or diploma that aligns with employer needs in our community. The issue is a skills mismatch. Better local labour market information was mentioned several times as something that could help with this skills mismatch problem.
employed in field of ChoiceOf the 4,049 ES clients whose outcome at exit was employed, approximately only 50 found employment in an occupation similar to what they were looking for.
Service providers suggest a major reason for this is that many clients need to find immediate employment and therefore they may take the first opportunity available.
Table 11. Clients by Education Level, Hamilton and Ontario, 2012-2015
Educational Level2012- 2013
2013- 2014
2014- 2015
Year-Over-Year (2013/2014 - 2014/2015)
Over Three Years (2012/2013 - 2014/2015)
% Change Hamilton
% Change Ontario
% Change Hamilton
% Change Ontario
Less than Grade 8 60 69 67 -3% 0% 12% 4%
Less Than Grade 12 640 761 767 1% -1% 20% 1%
Completion of Secondary School 1257 1720 1807 5% 7% 44% 14%
Certification of Apprenticeship/Journeyperson
96 71 -26% -3% N/A N/A
Completion of College 1215 1701 1721 1% 3% 42% 5%
Completion of University 753 106 1135 13% 2% 51% 12%
Other 367 513 486 -5% -9% 32% -12%

Workforce Planning Hamilton | 2015 Labour Market Plan22
Employer ConsultationsEmployer consultations and feedback are important to our labour market planning process. Employers are the demand side of the labour market equation and provide critical information on skills in demand, hiring outlook, anticipated growth, etc. It is imperative to gather this information and have it in hand to help develop our labour market plan.
Last year we conducted over sixty in depth interviews with employers from all sectors and combined that with information from our annual Hire Learning Survey (HLS) to explore a demand-side perspective for the development of a full labour market plan. For this year’s update we relied upon the results of WPH’s Hire Learning Survey. It was distributed in January 2015, and it received 179 total responses from employers about workforce topics that ranged from evolving skill requirements, training initiatives, recruitment challenges and retention. These are the main highlights gathered. More in-depth information can be found in the Hire Learning Survey report.
Employment Outlook• Hamilton employers have a positive outlook as almost half of all respondents see their organization growing and 87%
plan on hiring in the next year. 92% hired at least one position in the past year• The largest share of separations is due to retirements. 37% of job losses were due to retirements but 36% were due
to resignations. Depending on the industry these shares may differ, as Manufacturing had the greatest number of separations due to retirements
Skill Requirements • 22% of employers said skills requirement will increase by a significant extent in five years, and 60% said it would
increase by a moderate extent. The number of employers that said skill requirements would increase by a significant extent is higher this year than last year
Which industries were most likely to say they were growing?
Manufacturing Other Services (except Public
Administration)
Professional, Scientific and
Technical Services
Healthcare and Educational
Services
Arts, Entertainment and Recreation
Please Select the top 3 competencies for most of your employees: Share
Work ethic, dedication, dependability 13%
Communication(both oral and written) 13%
Self-motivated/ability to work with little or no supervision 12%
Problem solving, reasoning, creativity 11%
Technical 10%
Top Competencies for Your Employees
As was highlighted in last year’s report soft skills are critical to employers from all sectors.

23Workforce Planning Hamilton | 2015 Labour Market Plan
• The skill requirement percentages vary from industry to industry. Over one third of employers in the manufacturing sector report that skills will increase by a significant extent.
• College was the most targeted education level among the most hired occupations
Recruitment• Similar to last year, the top recruitment
methods are word of mouth (75%) and online job postings (63%)
• Majority of employers (63%) stated they had a position that was challenging to fill in the past year. This was higher than the previous year, as only 56% of employers indicated they had a hard-to-fill position. For certain industries such as manufacturing the challenge was even greater.
• The most commonly cited occupations in demand were: IT professionals; Journeypersons and Apprentices; Labourers in manufacturing; Administrative support workers; Customer service representatives
• The largest share of employers view the availability of qualified workers as fair. In fact, the majority (59%) rate it as fair or poor, and only 8% rate it as excellent
Training• The large majority of employers (80%) provided some sort of training and education opportunities for their
employees in the past year• Cost and loss of productivity during training time were identified as the main barriers to providing more training.
87%plan on hiring in
the next year
58%10% 32%
Not at all challlenging
Very challenging
Somewhat challenging
In general, does your organization find recruitment a challenging issue?
Does your organization find recruitment a challenging issue?
The majority of employers find recruitment a somewhat challenging issue, and about a third find it very challenging. Compared to last year’s survey, the number of employers that found it challenging has increased by 8%.

Workforce Planning Hamilton | 2015 Labour Market Plan24
2015 Labour Market Update and Action PlanWPH established key priorities in the fall of 2014 and has been working with partners to move a variety of initiatives forward to address these key labour market challenges. This section of our report provides an update on the action plan recorded in last year’s labour market plan and provides updates on activities planned for the coming year.
To develop this plan a group of key labour market stakeholders (see Appendix B for the organizations represented) came together to review the Labour Market Action Plan. They were provided with an opportunity to review the key priorities and, based on the evidence presented and their knowledge of the local labour market, identify any new or emerging priorities. Based on the evidence presented at the event and their knowledge of the local labour market there was agreement that the priorities established in 2014 – 15 were still valid.
Following that they broke into small groups and reviewed the existing action plans and activities-to-date and made suggestions for updates and improvements to existing actions. The group offered ideas for additional activities based on their experience and perspective. The following charts present:• a brief summary of the discussion focusing on their recommendations;• an update on recent activity in support of the four key priorities;• revised action plans as recommended by consultation participants.
The context within which these action plans are implemented is shifting and evolving as our provincial government, a funding partner in many initiatives, continues with employment and training services integration. New initiatives have been launched or are planned which may require us to revise or adapt this action plan as we go along. As always, WPH and other project leads will consider the broader landscape to ensure that our efforts to improve labour market and workforce development are maximized.
25Workforce Planning Hamilton | 2015 Labour Market Plan
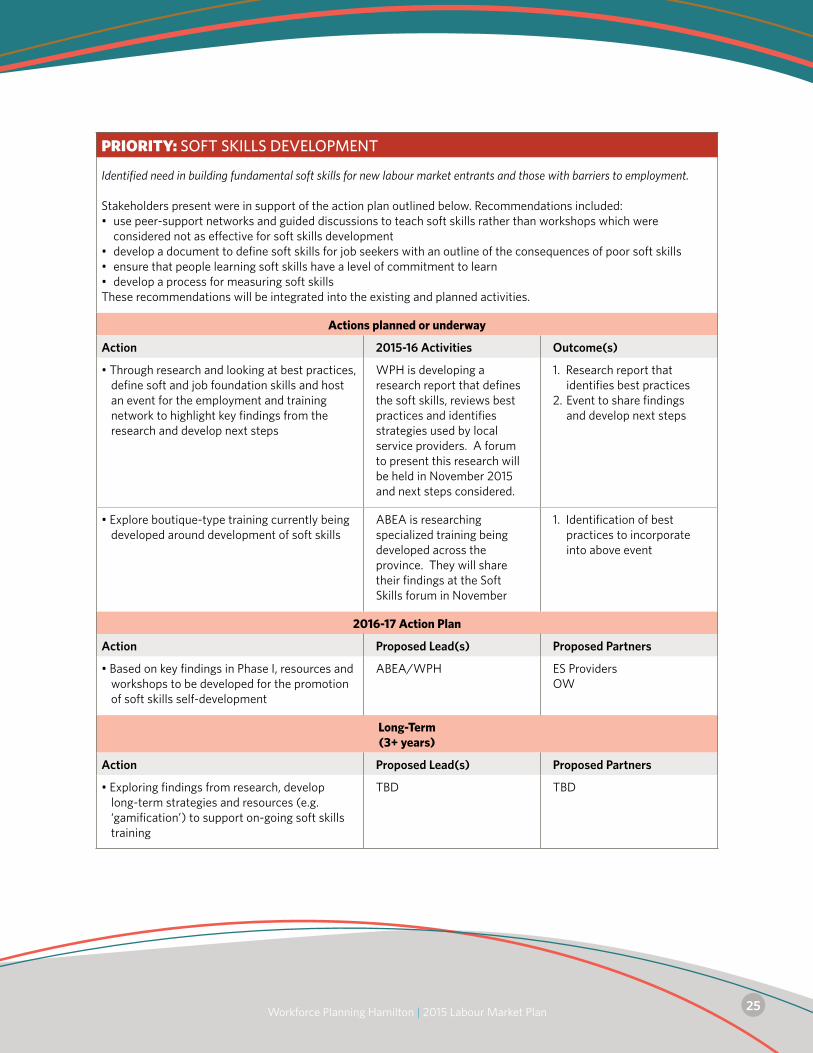
PRioRiTY: SOFT SKILLS DEVELOPMENT
Identified need in building fundamental soft skills for new labour market entrants and those with barriers to employment.
Stakeholders present were in support of the action plan outlined below. Recommendations included:• use peer-support networks and guided discussions to teach soft skills rather than workshops which were
considered not as effective for soft skills development• develop a document to define soft skills for job seekers with an outline of the consequences of poor soft skills• ensure that people learning soft skills have a level of commitment to learn • develop a process for measuring soft skillsThese recommendations will be integrated into the existing and planned activities.
Actions planned or underway
Action 2015-16 Activities Outcome(s)
•Throughresearchandlookingatbestpractices,define soft and job foundation skills and host an event for the employment and training network to highlight key findings from the research and develop next steps
WPH is developing a research report that defines the soft skills, reviews best practices and identifies strategies used by local service providers. A forum to present this research will be held in November 2015 and next steps considered.
1. Research report that identifies best practices
2. Event to share findings and develop next steps
•Exploreboutique-typetrainingcurrentlybeingdeveloped around development of soft skills
ABEA is researching specialized training being developed across the province. They will share their findings at the Soft Skills forum in November
1. Identification of best practices to incorporate into above event
2016-17 Action Plan
Action Proposed Lead(s) Proposed Partners
•BasedonkeyfindingsinPhaseI,resourcesandworkshops to be developed for the promotion of soft skills self-development
ABEA/WPH ES ProvidersOW
Long-Term(3+ years)
Action Proposed Lead(s) Proposed Partners
•Exploringfindingsfromresearch,developlong-term strategies and resources (e.g. ‘gamification’) to support on-going soft skills training
TBD TBD

Workforce Planning Hamilton | 2015 Labour Market Plan26
PRioRiTY: DESIGNATED GROUPS ENGAGEMENT WITH THE LABOUR MARKET
Designated groups (including youth, immigrants, persons with disabilities, visible minorities, older workers and Aboriginals) face specific and unique challenges to finding employment.
Stakeholders discussing this priority were generally in support of the actions in place. With respect to mentorship, those consulted commented that it is difficult to encourage employers to support mentorship programs in their workplaces. Recommended was:• creation of a toolkit for employers, based on the mentoring report and other research. The toolkit should be
broadened to be used with other designated groups especially older workers (45+) and others in the community who have difficulties finding and retaining jobs. Stakeholders discussing this priority were generally in support of the actions in place.
With respect to the action focusing on an employer engagement strategy, those consulted supported the actions and recommended the following: • employers need to know the ROI when they hire newcomers. It was suggested that the strategy should focus on
industries that have areas of skills shortages rather than generically to all employers.
Actions planned or underway
Action 2015 Activities Outcome(s)
•Reviewmentorship/internshipprogramofferings in the community and identify any gaps and best practices for any of the designated groups
With the support of McMaster University, WPH has released a literature review of best practices related to youth mentorship.
1. Document of best practices
2. Recommendations based on evidence
•Developandpilotemployerengagementstrategy for hiring skilled newcomers
A strategy is under development that will provide greater information to the employers on the immigrant talent pool.
1. Report that outlines strategy and implementation plan including targeted sectors
•Developacommunicationandoutreachstrategy for youth in Hamilton
Working with the Neighbourhood Action Strategy and youth from identified neighbourhoods in Hamilton, WPH is developing an approach to engage youth in employment services.
1. A strategy including best practices for employment service providers
The Youth Employment Network is working on a new website for youth that provides information about a range of services for youth
2. Youth employment portal

27Workforce Planning Hamilton | 2015 Labour Market Plan
2016-17 Action Plan
Action Proposed Lead(s) Proposed Partners
•Basedonmentorshipresearchandexperienceincrease job retention through mentorship toolkit for employers
WPH Employment service providers
•TheConnectorProgramdevelopedinHalifaxis an identified best practice in connecting newcomers to the labour market. Research into this program with a view to adapting and adopting in Hamilton will be conducted.
WPH Global Hamilton
•Evaluatepilotofemployerengagementstrategyfor newcomers and adapt for other designated groups
TBD Job Developers NetworkGlobal Hamilton
Long-Term(3+ years)
Action Proposed Lead(s) Proposed Partners
•Furtheractiontobedevelopedpendingtheresults of the action in year 1 and 2.
TBD TBD

Workforce Planning Hamilton | 2015 Labour Market Plan28
PRioRiTY: UNDERSTANDING INCREASING AND EVOLVING SKILLS REQUIREMENTS
Technological advancement across all industries requires multi-skilled workers at all levels who are adaptable, flexible and willing to learn.
Stakeholders present were in support of this priority and related actions. Recommendations to refine the actions especially the outreach strategy included:• promote a business-to-business/one-on-one approach to the promotion of training• ensure that any tools and resources address the issue of workplace culture that supports training• present a range of training options including those that meet the needs of small employers who have less time and
money to invest• consider the employee attitude to training and consider strategies to improve the interest and uptake on training
by employees.
Actions planned or underway
Action 2015 Activities Outcome(s)
•ResearchROIforemployerstoprovidetrainingand development for their workers and identify best practices that can be adopted at the local level
WPH has a project in place to research best practices related to promoting workplace training and investment in training.
Marketing piece with recommendations for how to adopt training
•Developanoutreachstrategytopromotetraining incentives and resources available for employers, such as the Canada Ontario Jobs Grant, especially as they relate to SMEs
WPH is working with partners to develop a strategy for promotion of training.
See above
2016-17 Action Plan
Action Proposed Lead(s) Proposed Partners
•Bringeducationandemploymentpartnerstogether to consider a local strategy for developing a coordinated approach to better connect people to future labour markets (e.g. through skills development, career exploration, training, etc.)
WPH IEC School BoardsOther partners TBD
•Hostaforumtoincreaseawarenessintheemployer community of the benefits of investing in training and development (as established through research findings)
WPH Chambers of Commerce
Long-Term(3+ years)
Action Proposed Lead(s) Proposed Partners
•Addresstraininggapforthosejobseekerswhodo not qualify for government funded training programs
TBD TBD

29Workforce Planning Hamilton | 2015 Labour Market Plan
PRioRiTY: EXPLORING OPPORTUNITIES IN HAMILTON’S DIVERSIFYING ECONOMY
Broaden job seekers’ awareness of the growth of opportunities of SMEs and different work environments (including part-time, contract and shift- work) through labour market information and other resources.
Participants at our consultation agreed that despite the fact that there was not action or activity underway this was still an important priority. Action planning honed in on specific information that might better support jobseekers understanding of the particular and unique needs of individual employers. The suggested approach was to engage in more dialogue with employers.
Actions planned or underway
Action 2015 Activities
•Developsector-basedmarketingstrategiesforsmall businesses and lesser-known companies to help make the connection to qualified job seekers
No action to date.
To be carried forward and revised. See below.
•Increaseworkerawarenessofemploymentstandards for precarious work environments (including part-time and/or contract work) to enhance labour force participation
No action to date
2016-17 Action Plan
Action Proposed Lead(s) Proposed Partners
•WorktoengageSMEsinkeysectorstocreatea two-way flow of information between employment services and employers. Working with key employer networks (e.g. BIAs) host focus group(s) with employers to learn more about their approach to recruitment and the ways in which they can be better supported by the employment services community.
WPH Job Developers NetworkEconomic Development
Ongoing
Action Proposed Lead(s) Proposed Partners
•Continuetoresearchgrowingsectorsofthelocal economy and explore their skill needs and help to develop strategies to meet their need
WPH Employers

Workforce Planning Hamilton | 2015 Labour Market Plan30
APPendICIesConclusionWPH is pleased to present this plan to the community. We hope that you find the information useful and look forward to working with all partners to strengthen our community through workforce development. We welcome your participation in any or all of activities presented here. Please contact WPH if you would like to be further involved.

31Workforce Planning Hamilton | 2015 Labour Market Plan
Appendix A – Employment and Training Agencies Consulted for Analysis of EO Data
Adult Basic Education Association
City of Hamilton, Community and Emergency Services
College Boreal
Employment Hamilton
Goodwill
Mohawk College, Community Employment Services
PATH Employment Services
vpi Inc.
Wesley Urban Ministries
YMCA

Workforce Planning Hamilton | 2015 Labour Market Plan32
Appendix B – List of Participating Service Organizations in Community Consultation
Adult Basic Education Association
City of Hamilton
College Boreal
Hamilton Immigration Partnership Council
HWDSB
McMaster University
Mohawk College
Mohawk College Enterprise
MTCU
Social Planning and Research Council
Threshold School of Building
Wesley Urban Ministries
YMCA Careerworx
YMCA of Hamilton/Burlington/Brantford
YWCA Hamilton
PATH
Employment Hamilton


Business, Labour & Community:Planning for Prosperity
Workforce Planning Hamilton
Business, Labour & Community:Planning for Prosperity
Since 1997 Workforce Planning Hamilton has provided planning, partnerships and projects that highlight local labour market trends and support workforce development.
WPH is a member of Workforce Planning Ontario, a network of 25 labour market planning areas across Ontario.
Our evidence-based approach relies on key industry sector and demographic data combined with local intelligence from employers and other local partners to develop a strategic vision for Hamilton.
Log on to WPH’s website at www.workforceplanninghamilton.ca and you will:
Discover our community Projects and Partners that promote labour force development.
Learn about local labour market trends, opportunities, and priorities in our Publications.
Connect to Links on training, employment, and labour market information.
117 - 77 James Street NorthHamilton, Ontario, L8R 2K3Telephone: 905-521-5777
Fax: 905-521-9309Email: [email protected]
Website: www.workforceplanninghamilton.ca
Workforce Planning Hamilton is funded by Employment Ontario


