Labour’s Record on the Under Fives: Policy, Spending and Outcomes 1997 - 2010 Kitty Stewart Preface This is one of a series of working papers which form the first stage of a programme of research, Social Policy in a Cold Climate, designed to examine the effects of the major economic and political changes in the UK since 2007, particularly their impact on the distribution of wealth, poverty, income inequality and spatial difference. The full programme analysis will include policies and spending decisions from the last period of the Labour government (2007-2010), including the beginning of the financial crisis, as well as those made by the Coalition government since May 2010. The programme is funded by the Joseph Rowntree Foundation and the Nuffield Foundation, with London-specific analysis funded by the Trust for London. The views expressed are those of the authors and not necessarily those of the funders. The research is taking place from October 2011 to May 2015. More detail and other papers in the series will be found at: http://sticerd.lse.ac.uk/case/_new/research/Social_Policy_in_a_Cold_Climate.asp In our first set of papers, including this, we look back at the policies of the Labour government from 1997 to 2010, charting their approach and assessing their impact on the distribution of outcomes and on poverty and inequality particularly. This provides a baseline for analysing and understanding the changes that are now taking place under the Coalition government. All these papers approach this by following a chain from ultimate policy aims, through specific policy objectives, to public spending and other policies, to outcomes. This provides a device for the systematic analysis and comparison of activity and impact in different social policy areas. A short supplementary paper defining the terms used in the framework and exploring its uses and limitations is available at http://sticerd.lse.ac.uk/dps/case/spcc/RN001.pdf Working Paper 4 July 2013
Transcript
Labour’s Record on the Under Fives:
Policy, Spending and Outcomes 1997 - 2010
Kitty Stewart
Preface
This is one of a series of working papers which form the first stage of a programme of research, Social Policy in a Cold Climate, designed to examine the effects of the major economic and political changes in the UK since 2007, particularly their impact on the distribution of wealth, poverty, income inequality and spatial difference. The full programme analysis will include policies and spending decisions from the last period of the Labour government (2007-2010), including the beginning of the financial crisis, as well as those made by the Coalition government since May 2010. The programme is funded by the Joseph Rowntree Foundation and the Nuffield Foundation, with London-specific analysis funded by the Trust for London. The views expressed are those of the authors and not necessarily those of the funders. The research is taking place from October 2011 to May 2015. More detail and other papers in the series will be found at: http://sticerd.lse.ac.uk/case/_new/research/Social_Policy_in_a_Cold_Climate.asp In our first set of papers, including this, we look back at the policies of the Labour government from 1997 to 2010, charting their approach and assessing their impact on the distribution of outcomes and on poverty and inequality particularly. This provides a baseline for analysing and understanding the changes that are now taking place under the Coalition government. All these papers approach this by following a chain from ultimate policy aims, through specific policy objectives, to public spending and other policies, to outcomes. This provides a device for the systematic analysis and comparison of activity and impact in different social policy areas. A short supplementary paper defining the terms used in the framework and exploring its uses and limitations is available at http://sticerd.lse.ac.uk/dps/case/spcc/RN001.pdf
Working Paper 4
July 2013
WP04 Labour’s Record on the Under Fives: Policy, Spending and Outcomes 1997 - 2010
1
Acknowlegements
The author would like to thank Polina Obolenskaya and Sangeeta Goswami for research input; Ludovica Gambaro for many useful discussions about childcare and early education; Naomi Eisenstadt, Jane Lewis, Abigail McKnight and Harriet Waldegrave for comments on earlier drafts; and the Social Policy in a Cold Climate research team for comments and discussion throughout. Kitty Stewart is Lecturer in Social Policy at the London School of Economics and Research Associate at CASE
WP04 Labour’s Record on the Under Fives: Policy, Spending and Outcomes 1997 - 2010
Inputs: How was this money spent? ..................................................................................................... 32
6. Early education for three and four year olds ......................................................................................... 40
7. Early childhood health .......................................................................................................................... 49
8. Poverty and material resources ............................................................................................................ 58
Table 1: Total public expenditure on early years and childcare provision in England, 1997-98 to 2010-11 (real, 2009-10 prices), £m ........................................................................................................................ 12 Table 2: Spending on early education, Sure Start and the childcare tax credit in the four UK nations (2009-10 prices) ....................................................................................................................................... 14 Table 3: GB spending on child-contingent benefits and tax credits (all children under 18), 2009-10 prices, £million ..................................................................................................................................................... 15 Table 4: Median number of service beneficiaries per week of different children’s centre activities by phase ........................................................................................................................................................ 29 Table 5: Childcare places in England 1997-2010 ..................................................................................... 35 Table 6: Highest qualification held by childcare and early education workers, by time period ................. 37 Table 7: Percentage of children working securely1 in each area of learning in maintained schools and private, voluntary and independent providers, 2005-2011, England ........................................................ 47 Table 8: Raw scores from the Performance Indicators in Primary Schools (PIPS) On-entry Baseline Assessment (BLA) .................................................................................................................................... 48
WP04 Labour’s Record on the Under Fives: Policy, Spending and Outcomes 1997 - 2010
3
Table 9: Changes in smoking behaviour for UK mothers 2000-2010: Evidence from Infant Feeding Surveys ..................................................................................................................................................... 51 Table 10: Drinking behaviour before and during pregnancy in the UK, by mother’s socio-economic group .................................................................................................................................................................. 54 Table 11 Percentage of babies born weighing less than 2500g, by father’s occupational class, and by single registration, England and Wales .................................................................................................... 55
List of Figures
Figure 1: Spending on maternity and paternity leave, Great Britain (2009-10 prices) .............................. 18 Figure 2: Prevalence of breastfeeding at ages up to nine months, UK 1995-2010 .................................. 21 Figure 3: Incidence of breastfeeding among mothers who initiated feeding at birth UK .......................... 21 Figure 4: Breastfeeding rates by mother’s occupation UK ....................................................................... 22 Figure 5: Spending on Sure Start Local Programmes and Sure Start Children’s Centres in England (2009/10 prices) ........................................................................................................................................ 27 Figure 6: Use of formal childcare by age, 1999-2010, England. ............................................................. 36 Figure 7:Percentage of three and four year olds in early education in England ....................................... 42 Figure 8: Total number of three and four year olds in early years education in England ......................... 43 Figure 9: Percentage of children in England accessing the free entitlement in a setting with a graduate, by decile of area deprivation ..................................................................................................................... 45 Figure 10: Percentage of children in England accessing the free entitlement in a setting with a graduate – PVI settings only .................................................................................................................................... 45 Figure 11: Smoking in pregnancy by mothers socio-economic classification, UK: ................................... 52 Figure 12: Absolute and relative gaps in infant mortality rates between routine/manual group and the average for all groups, England and Wales .............................................................................................. 56 Figure 13: Percentage of reception class children who were overweight or obese, England ................... 57 Figure 14: Child poverty in Britain by age of youngest child in the household, three-year averages ....... 60
WP04 Labour’s Record on the Under Fives: Policy, Spending and Outcomes 1997 - 2010
4
Summary
When Labour came to power in 1997 it made commitments to reduce poverty and improve children’s health, education and wider life chances. How far did it act on these commitments, at what cost, and with what impact?
New spending was split evenly between services and cash benefits. Spending on early years education, childcare and Sure Start grew almost four-fold in England from £671 per child under five in 1997/98 to £2,514 in 2009/10. UK spending on cash benefits, including maternity benefits, more than doubled in real terms to £3,431 per child under five.
Key policies included longer maternity leave, Sure Start Children’s Centres, free early education for all three and four year olds, more affordable and higher quality childcare, and more generous financial support for families with children, both in and out of work.
Average maternity leave taken doubled from around 18 weeks to 39 weeks. There was an increase in the use of formal childcare and early education, including among disadvantaged groups. The quality of these services improved with the Early Years Foundation Stage Curriculum and staff qualifications also rose, but there was only a modest increase in the number of graduate staff. Qualification levels in the private and voluntary sector remained lower than in maintained settings.
There were measurable improvements in parenting as well as children’s health, behaviour, and other developmental outcomes. Gaps narrowed between disadvantaged social groups and others in the levels of low birth weight, infant mortality and cognitive and social development, though considerable social gaps remained at the end of the period.
Child poverty fell, with particularly strong improvements in households with a child under five.
Research suggests that investments in early childhood have long-lasting rewards, so the full benefits of some of these changes may not yet have been felt.
All the main political parties now subscribe to the importance of investment in early childhood in reducing inequalities in life chances, and this fact in itself could be considered part of Labour’s legacy. Future work will examine how services for young children have fared under the Coalition Government and conditions of austerity.
WP04 Labour’s Record on the Under Fives: Policy, Spending and Outcomes 1997 - 2010
5
Introduction
It is fair to say that the Labour Government that took office in 1997 took early childhood very seriously – probably more seriously than any previous government in the UK. An early cross-departmental spending review specifically focused on services for children aged 0-7 (HM Treasury, 1998a) and the subsequent decade saw vastly increased resources and a wealth of policies targeted on pre-school children, including the extension of maternity leave, the development of Sure Start Children’s Centres and the expansion of both nursery education and childcare. In large part, this focus grew out of the new government’s early determination to tackle the long-term causes of poverty and disadvantage. A growing body of research pointed to the importance of a child’s early years for later health and education outcomes, and this pushed the quality and availability of services for young children up the agenda, alongside the issue of income poverty in households with children. In addition to these child-focused motivations, a focus on childcare also resulted from the push to increase parental employment, which itself had multiple objectives – to reduce income poverty, to promote gender equality and to boost economic growth. This paper examines Labour policy for the under-fives between 1997 and 2010, with a particular focus on the government’s goal of creating a more equal starting point for young children from all backgrounds. The paper has two main aims. First, it seeks to examine Labour’s record in a policy field it emphasised throughout its 13 years in power. Second, it hopes to prepare the ground for a future assessment of policy for under-fives under the Conservative-Liberal Democrat Coalition. The evidence on the importance of early childhood has had an impact across the political spectrum, and the Coalition has retained an interest in the early years as part of its social mobility agenda. The current assessment hopes to be useful in presenting a baseline for a study of changes in policy and outcomes for young children post-2010. The next section of the paper summarises policy objectives and policy developments under Labour. In Section 2 we look at changes in total expenditure on children under five. The following six sections each focus on a particular policy area: parental leave policies; Sure Start; formal childcare provision; early education for three and four year olds; health care; and policy to reduce income poverty. In each case we aim to look at inputs (how were resources spent?), outputs (what services were delivered with the inputs?) and finally at outcomes (what difference did this make to the health, social and educational development and well-being of young children and their families?). This framework follows that set out in Lupton et al. (2012) and keeps this paper consistent with others in our series of papers evaluating the Labour years. We should note that the paper does not examine policy in relation to children in care and to child protection, and we refer interested readers elsewere (Parton, 2006; Ainslie et al, 2010; Munro, 2011). The story is complicated by the fact that the UK has four constituent nations: 85% of under-fives live in England, with 8% in Scotland, 4% in Wales and 3% in Northern Ireland. Control over taxation is retained by the UK Parliament in Westminster, but the devolved administrations have authority over education and childcare policies, and there are important differences in practice among the four. The sections on spending, parental leave and income poverty cover the whole of the UK, but where education and childcare is concerned this is largely a paper about England; the scope of the project was simply too large to do justice to four differing systems.
WP04 Labour’s Record on the Under Fives: Policy, Spending and Outcomes 1997 - 2010
6
1. Goals, Policies and Targets
“If we are in politics for one thing, it is to make sure that all children are given the best chance in life.” Tony Blair, Labour Party Conference Speech 1999 “An inclusive society, where everyone has an equal chance to achieve their full potential.” 1998 Comprehensive Spending Review (HM Treasury, 1998b) Ensuring a more equal starting point for all young children was a repeated theme in New Labour speeches and policy documents, and this paper aims to assess the extent to which the government made progress towards this goal. We begin by setting out the main policies introduced between 1997 and 2010 that were targeted at children under five. These largely fall under one of two broad policy objectives – reducing income poverty and promoting child development – although in several cases policy sought to contribute to both at once.
Reducing income poverty
Reducing poverty in households with children was central to Labour’s attempt to level the playing field. The strategy was to increase parental employment (“work is the best route out of poverty”) while also increasing resources in low-income households with children, and especially with younger children, whether adults were in work or not. Three main policy areas are relevant. First, changes to the tax-benefit system increased the level of financial support to all households with children, while also attempting to improve financial incentives to work. Universal Child Benefit was increased substantially in real terms for oldest children in 1999 and kept pace with earnings thereafter. Working Families Tax Credit, introduced in 1999, and then Child Tax Credit and Working Tax Credit, which replaced WFTC from 2003, provided more significant levels of support on a means-tested basis: some 90% of families were eligible for the family element of CTC but the per-child element was highly progressive, targeting most support to those at the bottom of the distribution, including those not in work at all or working part-time on low wages. While almost all households with children benefited from Labour’s tax-benefit changes, the position of families with younger children was privileged in several ways. Most importantly, CTC treated all dependent children under 18 alike, where previously rates had been lower for children under 11, and this led to a significant boost in the relative incomes of younger families during Labour’s first term (Gregg et al, 2006). In addition, the family element of CTC was doubled during a child’s first year, while a one-off Sure Start Maternity Grant payment of £500 was introduced for mothers on low incomes. From April 2009, Child Benefit was extended to pregnant women in the third trimester. Second, alongside in-work tax credits, other policies aimed to encourage parents into work. Some of these were aimed at all low-paid workers: the National Minimum Wage played a key role in improving the rewards from low-wage jobs, with the greatest impact on women and on those working part-time (Manning, 2012). Others were specifically targeted, such as the New Deal for Lone Parents, which provided advice and support to lone parents considering a return to work, and In-Work Credit, which provided a £40 a week bonus to lone parents during their first year back in work. During Labour’s time in office, increasing conditionality of benefit payment was applied to lone parents: in 1997 no attempt to look for work was expected until a youngest child turned 16; by 2010 the age had dropped to seven. Mothers of children under five were not affected, although from 2008 all lone parents were required to attend a six-monthly work-focused-interview, regardless of the age of their youngest child.
WP04 Labour’s Record on the Under Fives: Policy, Spending and Outcomes 1997 - 2010
7
Third, and related, a series of measures aimed to improve the availability and affordability of childcare places in an attempt to make work more feasible for lone parents and second earners with young children. The first ever National Childcare Strategy was published in 1998 pledging to “ensure quality, affordable childcare for children aged 0-14 in every neighbourhood” (DfEE, 1998). Some short-term funding was provided for nurseries in more deprived neighbourhoods through the Neighbourhood Nurseries Initiative, and subsidised loans were made available to start-up nurseries in other areas. At the same time, demand-side funding was introduced through a childcare element of Working Tax Credit: working families on lower incomes could claim back initially up to 70% and later up to 80% of the cost of a registered childcare place. A salary sacrifice scheme enabled parents working for participating employers to be part paid in childcare vouchers, saving up to £1,100 a year in tax per parent, although this was of greatest value to parents on higher incomes.
Promoting child development
The first set of policies we highlight as having child development objectives really had multiple purposes. Changes to maternity leave and the introduction of paternity and parental leave had three distinct objectives: to raise household incomes in the first year after a child’s birth; to make it easier for mothers to remain attached to the labour market after having children, rather than exiting altogether with long-term consequences for household income and gender inequality; and to allow parents to spend more time at home with children, with family bonding and child development goals in mind (see e.g. Home Office, 1999; HM Treasury et al, 2004). Evidence on what children need during the first year points to the importance of developing a bond with a single carer and suggests that full-time hours in centre-based care may not be ideal at this time (Waldfogel, 2006); the benefits attached to breast-feeding mean that the ideal carer during the first six months is the mother. Labour increased maternity leave from 18 weeks to a full year, with nine months paid, although all but the first six weeks were paid at a relatively low flat rate. Fathers became entitled to two weeks of paid paternity leave, paid at the same flat rate, and all parents of children under six gained the right to up to three months of unpaid parental leave, to be taken in blocks of between one and four weeks at a time. The second major policy change was the extension of free part-time nursery education to all three and four year olds, replacing the nursery voucher scheme for four-year-olds piloted by the outgoing administration. A place for all four-year-olds was pledged as a 1997 manifesto commitment; by 2004 this had been delivered and extended to include all three year olds from the term following their third birthday. Initially places covered 2.5 hours per day for 33 weeks each year; by 2010 children were entitled to 15 hours per week for 38 weeks, with greater flexibility in delivery (places could be accessed over three slightly longer days, to make them work more effectively as childcare). In 2010 the government were piloting a scheme to extend the free places to cover disadvantaged two-year-olds. Third, a series of policies aimed to improve the quality of childcare and early education provision. One aspect of this was the integration of all settings under the auspices of the Department for Education, including regular inspection by the Office for Standards in Education, Ofsted. Integration of education and care is seen internationally as a hallmark of higher quality provision, contrasting with the traditional breakdown between childcare services, designed to enable parental employment and often delivered by employment or health ministries, and early education services, usually delivered as part-time sessions focused on children’s play and development in a model developed in an era in which children could be assumed to have a parent at home. Labour’s intention was to ensure that children were receiving high quality early education provision whether they attended one of these part-time providers or a full-day
WP04 Labour’s Record on the Under Fives: Policy, Spending and Outcomes 1997 - 2010
8
nursery while their parents worked (HM Treasury et al, 2004). In addition to formal integration under the DfE, a single curriculum was imposed on all childcare and early education providers in England, the Early Years Foundation Stage Curriculum. There was also some attempt to improve the qualifications of the early years workforce to bridge some of the gap between state nursery classes, staffed by qualified teachers, and other providers. Minimum qualification requirements covering childcare/playgroup managers and a proportion of other staff were imposed for the first time, and a new graduate-level qualification, the Early Years Professional, was introduced. Finally, we turn to the most high profile part of Labour’s policy for under-fives: the flagship Sure Start initiative. Initially set up as 250 Sure Start Local Programmes in the most disadvantaged areas, the aim of Sure Start was to fill in the gap in services for very young children identified in the 1998 cross-departmental spending review, by providing “integrated and preventive provision of a range of services, targeted in particular on pre-school children and their families in areas of need” (para 21.6), with services to be locally determined by a partnership of parents, volunteers, local authority officials and other professionals, but to include childcare, primary health care, early education and play and support for families. Sure Start Local Programmes were subsequently rolled out more widely as Sure Start Children’s Centres, although with important differences. The programme was adapted so that centres fell more clearly under local authority control, and while centres that had been Local Programmes continued to provide a wide range of services and to bring health, education, parenting, and employment support under one (often purposely-designed) roof, not all the new centres operated from a single physical location in the same way, or provided the full range of services. In addition to being a development of SSLPs, Children’s Centres were also part of a major shift in the government’s approach towards accountability for children’s welfare introduced with the Every Child Matters framework in 2003, which attempted to integrate services around the child (HM Treasury, 2003; Eisenstadt, 2011). Before we go on to look at these policies in greater detail, it is worth giving brief consideration to the government’s own targets for each area. Labour introduced an approach under which departments were set Public Service Agreement (PSA) targets at the time of each Comprehensive Spending Review: these were policy goals which the department was expected to work towards. One simple way to appraise the extent to which Labour reached its own policy goals for under-fives would seem to be to examine how far these PSA targets were met, so in Appendix 1 we list the relevant targets along with the government’s own judgment of whether each one was met. This adds up to an unsatisfactory assessment, though, largely because both the choice of indicators themselves and the extent of required improvement seem to be rather arbitrary. First, there is a mix of input, output and outcome measures, making some targets much easier to hit than others: making information available to all parents in Sure Start Local Programmes is clearly easier than reducing infant hospital admissions. Second, they do not cover all policy areas: there is no target covering the free entitlement for three and four year olds, for example. Third, some targets are listed simply as ‘not met’ when we know that the target was ambitious and that extensive progress was made; progress on reducing child poverty is a good example here. Others, such as reductions in smoking in pregnancy and in low birthweight were not met at the time, and (perhaps as a consequence) were dropped as targets. In practice both indicators subsequently saw progress later in Labour’s administration which is not captured on the list, but had no progress been made this might have gone quietly unnoticed with no target drawing attention to the issue. A wider problem (which affects all attempts to measure progress) is that targets focus on what is measurable, and what policy is trying to achieve is not always so easy to capture. In relation to Sure Start Local Programmes, Lewis (2011) points out that many programmes saw a key goal as being to
WP04 Labour’s Record on the Under Fives: Policy, Spending and Outcomes 1997 - 2010
9
increase parental self-esteem and confidence, but the targets focus on more concrete goals such as smoking, breastfeeding and worklessness. In short, while PSA targets were small steps intended to keep policy on track with the government’s goals, the fact that they were met does not always mean that the government succeeded in achieving these goals, nor does failure to meet them necessarily mean that the government failed. In this paper, therefore, we use PSA targets as one source of information, but our approach is broader: we try to measure what resources achieved in terms of inputs, what this delivered in terms of outputs, and what we know about subsequent changes in outcomes.
WP04 Labour’s Record on the Under Fives: Policy, Spending and Outcomes 1997 - 2010
10
2. Resources
Table 1 shows the change in spending in England between 1997 and 2010 on nursery and primary education for under fives, Sure Start, childcare subsidies, and maternity and paternity benefits. The table shows the huge increase in resources targeted at young children over this period. In real terms, spending increased nearly four-fold, rising from £876 per child under five in 1997-98 to £3,194 per child in 2009-10. By 2009-10, an additional £2.3 billion a year was being spent on early education (more than double the figure for 1997-98); an additional £1.5 billion on maternity and paternity pay (three times the spend for 1997-98); while £1.9 billion was spent on Sure Start and £1.8 billion on childcare subsidies – spending categories that had not existed (or barely so) when Labour took office. As a share of UK GDP, spending nearly trebled, from 0.24% to 0.70%.1 Table 2 presents what we know about spending on early education and on Sure Start programmes (or their equivalent) in all four UK nations. The other categories listed in Table 1 – the childcare tax credit, childcare vouchers, maternity and paternity payments – are administered from Westminster under regulations that apply equally across the UK, so differences across nations simply reflect differences in eligibility and/or take-up. In contrast, control over spending on early education and other services for young children rests with the devolved administrations, so variations by country are likely to be wider and to reflect policy divisions. The picture is, however, frustratingly incomplete. Most significantly, the Welsh Government do not produce separate figures for spending on under fives within primary schools (where many three and four year olds attend nursery classes). Figures for Northern Ireland are published within the Treasury Public Expenditure Statistical Analyses (PESA) series but look unconvincingly low. Data on early education are therefore not reported for either nation. For Scotland, data are available from both the Scottish Government and PESA but from 2001-02 only. These data are included in Table 2, and point to faster growth in spending on early education in Scotland than in England over this period – an increase of between 20% and 30% between 2001-02 and 2009-10, compared to 15% in England. However, this may simply reflect a lagged start to increased spending in Scotland: the sharpest rise for England came between 1997-98 and 2001-02 (64%) when no Scottish data are available. In absolute (per capita) terms, spending per head remains substantially higher in 2009-10 in England than in Scotland, at £1,323 compared to £1,061. More complete data are available on the national equivalents of Sure Start, called Sure Start in both Scotland and Northern Ireland and Cymorth and Flying Start in Wales. The Sure Start programme in England appears considerably larger than those in the other nations: in 2009-10, £593 was spent through Sure Start in England for each child under five, compared to £361 per head in Scotland, £327 in Wales and £155 in Northern Ireland. Questions of comparability arise however, especially for Wales, where Flying Start is focused on 0-3s (not 0-4s), and Cymorth spending covers young people up to 25 years old, with the part of the budget spent on 0-3s included here. Table 1 (and to a lesser extent Table 2) capture the main categories of spending targeted specifically on young children, but the picture they provide is not comprehensive. One key missing item is spending on health services other than those delivered through Sure Start. Local health care priorities were determined by Primary Care Trusts during this period, and spending on particular age groups was not
1 Note that the spending table is for England only and GDP is for the UK. As a share of English value added, the proportion would be higher.
WP04 Labour’s Record on the Under Fives: Policy, Spending and Outcomes 1997 - 2010
11
gathered centrally, while no age-specific numbers are created for national health expenditure data. In the section on health below we present some estimates of health spending on under-fives from the Audit Commission, and these make a significant addition to the total. There are also many other areas of expenditure that touch young children’s lives but where a particular share of spending cannot be attributed to them. Housing and neighbourhood renewal are obvious examples: investment in local playgrounds and safe play areas on housing estates will have particularly affected young children’s lives, but we have no way to capture them. Other papers in this series discuss these policy areas in relation to the population as a whole (see e.g. Lupton et al, 2013, on neighbourhood policy, and Vizard and Obolenskaya, 2013, on health). One crucial additional spending stream can be identified: expenditure on child-contingent benefits and tax credits. As discussed, reducing poverty among households with children was central to Labour’s agenda, both as a goal in itself and because of a belief that without adequate financial resources families are not well-placed to provide a home environment in which children can thrive. To reduce child poverty the Labour Government channelled substantial resources into benefits for both in-work and out-of-work families. In total, as Table 3 shows, an additional £20 billion in real terms was spent on children through the benefit system in 2009-10 compared to 1997-98 – an extra 1% of UK GDP. The bulk of this additional money – over £12 billion – went on means-tested assistance for working families. Table 3 includes benefits for all children under 18: breaking out expenditure specifically for younger children is difficult to do. The final line of the table shows average spending per child, and this can be taken to apply roughly equally to children of all ages, with two caveats. First, from 2003 until the end of Labour’s time in office, families could claim double the family element of Child Tax Credit during a child’s first year, meaning an extra £545 in 2009-10. Second, between 1998 and 2003 the gap in out-of-work benefit payments for children under and over eleven was gradually closed: in April 1998 just over £10 less (in 2009-10 prices) was paid in Income Support each week for younger than older children, while from April 2003 payments were equal for all dependent children under 18. The 2009-10 per capita figure is therefore a reasonable estimate of what the average child over a year old will have received in that year, but the 1997-98 figure somewhat over-estimates spending on children under 11, and similarly under-estimates spending on older children. For these two reasons, the extent of the increase in per capita spending on younger children is not fully reflected by these numbers. Nevertheless, the increase averaged over all children is substantial: spending per child more than doubled in real terms from £1,334 to £2,913.
WP04 Labour’s Record on the Under Fives: Policy, Spending and Outcomes 1997 - 2010
12
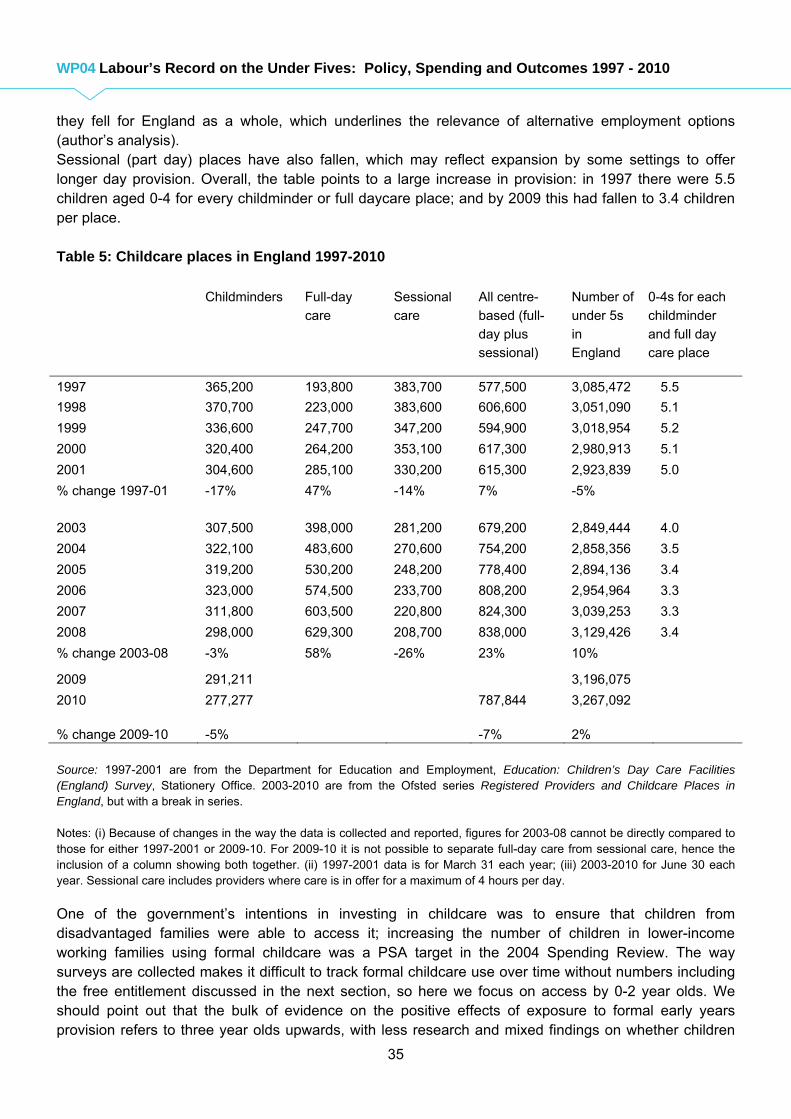
Table 1: Total public expenditure on early years and childcare provision in England, 1997-98 to 2010-11 (real, 2009-10 prices), £m
Sources and Notes for Table 1: Local Authority spending on under 5s excluding Sure Start: Sources: 1997-98 to 2008-09 are from Departmental Annual Report 2009, Table 8.6, p.179 (DCSF, 2009). Figures within Departmental Expenditure limits (DEL). 2007-08 is a provisional outturn; 2008-9 is a provisional outturns. 2009-10 and 2010-11 are from PESA 2011 (October), Table B1/ Notes: Includes expenditure on under fives in nursery schools, in primary schools and in the private, voluntary and independent sectors. Current expenditure only: capital expenditure is reported gross for education. 1997-98 outturn expenditure reflects the transfer of £527 million from local government to central government for the nursery voucher scheme. Sure Start: Sources: 1997-98 from House of Commons Committee of Public Accounts. Sure Start Children's Centres. Thirty–eighth Report of Session 2006–07: Evidence (http://www.publications.parliament.uk/pa/cm200607/cmselect/cmpubacc/261/261.pdf). 1998-99 and 1999-00 from Departmental Reports 2003 and 2004. 2000-01 to 2002-03 from Department for Education and Skills Departmental Report 2006 (Table 8.2, page 81). 2003-04 to 2008-09 from Department Annual Report 2009, Table 8.4 (DCSF, 2009). 2008-09 is an estimated outturn
1997-98 1998-99 1999-00 2000-01 2001-02 2002-03 2003-04 2004-05 2005-06 2006-07 2007-08 2008-09 2009-10 2010-11LA spending on under fives, excl. Sure Start, of which:
WP04 Labour’s Record on the Under Fives: Policy, Spending and Outcomes 1997 - 2010
13
2009-10 and 2010-11 (Support for Sure Start, Early Years and Childcare) from the Department for Education Annual Report and Accounts 2010-11: p.77 - Figures within Departmental Expenditure limits (DEL). Notes: From 2003-04 funding for Childcare and Nursery Education was merged with that of Sure Start, including capital and current spending. Capital expenditure figures includes capital expenditure by non-departmental public bodies, which is financed by voted grants, and local authority credit approval. Childcare element of Working Tax Credit: Sources: Figures up to 2002-03 from Table 1.3 of HMRC’s Working Families Tax Credit (WFTC) Quarterly Enquiry, November 2002, which includes information on the total number of families benefiting from the childcare element of Family Credit/WFTC and the average extra amount received for childcare. As these are UK figures, we apportion 83.4% of this total to England, 9.3% to Scotland, 4.2% to Wales and 3.4% to Northern Ireland based on the regional breakdown of spending in Table 1B of Child and Working Tax Credit Statistics Finalised Awards 2004/05, Geographical Analyses (2004/5). For 2003-04 onwards, data are from Table 2.4 of HMRC’s Child and Working Tax Credits Finalised Annual Awards. Geographical analyses 2003-4 and subsequent editions. Note: These figures include spending on childcare for older children (after school and holiday provision). Employer childcare vouchers: Source: Hansard records. Figures for the UK provided by David Gauke MP in response to a question from Elizabeth Truss MP, 12 January 2012. No estimates were provided for 2005-06 or 2006-07. Figures have been adjusted down to reflect population of England (84%). Maternity Allowance and Statutory Maternity Pay Sources: 2004-05 to 2010-11 from DWP Expenditure Tables (research.dwp.gov.uk/asd/asd4/r1.values.xls) Earlier years for GB from budget_2012_300712.xls, split between England, Scotland and Wales using average percentage spending breakdown for 2004/05 to 2010/11 (England 0.88, Scotland 0.08, Wales 0.04). Both sites accessed October 12 2012. Paternity Pay and Adoption Pay Sources: 2003-04 and 2004-05 from Hansard records (Hansard, 28 January 2012: Column 1020W). 2005-06 to 2008-09 from Department for Business, Enterprise and Regulatory Performance Annual Report and Accounts 2008-09 (July 2009). 2009-10 and 2010-11 from Department of Business, Innovation and Skills Annual Report and Accounts 2010-11 (July 2011). Figures are for GB and were multiplied by 0.88 to adjust for England following SMP spending figures. Notes: Figures for Statutory Paternity Pay and Adoption Pay are provided together. Both are the responsibility of the Department of Business, Innovation and Skills, not the DWP. The figure for 2006-07 is provided as written; it is not clear why spending is so much lower in that year. Sure Start Maternity Grant: Source: 1991/2 to 2006/07 from DWP Expenditure Tables (Breakdown of Social Fund Expenditure). 2007/8 to 2010/11 from DWP Annual Report on the Social Fund (2007/08, 2008/09, 2009/10 and 2010/11) GDP and Price Deflators: HM Treasury (2011, oct.) deflators. Population 0-4: Mid-year population estimates (ONS) provided by Tony Hitshing (ONS), May 2012.
WP04 Labour’s Record on the Under Fives: Policy, Spending and Outcomes 1997 - 2010
14
Table 2: Spending on early education, Sure Start and the childcare tax credit in the four UK nations (2009-10 prices)
Total Expenditure £million 1997-8 1998-9
1999-2000
2000-01
2001-02
2002-03
2003-04
2004-05
2005-06
2006-07
2007-08
2008-09
2009-10
2010-11
Under 5's education England (PESA) 3,452 3,534 3,968 4,259 4,383 4,016 4,204 4,252 4,347 4,322
Sources and Notes for Table 2: Under 5s Education: England: HM Treasury (various years) PESA and DCSF (2009a) Table 8.5. Authors’ calculations in deflating the DfE figures back to current and inflating them using GDP deflators (published 25 October 2011). 2007-08 are provisional outturn figures and 2008-09 are estimated outturn figures Scotland: HM Treasury (various years) PESA and The Scottish Government (various years), Scottish Local Government Finance Statistics Wales: Because of the way education for under 5s is funded in Wales, HM Treasury was unable to provide a breakdown between nursery and primary schooling. Northern Ireland: Data are available from the HM Treasury PESA series, but appear unreasonably low (£107 per child in 2009-10) and are not reported here. Sure Start (or equivalent) spending: England: See Table 1 notes. Scotland: Spending on Sure Start Scotland and Childcare Strategy in Scotland, taken from the Scottish Government’s Grant Aided Expenditure website. Wales: In Wales, Sure Start equivalent programmes are Cymorth (introduced in 2003-04) and Flying Start (from 2007-08). The spending on Cymorth programme is an estimate calculated on a minimum share of spending on 0-3 year olds reported for 2007-08 (McCrindle and White, 2010: 3). This could underestimate the amount spent on this age group as there are non-age specific allocations within Cymorth which account for 22% of spending. Additionally, it is not possible to tease out spending for 4 year olds; Cymorth spending on 4-10 year olds is grouped together. Northern Ireland: 2008-09 from DCSF (2009b); 2006-07 from Table 4.10 of An Analysis of Public Expenditure on Children in Northern Ireland Part 1: Spending on Children's Services, a report from Economic Research Institute for NI and IFS; 2000-01 figure from Department of Health, Social Services and Public Safety (2002). 2000-01 was the first year of Sure Start programme in Ireland. The initial allocation was £4m with a further £1.8m from April 2001, making £5.8m for 2001-02 in total. Childcare element of Working Tax Credit: Table 2.4 of HMRC’s Child and Working Tax Credits Finalised Annual Awards. Geographical Analyses 2003-4 and subsequent editions (http://www.hmrc.gov.uk/stats/personal-tax-credits/final-award-geog.htm). For earlier years national breakdowns are not provided. Price Deflators: HM Treasury (25 October 2011). Population 0-4: Mid-year population estimates (ONS) provided by Tony Hitshing (ONS), May 2012.
WP04 Labour’s Record on the Under Fives: Policy, Spending and Outcomes 1997 - 2010
15
Table 3: GB spending on child-contingent benefits and tax credits (all children under 18), 2009-10 prices, £million
Sources and Notes for Table 3: Sources: The main source is the Department for Work and Pensions' Benefit Expenditure Tables, which have been adapted and supplemented in the case of certain benefits where responsibility has been transferred to other departments. Expenditure on children is determined by estimating what expenditure on each particular benefit would be if the household or benefit unit did not contain any children. Child Benefit from 2003/04 onwards from HM Revenue and Customs Accounts, annual reports. E.g. http://www.hmrc.gov.uk/about/hmrc-dep-acct0708.pdf. Working Tax Credit and Child Tax Credit from 2003/04 from HM Revenue and Customs (2012), Child and Working Tax Credits Statistics 2010-11. Working Families Tax Credit (from 1999-2003): net expenditure from Inland Revenue Annual Reports. Notes: (i) Family Credit: total expenditure on Family Credit (including element allocated to working age adults in the DWP Benefit Tables); Working Families Tax Credit: net expenditure from Inland Revenue Annual Reports; WTC/CTC: total entitlement of in-work recipients excluding family element of CTC (previously delivered through the Married Couples Allowance and the Children’s Tax Credit). (ii) Married Couples Allowance was replaced by the Children’s Tax Credit in 2000 and by the family element of CTC in 2003; the latter were both tapered away for those on very high incomes. (iii) Previous versions of this table (Stewart, 2005; Stewart, 2009) have included an additional line for ‘other income-related benefits’, capturing the part of Housing Benefit, Council Tax Benefit and the Social Fund estimated to be contingent on children living in the household, as well as a line for ‘other non-income related benefits’, which included Disability Living Allowance along with child dependency increases in the Basic State Pension, Incapacity Benefit and Carer’s Allowance. These estimations are no longer made by the DWP in their Benefit Expenditure Tables and so these lines are excluded for consistency. Between 1997/98 and 2002/03 these categories of spending are estimated to have added around £1 billion to expenditure in each year (2009/10 prices).
WP04 Labour’s Record on the Under Fives: Policy, Spending and Outcomes 1997 - 2010
16
The final line of Table 3 shows average spending in Britain per child 0-4 on maternity pay, paternity pay and Sure Start Maternity Grant (from Table 1), to put us in a position to compare increased spending on all cash benefits with increased spending on early years services (shown in the final line of Table 1). Labour’s was in principle a ‘both-and’ strategy – investment in both services and household resources – and it is instructive to know whether money was in practice spent equally on the two sides, or whether one side was prioritised over the other. Our comparison for under-fives points to a fairly equal division of the additional resources spent under Labour, but considerably more was being spent on benefits than on services at the beginning of the period and so a heavier weighting on benefits remained at the end. Adding the average per capita spend on tax credits and benefits to that on maternity/paternity payments gives us £3,606 per child under five in 2009-10 (but this would be higher – something over £4,000 – during a child’s first year). Looking back to Table 1 we see spending on early education, Sure Start and childcare in England adding up to just £2,529 per child. Comparing 2009-10 with 1997-98, though, we see that Labour increased annual cash spending by £2,077 per child while increasing spending on services by £1,858 per child. We should also remember the point made above: the available data allow us to capture cash transfers to households with children more comprehensively than all the spending on the services that affect them. How do these levels of spending compare to those in other similar countries? The OECD publish expenditure data for spending as a share of GDP on childcare and education for children aged 0-5 (OECD, 2011). According to their figures (which are higher than our own as five-year-olds are included, almost all of whom are in full-time education in the UK) the UK spent 1.13% of GDP on these services in 2007, compared to an OECD average of 0.79%. Only seven countries spent more: Sweden (1.86%), Denmark (1.80%) France (1.66%), Iceland and Norway (1.45%), the Netherlands (1.39%) and Finland (1.34%). This places the UK still some way off the level of spending in France and Scandinavia, but comfortably in a second expenditure tier – well above Germany and Italy (0.75%), for example, or the USA (0.55%).2 On the other hand, a comparison of spending on cash benefits and tax credits (to all families with children, not just 0-5s) places the UK second only to Luxembourg, and if benefit and service spending are combined France comes top and the UK again second. Thus we see a reasonable level of spending on services in international terms, alongside an unusually high spend on cash benefits. It would be dangerous to deduce from this that the UK has got the balance wrong; clearly many factors (the incidence of lone parenthood, employment rates, wage levels) will be relevant. But it provides interesting context to any consideration of the composition of UK spending on young children. The following sections examine in more detail the way in which extra resources on young children were spent in the Labour years. What did the money buy? What impact did it have? We begin by looking at increased entitlement to leave in a child’s first year.
2 The accuracy of these comparisons has been questioned by academics who point to inconsistencies between UK government spending figures and figures reported for the UK by the OECD: see for example Lloyd and Moss (2013). However, one key explanation for the UK”s strong ranking is that most four and all five year olds are in full-time reception or Year 1 classes, staffed by qualified teachers. This is relatively unusual for other countries, where school starts later and children therefore remain longer in childcare settings.
WP04 Labour’s Record on the Under Fives: Policy, Spending and Outcomes 1997 - 2010
17
3. Parental leave, maternity and paternity pay
There were three main phases of changes to legislation governing parental leave policy under Labour. First, changes between 1999 and 2001 introduced a right to 13 weeks unpaid parental leave for parents of children under five, reasonable unpaid time off in emergencies for employees with dependants, and improved rights to maternity leave (including a reduced qualifying period).3 Second, from 6 April 2003, both Statutory Maternity Pay (SMP) and Maternity Allowance (MA) were extended from 18 weeks to 26 weeks, with an additional right to a further 26 weeks unpaid leave.4 In addition, the right to paternity leave was introduced for the first time, with two weeks Statutory Paternity Pay (SPP) paid at the same flat rate as SMP and MA. The right to adoption leave and to Statutory Adoption Pay was enacted, along with the right to request flexible working for parents of children under six or disabled children under 18. Finally, from 1 April 2007, the Work and Families Act (2006) increased both SMP and MA from 26 to 39 weeks, while also extending the right to statutory maternity leave to a full year to all employed women, regardless of length of service. The Act introduced Keeping In Touch days – up to 10 paid days in which women could work or attend training without affecting rights to SMP or SML. It also heralded two further changes which came into effect only as Labour left office: from April 2010 the right to request flexible working was extended to parents of all children under 17, while from April 2011 fathers gained the right to up to 26 weeks Additional Paternity Pay if mothers returned to work before exhausting their own paid entitlement. Meanwhile, the rate of maternity pay was increased in real terms, with particularly large rises between 2001 and 2003. Both SMP and MA were worth approximately 19% of average female weekly earnings in 1997, falling slightly to 17% by 2001. Two substantial annual increases then took the rate up to 25% by April 2003, and it has hovered between 24% and 25% since then.5 These changes shifted the UK right up an international comparison of maternity leave rights, to the most generous allowance in terms of length of leave allocated exclusively to mothers. The UK’s position is less favourable, however – closer to average – if we add in leave that can be split between mothers and fathers, or if we consider the paid value of the leave (OECD, 2011). The reforms were aimed at achieving a range of outcomes: increasing household income at a vulnerable time; increasing the rate of return to employment for mothers, so raising income and reducing gender inequality in the longer term; and doing the right thing for young children by making it possible for them to spend more time and build stronger relationships with both parents in their first year of life.
Expenditure:
Some of the changes regarding flexible working and rights to unpaid leave were effectively cost-free to the taxpayer but the increases in the length and generosity of maternity pay were expensive: an extra £1.7 billion in real terms was spent on maternity pay in Britain in 2009/10 compared to 1997/98, or £2.4 billion in total, plus a tiny fraction of that (£48 million) on paternity pay. These figures can be seen for England in Table 1 and for Britain in Figure 1. The figure shows the steep increases in spending after
3 Employment Relations Act 1999, the Maternity and Parental Leave (Amendment) Regulations 2001 and the Welfare Reform and Pensions Act 1999. 4 The two benefits are largely equivalent, except that SMP – for which a longer work record is required – pays 90% of earnings for the first six weeks before reverting to a flat rate payment. 5 Author’s calculations using IFS benefits data and the DWP Annual Abstract of Statistics.
WP04 Labour’s Record on the Under Fives: Policy, Spending and Outcomes 1997 - 2010
18
both the extensions of paid leave. The per-child line rises slightly more steeply than the overall line, showing that none of the increase reflects an increasing birth rate. Figure 1: Spending on maternity and paternity leave, Great Britain (2009-10 prices)
Source: DWP Expenditure Tables. Note: Per child numbers are calculated per child aged 0 in January of the relevant year.
Outputs:
First, we want to know whether it effectively increased the number of weeks parents spent on leave in the first year – this is the key policy output. We can then ask whether this in turn led to the intended changes in outcomes for mothers and children. Surveys conducted for the DWP in 2006 and 2008 allow us to compare the experiences of mothers of children born before and after the April 2007 changes. In 2006 49% of women who had worked in the year before birth took a maximum of six months leave; in 2008 this had dropped to just 14% (Chanfreau, 2011). The median length of maternity leave increased from 27 weeks to 39 weeks. Both figures are so close to the length of paid leave that it seems reasonable to conjecture that over the full Labour period the median leave may have increased from 18 to 39 weeks. A survey conducted in 2002 points to a median just a little higher than 18 weeks: 40% of women took 18 weeks leave or less and a further 35% took between 19 and 29 weeks (Hudson et al., 2004). However, differences in survey design and methodology mean this comparison should be treated with a little caution.6 Given the government’s focus on improving equality of opportunity, we also want to know whether women from different backgrounds were equally likely to increase the length of leave. NatCen’s figures show that more advantaged women – those from professional backgrounds, in higher paid jobs, and with higher-earning partners – were more likely to take longer leave in both 2006 and 2008, but that gaps narrowed over time, with policy changes apparently benefiting lower skilled and lower paid women most (Chanfreau, 2011). For example, 52% of women in administrative, secretarial, personal, sales and customer service jobs took a maximum of 26 weeks leave in 2006, compared to 39% of professional 6 The 2002 survey relied on a postal questionnaire, while the 2007 and 2009/10 used face-to-face interviews. The 2002 survey also had a much lower response rate (35%).
0
500
1000
1500
2000
2500
3000
3500
1996/97
1997/98
1998/99
1999/00
2000/01
2001/02
2002/03
2003/04
2004/05
2005/06
2006/07
2007/08
2008/09
2009/10
SMP, MA and PP(£mill ion)
Per child (£thousand)
WP04 Labour’s Record on the Under Fives: Policy, Spending and Outcomes 1997 - 2010
19
women. In 2008 these shares had fallen to 13% and 11% respectively. There was also a narrowing gap in the share of women taking longer leave, beyond 39 weeks: in 2006 36% of professional women took at least 40 weeks, compared to 20% of the administrative and sales group; in 2008 the shares were 51% and 44%. So the extended paid entitlement seems to have allowed women from lower skilled and lower paid jobs to make choices that only richer women had previously been able to afford.7 In contrast, surveys carried out in 2002, 2006 and 2008 indicate few differences in the percentage of fathers taking time off around the time of a child’s birth – although once again the 2002 survey is not fully comparable with the latter two so numbers should be treated with care. The 2002 Survey of Fathers, conducted before the introduction of a right to paternity leave, found that 96% of employed fathers took some time off around the time of birth, 64% using employer provided paternity leave, and 65% annual leave provision (Hudson et al., 2004). The least likely to take time off were machine operatives, but even among this group 90% took some time off. Fast forward to 2006, after the introduction of a paid paternity leave entitlement, and we find the share of employees taking leave very similar at 94% (La Valle et al., 2008).8 The 2008 survey finds 92% of employed fathers took time off (Chanfreau, 2011). Given that these figures include those taking a single day off for the birth the high rates and lack of movement are perhaps not very surprising. The surveys do point to a small increase in the length of leave taken between 2002 and 2006: the percentage of employed fathers taking one week or less had fallen from 37% to 25%, with a large increase in the share taking between one and two weeks (36% to 51%), and little movement in the share taking more than two weeks (23% to 21%) (La Valle et al., 2008).9 Men on middle and higher salaries appear more likely to take the two weeks than those on the lowest rates of pay. Figures from the 2008 survey look similar to 2006 except that the percentage taking longer than two weeks has increased – 30% up from 21% (Chanfreau, 2011). In short, the introduction of a legal right to paid paternity leave does not seem to have had any impact on the likelihood of taking a day or two off at the time of childbirth, but there has been an increase – a matter of a few days – in the length of leave taken. This may in part be driven by the financial value of the paid entitlement itself, but it may more plausibly result from changing expectations about fathers’ behavior – itself partly encouraged by official state sanction of a period of paternity leave.
Outcomes:
We know, then, that many mothers spent considerably longer at home as a result of the additional investment in SMP and MA, while the introduction of paternity leave and SPP at a low flat rate had much more marginal effects on the behaviour of fathers. We now turn to consider the impact increased maternity leave had on the three main intended outcomes for families and children. First, how many mothers returned to employment when their leave ran out, who would not have done so otherwise? This was one of the aims of the 2007 changes (BIS 2010). In particular, it was hoped that more women would
7 Of course longer leave and higher payments only affected the women who had rights to SMP or MA, excluding the most disadvantaged working women: 11% of mothers in the DWP 2009/10 survey received no maternity pay, despite having worked at some point in the 12 months before the birth. These women were much more likely than others to have been in temporary jobs, on low pay, or working few hours. Also excluded are women not in employment at all before the birth. Most of the women in both groups will have benefited financially from other government initiatives: some will have received the £500 Sure Start Maternity Grant payment, and most will have benefited from increased support through the tax credit system. 8 Only employees were asked this question in the 2002 survey so these are the data presented here. Self-employed fathers are less likely to take time off. 9 Percentages reported by (La Valle et al., 2008) Table 2.14 sum to 103%.
WP04 Labour’s Record on the Under Fives: Policy, Spending and Outcomes 1997 - 2010
20
return to the same place of employment, because past research had shown that loss of pay and responsibility were more likely for women changing employers. In practice, the DWP surveys find that rates of return have not shifted despite changing legislation (BIS, 2010). Among women who gave birth in 2006, 76% had returned to work 12-18 months after the birth, while 77% of those who gave birth in 2008 (and were entitled to the longer period of paid leave) had done so (Chanfreau, 2011); the figure for 2002 was 80% (Hudson et al., 2004). There must be factors other than the length of leave which are leading one fifth of women to break their labour market attachment after having a child – strong preference for being at home during a child’s early years, the birth of a sibling, or the cost and perceived quality of childcare options. On the other hand, BIS (2010) points to a “dramatic decline” in the proportion of mothers not returning to the same job with the same employer – down from 41% in 2002 to 14% in 2007 (p.15); the latest survey gives a figure of 16% for 2008 (Chanfreau, 2011). This suggests that 18 weeks leave was not sufficient for a substantial group of mothers – they preferred to break the link with a previous employer than return at that point – but after 26 or 39 weeks the benefits of retaining an old job outweighed the costs of leaving a baby. The second question is about what happened to income poverty and material hardship in households with a baby. Higher rates of SMP and MA for longer periods of time may have had a positive impact on poverty, although as the leave is not fully paid it will have reduced incomes in households where a mother would otherwise have returned to work earlier. It is beyond the scope of this paper to untangle these effects from other concurrent changes to cash benefits and tax credits but we consider overall changes in income poverty in households with young children in a later section. The third set of outcomes concern the relationship between mothers (and fathers) and children. That many more mothers were able to stay at home with their babies for several months longer could fairly be seen as a positive outcome in its own right. Are we also able to observe measurable changes in bonding and breastfeeding (and in longer-term child health and cognitive outcomes)? Bonding is very difficult to capture, and no suitable longitudinal data allow us to try, while longer-term outcomes suffer from the impossibility of isolating the individual impact of different initiatives; we look at child cognitive and social-behavioural outcomes at age five at the end of section 6. Breastfeeding, which has been shown to protect the health of mothers and babies and to have positive effects on children’s cognitive test scores (NICE, 2008; Borra et al., 2012), is easier to measure, although the difficulties of untangling the impact of different policies remain. Figure 2 shows breastfeeding prevalence during the nine months after birth, from NHS Infant Feeding Surveys (Becky Hamlyn et al., 2002; Bolling et al., 2007; Foster et al., 1997; Health and Social Care Information Centre, 2012). The figure shows a slight shift in rates between 1990 and 2000, which Hamlyn et al (2002) explain masks a real increase in Scotland and Northern Ireland but no change in England and Wales when the social class of the sample is controlled for. Since 2000 breastfeeding rates have risen significantly. The rise between 2000 and 2005 is almost entirely driven by an increase in breastfeeding initiation: among mothers who had breastfed at birth, the proportion still feeding at six weeks and at six months was roughly the same in 2005 as in 2000 (and had actually fallen in Scotland) despite the increase in the median length of leave taken, and despite the government’s adoption in 2003 of WHO guidance that babies should be exclusively breastfed for the first six months. However, between 2005 and 2010 we see an increase not just in initiation rates but also in the likelihood of continuing to feed. This is reflected more clearly in Figure 3. In 2010, 42% of mothers who started feeding were still doing so when their baby reached six months, compared to 33% in 2005.
WP04 Labour’s Record on the Under Fives: Policy, Spending and Outcomes 1997 - 2010
21
Figure 2: Prevalence of breastfeeding at ages up to nine months, UK 1995-2010
Source: (Health and Social Care Information Centre, 2012) Table 2.11 and Foster et al (1997) Notes: (1) Includes all mothers breastfeeding at each time-point, whether or not this is exclusive. (2) Nine months rate is based on a reduced number of cases excluding those babies who had not reached 9 months by Stage 3.
Figure 3: Incidence of breastfeeding among mothers who initiated feeding at birth UK
Source: (Health and Social Care Information Centre, 2012) Table 2.15 for 2005 and 2010, plus Infant Feeding Surveys for earlier years.
0
10
20
30
40
50
60
70
80
90
100
1 week 2 weeks 6 weeks 4 months 6 months 9 months
1995
2000
2005
2010
0
10
20
30
40
50
60
70
80
90
Birt
h1
we
ek2
we
eks
6 w
eek
s
4 m
onth
s
6 m
onth
s
9 m
onth
s
1990
1995
2000
2005
2010
WP04 Labour’s Record on the Under Fives: Policy, Spending and Outcomes 1997 - 2010
22
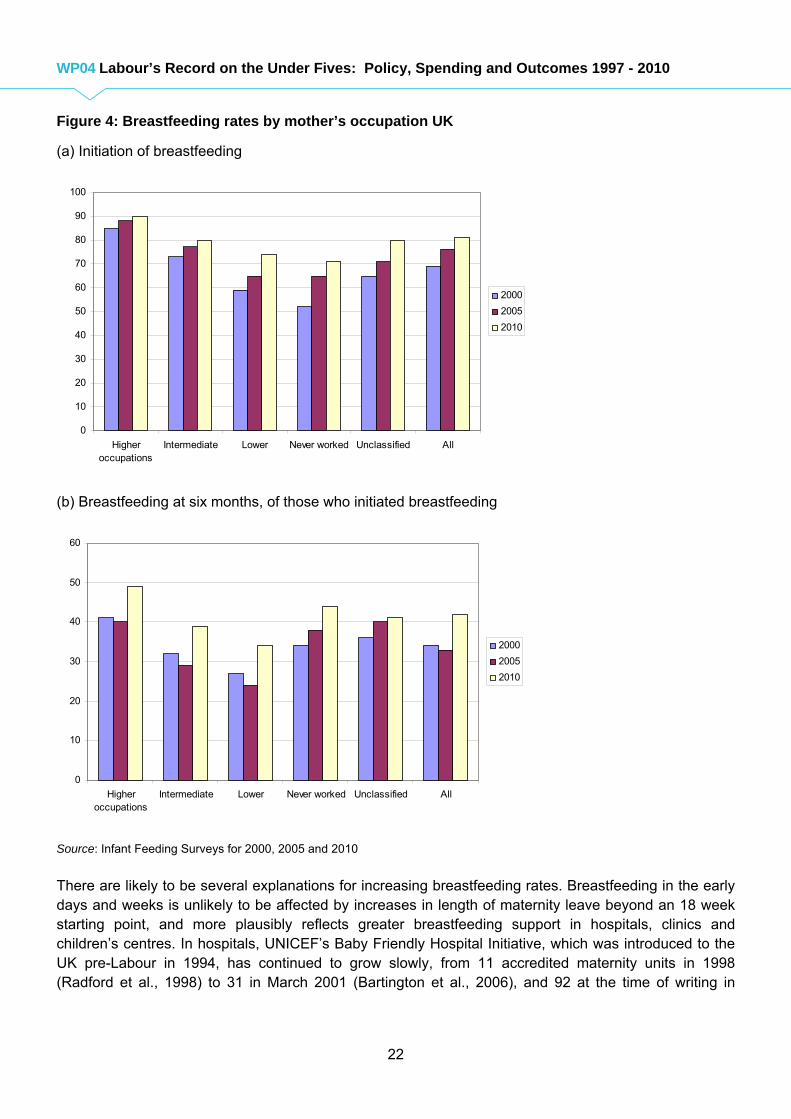
Figure 4: Breastfeeding rates by mother’s occupation UK
(a) Initiation of breastfeeding
(b) Breastfeeding at six months, of those who initiated breastfeeding
Source: Infant Feeding Surveys for 2000, 2005 and 2010
There are likely to be several explanations for increasing breastfeeding rates. Breastfeeding in the early days and weeks is unlikely to be affected by increases in length of maternity leave beyond an 18 week starting point, and more plausibly reflects greater breastfeeding support in hospitals, clinics and children’s centres. In hospitals, UNICEF’s Baby Friendly Hospital Initiative, which was introduced to the UK pre-Labour in 1994, has continued to grow slowly, from 11 accredited maternity units in 1998 (Radford et al., 1998) to 31 in March 2001 (Bartington et al., 2006), and 92 at the time of writing in
0
10
20
30
40
50
60
70
80
90
100
Higheroccupations
Intermediate Lower Never worked Unclassified All
2000
2005
2010
0
10
20
30
40
50
60
Higheroccupations
Intermediate Lower Never worked Unclassified All
2000
2005
2010
WP04 Labour’s Record on the Under Fives: Policy, Spending and Outcomes 1997 - 2010
23
November 2012, out of 306 units in total.10 Comparisons for the UK using the MCS (Bartington et al., 2006) and for Scotland using postal questionnaires (Broadfoot et al., 2005) have found that babies born in a Baby Friendly hospital are significantly more likely to be breastfed initially and one week after birth, although no impact was found on feeding rates after one month. Increased BFHI coverage is likely therefore to be one explanation for better initiation rates. Initial breastfeeding rates have also risen more rapidly in the parts of the UK with better BFHI coverage (Scotland and Northern Ireland) than in England.11 In the community, there has been increased support for breastfeeding available through Sure Start as well as other small programmes such as the Infant Feeding Initiative (1999-2002) which funded 79 small scale breastfeeding projects. 12 An assessment of the 79 projects points to both quantitative and qualitative evidence that breastfeeding support counselors, drop-ins, peer support networks and ante-natal classes all contribute to higher initiation and continuation rates (Dykes, 2003). A review of breastfeeding support in Sure Start Local Programmes found “promising early benefits” from a range of different programmes, with some SSLPs able to report an increase in breastfeeding rates (not all programmes had effective monitoring systems in place to provide comparable data over time) (Latham et al., 2006). Nevertheless, the increased length of maternity leave looks like an important further factor in explaining the increased duration of breastfeeding, especially the rise observed for working mothers between 2005 and 2010. Returning to work at six months means returning before a baby is fully weaned onto solids, which means planning ahead to ensure the baby will take a bottle. This could plausibly affect not just feeding patterns at six months but also earlier, at four months and even at six weeks. Research studies have consistently backed the intuition that length of leave might affect breastfeeding duration. Studies from the US tend to focus on an earlier return to work (within 12 weeks) (Berger et al., 2005; Ogbuanu, 2009), but studies from Canada and Singapore have explored the difference between leave of six months and a year and found significant effects (Baker and Milligan, 2008; Chuang et al., 2010). The Canadian study shows an increase in the likelihood of breastfeeding at all ages, with greatest impact between three and nine months. More broadly, examining data for 18 OECD countries over 30 years, Tanaka (2005) finds that that the extension of paid maternity leave has significant effects on decreasing infant mortality rates, via mechanisms which Tanaka hypothesizes include breastfeeding.
10 See UNICEF UK Baby Friendly Initiative webpage for the latest figures, http://progress.babyfriendly.org.uk/htables/all_hospitals_acc_status.asp. Last accessed November 22 2012. 11 Wales also has high BFHI coverage, but breastfeeding data are only available for England and Wales together until 2005. As of November 2012, 79% of births in Scotland were in BFHI hospitals, compared to 69% in Wales, 59% in Northern Ireland and just 19% in England (UNICEF UK BFHI website; see previous footnote). Infant Feeding Surveys indicate that initial breastfeeding rates had risen by 77% in Northern Ireland between 1990 and 2010, by 48% in Scotland and by 28% in England and Wales. Breastfeeding initiation remained most common in England but there had been substantial convergence by 2010: England 83%, Scotland 74%, Wales 71% and Northern Ireland 64% (Health and Social Care Information Centre, 2012). 12 This is an example of funding for services for under-fives which is not captured in Table 1. Nearly £3 million was spent between 1999 and 2002 to the Infant Feeding Initiative from the Public Health Development Fund to support projects that identified and developed innovative practices that aimed to increase breastfeeding initiation and duration rates, especially among groups less likely to breastfeed. 79 projects were successful in gaining funding.
WP04 Labour’s Record on the Under Fives: Policy, Spending and Outcomes 1997 - 2010
24
4. Sure Start Local Programmes and Children’s Centres
Sure Start was Labour’s flagship programme for young children in England, aiming to fill in the patchwork of services that existed for pre-schoolers and their parents, and in doing so to change children’s long-term developmental trajectories. The initial plan, announced in 1998, was for 250 Sure Start Local Programmes (SSLPs) in the most deprived 20% of wards, but this was quickly expanded and by 2003 there were 524 SSLPs in place. One of the unique characteristics of the programmes was that content was to be locally defined, with priorities agreed by a local board that included representatives of the local authority, parents and the voluntary sector, but all were to offer five key services: outreach and home visiting; parenting support; play and learning opportunities; healthcare and advice; and support for parents and children with special needs. From 2004, Sure Start was transformed into rather a different animal, with the decision to create 3,500 Sure Start Children’s Centres, one in each community in England, and to bring the centres under local authority control (DfES et al, 2002; HM Treasury et al, 2004). “Community” appears to have been loosely defined, and the number 3,500 does not correspond to any defined geographic area, but allows for one centre for roughly every 800 children aged under four. The expansion took place in three phases: Phase 1 from 2004-06 established 800 centres concentrated in the 20% most deprived areas in England (many of which already had an SSLP to build on); Phase 2 from 2006-08 expanded provision to 2,500 centres in the 30% most deprived areas and beyond, with most centres developed from scratch; and in Phase 3 from 2008-10 a further 1,000 centres were set up in the rest of the country. The publication of Every Child Matters in 2003 was a key part of the background to the shift to the Children’s Centre model. A reaction to the death from abuse and neglect of eight-year-old Victoria Climbié despite the fact that a number of different agencies were in contact with the family, ECM emphasised the importance of integrating services around the child and gave local authorities responsibility for ensuring this took place; from 2006 LAs also had to appoint a Director of Children’s Services to make lines of accountability even clearer (HM Treasury, 2003; Lewis et al, 2011a: Eisenstadt, 2011). As Eisenstadt (2011) points out, if local authorities (and ultimately Directors of Children’s Services) were to be responsible for joined-up delivery of all services for children in the area, Sure Start services had to be included. At the same time, the shift to Children’s Centres enabled the government to develop a stronger emphasis within Sure Start on both early education and childcare. Neither played a large role in SSLPs, and the quality of such provision as existed was often poor (Lewis et al, 2011a; Anning et al, 2005; Anning and Ball, 2008). Early findings from the first round of the SSLP evaluation were disappointing, particularly as regarded children’s cognitive outcomes (see discussion below). Meanwhile, other early years initiatives including Early Excellence Centres and the Effective Provision of Pre-School Education Project were emphasising the impact on child outcomes of good quality integrated education and care. The reorganisation of Sure Start allowed these lessons to be taken on board (DfE, 2002). In addition to the original SSLP core services, centres in the most deprived 30% of areas were expected to provide integrated early education and childcare for ten hours a day, five days a week, 48 weeks a year, while all centres were required to provide support for childminders and links with Jobcentre Plus for training and employment advice. On the other hand, critics of the change in direction argued that funding would be diluted and that the increase in local authority control effectively downgraded the role played by parents and the community. In addition, there was discomfort at the stronger focus on childcare, which was seen by some as a
WP04 Labour’s Record on the Under Fives: Policy, Spending and Outcomes 1997 - 2010
25
betrayal of the original Sure Start focus on play, nurture and parenting support: Norman Glass, regarded as the ‘father’ of Sure Start, argued that the programme had been “capture[d] by the ‘employability’ agenda” (Glass, 2005; see also Bradley et al., 2008 and Meadows, 2008). The speed of response to very early findings for a programme with long-term goals also raised concern, with the Education and Skills Committee pointing out that “significant changes are being made to the Sure Start programme when evidence about the effectiveness of the current system is only just beginning to emerge”.13 We begin here by examining the evolution of expenditure on Sure Start in all its guises, before turning to consider what the money bought, and finally whether measured outcomes changed.
Expenditure:
Table 1 showed the steady rise in total spending on Sure Start, Early Years and Childcare programmes between 1997 and 2010, culminating in a spend of £1.9 billion in 2009-10; this is nearly as much as was spent on maternity pay that year, though still well under half of the budget for early education for three and four year olds (shown as Local Authority spending in the top line of Table 1). A considerable chunk of the money was capital spending, including that used to provide new buildings or to convert existing nursery schools and community centres to provide the range of Sure Start services. From 2003/04 not all of this spending went on Sure Start Local Programmes and Children’s Centres: the ring-fenced Sure Start grant allocation includes other early years initiatives, such as subsidies for childcare in disadvantaged areas. Figure 5 shows approximate figures for the part of the grant allocated specifically to SSLPs and SSCCs. In addition to being a little rough, these numbers are not fully comprehensive. While they capture resources allocated from the Department of Children, Schools and Families to local authorities, a number of Children’s Centre services are funded separately, from the DCSF itself, from other departments including the Department of Health and the Department of Work and Pensions, and from the voluntary sector and fee income (NAO, 2009). A survey conducted by the NAO in 2008 found that about 85% of the budget in Phase 1 centres and 95% in Phase 2 centres came from the Sure Start grant. A 2010 report by the House of Commons Children, Schools and Families Committee called on the Government to “make more effort to work out the totality of funding that is supporting Centres” (House of Commons, 2010, para 98), declaring it “unacceptable that such basic information remains apparently unknown.” What is clear, though, is that while spending on Children’s Centres continued to rise, it did not do so as quickly as the number of centres, and funding for later centres was far less generous than for the early SSLPs. Fully operational SSLPs spent on average around £872,000 a year at 2009-10 prices), or £1,090 for each of the 800 children in a Sure Start area.14 In the government’s guidance for universal rollout it anticipated that local authorities would allocate around £400,000 a year to centres in the most deprived 30% of areas. Former SSLPs would continue to receive more support than other Phase 1 and 2 centres, so would not face a sudden drop in resources, but a gradual taper would ensure that by 2011-12 all centres in disadvantaged areas were funded on an equal basis, regardless of origin (DCSF, 2007). Funding for Phase 3 centres would be much lower at between £100,000 and £250,000. Of course, later centres were by definition located in less disadvantaged areas and so may have required fewer resources. On the other hand, as expert witnesses to the Children, Schools and Families Committee
13 Education and Skills Committee, Ninth report of session 2004-05, Every Child Matters, HC 40-1, para 39. 14 Author’s calculation using price deflators and (Belsky et al., 2007)’s estimation of £700,000 per year at 1999-2000 prices (p.121). NESS (2010a) has a slightly higher per child figure of £1,300 in 2009-10 prices.
WP04 Labour’s Record on the Under Fives: Policy, Spending and Outcomes 1997 - 2010
26
pointed out, they also served larger and more disparate communities, making identifying and engaging the most needy families a challenge (House of Commons, 2010). Evidence from surveys of centre expenditure indicates that funding per centre dropped substantially in later years – for existing centres as well as new ones – so part of the cost of the roll-out was a thinner service all round. NAO (2006) found average expenditure in former SSLP Children’s Centres to be £580,000 in 2005-06, while spending in other centres averaged £350,000. A follow-up survey in 2009 found former SSLP spending down to £510,000, with other Phase 1 centres spending £290,000 on average and Phase 2 centres £120,000 (NAO, 2009). In real terms, this is a 20% drop in funding for former SSLPs and a 24% drop for other Phase 1 centres.
Inputs:
The most obvious and lasting legacy are the buildings in which Sure Start Children’s Centres are located, many of them built new or resulting from major conversions. SSLPs received a minimum capital allocation of £750,000, and 84% undertook at least one major construction project; by late 2004 215 new buildings had been built and 420 converted in the first 260 SSLPs alone (Ball and Niven, 2005). The Commission for Architecture and the Built Environment (CABE) conducted a post-occupancy evaluation of 101 of the new buildings and found that while the buildings weren’t always rated highly by architects, “parents were very positive about almost all of the buildings and the benefits that they feel result from using them” (CABE, 2008). In trying to understand why users praise buildings seen as unremarkable by design professionals, CABE concluded that parents were so pleased to have the new facilities that the operation and appearance of the building was secondary. They noted that many families are unlikely to have had prior access to similar provision, and that those living in cramped conditions with no outdoor space at home would find the generous play spaces especially welcome. Centre staff were also positive about the buildings, and CABE believed that this was contributing to staff recruitment and retention and to higher job satisfaction.15 The average capital allocation in Phase 2 and 3 of the Children’s Centre programme was estimated by the Children, Schools and Families Committee to be £274,000 (House of Commons, 2010, para 46). These centres made much greater use of spare capacity on school sites or co-located with health centres, community centres, libraries and (in Northumberland) even fire stations. In some parts of the country services were delivered from mobile play vans. Thus while the number of designated Children’s Centres multiplied as planned, from 800 in March 2006 to 3,631 in April 2010, many of the newer centres were very different, slimmed-down versions of the original model. They may have successfully delivered key services with low upfront costs in a flexible way entirely appropriate for less urban areas – but they may also have missed out on part of what made SSLPs so popular. In their 2005 evaluation of SSLPs Ball and Niven concluded that “the existence of buildings is essential to Sure Start” (p.9) and reported SSLPs’ own view that services declined in quality and were less well-used when there was an interruption to delivery from one recognised site. In fact, Lewis et al. (2011) point out that in practice even in urban areas CCs are often service umbrellas rather than single buildings, despite the expectation of parents (and staff); all the Children’s Centres they visited in three urban local authorities provided services from more than one site. They highlight the additional difficulties of integrating staff and providing a joined-up service when there are multiple sites.
15 CABE’s view on the sub-optimal design is that the ‘relatively small’ budget available to most centres meant that only those features that formed the core requirement or had dedicated budgets were provided adequately. Elements including adult space, outside space, storage and environmental sustainability suffered.
WP04 Labour’s Record on the Under Fives: Policy, Spending and Outcomes 1997 - 2010
27
Figure 5: Spending on Sure Start Local Programmes and Sure Start Children’s Centres in England (2009/10 prices)
Source: Current spending series is reproduced from Figure 3 in NAO (2009), where the original source is given as National Audit Office/Department for Children, Schools and Families. Capital spending on Children’s Centres 2003/04 to 2009/10 is reproduced from Figure 4 in NAO (2009). A note to that figure states that the numbers reported exclude capital funding for SSLPs of £430 million between 1999 and 2006. We have added the £430 million (converted to 2009/10 prices), using the numbers reported in Table 1 to divide between the years. The full sum of capital spending reported there for 1999/00 to 2004/05 fell £49 million short (in current price) so this was added to Children’s Centre spending for 2005/06. In short, it has been remarkably hard to get a concise picture of expenditure on Sure Start Local Programmes and Sure Start Children’s Centres, but this figure provides an approximation. Note: For 2008/09 onwards, allocated funding has been used.
No data are gathered on staffing levels at Children’s Centres, and assessing the way non-capital money was spent is further complicated by a range of modes of service delivery, with services and staff time often bought in from other organisations rather than provided directly. NAO (2009) found salaries to be the main expenditure item across all centres, taking up two-thirds of the budget in former SSLPs and Phase 2 centres, and three-quarters elsewhere; Tanner et al. (2012) also found roughly three-quarters of Children’s Centre budgets going on staff with the rest on goods, services and materials. Lewis et al. (2011) point to differences across centres in the qualifications, professional background and values of managers, and in the deployment of other staff: for example, two out of 23 CC managers interviewed mentioned the importance of having employed a qualified teacher to advise on curriculum development and the content of ‘stay and play’ sessions.
0
200
400
600
800
1000
1200
1999
/00
2000
/01
2001
/02
2002
/03
2003
/04
2004
/05
2005
/06
2006
/07
2007
/08
2008
/09
2009
/10
Total current
Total capital
Box 1: Services and Activities found in Sure Start Children’s Centres: some examples
‘Baby Bounce and Rhyme’ sessions, speech and language therapy appointments, baby massage, fathers’ groups, housing advice, Citizens’ Advice Bureaux, money management workshops, sexual health clinics, holiday and after-school clubs for older children, home birth support groups, breastfeeding support groups, ‘Stay and Play’ sessions, book and toy libraries, community cafés, sales of cost-price home safety equipment, relationship counselling, befriending services, family learning, parenting skills courses, childminder drop-ins, healthy eating classes, smoking cessation groups, basic skills courses including ESOL and IT, domestic violence support groups, advocacy services, dental hygiene clinics, multiple birth support groups.
Source: House of Commons (2010)
WP04 Labour’s Record on the Under Fives: Policy, Spending and Outcomes 1997 - 2010
28
Outputs:
Buildings, staff and other inputs were used to deliver a very wide range of services, with considerable local variation, making programme content difficult to summarise. Box 1, reproduced from House of Commons (2010), lists examples of services and activities found in Sure Start Children’s Centres. Tanner et al. (2012) conducted a survey of nearly 500 Children’s Centres in disadvantaged areas during summer 2011, representative of Phase 1 and 2 centres. The most frequent services encountered were ‘Stay and Play’ (offered by all); home based services (offered by 99%); parent and family support classes or groups (93%); breastfeeding support (91%); adult learning programmes (87%); parent forums (86%); evidence based parenting programmes (84%); health visitor clinics (82%); and early learning and childcare (82%). Early learning and childcare and ‘Stay and Play’ were found to be the most popular services on offer; employment and benefits advice and adult education the least popular. Tanner et al found the average number of users in the past three months was 337, with some centres reporting up to 4,000. The 2009 survey conducted by the NAO found that “overall there was a clear link between amounts spent and numbers of service users… Generally… the more hours of service a centre provides, the higher its delivery costs.” This supports the rather obvious hypothesis that centres with less funding will provide less, although the association does not appear as strong as might be expected: Table 4 shows the median number of service beneficiaries by centre phase, and this makes non-SSLPs centres in Phase 1 appear relatively good value for money, reaching as many or more users for most services on a much lower average budget than centres which developed from SSLPs. However, former SSLPs are doing better on parental outreach, and this carries much the highest delivery cost per user (with the exception of links with Jobcentre plus, which seems to be expensive because there are so few users). The NAO had insufficient data to include Phase 3 centres in its comparisons, but with far smaller budgets these will inevitably offer a considerably reduced service. In evidence to the Children, Schools and Families Committee, Professor Iram Siraj-Blatchford argued that many later centres provide “only a fraction of the services provided by the Phase 1 Centres… with many operating on a shoestring.” (House of Commons, 2010, para 44). Successful outreach, and ensuring that services are used by those most in need of them, are crucial outputs for Sure Start. Universal access was an important aspect of programme design, intended to avoid stigma, and commentators have pointed to other characteristics of Children’s Centres which make them better placed to reach vulnerable families than traditional delivery models, including integrated, multi-agency teams; personalised outreach workers; a welcoming and non-threatening environment; and co-location of services (House of Commons, 2010). However, early evaluation data pointed to worse outcomes for some of the most disadvantaged groups in Sure Start areas than for similar groups in comparison areas, discussed below, and NAO (2006) also highlighted concerns that centres were not effectively targeting those most in need. Later evaluations found no difference in the Sure Start effect for more and less disadvantaged groups, suggesting that outreach improved with time, while the 2008 DCSF survey of parents found no evidence that sub-groups were being excluded or failing to access the centres (DCSF, 2009a). In a report on 20 children’s centres conducted at the same time as the parents’ survey, (Ofsted, 2009) concluded that engagement continues to be a challenge and that “despite a clear commitment to reach out to the most disadvantaged and vulnerable families, no centres felt they were fully successful in doing so” (para 32).
WP04 Labour’s Record on the Under Fives: Policy, Spending and Outcomes 1997 - 2010
29
Table 4: Median number of service beneficiaries per week of different children’s centre activities by phase
Former Sure Start Local Programmes Other Phase 1 Centres Phase 2 Centres
Early learning/full day care
246
291
200
Drop-in sessions for parents/carers and children*
88 119 48
Teacher input to learning development*
97 104 55
Child/family health (including antenatal)*
70 35 32
Parental outreach* 60 42 18
Family support services* 55 54 17
Childminder network or other support to childminders
6 10 7
Support for children with special needs and/or parents/carers
10 23 6
Link with Jobcentre Plus 6 6 5
Number of centres 26-40 15-29 43-109
Median spending by centre £510,000 £290,000 £120,000
Source: NAO (2009), Figure 17 and Figure 6. Notes: * NAO (2009) reports these as statistically significant differences, but does not make it clear which columns the test of significance refers to.
For the years 2008-09 to 2010-11, the DCSF increased Sure Start funding to local authorities to allow for two additional outreach workers per centre in the most disadvantaged areas, as recommended by NAO (2006). It is impossible to know in practice how the money was spent, but that centres in the 30% most deprived communities reported to NAO (2009) that only 38 staff hours a week was spent on outreach (so one worker rather than two or three), though the DCSF believe this may underestimate the actual hours provided.
Outcomes:
What difference did Sure Start Local Programmes and Children’s Centres make in practice to children’s outcomes? There is widespread evidence from a range of sources – user satisfaction surveys, qualitative studies, case studies and anecdote – that besides being popular places where parents and children enjoy playing and socialising, centres have had positive impacts on individual lives through the development of confidence, skills and social networks (e.g. House of Commons, 2010; Power, 2007; DCSF, 2009a). The Children, Schools and Families Committee report notes that “it is common for parents to describe the impact of their contact with Children’s Centres as ‘life-changing’” (para. 81), and that the majority of submissions to the inquiry “evinced a strong commitment to the idea of Children’s Centres, and a firm belief that they are having benefits now, and they will over time reduce the need for more expensive and intrusive interventions later in children’s lives” (House of Commons, 2010, p.43). But are these impacts quantifiable: do they show up as the statistically significant effects on child outcomes we would hope to see if Sure Start is to transform longer term life chances?
WP04 Labour’s Record on the Under Fives: Policy, Spending and Outcomes 1997 - 2010
30
Sure Start Local Programmes were rigorously evaluated, despite significant complications, including the difficulty of identifying a comparable control group, and the problem that local control meant each programme offered a different package of services delivered in a different way (see discussion in Belsky et al, 2007 and Eisenstadt, 2011).16 Nevertheless, the evaluation findings provide solid evidence of positive and significant Sure Start effects, albeit smaller and less extensive than had been hoped for. Initial results were disappointing: the most disadvantaged three-year-olds and their families (teenage parents, lone parents and workless households) were doing less well in SSLPs than outside them, scoring lower on verbal ability and social competence and higher on behavioural problems (NESS, 2005). Somewhat disadvantaged households within the areas did seem to be benefiting, suggesting that the new programmes were less well targeted than those they replaced. However, later results were more positive. Three year olds assessed when programmes had had longer to bed in displayed more positive social behaviour and greater independence/self-regulation than their counterparts in non-SSLP areas, while parenting was found to be less negative and the home learning environment richer (NESS, 2008). Families used more child and family development services in Sure Start areas, and children were more likely to have been immunised and less likely to have had an accident in the preceding year (although the research team raised concerns that these last two differences might be explained by methodology). This time there were no differences across sub-groups. When children were five years old, mothers in SSLP areas reported a more stimulating and less chaotic home environment, less harsh discipline, and greater life satisfaction – although they also reported more depressive symptoms (NESS, 2010b). Children in non-SSLP areas had caught up with Sure Start children on self-regulation, but Sure Start children had better physical health and were less likely to be overweight. Mothers in SSLP areas also reported more positive change over time (between three and five) in life satisfaction, more improvement in the home learning environment (HLE), a bigger reduction in harsh discipline and a greater decrease in workless household status (between 9 months and 5 years old). The latter was estimated in an economic evaluation of Sure Start to be worth between £279 and £557 per eligible child over a lifetime, so a small payback towards the average SSLP cost of £4,860 per child (NESS, 2010a). Finally, when children were seven years old, mothers continued to report less harsh discipline and a more stimulating HLE; and mothers of boys also reported a less chaotic home environment, while life satisfaction was higher for mothers in lone parent or workless households in SSLP areas than outside them (NESS, 2012). There were no adverse effects and the positive effects appeared to apply to families at all levels of disadvantage and area deprivation. Significant Sure Start effects were identified for only a minority of outcomes in any year: at age three, 7 of 14 indicators were positive and significant; at aged five, 6 positive and 2 negative out of 21; and at aged seven, just 4 out of 15 (two for sub-groups only). Most strikingly, no significant effects were found for any measures of children’s cognitive or social development at age five or age seven, despite evidence of improved parenting and a better HLE. As the NESS (2012) team point out, this may be explained by the fact that nearly all children, in and out of SSLP areas, took up the entitlement to part-time pre-school education (discussed below), which may have allowed children in non-Sure Start areas
16 As discussed by both Belsky et al (2007) and Eisenstadt (2012), politicians did not agree to set up Sure Start as a randomised controlled trial, so an initial design used a control group of areas waiting to receive an SSLP. This evaluation strategy was thrown off course by the decision to roll out programmes to these areas earlier than had been expected. The evaluation ended up as a comparison between families in SSLP areas and similar non-SSLP families in the Millennium Cohort Study, introducing a two-year time lag between treatment and comparison group because of the timing of the MCS.
WP04 Labour’s Record on the Under Fives: Policy, Spending and Outcomes 1997 - 2010
31
to catch up with the advantages SSLP children enjoyed at three. It is also the case that SSLPs did not have a strong focus on early education and cognitive development, as noted above, so any impact would be expected to come through parenting and the home environment. Parenting behaviours are notoriously difficult to shift, and it is encouraging that positive parenting effects are picked up consistently and that they appear to persist over time. NESS (2010a) argue that “it is very likely” that improvements in home environment, chaos and harsh discipline will deliver future positive benefits in education, worklessness and offending, although the size of these benefits cannot be predicted. No similar results are yet available for Sure Start Children’s Centres (which have lower budgets than SSLPs, as discussed, but with a stronger focus on early learning and childcare that might be expected to yield more positive developmental outcomes). In fact with no control group it is not possible that such rigorous outcome data will ever be available, although a six-year national evaluation is underway which will explore the effectiveness of different approaches to management and delivery. In addition, centres are responsible for self-evaluation, including an ‘annual conversation’ with local authorities in which they must report their performance against a range of indicators: worklessness, take-up of formal childcare, performance in the Early Years Foundation Stage, health indicators and engagement with vulnerable groups. However, aside from the difficulty of showing impact without a comparison group, there are concerns about how far centres are in a position to track these measures given a lack of detailed baseline data, limited capacity and expertise, and the extra complication of highly mobile populations in some areas (House of Commons, 2010). The NAO (2009) found that performance monitoring had improved considerably since 2006, when more than half of local authorities were not conducting any performance monitoring at all, but all the centres spoken to emphasised the difficulty of measuring impact. The majority of managers interviewed by Lewis et al. (2011) found the monitoring process onerous and time-consuming and many said that baseline data from health and local authorities were unavailable. This leaves Children’s Centres in a vulnerable position as they face local authority budget cuts and the removal of their ringfence under the Coalition government. Without clear outcome data it will be harder to protect services which are working, or indeed to identify aspects of provision which are less effective and to prioritise spending accordingly. Furthermore, if cuts are implemented before monitoring systems are well-established, the extent of damage may not be captured – and monitoring itself is likely to fall victim to tighter budgets.
WP04 Labour’s Record on the Under Fives: Policy, Spending and Outcomes 1997 - 2010
32
5. Childcare
With the publication of the National Childcare Strategy in 1998, the Labour Government became the first administration since the Second World War to accept state responsibility for developing childcare policy (Lewis, 2012). The National Childcare Strategy and later the 2004 Ten Year Strategy for Children and the 2006 Childcare Act had two over-arching goals: to enable mothers (and particularly lone mothers) to go out to work, thereby reducing child poverty; and to improve children’s opportunities directly by giving them exposure to early education. It was hoped that high quality, affordable childcare could contribute to both goals at once, delivering a so-called “double dividend” (DfES, 2002). In practice, there remains a distinction between institutions whose primary focus is childcare while parents work and those providing part-time provision of early education. In this section we focus on the expansion of childcare for working parents and in the next section on the early education entitlement. In keeping with the format in the rest of this paper, we begin each section by looking at spending, and then consider inputs, outputs and outcomes.
Expenditure:
Table 1 shows how spending on the two main forms of childcare subsidy, the tax credit and employer childcare vouchers, grew from close to zero in 1997-98 (when a small subsidy for low-income working parent was available through Family Credit) to £1.8 billion in 2009-10. To this should be added some of the expenditure grouped under the Sure Start heading, although it is difficult to calculate just how much. Part of the bars in Figure 5 which are not SSLPs or Children’s Centres will have been spent on childcare initiatives, including the Neighbourhood Nurseries Initiative (2001-2006), Early Excellence Centres (1997-2006), start-up funding for childcare providers and investments in quality (throughout). Some expenditure on childcare in disadvantaged areas will also have come through the Children’s Centre budget. Reaching a total is nothing more than guesswork but it could easily amount to £2.5 billion in 2009-10, almost entirely new money compared to 1997.
Inputs:
The first thing to understand about Labour’s childcare strategy is that the expansion of places was largely built on quasi-market principles. Rather than investing in direct state provision, private and voluntary providers were encouraged to meet demand, with the state providing demand-side funding to back up parental choices. The idea was to support the principles of choice and flexibility to parental needs, allowing working parents (for example) to access childcare with a childminder rather than in a nursery if they preferred home care, or to nest the free entitlement within a more useful longer day of childcare. The 2004 ten year strategy for childcare was actually called “Choice for parents, the best start for children”, making it clear just how much value was attached to parental choice within the childcare agenda. The quasi-market structure was in keeping with wider New Labour approaches to choice and competition in public services. As Lewis (2012) points out in her historical analysis of childcare policy in England, the strategy was also shaped to some extent by the decisions of governments in previous decades not to intervene in childcare provision, leaving the private and voluntary sector to fill the gap. By 1997, it would perhaps have been difficult for a government to move against this environment and take a central role as direct provider. On the other hand, private and voluntary sector providers were not just given equal status with the maintained sector but were given clear preference: the 2006 Childcare Act stipulated that, while local authorities in England had a duty to ensure sufficient childcare places for all those children
WP04 Labour’s Record on the Under Fives: Policy, Spending and Outcomes 1997 - 2010
33
whose parents wanted them, they should not directly provide the places unless no private or voluntary sector organisation was willing to do so. In practice, there were two main demand-side funding policies, the childcare tax credit and the employer voucher. The tax credit refunded working parents on low incomes (those eligible for Working Tax Credit), initially up to 70% and from April 2006 up to 80% of the cost of a childcare place, up to maximum costs of £175 for one child or £300 for more than one. Places could be in any registered setting outside the parent’s home, including with a childminder. The second policy was a salary sacrifice scheme which allowed employees to receive part pay in childcare vouchers, saving up to around £900 a year, or £1,100 for higher-rate taxpayers (but both parents could claim, doubling the benefit). As Table 1 shows, the tax credit was much the bigger scheme, taking £1.34 billion in 2009-10 compared to £400 million for childcare vouchers. Some 460,000 families in England benefited from the credit in 2009-10, receiving an average weekly award of £67.50, or £3,500 a year (HMRC, 2011). Analysis of survey data for 2007 suggests that in that year 190,000 people across the UK benefited from a total of £170 million in childcare vouchers, so an average of £895 each (Konings, 2010); an additional £70 million seems to have been spent on administration.17 Most recipients were middle income earners: 83% paid tax at the basic rate. While the bulk of state support for childcare came through these demand side funding routes, there were also elements of supply side funding, in particular in disadvantaged areas, where it was understood that low employment might make it difficult for providers to secure a sufficient and stable income to survive without state intervention, particularly in their first few years. Direct funding through the Neighbourhood Nurseries Initiative and subsidised loans to new providers were intended to address this problem of market failure in the short-term, with childcare tax credit the preferred subsidy mechanism in the longer run. In fact, continued supply-side funding for childcare provision in Children’s Centres is an acknowledgement that direct financial support for providers in disadvantaged areas may be necessary in the long run. Early Excellence Centres, launched by the government in 1997, were also largely located in disadvantaged areas (two-thirds in the most deprived 20%), although the intention of these was slightly different, to provide models of good practice and help to increase the quality of provision (Bertram et al, 2004). Early Excellence Centres and their funding were also folded into the Children’s Centre programme from 2006. In total, direct supply side funding for childcare in 2009-10 is impossible to calculate because we do not have breakdowns for Children’s Centre budgets, but is certainly considerably less than funding on the demand side. Finally, childcare resources were also spent on measures to improve the quality of provision. One key development was the introduction of an integrated curriculum covering all settings in England catering for children between 0 and 5. The 2006 Childcare Act removed any legal distinction between childcare and nursery education and placed a statutory duty on local authorities to improve outcomes for young children and to reduce inequalities. The 2007 Early Years Foundation Stage Framework imposed a single regulatory and quality framework on all providers, from childminders to reception classes, whether or not they were in receipt of public funding. The EYFS specified learning and development objectives across seven areas, and also required practitioners to plan activities and observe children in a systematic way, and to combine child-led activities with moments of adult stimulation. Gambaro (2012) argues that its introduction marked the first time that regulation was used for younger children not just to dictate structural features (ratios or health and safety requirements), but to influence the interaction
17 Employers are not required to report numbers of employees receiving vouchers, so official administrative data on take-up does not exist.
WP04 Labour’s Record on the Under Fives: Policy, Spending and Outcomes 1997 - 2010
34
between workers and children, trying to ensure a child-centred approach to learning. 18 A second important change was the 2001 expansion of the education inspectorate, Ofsted, to cover all childcare and early education providers in England, with regular inspection of both centre-based care and childminders. This was largely then a command and control approach to improving quality: the curriculum set out what should be taking place in childcare settings, and Ofsted inspections assessed how effectively this was happening in practice. However, there were also attempts to improve the qualifications of staff working in the sector. Observational studies of quality, as measured by Environment Rating Scales (ECERS), had pointed to qualifications as central predictors of process quality: maintained nursery schools and classes, headed by a graduate teacher, achieved higher ECERS scores than private and voluntary sector settings, where staff qualifications were much lower (Sylva et al, 1999; 2003; 2004). Follow-up studies have supported the importance of high ECERS ratings, which continue to predict cognitive and social-behavioural outcomes later in childhood: the most recent study finds that the effect on academic outcomes of attending a highly rated pre-school setting continues to show up as significant when children reach age 14 (Sylva et al 2012). To push up standards in the private and voluntary sectors, Labour introduced, for the first time, minimum requirements on the qualifications of staff working with young children, although these mostly operated at setting rather than individual level. All managerial and supervisory staff were required to have a Level 3 NVQ (A level equivalent), while half of remaining staff should have qualifications at Level 2 (equivalent to five good GCSEs). In addition, a new qualification was introduced in 2005, the Early Years Professional (EYP), a graduate-level qualification providing specialist training in early childhood. It was a stated policy intention to ensure that all settings had either a teacher or an EYP in place by 2010. This was never made a requirement, but resources were made available to local authorities to develop a graduate-led workforce through first the Transformation Fund (£250 million in total between 2006 and 2008) and later the Graduate Leaders’ Fund (£305 million between 2008 and 2011). Under the 2006 Childcare Act local authorities were required to provide information, advice and training to the early years workforce.
Outputs:
We examine here the change in the number of childcare places provided; the take-up of these places by different groups; and finally what we know about the quality of childcare. Table 5 shows the increase in childcare places between 1997 and 2010. The numbers of places available in full time centre-based provision rose steadily through the decade, so by 2008 there were more than three times as many places as there had been in 1997. These increases were somewhat off-set by reductions in childminder numbers, especially during Labour’s first term, which can only partly be explained by an updating of the childminder register at the end of the 1990s. A survey of former childminders suggested that the growth of alternative employment opportunities for women – including in centre-based childcare settings and as teaching assistants in schools – was a key factor behind falling numbers, with very few mentioning tighter regulation of the sector as an issue (Mooney et al, 2001). Interestingly, childminder numbers rose by an average of 14% across the 20 most deprived local authorities between 2003 and 2008, even while
18 Both Wales and Scotland have taken a similar approach for children from three onwards, with the Foundation Phase in Wales for 3-7 year olds, and the “early level” of the Curriculum for Excellence in Scotland. Like the EYFS, both emphasise learning through play. But both nations retain a more traditional split between care and education than England, with children under three falling under separate regulation, and different systems of inspection for settings providing “care” and those providing more formal early education.
WP04 Labour’s Record on the Under Fives: Policy, Spending and Outcomes 1997 - 2010
35
they fell for England as a whole, which underlines the relevance of alternative employment options (author’s analysis). Sessional (part day) places have also fallen, which may reflect expansion by some settings to offer longer day provision. Overall, the table points to a large increase in provision: in 1997 there were 5.5 children aged 0-4 for every childminder or full daycare place; and by 2009 this had fallen to 3.4 children per place. Table 5: Childcare places in England 1997-2010
% change 2009-10 -5% -7% 2% Source: 1997-2001 are from the Department for Education and Employment, Education: Children’s Day Care Facilities (England) Survey, Stationery Office. 2003-2010 are from the Ofsted series Registered Providers and Childcare Places in England, but with a break in series. Notes: (i) Because of changes in the way the data is collected and reported, figures for 2003-08 cannot be directly compared to those for either 1997-2001 or 2009-10. For 2009-10 it is not possible to separate full-day care from sessional care, hence the inclusion of a column showing both together. (ii) 1997-2001 data is for March 31 each year; (iii) 2003-2010 for June 30 each year. Sessional care includes providers where care is in offer for a maximum of 4 hours per day.
One of the government’s intentions in investing in childcare was to ensure that children from disadvantaged families were able to access it; increasing the number of children in lower-income working families using formal childcare was a PSA target in the 2004 Spending Review. The way surveys are collected makes it difficult to track formal childcare use over time without numbers including the free entitlement discussed in the next section, so here we focus on access by 0-2 year olds. We should point out that the bulk of evidence on the positive effects of exposure to formal early years provision refers to three year olds upwards, with less research and mixed findings on whether children
WP04 Labour’s Record on the Under Fives: Policy, Spending and Outcomes 1997 - 2010
36
under three benefit from some provision if the alternative is parental care only (Ruhm and Waldfogel, 2012; Gambaro et al, 2014). High quality formal provision does appear to be preferable, in general, to informal care by friends or relatives (Waldfogel, 2006).We know from an annual survey of parents that overall, 59% of all children aged 0-2 received some form of non-parental care in 2010, with 39% attending formal (paid) care (33% centre-based and 7% with a childminder or nanny) (Smith et al, 2012). This is considerably higher than in 1997, when 25% of 0-2s were in formal care (Butt et al, 2007), although most of the increase had been delivered by 2004, as illustrated in Figure 6. From 2007 to 2010 the dramatic increase was in the use of childcare for older age groups, such as after-school clubs. Among more disadvantaged households, use of formal care remained much lower. Among families with the highest level of multiple disadvantage in 2010, 15% of 0-2 year olds accessed some formal provision, including 6% in a day nursery, compared to 55% of children from the least disadvantaged households, with 34% in a day nursery (Speight et al, 2010, Table 2.2).19 This indicates that the growth of formal childcare places has not really affected the most disadvantaged in this youngest age group, which is as expected given the way that support has been structured, with childcare tax credit available only for working households, and then parents paying at least 20% of the cost of the place. Among low-income working households, there was no change in the proportion of children (of all ages) in formal childcare settings between 2005 and 2008 and the PSA target on this was not met (DCSF, 2009). Figure 6: Use of formal childcare by age, 1999-2010, England.
Source: 1999 and 2004 from Butt et al (1997); 2007 from Kazimirski et al (2008); 2010 from Smith et al (2012). Note: ‘Formal childcare’ includes centre-based care, childminders, playgroups, nursery classes, nursery schools and reception class, after-school clubs and holiday schemes. Figures for 3-4 year olds include the free entitlement but almost certainly underestimate take-up as parents may not report access if they do not consider it ‘childcare’. Figures for 5-7 year olds include children in reception class but not later school years.
19 The most disadvantaged households are considered to be those experiencing at least five of nine indicators of disadvantage; the indicators include lone parenthood, low income, low qualifications, worklessness, at least three children, rented accommodation, living in a deprived area, and a long-standing illness or disability for parent or child.
WP04 Labour’s Record on the Under Fives: Policy, Spending and Outcomes 1997 - 2010
37
Finally, what can we say about what happened to the quality of childcare on offer? The qualifications of the workforce have steadily improved, most notably at lower qualification levels, but also in the numbers of graduates in the sector. Table 6 shows a shift in the makeup of the early years workforce (excluding childminders) between the mid 1990s and the mid 2000s. In 2004-08 51% of the workforce had at least a Level 3 NVQ, compared to 29% a decade earlier (Gambaro, 2012). More recent evidence from a survey of childcare providers (including childminders) indicates that qualifications kept rising thereafter: 66% were found to be qualified to at least Level 3 in 2008, rising to 72% in 2010 (Tickell, 2011). It is apparent that the government’s (very modest) ambitions for the workforce – half of staff to hold Level 2 qualifications and the manager a Level 3 – were wildly outstripped in practice. This is very good news, but experts continue to be concerned about the numbers of staff qualified only to Level 2 or below. In two separate independent reviews of the sector, Clare Tickell (looking at the EYFS) and Cathy Nutbrown (looking at qualifications) argue that Level 3 qualifications should become the minimum standard for the entire workforce, including childminders (DfE, 2012; Tickell Review). There are also some concerns about the real value-added of a Level 3 NVQ. Gambaro (2012) points out that candidates are drawn from school leavers with low grades (only 37% of childcare workers holding an NVQ3 have obtained 5A*-C at GCSE), and that there are very low rates of progression to higher levels (for almost 90% of childcare workers with an NVQ3, this will be their highest level). Gambaro’s interviews with childcare workers point to a sense of pride and achievement among those gaining an NVQ3, although not necessarily a feeling that the qualification has significantly changed the worker’s practice; her interviews with managers uncover mixed opinions over an NVQ’s worth. In short, an upgrading of qualifications from very low to low is to be welcomed, but is unlikely to have delivered the quality improvements associated with having graduate level staff. Table 6: Highest qualification held by childcare and early education workers, by time period
Source: Gambaro (2012), Table 6.9, using LFS data 1994-2008, all quarters, first wave respondents only. Note: percentages do not necessarily add up because of rounding.
In terms of the number of graduates in the sector, Table 6 records only a small increase over time, but investments in training for the new graduate Early Years Professional Status (EYPS) largely post-date these figures. By March 2012 9,365 people had attained the status with another 2,000 candidates in training. The childcare providers’ survey finds that by 2010 13% of the workforce were graduates, up from 11% in 2008 (Tickell, 2011). Furthermore, there is evidence that these new graduates have had a measurable impact on quality. The evaluation of the Graduate Leader Fund found that settings which
WP04 Labour’s Record on the Under Fives: Policy, Spending and Outcomes 1997 - 2010
38
gained a graduate leader with EYPS made significant improvements in the quality of provision for pre-school children (2.5 to 5 years old) compared to settings which did not (Ranns et al, 2011), and that EYPS provided ‘value-added’ even over gaining another type of graduate. There was no measurable impact on quality for younger children, however, possibly because the most highly qualified staff are much less likely to work in infant/toddler rooms: each EYP worked an average of 18.4 hours in the pre-school room in the evaluation week and 4.7 hours in the infant/toddler rooms. This evidence indicates that the introduction of EYPS was a move in the right direction, but that more needs to be done to boost the numbers gaining the qualification and ensure that more children benefit. Given that there are roughly 800,000 childcare places in England (see Table 5), one EYP has now been trained for every 70-80 places, representing an important investment but not a sufficient one to reach all children. One further issue is disquiet among some EYPs at a lack of parity in pay and perceived status with qualified teachers, which may need addressing if high quality candidates are to be attracted to the profession and retained (DfE, 2012). Alongside the upskilling of the workforce, the Tickell Review concludes that the EYFS has itself contributed to improvements in quality in the sector. The proportion of childcare providers judged by Ofsted to be good or outstanding increased from 56% in 2007/08 (before the EYFS was introduced) to 68% in 2009/10, with outstanding rising from 4% to 10% (Ofsted, 2011). Ofsted’s report for the Tickell Review also found that 16% of providers which left the sector after an inspection under the EYFS framework had been found to be inadequate, while only 2% of providers remaining active were judged inadequate; Ofsted believes that this shows that the combination of the framework itself and inspection against it have raised standards.20 Furthermore, the curriculum appears to have been broadly popular with staff and parents (Tickell, 2011), although there are exceptions, most notably childminders who had been given a ‘satisfactory’ judgement and thought of themselves as carers rather than educators (Ofsted, 2011). Children themselves, in Ofsted’s assessment, are also happy and enjoying their time in the EYFS, despite initial concerns that the framework would be too formal for young children and place too much pressure on them (Ofsted, 2011). On the other hand, Ofsted finds that the average quality of provision remains worse in more deprived areas, largely due to differences in the quality of childminding: 55% of childminders in the most deprived quintile were rated good or outstanding at their last inspection, compared to 72% in the least deprived quintile; for centre-based providers the figures are 65% and 75% (Ofsted, 2011, Figure 2).
Outcomes:
One of the purposes of increased funding to childcare was to enable more mothers to move into paid work. Worklessness did fall during the Labour years, especially among lone parents, for whom the employment rate rose from 45% in 1997 to 57% in 2010 (Spence, 2011). Studies comparing the change in lone parent employment to that of mothers in couples and childless women attribute as much as two-thirds of the increase to the effect of policy change, rather than economic growth, but cannot separate the impact of investment in childcare from that of tax credit and New Deal policies (Gregg et al., 2009; Blundell et al 2008; Brewer et al 2006). The evaluation of the Neighbourhood Nursery Initiative is able to hone in on the childcare effect specifically, by comparing employment change between disadvantaged areas with and without a Neighbourhood Nursery (La Valle et al., 2007). The evaluation finds that childcare provision did have a small but significant effect on employment, which rose more quickly in areas with a Neighbourhood Nursery than in similar non-NNI areas. Among work-ready parents the NNI 20 However, it should be remembered that Ofsted ratings provide just one quality measure, and one that has been found to be poorly correlated with other quality indicators, particularly for younger children (Mathers et al, 2012).
WP04 Labour’s Record on the Under Fives: Policy, Spending and Outcomes 1997 - 2010
39
was associated with an increase in employment of 1.3 percentage points, and 0.8 percentage points among all parents (La Valle et al, 2007). Parents (and especially lone parents) using the nursery judged its importance very highly: 31% of lone parents said they would not have been using formal childcare if the NNI place had not been available, and 30% said they would not have been in work without it. But the overall impact was dampened by low take-up, with only 10% of pre-school parents in NNI areas using the service. Both information and cost appeared to remain important barriers to access, particularly among groups with low employment levels. A second purpose was to improve children’s developmental outcomes and to reduce inequalities. The evidence we have on developmental outcomes is measured at age five and so cannot separate the effect of provision at different ages, so this evidence is discussed in the next section, after we consider the free entitlement to nursery education for three and four year olds. From what we know from the discussion so far, however, we might expect both increased use of formal childcare and its improved quality to have had a positive impact on many young children in working families – 39% of all 0-2s in 2010 – but not to have affected children from the most disadvantaged households, for whom exposure to formal provision at this age remains very uncommon.
WP04 Labour’s Record on the Under Fives: Policy, Spending and Outcomes 1997 - 2010
40
6. Early education for three and four year olds
The provision of early education to three and four year olds was the largest area of spending on children under five during the Labour era, although only the three-year-old places were really new. The Conservative Party had piloted a nursery voucher scheme for four year olds during its final years in office, and this was rolled out in 1997-98 before being replaced by Labour’s Nursery Education Grant (NEG) (Sparkes and West, 1998; West, 2006). The NEG entitled all four year olds to 12.5 hours a week of free early years education for 33 weeks a year. In 2004 the entitlement was extended to three year olds from the term following their third birthday. By 2010, the places had been expanded to 15 hours a week for 38 weeks a year, and more flexibility had been introduced: in some settings, families could use the hours across three or four slightly longer days, making the places work more effectively as childcare. At the time Labour lost power in 2010, a pilot scheme was in place to extend free places to two year olds in disadvantaged areas, a policy which was subsequently taken up and expanded by the Coalition Government.
Expenditure:
Expenditure on early education for under fives is shown in the first row of Table 1, which includes spending on nursery places and on under fives in maintained schools. Funds are transferred to local authorities via the Direct Schools Grant and then allocated to providers by the LA using their own funding formulae. In 2009-10, £4.4 billion was spent in total in this way, representing a real increase of £2.3 billion since 1997-98. As Table 1 shows, this is easily the biggest chunk of public spending on young children’s services.
Inputs:
As was the case for childcare, the approach to funding the free entitlement was essentially a demand-side one, with resources following the child rather than being used to expand provision directly. The idea was to encourage both choice and flexibility, with parents taking up the place that suited their child and their circumstances: the hours could be taken at a maintained sector nursery school; a private or voluntary sector playgroup or pre-school; or as part of a longer day in a full daycare setting. Childminders were also given the right to offer the free entitlement provided they met certain quality requirements. However, the funding differed from that for childcare in several ways: it was universal, covering all children, regardless of income or parents’ employment status; it went directly to the provider (rather than being reimbursed to parents); it covered the full place with no part payment; and – in principle – it could not be topped up, so parents could not use it towards the cost of higher quality provision. In practice, it did not operate entirely as planned. Many providers argue that the funding is insufficient to provide high quality early education (FSB (Federation of Small Businesses), 2007; West et al., 2010; NAO, 2012). Providers cope by cross-subsidising the places where possible: private providers and full day care settings from fees for additional hours, and maintained settings from other parts of the school budget (West et al, 2010). For parents using private or full-day provision, the entitlement is often presented simply as a reduction in fees when a child reaches the eligible age. Thus the funding model is largely one of co-production – with both private resources and other parts of the education budget – rather than
WP04 Labour’s Record on the Under Fives: Policy, Spending and Outcomes 1997 - 2010
41
full direct provision.21 There is also evidence of less flexibility for parents than had been anticipated, with full-day providers prioritising children who will stay for additional paid hours (West et al, 2010).
Outputs:
What has the extra £2.3 billion delivered in terms of numbers of children accessing early education? By 2010, 98% of all four year olds and 92% of all eligible three year olds (in the term after their third birthday) were benefiting from some free early education (DfE, 2010). Capturing what this means as an increase since 1997 is difficult because figures on the private, voluntary and independent sector were only collected from 2000, and we can only ensure that each child is only counted once from 2008. We do know that in 1997 38% of three year olds attended either a state nursery class or independent school, and 81% of four year olds attended reception, nursery or independent school, but this excludes children in playgroups and day nurseries (DfES, 2003). In 2000, 86% of three year olds (of whom 44% did not pay) and 100% of four year olds (98% non-paying) are recorded as accessing some provision, but these are upper bounds as children attending more than one setting are counted twice (DfE, 2010). Between 2008 and 2010, when figures are measured consistently, there was no change in enrolment. Figure 7 shows a breakdown of the type of setting children are attending, with three year olds in the top panel and four year olds at the bottom. These numbers overestimate total enrolment as there is some double-counting, but the trends are interesting. Three things are striking. First, it is clear that a large proportion of funding was spent not on increasing enrolment but on funding places for children who were already attending – the cost of a universal policy. This is indicated by the difference between the PVI line and the ‘PVI with a funded place’, which is particularly sharp for three-year olds. Nearly half of three-year-olds attended a private, voluntary or independent setting in 2000. The free entitlement policy pushed this up by about 13 percentage points, but at the cost of subsidising places for nearly 300,000 children who were already there. If the goal was simply to increase enrolment this would be seen by economists as a deadweight loss, albeit one that may have been necessary to ensure that the system reached those least likely to attend. On the other hand the policy might also be seen as helping to improve the affordability of early education and childcare for everyone; not a deadweight loss but a deliberate redistribution of a benefit in kind towards households with young children. The second point that emerges is the very limited expansion in the places which EPPE research had shown to be the highest quality: maintained nursery schools and classes. Indeed, as Figure 8 shows, the total number of places in the maintained sector did not expand at all but declined steadily between 1999 and 2006 before recovering to the levels of the late 1990s, with the late increase largely driven by the expansion of reception rather than nursery classes. As population numbers were also declining between 1996 and 2006, this allowed a slight increase in the percentage of children in the maintained sector between 1996 and 2000 and a steady share thereafter. Figure 8 makes it clear that all the new places have been created in the PVI sector. Third, Figure 7b points to a steady shift for four-year-olds from nursery classes to reception classes. In 1997 53% of children aged four were in state school reception classes, and by 2010 this had risen to 62%, while the share in state nursery classes and nursery schools had fallen from 24% to 16%. Late in Labour’s third term this became deliberate policy, in response to the recommendations of the Rose
21 The scheme is arguably not as dissimilar in practice to the Conservative’s Nursery Voucher scheme as it was intended to be. The Conservative scheme explicitly allowed top-ups to meet the cost of a higher priced place. In ruling out top-ups, the free entitlement is different in principle, but as parents can pay for additional hours around the entitlement the result is very much the same (see Sparkes and West, 1998; West, 2006).
WP04 Labour’s Record on the Under Fives: Policy, Spending and Outcomes 1997 - 2010
42
Review of the primary curriculum, which argued that the traditional practice of deferring school entry for younger four year olds compounded the disadvantages of being summer-born, and that instead younger children should be provided with developmentally appropriate learning experiences within primary school (DCSF, 2009b); since September 2010 children in England have been entitled to a full-time place in reception from the September following their fourth birthday. But the figures here pre-date this change and look to be driven largely by falling population numbers. Figure 8 shows no additional reception places overall until the young population starts growing in 2006, but these places are able to cover a greater proportion of the cohort. This in turn creates more space for three-year-olds in nursery classes, despite the decline in the numbers of nursery class places to 2006.
Figure 7: Percentage of three and four year olds in early education in England
7a) Eligible three year olds
7b) Four year olds
Source: Put together from DFE statistical releases. Notes: No data on PVI collected prior to 2000 (or 1999 for four year olds). Data may double count children attending more than one setting, so total can exceed 100%.
WP04 Labour’s Record on the Under Fives: Policy, Spending and Outcomes 1997 - 2010
43
Figure 8: Total number of three and four year olds in early years education in England
Note: Total numbers calculated from the other data on the SFR. NB “The population estimates are derived from mid-year estimates and projections provided by the Office for National Statistics. They are subject to a margin of error and should be considered to be approximations.” SFR13/2011. Of course this affects all the figures presented. As in our analysis of childcare above, we want to know not just what happened to take-up overall but also whether more disadvantaged children were reached by the free entitlement policy, and what happened to the quality of provision on offer. It is clear from the very high take-up rates overall that the entitlement was much more successful than childcare subsidies at reaching more disadvantaged groups: 92% of three-year-olds and 98% of four-year-olds are impressive numbers. An annual survey of parents finds that children from disadvantaged households are still disproportionately represented among those not taking up a place, with children from lower-income and larger families and those whose mothers do not work and/or have low educational qualifications less likely to attend (Speight and Smith, 2010). For example, among children with the highest levels of multiple disadvantage, 5% of four-year olds and 24% of three year olds did not access any provision. 22 The authors point to lack of awareness of the entitlement and a low level of information about local options as substantial barriers to taking places up. This shows that coverage is still not fully universal. On the other hand, it also tells us that three-quarters of three-year-olds from the most disadvantaged households – along with 95% of four-year-olds from these households – are accessing early education. What about the quality of places? Given the findings from the EPPE study referred to above, it is disappointing to see such clear evidence that all of the expansion in early education places came in the private, voluntary and independent sectors. The EPPE results clearly pointed to the maintained sector – and nursery schools in particular – as offering the highest quality provision on ECERS ratings (Sylva et al, 1999), with high ECERS scores predicting better cognitive and social-behavioural outcomes for as long as the study has continued; the latest wave of research continues to find an effect at age 14 (Sylva et al, 2004; Sylva et al., 2012). In opposition, Labour had opposed the Conservatives nursery voucher
22 See footnote 13 above. Here families with the highest level of disadvantage were classified as those experiencing at least four of the nine factors.
WP04 Labour’s Record on the Under Fives: Policy, Spending and Outcomes 1997 - 2010
44
scheme, which provided demand-side funding to whichever setting parents chose, and had pledged to dismantle it to expand nursery education in the state sector (Eisenstadt, 2011). In office, what they implemented was different in principle to the voucher scheme – which explicitly allowed parents to top-up the value of the voucher – but very similar in practice. The system continued to channel state resources towards early education services in the private and voluntary sectors, even though these had now been shown to be on average lower quality than the services provided directly by the state. On the other hand, the EPPE observations were carried out in 1997 and 1998, and we know that while supporting the expansion of PVI settings Labour policy also took a number of actions to improve their quality. The intention was to allow the flexibility for parents of taking up the early education place where they wanted to while ensuring a common and high quality experience for children across all settings. Is it the case that these changes have evened up quality between sectors, so that it is misplaced to worry that the expansion has taken place in the ‘wrong’ settings? As discussed above in the section on childcare, staff qualifications have indeed improved and Ofsted inspections point to rising quality of provision in PVI childcare settings, resulting in part from the EYFS curriculum. The most recent attempt to assess process quality for 3-5 year olds through ECERS scores found significant improvements in quality across all sectors between the EPPE observations in the late 1990s and fieldwork in 2005 (Mathers et al., 2007). The largest gains were made in the voluntary sector, with improvements registered in all the areas assessed. On the other hand, the maintained sector continued to be the most effective overall, especially where learning outcomes were concerned. Like EPPE, this study underlined the role of staff qualifications in raising quality, with the presence of a qualified teacher identified as particularly important. No ECERS study has been carried out since the EYFS became mandatory in 2008, but all the available evidence suggests that a gap will persist between the maintained and other sectors as long as staff qualification levels continue to differ widely. Given the variation in quality identified by EPPE and by Mathers et al. (2007), it is interesting to examine what we know about how quality and children’s background interact: are children from disadvantaged backgrounds receiving lower (or higher) quality early education than others? We saw above that the quality of childcare as measured by Ofsted is slightly lower in more deprived areas, especially when childminders are included. Analysis of Ofsted results for the free entitlement tell a similar story, with quality improving as area deprivation falls: there are more outstanding and fewer satisfactory settings in the least deprived areas (Gambaro et al., 2013). However, if we look at the presence of a graduate as an indicator of quality the story is very different. Figure 9 shows the percentage of children accessing the free entitlement in a setting with a graduate, by the deprivation decile of their home address. Differences across areas are striking though not necessarily as expected. Nearly half of all children in the least deprived areas access the entitlement in a setting where no graduate is employed, compared to fewer than one in five children in the most deprived areas. The explanation is that children in poorer areas are much more likely to access the entitlement in a state nursery school or class. This is both because these settings are overwhelmingly located in deprived inner city boroughs, and because poorer children are less likely to have working parents, and therefore more likely to take up traditional half-day school nursery places, with no need for a setting that provides wrap-around hours. Figure 10 shows the same indicator but for PVI settings alone. Here we see much less variation across the country, with roughly one third of children in PVI settings attending a centre with a graduate. A very mild U-shape indicates a slightly higher prevalence of graduates in the most and least deprived areas than in the middle, which may reflect the impact of private resources at the top end and supply side investments to support training and development at the bottom. The lack of a stronger association between area deprivation and access to graduates within the PVI sector is encouraging in some
WP04 Labour’s Record on the Under Fives: Policy, Spending and Outcomes 1997 - 2010
45
respects, but what the figure is showing is low quality for a majority, whatever their background. High quality provision has been shown to have the greatest impact for disadvantaged children, so this is not an effective way of evening up life chances, and is another reminder of the key role being played by state nursery schools and classes.23 Figure 9: Percentage of children in England accessing the free entitlement in a setting with a graduate, by decile of area deprivation
Source: Gambaro et al (2013) from Early Years Census 2011 and School Census 2011. Notes: Sample includes all children born between September 2006 and December 2006 receiving the entitlement. Sample excludes children in reception classes and children with special education needs.
Figure 10: Percentage of children in England accessing the free entitlement in a setting with a graduate – PVI settings only
Source: Gambaro et al (2013) from Early Years Census 2011. Notes: Sample includes all children born between September 2006 and December 2006 receiving the entitlement in a PVI setting (or by a childminder). Sample excludes children in reception classes and children with special education needs.
23 Interestingly, Ofsted does not consistently rank maintained settings more highly than PVI settings: indeed, the opposite is the case, with a slightly higher share of PVI settings ranked as outstanding and fewer as satisfactory. However, there are differences in the inspectorate, the length and style of inspections, and the inspection cycle for the two sectors which make this comparison fairly meaningless: see discussion in Gambaro et al (2013).
WP04 Labour’s Record on the Under Fives: Policy, Spending and Outcomes 1997 - 2010
46
Lastly, before we move on to look at outcomes, it may be worth reflecting briefly on what the shift towards reception class means for the quality of provision received by four-year-olds. Several commentators have in the past raised concerns that formal schooling starts too early in the UK and that reception class is an inappropriate environment for a child aged four (e.g. Moss and Penn, 1996; Moss, 1999). The introduction of the EYFS with its focus on delivery through play appears to have allayed many of these worries; respondents to the Tickell Review gave the curriculum strong support, with concern now focused on the jump from reception to the more formal requirements of Key Stage 1 in the following year (Tickell, 2011). The Tickell Review did recommend further research into whether the 1:30 ratio of staff to children is sufficient for reception class (up from 1:13 in nursery), while noting that this ratio rarely appears to operate in practice, with a number of teaching assistants employed as a matter of course.
Outcomes:
We have examined increased resources and improved outputs in both childcare and early education – higher enrolment rates and better quality – as well as investments in family support services and increased maternity leave. Have these outputs led to measurable changes in children’s outcomes: can we see an improvement in cognitive, social and behavioural development at the end of the EYFS? As Figures 6 and 7 testified, the big increases in enrolment rates for both 0-2 and 3-4 year olds came between 1999 and 2004. Sure Start Local Programmes were in full swing by 2004. We might then expect to see improvements in outcomes showing up by 2006 or 2007. On the other hand, improvements in the quality of provision have taken place more gradually over the decade, with the introduction of the EYFS in 2007 and resources to fund the development of Early Years Professionals in place from 2006-2011. If the major changes to maternity leave affected child development indicators, we would expect to see this coming through between 2008 and 2012. Table 7 shows the percentage of children working securely in each area of learning in the EYFS and its predecessor, the Foundation Stage Profile, between 2005 and 2011.24 These are the scores recorded by teachers for children as they approach the end of reception class. The figures point to stagnation or slippage between 2005 and 2007, but considerable progress thereafter. From 2007 the proportion of children working securely in communication, language and literacy (CLL) rose by 13 percentage points over four years to 62% in 2011, while in personal, social and emotional development (PSED) the improvement was eight percentage points to 79%. Scores for children in the most deprived 30% of areas improved more quickly than average, so the achievement gap between these areas and the rest narrowed steadily from 17 percentage points in 2007 to 12 percentage points in 2011. The 2007 Spending Review had set two Public Service Agreement targets in relation to EYFS results: to increase the proportion of children achieving “a good level of development” by 4 percentage points between 2008 and 2011; and to improve the average score of the lowest achieving 20% so that the gap between that score and the median reduced by 3 percentage points between 2008 and 2011. Both targets were met. The share achieving a good level of development rose from 49% to 59% over this period (Table 7), while the gap between the lowest achieving 20% and the median narrowed for England from 38.3 points in 2006 to 35.6 in 2008 and then 31.4 in 2011. Ofsted (2011) point to particularly strong improvement among children of Bangladeshi and Pakistani heritage, children from ‘any other Black background’ or ‘any other ethnic background’, those speaking English as an additional language and those known to be eligible for free school meals. However, children with disabilities or statements of special needs and children of Gypsy/Roma or Irish Traveller heritage made less or much less progress than average. 24 FSP results were collected from 2003 but only on an experimental basis.
WP04 Labour’s Record on the Under Fives: Policy, Spending and Outcomes 1997 - 2010
47
Table 7: Percentage of children working securely1 in each area of learning in maintained schools and private, voluntary and independent providers, 2005-2011, England
2005 2006 2007 2008 2009 2010 2011 A good level of development (78 points in total, including 6 on all PSE and CLL scales) 48 45 46 49 52 56 59 Children in 30% most deprived areas -- 33 35 39 42 47 51 Children in other areas2 .. 50 52 55 57 61 63 Difference between deprived/other areas2 .. 17 17 16 15 14 12 Personal Social and Emotional Development [PSE] (in all 3 scales) 75 71 71 72 74 77 79 Communication, Language and Literacy [CLL] (in all 4 scales) 51 48 49 53 55 59 62 Problem Solving, Reasoning and Numeracy (in all 3 scales) 69 66 67 68 70 72 74 Knowledge and Understanding of the World (1 scale) 81 77 77 79 81 83 84 Physical Development (1 scale) 90 88 88 89 90 91 91 Creative development (1 scale) 81 78 78 79 80 82 83 Sources: Figures for years 2006 and 2007 are from DCSF (2008b); Figures for year 2008 to 2010 are from DCSF (2010); Figures for year 2011 are from DfE (2011). Notes to the table: 1. Children achieving 6 or more points in all scale(s) within an area of learning are working securely in that assessment area. 2. The figures are based on children for whom it was possible to establish an area of residency. 3. The figures for 2009 and 2010 are based on the areas identified as being the 30% most deprived using the Index of Multiple Deprivation 2007. Figures prior to that are based on the areas identified as being the 30% most deprived using the Index of Multiple Deprivation 2004. 4. The Problem solving, reasoning and numeracy area of learning was known as Mathematical development prior to 2009. The figures for 2005 and 2006 are derived from the child level sample. The figures for years 2007 to 2011 are derived from full child level data reported by local authorities. .. Not available. It was not possible to establish the deprivation status of children in Private, Voluntary or Independent providers in 2005.
The positive story from 2007 contrasts with less impressive achievements in the earlier part of the decade. Neither of the Public Service Agreements set in the 2004 Spending Review for progress between 2004 and 2008 were met. As Table 7 shows, only 49% of children had achieved a good level in 2008, short of the 53% in the target and little better than 2005. A second target aimed to reduce inequalities between the most disadvantaged children and the rest to 12 percentage points by 2008; Table 7 shows minimal progress between 2006 and 2008. The findings of two other relevant studies also suggest disappointing progress to 2008. Analysing data for 472 primary schools from the Performance Indicators in Primary Schools (PIPS) On-entry Baseline Assessment (BLA), Merrell and Tymms (2011) point to stagnation in outcomes, as presented in Table 8. The PIPS-BLA is administered as a 20 minute test within six weeks of a child starting school, and the authors argue that it provides reliable, objective and consistent indicators which have well-established validity. The data show statistically significant declines in early reading and picture vocabulary and statistically significant increases in maths between 2001 and 2008, but the authors emphasise that these differences are very small in educational terms and that the story is broadly one of stability.
WP04 Labour’s Record on the Under Fives: Policy, Spending and Outcomes 1997 - 2010
48
Unfortunately no later data are available from PIPS to test whether the improvements shown in Table 7 are also reflected there. It may be relevant that the Merrell and Tymms figures give an average rather than a percentage of children reaching a given level; averages have shown much greater stability in the EYFS than the percentage moving across a level, as can be seen in Table 7. Table 8: Raw scores from the Performance Indicators in Primary Schools (PIPS) On-entry Baseline Assessment (BLA)
Early reading Early Maths Picture vocabulary Total
Source: Merrell and Tymms (2011), table 4 (p. 340)
A second study finds only a modest effect of attending early education on Key Stage 1 scores (age 7) for children in the Millennium Cohort Study, who would have accessed the free entitlement in 2003-2005 and reached the end of reception in 2006; for children living in poverty a significant association between attendance and maths score at Key Stage 1 remains after controlling for family, child and school characteristics, but there is no significant association for other areas of the curriculum, nor for children overall (George et al., 2012). Overall, a possible interpretation of what happened in the 2000s is this. The increases in enrolment in PVI settings recorded between 1999 and 2004 made little difference in themselves to school readiness (and nor, it seems, did other early interventions such as Sure Start, despite what we know about its impact on parenting and the home learning environment). However, the combination of enrolment with improvements in quality – increasing qualifications of staff, more graduates, and the introduction of the Early Years Foundation Stage – do seem to be reaping real rewards, with significant improvements in child development indicators from 2008 onwards, alongside significant narrowing of inequalities.
WP04 Labour’s Record on the Under Fives: Policy, Spending and Outcomes 1997 - 2010
49
7. Early childhood health
Improving the quality of healthcare and reducing health inequalities were policy priorities for Labour from 1997 to 2010: at least fifteen government-commissioned reviews, White Papers and action plans were published in this period, from the Acheson Inquiry into Inequalities in Health in 1998 to the Marmot Review in 2009 (Audit Commission, 2010). But while nearly all of these emphasise the importance for adult health of what happens in childhood, policy focused on child health was slower in coming. A Children’s National Service Framework was developed from 2003 and subsequently integrated into the Every Child Matters framework (DfES and DoH, 2004) and a specific Child Health Strategy was published in 2009 (DoH, 2009a). This launched the Healthy Child Programme, a clinical and public health programme comprising screening, immunisation, developmental reviews, information and guidance to support parenting. Until then Sure Start was arguably the main health care policy initiative for young children, although in practice the Department of Health’s joint responsibility for Sure Start only lasted from 1999 to 2002. Eisenstadt (2011) describes both the early excitement among civil servants at the decision to allow the Health Minister to answer questions on Sure Start during education question time – this was joined-up government in action – and the quiet shift in 2002 that gave joint responsibility for the new Sure Start, Early Years and Childcare Unit to the DfES and the DWP, leaving the DoH out.25 There were also smaller specific health-focused initiatives: the National School Fruit and Vegetable Scheme (a free daily piece of fruit to schoolchildren between four and six years old); Healthy Start (from 2006, providing nutritional support to pregnant women and children under four in low income families); and the Family Nurse Partnership from 2007 (a tightly targeted health visiting scheme providing support for teenage mothers from early pregnancy until two years after birth). However, it is widely accepted that health care services are only one factor (and perhaps even a minor factor) affecting health outcomes, with income, housing conditions and the neighbourhood environment all known to have direct and significant impacts on health. This is repeatedly acknowledged in Labour health policy documents. For example, the Department of Health’s implementation plan for reducing the social class gap in infant mortality by 10 percentage points proposes that progress on child poverty and reduced overcrowding might together contribute 4.4 percentage points; reduction in adult obesity 2.8 points; reduced smoking in pregnancy 2 points; targeted interventions to reduce cot death 1.4 points; and reduced teenage pregnancy 1 point (Department of Health, 2007). As health behaviours such as smoking and healthy eating are themselves strongly correlated with social and economic variables, this points to a relatively small role for health care services in addressing inequalities in IMR. In this section we examine changes in spending and in health inputs and outputs (insofar as this is possible) but the outcomes we look at will have been influenced by wider policies on housing, income poverty, teen pregnancy and adult health behaviour (such as the smoking ban).
Expenditure:
Health spending was not included in Table 1, other than as part of Sure Start, because of the difficulty of identifying age-specific health spending within the health budget, although some estimates are available.
25 Eisenstadt (p.75) interviewed Carey Oppenheim, an advisor on childcare in Number 10 at the time, about the shift in ministerial responsibility for Sure Start: “The idea obviously… was that you would combine issues around employment and income with issues around education and early years services. Why health was left out? Maybe we just felt it was too complicated, it was just another player.”
WP04 Labour’s Record on the Under Fives: Policy, Spending and Outcomes 1997 - 2010
50
The specific initiatives referred to above were allocated relatively small amounts in comparison to Sure Start: £37 million in total for Family Nurse Partnerships between 2007 and 2011 (Audit Commission, 2010); between £29 million and £37 million a year for the National School Fruit and Vegetable Scheme between 2004-05 and 2006-07 (current prices; no data could be found for later years although the scheme still existed at the time of writing in early 2013).26 However, the Audit Commission identifies very significant additional sums from general health spending “with impact on under-fives health” (p.41). Their report points to a total of £13.3 billion in current prices between 1999/00 and 2010/11 from Primary Care Trust public health spend and local authority children’s service grants; plus an additional £4.1 billion in total on “Children’s policy (with health impact) and Health policy (with impact on children)”; and a further £1.6 billion on “other general funding” (Audit Commission, 2010, Table 4). They also identify nearly £3.6 billion spent on health visitors, but their calculation of Sure Start spending is considerably lower than our own at £7.2 billion. Little detail is provided to explain their calculations, though they note that the figures include only general health spending and not hospital spend, but the size of the numbers serve to make the point that much relevant expenditure is not captured in Table 1. On the Audit Commission’s figures, total funding on the categories discussed above (excluding health visitors) rose from £1,756 billion in 1999-2002 to an estimated £8,934 billion in 2008-2011 in nominal prices. Dividing the £8,934 billion evenly between the three spending years and then by the number of 0-4s in 2009/10, we get £932 a year. If this is really additional spending, and if it is really being spent on the under-fives, it is a significant addition to the £2,514 we calculated per child in 2009/10 on early education, Sure Start and childcare services. Young children will also of course have benefited from the broader improvements in the NHS – such as reduced waiting times and better resourced GP services and hospitals – that resulted from significant increases in overall health spending (see Vizard and Obolenskaya, 2013).
Inputs:
Overall, labour inputs in the health sector increased by 47.5% between 1995 and 2009 (Vizard and Obolenskaya, 2013) but it is not possible to identify changes in the workforce relevant to young children. However, the Audit Commission (2010) points to a 10% reduction in health visitor numbers between 1998 and 2008. Department of Health (2009b) notes that there have been overall increases in midwife numbers over the previous decade, but that the rising birth rate – particularly in inner-city areas – has stretched maternity services in disadvantaged areas where pressures are greatest.
Outputs:
Sure Start Children’s Centres provide a number of health-related clinics and services, including maternity services, breastfeeding support, baby clinics, immunisation sessions and nutritional advice. As well as increasing the number of available services, part of the aim was to join services up and deliver them in one convenient location, making it easier for parents to find about and access what they needed. At the same time, pre- and post-natal health services were seen as a way for Children’s Centres to draw in and build a longer-term relationship with vulnerable parents. Evidence to the House of Commons inquiry into Children’s Centres pointed to excellent examples of good integration, but also suggested that the extent of partnership between Children’s Centres and health agencies was variable: for example, a 2010 survey of PCTs by the NHS Confederation found that 69% of local health services were ‘very involved’ or ‘quite involved’ in Children’s Centres. Other witnesses suggested that while health visitors and midwives often
26 Data from a Hansard written answer, HC Deb 23 July 2007, c833W.
WP04 Labour’s Record on the Under Fives: Policy, Spending and Outcomes 1997 - 2010
51
have good working relationships with Children’s Centres, this is much less common for GPs (House of Commons, 2010). Consistent with this picture, there is some evidence that less use is made of health services than other parts of Children’s Centre activity. Figures on service use presented earlier, in Table 4, showed, for example, an average 35 users a week in Phase 1 centres compared to 119 for drop in play sessions. A 2009 survey of parents conducted by the DCSF found that only 13% of parents in Sure Start Phase 1 areas had used Sure Start health services in the last three months, compared to 45% overall who had used or attended the centre (DCSF, 2009a). Health services may of course be needed less frequently than some other services, but the DCSF study also found less awareness that Children’s Centres provided health services: 50% of respondents knew this, compared to 69% who knew they provided childcare and nursery education. It seems likely that the decision to end formal Department of Health responsibility for Sure Start affected the focus of Children’s Centres: the House of Commons inquiry described this decision as a “backward step”. The committee’s report acknowledged that this is not the only reason why local health services are not consistently involved in Children’s Centres –“there are many practical and professional reasons why collaboration is difficult” – but it called on the government to establish joint DCSF and DoH responsibility for the centres.
Outcomes:
We begin by examining change in health-related behaviour – smoking and drinking during pregnancy and healthy eating (breastfeeding was discussed earlier in the paper). We then look at changes in health outcomes: low birthweight, infant mortality and rates of obesity. Figure 11 shows smoking in pregnancy in the UK, with breakdown by mother’s socio-economic classification. The first panel shows substantial declines in the share of women smoking throughout their pregnancy between 2000 and 2010 – a 40% drop overall, including 50% for the managerial/professional group (from a low base) and 42% for those who have never worked. The second and third panels (and Table 9) show that much of this change was driven by a fall in the share of women smoking before they became pregnant, but that increased rates of giving up during pregnancy were also important. Table 9: Changes in smoking behaviour for UK mothers 2000-2010: Evidence from Infant Feeding Surveys Smoked
throughout pregnancy (%)
Smoked before or during pregnancy
Gave up smoking in relation to pregnancy
Smoked throughout pregnancy
2000 2010 % change 2000-2010
% change 2000-2010
% change 2000-2010
Managerial & professional 8 4 -36 14 -50
Intermediate occupations 13 10 -10 11 -23
Routine & manual 29 20 -13 32 -31
Never worked 36 21 -40 0 -42
Unclassified 22 14 -24 23 -36
All mothers 20 12 -26 23 -40
Source: Infant Feeding Surveys 2000 and 2010 (Hamlyn et al, 2002; HSCIC, 2012).
WP04 Labour’s Record on the Under Fives: Policy, Spending and Outcomes 1997 - 2010
52
0
5
10
15
20
25
30
35
40
Managerial &professional
Intermediateoccupations
Routine &manual
Never worked Unclassified All mothers
2000
2005
2010
Figure 11: Smoking in pregnancy by mothers socio-economic classification, UK:
(11a) Smoked throughout pregnancy (%)
(11b) Smoked before or during pregnancy (%)
(11c) Gave up smoking before or during pregnancy (% of those who smoked)
Source: Infant feeding surveys 2000, 2005 and 2010. Note: Trends for the four nations are broadly similar; some slight differences for Northern Ireland may be due to small sample sizes.
0
10
20
30
40
50
60
Managerial &professional
Intermediateoccupations
Routine &manual
Never worked Unclassified All mothers
2000
2005
2010
0
10
20
30
40
50
60
70
80
Managerial &professional
Intermediateoccupations
Routine &manual
Never worked Unclassified All mothers
2000
2005
2010
WP04 Labour’s Record on the Under Fives: Policy, Spending and Outcomes 1997 - 2010
53
The decline in smoking reflects behaviour in the wider population, and continues a long-term trend in the prevalence of smoking (and in the share of women giving up smoking in pregnancy) that goes back to the 1970s (Robinson and Harris, 2011; Foster et al, 1997). There is a lack of consensus as to whether the introduction of the ban on smoking in public places, introduced in Scotland in March 2006 and in the rest of the UK between April and July 2007, affected the trend. No change in trend is observable in the General Lifestyle Survey (ONS, 2013), but studies of health outcomes in Scotland and England before and after the ban have suggested an impact (Sims et al, 2010; Mackay et al, 2010; Mackay et al, 2012). However, social class gaps in smoking during pregnancy do seem to have narrowed since 2000 at a faster rate than in the previous period, according to the Infant Feeding Survey data. The absolute gap between non-manual and manual occupational classifications narrowed slightly between 1985 and 1995 but (under a new definition, and based on mothers’ not fathers’ occupation) the gap closed more quickly between 2000 and 2010 (Foster et al, 1997; HSCIC, 2012). As Table 9 shows, smoking during pregnancy fell most in absolute terms among women who had never worked (from 36% in 2000 to 21% in 2010), reducing the gap with managerial and professional women from 26 to 17 percentage points. However, the relative fall was higher among women from the highest occupational groups (where the share fell from 8% to 4%). Table 10 shows that the prevalence of drinking during pregnancy also fell over this period. Unlike smoking, drinking is less common among women from lower occupational classes, but Table 9 shows that in percentage terms drinking declined fastest for these women. No occupational breakdowns are available prior to 2005, but the overall trend has been steadily downwards since 1995 but picking up speed from 2005. In the population as a whole, there was an overall decline in the percentage of both men and women who had a drink in the past week, especially for the 16-44 age group (Robinson and Harris, 2011). But most of the story here seems to be about abstinence during pregnancy, probably reflecting increasing information about the potential dangers of alcohol for the developing foetus. In 2007 the government clarified its guidelines, advising pregnant women to avoid alcohol. What is perhaps most surprising is the larger falls for women from lower occupational classes, as health messages are often taken up fastest by higher socio-economic groups. Decreases in smoking and drinking during pregnancy and higher rates of breastfeeding indicate significant improvements for infant health. It is less clear whether there have been improvements in nutritional intake, particularly for younger children. For slightly older children, aged 5-8, evaluation of the National School Fruit and Vegetable Scheme found that in 2008 children were consuming significantly more fruit and vegetables both at home and at school compared to 2004 (Teeman et al., 2010). Most of the increase was in consumption at school, linked directly to the free fruit provision but also to improvements in school dinners: children were eating three times as many vegetables in their school dinners in 2008 as in 2004 (1.2 portions on average compared to 0.4 portions). But consumption at home and the fruit composition of packed lunches had also improved significantly. On the other hand, 2006 seemed to mark the peak for healthy eating and fruit and vegetable consumption fell back between 2006 and 2008.
WP04 Labour’s Record on the Under Fives: Policy, Spending and Outcomes 1997 - 2010
54
Table 10: Drinking behaviour before and during pregnancy in the UK, by mother’s socio-economic group
Drank alcohol before pregnancy Drank alcohol during pregnancy
Source: Infant Feeding Surveys 2000, 2005 and 2010 (Hamlyn et al, 2002; Bolling et al, 2007; HSIC, 2012). Note: Sample size (all mothers, unweighted) 5,165 1995; 9492 2000; 12,290 2005; 15,724 2010. Similar trends in the total figure were observed in all four UK nations.
We turn now to consider outcome measures. Table 11 shows the percentage of babies born at low birthweight (below 2500g). Low birthweight is an important predictor of later health outcomes which has also been linked to delays in cognitive and social development. The table shows that, overall, the prevalence of low birthweight rose from 1996 to 2002, making a mockery of the 1998 PSA target to reduce low birthweight by 5% by 2001-02, but fell steadily thereafter: a 5% reduction was finally achieved by 2010. The UK also improved in international terms: ranked against the EU15 and the US in 1998, only the US and Greece had a higher prevalence of low birthweight than the UK, while by 2009 it was also doing better than Portugal, Spain and Belgium (OECD 2011a)27. Trends in the overall prevalence of low birthweight can be misleading, however, because advances in medical technology have led to more very small babies being classified as live births (and therefore included in the statistics) who would previously not have been included, and this can push the percentage upwards. More interesting is the difference in low birthweight between social groups. Table 11 shows a striking reduction in the social class gap, which fluctuated between 1995 and 2005 but fell very sharply thereafter due to a steeper decline in the proportion of low birthweight babies in lower social classes. The percentage gap more than halved between 2005 and 2010, to 16%. This is substantial progress, which may result in large part from the falls in smoking in pregnancy pointed to above; Mackay et al (2012) provide some evidence on this for Scotland, identifying reductions in pre-term and small-for-dates births associated with the smoking ban. On the other hand, Table 11 shows less evidence of a closing gap between babies registered by two parents and those registered by the mother alone. Low birthweight for sole registrations shows a downward trend from 2003, and the gap also narrows from that point, but the change is more gradual and is thrown by a jump upwards in 2009.
27 OECD Health Data 2011, available at: http://www.oecd.org/document/30/0,3746,en_2649_37407_12968734_1_1_1_37407,00.html
WP04 Labour’s Record on the Under Fives: Policy, Spending and Outcomes 1997 - 2010
55
Low birthweight is a strong predictor of infant death: two-thirds of infant deaths in 2009 were among babies born below 2500g, though these babies represented only 7% of all live births.28 Figure 12 shows declines in infant mortality for all births which are jointly registered or within marriage (the bottom of the bars) and for babies whose fathers’ occupation is classified as routine or manual (the top of the bars). In brackets we see the percentage gap between the two. Infant mortality declined steadily between 1997 and 2010, but initially fell slightly faster for higher socioeconomic classes, leading to a widening of the relative gap from 13% to 19%. Since 2004-06, however, there has been a sharp fall in infant mortality among babies from routine/manual backgrounds, echoing the fall in low birthweight noted earlier. The relative gap closed significantly as a result, nearly halving from 2001-03 to 10% in 2008-10 (provisional figures). This meant that Labour met its 2002 PSA target for the IMR gap, which was to reduce the gap between the routine and manual socioeconomic group and the general population by at least 10% compared to a baseline year of 1997-99. The drop to a 10% gap in 2008-10 meant an overall reduction of the gap of 23% compared to the baseline. Table 11 Percentage of babies born weighing less than 2500g, by father’s occupational class, and by single registration, England and Wales
Year Total
Social
classes I to
IIINM
Social
classes IIIM
to V
% gap
Jointly
registered by
two parents
Solely
registered by
the mother
% gap
1995 7.3 6.2 7.9 0.27
1996 7.3 6.3 7.7 0.22
1997 7.4 6.3 7.8 0.24 7.2 9.9 0.38
1998 7.5 6.3 8.3 0.32 7.3 10.0 0.37
1999 7.6 6.3 8.5 0.35 7.4 9.9 0.34
2000 7.6 6.4 8.2 0.28 7.4 10.1 0.36
2001 7.6 6.4 8.5 0.33 7.4 10.2 0.38
Social
classes 1-4
Social
classes 5-8
2002 7.7 6.6 8.5 0.29 7.5 10.4 0.39
2003 7.7 6.7 8.5 0.27 7.4 10.8 0.46
2004 7.5 6.6 8.2 0.24 7.3 10.5 0.44
2005 7.5 6.4 8.6 0.34 7.3 10.4 0.42
2006 7.5 6.6 8.1 0.23 7.3 10.4 0.42
2007 7.1 6.3 7.7 0.22 7.0 9.9 0.41
2008 7.1 6.5 7.8 0.20 6.9 9.6 0.39
2009 7.1 6.4 7.2 0.13 6.9 10.0 0.45
2010 6.9 6.2 7.2 0.16 6.8 9.5 0.40 Source: Social Class 1997-2009 from www.poverty.org.uk, using ONS data. Social class 2010 and sole and joint registration provided by ONS at individual request. Notes: Figures are for live births only. Figures for live births by social class are a 10% sample coded for father’s occupation. There was a change in the classification system between 2001 and 2002. Classes I-IIINM include: Professional, managerial and technical/intermediate and skilled non-manual. Classes IIIM-V include: Skilled non-manual, partly skilled and unskilled. NS-SEC categories 1-4 include: Higher managerial and professional, lower professional and higher technical occupations, intermediate occupations and employers in small occupations. NS-SEC categories 5-8 include: Lower supervisory occupations, semi-routine occupations, routine occupations and never worked and long-term unemployed.
28 ONS child mortality statistics for 2009, reported on The Poverty Site, www.poverty.org.uk
WP04 Labour’s Record on the Under Fives: Policy, Spending and Outcomes 1997 - 2010
56
Figure 12: Absolute and relative gaps in infant mortality rates between routine/manual group and the average for all groups, England and Wales
Source: 1997-1999 data and 2002-04 to 2008-10 data: Department of Health (2011a: 6) Table 1b; 1997-99 to 2001-03 data: Department of Health (2009) Table 1 Notes: Gap and change figures are calculated based on unrounded mortality rates except for pre 1997-99 figures where the absolute and relative gap figures are authors’ calculations based on rounded mortality rates. 2008-10 data are provisional. Earlier periods reflect the latest final figures, and so may differ slightly from data reported previously. Only infants born inside marriage or outside marriage jointly registered by both parents are included. Data for 2001 onwards is based on NS-SEC classification which was introduced in 2001 to replace the Registrar General’s Social Classification (RGSC). A time series back to 1994 was constructed to be on an equivalent basis and is based on an approximation to NS-SEC (NS-SEC 90) available for use with data prior to 2001. See Department of Health (2009) Annex for further details.
If infant mortality figures are placed in international context the story is a little less positive. In the UK as a whole the infant mortality rate fell from 5.9 per 1,000 in 1997 to 4.6 per 1,000 in 2010, but all OECD countries saw IMR fall over this period, and faster progress in many other countries meant the UK’s ranking fell, from 20th to 25th of 34 OECD countries.29 Among the countries overtaking the UK were Portugal, Ireland, Greece, Israel, Estonia and Korea. The narrowing social class gap is likely to be a more unusual achievement, but we do not have comparative data which lets us place this in international context. Finally we consider childhood obesity figures. Figure 13 provides data for 4-5 year olds from the National Child Measurement Programme, which has weighed and measured children annually in reception class and Year 6 since 2006/07. The figure shows data right up to 2011/12 because these are already published, and because obesity reflects medium-term patterns of behaviour, so will not have been suddenly affected by the change of government. Progress is very clearly less impressive than for the health outcomes looked at above. There has been a small but significant decline in the percentage of boys classified as obese since 2006/07, but no change for girls or for the percentage of children who are overweight but not obese. More than one in five children are overweight by the time they start school.
29 OECD Health Data 2011, available at:
http://www.oecd.org/document/30/0,3746,en_2649_37407_12968734_1_1_1_37407,00.html, accessed April 2012
WP04 Labour’s Record on the Under Fives: Policy, Spending and Outcomes 1997 - 2010
57
Figure 13: Percentage of reception class children who were overweight or obese, England
Source: National Child Measurement Programme, annual reports available from www.ic.nhs.uk/ncmp Note: The NCMP measures and weighs all children in maintained schools in England in reception year and Year 6 unless their parents opt out. Because nearly all children are included, confidence intervals are small. The decline in obesity for boys is significant at the 95% confidence level.
In sum, there is considerable evidence here of real improvements in early childhood health, which are likely to have been driven by changing health behaviour. There have been substantial declines in smoking and drinking during pregnancy and big increases in rates of breastfeeding, with particularly large gains in all cases among more disadvantaged mothers. Rates of low birthweight and infant mortality have fallen, particularly for children from lower socioeconomic groups. In both cases, substantial improvements only really materialised late in Labour’s time in office, echoing the patterns we noticed above with respect to changes in Foundation Stage Profile results. Again, it seems plausible that a range of policies have taken time to have an impact. However, some shadow is cast on the health story by the fact that other countries have seen faster improvements in infant mortality, and by a lack of progress since 2006/07 in reducing the share of four and five year olds classified as overweight or obese.
0
2
4
6
8
10
12
14
16
2006
/07
2007
/08
2008
/09
2009
/10
2010
/11
2011
/12
2006
/07
2007
/08
2008
/09
2009
/10
2010
/11
2011
/12
Boys Girls
Overweight
Obese
WP04 Labour’s Record on the Under Fives: Policy, Spending and Outcomes 1997 - 2010
58
8. Poverty and material resources
Reducing income poverty in households with children was central to Labour’s agenda, both as an end in itself and as a key part of the strategy to improve children’s long-term opportunities. A raft of policies aimed to increase parental employment, including investment in childcare discussed earlier and policies such as the New Deal for Lone Parents, which provided advice and support to lone parents considering a return to work. Parents also benefited from broader changes aimed at ‘making working pay’, including the National Minimum Wage, which played a key role in lifting pay in low-wage jobs, with the greatest impact on women and on those working part-time (Manning, 2012). At the same time, reforms also directly increased financial support to households with children, whether adults were in work or not. Universal Child Benefit was increased substantially in real terms for oldest children in 1999 and kept pace with earnings thereafter. Child Tax Credit, introduced in 2003, provided more significant levels of support on the principle of ‘progressive universalism’: some 90% of families were eligible for the family element of CTC but the per-child element was highly progressive, targeting most support to those at the bottom of the distribution, including those not in work at all or working part-time on low wages. While almost all households with children benefited from Labour’s tax-benefit changes, the position of families with younger children was privileged in several ways. Most importantly, CTC treated all dependent children under 18 alike, where previously rates had been lower for children under 11, and this led to a significant boost in the relative incomes of younger families during Labour’s first term (Gregg et al, 2005). In addition, the family element of CTC was doubled during a child’s first year, while a one-off Sure Start Maternity Grant payment of £500 was introduced for mothers on low incomes. From April 2009, Child Benefit was extended to pregnant women in the third trimester.
Spending and inputs:
As Table 3 showed, very large sums were invested in tax credits and benefits aimed at households with children. An additional £20 billion in real terms was spent on children under 18 through the benefit system in 2009-10 compared to 1997-98 – an extra 1% of UK GDP. Breaking out spending specifically on under-fives is difficult to do. The bottom line of Table 3 shows average spending per child 0-4, which includes the average spend for all under 18s with maternity and paternity benefits added, but there are two reasons why this will slightly underestimate the investment in younger children. First, from 2003 until the end of Labour’s time in office, families could claim double the family element of Child Tax Credit during a child’s first year, so an extra £545 in 2009-10 for around 470,000 households (HMRC 2012). Second, between 1998 and 2003 the gap in out-of-work benefit payments for children under and over eleven was gradually closed: in April 1998 just over £10 less (in 2009-10 prices) was paid in Income Support each week for younger than older children, while from April 2003 payments were equal for all dependent children under 18. The 2009-10 per capita figure is therefore a reasonable estimate of what the average child over a year old will have received in that year, but the 1997-98 figure somewhat over-estimates spending on children under 11, and similarly under-estimates spending on older children. For these two reasons, the extent of the increase in per capita spending on younger children is not fully reflected by these numbers. Nevertheless, the increase averaged over all children is substantial: additional spending of just over £2,000 per head in 2009-10 prices. It is perhaps worth reiterating, though, that this is similar to the level of additional per-capita spending on services for under-fives (excluding most health spending) – so a very significant sum, but only half of the government’s overall investment in young children.
WP04 Labour’s Record on the Under Fives: Policy, Spending and Outcomes 1997 - 2010
59
The bulk of the additional money – over £12 billion of the £20 billion on under 18s – went on means-tested assistance for working families. A further £4 billion extra was spent on benefits for non-working families, with another £4 billion on universal Child Benefit and the non-means-tested Disability Living Allowance. In 2009-10, targeted in-work support comprised close to half the total benefit bill (45%), compared to around one quarter (27%) in 1997-98. Child Benefit made up less than one-third, compared to half the total bill in 1997-98, while the share spent on out-of-work benefits had remained roughly the same at just under a fifth.
Outputs and outcomes:
Child poverty in the UK fell from 27% in 1996/97 to 20% in 2009/10 with income measured before housing costs are deducted, and from 34% to 29% after housing costs (DWP, 2011). By 2010/11 poverty had fallen further to 18% (BHC) and 27% (AHC). This represented a big improvement in international ranking. In 1997, data from the European Community Household Panel showed child poverty to be higher in the UK than anywhere else in the EU 15 (Stewart, 2005). Data for 2011 from the European Union Statistics on Income and Living Standards (the successor to the ECHP), places the UK seventh of fourteen of these countries (with no data available for Ireland).30 The reduction in UK child poverty figures is well documented. What is less well known is that improvements were entirely driven by reductions in poverty among households with children under 11, and in particular among those with children under five. Figure 14 shows income poverty rates for children by the age of the youngest child in the household. We present the data in this way (rather than by the child’s own age) because poverty is measured at household level, so if a new baby tips a household into poverty this will affect all the children in the house. The numbers are three-year averages because of small sample sizes in some groups. Figure 14 shows both that the poverty risk in 1997 was higher the younger the smallest child in the household, and that poverty rates have converged over time, wiping out a large part of this difference. In 1997, children in households where the youngest child was under five were more than twice as likely to live in poverty as those where the youngest was sixteen or seventeen. Poverty fell steadily over the next decade for children in the first group, while, in contrast, children in households where all siblings are at least eleven have seen poverty rise slightly over time (similar to the rise in poverty for adults without dependent children). From 2001/02 onwards, all the improvement was for households with a youngest child under five. By 2009/10 the risk of poverty is still highest for these households, but the differences by age are much less stark than they had been at the start.
30 Data accessed February 26 2013. http://epp.eurostat.ec.europa.eu/portal/page/portal/statistics/search_database.
WP04 Labour’s Record on the Under Fives: Policy, Spending and Outcomes 1997 - 2010
60
Figure 14: Child poverty in Britain by age of youngest child in the household, three-year averages
(14a) Before Housing Costs
(14b) After Housing Costs
Source: Institute for Fiscal Studies, using the Family Resources Survey. Note: Figures are a three-year average ending in the year shown. Poverty is defined as having equivalised household income below 60% of the median. The figures show the percentage of children living in poverty by the age of the youngest child in the household.
What did this mean for children’ lives? A wide body of literature identifies an association between household income and children’s outcomes, and studies which are able to control properly for confounding factors indicate that this is more than a correlation – that higher income improves outcomes (see e.g. Blau, 1999; and review in Cooper and Stewart, 2013 forthcoming). There are two broad mechanisms through which a causal relationship is expected to operate: an investment model, because
WP04 Labour’s Record on the Under Fives: Policy, Spending and Outcomes 1997 - 2010
61
higher income enables parents to spend more on food, goods, toys and educational experiences which promote child development; and a stress model, which predicts that the quality of parenting suffers when parents are anxious about income. Research provides some indication that both mechanisms have been in play in the UK. Gregg et al (2006) find that, as income rose for low income households with young children, their expenditure patterns converged with those of better off households. In particular, spending rose on children’s clothing and footwear, fruit and vegetables, books, and durables including a telephone and a car. In contrast, spending on alcohol and tobacco fell. Analysis of the Families and Children study points both to big declines in material hardship among lone parent households between 1999 and 2006, and to substantial reductions in indicators of financial stress (Stewart, 2009). For example, the percentage of lone parents saying they could not afford fresh fruit on most days fell from 17% to 6%, and the share unable to afford toys and sports gear fell from 24% to 7%. The percentage saying they worried about money “almost always” fell from 45% to 29%, and the percentage who said they always ran out of money by the end of the week fell from 27% to 18%.31 These changes in turn are likely to have had an effect on children’s health and cognitive and social development, but pinning down the link is extremely difficult. The earlier sections of this paper have pointed to improvements in low birthweight, infant mortality, and cognitive, social and behavioural development, although obesity at age five shows little sign of change. We have discussed the range of policies which are likely to have contributed to these outcomes, from the introduction of a ban on smoking to the services offered through Sure Start Children’s Centres and the quantity and quality of early education and childcare. The role played by reductions in income poverty and financial hardship is impossible to quantify, but is surely one key part of the story.
31 The fresh fruit figure is for 2005.
WP04 Labour’s Record on the Under Fives: Policy, Spending and Outcomes 1997 - 2010
62
9. Conclusions
The Labour Government in power from 1997 to 2010 spent significant amounts of money on children under five, in a strategy which invested in both cash and services (to a remarkably even degree). By 2010 more than £3,500 was being spent per year on cash benefits for each child, and roughly £2,600 per child on Sure Start, early education and childcare, plus more than £900 on health. This paper has sought to examine what this money was spent on, what was delivered in terms of additional services, and how these changes affected measurable outcomes for children. Perhaps the simplest way to sum up what we have found is to consider the early experiences of a hypothetical child born at the end of the period compared to that of his sister born at the beginning. The child born later could expect to spend twice as long at home with his mother in the first year if she had worked before birth. Whether she had worked or not, and whatever her occupational background, he was more likely to be breastfed in his first few days and also more likely to still be breastfeeding six months later. His chances of attending a formal childcare setting before the age of three were higher, and from age three onwards he was now almost certain to access early education. The childcare and early education settings would very likely have been of better quality than those his sister attended, structured around a play-based curriculum and with more chance of contact with a trained graduate professional. If he spent his first few years at home or with a childminder or part-time working parent, he would have had access to more local play sessions, art and singing groups and toy libraries, especially if he lived in a disadvantaged area. His mother would have had more support, with easier access both to networks of other parents and to more formal advice and information. He would have been a little less likely to experience harsh parenting and a little more likely to have a more stimulating home environment. His household would have been better off financially and considerably less likely to live below the poverty line. In terms of outcomes, our younger child was less likely to have been born at low birthweight than his sister and less likely to die in his first year. His cognitive and social development at age five were likely to have been considerably higher, but his chances of being overweight had not changed. In both health outcomes and cognitive and social development, the gap between our child and babies his age but from different social backgrounds had narrowed. A crucial question, of course, is how far these changes in parenting behaviour and children’s outcomes were driven by policy change and service improvements. How do we know that they would not have taken place anyway? This is always a difficult question for policy evaluation, because we have no counerfactual world to make comparisons to, but there are several ways of approaching an answer. A handful of Labour’s policy initiatives were subject to a formal evaluation process in which the use of a control group allows us to isolate the impact of the policy. Four policies looked at in this paper had such an evaluation: Sure Start Local Programmes, the Neighbouhood Nurseries Initiative (which looked for impact on employment in areas with a Neighbourhood Nursery), the Graduate Leader Fund (looking at quality of provision in nurseries) and the National School Fruit and Vegetable Scheme. All found the policy in question had a significant positive impact on service quality, behaviour or outcomes, though this was often small in size. A second useful approach, where data allows, is to consider whether improvements simply represent a continuation of what was happening before or whether what we see is a new trend. On the whole, where we are able to do this, we see either a change in trend or an acceleration of progress. The decline in relative income poverty among children represents a clear change in direction, reversing a steady
WP04 Labour’s Record on the Under Fives: Policy, Spending and Outcomes 1997 - 2010
63
upward trend since 1979. In health, the infant mortality rate had been falling for many years, but the social class gap only started to narrow from 2002-04. Low birthweight rose from 1993 to 2002 and fell from then on, while the social class gap in low birthweight rose between 1995 and 1999 and has been on a downward trend thereafter. Measures of cognitive and social development among five year olds were only gathered in a consistent way from 2005, but the change in trend since that time, with improvements starting from 2008, suggests that Labour policies were responsible but took a while to become effective. Figures for maternal health behaviour are a little less clear but also point to a change in trend, especially in relation to social class gaps. Smoking overall and in pregancy has been in steady decline since at least 1985 but the social class gap narrowed more rapidly between 2000 and 2010 than in previous periods. The increase in breastfeeding rates at birth can be identified from 1990 onwards in Scotland and Northern Ireland, but for England only from 2000, and the big improvements in the duration of breastfeeding came after 2000, and particularly between 2005 and 2010. Social class differences in both initial breastfeeding and duration narrowed slightly between 1980 and 1995 but more rapid gains were made between 2000 and 2010. Third, we can ask whether outcomes improved by international standards. Here the story is more mixed, though there are only a few indicators where comparison is possible on a consistent basis. On child poverty rates (for children of all ages), the UK’s ranking improved from bottom of 15 EU countries in 1997 to seventh of fourteen in 2011 (with no data available for Ireland). Smaller improvements were made in the low birthweight ranking, but on the infant mortality rate the UK’s position fell as other countries made faster progress. On the other hand, closing social class gaps in low birthweight and IMR has been a particularly important part of the story of the period and for this we do not have comparisons. In sum, there is good evidence that many of the improvements in children’s experience and outcomes can be linked to Labour policy. A final and more challenging question for Labour is whether improvements represent good value for the large increases in expenditure we have recorded. Could outcomes have been even better if the money had been spent differently? Again, the absence of an identical world with different policy choices makes this an impossible question to answer, but several issues are worth raising. The first regards the balance between universalism and targeting. One of the most expensive policies, the three and four year old early education entitlement, was costly because it was universal. If we consider the policy in instrumental terms, was it worth it? Could the money have been better spent if targeted on those who had most to gain? Common sense suggests that it could – and yet the much lower take-up of targeted support for childcare for younger children raises questions about whether near universal enrolment could have been achieved without a universal policy. Sure Start provides another example of the challenge of finding a balance between universalism and targeting. When Sure Start Children’s Centres were rolled out to the rest of the country (partly to reach disadvantaged children in non-disadvantaged areas), resources were not increased by enough to sustain levels of funding to the existing Centres: services now reached more children, at greater cost overall, but were more thinly spread. These examples underline the basic trade-off policymakers face: in general, providing improved services for more children will cost more money, and there is no right answer about which corner of this triangle should give way. Nevertheless there may be ways in which money could have been spent ‘smarter’. One question mark hangs over Labour’s decision to expand the provision of childcare and early education in England using a demand-side strategy which actively promoted private and voluntary sector providers of childcare and early education, rather than developing the maintained sector, which had been shown to deliver better
WP04 Labour’s Record on the Under Fives: Policy, Spending and Outcomes 1997 - 2010
64
quality. The importance of ‘choice for parents’ was given considerable emphasis, echoing approaches to the delivery of other public services. In practice, it is not clear either how much parents really value choice or how far having a range of providers, including for-profit providers, manages to ensure this. Quality of childcare certainly improved under Labour policies, particularly in the voluntary sector, but these improvements seem to have resulted from government investment and regulations, not from competition between providers. It is quite plausible that the same level of resources could have achieved more if they had been invested in direct state provision. On the other hand, the focus on joined-up working at local level may have improved the effectiveness of government spending by reducing duplication. Service integration was an important part of the thinking behind Sure Start Local Programmes, and the Every Child Matters framework picked up this approach and developed it further, ensuring clearer lines of accountability for children’s welfare. To the extent that these processes have been successful, they will have increased the returns to money spent. In practice, fully joined-up working was difficult to achieve (Eisenstadt, 2011), but the change in the way services were delivered locally should not be dismissed. In evidence to the House of Commons Children, Schools and Families Committee, a number of local authorities argued that the development of Children’s Centres led to a wider reconfiguration of local services for young people, and described the value of the multi-agency teams they had created (House of Commons, 2010). We conclude with two final observations. First, it has been a repeated theme in this paper that policies can take time to bed in and have an effect. In a number of areas – Sure Start, improvements in Foundation Stage Profiles, low birthweight and infant mortality – we see no instant gains but significant improvements by the time Labour left office. Politicians (and electorates) operate on short-term time scales and are eager for quick results, but some policies only reap rewards years down the line. The second, related, point is that many of the outcomes we are interested in are influenced by a range of different policies, and as such are difficult to pin to particular policy changes. For example, are improvements in Foundation Stage Profile results mainly due to increases in the quantity and quality of formal childcare and early education, or do they also owe something to reduced poverty, improvements in the home learning environment, and better health at birth? Because of both time-lags and uncertainties, there are dangers that valuable pieces of the jigsaw will be vulnerable to policy change, and that effective policies will be dismantled or scaled down just as they are starting to work well.
WP04 Labour’s Record on the Under Fives: Policy, Spending and Outcomes 1997 - 2010
65
References
Ainslie, S., R. Foster, J. Groves, K. Grime, K. Straker and C. Woolhouse (2010). ‘Making children count: an exploration of the implementation of the Every Child Matters agenda.’ Education 3-13, 38 (1): 23-38.
Anning, A., and M. Ball, eds. 2008. Improving services for young children: From Sure Start to children’s centres. London: Sage.
Anning, A., E. Chesworth, and L. Spurling. 2005. The quality of early learning, play and childcare services in Sure Start local programmes. NESS/2005/FR/009. Nottingham: DfES.
Audit Commission, 2010. Giving Children a Healthy Start. London: Audit Commission. Baker, M., Milligan, K., 2008. Maternal employment, breastfeeding, and health: Evidence from maternity
leave mandates. Journal of Health Economics 27, 871–887. Ball, M., Niven, L., 2005. National Evaluation Summary: Buildings in Sure Start Local Programmes.
NESS/2005/SF/011. London: National Evaluation of Sure Start. Bartington, S., Griffiths, L.J., Tate, A.R., Dezateux, C., 2006. Are breastfeeding rates higher among
mothers delivering in Baby Friendly accredited maternity units in the UK? International Journal of Epidemiology 35, 1178–1186.
Belsky, J., Barnes, J., Melhuish, E.C., 2007. The national evaluation of Sure Start. Bristol: The Policy Press.
Berger, L.M., Hill, J., Waldfogel, J., 2005. Maternity leave, early maternal employment and child health and development in the US. The Economic Journal 115, F29–F47.
Bertram, T, C Pascal, S Bokhari, M Gasper, S Holtermann, K John, C Nelson (2004) Early Excellence Centre Pilot Programme: Third Annual Evaluation Report 2001-02. Birmingham: Centre for Research in Early Childhood.
BIS, 2010. Work and Families Act 2006 Evaluation Report. Department for Business, Innovation and Skills.
Blau, D.M., 1999. The Effect of Income on Child Development. The Review of Economics and Statistics 81, 261–276.
Bolling, K, 2007. Infant Feeding Survey 2005. London: The Stationery Office. Borra, C., Iacovou, M., Sevilla, A., 2012. The effect of breastfeeding on children’s cognitive and
noncognitive development. Labour Economics 19, 496. Bradley, K., Price, E., Mitchell, L., Hakim, C., 2008. Little Britons: financing childcare choice. London:
Policy Exchange. Broadfoot, M., Britten, J., Tappin, D.M., MacKenzie, J.M., 2005. The Baby Friendly Hospital Initiative and
breast feeding rates in Scotland. Arch Dis Child Fetal Neonatal Ed 90, F114–F116. CABE, 2008. Sure Start Children’s Centres: A post-occupancy evaluation. Commission for Architecture
and the Built Environment. Chanfreau, J., 2011. Maternity and paternity rights and women returners survey 2009/10. Department for
Work and Pensions Research report No. 777. Norwich: The Stationery Office. Chuang, C.-H., Chang, P.-J., Chen, Y.-C., Hsieh, W.-S., Hurng, B.-S., Lin, S.-J., Chen, P.-C., 2010.
Maternal return to work and breastfeeding: A population-based cohort study. International Journal of Nursing Studies 47, 461–474.
Cooper, K and K Stewart 2013 (forthcoming). How Much Does Money Matter? A Review of the Evidence on the Causal Link Between Household Financial Resources and Child Outcomes. York: Joseph Rowntree Foundation.
DCSF, 2007. Sure Start Children’s Centres: Phase 3 Planning and Delivery. Department for Children, Schools and Families.
WP04 Labour’s Record on the Under Fives: Policy, Spending and Outcomes 1997 - 2010
66
DCSF, 2009. Autumn Performance Report 2009: Progress against our Public Service Agreements and Departmental Strategic Objectives. London: TSO.
DCSF, 2009a. Sure Start Children’s Centres Survey of Parents. Department for Children, Schools and Families.
DCSF, 2009b. Independent Review of the Primary Curriculum: Final Report [WWW Document]. URL https://www.education.gov.uk/publications/standard/AbouttheDepartment/Page3/DCSF-00499-2009 (accessed 11.20.12).
DfES, DWT (Department for Work and Pensions), HMT (HM Treasury), and Women and Equality Unit. 2002. Inter-departmental childcare review: Delivering for children and families. London: DfES, DWP, HMT, Women and Equality Unit.
Department of Health, 2007. Implementation Plan for Reducing Health Inequalities in Infant Mortality. Department of Health.
Department of Health, 2009a. Healthy lives, brighter futures: The strategy for children and young people’s health.
Department of Health, 2009b. Tackling Health Inequalities: 10 Years On. DfEE, 1998. Meeting the Childcare Challenge. Green Paper. Department for Education and
Employment. DfE, 2010. Provision for Children Under Five Years of Age in England - January 2010. Department for
Education. DfES, 2003. Provision for children under five years of age in England: January 2003. Department for
Education and Skills. DfES and DoH, 2004. National Service Framework for Children, Young People and Maternity Services:
Executive Summary. London: Department of Health. Department of Health (2009), Mortality Target Monitoring (Infant Mortality, inequalities) available at
http://www.dh.gov.uk/prod_consum_dh/groups/dh_digitalassets/documents/digitalasset/dh_109444.pdf , accessed April 2012
Department of Health, (2011a) Mortality Monitoring Bulletin. Infant mortality, inequalities. Update to include data for 2010, available: http://www.dh.gov.uk/prod_consum_dh/groups/dh_digitalassets/documents/digitalasset/dh_131738.pdf
DWP, 2011. Households Below Average Income 1994/95 to 2009/10. The Stationary Office, London. Dykes, F., 2003. Infant Feeding Initiative: A Report Evaluating the Breastfeeding Practice Projects 1999-
2002. Department of Health. Eisenstadt, N., 2011. Providing A Sure Start : How government discovered early childhood. The Policy
Press, Bristol. FSB (Federation of Small Businesses), 2007. Nursery Entitlement - the situation. Foster, K, D Lader and S Cheesbrough (1997) Infant Feeding 1995. London: HMSO. Gambaro, L., Why are childcare workers low paid? An analysis of pay in the UK childcare sector, 1994-
2008. London Gambaro, L., Stewart, K., Waldfogel, J., 2013. “A question of quality: Do children from disadvantaged
backgrounds receive lower quality early childhood education and care in England?” CASEpaper 171. London: Centre for Analysis of Social Exclusion.
Gambaro, L., Stewart, K. and Waldfogel, J. (2014) ‘Introduction’ in An Equal Start: Providing High Quality Early Childhood Education and Care to Disadvantaged Families. Bristol: The Policy Press.
George, A., Wilkinson, D., Stokes, L., 2012. “Does Early Education Influence Key Stage 1 Attainment? Evidence for England from the Millennium Cohort Study.” National Institute Economic Review 222, R67–R80.
Glass, N., 2005. “Surely some mistake.” The Guardian, January 5 2005.
WP04 Labour’s Record on the Under Fives: Policy, Spending and Outcomes 1997 - 2010
67
Gregg, P., Harkness, S., Smith, S., 2009. “Welfare Reform and Lone Parents in the UK.” Economic Journal 119, F38(1).
Gregg, P., Waldfogel, J., Washbrook, E., 2006. “Family expenditures post-welfare reform in the UK: Are low-income families starting to catch up?” Labour Economics 13, 721–746.
Hamlyn, B, S Brooker, K Oleinikova and S Wands, 2002. Infant Feeding 2000. London: TSO. Health and Social Care Information Centre (HSCIC) Infant Feeding Survey 2012. London: TSO. HMRC, 2012. Child and Working Tax Credits Statistics. April 2012. London: Her Majesty’s Revenue and
Customs. HM Treasury, 1998a. Modern Public Services for Britain: Investing in Reform. Comprehensive Spending
Review New Public Spending Plans 1999-2002. The Stationery Office, London. HM Treasury, 1998b. Comprehensive Spending Review: Aims and Objectives. The Stationery Office. HM Treasury. 2003. Every Child Matters. Cm 5860. Norwich: TSO. HM Treasury, Department for Education and Skills, Department for Work and Pensions and Department
for Trade and Industry, 2004. Choice for Parents, the best start for children: a ten year strategy for childcare. Norwich: Her Majesty’s Stationery Office.
Home Office. 1999. Supporting Families: A Consultation Document. Norwich: Her Majesty’s Stationery Office.
House of Commons, 2010. Sure Start Children’s Centres: Fifth Report of Session 2009-10. Hudson, M., Lissenburgh, S., Sahin-Dikmen, M., 2004. Maternity and paternity rights in Britain 2002, In-
house report. Department for Work and Pensions. Konings, J., 2010. Children Vouchers: Who Benefits? An assessment of Evidence from the Family
Resources Survey. London: Social Market Foundation. La Valle, I., Clery, E., Huerta, M.C., 2008. Maternity rights and mothers’ employment decisions.
Research report Department for Work and Pensions Research Report No 496. La Valle, I., Smith, R., Purdon, S., Bell, A., Dearden, L., Shaw, J., Sibieta, L., 2007. The Neighbourhood
Nursery Initiative: what impact did it have on families’ lives? Latham, P., Kapoor, S., Myers, P., Barnes, J., 2006. Breastfeeding, Weaning and Health Eating: A
Synthesis of Sure Start Local Programme Evaluation Findings. Lewis, J., 2011. From Sure Start to Children’s Centres: An Analysis of Policy Change in English Early
Years Programmes. Journal of Social Policy 40, 71. Lewis, J., 2012. Continuity and Change in English Childcare Policy 1960-2000 Social Politics. Lewis, J., Cuthbert, R., Sarre, S., 2011. What are Children’s Centres? The Development of Children’s
Centre Services, 2004–2008. Social Policy & Administration 45, 35–53. Lewis, J, C Finnegan and A West, 2011a. Issues in the development of children’s centres on nursery
and primary school sites, Educational Studies, 37:4, 435-445 Lupton, R., A. Fenton, and A. Fitzgerald. 2013. “Labour’s Record on Neighbourhood Renewal in
England: Policy, Spending and Outcomes 1997-2010.” Social Policy in a Cold Climate Working Paper No 6.
Lupton, R., Burchardt, T., Hills, J., Stewart, K., Vizard, P., 2012. A Framework for Analysing the Effects of Social Policy. Social Policy in a Cold Climate Research Note.
Mackay, D., S. Haw, J. Ayres, C. Fischbacher and J. Pell. 2010. Smoke-free Legislation and Hospitalizations for Childhood Asthma. New England Journal of Medicine. 363(12): 1139-1145 .
Mackay, D., S. Nelson, S. Haw and J. Pell, 2012. Impact of Scotland’s Smoke-free Legislation on Pregnancy Complications: Retrospective Cohort Study. PLoS Med 9(3).
Manning, A., 2012. Minimum Wage, Maximum Impact? Resolution Foundation, London. Mathers, S., Sylva, K., Joshi, H., 2007. Quality of Childcare Settings in the Millennium Cohort Study ( No.
Research Report S SU/2007/FR/025). HMSO, London.
WP04 Labour’s Record on the Under Fives: Policy, Spending and Outcomes 1997 - 2010
68
Meadows, P., 2008. Improving the employability of parents, in: Anning, A., Ball, M. (Eds.), Improving Services for Young Children: From Sure Start to Children’s Centres. Sage, London.
Merrell, C., Tymms, P., 2011. Changes in Children’s Cognitive Development at the Start of School in England 2001-2008. Oxford Review of Education 37, 333–345.
Mooney, A, P Moss, C Owen (2001) A Survey of Former Childminders. DfES Research Report RR300. Moss, P. "Renewed Hopes and Lost Opportunities: Early Childhood in the Early Years of the Labour
Government." 1999. Cambridge Journal of Education 29, no. 2: 229 - 38. Moss, P., and H. Penn. 1996. Transforming Nursery Education. London: Paul Chapman. Moss, P and E Lloyd, 2013. “Is England really near the top of the league?” Nursery World. 8-21 April
2013. Munro, E. 2011. The Munro Review of Child Protection: Final Report – A Child Centred System. London:
Department for Education.NAO, 2006. Sure Start Children’s Centres. National Audit Office. NAO, 2009. Sure Start Children’s Centres – Memorandum for the Children, Schools and Families
Committee. National Audit Office, December 2009. NAO, 2012. Delivering the free entitlement to education for three- and four-year-olds ( No. HC 1789
Session 2010-2012). The Stationery Office, London. NESS, 2005. Early impacts of Sure Start Local Programmes on Children and Families. London: National
Evaluation of Sure Start. NESS, 2008. The Impact of Sure Start Local Programmes on Three Year Olds and Their Families.
London: National Evaluation of Sure Start. NESS, 2010a. National Evaluation of Sure Start Local Programmes: An economic perspective. London:
National Evaluation of Sure Start. NESS, 2010b. The Impact of Sure Start Local Programmes on five year olds and their families. London:
National Evaluation of Sure Start. NESS, 2012. The Impact of Sure Start Local Programmes on seven year olds and their families. London:
National Evaluation of Sure Start. NICE, 2008. Improving the nutrition of pregnant and breastfeeding mothers and children in low-income
households. National Institute for Health and Clinical Excellence. OECD, 2011. Doing Better for Families. Paris: OECD. Ofsted, 2009. The imapct of integrated services on children and their families in Sure Start Children’s
Centres. Ofsted, July 2009. Ofsted, 2011. The impact of the Early Years Foundation Stage. London: Ofsted. Ogbuanu, C.A., 2009. The effect of maternity leave length, other employment benefits, and job
characteristics on breastfeeding initiation and duration. Mimeo. University of South Carolina. ONS, 2013. General Lifestyle Survey Overview – a report on the 2011 General Lifestyle Survey. London:
Office for National Statistics. Parton, N. (2006) "Every child matters": The shift to prevention whilst strengthening protection in
children's services in England. Children and Youth Services Review, 28 (2). pp. 976-992. ISSN 0190-7409
Power, A., 2007. City survivors: bringing up children in disadvantaged neighbourhoods. Bristol: The Policy Press.
Radford, A., Rickitt, C., Williams, A., 1998. Breast feeding: the baby friendly initiative. BMJ : British Medical Journal 317, 1385.
Robinson, S. and Harris, H., 2011. Smoking and drinking among adults, 2009. London: Office for National Statistics.
Ruhm, C and J Waldfogel, 2012. Long-term Effects of Early Childhood Care and Education. Nordic Economic Policy Review.
WP04 Labour’s Record on the Under Fives: Policy, Spending and Outcomes 1997 - 2010
69
Sims, M, R Maxwell, L Bauld and A Gilmore, 2010. Short-term impact of smoke-free legislation in England: retrospective analysis of hospital admissions for myocardial infarction. British Medical Journal. 340: c2161. June 8 2010.
Sparkes, J and West A, 1998. “An evaluation of the English nursery voucher scheme”. Education Economics, 6(2),171 — 184
Spence, A. 2011. Social Trends 41: Labour Market. London: Office for National Statistics. Speight, S., Smith, R., 2010. Towards universal early years provision: analysis of take-up by
disadvantaged families from recent annual childcare surveys, DfE. Department for Education, London.
Stewart, K., 2005. Changes in poverty and inequality in the UK in international context, in: Hills, J., Stewart, K. (Eds.), A More Equal Society? New Labour, Poverty, Inequality and Exclusion. The Policy Press, Bristol.
Stewart, K., 2009. A scar on the soul of Britain: child poverty and disadvantage under New Labour, in: Hills, J., Sefton, T., Stewart, K. (Eds.), Towards a More Equal Society? Policy, Inequality and Policy Since 1997. The Policy Press, Bristol.
Sylva, K., Melhuish, E.C., Sammons, P., Siraj-Blatchford, I., Taggart, B., 2012. Effective Pre-school, Primary and Secondary Education 3-14 Project (EPPSE 3-14) - Final Report from the Key Stage 3 Phase: Influences on Students’ Development from age 11-14. Department for Education. Research Report DFE-RR202.
Sylva, K., Melhuish, E., Sammons, P., Siraj-Blatchford, I. and Taggart, B., 2004. The Effective Provision of Pre-School Education (EPPE) Project: Final Report. A Longitudinal Study Funded by the DfES 1997-2004. Department for Education and Skills.
Tanaka, S., 2005. Parental leave and child health across OECD Countries. Economic Journal, Vol 115, No 501, pp.F7-F28. February 2005.
Tanner, E., Agur, M., Hussey, D., 2012. Evaluation of Children’s Centres in England (ECCE) Strand 1: First Survey of Children’s Centre Leaders in the Most Deprived Areas. Department for Education.
Teeman, D., Lynch, S., White, K., Scott, E., 2010. The third evaluation of the School Fruit and Vegetable Scheme. Department of Health.
Tickell, C., 2011. The Early Years Foundation Stage (EYFS) Review: Report on the Evidence. Department for Education.
Vizard, P and P Obolenskaya. 2013. Labour’s Record on Health 1997-2010. Social Policy in a Cold Climate Research Paper.
Waldfogel, J., 2006. What Children Need. Harvard University Press,, Cambridge, Mass. West, A. 2006. The pre-school education market in England from 1997: quality, availability and equity.
Oxford Review of Education. 32:3, 283-301. West, A., Roberts, J., Noden, P., 2010. Funding Early Years Education And Care: Can A Mixed
Economy Of Providers Deliver Universal High Quality Provision? British Journal of Educational Studies 58, 155–179.
WP04 Labour’s Record on the Under Fives: Policy, Spending and Outcomes 1997 - 2010
70
Appendix 1: Public Service Agreement targets affecting children under five32
Each of Labour’s Spending Reviews set Public Service Agreement targets, giving Departments priority outcomes to achieve within a given timeframe. We report the main targets affecting children under five along with (where available) the official assessment of whether the targets were met. PSA targets were abolished by the Coalition Government in 2010.
Objectives PSA targets Met? Department for Education and Employment
Ensuring that all young people reach 16 with the skills, attitudes and personal qualities that will give them a secure foundation for lifelong learning, work and citizenship in a rapidly changing world.
An increase in the coverage of nursery places for 3 year olds from 34% to 66% by 2002, focusing on the most deprived areas of the country;
Met
Ofsted to deliver high quality inspection of schools, funded nursery education and Local Education Authorities (LEAs) providing independent assessment to help them raise educational standards.
8,000 nursery places inspected in 1999–2000
Department of Health
To maximise the social development of children within stable family settings.
Reduce the proportion of children who are re-registered on the child protection register by 10%, by 2002, from the baseline for the year ending March 1997 of 19% of children on the child protection register being re-registered.
Met
Sure Start Improving children’s social and emotional development. Improving children’s health.
Parenting support and information available for all parents. 10% reduction in children re-registered on a child protection register. All local Sure Start programmes to have agreed and implemented, in a culturally sensitive way, ways of identifying, caring for and supporting mothers with post natal depression. 5% reduction in proportion of low birth weight babies by 2001-02. 10% reduction in children admitted to hospitals as an emergency during their first year of life with gastroenteritis, a respiratory infection or a severe injury.
Met Met Met Not met Not met
32 Thanks to Sangeeta Goswami for putting these tables together.
WP04 Labour’s Record on the Under Fives: Policy, Spending and Outcomes 1997 - 2010
71
Improving children’s ability to learn. Strengthening families and communities. Increasing productivity.
At least 90% of children with normal speech and language development at 18 months and 3 years. 100% of children in Sure Start areas to have access to good quality play and early learning opportunities, helping progress towards early learning goals when they get to schools. 75% of families report personal evidence of an improvement in the quality of services providing family support. All local Sure Start programmes to have parent representation on local programme boards. At least 250 local programmes in England. 100% of families in contact with the local Sure start programme within first two months after birth. Evaluation strategy in place by 2000-01.
Not assessed Met Met Met Met Not met Met
Sources: Public Services for the Future: Modernisation, Reform, Accountability. Comprehensive Spending Review: Public Service Agreements 1999–2002. London: TSO http://archive.treasury.gov.uk/pub/html/psa/csrpsa.pdf Department for Education and Skills. Autumn Performance Report, 2003. http://media.education.gov.uk/assets/files/pdf/d/autumn%20performance%20report%20%20%202003.pdf
Department for Children, Schools and Families. Autumn Performance Report 2007: Achievement against Public Service Agreement targets. London: TSO, 2007. http://media.education.gov.uk/assets/files/pdf/d/autumn%20performance%20report%20%20%202007.pdf
Department of Health. Autumn Performance Report 2003. London: TSO, 2003. http://www.dh.gov.uk/prod_consum_dh/groups/dh_digitalassets/@dh/@en/documents/digitalasset/dh_4068576.pdf
WP04 Labour’s Record on the Under Fives: Policy, Spending and Outcomes 1997 - 2010
72
Spending Review 2000
Overarching objectives: increasing opportunity for all; building responsible and secure communities; raising productivity and sustainable growth; and securing a modern international role for Britain.
Objectives PSA targets Met? Department of Health Improving the
educational attainment of children in care and significantly reducing the proportion of children re-registered on the child protection register.
Continue the drive to give children in care the same life chances as their peers by maximising the contribution adoption can make to providing permanent families for children without compromising on quality, so maintaining current levels of adoptive placement stability. (amended in 2002 to include): by 2004-05 increase by 40% the number of looked after children who are adopted, and aim to exceed this by achieving, if possible, a 50% increase by 2006, up from 2,700 in 1999-00. by 2004-05 increase to 95% the proportion of looked after children placed for adoption within 12 months of the decision that adoption is in the child’s best interests, up from 81% in 2000-01 and maintain this level (95%) up to 2006, by locally applying the timescales in the National Adoption Standards, taking account of the individual child’s needs.
Not met Not met
Department of Social Security with HM Treasury
Ensuring the best start for all children and ending child poverty in 20 years.
Reduce the number of children in low-income households by at least a quarter by 2004, as a contribution towards the broader target of halving child poverty by 2010 and eradicating it by 2020.
Not met
Sure Start Improving social and emotional development. Improving health.
Reduce the proportion of children aged 0-3 in the 500 Sure Start areas who are re-registered within the space of 12 months on the child protection register by 20 per cent by 2004. Achieve by 2004 in the 500 Sure Start areas, a 10 per cent reduction in mothers who smoke in pregnancy.
Met Met
WP04 Labour’s Record on the Under Fives: Policy, Spending and Outcomes 1997 - 2010
73
Improving children's ability to learn. Strengthening families and communities.
Achieve by 2004, for children aged 0-3 in the 500 Sure Start areas, a reduction of five percentage points in the number of children with speech and language problems requiring specialist intervention by the age of four. Reduce the number of 0-3 year old children in Sure Start areas living in households where no-one is working by 12% by 2004.
Not known – target cannot be assessed Not met
Sources:
2000 Spending Review: Public Service Agreements, July 2000. http://archive.treasury.gov.uk/sr2000/psa/psa.pdf
Department for Education and Skills, Autumn Performance Report 2004: Achievement against Public Service Agreement Targets, 2000–2004. London: TSO, 2004. http://media.education.gov.uk/assets/files/pdf/d/autumn%20performance%20report%20%20%202004.pdf
Department for Education and Skills, Autumn Performance Report 2005: Achievement against Spending Review Public Service Agreement targets. London: TSO, 2005. http://media.education.gov.uk/assets/files/pdf/d/autumn%20performance%20report%20%20%202005.pdf Department for Children, Schools and Families. Autumn Performance Report 2007: Achievement against Public Service Agreement targets. London: TSO, 2007. http://media.education.gov.uk/assets/files/pdf/d/autumn%20performance%20report%20%20%202007.pdf
WP04 Labour’s Record on the Under Fives: Policy, Spending and Outcomes 1997 - 2010
74
Spending Review 2002
Overarching objective: Opportunity and security for all: Investing in an enterprising, fairer Britain.
Objectives PSA targets Met? Department of Health Starting with children
under one year, by 2010 to reduce by at least 10% the gap in mortality between the routine and manual group and the population as a whole.
By 2010 reduce inequalities in health outcomes by 10% as measured by infant mortality and life expectancy at birth.
Met
Department of Work and Pensions and HM Treasury
Ensure the best start for all children and end child poverty in 20 years. (DWP)
Reduce the number of children in low-income households by at least a quarter by 2004, as a contribution towards the broader target of halving child poverty by 2010 and eradicating it by 2020.
Not met
Sure Start Increase the availability of childcare for all children, and work with parents to be, parents and children to promote the physical, intellectual and social development of babies and young children particularly those who are disadvantaged so that they can flourish at home and at school, enabling their parents to work and contributing to the ending of child poverty.
In fully operational programmes, achieve by 2005-06: an increase in the proportion of children having normal levels of communication, language and literacy at the end of the Foundation Stage and an increase in the proportion of young children with satisfactory speech and language development at age 2 years; a 6 percentage point reduction in the proportion of mothers who smoke during pregnancy.
a 12% reduction in the proportion of young children living in households where no one is working.
Met Not met Not met
Sources:
2002 Spending Review: Public Service Agreements. http://webarchive.nationalarchives.gov.uk/20071204130111/http://hmtreasury.gov.uk/Spending_Review/spend_sr02/psa/spend_sr02_psaindex.cfm
HM Treasury. Autumn Performance Report: Progress Report on HM Treasury Public Service Agreement Targets, 1998–2002. London: TSO, 2003. http://www.hm-treasury.gov.uk/d/ACFD7F.pdf Department for Education and Skills. Autumn Performance Report 2006: Achievement against Public Service Agreement targets. London: TSO, 2006. http://media.education.gov.uk/assets/files/pdf/d/dfes%20autumn%20performance%20report%20-%202006.pdf
Department of Health. Autumn Performance Report 2007. London: TSO, 2007. http://www.dh.gov.uk/prod_consum_dh/groups/dh_digitalassets/@dh/@en/documents/digitalasset/dh_081329.pdf
WP04 Labour’s Record on the Under Fives: Policy, Spending and Outcomes 1997 - 2010
75
Spending Review 2004
Overarching objective: Stability, Security and Opportunity for All: Investing for Britain´s long-term future.
Objectives PSA targets Met? Department of Work and Pensions (DWP) and HM Treasury
To ensure the best start for all children and end child poverty by 2020.
Halve the number of children in relative low-income households between 1998-99 and 2010-11, on the way to eradicating child poverty by 2020, including: reducing the proportion of children living in workless households by 5 per cent between spring 2005 and spring 2008; and increasing the proportion of Parents with Care on Income Support and income-based Jobseeker’s Allowance who receive maintenance for their children to 65% by March 2008.
Not met Not met Not met
DWP and Department for Children, Schools and Families (DCSF) (through Sure Start Unit)
Safeguard children and young people, improve their life outcomes and general well-being, and break cycles of deprivation.
Improve children’s communication, social and emotional development so that, by 2008, 53 per cent of children reach a good level of development at the end of the Foundation Stage; and reduce inequalities between the level of development achieved by children in the 30 per cent most disadvantaged Super Output Areas11 and the rest of England, by four percentage points from 16 to 12 per cent.
Not met Not met
DWP and DCSF (through Sure Start Unit)
To ensure the best start for all children and end child poverty by 2020.
As a contribution to reducing the proportion of children living in households where no one is working, by 2008: increase the stock of Ofsted registered childcare by 10 per cent; increase the number of children in lower-income working families using formal childcare by 120,000; and introduce, by April 2005, a successful light-touch childcare approval scheme.
Met Not met Met
WP04 Labour’s Record on the Under Fives: Policy, Spending and Outcomes 1997 - 2010
76
Department of Health, joint with the Department for Education and Skills and the Department for Culture, Media and Sport
Improve the health of the population.
Reduce health inequalities by 10% by 2010 as measured by infant mortality and life expectancy at birth. Tackle the underlying determinants of ill health and health inequalities by halting the year-on-year rise in obesity among children under 11 by 2010 in the context of a broader strategy to tackle obesity in the population as a whole.
Met Not assessed
Sources: 2004 Spending Review: Stability, Security and Opportunity for All: Investing for Britain's long-term future. New Public Spending Plans 2005-2008. http://webarchive.nationalarchives.gov.uk/20100407164511/http://www.hm-treasury.gov.uk/spend_sr04_repindex.htm Department for Children, Schools and Families. Autumn Performance Report 2008: Progress against our Public Service Agreements and Departmental Strategic Objectives. London: TSO, 2008. http://media.education.gov.uk/assets/files/pdf/d/autumn%20performance%20report%20%20%202008.pdf Department for Children, Schools and Families. Autumn Performance Report 2009: Progress against our Public Service Agreements and Departmental Strategic Objectives. London: TSO http://media.education.gov.uk/assets/files/pdf/d/autumn%20performance%20report%20%20%202009.pdf Department for Work and Pensions. Autumn Performance Report 2007: Progress against Public Service Agreement targets. DWP, 2007. http://www.dwp.gov.uk/docs/bw-chapter2.pdf HM Treasury. Autumn Performance Report 2008: Progress on the HM Treasury Group Departmental Strategic Objectives and Public Service Agreements. http://www.hm-treasury.gov.uk/d/apr2008_pu672.pdf Department of Health. Autumn Performance Report 2007. London: TSO, 2007. http://www.dh.gov.uk/prod_consum_dh/groups/dh_digitalassets/@dh/@en/documents/digitalasset/dh_081329.pdf
WP04 Labour’s Record on the Under Fives: Policy, Spending and Outcomes 1997 - 2010
77
Comprehensive Spending Review 2007
Overarching objective: Help people and businesses come through the downturn sooner and stronger, supporting long-term economic growth and prosperity.
Objectives PSA targets Met? HM Treasury, DCSF Fairness and
opportunity for all. Halve the number of children in poverty by 2010-11, on the way to eradicating child poverty by 2020.
Not met
DCSF Raise the attainment gap for all children and young people Narrow the gap in educational achievement between children from lower income and disadvantaged backgrounds and their peers.
Increase the proportion of young children achieving a total points score of at least 78 across all 13 Early Years Foundation Stage Profile (EYFSP) scales - with at least 6 in each of the communications, language and literacy and language (CLL) and personal, social and emotional development (PSED) scales - by an additional 4 percentage points from 2008 results, by 2011 Improve the average (mean) score of the lowest 20 per cent of the Early Years Foundation Stage Profile (EYFSP) results, so that the gap between that average score and the median score is reduced by an additional 3 percentage points from 2008 results, by 2011
Met Met
DCSF and Department of Health
Improve the health and well-being of children and young people
Reduce the proportion of overweight and obese children to 2000 levels by 2020 in the context of tackling obesity across the population Increase the prevalence of breastfeeding at 6-8 weeks
Not assessed Not assessed
Sources: Public Service Agreements 2008-2011. http://webarchive.nationalarchives.gov.uk/+/http://www.hm-treasury.gov.uk/d/psa_2008-2011_200409.pdf Department of Health. Autumn Performance Report, 2009. London: TSO, 2009. http://www.dh.gov.uk/prod_consum_dh/groups/dh_digitalassets/documents/digitalasset/dh_109886.pdf Department for Children, Schools and Families. Autumn Performance Report 2009: Progress against our Public Service Agreements and Departmental Strategic Objectives. London: TSO, 2009. http://media.education.gov.uk/assets/files/pdf/d/autumn%20performance%20report%20%20%202009.pdf HM Treasury. Autumn Performance Report 2008: Progress on the HM Treasury Group Departmental Strategic Objectives and Public Service Agreements. http://www.hm-treasury.gov.uk/d/apr2008