53
Robert A. Kleinhenz, Ph.D. Chief Economist, Kyser Center for Economic Research, LAEDC LAEDC Economic Forecast & Industry Outlook 2015-2016 February 18, 2015

Robert A. Kleinhenz, Ph.D. Chief Economist, Kyser Center for Economic Research, LAEDC
LAEDC Economic Forecast
& Industry Outlook 2015-2016
February 18, 2015

Kyser Center for Economic Research
U.S. Economy
California Economy
Southern California Economy & Industries
Southern California 2015-16 Forecast
Kyser Center for Economic Research
Outline

U.S. Economy
Kyser Center for Economic Research

U.S. Economy – faster growth
Labor Market – full employment, wage gains
Oil Situation – tough on oil, good for economy
World Economy – mixed bag for U.S.
Federal Reserve – U.S. & global concerns
Kyser Center for Economic Research
In Brief – U.S. Economy

U.S. Economic Growth
Source: US Bureau of Economic Analysis, LAEDC Forecasts Kyser Center for Economic Research
3.3
2.7
1.8
-0.3
-2.8
2.5
1.6 2.3 2.2 2.4
3.0 3.0
2005 2006 2007 2008 2009 2010 2011 2012 2013 2014 2015f 2016f
Annual % Change

2%
4%
6%
8%
10%
12%
Ja
n-9
0
Ja
n-9
1
Ja
n-9
2
Ja
n-9
3
Ja
n-9
4
Ja
n-9
5
Ja
n-9
6
Ja
n-9
7
Ja
n-9
8
Ja
n-9
9
Jan
-00
Ja
n-0
1
Ja
n-0
2
Ja
n-0
3
Ja
n-0
4
Ja
n-0
5
Ja
n-0
6
Ja
n-0
7
Ja
n-0
8
Ja
n-0
9
Jan
-10
Ja
n-1
1
Ja
n-1
2
Ja
n-1
3
Ja
n-1
4
Ja
n-1
5
U.S. Average 1990-Now
U.S. Unemployment Rate
Source: US Bureau of Labor Statistics Kyser Center for Economic Research
Seasonally Adjusted, Jan 2015: 5.7%
Source: US Bureau of Labor Statistics Kyser Center for Economic Research
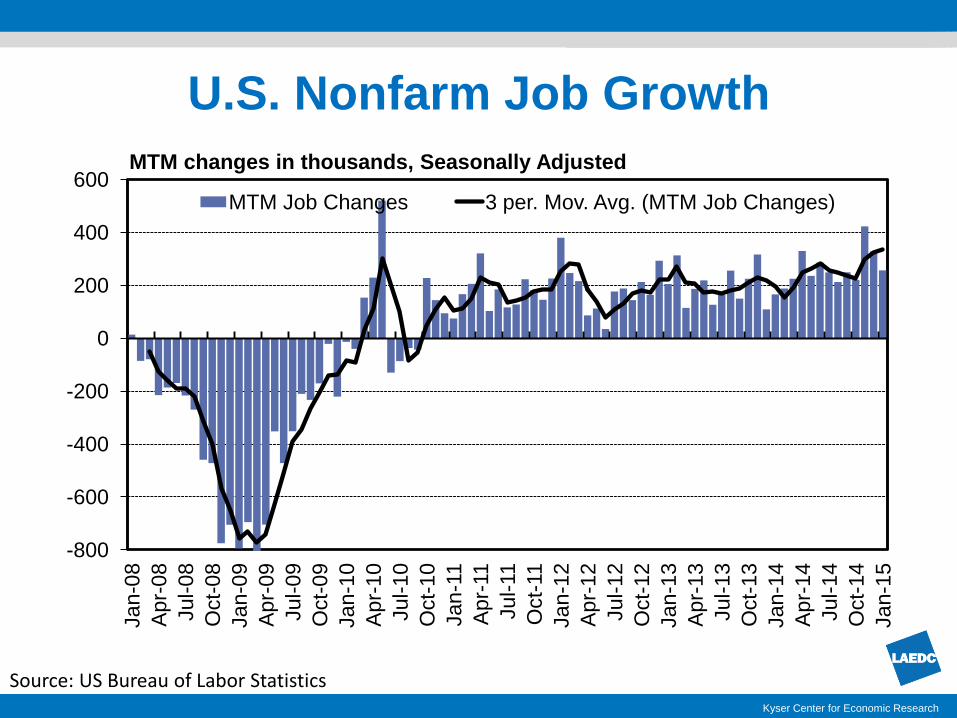
U.S. Nonfarm Job Growth
-800
-600
-400
-200
0
200
400
600
Jan
-08
Apr-
08
Jul-
08
Oct-
08
Jan
-09
Apr-
09
Jul-
09
Oct-
09
Jan
-10
Apr-
10
Ju
l-10
Oct-
10
Jan
-11
Apr-
11
Jul-
11
Oct-
11
Jan
-12
Apr-
12
Jul-
12
Oct-
12
Jan
-13
Apr-
13
Jul-
13
Oct-
13
Jan
-14
Apr-
14
Jul-
14
Oct-
14
Ja
n-1
5
MTM Job Changes 3 per. Mov. Avg. (MTM Job Changes)
MTM changes in thousands, Seasonally Adjusted

Key Sectors of Macroeconomy
Consumer Sector
Business Sector
Government
International Trade
Kyser Center for Economic Research

-2
-1
0
1
2
3
4
2007 2008 2009 2010 2011 2012 2013 2014 2015f 2016f
U.S. Consumer Expenditures Up
Source: Bureau of Economic Analysis, LAEDC forecasts
Annual % Change
Kyser Center for Economic Research

Household Income Below Peak
56.9 56.4
51.9
40
45
50
55
60
1999
2000
2001
2002
2003
2004
2005
2006
2007
2008
2009
2010
20
11
2012
2013
Median HH Income in Thousands of 2013 Dollars
Source: Census Bureau
Kyser Center for Economic Research
-8%

6.3%
4.6%
8.0% 7.6%
5.6%
-1.9%
7.0%
4.4%
3.5%
-4%
-2%
0%
2%
4%
6%
8%
10%
Equipment Intellectual Property Structures
2014 2015 2016
Kyser Center for Economic Research
Annual Percentage Change
Business Investment Spending Up
Source: IHS, LAEDC

Kyser Center for Economic Research
Federal Budget Receipts & Outlays as
Percentage of GDP
Source: Office of Management and Budget
10
12
14
16
18
20
22
24
26
2007 2008 2009 2010 2011 2012 2013 2014 2015f 2016f 2017f 2018f 2019f
Receipts Outlays
Forecast Source: LAEDC Kyser Center for Economic Research
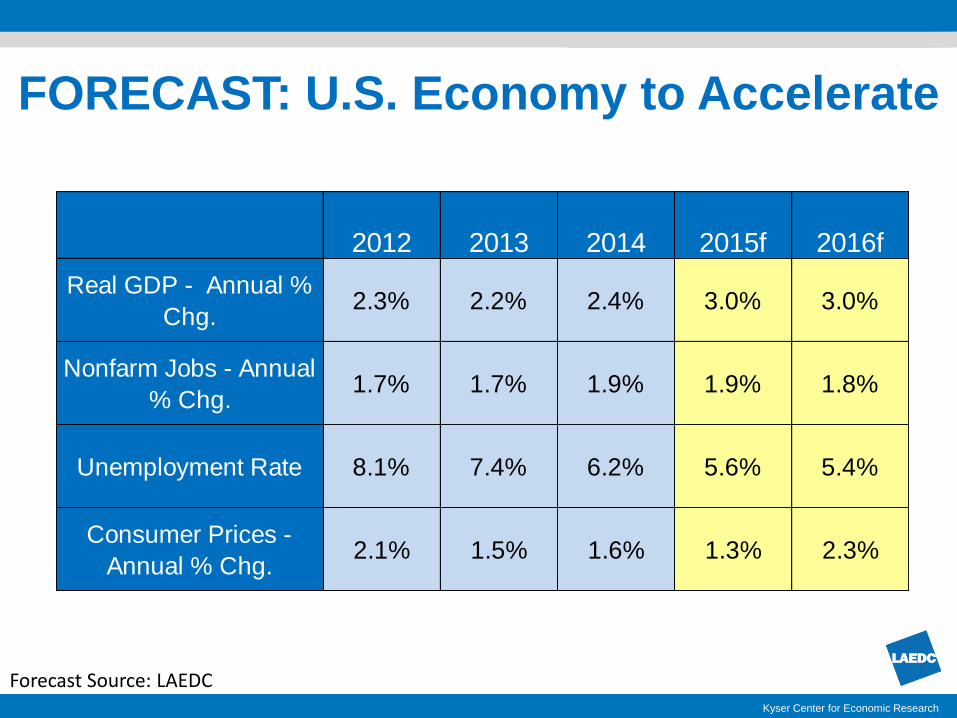
FORECAST: U.S. Economy to Accelerate
2012 2013 2014 2015f 2016f
Real GDP - Annual %
Chg.2.3% 2.2% 2.4% 3.0% 3.0%
Nonfarm Jobs - Annual
% Chg.1.7% 1.7% 1.9% 1.9% 1.8%
Unemployment Rate 8.1% 7.4% 6.2% 5.6% 5.4%
Consumer Prices -
Annual % Chg. 2.1% 1.5% 1.6% 1.3% 2.3%

Kyser Center for Economic Research Kyser Center for Economic Research
U.S. Forecast:
What to Watch

-0.5%
0.0%
0.5%
1.0%
1.5%
2.0%
2.5%
3.0%
3.5%
4.0%
2007 2008 2009 2010 2011 2012 2013 2014
Annual % Change in Hourly Wage Annual Inflation Rate
Source: Bureau of Labor Statistics
Wage Gains vs. Inflation
Kyser Center for Economic Research
Source: US Energy Information Administration Kyser Center for Economic Research
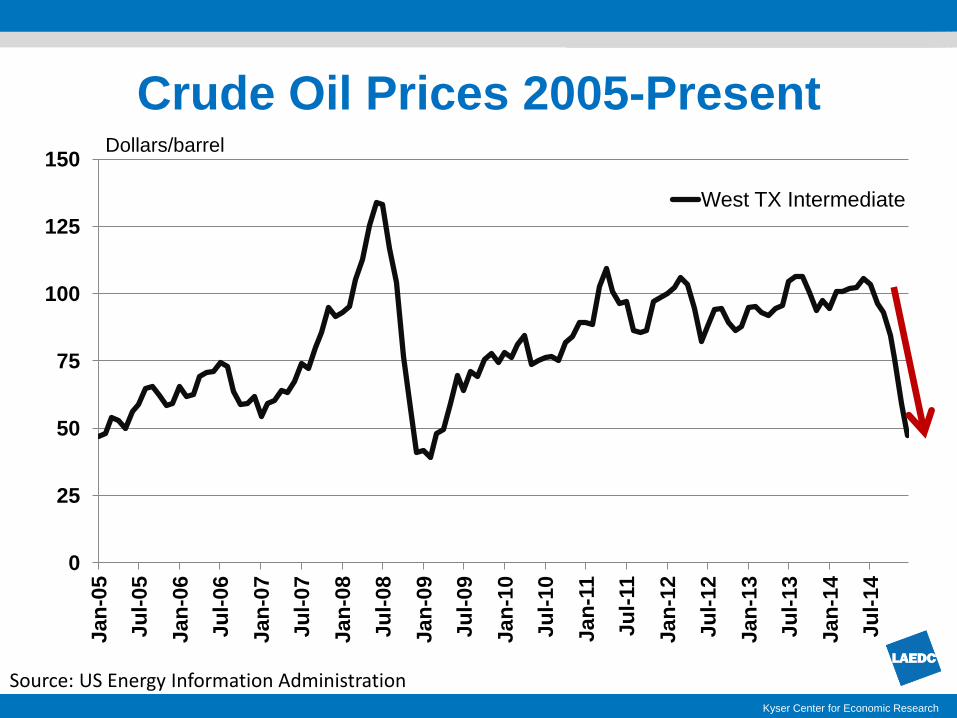
Crude Oil Prices 2005-Present
0
25
50
75
100
125
150
Jan
-05
Ju
l-0
5
Ja
n-0
6
Ju
l-0
6
Ja
n-0
7
Ju
l-07
Ja
n-0
8
Ju
l-0
8
Ja
n-0
9
Ju
l-0
9
Ja
n-1
0
Ju
l-1
0
Jan
-11
Ju
l-11
Ja
n-1
2
Ju
l-1
2
Ja
n-1
3
Ju
l-1
3
Ja
n-1
4
Ju
l-1
4
West TX Intermediate
Dollars/barrel

Kyser Center for Economic Research
Fed ended Quantitative Easing (QE) in
October 2014
Fed to raise short term rates in second
half of 2015? It depends…
Concern about Fed getting ‘ahead of the
curve’ and ability to react to future events
Q: When Will Fed Raise Rates?

Kyser Center for Economic Research
Key Interest Rates
0.0%
2.0%
4.0%
6.0%
8.0%
10.0%
12.0%
Ja
n-9
1
Ja
n-9
2
Ja
n-9
3
Ja
n-9
4
Ja
n-9
5
Ja
n-9
6
Ja
n-9
7
Ja
n-9
8
Ja
n-9
9
Ja
n-0
0
Ja
n-0
1
Ja
n-0
2
Ja
n-0
3
Ja
n-0
4
Ja
n-0
5
Ja
n-0
6
Ja
n-0
7
Ja
n-0
8
Ja
n-0
9
Ja
n-1
0
Ja
n-1
1
Ja
n-1
2
Ja
n-1
3
Ja
n-1
4
Fed Funds Fixed Rate Mort 10-Year T-Bond
Source: Federal Reserve
Source: DJIA Kyser Center for Economic Research
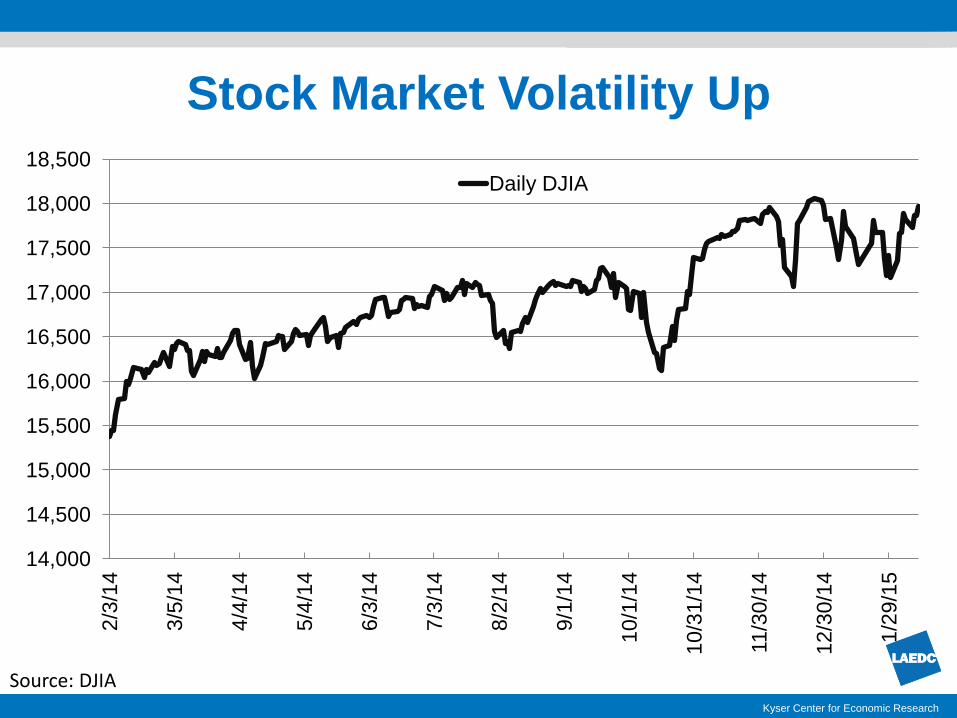
Stock Market Volatility Up
14,000
14,500
15,000
15,500
16,000
16,500
17,000
17,500
18,000
18,500
2/3
/14
3/5
/14
4/4
/14
5/4
/14
6/3
/14
7/3
/14
8/2
/14
9/1
/14
10
/1/1
4
10
/31
/14
11/3
0/1
4
12
/30
/14
1/2
9/1
5
Daily DJIA

Source: IMF World Economic Outlook, January 2015 Update Kyser Center for Economic Research
Mixed Global Outlook
-2.0
0.0
2.0
4.0
6.0
8.0
10.0
12.0
Euro Area Japan Developing Asia
Latin America/Carb.
World
2014 2015f 2016f
Annual % Growth

Kyser Center for Economic Research
California Economy

-7%
-6%
-5%
-4%
-3%
-2%
-1%
0%
1%
2%
3%
4%
Ja
n-0
7
Jan
-08
Ja
n-0
9
Ja
n-1
0
Ja
n-1
1
Ja
n-1
2
Ja
n-1
3
Ja
n-1
4
Jan
-15
US CA
California Adding Jobs Faster than U.S.
Source: US BLS, CA EDD Kyser Center for Economic Research
YTY % change in nonfarm jobs, seasonally adjusted

0%
5%
10%
15%
Ja
n-9
0
Ja
n-9
1
Ja
n-9
2
Ja
n-9
3
Ja
n-9
4
Ja
n-9
5
Jan
-96
Ja
n-9
7
Ja
n-9
8
Jan
-99
Ja
n-0
0
Ja
n-0
1
Jan
-02
Ja
n-0
3
Ja
n-0
4
Jan
-05
Ja
n-0
6
Ja
n-0
7
Ja
n-0
8
Ja
n-0
9
Ja
n-1
0
Ja
n-1
1
Ja
n-1
2
Ja
n-1
3
Ja
n-1
4
U.S. CA
CA Unemployment Rate Falling Quickly
Source: US BLS, CA EDD Kyser Center for Economic Research
Unemployment Rate
Source: CA EDD, Labor Market Information Division Kyser Center for Economic Research
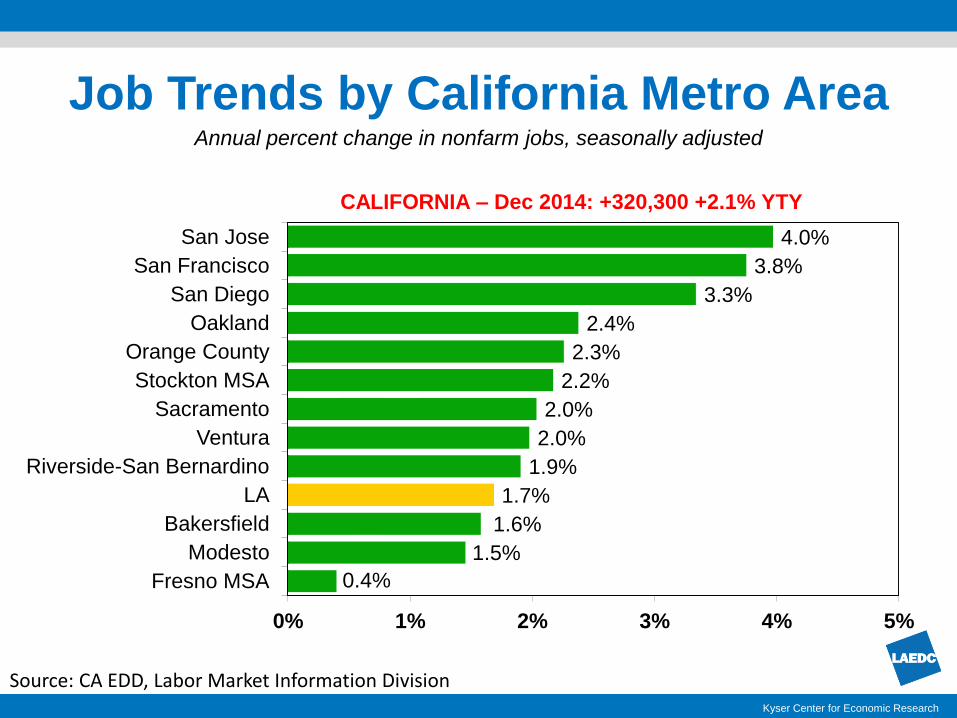
Job Trends by California Metro Area
0.4%
1.5%
1.6%
1.7%
1.9%
2.0%
2.0%
2.2%
2.3%
2.4%
3.3%
3.8%
4.0%
0% 1% 2% 3% 4% 5%
Fresno MSA
Modesto
Bakersfield
LA
Riverside-San Bernardino
Ventura
Sacramento
Stockton MSA
Orange County
Oakland
San Diego
San Francisco
San Jose
Annual percent change in nonfarm jobs, seasonally adjusted
CALIFORNIA – Dec 2014: +320,300 +2.1% YTY

Forecast Source: LAEDC Kyser Center for Economic Research
FORECAST: California Keeps Momentum
2012 2013 2014 2015f 2016f
Nonfarm Jobs -
annual % chg. 2.4% 3.0% 2.2% 2.2% 2.1%
Unemployment Rate 10.4% 8.9% 7.5% 6.7% 6.3%
Personal Income - annual
% chg.7.1% 2.8% 4.7% 4.4% 5.1%
Total Taxable Sales - %
chg. 7.3% 5.8% 5.7% 4.2% 6.1%
Housing Permits -
thousands of units57.6 82.3 85.3 110.0 135.6

Los Angeles County
& Southern California
Kyser Center for Economic Research

• Economic Activity – broad gains, new highs
• Port Activity – 3rd highest in 2014, 2015?
• Motion Picture & Sound Recording – stronger
• Housing – potential for growth
Kyser Center for Economic Research
In Brief - Southern California

Source: CA EDD, Labor Market Information Division Kyser Center for Economic Research
Local Unemployment Rates
0%
2%
4%
6%
8%
10%
12%
14%
16%
18%
20%
0%
2%
4%
6%
8%
10%
12%
14%
16%
18%
20%
2007 2008 2009 2010 2011 2012 2013 2014
LA - 8.2% OC - 5.3% IE - 8.5%

# of Major Industries and Industries: 169
Total Nonfarm Mining and Logging Construction Construction of Buildings Residential Building Construction Nonresidential Building Construction Heavy & Civil Engineering Construction Specialty Trade Contractors Building Foundation & Exterior Contractors Building Equipment Contractors Building Finishing Contractors Other Specialty Trade Contractors Manufacturing Durable Goods Primary Metal Manufacturing Fabricated Metal Product Manufacturing Machinery Manufacturing Computer & Electronic Product Manufacturing Electronic Instrument Manufacturing Electrical Equipment & Appliance Manufacturing Transportation Equipment Manufacturing Aerospace Product & Parts Manufacturing Furniture & Related Product Manufacturing Household & Institutional Furniture Mfg Miscellaneous Durable Goods Manufacturing Nondurable Goods Food Manufacturing Dairy Product Manufacturing Animal Slaughtering & Processing Bakeries & Tortilla Manufacturing Beverage & Tobacco Product Mfg Textile Mills Apparel Manufacturing Cut & Sew Apparel Manufacturing Paper Manufacturing Printing & Related Support Activities Petroleum & Coal Products Manufacturing Chemical Manufacturing Pharmaceutical & Medicine Manufacturing Plastics & Rubber Products Manufacturing Wholesale Trade Merchant Wholesalers, Durable Goods Motor Vehicle & Motor Vehicle Parts Merchant Professional & Commercial Equipment Merchant Electrical & Electronic Goods Merch Wholesalers Machinery, Equip & Supplies Merchant Wholesalers Miscellaneous Durable Goods Merchant Wholesalers Merchant Wholesalers, Nondurable Goods Apparel, Piece Goods & Notions Merch Wholesalers Grocery & Related Products Merchant Wholesalers Misc Nondurable Merchant Wholesalers Wholesale Electronic Markets & Agents & Broker Retail Trade Motor Vehicle & Parts Dealer Automobile Dealers Other Motor Vehicle Dealers Automotive Parts, Accessories & Tire Stores Furniture & Home Furnishings Stores Electronics & Appliance Stores Building Material & Garden Equipment Stores Food & Beverage Stores Grocery Stores Health & Personal Care Stores Gasoline Stations Clothing & Clothing Accessories Stores Sporting Goods, Hobby, Book & Music Stores Sporting Goods, Hobby & Musical Instrument Store Book, Periodical & Music Stores General Merchandise Stores Department Stores Other General Merchandise Stores Miscellaneous Store Retailers Nonstore Retailers Transportation, Warehousing & Utilities Utilities
Transportation & Warehousing Air Transportation Truck Transportation Transit & Ground Passenger Transportation Support Activities for Transportation Couriers & Messengers Warehousing & Storage Information Publishing Industries (except Internet) Newspaper, Periodical, Book & Directory Publishers Motion Picture & Sound Recording Broadcasting (except Internet) Radio & Television Broadcasting Cable & Other Subscription Programming Telecommunications Data Processing, Hosting & Related Services Finance & Insurance Credit Intermediation & Related Activities Depository Credit Intermediation Nondepository Credit Intermediation Activities Related to Credit Intermediation Securities, Commodity Contracts & Investments Insurance Carriers & Related Insurance Carriers Agencies, Broker, & Other Insurance Related Act Real Estate & Rental & Leasing Real Estate Lessors of Real Estate Offices of Real Estate Agents & Brokers Activities Related to Real Estate Real Estate and Rental and Leasing - Residual Professional, Scientific & Technical Services Legal Services Accounting, Tax Preparation & Bookkeeping Services Architectural, Engineering & Related Services Computer Systems Design & Related Services Management, Scientific & Technical Consulting Serv Scientific Research & Development Services Advertising & Related Services Management of Companies & Enterprises Administrative & Support & Waste Services Administrative & Support Services Employment Services Business Support Services Travel Arrangement & Reservation Services Investigation & Security Services Services to Buildings & Dwellings Educational Services Elementary & Secondary Schools Junior Colleges Colleges, Universities & Professional Schools Health Care & Social Assistance Ambulatory Health Care Services Offices of Physicians Offices of Dentists Offices of Other Health Practitioners Hospitals Nursing & Residential Care Facilities Nursing Care Facilities Social Assistance Individual & Family Services Child Day Care Services Leisure & Hospitality Arts, Entertainment & Recreation Performing Arts, Spectator Sports Independent Artists, Writers & Performers Museums, Historical Sites & Similar Institutions Amusement, Gambling & Recreation Gambling Industries Other Amusement & Recreation Accommodation & Food Services Accommodation Food Services & Drinking Places Full-Service Restaurants Limited-Service Eating Places Special Food Services Other Services Repair & Maintenance Personal & Laundry Services Religious, Grants, Civic, Professional & Like Org Government Federal Government Department of Defense Federal Government excluding Department of Defense State & Local Government State Government State Government Education State Government Excluding Education Local Government Local Government Education Local Government Excluding Education County City Special Districts plus Indian Tribes
Kyser Center for Economic Research

# of Detailed Industries: 2,059
Oil and Gas Extraction Oil and Gas Extraction Oil and Gas Extraction Crude Petroleum & Natural Gas Extraction Natural Gas Liquid Extraction Mining (except Oil and Gas) Nonmetallic Mineral Mining and Quarrying Stone Mining and Quarrying Dimension Stone Mining and Quarrying Other Crushed Stone Mining and Quarrying Sand, Clay, & Refractory Mineral Mining Construction Sand and Gravel Mining Other Nonmetallic Mineral Mining Potash, Soda, and Borate Mineral Mining All Other Nonmetallic Mineral Mining Support Activities for Mining Support Activities for Mining Support Activities for Mining Drilling Oil and Gas Wells Support Activities, Oil/Gas Operations Support Activities for Coal Mining Support Activities for Metal Mining Construction Construction of Buildings Residential Building Construction Residential Building Construction New Single-Family Housing Construction (except For-Sale Builders) New Multifamily Housing Construction (except For-Sale Builders) New Housing For-Sale Builders Residential Remodelers Nonresidential Building Construction Industrial Building Construction Industrial Building Construction Commercial Building Construction Commercial Building Construction Heavy and Civil Engineering Construction Utility System Construction Water and Sewer System Construction Water and Sewer System Construction Oil and Gas Pipeline Construction Oil and Gas Pipeline Construction Power/Communication System Construction Power/Communication System Construction Land Subdivision Land Subdivision Land Subdivision Highway, Street, and Bridge Construction Highway, Street, and Bridge Construction Highway, Street, and Bridge Construction Other Heavy Construction Other Heavy Construction Other Heavy Construction Specialty Trade Contractors Building Foundation/Exterior Contractors Poured Concrete Structure Contractors Residential Poured Foundation Contractor Nonresidential Poured Foundation Contrs Steel and Precast Concrete Contractors Residential Structural Steel Contractors Nonresidential Structural Steel Contrs Framing Contractors Residential Framing Contractors Nonresidential Framing Contractors Masonry Contractors Residential Masonry Contractors Nonresidential Masonry Contractors Glass and Glazing Contractors Residential Glass/Glazing Contractors Nonresidential Glass/Glazing Contractors Roofing Contractors Residential Roofing Contractors Nonresidential Roofing Contractors Siding Contractors Residential Siding Contractors Nonresidential Siding Contractors Other Building Exterior Contractors Other Residential Exterior Contractors Other Nonresidential Exterior Contrs Building Equipment Contractors Electrical Contractors Residential Electrical Contractors Nonresidential Electrical Contractors Plumbing and HVAC Contractors Residential Plumbing/HVAC Contractors Nonresidential Plumbing/HVAC Contractors Other Building Equipment Contractors Other Residential Equipment Contractors Other Nonresidential Equipment Contrs Building Finishing Contractors Drywall and Insulation Contractors Residential Drywall Contractors Nonresidential Drywall
Contractors Painting and Wall Covering Contractors Residential Painting Contractors Nonresidential Painting Contractors Flooring Contractors Residential Flooring Contractors Nonresidential Flooring Contractors Tile and Terrazzo Contractors Residential Tile/Terrazzo Contractors Nonresidential Tile/Terrazzo Contractors Finish Carpentry Contractors Residential Finish Carpentry Contractors Nonresidential Finish Carpentry Contrs Other Building Finishing Contractors Other Residential Finishing Contractors Other Nonresidential Finishing Contrs Other Specialty Trade Contractors Site Preparation Contractors Residential Site Preparation Contractors Nonresidential Site Preparation Contrs All Other Specialty Trade Contractors All Other Residential Trade Constractors All Other Nonresidential Trade Contrs Manufacturing Food Manufacturing Animal Food Manufacturing Animal Food Manufacturing Dog and Cat Food Manufacturing Other Animal Food Manufacturing Grain and Oilseed Milling Flour Milling and Malt Manufacturing Flour Milling Rice Milling Starch and Vegetable Oil Manufacturing Soybean and Other Oilseed Processing Fats and Oils Refining and Blending Breakfast Cereal Manufacturing Breakfast Cereal Manufacturing Sugar/Confectionery Product Manufacture Nonchocolate Confectionery Manufacturing Nonchocolate Confectionery Manufacturing Chocolate and Confectionery Manufacturing from Cacao Beans Confectionery Manufacturing from Purchased Chocolate Fruit, Vegetable, & Specialty Foods Mfg Frozen Food Manufacturing Frozen Fruit and Vegetable Manufacturing Frozen Specialty Food Manufacturing Fruit and Vegetable Canning Fruit and Vegetable Canning Specialty Canning Dried and Dehydrated Food Manufacturing Dairy Product Manufacturing Dairy Product (ex. Frozen) Manufacturing Fluid Milk Manufacturing Creamery Butter Manufacturing Cheese Manufacturing Dry, Condensed, Evaporated Dairy Product Ice Cream & Frozen Dessert Manufacturing Ice Cream & Frozen Dessert Manufacturing Animal Slaughtering and Processing Animal Slaughtering and Processing Animal (except Poultry) Slaughtering Meat Processed from Carcasses Rendering and Meat Byproduct Processing Poultry Processing Seafood Product Preparation & Packaging Seafood Product Preparation & Packaging Seafood Product Preparation and Packaging Bakeries and Tortilla Manufacturing Bread and Bakery Product Manufacturing Retail Bakeries Commercial Bakeries Frozen Pastry Manufacturing Cookie, Cracker, and Pasta Manufacturing Cookie and Cracker Manufacturing Dry Pasta, Dough, and Flour Mixes Manufacturing from Purchased Flour Tortilla Manufacturing Tortilla Manufacturing Other Food Manufacturing Snack Food Manufacturing Roasted Nuts and Peanut Butter Mfg Other Snack Food Manufacturing Coffee and Tea Manufacturing Coffee and Tea Manufacturing Flavoring Syrup and Concentrate Mfg Flavoring Syrup and Concentrate Mfg Seasoning and Dressing Manufacturing Mayonnaise, Dressing, and Sauce Mfg Spice and Extract Manufacturing All Other Food Manufacturing Perishable Prepared Food Manufacturing All Other Miscellaneous Food Mfg Beverage & Tobacco Product Manufacturing Beverage Manufacturing Soft Drink and Ice Manufacturing Soft Drink Manufacturing Bottled Water Manufacturing Ice Manufacturing Breweries Breweries Wineries Wineries Distilleries Distilleries Tobacco Manufacturing Tobacco Manufacturing Textile Mills Fiber, Yarn, and Thread Mills Fiber, Yarn, and Thread Mills
Kyser Center for Economic Research

Major Industries in Southern California
TRADED INDUSTRIES
(Generate New Income)
• International Trade
• Entertainment
• Business Services
• Aerospace
• Fashion & Apparel
• Tourism
• Knowledge Creation
LOCAL INDUSTRIES
(Circulate Income)
• Retail Sales
• Leisure & Hospitality
• Health Care/Social Assistance
Kyser Center for Economic Research

Millions of TEUs
Container Throughput
San Pedro Bay Ports
Sources: Ports of Los Angeles and Long Beach; forecast by LAEDC Kyser Center for Economic Research
Dec 2014 YTD: +3.8%
11.8 13.1
14.2
15.8 15.7 14.3
11.8
14.1 14.0 14.1 14.6 15.2
20
03
20
04
20
05
20
06
20
07
20
08
20
09
20
10
2011
20
12
20
13
20
14

0
50
100
150
200
250
300
20
00
20
01
20
02
20
03
20
04
20
05
20
06
20
07
20
08
20
09
20
10
20
11
20
12
20
13
20
14
Los Angeles Orange
Source: CA EDD, Labor Market Information Division Kyser Center for Economic Research
Southern California Transportation and
Warehousing Employment Thousands Dec 2014 YTY: +4.7%
YTD: +3.3%

Motion Picture & Sound Recording
Employment in Los Angeles County
Sources: CA EDD. LMID
0
20
40
60
80
100
120
140
2003 2004 2005 2006 2007 2008 2009 2010 2011 2012 2013 2014
Thousands
Kyser Center for Economic Research
2014: 130,900, +6.8% YTY
Shoot Days: +9.6% YTY

Kyser Center for Economic Research
Southern California Professional &
Business Services Employment
0
200
400
600
800
1,000
1,200
20
00
20
01
20
02
20
03
20
04
20
05
20
06
20
07
20
08
20
09
20
10
2011
20
12
20
13
20
14
Los Angeles Orange Inland Empire Ventura Thousands
Source: CA EDD, Labor Market Information Division
Dec 2014 YTY: +3.5% YTD: +5.5%

Source: CA EDD, Labor Market Information Division
Kyser Center for Economic Research
SoCal Manufacturing Employment
0
100,000
200,000
300,000
400,000
500,000
600,000
700,000
800,000
900,000
1,000,000
20
01
20
02
2003
20
04
20
05
20
06
20
07
20
08
20
09
20
10
20
11
20
12
20
13
2014
Durable Goods Nondurable Goods
Dec. 2014 YTD % Chg
Durable: -0.8% Nondurable: -3.8%

Manufacturing Trends
Adding Jobs:
Machinery Mfg
Furniture
Miscellaneous
Durable Goods
Losing Jobs:
Petro-Chemical
Food
Aerospace
Electronics
Pharmaceuticals
Apparel/Textiles
Kyser Center for Economic Research
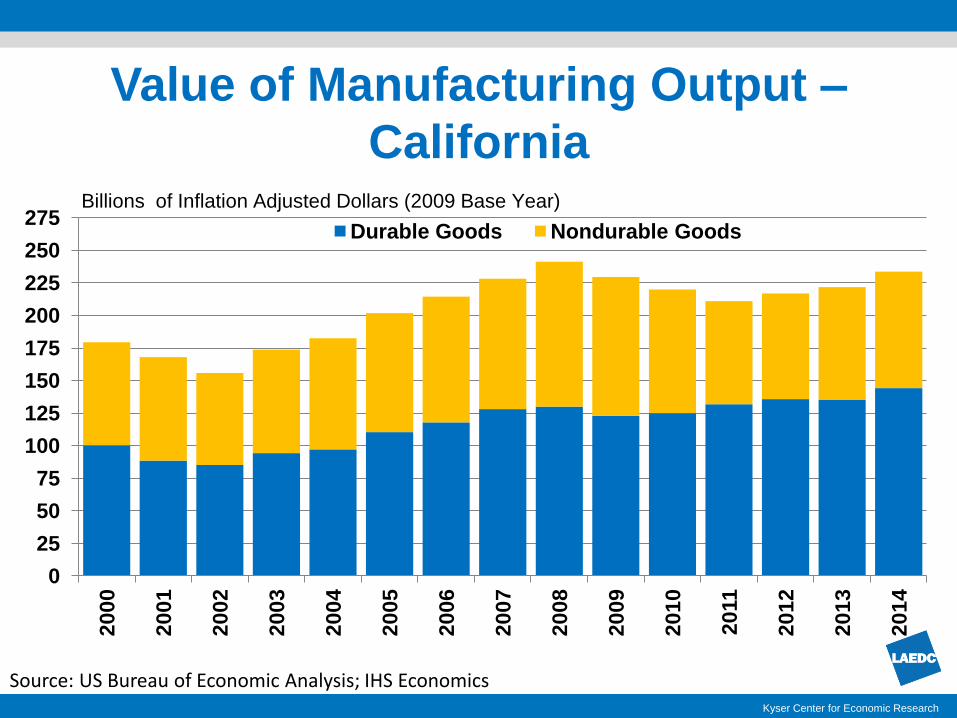
Source: US Bureau of Economic Analysis; IHS Economics Kyser Center for Economic Research
Value of Manufacturing Output –
California
0
25
50
75
100
125
150
175
200
225
250
275
20
00
20
01
20
02
20
03
20
04
20
05
20
06
20
07
20
08
20
09
20
10
2011
20
12
20
13
20
14
Durable Goods Nondurable Goods
Billions of Inflation Adjusted Dollars (2009 Base Year)
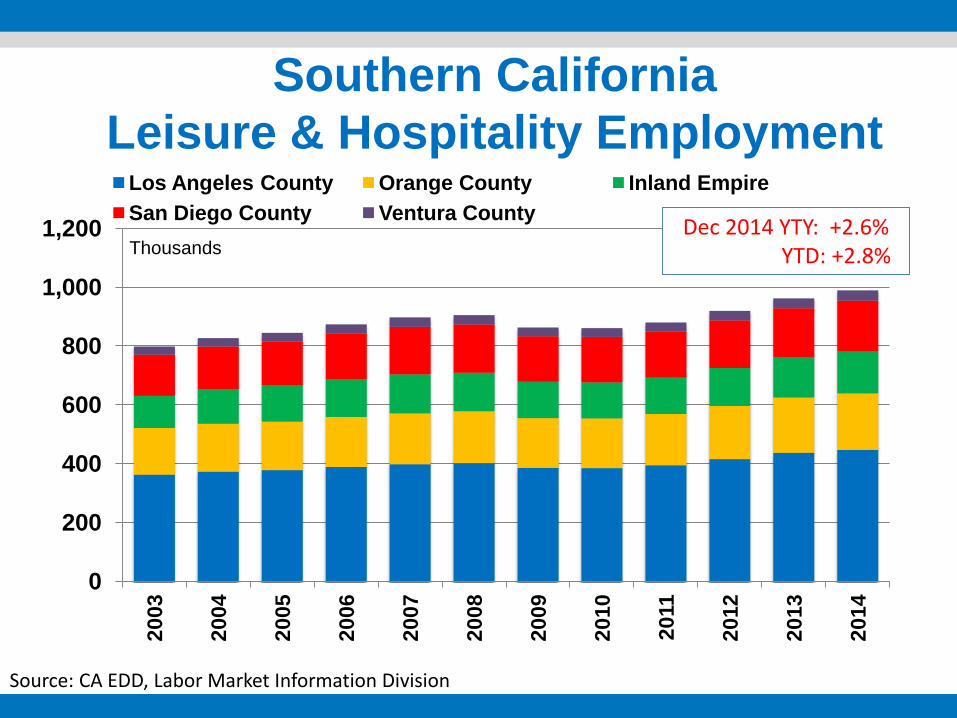
Southern California
Leisure & Hospitality Employment
0
200
400
600
800
1,000
1,200
2003
20
04
20
05
20
06
20
07
20
08
20
09
20
10
2011
20
12
20
13
20
14
Los Angeles County Orange County Inland Empire
San Diego County Ventura County
Thousands Dec 2014 YTY: +2.6%
YTD: +2.8%
Source: CA EDD, Labor Market Information Division
Kyser Center for Economic Research
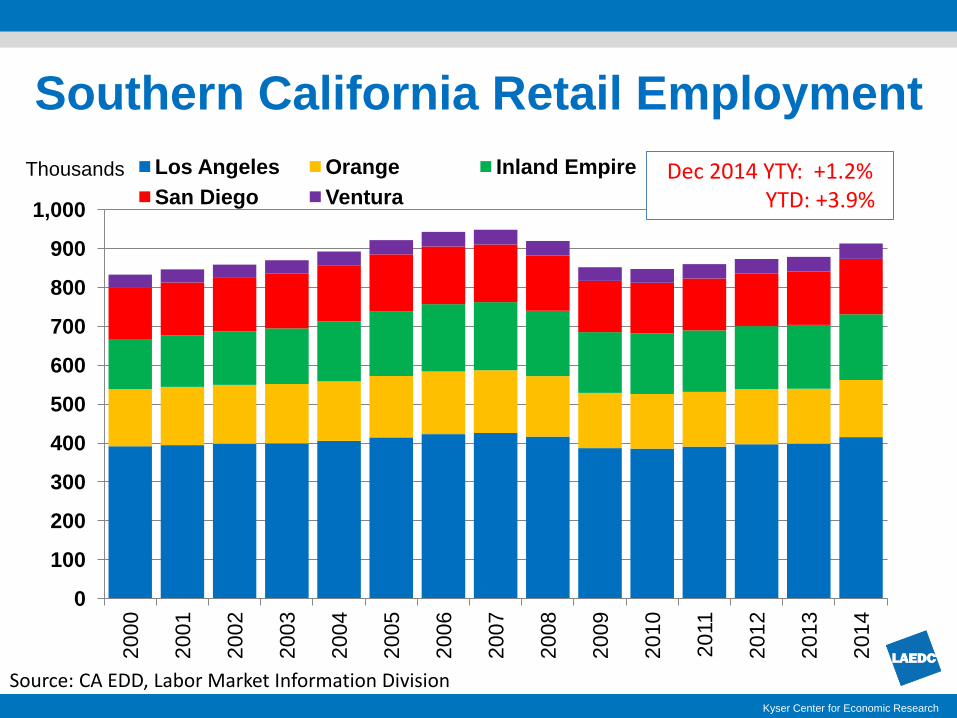
Southern California Retail Employment
Source: CA EDD, Labor Market Information Division
0
100
200
300
400
500
600
700
800
900
1,000
20
00
20
01
20
02
20
03
20
04
20
05
20
06
20
07
20
08
20
09
20
10
2011
20
12
20
13
20
14
Los Angeles Orange Inland Empire
San Diego Ventura
Thousands Dec 2014 YTY: +1.2% YTD: +3.9%

Kyser Center for Economic Research
Southern California Education &
Health Care Employment
Source: CA EDD, Labor Market Information Division
0
200
400
600
800
1,000
1,200
1,400
1,600
20
00
20
01
20
02
20
03
20
04
20
05
20
06
20
07
20
08
20
09
20
10
2011
20
12
20
13
20
14
Los Angeles Orange
Inland Empire San Diego
Ventura
Thousands Dec 2014 YTY: +3.8%
YTD: +3.5%

Kyser Center for Economic Research Kyser Center for Economic Research
Southern California
Real Estate
Source: Dataquick/DQ News Kyser Center for Economic Research
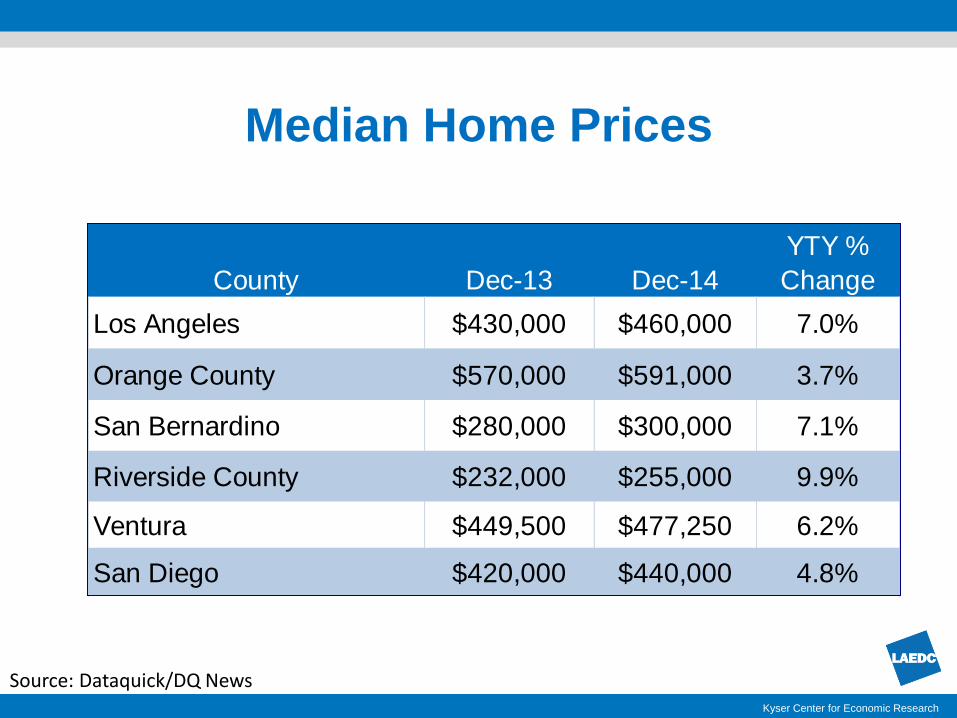
Median Home Prices
County Dec-13 Dec-14
YTY %
Change
Los Angeles $430,000 $460,000 7.0%
Orange County $570,000 $591,000 3.7%
San Bernardino $280,000 $300,000 7.1%
Riverside County $232,000 $255,000 9.9%
Ventura $449,500 $477,250 6.2%
San Diego $420,000 $440,000 4.8%

Residential Building Permits
Issued in Los Angeles County
10 12 12 10 8
3 2 2 2 4 4 4 5
11
15 14 16
13
10
3 5
8 9
13 14 16
0
5
10
15
20
25
30
'03 '04 '05 '06 '07 '08 '09 '10 '11 '12 '13 '14f '15f
Multi-Family
Single-Family
Permits issued, thousands
Source: CIRB, California Home Building Foundation, Preliminary Forecast LAEDC (1/27/15) Kyser Center for Economic Research

Source: CA EDD, Labor Market Information Division Kyser Center for Economic Research
Southern California Construction
Employment
0
100
200
300
400
500
600
20
00
20
01
20
02
20
03
20
04
20
05
20
06
20
07
20
08
20
09
20
10
2011
20
12
20
13
2014Y
TD
Los Angeles Orange Inland Empire San Diego Ventura Thousands
Dec 2014 YTY: +2.8% YTD: +7.8%

Kyser Center for Economic Research
Apartment Rents – Southern California
600
800
1,000
1,200
1,400
1,600
1,800
2,000
05Q
1
06Q
1
07Q
1
08Q
1
09Q
1
10Q
1
11Q
1
12
Q1
13Q
1
14Q
1
Los Angeles Orange Riverside San Bernardino Ventura
Source: CA Real Estate Research Council

0.0
2.0
4.0
6.0
8.0
10.0
12.0
14.0
16.0
1q
09
1q
10
1q
11
1q
12
1q
13
1q
14
Los Angeles Orange Inland Empire Ventura
Kyser Center for Economic Research
Industrial Vacancy Rates –
Southern California Percent vacant, quarterly averages
Source: Cushman and Wakefield

2.0
6.0
10.0
14.0
18.0
22.0
26.0
30.0
1q
09
1q
10
1q
11
1q
12
1q
13
1q
14
Los Angeles Orange Inland Empire Ventura
Source: Cushman and Wakefield Kyser Center for Economic Research
Office Vacancy Rates –
Southern California Percent vacancy, quarterly averages

2015 -2016
Southern Ca l i fo rn ia
Forecas t
Kyser Center for Economic Research

1.9% 2.0%
2.6%
1.7%
1.9% 1.8%
2.8%
1.8% 1.7%
1.8%
2.5%
1.6%
0.0%
0.5%
1.0%
1.5%
2.0%
2.5%
3.0%
Los Angeles County
Orange County Inland Empire Ventura County
2014 2015 2016
Kyser Center for Economic Research
Annual percent change in nonfarm jobs
Southern California Outlook - Jobs
Source: CA EDD, Labor Market Information Division; forecast by LAEDC
Kyser Center for Economic Research
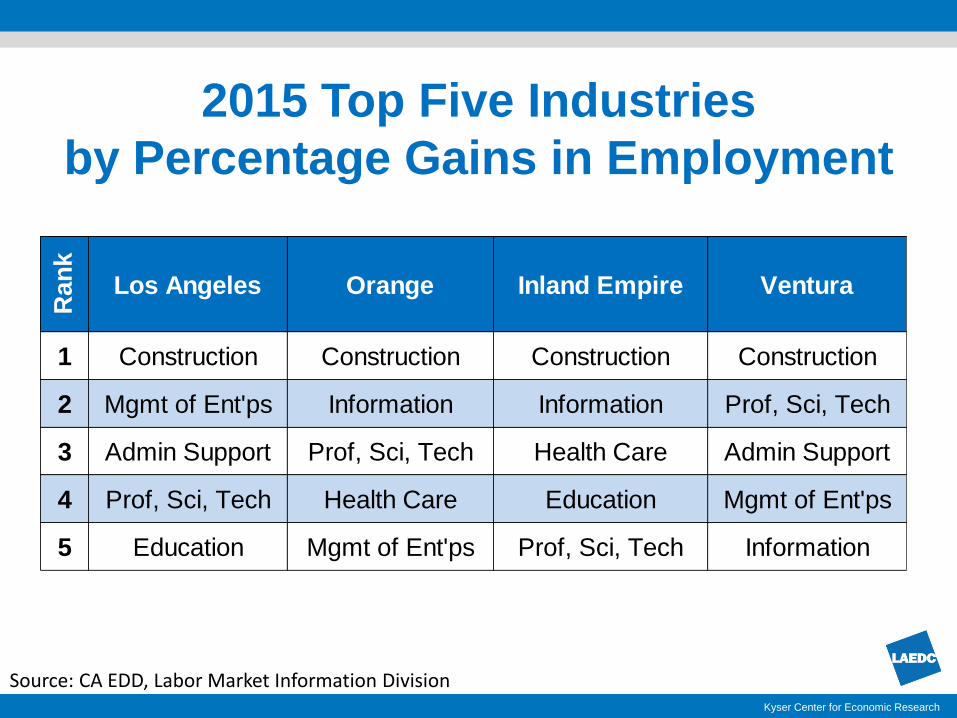
Ran
k
Los Angeles Orange Inland Empire Ventura
1 Construction Construction Construction Construction
2 Mgmt of Ent'ps Information Information Prof, Sci, Tech
3 Admin Support Prof, Sci, Tech Health Care Admin Support
4 Prof, Sci, Tech Health Care Education Mgmt of Ent'ps
5 Education Mgmt of Ent'ps Prof, Sci, Tech Information
2015 Top Five Industries
by Percentage Gains in Employment
Source: CA EDD, Labor Market Information Division

4.7% 4.7% 5.0%
4.4% 4.6% 4.8%
5.0% 4.6%
5.0%
5.6% 5.8%
5.1%
0.0%
1.0%
2.0%
3.0%
4.0%
5.0%
6.0%
7.0%
Los Angeles County
Orange County Inland Empire Ventura County
2014 2015 2016
Kyser Center for Economic Research
Annual Percent Change
Southern California Outlook –
Personal Income
Source: CA EDD, Labor Market Information Division; forecast by LAEDC

LAEDC Economic Forecast
& Industry Outlook 2015-2016
THANK YOU!


