TD Economics @TD_Economics http://economics.td.com • is provincial outlook incorporates widespread upgrades to 2021 growth forecasts relative to the March view. Up- ward adjustments range from 0.2 ppts in Newfoundland and Labrador and New Brunswick to 0.6 ppts in Quebec. e improved outlook is despite a third wave that has imparted more economic damage than endured during the second wave. Ontario and Nova Scotia seem to have suffered more damage, leaving employment in these provinces furthest from pre-pandemic levels as of May. In contrast, employment is much closer to pre-pandemic levels in B.C., New Brunswick and the Prairies. • With first dose vaccination campaigns progressing rapidly, we expect economies to rebound with gusto beginning this summer. All provinces have released re-opening plans. Most of these plans have begun in late-May/early-June, with further easing expected in July. Ontario stands out for its go-slow approach. However, the Province recently pushed forward its Stage 1 beginning date, suggesting the potential for further changes down the road. • Western Canada and to a lesser extent, Atlantic Canada, are well positioned to reap the benefits of a synchronized up- swing in commodity prices. A swifter than expected rebound in energy demand and prices is supportive for incomes, exports, and government coffers. A repeat of last year’s strong performance for crop production may prove to be a difficult feat, but solid demand and prices should keep the sector on a solid footing. An unprecedented bull market in lumber is an added tailwind to B.C.’s already-robust economic recovery. • A long-awaited government budget season culminated with another round of upward revisions to long-term provin- cial spending profiles. Relative to our previous fore- cast, B.C. and Quebec appear poised to benefit the most from new spending initiatives. All Provinces have also avoided any abrupt tightening of their purse strings. is came at the cost of upgraded medium- term deficit estimates across most provinces. • At long last, Canadian home sales have begun to un- wind from the stratospheric levels observed earlier in the pandemic. With tighter stress test rules taking hold in June, further declines are in store. However, tight supply/demand balances across Canada should keep home prices elevated, notwithstanding the po- tential for some near-term, policy-related cooling. Rising Tide Lifts All Boats June 18, 2021 Provincial Economic Forecast Jump to: BC | AB | SK | MB | ON | QC | NB | NS | PE | NL | Forecast Table For more details on our national forecast see our Quarterly Economic Forecast Contributing Authors ■ Omar Abdelrahman, Economist | 416-734-2873 ■ Rishi Sondhi, Economist | 416-983-8806 ■ Beata Caranci, Chief Economist | 416-982-8067 ■ Derek Burleton, Deputy Chief Economist | 416-982-2514 4.9% NS 4.7% PEI 4.1% NL 5.0% NB 6.7% QC 5.4% ON 5.5% MB 5.7% SK 6.4% AB 6.7% BC Provincial Real GDP Growth Forecast (2021) Source: TD Economics. Forecast as of June 2021.
Transcript
TD Economics
@TD_Economicshttp://economics.td.com
• This provincial outlook incorporates widespread upgrades to 2021 growth forecasts relative to the March view. Up-ward adjustments range from 0.2 ppts in Newfoundland and Labrador and New Brunswick to 0.6 ppts in Quebec. The improved outlook is despite a third wave that has imparted more economic damage than endured during the second wave. Ontario and Nova Scotia seem to have suffered more damage, leaving employment in these provinces furthest from pre-pandemic levels as of May. In contrast, employment is much closer to pre-pandemic levels in B.C., New Brunswick and the Prairies.
• With first dose vaccination campaigns progressing rapidly, we expect economies to rebound with gusto beginning this summer. All provinces have released re-opening plans. Most of these plans have begun in late-May/early-June, with further easing expected in July. Ontario stands out for its go-slow approach. However, the Province recently pushed forward its Stage 1 beginning date, suggesting the potential for further changes down the road.
• Western Canada and to a lesser extent, Atlantic Canada, are well positioned to reap the benefits of a synchronized up-swing in commodity prices. A swifter than expected rebound in energy demand and prices is supportive for incomes, exports, and government coffers. A repeat of last year’s strong performance for crop production may prove to be a difficult feat, but solid demand and prices should keep the sector on a solid footing. An unprecedented bull market in lumber is an added tailwind to B.C.’s already-robust economic recovery.
• A long-awaited government budget season culminated with another round of upward revisions to long-term provin-cial spending profiles. Relative to our previous fore-cast, B.C. and Quebec appear poised to benefit the most from new spending initiatives. All Provinces have also avoided any abrupt tightening of their purse strings. This came at the cost of upgraded medium-term deficit estimates across most provinces.
• At long last, Canadian home sales have begun to un-wind from the stratospheric levels observed earlier in the pandemic. With tighter stress test rules taking hold in June, further declines are in store. However, tight supply/demand balances across Canada should keep home prices elevated, notwithstanding the po-tential for some near-term, policy-related cooling.
Rising Tide Lifts All Boats June 18, 2021
Provincial Economic Forecast
Jump to: BC | AB | SK | MB | ON | QC | NB | NS | PE | NL | Forecast Table
For more details on our national forecast see our Quarterly Economic Forecast
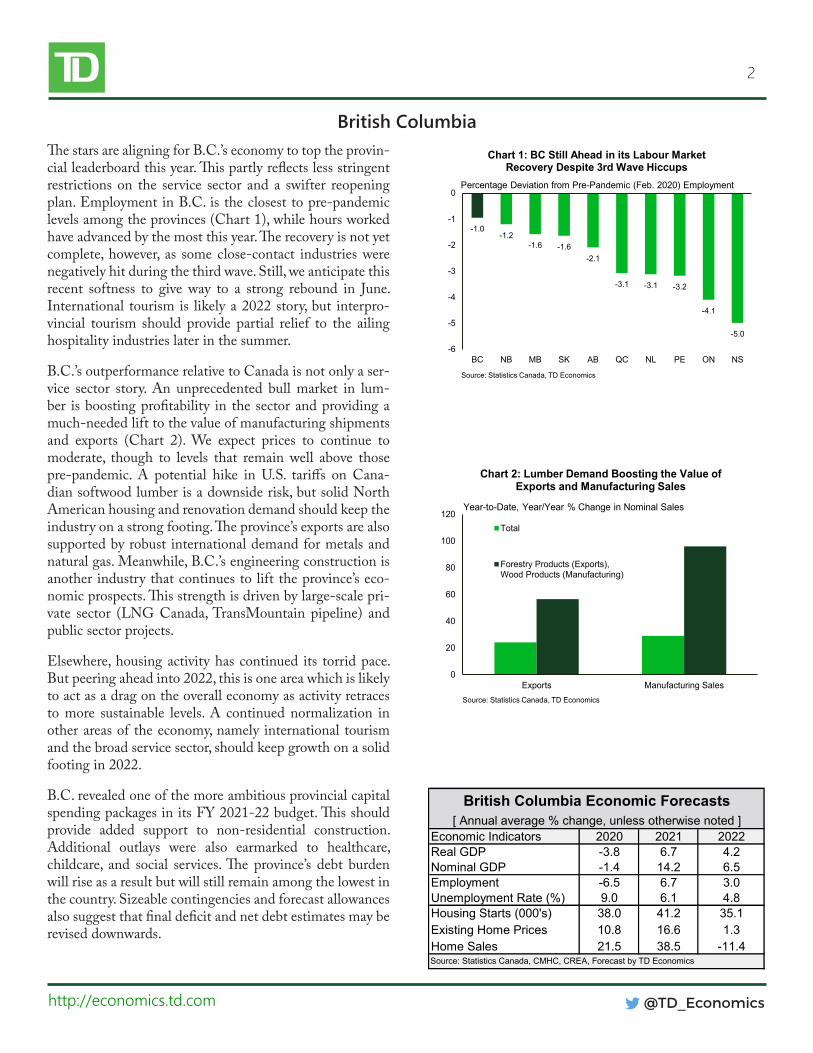
British ColumbiaThe stars are aligning for B.C.’s economy to top the provin-cial leaderboard this year. This partly reflects less stringent restrictions on the service sector and a swifter reopening plan. Employment in B.C. is the closest to pre-pandemic levels among the provinces (Chart 1), while hours worked have advanced by the most this year. The recovery is not yet complete, however, as some close-contact industries were negatively hit during the third wave. Still, we anticipate this recent softness to give way to a strong rebound in June. International tourism is likely a 2022 story, but interpro-vincial tourism should provide partial relief to the ailing hospitality industries later in the summer.
B.C.’s outperformance relative to Canada is not only a ser-vice sector story. An unprecedented bull market in lum-ber is boosting profitability in the sector and providing a much-needed lift to the value of manufacturing shipments and exports (Chart 2). We expect prices to continue to moderate, though to levels that remain well above those pre-pandemic. A potential hike in U.S. tariffs on Cana-dian softwood lumber is a downside risk, but solid North American housing and renovation demand should keep the industry on a strong footing. The province’s exports are also supported by robust international demand for metals and natural gas. Meanwhile, B.C.’s engineering construction is another industry that continues to lift the province’s eco-nomic prospects. This strength is driven by large-scale pri-vate sector (LNG Canada, TransMountain pipeline) and public sector projects.
Elsewhere, housing activity has continued its torrid pace. But peering ahead into 2022, this is one area which is likely to act as a drag on the overall economy as activity retraces to more sustainable levels. A continued normalization in other areas of the economy, namely international tourism and the broad service sector, should keep growth on a solid footing in 2022.
B.C. revealed one of the more ambitious provincial capital spending packages in its FY 2021-22 budget. This should provide added support to non-residential construction. Additional outlays were also earmarked to healthcare, childcare, and social services. The province’s debt burden will rise as a result but will still remain among the lowest in the country. Sizeable contingencies and forecast allowances also suggest that final deficit and net debt estimates may be revised downwards.
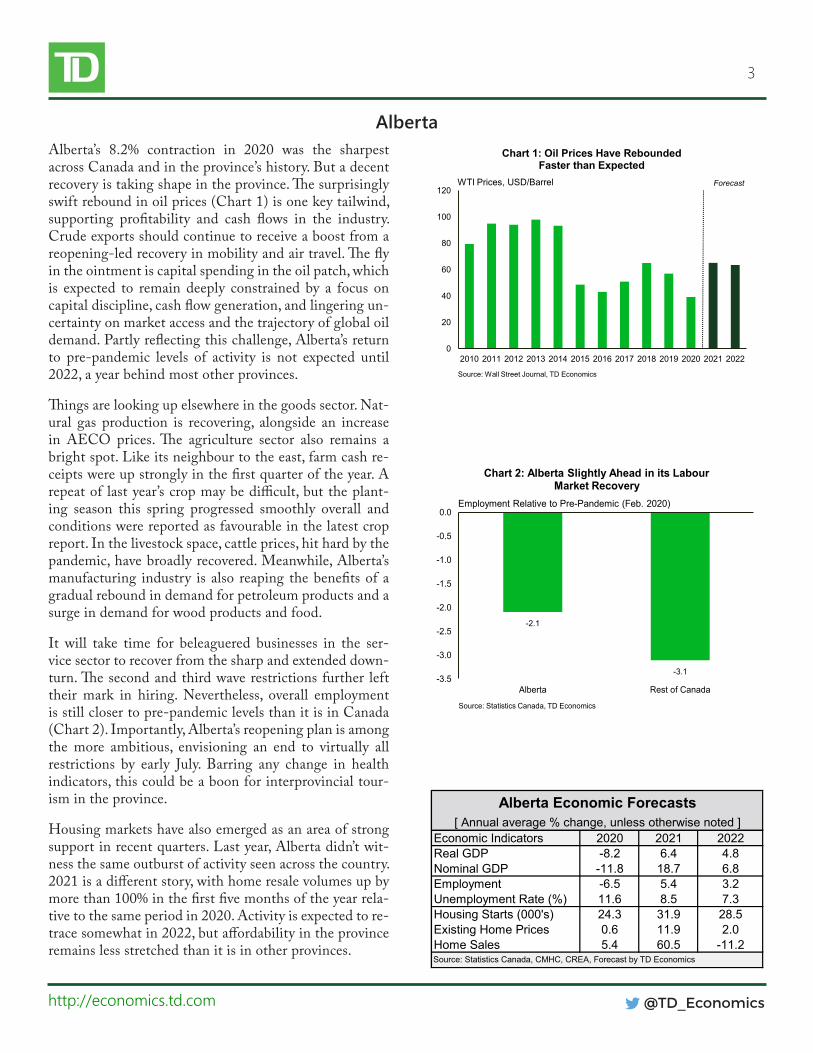
AlbertaAlberta’s 8.2% contraction in 2020 was the sharpest across Canada and in the province’s history. But a decent recovery is taking shape in the province. The surprisingly swift rebound in oil prices (Chart 1) is one key tailwind, supporting profitability and cash flows in the industry. Crude exports should continue to receive a boost from a reopening-led recovery in mobility and air travel. The fly in the ointment is capital spending in the oil patch, which is expected to remain deeply constrained by a focus on capital discipline, cash flow generation, and lingering un-certainty on market access and the trajectory of global oil demand. Partly reflecting this challenge, Alberta’s return to pre-pandemic levels of activity is not expected until 2022, a year behind most other provinces.
Things are looking up elsewhere in the goods sector. Nat-ural gas production is recovering, alongside an increase in AECO prices. The agriculture sector also remains a bright spot. Like its neighbour to the east, farm cash re-ceipts were up strongly in the first quarter of the year. A repeat of last year’s crop may be difficult, but the plant-ing season this spring progressed smoothly overall and conditions were reported as favourable in the latest crop report. In the livestock space, cattle prices, hit hard by the pandemic, have broadly recovered. Meanwhile, Alberta’s manufacturing industry is also reaping the benefits of a gradual rebound in demand for petroleum products and a surge in demand for wood products and food.
It will take time for beleaguered businesses in the ser-vice sector to recover from the sharp and extended down-turn. The second and third wave restrictions further left their mark in hiring. Nevertheless, overall employment is still closer to pre-pandemic levels than it is in Canada (Chart 2). Importantly, Alberta’s reopening plan is among the more ambitious, envisioning an end to virtually all restrictions by early July. Barring any change in health indicators, this could be a boon for interprovincial tour-ism in the province.
Housing markets have also emerged as an area of strong support in recent quarters. Last year, Alberta didn’t wit-ness the same outburst of activity seen across the country. 2021 is a different story, with home resale volumes up by more than 100% in the first five months of the year rela-tive to the same period in 2020. Activity is expected to re-trace somewhat in 2022, but affordability in the province remains less stretched than it is in other provinces.
Chart 1: Oil Prices Have Rebounded Faster than Expected
Source: Wall Street Journal, TD Economics
WTI Prices, USD/Barrel Forecast
#Internal
-2.1
-3.1-3.5
-3.0
-2.5
-2.0
-1.5
-1.0
-0.5
0.0
Alberta Rest of Canada
Chart 2: Alberta Slightly Ahead in its Labour Market Recovery
Source: Statistics Canada, TD Economics
Employment Relative to Pre-Pandemic (Feb. 2020)
4
@TD_Economicshttp://economics.td.com
SaskatchewanThings are looking up for Saskatchewan’s economy. Along-side an earlier reopening, the province’s resource-rich econ-omy is expected to reap the rewards of the recent upcycle in commodity markets. Oil prices have rebounded swiftly. And while investment in the sector will likely remain sub-dued, exports and incomes should benefit from recovering demand. Prospects for other resource industries are also bright. Prices remained elevated for crops in the first half of 2021. In turn, first quarter farm cash receipts were up 24% relative to the same period last year. Crop output remains at the mercy of weather, but conditions were reported as “fair to good” in the most recent government crop report. With international demand for food and crops robust, pot-ash markets have turned the corner after a subdued 2020. Production is already up 11% year-to-date, and prices are gradually rising. The outlook for uranium remains uncer-tain after production was curtailed in response to a global supply glut in the past two years. However, a resumption of production at the Cigar Lake mine (closed due to pandemic risks late last year) in April should lift output in the coming months, in tandem with modestly higher prices.
No provincial economy was spared the impacts of COV-ID-19. Though less impacted than Central Canada’s, Sas-katchewan’s labour market performance has left a lot to be desired. Still, less stringent restrictions in Saskatchewan relative to other provinces resulted in a milder hit to service-sector activity.
Meanwhile, housing markets continue to fire on all cylin-ders (Chart 1). Housing starts have more than doubled so far this year, outperforming most provinces. Like the rest of the country, activity in the resale market continues to rise unabated. In turn, home prices in the province are reversing years of underperformance. With affordability somewhat less stretched, we expect price growth to continue in 2022.
Saskatchewan was one of a few provinces to project an in-crease in its budget deficit in fiscal 2021-22, with new out-lays earmarked to education, healthcare, and social services. A sizeable boost to its infrastructure plan (Chart 2) should prove to be a tailwind for growth. Despite keeping its spend-ing taps open, the Province’s debt burden will remain among the lowest in the country.
Chart 1: Saskatchewan's Housing Markets Turned the Corner After Years of Decline
Unit Sales (LHS)
Starts (RHS)
Source: CREa, CMHC, TD Economics
Thousands Thousdands Forecast
#Internal
0.00.20.40.60.81.01.21.41.61.82.0
Chart 2: Saskatchewan Government Ramping Up its Capital Spending
Source: Saskatchewan Budget 2021-22, TD Economics
Capital Plan, C$ Billions Forecast
5
@TD_Economicshttp://economics.td.com
ManitobaManitoba’s economy turned in a solid first quarter of 2021, with gains recorded in manufacturing shipments, whole-sale and retail spending, employment, home sales and ex-ports. This buffer was needed, as the province’s COVID-19 fortunes took a turn for the worse in April. By mid-May, Manitoba was suffering through the worst outbreak of any province (Chart 1) and the surge prompted the province to tighten restrictions. However, the economy so far appears resilient, as employment was down only slightly in May.
Manitoba’s struggles with the third wave delayed its re-opening plan to the beginning of July, lagging slightly be-hind all other provinces. Still, re-opening should yield ro-bust second half growth in pandemic-sensitive industries. Meanwhile, services industries outside of those directly impacted by the pandemic are likely to post healthy output gains. For example, employment in the finance, insurance and real estate industry is up solidly so far this year, likely garnering support from hot housing market activity. On this front, Manitoba holds an advantage over other prov-inces in that affordability is still decent by historical stan-dards.
In the goods sector, the outlook is more mixed. On the one hand, activity in the province’s large manufacturing sec-tor is off to a great start (Chart 2) – thanks to gains in food, chemical and wood product shipments. Robust U.S. and Canadian demand should power further gains in this sector, despite the headwind coming from input shortag-es. On the other, agricultural seeding intentions point to a drop in production this year and mining output will be further impacted by the shutdown of mining operations in Flin-Flon, which is slated to last through 2022. Elsewhere, non-residential spending should hold down construction output, consistent with soft investment intentions. Oil production also began the year on the back foot, although we expect that rising prices will bring increased production as the year progresses.
The 2021 provincial budget revealed a deficit projection of $1.6 billion for this fiscal year, or 2.0% of GDP, which is on the lower end of provincial tallies. Meanwhile, net debt-to-GDP is projected to peak at 39.9% in FY 2020/21, be-fore dropping to a still-elevated 38.4% by FY 2024/25. The government is also pledging to hold residential rents flat, offer tax relief to households and businesses and freeze childcare fees.
Chart 2: Manufacturing Sector Performing Well in Manitoba
6
@TD_Economicshttp://economics.td.com
OntarioOntario stands out as being one of the only provinces whose 2021 growth forecast has been downgraded relative to the prior round. This is largely a function of two devel-opments. First, the province’s 3rd wave during April and May was extremely harsh, causing the province to tighten what were already very severe restrictions. These measures made their mark on the economy’s near-term performance, as employment declined 2.5% from March to May (Chart 1). Secondly, production distortions in the auto sector ow-ing to semi-conductor shortages are worse than previously assumed, and global supply chain disruptions are weighing on manufacturing elsewhere. Together, these shocks should heavily impact this year’s growth.
Despite the downgrade, we still expect a solid rebound in 2021 overall. This is partly due to the impressive hand-off from rebounding activity heading into this year. Also, growth is likely to soon rev up again as the province’s go-slow ap-proach to re-opening pushes activity into the second half. On this front, Ontario anticipates hitting “Stage 3” of its plan in late July (contingent on rising vaccination rates and other favourable health indicators). At that point, restric-tions on impacted businesses like retailers and restaurants would be much looser. In addition, we expect auto produc-tion to rebound in the third quarter after a subdued first half (Chart 2). And, other manufacturing industries should con-tinue benefitting from a strong U.S. recovery. Finally, current spending by the provincial government will likely offer near-term support, although projections contained in Ontario’s latest budget suggest that the fiscal impulse could shift to a moderate drag beginning in 2022. Still, public capital invest-ment is projected to increase both this year and next.
While some industries are poised to see healthy second half growth, others should see some cooling. For instance, growth in Ontario’s large finance, insurance and real estate industry should ease as housing markets likely come off the boil. On this score, home sales tumbled nearly 25% from March to May. And, activity is likely to trend even lower moving forward, impacted by newly tightened mortgage stress test rules. We also expect housing starts and pace of home renovations to unwind from their stratospheric levels as high lumber prices eat into builder margins. However, ro-bust permit issuance points to solid near-term activity.
Source: Statistics Canada, CMHC, CREA, Forecast by TD Economics
-2.5
-0.8
-3.0
-2.5
-2.0
-1.5
-1.0
-0.5
0.0
Ontario Rest of CanadaSource: Statistics Canada, TD Economics
March to May % Change in Employment
Chart 1: Restrictions Play Havoc With Ontario's Jobs Market
0
100
200
300
400
500
600
2019Q1 2019Q3 2020Q1 2020Q3 2021Q1 2021Q3
Source: Haver Analytics, TD Economics
Canadian Auto Production, Units, Thousands
Chart 2: Auto Production Likely to Have a Better Second Half
Forecast
7
@TD_Economicshttp://economics.td.com
QuébecThings are looking up for La belle province. Quebec’s 3rd wave was noticeably less severe than what took place in other large provinces. This allowed non-essential retailers across much of the province to remain open, albeit with ca-pacity restraints and a curfew. As such, Quebec’s employ-ment managed to hold relatively steady in both April and May, in sharp contrast to hefty declines in several other regions during the two-month period. And, this resilience in hiring came on the heels of a blockbuster first quarter output performance, with quarterly annualized economic growth tracking a 7% annualized gain (Chart 1).
Quebec’s reopening plan sees a progression of most re-gions to the loosest “Green” restrictions level by late-June. Accordingly, we anticipate robust growth taking place through the summer months, as consumers open their wallets for goods and services in sectors that were previ-ously either shuttered or under strict capacity constraints. Despite retail activity hitting a temporary snag in the first quarter, we anticipate strong consumption growth moving forward, supported by elevated confidence levels, improv-ing job markets, and a mountain of household savings on which to draw.
Residential construction has remained a major growth contributor (Chart 2). While single-detached starts have sprinted ahead, the real boost has come from apartment units, particularly purpose-built rentals. Record permit is-suance points to further near-term strength in residential construction. However, we anticipate some easing thereaf-ter, particularly next year, as cooling housing demand, el-evated material input costs and rising interest rates cause homebuilding to retreat from its record pace to more de-mographically supported levels.
Government spending has been another pillar boosting Quebec’s economic recovery, and more support appears to be in the cards. The Province’s latest budget anticipates solid gains in program spending over the next few fiscal years. This will complement Quebec’s infrastructure pro-gram, which sees spending levels rising quickly through FY 2023/24.
The provincial government expects a gradual return to sur-plus by 2025/26. This will keep debt-to-GDP on a down-ward trend after it hit 45.0% in FY 2020/21. This is not a bad result at all as its below levels seen as recently as FY 2015/16.
New Brunswick Economic Forecasts[ Annual average % change, unless otherwise noted ]
Source: Statistics Canada, CMHC, CREA, Forecast by TD Economics
The economic fallout from the pandemic has been less se-vere in New Brunswick than in most other regions, includ-ing during the most recent third wave. This was reflected in a milder infection curve, with cases per capita consistently among the lowest in the country. Accordingly, restrictions were less stringent, leaving some breathing room for the service sector.
As a result, New Brunswick’s labour markets are closer to pre-pandemic levels than they are in most other prov-inces (Chart 1). Public sector hiring has played a key role. Nonetheless, resilience is evident across the private sector and notably in the close-contact services industries. For instance, employment in retail and wholesale trade is back above pre-pandemic levels. Employment in the hospitality industry is also remarkably close to pre-pandemic levels. New Brunswick’s “Path to Green” reopening plan should pave the way for a further ramp up in hiring this summer.
The goods sector is rising to the occasion this year. Ex-ports and manufacturing sales are advancing at the fast-est pace in the country (Chart 2). This solid recovery was aided by rising demand for two key commodities: forestry and petroleum products. Lumber markets have been firing on all cylinders, with demand outpacing supply and prices hitting record highs. Although prices have recently pulled back from their peak, continued robust housing demand in North America and a lagging supply response will likely keep prices above pre-pandemic levels. Meanwhile, petro-leum demand should continue to receive support from the reopening of state and provincial economies. With the U.S. economy on track to rebound strongly, New Brunswick’s outsized exposure to its markets bodes well for exports.
Construction is another bright spot for New Brunswick in 2021. Capital expenditures are set to advance at a solid 10% clip this year, lifting prospects for non-residential and engineering construction. Homebuilding activity is on track to eke out a modest gain on the year.
A milder exposure to the impacts of the virus has left New Brunswick with a comparatively less need for fiscal stimu-lus. As a result, New Brunswick was among the few ex-pecting a decline in its debt burden this year in its 2021-22 budget, reaffirming the Province’s previous focus on fiscal discipline.
Chart 1: Brunswick's Labour Market Recovery Ahead of Canada's
New Brunswick
Rest of Canada
Source: Statistics Canada, TD Economics
Employment Index, February 2020 = 100
#Internal
-10
-5
0
5
10
15
20
25
30
35
40
NB BC NS AB SK QC ON PE MB NL
Chart 2: A Strong Recovery in the Value of New Brunwick's Exports
Source: Statistics Canada, TD Economics
Exports, Year-to-Date, Year/Year % Change
9
@TD_Economicshttp://economics.td.com
Nova ScotiaNova Scotia suffered through a severe 3rd wave in late April and May. During this time, the peak in per capita new cas-es was about five times as high as that seen during the 1st wave. The provincial government acted swiftly in response by enacting restrictions even more severe than in the 1st wave (Chart 1). As a result, growth was heavily impacted, evidenced by the steep 4.8% m/m decline in employment in May – the largest drop since April of last year.
The silver lining is that the province’s 3rd wave, while steep, was short in duration. Dwindling new cases allowed the gov-ernment to roll out its staged reopening plan in early June and with it, we expect a significant boost to output in the impacted industries in the second half of this year. We also note that Nova Scotia’s economy had significant momentum heading into the latest wave. Indeed, while the mix of em-ployment has changed, the province had recouped 99.8% of pandemic-related net job losses as of April.
The province’s goods-producing sector is likely to record healthy growth this year. Manufacturing is performing well, led by the wood products industry that has benefitted from robust North American homebuilding activity. We look for this factory strength to continue, given expectations of solid growth in the U.S. and the rest of Canada as well as on-going shipbuilding work at the Irving Shipyard. However, contin-ued near-term raw materials shortages due to the pandemic will remain a challenge for the sector.
The construction industry should also enjoy a busy year in 2021, backed by gains in homebuilding and government investment. On the former front, year-to-date residential spending was up nearly 25% from its 2020 level. In addition, housing starts are trending at a near-record level, boosted by work on rental units. And, with rental vacancy rates relatively low, rents generally on the rise, and population growth likely to pick up (Chart 2), we expect further growth.
The government’s capital spending plan envisions a sharp rise in infrastructure spending this fiscal year, supported by highway improvements, education expenditures and health-care investments. These expenditures, which may help en-hance longer-term productivity, are also expected to drive the province’s debt burden. As such, the province’s debt-to-GDP ratio is forecast to climb 2.2 ppts to 40.1% by FY 2024/25, despite a projected return to budget balance.
Source: Bank of Canada, TD Economics. Last observation: June 9, 2021.
COVID-19 Stringency Index
Chart 1: Severe Third Wave Forced Nova Scotia Into a Lockdown
0.6
0.7
0.8
0.9
1.0
1.1
1.2
1.3
1.4
1.5
Jan-18 Jun-18 Nov-18 Apr-19 Sep-19 Feb-20 Jul-20 Dec-20 May-21*15 Years and Over. Seasonally Adjusted. Source: Statistics Canada, TD Economics
Nova Scotia Population, Year/Year % Change*
Chart 2: Nova Scotia's Population Growth Showing Some Small Signs of Life
10
@TD_Economicshttp://economics.td.com
Prince Edward IslandPEI’s success is keeping COVID-19 case counts low has enabled the loosest restrictions in the country through much of the pandemic (Chart 1) and sets up for impressive growth this year. The Island’s relatively large retail industry bears this out, as sales were already 20% above last year’s levels in the first quarter of 2021, and high frequency data points to this momentum being sustained in the second quarter. Even PEI’s outsized accommodation and food services industry is showing some modest signs of life de-spite the brutal impact of the pandemic on tourism.
On the tourism front, PEI’s reopening plan envisions trav-el being permitted from other Atlantic Provinces by June 23rd. In addition, the Island hopes to have 80% of its 12+ population vaccinated with a second dose by September, paving the way for full reopening across most industries. However, the fact that most sectors are already open to some degree should lessen the growth boost.
In PEI’s important agricultural sector, crop seeding inten-tions point to increased planting and output in 2021, after the steep 9.0% contraction recorded in 2020. This should help satisfy the increase in demand for PEI’s food products that should come as restaurants re-open in the U.S. and Canada. On this front, we note that agricultural exports are up 11% so far in 2021 compared to last year’s level.
Government spending should also support growth this year, with provincial program expenditures expected to ex-pand by 4.0% in FY 2021/22, driven by healthcare outlays (Chart 2). This is very important for PEI’s growth, as the public sector (i.e. healthcare, education and public admin-istration), accounts for nearly one-third of total output. Meanwhile, Charlottetown has decided to double its capi-tal budget for this year, offering further support to growth. However, the story shifts in 2022, as provincial capital in-vestment is projected to drop while spending growth slows.
Manufacturing is off to a slow start. However, a likely in-crease in agricultural production alongside robust demand growth in the rest of Canada and the U.S. suggests that a turnaround is in store for the remainder of 2021. We also anticipate that these positive forces will offset the impacts of a sharply appreciated dollar.
Chart 2: PEI's Large Government Sector to Support Growth This Year
Source: Federal Department of Finance, PEI 2021 Budget, TD Economics
Total Program Expenditures (Mil.C$)
11
@TD_Economicshttp://economics.td.com
Newfoundland & LabradorNewfoundland & Labrador’s economy has come a long way from the pandemic-induced slump in the spring of last year. Short-lived restrictions left the province’s service sector on a better footing compared to other regions. The prov-ince’s recently-released reopening plan should support hir-ing further in the coming months. Interprovincial tourism prospects have improved, with fully vaccinated Canadians permitted to visit the province without quarantine require-ments by early July.
Elsewhere, housing markets have turned the corner. Indeed, starts are expected to advance at a blitsering 110% pace this year (Chart 1). Activity in the resale market has also been brisk. Aided by favourable affordability relative to other provinces, prices likely have more room to run in 2022.
Soaring commodity prices are another bright spot. Iron ore was among the suite of commodities registering record high prices this year. Coupled with an expected increase in pro-duction, this should help propel the value of the province’s exports this year. A faster-than-expected bounce back in Brent prices will also support bottom lines for oil producers and the government.
Notwithstanding these strengths, we remain cautious on the province’s recovery and growth trajectory, which are expect-ed to be more drawn out relative to other provinces. Oil pro-duction is taking a leg down this year. Meanwhile, activity remains halted at the Come by Chance refinery, capping the recovery in manufacturing sales. Capital expenditures are a lingering weak spot (Chart 2). A ramp down in the Musk-rat falls project is one key headwind. Prospects for spending were weakened further following the halt to the West White Rose expansion project last year.
Newfoundland & Labrador continues to face a challenging demographic backdrop, having not benefitted from the same immigration outburst seen in its Atlantic Canada peers pri-or to the pandemic. This backdrop was made more difficult by COVID-19. Despite these headwinds, the provincial government’s 2021 budget managed to surpass expectations. A downshift in its debt burden is anticipated on the back of spending restraint and the improving oil price backdrop. However, government finances will continue to cast a shad-ow on the economy in the medium term as the province struggles with an aging population and reliance on volatile resource revenues.
British Columbia -3.8 6.7 4.2 -1.4 14.2 6.5 -6.5 6.7 3.0 9.0 6.1 4.8 38.0 41.2 35.1 10.8 16.6 1.3
Source: CREA, CMHC, Statistics Canada, TD Economics. Forecasts by TD Economics as at June 2021.
Provincial Economic ForecastsReal GDP(% Chg.)
Nominal GDP(% Chg.)
Employment(% Chg.)
Unemployment Rate (average, %)
Housing Starts(Thousands)
Home Prices(% Chg.)Provinces
DisclaimerThis report is provided by TD Economics. It is for informational and educational purposes only as of the date of writing, and may not be appropriate for other purposes. The views and opinions expressed may change at any time based on market or other conditions and may not come to pass. This material is not intended to be relied upon as investment advice or recommendations, does not constitute a solicitation to buy or sell securities and should not be considered specific legal, investment or tax advice. The report does not provide material information about the business and affairs of TD Bank Group and the members of TD Economics are not spokespersons for TD Bank Group with respect to its business and affairs. The information contained in this report has been drawn from sources believed to be reliable, but is not guaranteed to be accurate or complete. This report contains economic analysis and views, including about future economic and financial markets performance. These are based on certain assumptions and other factors, and are subject to inherent risks and uncertainties. The actual outcome may be materially different. The Toronto-Dominion Bank and its affiliates and related entities that comprise the TD Bank Group are not liable for any errors or omissions in the information, analysis or views contained in this report, or for any loss or damage suffered.