140
LAGOS STATE GOVERNMENT BASELINE ASSESSMENT OF OLUBORI-ODUN IFA, IDI-ARABA AND MOSAFEJO COMMUNITIES IN Kosofe Local Government Areas Of Lagos State December 2015

LAGOS STATE GOVERNMENT
BASELINE ASSESSMENT
OF
OLUBORI-ODUN IFA, IDI-ARABA AND
MOSAFEJO COMMUNITIES
IN
Kosofe Local Government Areas Of
Lagos State
December 2015

Table of Contents Table of Charts ................................................................................................................................................................... i
Table of Figures ............................................................................................................................................................... iii
PREFACE ............................................................................................................................................................................iv
INTRODUCTION .................................................................................................................................................................vi
OBJECTIVES: .................................................................................................................................................................... viii
SCOPE and COVERAGE ...................................................................................................................................................... ix
METHODOLOGY ................................................................................................................................................................ ix
SAMPLING METHODOLOGY ............................................................................................................................................. ix
TRAINING .......................................................................................................................................................................... x
FIELD WORK .................................................................................................................................................................... xiii
DEMOGRAPHY ............................................................................................................................................................... 1
AGE OF RESPONDENTS ..................................................................................................................................................... 1
MARITAL STATUS OF RESPONDENTS ............................................................................................................................... 2
OCCUPATIONAL STATUS OF RESPONDENTS .................................................................................................................... 2
AVERAGE HOUSEHOLD SIZE ............................................................................................................................................. 3
COMPOUND DENSITY ....................................................................................................................................................... 4
HIGHEST LEVEL OF EDUCATION ATTAINED ...................................................................................................................... 5
ENVIRONMENT .............................................................................................................................................................. 6
DRAINAGE SERVICE ........................................................................................................................................................... 6 AVAILABILITY OF DRAINS/ GUTTERS ON THE STREET ................................................................................................. 6 TYPE OF DRAINAGE FACILITY ....................................................................................................................................... 7 CLEANING OF THE DRAINAGE SYSTEM ........................................................................................................................ 8 PERSONNEL RESPONSIBLE FOR CLEANING THE DRAINAGE SYSTEM .......................................................................... 9
TOILET ............................................................................................................................................................................. 10 MAIN TYPE OF TOILET FACILITY AVAILABLE TO HOUSEHOLD ................................................................................... 10
WATER ............................................................................................................................................................................ 11 MAIN SOURCE OF WATER .......................................................................................................................................... 11 MAIN SOURCE OF POTABLE WATER .......................................................................................................................... 12 TREATMENT OF PRIMARY SOURCE OF WATER TO MAKE IT SAFE FOR DRINKING ................................................... 13
WASTE DISPOSAL ............................................................................................................................................................ 14 METHODS OF WASTE DISPOSAL ................................................................................................................................ 14
HEALTH ........................................................................................................................................................................ 15
ANTENATAL CHECK-UPS ................................................................................................................................................. 15

TETANUS TOXOID IMMUNIZATION (TTI) ....................................................................................................................... 16
REASONS FOR THE FAILURE OF TETANUS TOXOID IMMUNIZATION (TTI) .................................................................... 17
LAST CHILD BORN IN A HEALTH FACILITY ....................................................................................................................... 18
HEALTH FACILITY WHERE CHILD WAS BORN ................................................................................................................. 18
ASSISTANT USED WITH THE DELIVERY ........................................................................................................................... 19
REASON FOR NOT DELIVERING IN A HEALTH FACILITY .................................................................................................. 20
HOUSEHOLD WITH NEWBORN BABY ............................................................................................................................. 21
RESPONDENT CURRENTLY BREAST FEEDING BABY ....................................................................................................... 22
AWARENESS OF EXCLUSIVE BREAST FEEDING OF CHILDREN ........................................................................................ 23
DURATION OF EXCLUSIVE BREAST FEEDING .................................................................................................................. 23
PREGNANCY IN THE LAST FIVE YEARS ............................................................................................................................ 24
PLACE OF DELIVERY ........................................................................................................................................................ 25
PROPORTION OF PERSONNEL WHO PROVIDED ASSISTANCE DURING DELIVERY ......................................................... 26
HOUSEHOLD WITH UNDER 5 YEAR OLD CHILDREN ....................................................................................................... 27
REGISTERED UNDER 5 CHILDREN BY COMMUNITIES .................................................................................................... 28
CHILDREN WITH DOCUMENTARY EVIDENCE OF REGISTERED BIRTH ............................................................................ 29
CHILDREN WITH DOCUMENTARY EVIDENCE (BIRTH CERTIFICATE) FROM OTHER SOURCE(S) ..................................... 30
OTHER SOURCES OF DOCUMENTARY EVIDENCE OF REGISTERED BIRTH ...................................................................... 30
CHILDREN WITH IMMUNIZATION CARD OR A CHILD HEALTH HANDBOOK .................................................................. 31
CHILDREN THAT RECEIVED BCG VACCINE ...................................................................................................................... 32
CHILDREN THAT RECEIVED MEASLES VACCINATION (at 9 Months) .............................................................................. 33
CHILDREN THAT RECEIVED VITAMIN A AT 6 MONTHS .................................................................................................. 34
CHILDREN THAT RECEIVED VITAMIN A SECOND DOSE AT EXACTLY 1 YEAR ................................................................. 34
CHILDREN GIVEN DPT 1 VACCINE AT 6 WEEKS .............................................................................................................. 35
CHILDREN THAT RECEIVED DPT 2 VACCINE AT 10 WEEKS ............................................................................................. 36
CHILDREN THAT RECEIVED DPT 3 VACCINEAT 14 WEEKS .............................................................................................. 36
CHILDREN THAT RECEIVED OPV 0 AT BIRTH OR TWO (2) WEEKS AFTER BIRTH ........................................................... 37
CHILDREN THAT RECEIVED OPV 1 AT 6 WEEKS .............................................................................................................. 38
CHILDREN THAT RECEIVED OPV 2 AT 10 WEEKS AFTER BIRTH ...................................................................................... 39
CHILDREN THAT RECEIVED OPV 3 AT 14 WEEKS AFTER BIRTH ...................................................................................... 40
IMMNUNIZATION STATUS OF CHILDREN ....................................................................................................................... 40
CHILDREN FULLY IMMUNIZED BEFORE ONE YEAR ........................................................................................................ 41

REASONS FOR CHILDREN NOT FULLY IMMUNIZED BEFORE ONE YEAR OF AGE ........................................................... 42
CHILDREN WHO EXPERIENCED ANY ILLNESS IN THE HOUSEHOLD IN THE LAST THREE MONTHS ................................ 44
NATURE OF ILLNESS EXPERIENCED BY CHILDREN IN THE LAST THREE MONTHS .......................................................... 45
FACILITIES WHERE HOUSEHOLD GO TO TREAT CHILDREN WITH MALARIA, COUGH, PNEUMONIA AND DIARRHEA .. 47
WAYS TO PREVENT AND CONTROL MALARIA ............................................................................................................... 48
HOUSEHOLDS WHO HAVE INSECTICIDE TREATED NETS ................................................................................................ 49
HOW HOUSEHOLDS OBTAINED INSECTICIDE TREATED NETS ........................................................................................ 50
PERIOD WHEN HOUSEHOLD OBTAINED TREATED NETS ............................................................................................... 51
PERIOD WHEN HOUSEHOLD OBTAINED TREATED NETS GIVEN FREELY BY GOVERNMENT ......................................... 52
PERIOD WHEN HOUSEHOLD OBTAINED TREATED NETS GIVEN FREELY BY NON GOVERNMENTAL ORGANISATIONS (NGOs) ............................................................................................................................................................................. 54
RESPONDENTS WHO SLEPT IN THE NET LAST NIGHT ..................................................................................................... 55
HOUSEHOLD AWARENESS OF GOVERNMENT FREE PROVISION OF INSECTICIDE TREATED MOSQUITO NETS ............ 56
RESPONDENTS WHO BENEFITTED FROM THE FREE INSECTICIDE TREATED MOSQUITO NETS ..................................... 57
HOUSEHOLD MEMBERS WHO RECEIVED ANTI-MALARIA DRUGS FOR PREVENTION OF MALARIA AT THEIR LAST OR INDEX PREGNANCY ......................................................................................................................................................... 58
DOSES OF ANTI-MALARIA DRUGS RECEIVED BY HOUSEHOLDS AT THEIR LAST OR INDEX PREGNANCY ..................... 59
HOUSEHOLD MEMBERS WHO SUFFERED FROM MALARIA FEVER IN THE LAST 12 MONTHS ...................................... 60
NUMBER OF RESPONDENTS WHO SUFFERED FROM MALARIA FEVER IN THE LAST 12 MONTHS ............................... 61
SIGNS AND SYMPTOMS OF MALARIA ............................................................................................................................ 62
PLACE WHERE RESPONDENTS WENT FIRST FOR TREATMENT WHEN THEY SUSPECTED MALARIA ............................. 63
HOUSEHOLDS WHO UNDERGO MALARIA TEST BEFORE COMMENCEMENT OF TREATMENT ...................................... 64
TYPES OF DRUG USED FOR TREATMENT OF MALARIA FOR ADULT .............................................................................. 65
COMMUNITY WITH PUBLIC HEALTH CENTRE................................................................................................................. 66
DISTANCE OF PUBLIC HEALTH FACILITY TO DWELLING ................................................................................................. 67
PREFERENCE FOR HEALTH CARE CENTRE IN THE COMMUNITY ................................................................................... 68
WHERE HOUSEHOLD'S MEMBER SEEK HEALTH CARE ................................................................................................... 69
PATRONAGE OF PUBLIC HOSPITAL/ HEALTH CENTRE IN THE LAST ONE YEAR ............................................................. 70
REASONS FOR NOT PATRONISING PUBLIC HOSPITAL/ HEALTH CENTRE ...................................................................... 70
HOUSEHOLD'S EXPENDITURE ON HEALTH CARE ........................................................................................................... 71
AWARENESS OF NATIONAL HEALTH INSURANCE SCHEME IN KOSOFE ......................................................................... 72
HOUSEHOLD'S MEMBER THAT REGISTERED FOR NATIONAL INSURANCE SCHEME IN KOSOFE ................................... 73

WILLINGNESS TO PRE-PAY A DEFINED HEALTH CARE PACKAGE FOR PARENTS AND FOUR CHILDREN LESS THAN 18 YEARS OF AGE ................................................................................................................................................................. 74
AMOUNT HOUSEHOLD’S MEMBER WILLING TO PAY FOR HEALTHCARE PACKAGE IN THE NEXT ONE YEAR .............. 75
THE LAST TIME HOUSEHOLD MEMBER VISITED PUBLIC HOSPITAL/ HEALTH CENTRE.................................................. 76
SATISFACTION WITH GOVERNMENT HEALTH CENTRE/HOSPITAL ................................................................................ 77
HOUSEHOLD HEALTH CARE COST COVERED BY INSURANCE ......................................................................................... 77
REASON(S) FOR CHOICE OF "PUBLIC HOSPITAL/ HEALTH CENTRE" .............................................................................. 78
REASON(S) FOR CHOICE OF "PRIVATE HOSPITAL/ CLINIC" .......................................................................................... 80
REASON(S) FOR CHOICE OF "PRIVATE PHYSICIAN" ...................................................................................................... 82
REASON(S) FOR CHOICE OF "TRADITIONAL HERBAL CLINIC" ........................................................................................ 84
REASON(S) FOR CHOICE OF "FAITH BASED/ SPIRITUAL HOME" ................................................................................... 86
REASON(S) FOR CHOICE OF "PHARMACY/ CHEMIST SHOP" ......................................................................................... 88
GOVERNMENT HOSPITAL/ HEALTH CENTRE RATING ON "PROVISION OF DRUGS" ..................................................... 90
GOVERNMENT HOSPITAL/ HEALTH CENTRE RATING ON "MEDICAL EQUIPMENT" ..................................................... 91
GOVERNMENT HOSPITAL/ HEALTH CENTRE RATING ON "QUALITY OF MEDICAL PERSONNEL" ................................. 92
GOVERNMENT HOSPITAL/ HEALTH CENTRE RATING ON "WAITING TIME" ................................................................. 93
GOVERNMENT HOSPITAL/ HEALTH CENTRE RATING ON "INFRASTRUCTURE (BUILDING, WATER, ELECTRICITY ETC.)" ......................................................................................................................................................................................... 94
GOVERNMENT HOSPITAL/ HEALTH CENTRE RATING ON "ATTITUDE OF MEDICAL PERSONNEL TOWARDS PATIENTS" ......................................................................................................................................................................................... 95
GOVERNMENT HOSPITAL/ HEALTH CENTRE RATING ON "COST OF DRUGS/ MEDICAL TEST" ..................................... 96
GOVERNMENT HOSPITAL/ HEALTH CENTRE RATING ON "QUALITY OF SERVICE" ........................................................ 97
PROBLEMS FACED IN THE MOST RECENT VISIT TO GOVERNMENT HEALTH FACILITY .................................................. 98
RATING OF QUALITY OF HEALTH CARE SERVICES AT GOVERNMENT HOSPITALS OR CLINICS .................................... 101
SUMMARY OF INDICATORS ....................................................................................................................................... 103

i
Table of Charts Chart 1: Total Number of Households Enumerated and Interviewed by Communities .................................... viii Chart 2: Response Rate by Communities and Ward ............................................................................................. x Chart 3: AGE OF RESPONDENT ............................................................................................................................. 1 Chart 4: MARITAL STATUS OF RESPONDENT ........................................................................................................ 2 Chart 5: OCCUPATIONAL STATUS OF RESPONDENTS ........................................................................................... 3 Chart 6: AVERAGE HOUSEHOLD SIZE .................................................................................................................... 4 Chart 7: COMPOUND DENSITY .............................................................................................................................. 4 Chart 8: HIGHEST LEVEL OF EDUCATION ATTAINED ............................................................................................ 5 Chart 9: AVAILABILITY OF DRAINS/GUTTER ON THE STREET ................................................................................ 6 Chart 10: AVAILABILITY OF DRAINS/GUTTER ON THE STREET .............................................................................. 7 Chart 11: CLEANING OF THE DRAINAGE SYSTEM ................................................................................................. 8 Chart 12: PERSONNEL RESPONSIBLE FOR CLEANING THE DRAINAGE SYSTEM .................................................... 9 Chart 13: MAIN TYPE OF TOILET FACILITY AVAILABLE TO HOUSEHOLD ............................................................ 10 Chart 14: MAIN SOURCE OF WATER ................................................................................................................... 11 Chart 15: MAIN SOURCE DRINKABLE WATER .................................................................................................... 12 Chart 16: TREATMENT OF PRIMARY SOURCE OF WATER TO MAKE IT SAFE FOR DRINKING ............................. 13 Chart 17: METHODS OF WASTE DISPOSAL ......................................................................................................... 14 Chart 18: ANTENATAL CHECKUPS (ANC) ............................................................................................................. 15 Chart 19: TETANUS TOXOID IMMUNIZATION (TTI) ............................................................................................. 16 Chart 20: REASONS FOR THE FAILURE OF TETANUS TOXOID IMMUNIZATION (TTI) .......................................... 17 Chart 21: LAST CHILD BORN IN A HEALTH FACILITY ............................................................................................ 18 Chart 22: HEALTH FACILITY WHERE CHILD WAS BORN ...................................................................................... 19 Chart 23: ASSISTANT USED WITH THE DELIVERY ................................................................................................ 20 Chart 24: REASON FOR NOT DELIVERING IN A HEALTH FACILITY ....................................................................... 21 Chart 25: HOUSEHOLD WITH NEWBORN BABY .................................................................................................. 22 Chart 26: RESPONDENT CURRENTLY BREAST FEEDING BABY ............................................................................. 22 Chart 27: AWARENESS OF EXCLUSIVE BREAST FEEDING OF CHILDREN ............................................................. 23 Chart 28: DURATION OF EXCLUSIVELY BREAST FEEDING ................................................................................... 24 Chart 29: PREGNANT WOMEN IN THE LAST FIVE YEARS .................................................................................... 25 Chart 30: PLACE OF DELIVERY ............................................................................................................................. 26 Chart 31: PROPRTION OF PERSONNEL WHO PROVIDED ASSISTANT DURING DELIVERY .................................. 27 Chart 32: HOUSEHOLD WITH UNDER 5 YEARS OLD CHILDREN .......................................................................... 28 Chart 33: REGISTERED UNDER 5 CHILDREN BY COMMUNITIES .......................................................................... 29 Chart 34: CHILDREN WITH DOCUMENTARY EVIDENCE OF REGISTERED BIRTH CERTIFICATE ............................ 29 Chart 35: PROPORTION OF CHILDREN WITH DOCUMENTARY EVIDENCE (BIRTH CERTIFICATE) FROM OTHER SOURCE ............................................................................................................................................................... 30 Chart 36: TYPES OF OTHER SOURCES OF DOCUMENTARY EVIDENCE OF BIRTH REGISTERATION ..................... 31 Chart 37: CHILDREN WITH IMMUNIZATION CARD OR A CHILD HEALTH HANDBOOK ........................................ 32 Chart 38: CHILDREN THAT RECEIVED BCG VACCINE ........................................................................................... 33 Chart 39: CHILDREN THAT RECEIVED INJECTION TO PREVENT MEASLES AT EXACTLY NINE MONTHS .............. 33 Chart 40: CHILDREN WHO RECEIVED VITAMIN A AT 6 MONTHS ....................................................................... 34

ii
Chart 41: CHILDREN THAT RECEIVED VITAMIN A SECOND DOSE AT EXACTLY 1 YEAR ....................................... 35 Chart 42: CHILDREN GIVEN DPT 1 VACCINE AT 6 WEEKS ................................................................................... 35 Chart 43: CHILDREN WHO RECEIVED DPT 2 VACCINE AT 10 WEEKS .................................................................. 36 Chart 44: CHILDREN THAT RECEIVED DPT 3 VACCINE AT 14 WEEKS ................................................................. 37 Chart 45: CHILDREN THAT RECEIVED OPV 0 AT BIRTH OR TWO (2) WEEKS AFTER BIRTH ................................. 38 Chart 46: CHILDREN THAT RECEIVED OPV 1 AT 6 WEEKS ................................................................................... 39 Chart 47: CHILDREN THAT RECEIVED OPV 2 AT 10 WEEKS AFTER BIRTH ........................................................... 39 Chart 48: CHILDREN THAT RECEIVED OPV 3 AT 14 WEEKS AFTER BIRTH ........................................................... 40 Chart 49: IMMNUNIZATION STATUS OF CHILDREN ............................................................................................ 41 Chart 50: CHILDREN FULLY IMMUNIZED BEFORE ONE YEAR .............................................................................. 42 Chart 51: REASONS FOR CHILDREN NOT FULLY IMMUNIZED BEFORE ONE YEAR OF AGE ................................. 44 Chart 52: PROPORTION OF CHILDREN WHO EXPERIENCE ANY ILLNESS IN THE HOUSEHOLD IN THE LAST THREE MONTHS .............................................................................................................................................................. 45 Chart 53: NATURE OF ILLNESS EXPERIENCED BY CHILDREN IN THE LAST THREE MONTHS ............................... 46 Chart 54: PLACES WHERE HOUSEHOLD GO TO TREAT CHILDREN WITH MALARIA, COUGH, PNEUMONIA AND DIARRHEA ............................................................................................................................................................ 48 Chart 55: WAYS TO PREVENT AND CONTROL MALARIA ..................................................................................... 49 Chart 56: PERCENTAGE DISTRIBUTION OF HOUSEHOLDS WHO HAVE INSECTICIDE TREATED NETS ................. 50 Chart 57: HOW HOUSEHOLDS GOT OR OBTAINED INSECTICIDE TREATED NETS ............................................... 51 Chart 58: PERIOD WHEN HOUSEHOLD OBTAINED TREATED NETS ..................................................................... 52 Chart 59: WHEN HOUSEHOLD OBTAINED TREATED NETS GIVEN FREELY BY GOVERNMENT ............................ 53 Chart 60: PERIOD WHEN HOUSEHOLD OBTAINED TREATED NETS GIVEN FREELY BY NON GOVERNMENTAL ORGANISATIONS ................................................................................................................................................. 55 Chart 61: HOUSEHOLD WHO SLEPT IN THE NET LAST NIGHT ............................................................................. 56 Chart 62: HOUSEHOLD AWARENESS OF GOVERNMENT FREE PROVISION OF INSECTICIDE TREATED MOSQUITO NETS .................................................................................................................................................................... 57 Chart 63: HOUSEHOLD MEMBERS WHO BENEFITTED FROM THE FREE INSECTICIDE TREATED MOSQUITO NETS ............................................................................................................................................................................ 58 Chart 64: HOUSEHOLD MEMBERS WHO RECEIVED ANTI-MALARIA DRUGS FOR PREVENTION AT THEIR LAST OR INDEX PREGNANCY ........................................................................................................................................ 59 Chart 65: DOSES OF ANTI-MALARIA DRUGS RECEIVED BY HOUSEHOLDS AT THEIR LAST OR INDEX PREGNANCY ............................................................................................................................................................................ 60 Chart 66: HOUSEHOLD MEMBERS WHO SUFFERED FROM MALARIA FEVER IN THE LAST 12 MONTHS ............ 61 Chart 67: NUMBER OF HOUSEHOLD MEMBERS WHO SUFFERED FROM MALARIA FEVER IN THE LAST 12 MONTHS .............................................................................................................................................................. 62 Chart 68: PERCENTAGE DISTRIBUTION OF AWARENESS OF HOUSEHOLD MEMBERS ON SIGNS AND SYMPTOMS OF MALARIA .................................................................................................................................... 63 Chart 69: PLACES WHERE HOUSEHOLD MEMBERS WENT FIRST FOR TREATMENT WHEN THEY SUSPECTED MALARIA ............................................................................................................................................................. 64 Chart 70: HOUSEHOLDS WHO UNDERGO MALARIA TEST BEFORE COMMENCEMENT OF TREATMENT ........... 65 Chart 71: TYPES OF DRUG USED FOR THE TREATMENT OF MALARIA FOR ADULT ............................................. 66 Chart 72: COMMUNITY WITH PUBLIC HEALTH CENTRE ..................................................................................... 67

iii
Chart 73: DISTANCE OF PUBLIC HEALTH FACILITY TO DWELLING ...................................................................... 68 Chart 74: PREFERENCE FOR HEALTH CARE CENTRE IN THE COMMUNITY......................................................... 68 Chart 75: WHERE HOUSEHOLD'S MEMBER SEEK HEALTH CARE ........................................................................ 69 Chart 76: PATRONAGE OF PUBLIC HOSPITAL/ HEALTH CENTRE IN THE LAST ONE YEAR ................................... 70 Chart 77: REASONS FOR NOT PATRONISING PUBLIC HOSPITAL/ HEALTH CENTRE ........................................... 71 Chart 78: HOUSEHOLD'S EXPENDITURE ON HEALTH CARE ................................................................................ 72 Chart 79: AWARENESS OF NATIONAL INSURANCE SCHEME IN KOSOFE ............................................................ 73 Chart 80: HOUSEHOLD'S MEMBER THAT REGISTERED FOR NATIONAL INSURANCE SCHEME IN KOSOFE......... 74 Chart 81: WILLINGNESS TO PAY FOR A DEFINED HEALTH CARE PACKAGE FOR PARENTS AND FOUR CHILDREN LESS THAN 18 YEARS OF AGE .............................................................................................................................. 75 Chart 82: AMOUNT HOUSEHOLD'S MEMBER WILLING TO PRE-PAY THE NEXT ONE YEAR ............................... 76 Chart 83: THE LAST TIME HOUSEHOLD MEMBER VISITED PUBLIC HOSPITAL/HEALTH CENTRE ........................ 76 Chart 84: SATISFACTION WITH GOVERNMENT HEALTH CENTRE/HOSPITAL ...................................................... 77 Chart 85: HOUSEHOLD HEALTH CARE COST COVERED BY INSURANCE ............................................................. 78 Chart 86: REASONS FOR CHOICE OF "PUBLIC HOSPITAL / HEALTH CENTRE" ..................................................... 79 Chart 87: REASON(S) FOR CHOICE OF "PRIVATE HOSPITAL/ CLINIC" ............................................................... 81 Chart 88: REASON(S) FOR CHOICE OF "PRIVATE PHYSICIAN" ........................................................................... 83 Chart 89: REASON(S) FOR CHOICE OF "TRADITIONAL HERBAL CLINIC" ............................................................. 85 Chart 90: REASON(S) FOR CHOICE OF "FAITH BASE/ SPIRITUAL HOME" ............................................................ 87 Chart 91: REASON(S) FOR CHOICE OF "PHARMACY/ CHEMIST SHOP" ............................................................. 89 Chart 92: GOVERNMENT HOSPITAL/ HEALTH CENTRE RATING ON "PROVISION OF DRUGS" ........................... 90 Chart 93: GOVERNMENT HOSPITAL/ HEALTH CENTRE RATING ON "MEDICAL EQUIPMENT" .......................... 91 Chart 94: GOVERNMENT HOSPITAL/ HEALTH CENTRE RATING ON "QUALITY OF MEDICAL PERSONNEL" ....... 92 Chart 95: GOVERNMENT HOSPITAL/ HEALTH CENTRE RATING ON "WAITING TIME" ....................................... 93 Chart 96: GOVERNMENT HOSPITAL/ HEALTH CENTRE RATING ON "INFRASTRUCTURE(BUILDING, WATER, ELECTRICITY)" ...................................................................................................................................................... 94 Chart 97: GOVERNMENT HOSPITAL/ HEALTH CENTRE RATING ON "ATTITUDE OF MEDICAL PERSONNEL TOWARDS PATIENTS" ......................................................................................................................................... 96 Chart 98: GOVERNMENT HOSPITAL/ HEALTH CENTRE RATING ON "COST OF DRUGS / MEDICAL TEST" ......... 97 Chart 99: GOVERNMENT HOSPITAL/ HEALTH CENTRE RATING ON "QUALITY OF SERVICE" .............................. 98 Chart 100: PROBLEMS FACED IN THE MOST RECENT VISIT TO GOVERNMENT HEALTH FACILITY ................... 100 Chart 101: RATING OF QUALITY OF HEALTH CARE SERVICES AT GOVERNMENT HOSPITALS OR CLINICS ........ 102
Table of Figures Table 1: SHOWING SUMMARY OF HOUSEHOLD EXERCISE IN KOSOFE LGA ....................................................... vii Table 2: SHOWING SUMMARY OF INDICATORS ............................................................................................... 104

iv
PREFACE Lagos State population continues to grow in leaps and bounds due to her proximity to national landmarks such as sea and air ports that made her an investment destination. In addition, the State had, at one time, served as the Nations’s capital with a wide range of socio-economic infrastructure and business haven to a lot of people. The uncontrollable influx of people into the State from other parts of the Country as well as the Sub-Sahara West Africa for business and other economic opportunities has serious impact on the State’s housing infrastructure. The persistence of the trend over time has culminated in the emergence of urban slums in the nooks and crannies of the State. The state population is currently estimated at over 23 million with a population density of 6,516 per square kilometer. Lagos is undoubtedly a regional economic hub and a megacity of unique endowments requiring better understanding and appreciation of its urban peculiarities in relation to other Nigerian cities. The State population has grown in leaps and bounds stretching the existing infrastructure beyond the limit.
In spite of the megacity status of Lagos State, facts and figures show that the State harbour a sizeable number of slum settlements across the entire 57 LG/ LCDAs. This is because the high cost of accommodation has resulted in concentration of the poor and most vulnerable population in slums and shanty towns scattered around the metropolis.
In all, the State has a preponderance of slums area with similar characteristics of low uptake of educational and health care services. In 2012, an investment case for Lagos was conducted with the aim of identifying bottlenecks and window of opportunities to address the inequalities in health especially the urban slums.
A 12 months pilot intervention was thereafter embarked upon in five slum communities in Ajeromi/Ifelodun LGA. One of the action points of the investment case was to review the progress of the investment case every three years using the current data as baseline while the results so far will be the basis for the next phase. It is 3 years now and there is a need to follow-up on the progress made and review strategies where necessary.
Thus, three (3) communities in the Kosofe Local Government Areas: OLUBORI ODUN IFA, IDI-ARABA and MOSAFEJO communities were selected for the next round of intervention with a view to scaling up the health care uptake of the inhabitants through direct access to preventive health care services.
To this end, The Lagos Bureau of Statistics (LBS), Ministry of Economic Planning and Budget (MEPB) in collaboration with the UNICEF embarked on the baseline assessment of the inhabitants of the three identified communities; OLUBORI ODUN IFA, IDI-ARABA and MOSAFEJO communities, with a view to arriving at the relevant and reliable information that could be leveraged upon for

v
appropriate intervention in these communities. This expectedly will assist to reduce both mortality and morbidity rates in the selected communities.
The Lagos Bureau of Statistics (LBS) provided the technical support for the baseline study in the listing of houses and households in the three (3) communities, Questionnaire designs and production, Data collection, Data analysis and Report writing while the fund for this project was exclusively sourced from United Nations Children’s Fund (UNICEF). The Agency supports countries and sub-nationals in using population data for policies and programmes targeting children (under 5 years old) and women especially the vulnerable ones. The Agency also supports various immunization initiatives that will enhance children’s quality of life, Child Rights protection and prevention of child abuse in all ramifications. Users in the academia, researchers, programme officers and policy makers on Lagos State will find the maiden edition very useful.
The Lagos Bureau of Statistics expresses its sincere gratitude to UNICEF for this relationship and her continuous support to the Bureau. The contribution of staff of the Bureau towards successful completion of this study is highly appreciated.
Suggestions, comments and constructive criticisms that will ensure improvement in the subsequent edition(s) are welcome from all and sundry.
Kadiri Abayomi Adebisi Permanent Secretary Ministry of Economic Planning and Budget, The Secretariat, Alausa, Ikeja

vi
INTRODUCTION Kosofe Local Government Area is one of the 57 LG/LCDAs in the State with an estimated population of 1,240,936 people (LBS Digest of Statistics, 2014) and a population density of 14,703 per square kilometre. The LGA is bounded in the North by Ojota-Alapere axis along Lagos-Ibadan Expressway and in the South by Oworonshoki-Apapa Expressway to Anthony Village. The Eastern Boundary of the LGA starts from Oworonshoki – Ibadan expressway to Ketu Junction while the Western Boundary ranged Anthony to Maryland axis of Ikorodu road. The LGA consist of 18 wards out of which Olubori - Mosafejo is one. The Olubori - Mosafejo Ward is comprised of three distinct communities namely, Olubori-Odunfa, Idi-Araba and Mosafejo communities with 124 Streets, 33 Streets and 74 Streets respectively. On the other hand, a total of 1,872 households, 516 households and 700 households were listed in Olubori-Odunfa, Idi-Araba and Mosafejo communities respectively. In accordance with the objective of the survey, only households with children less than 5 years old were actually interviewed. The summary of the exercise is tabulated in Table 1. Map of the target population

vii
Table 1: SHOWING SUMMARY OF HOUSEHOLD EXERCISE IN KOSOFE LGA
Summary of Household Survey Exercise in Kosofe LGA
S/N NAME OF COMMUNITY
Number of Streets
Number of Houses
Number of Households Enumerated
Households with under 5
years old
1 OLUBORI ODUN IFA 124 684 1,872 1,853
2 IDI ARABA 33 188 516 448
3 MOSAFEJO 74 256 700 642
Total 231 1,128 3,088 2,943
Household Survey is globally acclaimed as the major source of information on the socio-economic well-being of the populace. It provides information on wide range of activities and characteristics of individual household, the communal relationship, demography, education, health, religion, income and occupational pattern, housing condition, water and sanitation, infrastructural needs and provision among others. Researchers all over the world have realized that information collected at household levels within a geographical entity remain one of the powerful tools of assessing the socio-economic condition of the inhabitants of the community, local government areas, states or federal constituencies as the case may be. It is in this light that the baseline assessment of the three slum communities were conducted to obtain first-hand information on key social and health issues being experienced by the inhabitants of the communities, especially the children and the women, with a view to exposing them to basic health care services through a 6-month intervention. In addition, information gathered through this process will be of immense contribution in determining the variety and quality of health care desired by the inhabitants of the community.

viii
Chart 1: Total Number of Households Enumerated and Interviewed by Communities
OBJECTIVES: The General Objective of the baseline assessment study is to generate the database of the inhabitants of the three communities with a view to proffering appropriate solutions to their socio-economic needs as well as understanding the key features/ characteristics of the AJIF project in the communities. The specific objectives are: To determine the proportion of women that attended Ante-natal Care (ANC) To determine the proportion of women that received Tetanus Toxoid Immunization (TTI) To determine the proportion of new born baby(s) that received Bacillus Calmette - Guerin
(BCG) vaccine To determine the proportion of children that were vaccinated against Measles To determine the proportion of children that received the 1st and 2nd Doses of Vitamin A To determine the proportion of children that completed the dose of vaccination against
Diphtheria Pertussis and Tetanus (DPT) –DPT1, 2 and 3. To determine the proportion of children that completed the intake of Oral Polio Vaccine
(OPV) – OPV1, 2 and 3 To determine the proportion of deliveries taken by skilled birth attendants To determine where deliveries take place To determine the proportion of babies delivered that are exclusively breast fed for the first
six months To determine the proportion of under 5 children whose birth were registered.
0500
100015002000250030003500
OLUBORI ODUNIFA
IDI ARABA MOSAFEJO Total
1872
516 700
3088
1853
448 642
2943
Total Number of Households Enumerated and Interviewed by Communities
Total Number of Households Enumerated Total Households with under 5 years old interviewed

ix
To determine the proportion of under 5 children that are fully immunized in the selected communities
To determine the proportion of children sick with Malaria, Pneumonia and Diarrhoea in the selected communities
To determine the proportion of pregnant women who receive Focused Antenatal Care (FANC) including HIV testing.
SCOPE and COVERAGE The Scope of the study centred on the children (Under 5years) and women of child bearing age (15-49) years in the three (3) selected communities: Olubori Odun-Ifa, Idi-Araba and Mosafejo communities in Kosofe Local Government Areas of Lagos State.
METHODOLOGY A preliminary meeting was held between the Officials of the UNICEF and Lagos Bureau of Statistics (LBS) to discuss the modalities of the baseline assessment, the time lines and the cost implication. An Implementation Roadmap was thereafter generated for effective synergy on the expected deliverables and milestones.
Consequently, a meeting was held between the LBS and the official of the Kosofe local Government, ably represented by Mrs. Thomas to chart the course for approaching the communities leveraging upon the existing traditional structure and synergy with the head of each of the three (3) communities, the Baales, to inform them about the proposed interventions and solicit the cooperation of the inhabitants during the exercise.
A preliminary visit was paid to the three (3) Identified Slum Communities to identify the boundaries, study the terrain and map out the appropriate data collection strategy.
On the other hand, Questionnaire and Listing Format were designed and jointly ratified by the UNICEF and LBS which now paved way for the recruitment of AdHoc staff for field work. In all a total of 72 AdHoc-staff were engaged comprising 60 Enumerators and 12 Supervisors. The LBS provided 3 Coordinators to support the entire field work process.
SAMPLING METHODOLOGY A Multi-Stage Sampling method was adopted for the study:
First stage comprised listing of streets and houses in each of the three (3) communities.

x
Second Stage involved listing of households with women of child bearing age (15-49) that are pregnant or currently lactating with under 5 children in the in the selected houses within each community.
Third Stage: Interview of selected household with women of child bearing age (15-49) that are pregnant or lactating with under 5 children. Women, neither pregnant nor lactating, but having under 5 children were also interviewed.
Listing of houses and households across the three (3) slum communities commenced simultaneously as planned and lasted for 8 working days. At the end of the exercise, a total of 3,088 households were listed out of which 2,943 households were eventually interviewed. Thus, giving an overall response rate of 95.3%.
Chart 2: Response Rate by Communities and Wards
TRAINING The Lagos Bureau of Statistics (LBS) Technical Team was involved in recruiting field staff that had the requisite skill and experience to work as enumerators and supervisors. After the screening of the candidates, selections were made on the basis of mock test.
A Two (2) day training was held at Ostra Hotel on the 30th November and 1st December, 2015 to introduce the recruited Field Officers to the project objectives, scope, and coverage. The training also centered on the data collection ethics, the listing template, the questionnaires, the coding
OLUBORI ODUN IFA IDI ARABA MOSAFEJO Ward
99.0
86.8
91.7
95.3
Response Rate by Communities and Wards
Response Rate

xi
sheets as well as other survey instruments. The training was conducted according to LBS training procedures which included class presentation, class exercise and lectures on how to complete the questionnaire and field practice (Enumerators and Supervisors manuals).

xii
Cross-section of field workers being addressed by one of the officials of LBS.
Director, Lagos Bureau of statistics (LBS), addressing the Participants at the training workshop

xiii
FIELD WORK The field work commenced on 2nd December, 2015 and ended on the 11th December, 2015. A total of 60 Enumerators and 12 Supervisors were on the field. The field coordination were anchored by the Staff of Lagos Bureau of Statistics (LBS).
The following pictures showed the initial consultations with the Baales and leaders of the three communities (Olubori/ OdunIfa, Idiaraba and Mosafejo):
LBS Officials with Baale of Idi-Araba
LBS Officials with Baale of Mosafejo

xiv
Some of the LBS Officials with Baale and chiefs of Olubori-Odun-Ifa Community

xv
DATA PROCESSING, ANALYSIS AND REPORT WRITING The process of data entry began few days after the commencement of the field work and lasted for two weeks. Completed questionnaires from the field were edited by the supervisors and LBS checkers before being dispatched for data processing. The data were then edited and entered by data processing personnel specially trained for this task. The data analysis was done using QPMR and SPSS software. The report was exclusively written by the Staff of Lagos Bureau of Statistics (LBS).

1
DEMOGRAPHY In accordance with standard household survey, Age and Gender classification are very paramount to the characteristics of the inhabitants of any geographical entity. Accordingly, age distribution of the respondents in the slums communities were captured.
AGE OF RESPONDENTS Age composition remain one of the reliable indicators to determine the quality of human resources available in a geographical area of interest over a period of time. It is used mostly in the computation of population pyramids, calculation of dependency ratio and estimation of demographic trends of a population. The survey revealed more than half of the respondents, 51% were aged 21-30years, those in age group 31-40 years accounted for 40%. Respondents in age category 15-20 years and above 40 years constituted 3% and 6% respectively.
However, at the community level, respondents of aged 21-30 years was more pronounced at Mosafejo (53%) and this was closely followed by Olubori odun Ifa (51%) and Idi-Araba 50% . For ages 31-40 years, Olubori Odun Ifa recorded 41% while Mosafejo and Idi-Araba recorded 40% and 38% of respectively.
Chart 3: AGE OF RESPONDENT’S
15-20 21-30 31-40 41-49 >49
3 51 41 4 1
5 50 38 6 1
3 53 40 3 1
3 51 40 5 1
AGE OF RESPONDENTS'
OLUBORI ODUN IFA IDI ARABA MOSAFEJO KOSOFE INDICATOR

2
MARITAL STATUS OF RESPONDENTS Marital status also serves as a demographic indicator measuring the co-habitation arrangement of the inhabitant of the community in accordance with culture and tradition. It also reflects to some extent, the social interaction amongst diverse people of different ages, creeds and customs. The analysis revealed that 92% of the respondents are married, 4% divorced while 2% each are separated and single.
Community disaggregation showed that, Olubori Odun-Ifa and Mosafejo had 92% each of respondents that are married, while at Idi-Araba, 91% of respondents are married. Chart 4: MARITAL STATUS OF RESPONDENTS
OCCUPATIONAL STATUS OF RESPONDENTS Occupational status remains one of the key indicators guiding the quality and quantity of labour force available to an economy. The ward level result show that 67% of respondents are self employed (Artisans), 14% are full time housewives, (7%), 3% are regular employees in the private and public sectors respectively. The analysis further revealed that 6% of the respondents are job seekers while 1% each of the respondents are labourers and farmers (Agriculture).
The communities’ indicators revealed that Olubori Odun-Ifa and Idi-Araba had 67% each of respondents that are artisans while Mosafejo have 64% of the respondents that are Artisans. The Regular Employed (Private) indicator revealed that Mosafejo had the highest percentage (11%) while Idi-Araba and Olubori Odun Ifa had 8% and 6% of the
92
4
2
2
91
2
3
4
92
3
3
2
92
4
2
2
Married
Divorced
Separated
Single
MARITAL STATUS OF RESPONDENTS
OLUBORI ODUN IFA IDI ARABA MOSAFEJO KOSOFE INDICATOR

3
respondents that are in the private sector. Regular Employee (Government) respondents revealed that Mosafejo has 4%, Olubori Odun Ifa 3% and Idi-Araba (2%).
Chart 5: OCCUPATIONAL STATUS OF RESPONDENTS
AVERAGE HOUSEHOLD SIZE Average Household size is a powerful demographic indicator. It reflects the number of people living together and eating from the same pot. It is also a pointer to the living standard of the people and by extension the community. The analysis showed that 64% of the respondents has an average household size of three (3) members. 35% of the respondents recorded average household size of 7 members while those with more than nine (9) members accounted for 1%.
At the communities level, Mosafejo has the highest percentage of respondents (69%) with average household size of three (3) members, Olubori Odun-Ifa (63%) and Idi-Araba (59%).
3 6 67 1 5 2 15
1 2 8
67 1 5 1
15
4 11 64 1 7 2 12
3 7 67 1 6 2 14 1
Regularemployment
(Government)
RegularEmployment
(Private)
Self Employed(Artisan)
Agriculture. Unemployed(Job Seeker)
Student Full HouseWife
DailyLabourer
OCCUPATIONAL STATUS OF RESPONDENTS
OLUBORI ODUN IFA IDI ARABA MOSAFEJO KOSOFE INDICATOR

4
Chart 6: AVERAGE HOUSEHOLD SIZE
COMPOUND DENSITY The average number of people that live in a housing unit reflects the population density of the community concerned. The survey result show that 37% of the respondents live in a housing unit with an average of three (3) people, 36% and 27% of the respondents reside in the buildings with an average of seven (7) people and more than nine (9) people. However, at the community level, buildings with an average of seven (7) people living in the compound is more prominent at Idi-Araba (31%). This is closely followed by Olubori Odun Ifa with 26% while Mosafejo has 25% of respondents living in an housing unit with an average of seven (7) people. Chart 7: COMPOUND DENSITY
OLUBORI ODUN IFA IDI ARABA MOSAFEJO KOSOFE INDICATOR
63 59 69 64
35 39 30 35
1 2 2 2
AVERAGE HOUSEHOLD SIZE
1--4 5--9 >9
OLUBORI ODUN IFA
IDI ARABA
MOSAFEJO
KOSOFE INDICATOR
30
43
53
37
26
31
25
27
43
25
21
36
COMPOUND DENSITY
1--4 5--9 >9

5
HIGHEST LEVEL OF EDUCATION ATTAINED Education is knowledge acquired through learning and it plays a greater role in human development. It has an impact on an individual’s ability to participate in society socially and economically as well as to understand important public issues. It is the foundation upon which skill needed in labour market is built as well as the determinant of the potential level of the workforce and the wealth of a nation. The better educated the citizens of a nation are, the more technologically advanced the economy of the nation. The analysis revealed that 64% of households interviewed had secondary school certificate. 11% possessed primary 6 certificates while 12% have higher non university and 4% had higher university. Chart 8: HIGHEST LEVEL OF EDUCATION ATTAINED
Pre Primary
Primary (Basis 1-6)
Secondary(JSS 1-3)
Secondary (SSS 1-3)
Adult Education
Higher non university(ND, NCE, HND, PGD)
Higher University (BSC, MSC, MPhil, PHD)
Vocational training
No Formal Education
4
11
13
54
1
12
4
1
1
5
17
15
52
6
4
1
9
9
9
46
19
5
1
1
5
11
12
52
1
12
4
1
1
HIGHEST LEVEL OF EDUCATION ATTAINED
OLUBORI ODUN IFA IDI ARABA MOSAFEJO KOSOFE INDICATOR

6
ENVIRONMENT DRAINAGE SERVICE AVAILABILITY OF DRAINS/ GUTTERS ON THE STREET Drainage is the natural or artificial removal of surface and below the surface water from an area in order to prevent flooding. Flooding is a critical issue that should be prevented in order to curb the problem of collapse of buildings, roads, bridges and enhance neat and flood-free environment. To achieve these, adequate drainage facilities must be put in place .The analysis revealed that 76% of the survey area have drains and gutters as posited by the respondents. This result is reflected at Olubori Odun Ifa (79%), Mosafejo (78%) and
Idi-Araba 61%.
Chart 9: AVAILABILITY OF DRAINS/GUTTER ON THE STREET
OLUBORI ODUN IFA IDI ARABA MOSAFEJO KOSOFE INDICATOR
79 61
78 76
AVAILABILITY OF DRAINS/GUTTER ON THE STREET

7
TYPE OF DRAINAGE FACILITY Drainage system in the community must be well kept and covered always to allow free flow of water and prevent water borne diseases. The type of drainage system available in the communities show that 79% are uncovered as asserted by respondents while 13% and 8% of drains are covered concrete and earth. Idi-Araba has more uncovered concrete drains with 88% while Olubori Odun Ifa and Mosafejo have 79% and 72% uncovered concrete drains as indicated by the respondents.
Chart 10: AVAILABILITY OF DRAINS/GUTTER ON THE STREET
79
88
72
79
13
7
20
13
8
5
8
8
OLUBORI ODUN IFA
IDI ARABA
MOSAFEJO
KOSOFE INDICATOR
TYPE OF DRAINAGE FACILITY
Uncovered concrete drain Covered concrete drain Earth

8
CLEANING OF THE DRAINAGE SYSTEM Cleaning the drains system will allow for free flow of water which will make the environment clean as well as prevent malaria. To make the environment clean, the Lagos State Government introduced monthly sanitation exercise to compel the populace to clean their environment. The result of the analysis shows that 77% of the sampled household members have their drainage clean. Olubori Odun Ifa takes the lead with 81% of respondents asserting this while 73% and 66% of respondents from Mosafejo and Idi-Araba supported this claim.
Chart 11: CLEANING OF THE DRAINAGE SYSTEM
81 66 73 77
OLUBORI ODUN IFA IDI ARABA MOSAFEJO KOSOFE INDICATOR
CLEANING OF THE DRAINAGE SYSTEM

9
PERSONNEL RESPONSIBLE FOR CLEANING THE DRAINAGE SYSTEM Adequate provision is needed for cleaning of the drainage as this will allow for continuity and as such an entity must be held responsible for this. The cleaning of the drainage always go a long way in terms of promoting healthy living. The study examined those that are responsible for cleaning the drainage/gutters in their area and the result shows that 73% of the cleaning is being done by Private Sector Participation (PSP) as claimed by the respondents while 22% and 5% of the sampled household members asserted that the cleaning is done by the community and government employed personnel.
Chart 12: PERSONNEL RESPONSIBLE FOR CLEANING THE DRAINAGE SYSTEM
OLUBORI ODUN IFA
IDI ARABA
MOSAFEJO
KOSOFE INDICATOR
22
31
17
22
3
8
10
5
75
60
72
73
PERSONNEL RESPONSIBLE FOR CLEANING THE DRAINAGE SYSTEM
Community Government employed personnel PSP

10
TOILET MAIN TYPE OF TOILET FACILITY AVAILABLE TO HOUSEHOLD The toilet is a means of disposing human waste (excrete and urine) in the body system. It helps in providing comfort to the body and make the body light and free from some toxins. The proper disposal of excreta makes for a healthy environment. The result revealed that 42% of sampled households said they flush to septic tank while 31% claimed they flush to pit. Also, 11% asserted that they flush /pour to street, yard and ditch, 2% flush to sewer. Chart 13: MAIN TYPE OF TOILET FACILITY AVAILABLE TO HOUSEHOLD
Flush to septic tank (water closet)
Flush/pour to pit (pit latrine)
Flush/pour to street, yard, ditch
Flush to sewer
Covered pit toilet/latrine (improved)
Uncovered pit toilet/latrine
Hanging toilet/toilet on water
Bush/field
Ventilated improved pit(VIP)
Mobile toilet
No toilet facility
Dig ground and bury
Flush to gutter
45
31
8
1
5
1
1
1
2
1
2
1
21
30
25
2
2
4
2
2
2
5
1
5
50
30
9
3
1
1
1
2
1
1
42
31
11
2
4
1
1
1
1
1
2
1
1
MAIN TYPE OF TOILET FACILITY AVAILABLE TO HOUSEHOLD
OLUBORI ODUN IFA IDI ARABA MOSAFEJO KOSOFE INDICATOR

11
WATER MAIN SOURCE OF WATER Water is life. Good potable water will allow for good quality health. The nature of water consumed will determine how healthy the person is and this will transform to a healthy society. The source of water determines the quality of the water and how consumable the water is. The survey result shows that 54% of the sampled households said their main source of water supply was borehole. Other sources of water supply included public piped water supply, Lagos Water Corporation (18%), Local Water Supply Scheme (11%), unprotected dug well (6%), and Small Scale (water) Vendors (1%). At the community level, the usage of borehole was more pronounced in Mosafejo (68%), while Idi-Araba has 52% and Olubori Odun Ifa 50%. Chart 14: MAIN SOURCE OF WATER
Lagos Water Corporation (LWC)
Local Water Supply Scheme (Community)
Private Water Well (Borehole, Hand dug well,Standpipes)
Local Flowing Rivers/Stream/Spring
Protected dug well
Unprotected dug well
Small-scale /truck vendor
Surface water (lagoon, creek, river, dam, lake, pond,stream canal, irrigation channels)
27
9
50
1
3
4
1
4
4
22
52
3
6
2
11
4
9
68
5
8
1
4
18
11
54
1
3
6
1
5
MAIN SOURCE OF WATER
OLUBORI ODUN IFA IDI ARABA MOSAFEJO KOSOFE INDICATOR

12
MAIN SOURCE OF POTABLE WATER One of the ways to guide against water borne diseases is to drink safe water. The analysis shows that 33% of the respondents claimed that water from main source is potable. However, at the community level Olubori Odun Ifa recorded the highest percentage (40%) of respondents that asserted that the water from main source is not drinkable while Mosafejo and Idi-Araba recorded 25% and 16% respectively.
Chart 15: MAIN SOURCE POTABLE WATER
OLUBORI ODUN IFA IDI ARABA MOSAFEJO KOSOFE INDICATOR
40
16
25
33
MAIN SOURCE POTABLE WATER

13
TREATMENT OF PRIMARY SOURCE OF WATER TO MAKE IT SAFE FOR DRINKING There is need to treat water to make it safe for drinking so as prevent diseases. The survey sought to know the various methods being applied by the respondents in making their primary source of water safe for drinking. The result obtained revealed that 75% of the respondents said they boil their water to make it safe for drinking while 24%, 23% ,7% and 4% of the sampled household members indicated that they let it stay and settle, add bleach ,use water filter and sieve it through cloth respectively. At the community divide, boiling method was more noticeable in Olubori Odun Ifa (79%), Idi-Araba (75%) and Mosafejo (56%).
Chart 16: TREATMENT OF PRIMARY SOURCE OF WATER TO MAKE IT SAFE FOR DRINKING
Addbleach/chlorine/Alum
Boil Let it stay and settle Sieve it through cloth Water filter (ceramic,sand, composite)
22
79 26
5 8
17
75
11
3 1
30
56
23
1
4
TREATMENT OF PRIMARY SOURCE OF WATER TO MAKE IT SAFE FOR DRINKING
OLUBORI ODUN IFA IDI ARABA MOSAFEJO KOSOFE INDICATOR

14
WASTE DISPOSAL METHODS OF WASTE DISPOSAL Waste disposal is the process of getting rid of unwanted materials or substances. This enable residents living in the area to be free from germs and diseases thus making them healthy. The study sought to know the mode of waste disposal by the household members interviewed and the result show that 34% each of the respondents disposed their waste through Government (PSP) and the truck pushers. The analysis further revealed that 21%, 13% and 7% of the respondents said they dispose their waste through dumping ground in the neighbourhood, within the compound and burned/buried respectively. At the community divide dumping of waste in the neighbourhood is more prominent in Idi-Araba (54%), Mosafejo (20%) and Olubori Odun Ifa (14%). Chart 17: METHODS OF WASTE DISPOSAL
Collected by the government (PSP)
Dumping ground in neighborhood
Truck pusher/private refuse collector
Disposal within compound (neighborhood bin/tank)
Government bin
Burned/ Buried
36
14
42
2
2
4
12
54
9
7
1
17
42
20
28
1
9
34
21
34
3
1
7
METHODS OF WASTE DISPOSAL
OLUBORI ODUN IFA IDI ARABA MOSAFEJO KOSOFE INDICATOR

15
HEALTH ANTENATAL CHECK-UPS The purpose of ANC is to care for pregnant mothers and to have all births attended t o by trained health workers. It also serves as a means of identification of high risk pregnancies so as to provide special care for the mother and the unborn child. To protect the health of the mother and the child, the expectant mothers are expected to go for medical checkup to determine the health status of the mother and the child. The purpose for this is for the prevention of maternal mortality. The analysis revealed that 95% of expectant mothers went for antenatal check-up. Olubori Odun Ifa recorded the highest percentage (96%) of expectant mothers that go for antenatal check-ups when pregnant while Mosafejo and Idi-Araba recorded 94% and 90% of expectant mothers that go for antenatal check-ups when pregnant. Chart 18: ANTENATAL CHECKUPS (ANC)
OLUBORI ODUNIFA
IDI ARABA MOSAFEJO KOSOFEINDICATOR
96
90
94 95
ANTENATAL CHECK-UPS (ANC)

16
TETANUS TOXOID IMMUNIZATION (TTI) Immunization is the process of protecting a person from a specific disease. The uptake of Tetanus Toxoid Immunization (TTI) by expectant mothers was also investigated and the survey result revealed that TTI vaccines were received by 79% of the expectant mothers. The vaccination of expectant mothers was more noticeable in Idi-Araba (87%) while Olubori Odun Ifa and Mosafejo recorded 82% and 67% vaccination by expectant mothers.
Chart 19: TETANUS TOXOID IMMUNIZATION (TTI)
OLUBORI ODUNIFA
IDI ARABA MOSAFEJO KOSOFEINDICATOR
82 87 67
79
TETANUS TOXOID IMMUNIZATION (TTI)

17
REASONS FOR THE FAILURE OF TETANUS TOXOID IMMUNIZATION (TTI) In spite of the importance of Tetanus Toxoid Immunization TTI expectant mothers are still reluctant in taking it for one reason or the other. The views of expectant mothers were sought on the failure of TTI. The result revealed that long waiting time has the highest percentage(50%) of failure which is closely followed by fear of side reaction with 19% . The study further shows that unaware of the need of immunization(17%), postponement till another time (14%), mother too busy (13%), wrong idea about contraindication (12%) rumour (11%) ,culture/religious(10%) and place of immunization too far(9%) are some of the adduced reasons given for the failure of Tetanus Toxoid Immunization(TTI). At the community level, long waiting time as one of the reasons for the failure of TTI was more prominent in Olubori Odun Ifa (54%) while in the other two communities Mosafejo was (44%) and Idi-Araba (12%).
Chart 20: REASONS FOR THE FAILURE OF TETANUS TOXOID IMMUNIZATION (TTI)
Unaware of need for immunization
Place or time of immunization unknown
Wrong idea about contraindication
Cultural/ religious reasons
Place of immunization too far
Absent of vaccinator
Mother too busy
Mother ill did not visit health facility
Long waiting time
17 12
11 20
14 13
11 13
8 5 4
2 13
4 4 4
54
18 6
6 6
18 18 12
12 6
6
18
6 6
12
12 3
12 18
3 18
9 6
3 3
15
3 3
44
17 10 11 19
12 14
10 11
9 5 4
2 13
3 4 4
50
REASONS FOR THE FAILURE OF TETANUS TOXOID IMMUNIZATION (TTI)
OLUBORI ODUN IFA IDI ARABA MOSAFEJO KOSOFE INDICATOR

18
LAST CHILD BORN IN A HEALTH FACILITY One of the major determinants of improved health care delivery is the increased patronage of health facilities by pregnant women for antenatal health care and child delivery. The survey showed high health facility patronage when the last child were born in Olubori/ Odun Ifa and Mosafejo community with 86% and 85% patronage while 66% of Idi Araba community used the health facility for their last child delivery. Kosofe Indicator indicates 82% patronized the health facility while 18% did not.
Chart 21: LAST CHILD BORN IN A HEALTH FACILITY
HEALTH FACILITY WHERE CHILD WAS BORN The types of hospital patronized by household members when a fall or slip occurred was investigated. The survey revealed that traditional medical/ herbal home is seldom used in three communities with Kosofe indicator showing 3% for Traditional Home Patronage and Private Hospital patronage records 47% while the Government hospital had 49%. Mosafejo had the highest indication for Private hospital patronage with 57% followed by Idi Araba with 47% and Olubori/ OdunIfa 44%. The government hospital is more patronized by Olubori/ OdunIfa community with 54% followed by Idi Araba with 45% and Mosafejo with 39%. The traditional medical home patronage proportion is highest in Idi Araba (8%), Mosafejo (3%) and Olubori/ OdunIfa (2%).
OLUBORI ODUN IFA IDI ARABA MOSAFEJO KOSOFE INDICATOR
86
66
85 82
LAST CHILD BORN IN A HEALTH FACILITY

19
Chart 22: HEALTH FACILITY WHERE CHILD WAS BORN
ASSISTANT USED WITH THE DELIVERY The quality of care received during child birth often depends on the expertise of personnel that attended to the pregnant woman during child birth. The survey investigated person(s) that assisted the expectant mothers during their last child birth. The proportion of Assistance used with delivery. The Kosofe Indicator showed that 51% are assisted by Doctor with delivery, 45% were assisted by Nurse/ Midwife, 3% by Auxiliary Midwife and 2% by Trained Traditional Birth Attendant. However, Doctor-assisted delivery in Olubori/ OdunIfa was 55%, Idi Araba had 37% and Mosafejo had 44%. Nurse/ Midwife assisted delivery in Olubori/ OdunIfa was 41%, Idi Araba, 55% and Mosafejo, 45%.
54
45
39
49
44
47
57
47
2
8
3
3
0 10 20 30 40 50 60 70
OLUBORI ODUN IFA
IDI ARABA
MOSAFEJO
KOSOFE INDICATOR
HEALTH FACILITY WHERE CHILD WAS BORN
Traditional Private Government

20
Chart 23: ASSISTANCE USED WITH THE DELIVERY
REASON FOR NOT DELIVERING IN A HEALTH FACILITY The survey also explored various reasons given for non-patronage of health facilities as place of delivery by the female household members. Kosofe Indicator showed that Closed Facility accounted for the highest reasons for non-patronage of health facility with 39%. This was followed by high cost with 17%. Religious Affiliation (ie. Belief) accounted for 15%, those that thought it was not necessary recorded 14% and those that do not trust the facility or believed that they will receive poor services from the available facilities recorded the least with 5%. Closed facilities accounted for the major reasons given for non-patronage of available health facilities in the three communities with Idi Araba having 55%, Olubori/ OdunIfa recording 30% and Mosafejo with 38%. High Cost is another factor for non-patronage with Mosafejo recording 36%, Olubori/ OdunIfa (14%) and Idi Araba (12%).
Doctor Nurse/ midwife Auxiliary midwife Trained Traditionalbirth attendant
55 41 2 2
37 55 4 4
44 49 4 2
51 45 3 2
ASSISTANCE USED WITH THE DELIVERY
OLUBORI ODUN IFA IDI ARABA MOSAFEJO KOSOFE INDICATOR

21
Chart 24: REASON FOR NOT DELIVERING IN A HEALTH FACILITY
HOUSEHOLD WITH NEWBORN BABY The survey examined women that currently had babies. It was discovered that 38% of the respondents currently had babies in the Kosofe area indicating 35% for Idi Araba, 38% for Olubori/ OdunIfa and 40% for Mosafejo.
OLUBORI ODUN IFA
IDI ARABA
MOSAFEJO
KOSOFE INDICATOR
14
12
36
17
30
55
38
39
10
13
9
11
5
4
5
5
20
8
3
14
21
8
9
15
REASON FOR NOT DELIVERING IN A HEALTH FACILITY
Costs too much Facility closed (strike)
Too far/ no transportation Don’t trust facility/ poor quality service
Didn’t think it was necessary Religious affiliation

22
Chart 25: HOUSEHOLD WITH NEWBORN BABY
RESPONDENT CURRENTLY BREAST FEEDING BABY The respondents that are currently breastfeeding were also sought after. It was recorded that 38% were currently breastfeeding as recorded by the Kosofe Indicator and across the communities we have 36% breastfeeding in Olubori/ OdunIfa, 37% in Idi Araba and 43% in Mosafejo community.
Chart 26: RESPONDENT CURRENTLY BREAST FEEDING BABY
OLUBORI ODUN IFA IDI ARABA MOSAFEJO KOSOFE INDICATOR
38
35
40
38
HOUSEHOLD WITH NEWBORN BABY
OLUBORI ODUN IFA IDI ARABA MOSAFEJO KOSOFE INDICATOR
36 37
43
38
RESPONDENT CURRENTLY BREAST FEEDING BABY
Yes

23
AWARENESS OF EXCLUSIVE BREAST FEEDING OF CHILDREN Exclusive breast feeding of a child for the first six months is medically recommended for the growth and development of the baby physically and mentally. The survey sought to know the proportion of respondents that are aware of the exclusive breastfeeding initiative. The study revealed that 88% are aware of the need for exclusive breastfeeding while 12% claimed unawareness. Across communities, it was revealed that 90% of respondents in Olubori/ OdunIfa, 84% in Mosafejo and 82% in Idi Araba are aware of exclusive breastfeeding programme. Chart 27: AWARENESS OF EXCLUSIVE BREAST FEEDING OF CHILDREN
DURATION OF EXCLUSIVE BREAST FEEDING Global health policy recommends exclusive breastfeeding for six months as the optimal way of feeding infants, followed by a combination of continued breastfeeding and safe, appropriate and adequate feeding with other foods up to 2 years of age or beyond. It has been established that breastfeeding reduces infant mortality due to common childhood illnesses such as diarrhoea or pneumonia, and helps for quick recovery during illness. This survey established that, exclusive breastfeeding for more than 6 months is practiced in these communities with more than 12 months recording 41%, 6 months recording 32% and 7-12 months recording 17% and lesser months together having the remaining 10%.
Olubori/ OdunIfa recorded 49% for more than 12months, 29% for 6 months and 16% for between 7 and 12 months. Mosafejo recorded 34% each for 6 months and more than 12
OLUBORI ODUN IFA
IDI ARABA
MOSAFEJO
KOSOFE INDICATOR
90
82
84
88
AWARENESS OF EXCLUSIVE BREAST FEEDING OF CHILDREN
Yes

24
months category and 23% for 7 – 12 months. Idi Araba had 40% for 6 months, 27% for more than 12 months and 15% for 7 – 12 months.
Chart 28: DURATION OF EXCLUSIVE BREAST FEEDING
PREGNANCY IN THE LAST FIVE YEARS The survey enquire about the women that were pregnant in the last five years. It was recorded that 36% of respondents were affirmative while 64% responded otherwise.
Mosafejo recorded 31% of women that were pregnant in the last five years, Olubori/ OdunIfa recorded 37% and Idi Araba had 43%.
2 2 1 0 1 29 16 49
6 6
3 1 1 40 15
27
3 5
0 0
1 34 23 34
3 4 1 1 1 32 17 41
1MONTH 2MONTHS 3MONTHS 4MONTHS 5MONTHS 6MONTHS 7-12MONTHS >12MONTHS
DURATION OF EXCLUSIVE BREAST FEEDING
OLUBORI ODUN IFA IDI ARABA MOSAFEJO KOSOFE INDICATOR

25
Chart 29: PREGNANCY WOMEN IN THE LAST FIVE YEARS
PLACE OF DELIVERY Health seeking behaviour differs from household to household. People therefore determine where they seek health care. This can be at Public health care facilities, private physicians or with traditional and faith based healers. It was therefore important that places where households usually seek health care services be objectively determined. Awareness is quite rife among the residents of these communities with 56% and 37% patronizing Public Hospital/ Health Centre and Private Hospital/ Clinic respectively i.e. 93% combined. Only 7% patronise other options which include: Traditional Herbal Clinic, Faith-based/ Spiritual Homes and delivery at Home recorded 3%, 3% and 1% respectively for Olubori, IdiAraba and Mosafejo.
OLUBORI ODUN IFA
IDI ARABA
MOSAFEJO
KOSOFE INDICATOR
37
43
31
36
PREGNANCY WOMEN IN THE LAST FIVE YEARS

26
Chart 30: PLACE OF DELIVERY
PROPORTION OF PERSONNEL WHO PROVIDED ASSISTANCE DURING DELIVERY The quality of care received during child birth often depend on the expertise of personnel that attended to the pregnant woman during child birthas well as mother’s level of education and wealth status which may also affect the likelihood of her seeking assistance during delivery from a skilled provider. Thus, the survey investigated person(s) that assisted the respondents during the delivery of their child.
It was recorded that 68% were assisted by Doctors, 22% were assisted by Nurse/ Midwife, 4% were assisted by Auxiliary Midwife, Trained Traditional birth attendant, Relative/ Friends. Delivery by Self recorded 4%, 2% and fraction of 1 percent respectively.
PUBLIC HOSPITAL/ HEALTH CENTRE
PRIVATE HOSPITAL/CLINIC
TRADITIONAL HERBAL CLINIC
FAITH BASE/ SPIRITUAL HOME
AT HOME
57
37
3
2
1
54
34
3
6
4
50
42
4
3
2
56
37
3
3
1
PLACE OF DELIVERY
OLUBORI ODUN IFA IDI ARABA MOSAFEJO KOSOFE INDICATOR

27
Chart 31: PROPORTION OF PERSONNEL WHO PROVIDED ASSISTANCE DURING DELIVERY
HOUSEHOLD WITH UNDER 5 YEAR OLD CHILDREN Investigation into community’s children under 5 is quite imperative and necessary. History has it that children are vulnerable to most early childhood killer diseases thus the need to know their proportion in the communities with a view to fortifying them with the necessary health care support to overcome such risk. The survey showed that 84% has Under 5 Children. Across the communities, it was revealed that Olubori/ OdunIfa and Idi Araba each had 85% Under 5 Children while Mosafejo has 81%.
Doctor Nurse/ midwife Auxiliarymidwife
TrainedTraditional
birth attendant
Relative/friends Self
71 21 3 4 1
0
48 33 7 6
4
1
74 16 3
3 4
0
68 22 4 4 2 0
PROPORTION OF PERSONNEL WHO PROVIDED ASSISTANCE DURING DELIVERY
OLUBORI ODUN IFA IDI ARABA MOSAFEJO KOSOFE INDICATOR

28
Chart 32: HOUSEHOLD WITH UNDER 5 YEAR OLD CHILDREN
REGISTERED UNDER 5 CHILDREN BY COMMUNITIES Data on registration of birth represents the starting point for the recognition and protection of every child's fundamental right to identity and existence in accordance with Article 7 of the Convention on the Rights of the Child which stipulates that every child has the right to be registered at birth without discrimination. It also remains one of the potent vital statistics in demographic studies. According to UNICEF “it refers to the permanent and official recording of a child's existence by some administrative levels of the State that is normally coordinated by a particular branch of the government”. The survey revealed that 84% of the children from the studied ward has evidence of birth registration. However, community’s disaggregation showed that Olubori-OdunIfa had 87% of children under 5 years registered, Idi Araba – 82% and Mosafejo 77%.
OLUBORI ODUN IFA IDI ARABA MOSAFEJO KOSOFE INDICATOR
85 85
81
84
HOUSEHOLD WITH UNDER YEARS OLD CHILDREN

29
Chart 33: REGISTERED UNDER 5 CHILDREN BY COMMUNITIES
CHILDREN WITH DOCUMENTARY EVIDENCE OF REGISTERED BIRTH The National Population Commission is the body saddled with the responsibility of registering births and deaths. Documented evidence of registered birth will enable a State to have the statistics of births on annual basis, which could be used in planning and decision making. The evidence of documented registered births among the three sampled communities revealed that only 16% of the sampled households had evidence of birth registration. However community level analysis on awareness of birth registration among the households showed that Olubori Odun-Ifa recorded 15%, Idi Araba had 18% and Mosafejo 19%. Thus, confirming the need to step-up awareness of birth registration in these communities.
Chart 34: CHILDREN WITH DOCUMENTARY EVIDENCE OF REGISTERED BIRTH
OLUBORI ODUN IFA IDI ARABA MOSAFEJO KOSOFE INDICATOR
87
82
77
84
REGISTERED UNDER 5 CHILDREN BY COMMUNITIES
OLUBORI ODUN IFA IDI ARABA MOSAFEJO KOSOFE INDICATOR
15 18 19
16
CHILDREN WITH DOCUMENTARY EVIDENCE OF REGISTERED BIRTH

30
CHILDREN WITH DOCUMENTARY EVIDENCE (BIRTH CERTIFICATE) FROM OTHER SOURCE(S) Births are often registered in other places especially where delivery takes place such as Missionary Hospitals, Traditional Birth Homes, Churches and Mosques. At the Ward level, the study show that only (8%) of the sampled Households have their children’s births registered from other sources. Similar trends were also noticed across the three studied communities with Olubori Odun Ifa (9%), Idi Araba (7%) and Mosafejo (6%).
Chart 35: PROPORTION OF CHILDREN WITH DOCUMENTARY EVIDENCE (BIRTH CERTIFICATE) FROM OTHER SOURCE(S)
OTHER SOURCES OF DOCUMENTARY EVIDENCE OF REGISTERED BIRTH Further analysis of other sources of birth registration reveal that 61% of such registration were from Churches, 31% from Mosque while the remaining 8% were attributed to Traditional Birth Attendants (TBAs). On the other hand, community analysis showed that Mosafejo recorded (86%) registered births in Mosques, (13%) in Idi Araba and (20%) in Olubori Odunfa. However, Traditional Birth Attendants (TBAs) have no record of birth in Mosafejo as against (4%) in Idi Araba and (12%) in Olubori Odun Ifa. It is recommended that registration of child birth should be with National Population Commission (NPopC) irrespective other sources. Creation of awareness of child birth registration with NPopC needs to be intensified in these communities.
OLUBORI ODUN IFA IDI ARABA MOSAFEJO KOSOFE INDICATOR
9 7 6
8
PROPORTION OF CHILDREN WITH DOCUMENTARY EVIDENCE (BIRTH CERTIFICATE) FROM OTHER SOURCE(S)

31
Chart 36: TYPES OF OTHER SOURCES OF DOCUMENTARY EVIDENCE OF BIRTH REGISTERATION
CHILDREN WITH IMMUNIZATION CARD OR A CHILD HEALTH HANDBOOK Immunization card usually contain records of all immunizations given to a child from birth in order
to fortify the child against such childhood diseases as Measles, Polio, DPT, BCG, amongst others. In
the studied wards, nearly all the children have either immunization card or a child health handbook
(99%,). Community level analysis also revealed similar trends: Mosafejo and Idi Araba, 100% each
while Olubori Odun-Ifa recorded 99%.
OLUBORI ODUN IFA
IDI ARABA
MOSAFEJO
KOSOFE INDICATOR
68
83
14
61
20
13
86
31
12
4
0
8
TYPES OF OTHER SOURCES OF DOCUMENTARY EVIDENCE OF BIRTH REGISTERATION
CHURCH MOSQUE TRADITIONAL BIRTH ATTENDANT

32
Chart 37: CHILDREN WITH IMMUNIZATION CARD OR A CHILD HEALTH HANDBOOK
CHILDREN THAT RECEIVED BCG VACCINE Bacillus Calmette-Guerin (BCG) is a vaccine primarily administered to prevent tuberculosis. The vaccine is given to new born baby in the arm and it usually causes scar. The result of the studied ward revealed that 99% of the children received BCG Vaccine in the Ward. Similar trends were exhibited across the three slum communities- Olubori Odun-Ifa 98% while ldi Araba and Mosafejo had 100% each.
OLUBORI ODUN IFA
IDI ARABA
MOSAFEJO
KOSOFE INDICATOR
99
100
100
99
CHILDREN WITH IMMUNIZATION CARD OR A CHILD HEALTH HANDBOOK

33
Chart 38: CHILDREN THAT RECEIVED BCG VACCINE
CHILDREN THAT RECEIVED MEASLES VACCINATION (at 9 Months) Measles is an infectious diseases that is passed from an infected person to an uninfected person through droplets of saliva/respiratory secretions, when an infected person coughs or sneezes. This can also be spread when children share toys and other objects which have been put in the mouth. The probability of the spread increases when children spend prolonged time in settings like day care or crèches.
The vaccine is given to babies at nine (9) months and repeated at 18 months. Significant record was shown across the three sampled areas with Olubori Odun Ifa having 98%, Idi Araba and Mosafejo recorded (100%) each of children that received vaccine to prevent measles at exactly nine months.
Chart 39: CHILDREN THAT RECEIVED INJECTION TO PREVENT MEASLES AT EXACTLY NINE MONTHS
OLUBORI ODUNIFA IDI ARABA
MOSAFEJOKOSOFE
INDICATOR
98
100 100
99
CHILDREN THAT RECEIVED BCG VACCINE
OLUBORI ODUN IFA IDI ARABA MOSAFEJO KOSOFE INDICATOR
98
100 100
99
CHILDREN THAT RECEIVED INJECTION TO PREVENT MEASLES AT EXACTLY NINE MONTHS

34
CHILDREN THAT RECEIVED VITAMIN A AT 6 MONTHS Vitamins are essential to the body. Vitamin A helps a child to keep healthy vision, good teeth formation and build healthy immune system. It is mandatory for every child to get first and second doses of Vitamin A at interval of 6 months. The study sought to know the children that received Vitamin A at six (6) months after birth across the sampled areas in Kosofe Local Council Development Area. The indicator revealed that (99%) of the children received Vitamin A at six(6) months , (100%) each in Mosafejo, and Idi Araba while Olubori Odun Ifa has the least record (98%) among the communities.
Chart 40: CHILDREN WHO RECEIVED VITAMIN A AT 6 MONTHS
CHILDREN THAT RECEIVED VITAMIN A SECOND DOSE AT EXACTLY 1 YEAR The second dose of Vitamin A is essential for every child at one year old. The vaccine is usually administered through the mouth to ensure complete ingestion of Vitamin A for every child. Predominant intake of Vitamin A second dose at exactly one (1) year accounted for (99%) in the sampled areas of Kosofe LCDA. The result of the study Ward reveal that 99% of the children were given Vitamin A. Similar trends were exhibited across the three slum communities; Olubori Odun-Ifa 98% while ldi Araba and Mosafejo had 100% each.
OLUBORI ODUNIFA
IDI ARABA MOSAFEJO KOSOFEINDICATOR
98
100 100 99
CHILDREN WHO RECEIVED VITAMIN A AT 6 MONTHS

35
Chart 41: CHILDREN THAT RECEIVED VITAMIN A SECOND DOSE AT EXACTLY 1 YEAR
CHILDREN GIVEN DPT 1 VACCINE AT 6 WEEKS DPT is the vaccine administered to prevent three (3) infectious diseases namely Diphtheria, Pertussis (Whooping Cough) And Tetanus. The vaccine is usually administered in three doses with an interval of four weeks. The Ward level result revealed that 99% of the children received DPT1 Vaccine across the Ward. Similar trends were exhibited across the three slum communities; Olubori Odun-Ifa 98% while ldi Araba and Mosafejo had 100% each.
Chart 42: CHILDREN GIVEN DPT 1 VACCINE AT 6 WEEKS
OLUBORI ODUN IFA
IDI ARABA
MOSAFEJO
KOSOFE INDICATOR
98
100
100
99
CHILDREN THAT RECEIVED VITAMIN A SECOND DOSE AT EXACTLY 1 YEAR
OLUBORI ODUNIFA
IDI ARABA MOSAFEJO KOSOFEINDICATOR
98
100 100
99
CHILDREN GIVEN DPT 1 VACCINE AT 6 WEEKS

36
CHILDREN THAT RECEIVED DPT 2 VACCINE AT 10 WEEKS Further analysis of children that received second dose of DPT at ten (10) weeks from birth across Mosafejo-Olubori Ward in Kosofe LGA were carried out. The ward level analysis reveal that 98% of the children received DPT 2(at 10 weeks) while similar trends were exhibited across the three slum communities; Olubori Odun-Ifa 98% while ldi Araba and Mosafejo had 100% each.
Chart 43: CHILDREN WHO RECEIVED DPT 2 VACCINE AT 10 WEEKS
CHILDREN THAT RECEIVED DPT 3 VACCINEAT 14 WEEKS DPT 3 is usually administered as third dose to children at 14 weeks after birth. In the studied Ward of Kosofe LCDA, (98%) of the under five children received DPT 3 vaccine at 14 weeks. Similar trends were exhibited across the three slum communities; Olubori Odun-Ifa 98% while ldi Araba and Mosafejo had 100% each of their under 5 years children who received DPT 3 at fourteen (14) weeks.
OLUBORI ODUNIFA
IDI ARABA MOSAFEJO KOSOFEINDICATOR
98
100 100
98
CHILDREN WHO RECEIVED DPT 2 VACCINE AT 10 WEEKS

37
Chart 44: CHILDREN THAT RECEIVED DPT 3 VACCINE AT 14 WEEKS
CHILDREN THAT RECEIVED OPV 0 AT BIRTH OR TWO (2) WEEKS AFTER BIRTH Oral Polio vaccine (OPV) or Trivalent Oral Polio Vaccine produces antibodies in the blood that prevent Polio paralysis; It is usually administered in three (3) doses starting from six (6) weeks after birth with an interval of four (4) weeks. The study sought to know children that received OPV 0 at birth or up till two weeks after birth. The indicator shows that (99%) of the sampled children received OPV 0 at birth. At Olubori Odunfa community, (98%) were immunized against Polio while children 100% each were reportedly immunized in Idi Araba and Mosafejo respectively.
OLUBORI ODUNIFA
IDI ARABA MOSAFEJO KOSOFEINDICATOR
98
100 100
98
CHILDREN THAT RECEIVED DPT 3 VACCINE AT 14 WEEKS

38
Chart 45: CHILDREN THAT RECEIVED OPV 0 AT BIRTH OR TWO (2) WEEKS AFTER BIRTH
CHILDREN THAT RECEIVED OPV 1 AT 6 WEEKS Oral Polio Vaccine (OPV) 1 consist of mixture of live attenuated polio virus strains of each of the three serotypes selected by the ability to mimic the immune response following infections with wild polioviruses but with a significant reduced incidence of spreading to the central nervous system. The second dose is usually administered to children at six (6) weeks after birth. Children that received OPV 1 at six (6) weeks in Mosafejo-Olubori Ward area in Kosofe LGA accounted for 98%. Community level disaggregation revealed that in Olubori Odunfa community,(98%) of the children received OPV 1 while those in Idi Araba and Mosafejo has a record of (100%) each.
OLUBORI ODUNIFA
IDI ARABA MOSAFEJO KOSOFEINDICATOR
98
100 100
99
CHILDREN THAT RECEIVED OPV 0 AT BIRTH OR TWO (2) WEEKS AFTER BIRTH

39
Chart 46: CHILDREN THAT RECEIVED OPV 1 AT 6 WEEKS
CHILDREN THAT RECEIVED OPV 2 AT 10 WEEKS AFTER BIRTH The third dose of OPV is usually taken at 10 weeks after birth. The survey indicated that (98%) of children in the enumerated areas received OPV 2 at 10 weeks. The empirical analysis across the sampled communities further show that Olubori Odun Ifa recorded (98%) whereas Idi Araba and Mosafejo children recorded (100%) each for children that received OPV2 at 10 weeks. Chart 47: CHILDREN THAT RECEIVED OPV 2 AT 10 WEEKS AFTER BIRTH
98
100 100
98
OLUBORI ODUN IFA IDI ARABA MOSAFEJO KOSOFE INDICATOR
CHILDREN THAT RECEIVED OPV 1 AT 6 WEEKS
OLUBORI ODUN IFA IDI ARABA MOSAFEJO KOSOFE INDICATOR
98
100 100
98
CHILDREN THAT RECEIVED OPV 2 AT 10 WEEKS AFTER BIRTH

40
CHILDREN THAT RECEIVED OPV 3 AT 14 WEEKS AFTER BIRTH The fourth dose OPV 3 is usually administered at 14 weeks. The empirical analysis across the sampled communities further showed that Olubori Odun Ifa recorded (98%) whereas Idi Araba and Mosafejo children recorded (100%). Chart 48: CHILDREN THAT RECEIVED OPV 3 AT 14 WEEKS AFTER BIRTH
IMMNUNIZATION STATUS OF CHILDREN Immunization is a cost-effective intervention which prevents suffering, disability and death. Its benefits are universal and include improvements in health, life expectancy and positive social and economic impact at the global, national and community levels. The Ward level immunization status of the children in the selected households showed that (69%) were fully immunized, (24%) partially immunized and (7%) not immunized.
Community level analysis also reveal that Idi Araba had the highest record of fully immunized children indicating (76%), followed by Olubori Odun Ifa with (72%) and (56%) recorded by Mosafejo community.
OLUBORI ODUNIFA
IDI ARABA MOSAFEJO KOSOFEINDICATOR
98
100 100
98
CHILDREN THAT RECEIVED OPV 3 AT 14 WEEKS AFTER BIRTH

41
Chart 49: IMMNUNIZATION STATUS OF CHILDREN
CHILDREN FULLY IMMUNIZED BEFORE ONE YEAR The proportion of the children that were fully immunized before attaining one year was 72%. Idi Araba recorded the highest percentage of children that were fully immunized before one year with a record of 75% followed by Olubori Odun Ifa with 74% and Mosafejo has the least record of children that were fully immunized before one year with 62%.
OLUBORI ODUN IFA
IDI ARABA
MOSAFEJO
KOSOFE INDICATOR
4
7
17
7
72
76
56
69
24
17
27
24
IMMNUNIZATION STATUS OF CHILDREN
Partially Immunized Fully Immunized Not Immunized

42
Chart 50: CHILDREN FULLY IMMUNIZED BEFORE ONE YEAR
REASONS FOR CHILDREN NOT FULLY IMMUNIZED BEFORE ONE YEAR The baseline assessment investigated the various reasons why children were not fully immunized before age (one year of age). The result showed that 18% of the respondents attributed it to long waiting time at the health facilities, 17% claimed that it was as a result of postponement until another time, 10% were unaware of need for immunization, 9% of the mother were ‘too busy’, 8% claimed that place of immunization was too far, 7% attributed non immunization of their children to the fear of side reaction, 6% each were ignorant of the need to return for second and third doses. 5% alleged that the reason was due to lack of knowledge of place or time of immunization, 4% each indicated that the time was not convenient and absence of vaccination (no vaccination) respectively. Also 3% said that it was as a result of wrong idea about contraindication and cultural/religious reasons respectively. However, 2% claimed that it was due to rumours, family problems including illness of mother respectively while 1% said it was due to absence of vaccinator and child ill-brought but not given immunization respectively.
At the community level, the result reveal that household members in Mosafejo (30%), Olubori Odun Ifa (14%) and Idi Araba (7%) indicated that it was due to the postponement. Also, respondents in Mosafejo (20%), Olubori Odun Ifa (19%), and Idi Araba (7%) declared that the reason was due to long waiting time. However, respondents in Idi Araba (15%), Olubori Odun Ifa (12%), and Mosafejo (4%) claimed that the reason was due to
OLUBORI ODUNIFA
IDI ARABA MOSAFEJO KOSOFEINDICATOR
74 75
62
72
CHILDREN FULLY IMMUNIZED BEFORE ONE YEAR

43
their being unaware of the need of immunization. Nonetheless, households in Idi Araba (16%), Mosafejo (6%) and Olubori Odun Ifa (4%) claimed that it was as a result of unaware of the need to return for second and third doses.
On the other hand, respondents in Mosafejo (11%), Olubori Odun Ifa (6%) and Idi Araba (6%) claimed that the reason was due to distance of place of immunization. Similarly, respondents in Olubori Odun Ifa (10%), Mosafejo(8%) and Idi Araba (7%) attributed the reason to the mother being too busy. Moreover, respondents in Idi Araba (9%), Olubori Odun Ifa (6%) and Mosafejo (3%) said that it was due to the place or time of immunization being unknown. Also, households in Olubori Odun Ifa (9%), Idi Araba (6%) and Mosafejo(3%) attributed the reason to fear of side reaction. In the same vein, respondents in Idi Araba (6%), Olubori Odun Ifa (3%) and Mosafejo (2%) asserted it was due to cultural/religious reasons. Respondents in Idi Araba (5%), Mosafejo(5%) and Olubori Odun Ifa (3%) claimed that it was due to unavailability of vaccines. Furthermore, respondents in Olubori Odun Ifa (5%), Idi Araba (2%) and Mosafejo (2%) believed that the reason was due to the time of immunization not being convenient. Nonetheless, households in Idi Araba (5%), Olubori Odun Ifa (3%) Mosafejo (1%) asserted that it was due to contradictory perception about immunization while respondents in Idi Araba (7%) and Olubori Odun Ifa (2%) indicated that the reason is due to rumours while Mosafejo(0%) was not in support of such claim. Correspondingly, households in Mosafejo (4%), Olubori Odun Ifa (2%) and Idi Araba (1%) affirmed that the reason was as a result of family problems including illness of mother, whereas household members in Olubori Odun Ifa (2%), Idi Araba (2%) and Mosafejo(1%) declared that the reason for not being immunized was due to their child being ill when they were taken to the clinic. In the same way, 1% of the respondents in each of Olubori Odun Ifa, Idi Araba and Mosafejo alleged that it was due to absent of Vaccinator

44
Chart 51: REASONS FOR CHILDREN NOT FULLY IMMUNIZED BEFORE ONE YEAR OF AGE
CHILDREN WHO EXPERIENCED ANY ILLNESS IN THE HOUSEHOLD IN THE LAST THREE MONTHS The Survey also examined the morbidity status of the children in Olubori Odun Ifa, Idi Araba and Mosafejo communities with regards to illness in the last three months. The analysis revealed that 41% of the respondents affirmed that their children had experienced some illness in the last three months in Olubori-Odun -Ifa community, 38% of them in Idi-Araba and 34% in Mosafejo communities respectively. This implied that one (1) out of every three (3) children in Mosafejo-Olubori Ward experienced one form of illness or the other in the last three months.
0% 10% 20% 30% 40% 50% 60% 70% 80% 90% 100%
Unaware of need for immunization
Unaware of need to return for 2nd and 3rd dose
Place or time of immunization unknown
Fear of side reaction
Wrong idea about contraindication
Postponed until another time
Cultural/ religious reasons
Rumours
Place of immunization too far
Inconvenient in the time of immunization
Absent of vaccinator
No vaccination
Mother too busy
Family problem including illness of mother
Child ill brought but not given immunization
Long waiting time
12
4
6
9
3
14
3
2
6
5
1
3
10
2
2
19
15
16
9
6
5
7
6
7
6
2
1
5
7
1
2
7
4
6
3
3
1
30
2
11
2
1
5
8
4
1
20
REASONS FOR CHILDREN NOT FULLY IMMUNIZED BEFORE ONE YEAR OF AGE
OLUBORI ODUN IFA IDIARABA MOSAFEJO

45
Chart 52: PROPORTION OF CHILDREN WHO EXPERIENCED ANY ILLNESS IN THE HOUSEHOLD IN THE LAST THREE MONTHS
NATURE OF ILLNESS EXPERIENCED BY CHILDREN IN THE LAST THREE MONTHS The survey also tried to determine the nature of illness experienced by children in the preceding three months. In the Survey, the result showed that 42% had malaria fever, 21% had cold/catarrh/cough, 8% suffered from stomach ache, 7% each suffered from Typhoid Fever and skin disorder respectively. 3% had diarrhea, 2% each had Yellow Fever and Dysentry respectively, 1% each had acute respiratory infection (ARI), Migraine, Sickle c
Cell Anemia, Hepatitis, Guinea Worm infection and Cholera respectively. No child had Diabetes, Hypertension, Epilepsy and Pneumonia.
Disaggregation across the community disclosed that respondents in Idi Araba (47%), Olubori Odun Ifa (43%) and Mosafejo (37%) affirmed that their children had Malaria Fever in three months preceding the Survey. Moreover, respondents in Olubori Odun Ifa (22%), Idi Araba (19%) and Mosafejo (18%) stated that their children suffered from cold/cough/catarrh within this period. However, respondents in Mosafejo (10%) , Idi Araba
OLUBORI ODUN IFA IDIARABA MOSAFEJO
41 38
34
PROPORTION OF CHILDREN WHO EXPERIENCED ANY ILLNESS IN THE HOUSEHOLD IN THE LAST THREE MONTHS

46
(9%) and Olubori Odun Ifa (6%) claimed that their children experienced typhoid fever in the three months preceding the Study. Furthermore, households in Mosafejo (10%), Olubori Odun Ifa (8%) and Idi Araba (7%) declared that their children had Stomach Ache. Similarly, respondents in Mosafejo (13%), Olubori Odun Ifa (5%) and Idi Araba (2%) asserted that their wards experienced skin disorder while respondents in Idi Araba (6%), Olubori Odun Ifa (3%) and Mosafejo (1%) alleged that their children had Diarrhea . Nonetheless, respondents in Mosafejo (3%), Olubori Odun Ifa (2%) and Idi Araba (1%) said that their children experienced yellow fever. Also, respondents in Idi Araba (3%), Olubori Odun Ifa (1%) and Mosafejo (1%) recorded low proportion of incidence of Acute Respiratory Infection. Similarly, respondents in Idi Araba (3%) and Mosafejo (1%) recorded low percentage of incidence of Guinea Worm infection whereas households in Olubori Odun Ifa (2%), Idi Araba (1%) and Mosafejo (1%) recorded low proportion of incidence of Dysentery .
Chart 53: NATURE OF ILLNESS EXPERIENCED BY CHILDREN IN THE LAST THREE MONTHS
Malaria fever
Typhoid fever
Acute Respiratory Infection (ARI)
Cold/catarrh/cough
Yellow fever
Migraine
Diabetes
Hypertension
Sickle cell Anemia
Hepatitis
Guinea worm infection
Skin disorder
Cholera
Dysentary
Stomach ache
Epilepsy
Diarrhea
Pneumonia
43
6
1
22
2
1
0
0
1
1
0
5
1
2
8
0
3
1
47
9
3
19
1
0
0
0
1
0
3
2
0
1
7
0
6
0
37
10
1
18
3
1
0
1
1
0
1
13
0
1
10
1
1
0
NATURE OF ILLNESS EXPERIENCED BY CHILDREN IN THE LAST THREE MONTHS
OLUBORI ODUN IFA IDIARABA MOSAFEJO

47
FACILITIES WHERE HOUSEHOLDS GO TO TREAT CHILDREN WITH MALARIA, COUGH, PNEUMONIA AND DIARRHEA In the treatment of any disease medical practitioners should be consulted. Some people have formed the habit of practising self medication when any disease or illness is suspected. In this survey, the residents in Olubori Odun Ifa, Idi Araba and Mosafejo communities in Kosofe Local Government Area were asked where they sought treatment for their children when they have malaria, cough, pneumonia and diarrhea. The result disclosed that almost half (48%) of the sampled households in the Area reportedly sought of these diseases in a Public Hospital /Health Centre. 21% sought treatment from Private Hospital, 14% visited Chemist Shop, 10% sought treatment through self medication while 7% obtained treatment through Traditional Medicine for their children. Looking at the survey result from community level, household members in Olubori Odun Ifa (52%), Idi Araba (49%) and and Mosafejo (33%) sought treatment from Public Hospital/Health Centre. Similarly, respondents in Olubori Odun Ifa (24%), Mosafejo (18%) and Idi Araba (13%) claimed that they sought treatment from Private Hospital. More so, 26%, 17% and 10% sampled households in Mosafejo, Idi Araba and Olubori Odun Ifa respectively visited Chemist Shop for treatment. However, 17%, 9% and 4% of the respondents in Mosafejo, Idi Araba and Olubori Odun Ifa respectively sought treatment through Traditional Medicine. Nonetheless, 13%, 10% and 6% of the sampled household members in Idi Araba, Olubori Odun Ifa and Mosafejo respectively sought treatment through Self Medication.

48
Chart 54: FACILITIES WHERE HOUSEHOLD GO TO TREAT CHILDREN WITH MALARIA, COUGH, PNEUMONIA AND DIARRHEA
WAYS TO PREVENT AND CONTROL MALARIA Malaria is a serious disease that causes high fever and chills. A person can contract it from the bite of an infected mosquito. In very rare cases, people can contract malaria if they come into contact with infected blood. A developing fetus may get the disease from its mother. The baseline assessment survey therefore attempted to determine whether the residents of Olubori Odun Ifa, Idi Araba and Mosafejo communities in Kosofe Local Government Area have knowledge of how to prevent and control malaria. At the Local Government level, the findings revealed that 32% of the sampled household members affirmed that malaria can be prevented and controlled by sleeping in Insecticide Treated Net (ITN), 21% indicated that the disease can be prevented and controlled through Indoor Residual Spraying , 15% believed that the disease can be prevented and controlled by clearing the surroundings, 14% affirmed that it can be prevented and controlled by using mosquito coil while 9% each declared that malaria can be prevented and controlled by using prescribed drugs and wearing long sleeved dresses respectively.
PublicHospital/Health
Centre
Traditional medicine Self medication Chemist Shop Private Hospital
52 4
10 10
24
49
9
13
17
13
33 17
6 26 18
48 7 10 14 21
FACILITIES WHERE HOUSEHOLD GO TO TREAT CHILDREN WITH MALARIA, COUGH, PNEUMONIA AND DIARRHEA
OLUBORI ODUN IFA IDI ARABA MOSAFEJO KOSOFE INDICATOR

49
At the community level, respondents in Olubori Odun Ifa (33%), Idi Araba (33%) and Mosafejo (30%) recorded higher percentage of sleeping in Insecticide Treated Net as a method of preventing and controlling malaria. However, household members in Olubori Odun Ifa (22%), Idi Araba (20%) and Mosafejo (20%) claimed that they were aware of the prevention of malaria through Indoor Residual Spraying. Similarly, respondents in Olubori Odun Ifa (16%), Mosafejo (13%) and Idi Araba (11%) affirmed that malaria can be prevented by clearing the surroundings. Moreover, households in Olubori Odun Ifa (14%), Mosafejo (14%) and Idi Araba (12%) affirmed that malaria can be prevented and controlled by using mosquito coil. Nonetheless, respondents in Idi Araba (14%), Mosafejo (13%) and Olubori Odun Ifa (6%) believed that the disease can be prevented and controlled by wearing long sleeved dresses. Chart 55: WAYS TO PREVENT AND CONTROL MALARIA
HOUSEHOLDS THAT HAVE INSECTICIDE TREATED NETS One of the ways to prevent and control malaria is the use of Insecticide Treated Net. The Government and Non-Governmental Organizations have intensified efforts to prevent and control malaria in the State through distribution of Insecticide Treated Nets to the citizenry.
Sleep insideInsecticide
Treated Net (ITN).
Wearing longsleeves.
Indoor ResidualSpraying
Using prescribeddrugs
Using mosquitocoil.
Clearing thesurroundings
33 6
22 9 14 16
33 14
20 9 12 11
30 13 20 9 14 13
32 9 21 9 14 15
WAYS TO PREVENT AND CONTROL MALARIA
OLUBORI ODUN IFA IDI ARABA MOSAFEJO KOSOFE INDICATOR

50
This survey attempted to verify whether the residents of Olubori Odun Ifa, Idi Araba and Mosafejo communities in Kosofe Local Government Area have any Insecticide Treated Net. The Ward analysis revealed that 63% of the sampled households reportedly have Insecticide Treated Nets. Further analysis on community basis showed that households in Olubori Odun Ifa (68%) recorded the highest percentage of the respondents who have or possessed Insecticide Treated Nets followed by Idi Araba residents which account for 63% while Mosafejo (49%) residents recorded the lowest percentage of the households who claimed to have Insecticide Treated Nets. Chart 56: PERCENTAGE DISTRIBUTION OF HOUSEHOLDS WHO HAVE INSECTICIDE TREATED NETS
HOW HOUSEHOLDS OBTAINED INSECTICIDE TREATED NETS The survey also tried to find out the source of the Insecticide Treated Nets (ITN) possessed by the residents of Olubori Odun Ifa, Idi Araba and Mosafejo communities. The finding of this Survey across this area revealed a large percentage (72%) of the households who use Insecticide Treated Net declared that the nets were given free by Government, 21% disclosed that the Insecticide Treated Nets were procured while 7% affirmed that the nets were given free by NGOs.
At the community level, a greater percentage of respondents in Mosafejo (77%), Idi Araba (74%) and Olubori Odun Ifa (71%) strongly affirmed that the nets were given free by Government. Similarly, 23%, 22% and 13% of households in Idi Araba, Olubori Odun Ifa
OLUBORI ODUNIFA
IDI ARABA MOSAFEJO KOSOFEINDICATOR
68 63 49
63
PERCENTAGE DISTRIBUTION OF HOUSEHOLDS THAT HAVE INSECTICIDE TREATED NETS

51
and Mosafejo respectively disclosed that the nets were procured. However, 10%, 8% and 4% of respondents in Mosafejo, Olubori Odun Ifa and Idi Araba respectively stated that the nets were given free by NGOs. Chart 57: HOW HOUSEHOLDS OBTAINED INSECTICIDE TREATED NETS
PERIOD WHEN HOUSEHOLDS OBTAINED TREATED NETS The survey further investigated how long the dwellers of Olubori Odun Ifa, Idi Araba and Mosafejo communities in Kosofe Local Government Area had procured the nets being used. The result showed that 22% had obtained the nets 6 – 12 months earlier, 21% claimed that the nets were obtained 12 – 24 months earlier, 18% affirmed that they got the nets 36 - 52 months (3 - 5 years) before the Survey, 16% alleged that they could not remember the period, 12% got the net less than 6 months before the Survey while 1% and 10% declared that the nets being used were procured over 5 years earlier and between 24 – 36 months before the Survey respectively. Further analysis across the communities disclosed that 25%, 22% and 15% of respondents in Idi Araba, Olubori Odun Ifa and Mosafejo respectively got their nets 12 – 24 months before the Study. Nonetheless, 22%, 21% and 20% of sampled household members in
OLUBORI ODUN IFA IDI ARABA MOSAFEJO KOSOFE INDICATOR
22 23 13 21
71 74 77
72
8 4 10 7
HOW HOUSEHOLDS OBTAINED INSECTICIDE TREATED NETS
Procured Freely given by Government Freely given by NGOs

52
Olubori Odun Ifa, Mosafejo and Idi Araba respectively indicated that the nets were obtained 6 – 12 months earlier. Similarly, 23%, 17% and 5% of respondents in Mosafejo, Olubori Odun Ifa and Idi Araba respectively alleged that they could not remember the period the nets were procured. Moreover, 21%, 18% and 12% of respondents in Idi Araba, Olubori Odun Ifa and Mosafejo respectively obtained the nets 36 – 52 months (3- 5 years) before the Study whereas 19%, 15% and 10% of household members in Mosafejo, Idi Araba and Odun Ifa respectively stated that the nets were obtained less than 6 months before the Study. More so, 10% each of the respondents in Olubori Odun Ifa, Idi Araba and Mosafejo respectively claimed to have acquired the nets 24 – 36 months before the Study. On the other hand 4% and 1% of respondents in Idi Araba and Olubori Odun Ifa got the nets over 5 years earlier whereas respondents in Mosafejo were to the contrary. Chart 58: PERIOD WHEN HOUSEHOLD OBTAINED TREATED NETS
PERIOD WHEN HOUSEHOLD OBTAINED TREATED NETS GIVEN FREE BY GOVERNMENT The survey also further determined how long the residents of the communities had obtained the Insecticide Treated Nets given free by Government. The result across the communities disclosed that 23% had obtained the nets 12 – 24 months before the Study, 21% claimed that the nets were obtained 6 – 12 months earlier, 19% alleged that they could not remember when they obtained treated nets, 17% affirmed that the nets were obtained 36 – 52 months (3 – 5 years) ago, 10% got theirs 24 – 36 months before the
Less than 6Months
6 - 12 Months 12 - 24Months
24 - 36Months
36 - 52Months ( 3 - 5
years)
Greater than5 years
Can'tremember
10 22 22 10 18 1
17
15 20 25 10 21
4
5
19 21 15 10 12
0
23
12 22 21 10 18 1 16
PERIOD WHEN HOUSEHOLDS OBTAINED TREATED NETS
OLUBORI ODUN IFA IDI ARABA MOSAFEJO KOSOFE INDICATOR

53
Study while 1% and 7% declared that the nets being used were obtained over 5 years and less than 6 months earlier respectively. Further analysis across the communities disclosed that 28%, 25% and 19% of respondents in Mosafejo, Idi Araba and Olubori Odun Ifa respectively got their nets 6 – 12 months before the Study. Nonetheless, 26%, 23% and 15% of sampled household members in Olubori Odun Ifa, Idi Araba and Mosafejo respectively indicated that the nets were obtained 12 – 24 months before the Study. Similarly, 23%, 22% and 6% of respondents in Mosafejo, Olubori Odun Ifa and Idi Araba respectively alleged that they could not remember the period the nets were obtained. 21%, 17% and 15% of respondents in Idi Araba, Olubori Odun Ifa and Mosafejo respectively obtained the nets 36 – 52 months (3- 5 years) before the Study whereas 11%, 10% and 6% of household members in Idi Araba, Mosafejo, and Odun Ifa respectively stated that the nets were possessed less than 6 months before the Study. More so, 10%, 10% and 9% of respondents in Olubori Odun Ifa, Idi Araba and Mosafejo respectively claimed to have acquired the nets 24 – 36 months earlier. On the other hand 4% of respondents in Idi Araba got the nets over 5 years before the Study whereas 1% of respondents in Olubori Odun Ifa and Mosafejo obtained their nets also over 5 years ago. Chart 59: WHEN HOUSEHOLD OBTAINED TREATED NETS GIVEN FREE BY GOVERNMENT
6 19 26 10 17
1 22
11 25 23
10 21 4 6
10 28 15 9 15
1
23
7 21 23 10 17 1 19
Less than 6 Months 6 - 12 Months 12 - 24 Months 24 - 36 Months 36 - 52 Months ( 3- 5 years)
Greater than 5years
Can't remember
WHEN HOUSEHOLD OBTAINED TREATED NETS GIVEN FREE BY GOVERNMENT
OLUBORI ODUN IFA IDI ARABA MOSAFEJO KOSOFE INDICATOR

54
PERIOD WHEN HOUSEHOLD OBTAINED TREATED NETS GIVEN FREE BY NON GOVERNMENTAL ORGANISATIONS (NGOs) The survey was also designed to find out how long the inhabitants of the communities had obtained the Insecticide Treated Nets given free by Non Governmental Organizations (NGOs). The result across Kosofe Local Government Area revealed that 65% declared that they could not remember the period the net was given, 9% claimed that the nets were obtained 12 – 24 months before the Study, 8% affirmed that they received the net 6 – 12 months before the Study, 6% disclosed that the nets were obtained less than 6 months before the Study, 5% got the net 36 – 52 months ( 3 – 5 years) and over 5 years before the Study respectively while 3% declared that the nets being used were received 24 - 36 months before the Study. Breaking down the findings to community level, it was discovered that 71%, 50% and 47% of respondents in Olubori Odun Ifa, Mosafejo and Idi Araba respectively could not remember when the nets were obtained. However, 15%, 9% and 3% of sampled household members in Mosafejo, Idi Araba and respectively affirmed that the nets were obtained less than 6 months before the Study. Nonetheless, 14%, 13% and 6% of respondents in Mosafejo, Idi Araba and Odun Ifa respectively indicated that they received the net 6 – 12 months before the Study. Similarly, 12%, 8% and 8% of respondents in Idi Araba, Olubori Odun Ifa and Mosafejo respectively obtained the nets 12 – 24 months before the Survey. Moreover, 10%, 8% and 3% of household members in Idi Araba, Mosafejo, and Odun Ifa respectively claimed that the nets were obtained 36 – 52 months (3 –5 years) earlier. On the other hand, 6%, 4% and 1% of respondents in Olubori Odun Ifa, Idi Araba and Mosafejo respectively declared to have acquired the nets over 5 years ago whereas 5%, 4% and 3% of respondents in Mosafejo, Idi Araba and Olubori Odun Ifa got the nets 24 – 36 months before the Survey.

55
Chart 60: PERIOD WHEN HOUSEHOLD OBTAINED TREATED NETS GIVEN FREE BY NON GOVERNMENTAL ORGANISATIONS
RESPONDENTS WHO SLEPT IN THE NET LAST NIGHT The analysis revealed across these communities those who slept in the Insecticide Treated Net last night that 29% of the sampled household members indicated that it was everybody that slept in the net, 26% affirmed that it was children under five years, 12% and 18% claimed that it was parents respectively, 10% affirmed that no one slept in the net last night while 7% declared that it was children over five years. At the community level, it was revealed that respondents in Olubori Odun Ifa (31%), Idi Araba (28%) and Mosafejo (20%) affirmed that everybody slept in the net. Also, sampled household members in Mosafejo (27%), Odun Ifa (26%) and Idi Araba (22%) indicated that only under five years children slept in the net while respondents in Mosafejo (23%), Idi Araba (20%) and Odun Ifa (16%) reported that only the mother slept in the net. Similarly, households in Mosafejo (16%), Olubori Odun Ifa (11%) and Idi Araba (11%) declared that only the father slept in the net whereas respondents in Idi Araba (12%), Olubori Odun Ifa (10%) and Mosafejo (7%) claimed that none slept in the net. Furthermore, household members in Mosafejo (8%), Olubori Odun Ifa (7%) and Idi Araba (7%) reportedly indicated that only over five years children slept in the net the preceding night.
Less than 6Months
6 - 12 Months 12 - 24 Months 24 - 36 Months 36 - 52 Months( 3 - 5 years)
Greater than 5years
Can'tremember
3 6 8 3 3
6 71 9
14 12
4 10
4 47
15 13 8 5 8 1 50
6 8 9 3 5 5 65
PERIOD WHEN HOUSEHOLD OBTAINED TREATED NETS GIVEN FREE BY NON GOVERNMENTAL ORGANISATIONS (NGOs)
OLUBORI ODUN IFA IDI ARABA MOSAFEJO KOSOFE INDICATOR

56
Chart 61: RESPONDENTS WHO SLEPT IN THE NET LAST NIGHT
HOUSEHOLD AWARENESS OF GOVERNMENT PROVISION OF FREE INSECTICIDE TREATED MOSQUITO NETS In the attempt of the Lagos State Government to combat malaria as stated in goal six of the Millennium Development Goals (MDG), Insecticide Treated Mosquito Nets were provided and distributed free to the residents of the State. This survey also sought to investigate whether the dwellers of Olubori Odun Ifa, Idi Araba and Mosafejo communities in Kosofe Local Government Area were aware of Government free provision of Insecticide Treated Mosquito Nets.
The finding of the survey across Kosofe LG revealed that majority (82%) of the sampled household members affirmed that they were aware of Government’s provision of free Insecticide Treated Mosquito Nets while only 18% alleged that they were not aware.
At the community level, respondents in Olubori Odun Ifa (87%), Idi Araba (72%) and Mosafejo (72%) strongly affirmed that they were aware of Government provision of free Insecticide Treated Mosquito Nets.
Father Mother Children underfive
Children overfive
Everyone Nobody
11 16 26 7 31 10
11 20 22 7 28 12
16 23 27 8 20 7
12 18 26 7 29 10
RESPONDENTS WHO SLEPT IN THE NET LAST NIGHT
OLUBORI ODUN IFA IDI ARABA MOSAFEJO KOSOFE INDICATOR

57
Chart 62: HOUSEHOLD AWARENESS OF GOVERNMENT PROVISION OF FEEE INSECTICIDE TREATED MOSQUITO NETS
RESPONDENTS WHO BENEFITTED FROM THE FREE INSECTICIDE TREATED MOSQUITO NETS The survey further determined whether the residents of these communities benefited from the free Insecticide Treated Mosquito Nets. Across Kosofe Local Government Area. The result showed that only 59% of the household members claimed that they had benefitted from the free Insecticide Treated Mosquito Nets while the remaining 41% were to the contrary.
Disaggregating the results to the community level, respondents in Olubori Odun Ifa (62%), Idi Araba (57%) and Mosafejo (50%) affirmed that they had benefitted from the free Insecticide Treated Mosquito Nets.
OLUBORI ODUNIFA
IDI ARABA MOSAFEJO KOSOFEINDICATOR
87
72 72 82
HOUSEHOLD AWARENESS OF GOVERNMENT PROVISION OF FREE INSECTICIDE TREATED MOSQUITO NETS

58
Chart 63: RESPONDENTS WHO BENEFITTED FROM THE FREE INSECTICIDE TREATED MOSQUITO NETS
HOUSEHOLD MEMBERS WHO RECEIVED ANTI-MALARIA DRUGS FOR PREVENTION OF MALARIA IN THEIR LAST OR INDEX PREGNANCY
Anti-malaria medication is used both to treat and prevent malaria. The type and duration of drug(s) depend on the type of malaria, its severity and if the patient is pregnant. The pregnant woman is expected to receive Sulphadoxine Pyrimethamine (SPs) to prevent malaria during pregnancy.
The survey analysis revealed that majority (76%) of the sampled household members across these three communities in Kosofe Local Government Area declared that they received Anti-Malaria drugs for prevention of Malaria in their last or index pregnancy while a smaller proportion (24%) disclosed that they did not receive any Anti-malaria drugs in their last or index pregnancy.
OLUBORI ODUNIFA
IDI ARABA MOSAFEJO KOSOFEINDICATOR
62 57
50
59
RESPONDENTS WHO BENEFITTED FROM THE FREE INSECTICIDE TREATED MOSQUITO NETS

59
Disaggregation of the results (according to the community) showed that households in Olubori Odun Ifa (78%), Mosafejo (76%) and Idi Araba (69%) strongly affirmed that they received Anti-Malaria drugs in their last or index pregnancy. Chart 64: HOUSEHOLD MEMBERS WHO RECEIVED ANTI-MALARIA DRUGS FOR PREVENTION IN THEIR LAST OR INDEX PREGNANCY
DOSES OF ANTI-MALARIA DRUGS RECEIVED BY HOUSEHOLDS AT THEIR LAST OR INDEX PREGNANCY For the prevention of malaria during pregnancy, a required number of doses of anti-malaria drugs such as Sulphadoxine Pyrimethamine (SPs) must be received by pregnant women. Therefore, further analysis of the survey across Kosofe Local Government Area showed that 58% of the sampled household members in these communities received two (2) doses of SPs in their last or index pregnancy while 42% claimed to have received 3 doses of SPs. Looking at the results of the survey at the community level, more than half of the respondents in Olubori Odun Ifa (58%), Mosafejo (58%) and Idi Araba (56%) declared that 2 doses of SPs was received at their last or index pregnancy whereas a small proportion of respondents in Idi Araba (44%), Olubori Odun Ifa (42%) and Mosafejo (42%) stated that 3 doses of SPs were received.
78
69
76 76
OLUBORI ODUN IFA IDI ARABA MOSAFEJO KOSOFE INDICATOR
HOUSEHOLD MEMBERS WHO RECEIVED ANY ANTI-MALARIA DRUGS FOR PREVENTION OF MALARIA IN THEIR LAST OR INDEX PREGNANCY

60
Chart 65: DOSES OF ANTI-MALARIA DRUGS RECEIVED BY HOUSEHOLDS AT THEIR LAST OR INDEX PREGNANCY
HOUSEHOLD MEMBERS WHO SUFFERED FROM MALARIA FEVER IN THE LAST 12 MONTHS The survey also tried to find out the household members who had malaria fever in Olubori Odun Ifa, Idi Araba and Mosafejo communities in Kosofe Local Government Area in the preceding 12 months. The findings showed that only 56% of the sampled households across the Local Government had Malaria fever while the remaining 44% alleged that no member of their households had Malaria fever in the preceding 12 months. The breakdown at community level revealed that more than half of the sampled household members in Olubori Odun Ifa (57%), Idi Araba (57%) and Mosafejo (56%) declared that members of their household had malaria fever in the preceding 12 months.
OLUBORI ODUNIFA
IDI ARABA MOSAFEJO KOSOFEINDICATOR
58 56 58 58
42 44 42 42
DOSES OF ANTI-MALARIA DRUGS RECEIVED BY HOUSEHOLDS AT THEIR LAST OR INDEX PREGNANCY
2 doses of SPs 3 doses of SPs

61
Chart 66: HOUSEHOLD MEMBERS WHO SUFFERED FROM MALARIA FEVER IN THE LAST 12 MONTHS
NUMBER OF RESPONDENTS WHO SUFFERED FROM MALARIA FEVER IN THE LAST 12 MONTHS The survey also tried to determine the number of household members who had Malaria fever in the three communities. The results showed a total of 1,655 household members in the studied Ward who reportedly had malaria fever in the preceding 12 months. At the community level, the households in Olubori Odun Ifa recorded the highest with 1,047 Malaria fever cases, followed by households in Mosafejo which accounted for 354 malaria cases while Idi Araba community recorded 254 cases of household members who had malaria fever.
OLUBORI ODUNIFA
IDI ARABA MOSAFEJO KOSOFEINDICATOR
57 57
56
56
HOUSEHOLD MEMBERS WHO SUFFERED FROM MALARIA FEVER IN THE LAST 12 MONTHS

62
Chart 67: NUMBER OF RESPONDENTS WHO SUFFERED FROM MALARIA FEVER IN THE LAST 12 MONTHS
SIGNS AND SYMPTOMS OF MALARIA The survey also tried to investigate the household members’ awareness or knowledge of various signs and symptoms of malaria fever. The Ward level result showed that 25% of the household members knew that high body temperature/fever is a symptom of malaria, 19% were aware that headache is a symptom of malaria, 15% knew that vomiting is symptom. Similarly, 14% each claimed that body pains and loss of energy are symptoms of malaria respectively while 13% of the respondents are aware that loss of appetite is a symptom of the disease. At the community level, respondents in Olubori Odun Ifa (26%), Idi Araba (25%) and Mosafejo (22%) indicated high body temperate/fever as a symptom of malaria. In addition, household members in Idi Araba (20%) and Mosafejo (20%) and Olubori Odun Ifa (19%) signified headache as a symptom of malaria. However, 20%, 18% and 12% of the households in Mosafejo, Idi Araba and Olubori Odun Ifa respectively stated that vomiting is a symptom of malaria respectively. On the other hand, 16%, 11% and 11% respondents in Olubori Odun Ifa, Idi Araba and Mosafejo respectively declared that loss of energy is a symptom. Similarly, 14% of respondents each in Olubori Odun Ifa, Idi Araba and Mosafejo acknowledged that body pains is a symptom of malaria while 13%, 13% 12% of the
1047
254 354
1655
OLUBORI ODUN IFA IDI ARABA MOSAFEJO KOSOFE INDICATOR
NUMBER OF RESPONDENTS WHO SUFFERED FROM MALARIA FEVER IN THE LAST 12 MONTHS

63
household members in Olubori Odun Ifa, Idi Araba and Mosafejo signified that loss of appetite is a symptom of malaria. Chart 68: PERCENTAGE DISTRIBUTION OF AWARENESS OF HOUSEHOLD MEMBERS ON SIGNS AND SYMPTOMS OF MALARIA
PLACE WHERE RESPONDENTS WENT FIRST FOR TREATMENT WHEN THEY SUSPECTED MALARIA Medical practitioners should be consulted for the treatment of malaria fever. Some people have formed the habit of applying self medication when they suspected malaria. In this survey, household members in Olubori Odun Ifa, Idi Araba and Mosafejo communities in Kosofe Local Government were asked where they first sought treatment when they suspected malaria fever. The finding of this survey at the Local Government level revealed that 40% of the sampled respondents in these communities sought treatment of malaria at the Chemist, 23% sought treatment through Self Medication (No where), 21% sought treatment at a Health Centre, only 14% sought treatment at Public Hospital while 2% visited Traditional herbalists to obtain treatment for suspected malaria.
High bodytemperature /
Fever
Vomiting Body pains Loss of appetite Headaches. Loss of energy
26 12 14 13 19 16
25 18
14 13 20 11
22 20 14 12 20 11
25 15 14 13 19 14
PERCENTAGE DISTRIBUTION OF AWARENESS OF HOUSEHOLD MEMBERS ON SIGNS AND SYMPTOMS OF MALARIA
OLUBORI ODUN IFA IDI ARABA MOSAFEJO KOSOFE INDICATOR

64
At the community level, 59%, 52% and 31% of the household members in Mosafejo, Idi Araba and Olubori Odun Ifa respectively sought treatment at the Chemist whereas 25%, 23% and 18% of the respondents in Olubori Odun Ifa, Idi Araba and Mosafejo respectively sought treatment of malaria through Self Medication. On the other hand, 26%, 14% and 10% of these respondents in Olubori Odun Ifa, Idi Araba and Mosafejo respectively visited Health Centre for the treatment of malaria whereas 16%, 10% and 9% of the sampled households in Olubori Odun Ifa, Idi Araba and Mosafejo respectively sought treatment at Public Hospitals. Moreover, 4%, 2% and 1% of respondents in Mosafejo, Olubori Odun Ifa and Idi Araba respectively visited Traditional herbalist for treatment of malaria. Chart 69: PLACES WHERE RESPONDENTS WENT FIRST FOR TREATMENT WHEN THEY SUSPECTED MALARIA
HOUSEHOLDS THAT UNDERGO MALARIA TEST BEFORE COMMENCEMENT OF TREATMENT In order to ensure an effective treatment of malaria, it is expected that a series of test be undertaken before the treatment and this will enable the doctor to quickly prescribe the right treatment and medicine.
The Ward level analysis revealed that 35% of the sampled respondents, irrespective of their communities, carried out (blood) test before the treatment of Malaria. Households in
Self medication(no where)
Chemist Health Centre Public Hospital Traditionalherbalist
25 31
26 16 2
23 52
14 10
1
18 59 10 9 4
23 40 21 14 2
PLACES RESPONDENTS WENT FIRST FOR TREATMENT WHEN THEY SUSPECTED MALARIA
OLUBORI ODUN IFA IDI ARABA MOSAFEJO KOSOFE INDICATOR

65
Olubori Odun Ifa community with 37% recorded the highest, followed by Mosafejo 32% and Idi Araba 29%.
Chart 70: HOUSEHOLDS THAT UNDERGO MALARIA TEST BEFORE COMMENCEMENT OF TREATMENT
TYPES OF DRUGS USED FOR TREATMENT OF MALARIA FOR ADULT Drugs are always prescribed for adults in treating malaria parasite. Most of these drugs that are used by adult vary greatly in usage in accordance with their body systems and reactions. The types of drugs that are commonly used by adult in the treatment of malaria are as follows: Artemisinin Combination Therapy (24%), Paracetamol (24%),SPs: Fansidar; Amalar (23%), Chloroquine (18%),and Herbs (11%).
The analysis revealed that Mosafejo community (29%) had the highest proportion of respondents that use Artemisinin Combination Therapy for the treatment of malaria, followed by Olubori-Odunifa and Idi Araba each having 23%.
The community that uses more of SPs is Olubori/ OdunIfa with 26% while Mosafejo and Idi Araba had 20% and 18% respectively.
Chloroquine is mostly used in Mosafejo (29%) and Paracetamol in Olubori/ OdunIfa (25%).
OLUBORI ODUN IFA
IDI ARABA
MOSAFEJO
KOSOFE INDICATOR
37
29
32
35
HOUSEHOLDS THAT UNDERGO MALARIA TEST BEFORE COMMENCEMENT OF TREATMENT

66
Chart 71: TYPES OF DRUGS USED FOR THE TREATMENT OF MALARIA FOR ADULT
COMMUNITY WITH PUBLIC HEALTH CENTRE One of the basic facilities that must be established in the community for the development of a sustainable health care system is an efficient Public Hospital/Health Centre. The Ward level analysis revealed that 69% of the respondents confirmed the availability of Public Hospital/ Primary Health Centre within the studied Ward. However, community level disaggregation showed that Olubori Odun Ifa(80%) recorded the highest proportion of respondents who confirmed the existence of health facilities within the community, followed by Idi Araba(54%) and Mosafejo(50%).
OLUBORI ODUNIFA
IDI ARABA MOSAFEJO KOSOFEINDICATOR
23 29 23 24
14 23 29 18
25 24 19
24
26 15 20 23
11 10 9 11
TYPES OF DRUGS USED FOR THE TREATMENT OF MALARIA FOR ADULT
Artemisinin Combination Therapy (ACT) Choroquine
Paracetamol SPs: Fansidar, Amalar etc
Herbs

67
Chart 72: COMMUNITY WITH PUBLIC HEALTH CENTRE
DISTANCE OF PUBLIC HEALTH FACILITY TO DWELLING One of the objectives of the authority in the local government is to ensure nearness of health facilities to the people for easy access. Location of health Centre within 5km radius or walking distance especially in hard-to-reach areas in order to reduce disparity in access between the LGAs. The distance an individual has to travel to access health care services usually has a bearing on one’s preference of the type of health care source utilized. The survey result showed that 55% of the respondent confirmed a distance of less than 1 km to their place of health facility, 31% of them covered a distance of 1-5 km while the remaining 14% will cover more than 5km before reaching the Public Health Facility.
Community level analysis showed that 63% of respondents in Olubori Odun Ifa, 36% in Mosafejo(36%) and 25% in Idi Araba communities reportedly covered a distance less than 1 km to reach their health facilities. On the contrary, those who go too far a distance of more than 5 km before accessing public Health Facility were noticeable in Idi Araba(24%) and Mosafejo(14%).
OLUBORI ODUN IFA
IDI ARABA
MOSAFEJO
KOSOFE INDICATOR
80
46
50
69
COMMUNITY WITH PUBLIC HEALTH CENTRE

68
Chart 73: DISTANCE OF PUBLIC HEALTH FACILITY TO DWELLING
PREFERENCE FOR HEALTH CARE CENTRE IN THE COMMUNITY Ensuring availability of health facilities within communities should be an essential strategy used by government at bringing health care closer to the masses. The responses sought from the people on whether having quick access to health care in the community will make a difference and improve their health condition showed that most of the populace(83%) responded to the fact that an established health center in their community will make significant difference in the kind of health care they received.
The preference for whether the location of health center in the community will bring the desire benefits to the people was greatly revealed in the following Communities: Olubori Odun Ifa(88%),Mosafejo(77%) and Idi Araba(72%).
Chart 74: PREFERENCE FOR HEALTH CARE CENTRE IN THE COMMUNITY
OLUBORI ODUN IFA
IDI ARABA
MOSAFEJO
KOSOFE INDICATOR
63
25
36
55
24
51
51
31
13
24
14
14
DISTANCE OF PUBLIC HEALTH FACILITY TO DWELLING
Not too far (<1km) Far (1-5km) Very far (>5km)
OLUBORI ODUN IFA
IDI ARABA
MOSAFEJO
KOSOFE INDICATOR
88
72
77
83
PREFERENCE FOR HEALTH CARE CENTRE IN THE COMMUNITY

69
WHERE HOUSEHOLD'S MEMBER SEEK HEALTH CARE As revealed by the survey, 54% patronized Public Hospital/ Health Centre, 32% use Private Hospital/ Clinic and 3% seek health care with Private Physician. The remaining 11% seek health care from unorthodox sources such as 1% each from Traditional Herbal Clinic and Faith based/ Spiritual Homes while 9% use Pharmacy/ Chemist shop. The study further showed that inhabitants of Olubori Odun-Ifa Community Ward had a good health seeking behavior as attested to by 92% of the respondent, going by the result obtained from Public Hospital, Private Hospital and Private Physician. This is followed by Mosafejo with 86% and Idi-Araba 84%.
Chart 75: WHERE HOUSEHOLD'S MEMBER SEEK HEALTH CARE
62 28 2 2
0 6
44
35 5
2 2
13
40 44 2 1
1 12
54 32 3 1 1 9
WHERE HOUSEHOLD'S MEMBER SEEK HEALTH CARE
OLUBORI ODUN IFA IDI ARABA MOSAFEJO KOSOFE INDICATOR

70
PATRONAGE OF PUBLIC HOSPITAL/ HEALTH CENTRE IN THE LAST ONE YEAR The number of patronage of Public Hospital/Health Center by the people in the community is an indication of the level of awareness and importance attached to the growth and maintenance of good health care. The study showed that 65% of the people in Kosofe patronised Public Hospital/Health Center in the last 1 year.
Community level analysis revealed that Olubori Odun Ifa recorded highest proportion of people that patronized Public Hospitals (72%), followed by Idi Araba (57%) and Mosafejo(48%).
Chart 76: PATRONAGE OF PUBLIC HOSPITAL/ HEALTH CENTRE IN THE LAST ONE YEAR
REASONS FOR NOT PATRONISING PUBLIC HOSPITAL/ HEALTH CENTRE Various reasons were adduced by the household members for non patronage of Public Hospital/Health Centre in the last 1 year. Household from Olubori-Odunfa indicated Long waiting time (32%), Distance from residence (20%),Attitude of health workers (14%),Bad quality of services (13%),Non- affordable cost of services (7%), lack of sufficient medical facilities (7%) and lack of skilled personnel (7%) as the reason for non patronage of public Hospitals.
However, respondents from Idi Araba attributed it majorly to Distance from residence (42%), Bad quality service and Long waiting time as attested to by 19% and 17% of the respondents. Similar trends were revealed by Mosafejo household members who indicated Distance from residence (28%), Bad quality service and Long waiting time as attested to by 24% and 21% of the respondents.
OLUBORI ODUNIFA
IDI ARABA
MOSAFEJO
KOSOFEINDICATOR
72
57
48
65
PATRONAGE OF PUBLIC HOSPITAL/ HEALTH CENTRE IN THE LAST ONE YEAR

71
Chart 77: REASONS FOR NOT PATRONISING PUBLIC HOSPITAL/ HEALTH CENTRE
HOUSEHOLD'S EXPENDITURE ON HEALTH CARE The measure of health care expenditure at level of household includes the travel and consultation costs and drugs. The percentage of total household expenditures used for health care services increases with the level of household income. The result of the study revealed that most of respondents (46%) refuse to indicate their expenditure on health care perhaps for the fear of tax related matters. However, 34% spend less than N10,000; 6% between N10,000 and N19,99; 5% between N20,000 and N29,999 while those that spend more than N29,999 recorded 9%
Bad quality of services
Far from residence
Non-affordable cost of services
Lack of sufficient medical facilities e.g. building,equipment.
Long waiting time
Attitude of health workers (doctor, nurse)
Lack of skilled personnel
13
20
7
7
32
14
7
19
42
11
2
17
8
1
24
28
5
3
21
11
7
REASONS FOR NOT PATRONISING PUBLIC HOSPITAL/ HEALTH CENTRE
OLUBORI ODUN IFA IDI ARABA MOSAFEJO

72
Chart 78: HOUSEHOLD'S EXPENDITURE ON HEALTH CARE
AWARENESS OF NATIONAL HEALTH INSURANCE SCHEME IN KOSOFE For equitable access to health care in Nigeria, the government has introduced the National Health Insurance Scheme (NHIS) as an alternative source of funding for a rapidly extending and increasingly costly health care system. This study assessed the level of awareness of NHIS by health care consumers in the slum communities and it was found out that the level of awareness was very low. Only 24% of the respondents irrespective of their communities indicated awareness of NHIS Scheme.
Community specific indicators also revealed that respondents from Olubori Odun Ifa(26%), followed by Mosafejo(23%) and Idi Araba(17%) claimed to be aware of such Scheme.
0% 10% 20% 30% 40% 50% 60% 70% 80% 90% 100%
OLUBORI ODUN IFA
IDI ARABA
MOSAFEJO
KOSOFE INDICATOR
30
39
44
34
6
2
8
6
6
2
6
5
10
6
6
9
47
52
37
46
HOUSEHOLD'S EXPENDITURE ON HEALTH CARE
<N10, 000 N10, 000-N19, 999 N20, 000-N29, 999 >N29, 999 Refuse

73
Chart 79: AWARENESS OF NATIONAL HEALTH INSURANCE SCHEME IN KOSOFE
HOUSEHOLD'S MEMBER THAT REGISTERED FOR NATIONAL INSURANCE SCHEME IN KOSOFE The study confirmed that 5% of those who were aware of the National Health Insurance Scheme in Kosofe actually registered for the scheme. The two communities: Idi Araba (7%) and Mosafejo (7%) top those who registered for the NIHS while 4% of respondents from Olubori-OdunIfa reported same.
26
17
23
24
OLUBORI ODUN IFA
IDI ARABA
MOSAFEJO
KOSOFE INDICATOR
AWARENESS OF NATIONAL HEALTH INSURANCE SCHEME IN KOSOFE

74
Chart 80: HOUSEHOLD'S MEMBER THAT REGISTERED FOR NATIONAL INSURANCE SCHEME IN KOSOFE
WILLINGNESS TO PRE-PAY A DEFINED HEALTH CARE PACKAGE FOR PARENTS AND FOUR CHILDREN LESS THAN 18 YEARS OF AGE A Prepaid health care package for parents and four children less than 18 years of age is a health care strategy for the pulling of household resources together which allow participant to have easy access to maximum health care in the Hospital. The result showed that 35% of the respondents across the studied slums are willing to pay for the define packages. Most of them were from Idi Araba (40%), Olubori odun Ifa (37%) and Mosafejo (26%).
OLUBORI ODUN IFA
IDI ARABA
MOSAFEJO
KOSOFE INDICATOR
4
7
7
5
HOUSEHOLD'S MEMBER THAT REGISTERED FOR NATIONAL INSURANCE SCHEME IN KOSOFE
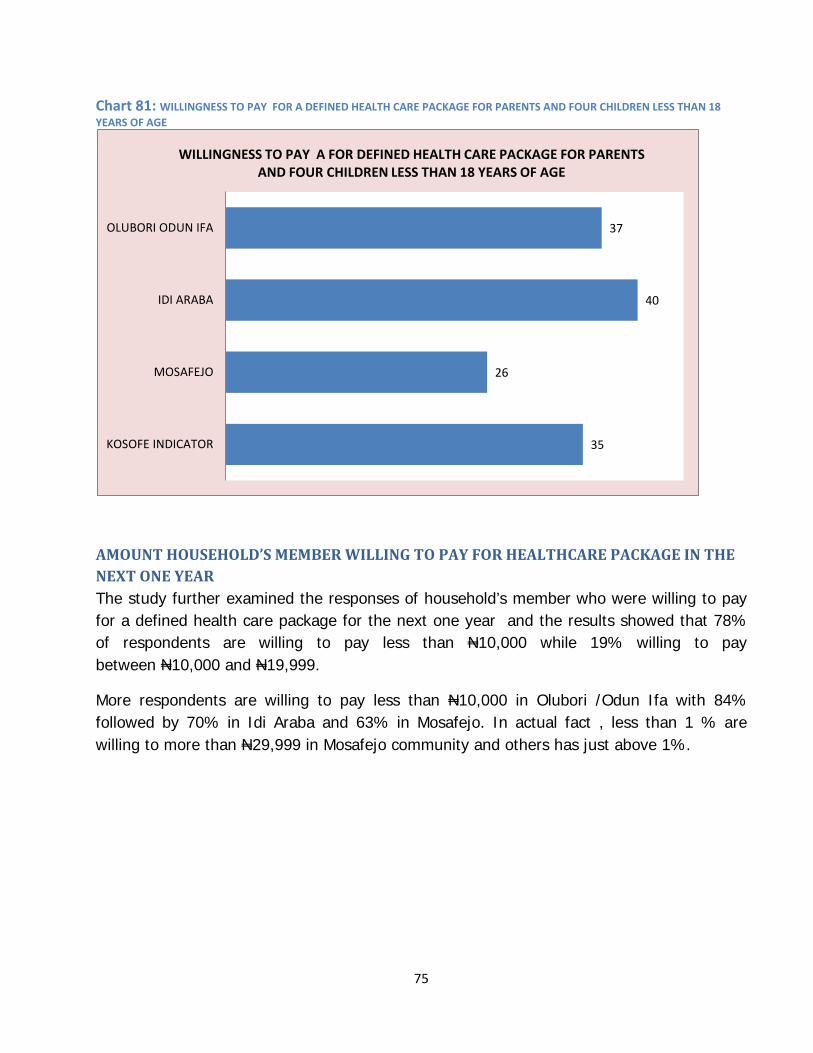
75
Chart 81: WILLINGNESS TO PAY FOR A DEFINED HEALTH CARE PACKAGE FOR PARENTS AND FOUR CHILDREN LESS THAN 18 YEARS OF AGE
AMOUNT HOUSEHOLD’S MEMBER WILLING TO PAY FOR HEALTHCARE PACKAGE IN THE NEXT ONE YEAR The study further examined the responses of household’s member who were willing to pay for a defined health care package for the next one year and the results showed that 78% of respondents are willing to pay less than N10,000 while 19% willing to pay between N10,000 and N19,999.
More respondents are willing to pay less than N10,000 in Olubori /Odun Ifa with 84% followed by 70% in Idi Araba and 63% in Mosafejo. In actual fact , less than 1 % are willing to more than N29,999 in Mosafejo community and others has just above 1%.
37
40
26
35
OLUBORI ODUN IFA
IDI ARABA
MOSAFEJO
KOSOFE INDICATOR
WILLINGNESS TO PAY A FOR DEFINED HEALTH CARE PACKAGE FOR PARENTS AND FOUR CHILDREN LESS THAN 18 YEARS OF AGE

76
Chart 82: AMOUNT HOUSEHOLD'S MEMBER WILLING TO PRE-PAY THE NEXT ONE YEAR
THE LAST TIME HOUSEHOLD MEMBER VISITED PUBLIC HOSPITAL/ HEALTH CENTRE The results of the study on the last time member of household visited Public Hospital/Health Centre in less than 1 year is high across the community of interest with 74%. ‘Can’t Remember’ and ‘Don’t know’ accounts for 18% and More than 1 year recorded 7%.
Chart 83: THE LAST TIME HOUSEHOLD MEMBER VISITED PUBLIC HOSPITAL/HEALTH CENTRE
< N 1 0 , 0 0 0
N 1 0 , 0 0 0 - N 1 9 , 9 9 9
N 2 0 , 0 0 0 - N 2 9 , 9 9 9
> N 2 9 , 9 9 9
84
14
1
1
70
25
4
1
63
33
3
0
78
19
2
1
AMOUNT HOUSEHOLD'S MEMBER WILLING TO PRE-PAY THE NEXT ONE YEAR
OLUBORI ODUN IFA IDI ARABA MOSAFEJO KOSOFE INDICATOR
W I T H I N T H E L A S T T H R E E M O N T H
W I T H I N T H E L A S T S I X M O N T H S
B E T W E E N S I X M O N T H S A N D O N E Y E A R
M O R E T H A N O N E Y E A R
C A N ’ T R E M E M B E R
D O N ’ T K N O W
33
22
21
7
11
7
27
41
11
7
10
3
26
28
16
9
12
9
30
26
18
7
11
7
THE LAST T IME HOUSEHOLD MEMBER VISITED PUBLIC HOSPITAL/HEALTH CENTRE
OLUBORI ODUN IFA IDI ARABA MOSAFEJO KOSOFE INDICATOR

77
SATISFACTION WITH GOVERNMENT HEALTH CENTRE/HOSPITAL The Satisfaction of the people with overall services provided in Government Health Centre/ Hospital and general performance are paramount to improved well being of the citizenry.
About 52% were satisfied with Government Health Centre/ Hospital, 35% are Not Satisfied and 13% Undecided. In Olubori Odun Ifa, 58% were Satisfied, Mosafejo had 47% Satisfied while Idi Araba had 44%.
Chart 84: SATISFACTION WITH GOVERNMENT HEALTH CENTRE/HOSPITAL
HOUSEHOLD HEALTH CARE COST COVERED BY INSURANCE The study revealed that 12% of the people in Kosofe confirmed their health care cost being covered by Insurance Scheme. The community level analysis revealed that Idi Araba(16%),Mosafejo(15%) and Olubori Odun Ifa(9%) respondents confirmed such venture.
OLUBORI ODUN IFA IDI ARABA MOSAFEJO KOSOFE INDICATOR
58 42 43
52
29 44 47 35
13 15 10 13
SATISFACTION WITH GOVERNMENT HEALTH CENTRE/HOSPITAL
Satisfied Not satisfied Undecided

78
Chart 85: HOUSEHOLD HEALTH CARE COST COVERED BY INSURANCE
REASON(S) FOR CHOICE OF "PUBLIC HOSPITAL/ HEALTH CENTRE" Several reasons were given for the choice of Public Hospital as health seeking outlet. This ranged from 2 “Quality of services” as supported by 23% of respondents, 12% gave reason as “Closeness to residence”, 17% chose “Affordable cost of services”, 12% chose “Sufficient medical facilities.”, 8% chose “low waiting time”, 17% chose “Availability of skilled personnel” and 11% chose “Attitude of health workers”
Olubori Odun Ifa (23%) and Idi Araba (26%) have percentages higher than Kosofe Indicator of 23% for respondents that gave reason for choice of Public hospital / health centre as “Quality of services” while Mosafejo has percentage lower at 22%.
Mosafejo (14%) has percentage higher than Kosofe Indicator of 12% for respondents that gave reason for choice of Public hospital / health centre as “Closeness to residence”, Olubori Odun Ifa equals with 12% while Idi Araba has percentage lower at 10%.
Idi Araba (21%) has percentage higher than Kosofe Indicator of 17% for respondents that gave reason for choice of Public hospital / health centre as “Affordable cost of services” while Olubori Odun Ifa (16%) and Mosafejo (15%) have percentages lower.
Mosafejo has 16% for respondents that gave reason for choice of Public hospital / health centre as “Sufficient medical facilities e.g. building, equipment” which is higher than Kosofe Indicator of 12% while Olubori Odun Ifa and Idi Araba have 12% respectively.
9
16
15
12
OLUBORI ODUN IFA
IDI ARABA
MOSAFEJO
KOSOFE INDICATOR
HOUSEHOLD HEALTH CARE COST COVERED BY INSURANCE

79
Kosofe Indicator for respondents that gave reason for choice of Public hospital / health centre as “low waiting time” is 8% likewise Olubori Odun Ifa and Mosafejo while Idi Araba records 5%.
Olubori Odun Ifa has 17% for respondents that gave reason for choice of Public hospital /
health centre as “Availability of skilled personnel” likewise Kosofe Indicator while Idi Araba and Mosafejo records 16% respectively.
Kosofe Indicator for respondents that gave reason for choice of Public hospital / health centre as “Attitude of health workers” is 11% likewise Kosofe Indicator while Idi Araba (9%) and Mosafejo (10%) have percentages lower.
Chart 86: REASONS FOR CHOICE OF "PUBLIC HOSPITAL / HEALTH CENTRE"
0% 20% 40%60%
80%100%
Quality of services
Closeness to residence
Affordable cost of services
Sufficient medical facilitiese.g building, equipment.
low waiting time
Availability of skilledpersonnel
Attitude of health workers
Nothing/Don't Know
23
12
16
12
8
17
11
1
26
10
21
12
5
16
9
0
22
14
15
16
8
16
10
0
23
12
17
12
8
17
11
0
REASONS FOR CHOICE OF "PUBLIC HOSPITAL / HEALTH CENTRE"
Olubori Odun Ifa Idiaraba Mosafejo Kosofe Indicator

80
REASON(S) FOR CHOICE OF "PRIVATE HOSPITAL/ CLINIC" The survey showed that 21% of respondents gave reason for choice of "Private hospital/clinic" as “Quality of services”, 19% chose “Closeness to residence”, 10% chose “Affordable cost of services”, 12% chose “Sufficient medical facilities e.g. building, equipment.”, 13% chose “low waiting time” another 13% gave reason(s) for choice of "Private hospital/clinic" as “Availability of skilled personnel” and 11% chose “Attitude of health workers”
Olubori Odun Ifa and Mosafejo have same percentages with Kosofe Indicator of 21% each
for respondents that gave reason for choice of Private hospital/clinic as “Quality of services” while Idi Araba has percentage lower at 20%.
Idi Araba (33%) and Mosafejo (20%) have percentages higher than Kosofe Indicator of 19% for respondents that gave reason for choice of Private hospital/clinic as “Closeness to residence” while Olubori Odun Ifa is low at 16%.
Olubori Odun Ifa and Mosafejo have same percentages with Kosofe Indicator of 10% each
for respondents that gave reason for choice of Private hospital/clinic as “Affordable cost of services” while Idi Araba has percentage lower at 9%.
Olubori Odun Ifa has 13% high, Idi Araba 8% low for respondents that gave reason for choice of "Private hospital/clinic" as “Sufficient medical facilities” while Kosofe Indicator has 12% likewise Mosafejo.
Olubori Odun Ifa and Mosafejo have same percentages with Kosofe Indicator of 13% each
for respondents that gave reason for choice of Private hospital/clinic as “low waiting time” while Idi Araba has percentage lower at 12%.
Olubori Odun Ifa and Mosafejo have same percentages with Kosofe Indicator of 13% each for respondents that gave reason for choice of Private hospital/clinic as “Availability of skilled personnel” while Idi Araba has percentage lower at 9%.
Olubori Odun Ifa has 12% high, Idi Araba 8% low for respondents that gave reason for
choice of "Private hospital/clinic" as “Attitude of health workers” while Kosofe Indicator has

81
11% likewise Mosafejo. Olubori Odun Ifa and Kosofe Indicator have 1% each for respondents that gave reason for choice of "Private hospital/clinic" as “Nothing/ Don’t Know”
Chart 87: REASON(S) FOR CHOICE OF "PRIVATE HOSPITAL/ CLINIC"
0% 20% 40% 60% 80%100%
Quality of services
Closeness to residence
Affordable cost of services
Sufficient medical facilitiese.g building, equipment.
low waiting time
Availability of skilledpersonnel
Attitude of health workers
Nothing/Don't Know
21
16
10
13
13
13
12
1
20
33
9
8
12
9
8
0
21
20
10
12
13
13
11
0
21
19
10
12
13
13
11
1
REASON(S) FOR CHOICE OF "PRIVATE HOSPITAL/ CLINIC"
Olubori Odun Ifa Idiaraba Mosafejo Kosofe Indicator

82
REASON(S) FOR CHOICE OF "PRIVATE PHYSICIAN" The survey showed that 23% of respondents gave reason for choice of "Private physician" as “Quality of services”, 12% as “Closeness to residence”, 17% as “Affordable cost of services” 12% as “Sufficient medical facilities” 8% as “low waiting time”, 17% as “Availability of skilled personnel” and 11% as “Attitude of health workers” .
Olubori Odun Ifa and Kosofe Indicator have same percentages of 23% each for respondents that gave reason for choice of “Private physician” as “Quality of services” while Mosafejo has 22% low and Idi Araba has 26% high. Idi Araba (10%) low, Mosafejo (14%) high for respondents that gave reason for choice of “Private physician” as “Closeness to residence” while Olubori Odun Ifa and Kosofe Indicator have same percentages at 12% each.
Idi Araba has 21% for respondents that gave reason for choice of “Private physician” as “Affordable cost of services” which is higher than Kosofe Indicator of 17%, Olubori Odun Ifa (16%) and Mosafejo (15%).Mosafejo has 16% high while Olubori Odun Ifa, Idi Araba and Kosofe Indicator have 12% lows each for respondents that gave reason for choice of “Private physician” as “Sufficient medical facilities”
Olubori Odun Ifa, Mosafejo and Kosofe Indicator have same percentages of 8% each for respondents that gave reason for choice of “Private physician” as “low waiting time” while Idi Araba has a percentage low of 5%.
Olubori Odun Ifa and Kosofe Indicator have same percentages of 17% each for respondents that gave reason for choice of “Private physician” as “Availability of skilled personnel” while Idi Araba and Mosafejo have percentage low at 16% each. Olubori Odun
Ifa and Kosofe Indicator have same percentages of 11% each for respondents that gave reason for choice of “Private physician” as “Attitude of health workers” while Mosafejo has 10% and Idi Araba has 9% low.
Olubori Odun Ifa is at 1% low for respondents that gave reason for choice of “Private physician” as “Nothing/ Don’t Know”

83
Chart 88: REASON(S) FOR CHOICE OF "PRIVATE PHYSICIAN"
23
12
16
12
8
17
11
1
26
10
21
12
5
16
9
0
22
14
15
16
8
16
10
0
23
12
17
12
8
17
11
0
0% 20% 40% 60% 80% 100%
Quality of services
Closeness toresidence
Affordable cost ofservices
Sufficient medicalfacilities e.g building,
equipment.
low waiting time
Availability of skilledpersonnel
Attitude of healthworkers
Nothing/Don't Know
REASON(S) FOR CHOICE OF "PRIVATE PHYSICIAN"
Olubori Odun Ifa Idiaraba Mosafejo Kosofe Indicator

84
REASON(S) FOR CHOICE OF "TRADITIONAL HERBAL CLINIC" 18% of respondents gave reason(s) for choice of "Traditional herbal clinic " as “Quality of services”, 19% as “Closeness to residence”, 18% chose “Affordable cost of services”, 7% chose “Sufficient medical facilities”, 16% chose “low waiting time”, 11% chose “Availability of skilled personnel”, 8% chose “Attitude of health workers” and 3% chose “Nothing/ Don’t Know”.
Mosafejo has 20% and Olubori Odun Ifa has 19%high for respondents that gave reason for choice of “Traditional herbal clinic” as “Quality of services” while Idi Araba has 15% low than Kosofe Indicator of 18%.Idi Araba has 30% and Mosafejo has 20% for respondents that gave reason for choice of “Traditional herbal clinic” as “Closeness to residence” while Olubori Odun Ifa has 15% low than Kosofe Indicator of 19%.
Idi Araba has 22%, Mosafejo has 20% for respondents that gave reason for choice of “Traditional herbal clinic” as “Affordable cost of services” which is higher than Kosofe Indicator of 18% while Olubori Odun Ifa is 16% low. Mosafejo (10%), Olubori Odun Ifa (8%) and Idi Araba (0%) though Kosofe Indicator is at 7% for respondents that gave reason for choice of “Traditional herbal clinic” as “Sufficient medical facilities”
Idi Araba has a percentage high of 19% even as Olubori Odun Ifa and Mosafejo have 15% each for respondents that gave reason for choice of “Traditional herbal clinic” as “low waiting time”, Kosofe Indicator for same is at 16%.
Olubori Odun Ifa (13%) high, Idi Araba (7%) and Mosafejo (5%) low for respondents that gave reason for choice of “Traditional herbal clinic ” as “Availability of skilled personnel” whereas Kosofe Indicator for same is at 11%. Olubori Odun Ifa (9%), Idi Araba (7%) and Mosafejo (5%) for respondents that gave reason for choice of “Traditional herbal clinic ” as “Attitude of health workers” as against Kosofe Indicator of 8% for same.
Mosafejo (5%), Olubori Odun Ifa (4%) and Idi Araba (0%) for respondents that gave reason for choice of “Traditional herbal clinic” as “Nothing/ Don’t Know” as against 3% for Kosofe Indicator.

85
Chart 89: REASON(S) FOR CHOICE OF "TRADITIONAL HERBAL CLINIC"
0%50%
100%
Quality of services
Closeness to residence
Affordable cost of services
Sufficient medical facilities e.g building,equipment.
low waiting time
Availability of skilled personnel
Attitude of health workers
Nothing/Don't Know
19
15
16
8
15
13
9
4
15
30
22
0
19
7
7
0
20
20
20
10
15
5
5
5
18
19
18
7
16
11
8
3
REASON(S) FOR CHOICE OF "TRADITIONAL HERBAL CLINIC"
Olubori Odun Ifa Idiaraba Mosafejo Kosofe Indicator

86
REASON(S) FOR CHOICE OF "FAITH BASED/ SPIRITUAL HOME" The survey showed that 21% of respondents gave reason for choice of "Faith base/Spiritual home" as “Quality of services”, 17% as “Closeness to residence”, 13% as “Affordable cost of services” 10% as “Sufficient medical facilities” 12% as “low waiting time”, 12% as “Availability of skilled personnel”, 12% as “Attitude of health workers” and 4% as “Nothing/ Don’t Know”.
Idi Araba has36% high than Kosofe Indicator of 21% for respondents that gave reason for choice of “Faith base/Spiritual home” as “Quality of services” even as Olubori Odun Ifa has 19% and Mosafejo 14% low. Olubori Odun Ifa (19%), Idi Araba (18%) and Mosafejo (14%) for respondents that gave reason for choice of “Faith base/Spiritual home” as “Closeness to residence” while Kosofe Indicator is 17% for same.
Mosafejo has 21% for respondents that gave reason for choice of “Faith base/Spiritual home” as “Affordable cost of services” which is higher than Kosofe Indicator of 13%, Olubori Odun Ifa (11%) and Idi Araba (9%).Mosafejo has 14% for respondents that gave reason for choice of “Faith base/Spiritual home” as “Sufficient medical facilities” which is higher than Olubori Odun Ifa (11%), Kosofe Indicator (10%) and Idi Araba (0%).
Idi Araba (18%) and Mosafejo (14%) have high percentages than Kosofe Indicator of 12% for respondents that gave reason for choice of “Faith base/Spiritual home” as “low waiting time” while Olubori Odun Ifa has 7% low.
Mosafejo has 14%, Olubori Odun Ifa (11%) and Idi Araba (9%) for respondents that gave reason for choice of “Faith base/Spiritual home” as “Availability of skilled personnel” while Kosofe Indicator is 12%.Olubori Odun Ifa has 19%, Mosafejo (7%) and Idi Araba (0%) for respondents that gave reason for choice of “Faith base/Spiritual home” as “Attitude of health workers” whereas Kosofe Indicator is 12%.
Idi Araba (9%) and Mosafejo (0%) for respondents that gave reason for choice of “Faith base/Spiritual home” as “Nothing/ Don’t know” though Olubori Odun Ifa and Kosofe Indicator have 4% each.

87
Chart 90: REASON(S) FOR CHOICE OF "FAITH BASED/ SPIRITUAL HOME"
0% 20% 40% 60% 80% 100%
Quality of services
Closeness to residence
Affordable cost of services
Sufficient medical facilities e.gbuilding, equipment.
low waiting time
Availability of skilled personnel
Attitude of health workers
Nothing/Don't Know
19
19
11
11
7
11
19
4
36
18
9
0
18
9
0
9
14
14
21
14
14
14
7
0
21
17
13
10
12
12
12
4
REASON(S) FOR CHOICE OF "FAITH BASED/ SPIRITUAL HOME"
Olubori Odun Ifa Idiaraba Mosafejo Kosofe Indicator

88
REASON(S) FOR CHOICE OF "PHARMACY/ CHEMIST SHOP" 19% of respondents gave reason(s) for choice of "Pharmacy/chemist shop" as “Quality of services”, 16% gave reason(s) as “Closeness to residence”, 18% as “Affordable cost of services”, 10% as “Sufficient medical facilities e.g. building, equipment.”, 12% as “low waiting time”, 11% as “Availability of skilled personnel”, 12% as “Attitude of health workers” and 2% as “Nothing/ Don’t Know”.
Mosafejo (21%) and Idi Araba (20%) have percentages higher than Kosofe Indicator of 19% for respondents that gave reason for choice of Pharmacy/chemist shop as “Quality of
services” while Olubori Odun Ifa has percentage low at 17%.Idi Araba has a high of 23% even as Mosafejo and Kosofe Indicator have 16% each for respondents that gave reason for choice of Pharmacy/chemist shop as “Closeness to residence”. Olubori Odun Ifa is 15%.
Olubori Odun Ifa and Kosofe Indicator have 18% each for respondents that gave reason for choice of Pharmacy/chemist shop as “Affordable cost of services” whereas Idi Araba has percentage 1 9% high and Mosafejo 17% low. Olubori Odun Ifa has 11% high, Idi Araba 5% low for respondents that gave reason for choice of "Pharmacy/chemist shop" as “Sufficient medical facilities” while Kosofe Indicator has 10% likewise Mosafejo.
Idi Araba and Mosafejo have percentages of 13% each for respondents that gave reason for choice of Pharmacy/chemist shop as “low waiting time” whereas Olubori Odun Ifa and Kosofe Indicator have percentages at 12% each.
Olubori Odun Ifa (14%), Idi Araba (10%) and Mosafejo (8%) for respondents that gave reason for choice of Pharmacy/chemist shop as “Availability of skilled personnel” whilst Kosofe Indicator is at 11%.Mosafejo (16%), Olubori Odun Ifa (10%) and Idi Araba (7%) for respondents that gave reason for choice of "Pharmacy/chemist shop" as “Attitude of health workers” as Kosofe Indicator is at 12%.
Olubori Odun Ifa (3%), Idi Araba (3%) and Mosafejo (0%) for respondents that gave reason for choice of "Pharmacy/chemist shop" as “Nothing/ Don’t know” while Kosofe Indicator is at 2%.

89
Chart 91: REASON(S) FOR CHOICE OF "PHARMACY/ CHEMIST SHOP"
0% 20% 40% 60% 80% 100%
Quality of services
Closeness to residence
Affordable cost of services
Sufficient medical facilitiese.g building, equipment.
low waiting time
Availability of skilledpersonnel
Attitude of health workers
Nothing/Don't Know
17
15
18
11
12
14
10
3
20
23
19
5
13
10
7
3
21
16
17
10
13
8
16
0
19
16
18
10
12
11
12
2
REASON(S) FOR CHOICE OF "PHARMACY/ CHEMIST SHOP"
Olubori Odun Ifa Idiaraba Mosafejo Kosofe Indicator

90
GOVERNMENT HOSPITAL/ HEALTH CENTRE RATING ON "PROVISION OF DRUGS" The survey showed that 13% of respondents rate Government Hospital/ Health Centre on "Provision of drugs” asExcellent, 40% rates it as Good, 34% rates it as Fair and 13% rates it as Poor.On the "Provision of drugs” as rated Excellent by respondents concerning Government Hospital/ Health Centre, Olubori Odun Ifa is at 16%, Mosafejo at 9% and Idi Araba at 6% while Kosofe Indicator is at 13%.
Respondents rating as Good the "Provision of drugs” positions Olubori Odun Ifa at 45%, Mosafejo at 35% and Idi Araba at 28% while Kosofe Indicator is at 40%.
Respondents rating as Fair the "Provision of drugs” sets Idi Araba at 49%, Mosafejo at 33% and Olubori Odun Ifa at 30% while Kosofe Indicator is at 34%.
Respondents rating as Poor the "Provision of drugs” puts Mosafejo at 23%, Idi Araba at 17% and Olubori Odun Ifa at 10% while Kosofe Indicator is at 13%.
Chart 92: GOVERNMENT HOSPITAL/ HEALTH CENTRE RATING ON "PROVISION OF DRUGS"
Excellent Good Fair Poor
16 45 30 10
6 28 49 17
9 35 33 23
13 40 34 13
GOVERNMENT HOSPITAL/ HEALTH CENTRE RATING ON "PROVISION OF DRUGS"
Olubori Odun Ifa Idiaraba Mosafejo Kosofe Indicator

91
GOVERNMENT HOSPITAL/ HEALTH CENTRE RATING ON "MEDICAL EQUIPMENT" The survey showed that 15% of respondents rate Government Hospital/ Health Centre on "Medical Equipment” asExcellent, 48% rates it as Good, 30% rates it as Fair and 7% rates it as Poor.On the "Medical Equipment” as rated Excellent by respondents concerning Government Hospital/ Health Centre, Olubori Odun Ifa is at 18%, Mosafejo at 12% and Idi Araba at 5% while Kosofe Indicator is at 15%.
Respondents rating as Good the "Medical Equipment” positions Olubori Odun Ifa at 52%, Mosafejo at 46% and Idi Araba at 36% while Kosofe Indicator is at 48%.
Respondents rating as Fair the "Medical Equipment” sets Idi Araba at 48%, Mosafejo at 28% and Olubori Odun Ifa at 26% while Kosofe Indicator is at 30%.
Respondents rating as Poor the "Medical Equipment” puts Mosafejo at 15%, Idi Araba at 11% and Olubori Odun Ifa at 3% while Kosofe Indicator is at 7%.
Chart 93: GOVERNMENT HOSPITAL/ HEALTH CENTRE RATING ON "MEDICAL EQUIPMENT"
18
52
26
3
5
36
48
11
12
46
28
15
15
48
30
7
0% 10% 20% 30% 40% 50% 60% 70% 80% 90% 100%
Excellent
Good
Fair
Poor
GOVERNMENT HOSPITAL/ HEALTH CENTRE RATING ON "MEDICAL EQUIPMENT"
Olubori Odun Ifa Idiaraba Mosafejo Kosofe Indicator

92
GOVERNMENT HOSPITAL/ HEALTH CENTRE RATING ON "QUALITY OF MEDICAL PERSONNEL" The survey showed that 14% of respondents rate Government Hospital/ Health Centre on "Quality of Medical Personnel” asExcellent, 51% rates it as Good, 28% rates it as Fair and 8% rates it as Poor.On the "Quality of Medical Personnel” as rated Excellent by respondents concerning Government Hospital/ Health Centre, Olubori Odun Ifa is at 17%, Mosafejo at 11% and Idi Araba at 6% while Kosofe Indicator is at 15%.
Respondents rating as Good the "Quality of Medical Personnel” positions Olubori Odun Ifa at 55%, Mosafejo at 45% and Idi Araba at 39% while Kosofe Indicator is at 51%.
Respondents rating as Fair the "Quality of Medical Personnel” sets Idi Araba at 43%, Mosafejo at 30% and Olubori Odun Ifa at 23% while Kosofe Indicator is at 28%.
Respondents rating as Poor the "Quality of Medical Personnel” puts Mosafejo at 14%, Idi Araba at 13% and Olubori Odun Ifa at 5% while Kosofe Indicator is at 8%.
Chart 94: GOVERNMENT HOSPITAL/ HEALTH CENTRE RATING ON "QUALITY OF MEDICAL PERSONNEL"
Excellent Good Fair Poor
17 55 23 5
6 39 43 13
11 45 30 14
14 51 28 8
GOVERNMENT HOSPITAL/ HEALTH CENTRE RATING ON "QUALITY OF MEDICAL PERSONNEL"
Olubori Odun Ifa Idiaraba Mosafejo Kosofe Indicator

93
GOVERNMENT HOSPITAL/ HEALTH CENTRE RATING ON "WAITING TIME" The survey showed that 4% of respondents rate Government Hospital/ Health Centre on "Waiting Time” asExcellent, 25% rates it as Good, 35% rates it as Fair and 36% rates it as Poor. On the "Waiting Time” as rated Excellent by respondents concerning Government Hospital/ Health Centre, Olubori Odun Ifa is at 5%, Idi Araba at 3% and Mosafejo at 2% while Kosofe Indicator is at 4%.
Respondents rating as Good the "Waiting Time” positions Mosafejo at 26%, Olubori Odun Ifa at 25% and Idi Araba at 22% while Kosofe Indicator is at 25%.
Respondents rating as Fair the "Waiting Time” sets Idi Araba at 49%,Olubori Odun Ifa at 33% and Mosafejo at 29% while Kosofe Indicator is at 35%.
Respondents rating as Poor the "Waiting Time” puts Mosafejo at 42%,Olubori Odun Ifa at 37% and Idi Araba at 26% while Kosofe Indicator is at 36%.
Chart 95: GOVERNMENT HOSPITAL/ HEALTH CENTRE RATING ON "WAITING TIME"
5
25
33
37
3
22
49
26
2
26
29
42
4
25
35
36
0% 10% 20% 30% 40% 50% 60% 70% 80% 90% 100%
Excellent
Good
Fair
Poor
GOVERNMENT HOSPITAL/ HEALTH CENTRE RATING ON "WAITING TIME"
Olubori Odun Ifa Idiaraba Mosafejo Kosofe Indicator

94
GOVERNMENT HOSPITAL/ HEALTH CENTRE RATING ON "INFRASTRUCTURE (BUILDING, WATER, ELECTRICITY ETC.)" The survey showed that 9% of respondents rate Government Hospital/ Health Centre on "Infrastructure (Building, Water, Electricity etc.)” asExcellent, 47% rates it as Good, 33% rates it as Fair and 11% rates it as Poor.On the "Infrastructure (Building, Water, Electricity etc.)” as rated Excellent by respondents concerning Government Hospital/ Health Centre, Olubori Odun Ifa is at 11%, Idi Araba at 5% and Mosafejo also at 5% while Kosofe Indicator is at 9%.
Respondents rating as Good the "Infrastructure (Building, Water, Electricity etc.)” positions Olubori Odun Ifa at 51%, Mosafejo at 48% and Idi Araba at 32% while Kosofe Indicator is at 47%.
Respondents rating as Fair the "Infrastructure (Building, Water, Electricity etc.)” sets Idi Araba at 52%,Olubori Odun Ifa at 30% and Mosafejo at 28% while Kosofe Indicator is at 33%.
Respondents rating as Poor the "Infrastructure (Building, Water, Electricity etc.)” puts Mosafejo at 19%,Idi Araba at 10% and Olubori Odun Ifa at 8% while Kosofe Indicator is at 11%.
Chart 96: GOVERNMENT HOSPITAL/ HEALTH CENTRE RATING ON "INFRASTRUCTURE(BUILDING, WATER, ELECTRICITY)"
0% 20% 40% 60% 80% 100%
Excellent
Good
Fair
Poor
11
51
30
8
5
32
52
10
5
48
28
19
9
47
33
11
GOVERNMENT HOSPITAL/ HEALTH CENTRE RATING ON "INFRASTRUCTURE(BUILDING, WATER, ELECTRICITY)"
Olubori Odun Ifa Idiaraba Mosafejo Kosofe Indicator

95
GOVERNMENT HOSPITAL/ HEALTH CENTRE RATING ON "ATTITUDE OF MEDICAL PERSONNEL TOWARDS PATIENTS" The survey showed that 5% of respondents rate Government Hospital/ Health Centre on "Attitude of Medical Personnel towards Patients” asExcellent, 35% rates it as Good, 39% rates it as Fair and 21% rates it as Poor.On the "Attitude of Medical Personnel towards Patients” as rated Excellent by respondents concerning Government Hospital/ Health Centre, Olubori Odun Ifa is at 6%, Idi Araba at 4% and Mosafejo at 2% while Kosofe Indicator is at 5%.
Respondents rating as Good the "Attitude of Medical Personnel towards Patients” positions Olubori Odun Ifa at 38%, Mosafejo at 33% and Idi Araba at 28% though Kosofe Indicator is at 35%.
Respondents rating as Fair the "Attitude of Medical Personnel towards Patients” sets Idi Araba at 48%,Mosafejo at 39% and Olubori Odun Ifa at 36% even as Kosofe Indicator is at 39%.
Respondents rating as Poor the "Attitude of Medical Personnel towards Patients” puts Mosafejo at 27%,Idi Araba at 20% and Olubori Odun Ifa also at 20% whereas Kosofe Indicator is at 21%.

96
Chart 97: GOVERNMENT HOSPITAL/ HEALTH CENTRE RATING ON "ATTITUDE OF MEDICAL PERSONNEL TOWARDS PATIENTS"
GOVERNMENT HOSPITAL/ HEALTH CENTRE RATING ON "COST OF DRUGS/ MEDICAL TEST" The survey showed that 6% of respondents rate Government Hospital/ Health Centre on "Cost of Drugs/ Medical Test” asExcellent, 40% rates it as Good, 39% rates it as Fair and 15% rates it as Poor.On the "Cost of Drugs/ Medical Test” as rated Excellent by respondents as regards Government Hospital/ Health Centre, Olubori Odun Ifa is at 8%, Idi Araba at 4% and Mosafejo also at 4% while Kosofe Indicator is at 6%.
Respondents rating as Good the "Cost of Drugs/ Medical Test” positions Olubori Odun Ifa at 43%, Mosafejo at 38% and Idi Araba at 29% though Kosofe Indicator is at 40%.
Respondents rating as Fair the "Cost of Drugs/ Medical Test” sets Idi Araba at 54%,Olubori Odun Ifa at 37 and Mosafejo at 32% even as Kosofe Indicator is at 39%.
Respondents rating as Poor the "Cost of Drugs/ Medical Test” puts Mosafejo at 25%,Idi Araba at 13% and Olubori Odun Ifa at 12% whereas Kosofe Indicator is at 15%.
Excellent
Good
Fair
Poor
6
38
36
20
4
28
48
20
2
33
38
27
5
35
39
21
GOVERNMENT HOSPITAL/ HEALTH CENTRE RATING ON "ATTITUDE OF MEDICAL PERSONNEL TOWARDS PATIENTS"
Olubori Odun Ifa Idiaraba Mosafejo Kosofe Indicator

97
Chart 98: GOVERNMENT HOSPITAL/ HEALTH CENTRE RATING ON "COST OF DRUGS / MEDICAL TEST"
GOVERNMENT HOSPITAL/ HEALTH CENTRE RATING ON "QUALITY OF SERVICE" The survey showed that 12% of respondents rate Government Hospital/ Health Centre on "Quality of Service” asExcellent, 47% rates it as Good, 32% rates it as Fair and 10% rates it as Poor.On the "Quality of Service” as rated Excellent by respondents as regards Government Hospital/ Health Centre, Olubori Odun Ifa is at 14%,Mosafejo at 10% and Idi Araba at 6% while Kosofe Indicator is at 12%.
Respondents rating as Good the "Quality of Service” positions Olubori Odun Ifa at 52%, Mosafejo at 42% and Idi Araba at 34% though Kosofe Indicator is at 47%. Respondents
rating as Fair the "Quality of Service” sets Idi Araba at 51%,Olubori Odun Ifa at 28% and Mosafejo at 27% even as Kosofe Indicator is at 32%.
Excellent Good Fair Poor
8 43 37 12
4 29 54
13
4 38 32
25
6 40 39 15
GOVERNMENT HOSPITAL/ HEALTH CENTRE RATING ON "COST OF DRUGS / MEDICAL TEST"
Olubori Odun Ifa Idiaraba Mosafejo Kosofe Indicator

98
Respondents rating as Poor the "Quality of Service” puts Mosafejo at 21%,Idi Araba at 10% and Olubori Odun Ifa at 6% whereas Kosofe Indicator is at 10%.
Chart 99: GOVERNMENT HOSPITAL/ HEALTH CENTRE RATING ON "QUALITY OF SERVICE"
PROBLEMS FACED IN THE MOST RECENT VISIT TO GOVERNMENT HEALTH FACILITY The survey showed the problems faced by respondents in the most recent visit to Government health facility as “Unhealthy facilities” with 8%, “Insufficient medical facilities” at 12%, “Unfriendly attitude of medical personnel” at 23%, “Insufficient number of doctors and nurses” at 8%, “Long waiting time ” at 32%, “Unaffordable service fees” at 6% and “No drugs/ medicines ” at 12%.
On the "Unhealthy facilities” as a problem faced by respondents in the most recent visit to Government health facility, Mosafejo is at 15%,Idi Araba at 8% and Olubori Odun Ifa at 6% while Kosofe Indicator is at 8%.
Regarding “Insufficient medical facilities”, the survey positions Idi Araba at 25%, Mosafejo at 16% and Olubori Odun Ifa at 9% though Kosofe Indicator is at 12%.
14 52 28
6
6 34 51
10
10 42 27
21
12 47 32 10
Excellent Good Fair Poor
GOVERNMENT HOSPITAL/ HEALTH CENTRE RATING ON "QUALITY OF SERVICE"
Olubori Odun Ifa Idiaraba Mosafejo Kosofe Indicator

99
Regarding “Unfriendly attitude of medical personnel” the survey sets Idi Araba at 26%, Olubori Odun Ifa at 22% and Mosafejo also at 22% even as Kosofe Indicator is at 23%.
As regards “Insufficient number of doctors and nurses” the survey puts Olubori Odun Ifa at 8%, Mosafejo at 6% and Idi Araba at 5% whereas Kosofe Indicator is at 8%.
Regarding “Long waiting time” the survey sets Olubori Odun Ifa at 35%,Idi Araba at 25% and Mosafejo also at 25% even as Kosofe Indicator is at 32%.
Regarding "Unaffordable service fees” as a problem faced by respondents in the most recent visit to Government health facility, Mosafejo is at 7%,Olubori Odun Ifa at 6% and Idi Araba at 3% while Kosofe Indicator is at 6%.
Regarding “No drugs/ medicines” the survey sets Olubori Odun Ifa at 14%,Mosafejo at 10% and Idi Araba at 8% even as Kosofe Indicator is at 12%.

100
Chart 100: PROBLEMS FACED IN THE MOST RECENT VISIT TO GOVERNMENT HEALTH FACILITY
0% 10% 20% 30% 40% 50% 60% 70% 80% 90%100%
Unhygienic facilities
Insufficient medical facility
Unfriendly attitude of medical personnel
Insufficient number of doctors or nurses
Long waiting time
Unaffordable service fees
No drugs/medicines available
6
9
22
8
35
6
14
8
25
26
5
25
3
8
15
16
22
6
25
7
10
8
12
23
8
32
6
12
PROBLEMS FACED IN THE MOST RECENT VISIT TO GOVERNMENT HEALTH FACILITY
Olubori Odun Ifa Idiaraba Mosafejo Kosofe Indicator

101
RATING OF QUALITY OF HEALTH CARE SERVICES AT GOVERNMENT HOSPITALS OR CLINICS The survey showed that 31% of respondents rate the quality of health care services at Government hospitals or clinic as "Improved Significantly”, 45% rates it as “Improved Fairly”, 19% rates it as “Stayed the same”, 3% rates it as “Deteriorated Fairly” and 1% rates it as “Deteriorated Significantly”
Respondents rating the quality of health care services at Government hospitals or clinic as "Improved Significantly” positions Mosafejo at 34%, Olubori Odun Ifa at 33% and Idi Araba at 19% though Kosofe Indicator is at 31%.
Respondents rating the quality as “Improved Fairly” sets Idi Araba at 60%,Olubori Odun Ifa at 44% and Mosafejo at 41% even as Kosofe Indicator is at 45%.
Respondents rating quality as “Stayed the same” puts Idi Araba at 20%,Olubori Odun Ifa at 19% and Mosafejo at 18% whereas Kosofe Indicator is at 19%.
Regarding respondents rating as “Deteriorated Fairly”, the survey positions Mosafejo at 6%, Olubori Odun Ifa at 3% and Idi Araba at 1% though Kosofe Indicator is at 3%.
As regards “Deteriorated Significantly” the survey puts Olubori Odun Ifa and Mosafejo at 2% each even as Idi Araba is at 0% whereas Kosofe Indicator is at 1%.

102
Chart 101: RATING OF QUALITY OF HEALTH CARE SERVICES AT GOVERNMENT HOSPITALS OR CLINICS
ImprovedSignificantly
ImprovedFairly
Stayed theSame
DeterioratedFairly
DeterioratedSignificantly
33 44 19 3 2
19 60 20
1
0
34 41 18
6 2
31 45 19 3 1
RATING OF QUALITY OF HEALTH CARE SERVICES AT GOVERNMENT HOSPITALS OR CLINICS
Olubori Odun Ifa Idiaraba Mosafejo Kosofe Indicator

103
SUMMARY OF INDICATORS

104
Table 2: SHOWING SUMMARY OF INDICATORS
SECTOR INDICATORS SUB GROUP OLUBORI ODUN IFA IDI ARABA MOSAFEJO DE
MO
GRA
PHY
AGE OF RESPONDENTS
15--20 3 5 3
21--30 51 50 53
31--40 41 38 40
41--49 4 6 3
>49 1 1 1
MARITAL STATUS OF RESPONDENTS
Married 92 91 92
Divorced 4 2 3
Separated 2 3 3
Single 2 4 2
OCCUPATIONAL STATUS OF RESPONDENTS
Regular employment (Government)
3 2 4
Regular Employment (Private) 6 8 11
Self Employed (Artisan) 67 67 64
Agriculture 1 1 1
Unemployed (Job Seeker) 5 5 7
Student 2 1 2
Full House Wife 15 16 11
Daily Labourer 1
AVERAGE HOUSEHOLD SIZE
1--4 63 59 69
5--9 35 39 30
>9 2 2 1
COMPOUND DENSITY
1--4 30 43 53
5--9 26 31 25
>9 44 26 22
HIGHEST LEVEL OF EDUCATION ATTAINED
Pre Primary 4 5 9
Primary (Basis 1-6) 11 17 9
Secondary(JSS 1-3) 13 15 9
Secondary (SSS 1-3) 53 52 47
Adult Education 1

105
SECTOR INDICATORS SUB GROUP OLUBORI ODUN IFA IDI ARABA MOSAFEJO
Higher non university(ND, NCE, HND, PGD) 12 6 19 Higher University (BSC, MSC, MPhil, PHD) 4 4 5
Vocational training 1 1
No Formal Education 1 1 1
ENVI
RON
MEN
T
AVAILABILITY OF DRAINS/GUTTERS ON THE STREET
Yes 79 61 78
TYPE OF DRAINAGE FACILITY
Uncovered concrete drain 79 88 72
Covered concrete drain 13 7 20
Earth 8 5 8 CLEANING OF THE DRAINAGE SYSTEM
Yes 81 66 73
RESPONSIBLE FOR CLEANING THE DRAINAGE SYSTEM
Community 22 31 17 Government employed personnel 3 8 10
PSP 75 61 73
MAIN TYPE OF TOILET FACILITY AVAILABLE TO HOUSEHOLD
Flush to septic tank (water closet) 45 21 50
Flush/pour to pit (pit latrine) 31 30 30 Flush/pour to street, yard, ditch 8 25 9
Flush to sewer 1 2 3 Covered pit toilet/latrine (improved) 5 2 1
Uncovered pit toilet/latrine 1 4 1
Hanging toilet/toilet on water 1 2 1
Bush/field 1 2
Ventilated improved pit(VIP) 2
Mobile toilet 1 2 2
No toilet facility 2 5 1
Dig ground and bury 1 1
Flush to gutter 1 5 MAIN SOURCE OF WATER
Lagos Water Corporation (LWC) 27 4 4

106
SECTOR INDICATORS SUB GROUP OLUBORI ODUN IFA IDI ARABA MOSAFEJO
Local Water Supply Scheme (Community) 9 22 9 Private Water Well (Borehole, Hand dug well, Standpipes 50 52 68 Local Flowing Rivers/Stream/ Spring 1
Protected dug well 3 3 5
Unprotected dug well 4 6 8
Small-scale /truck vendor) 1 2 1 Surface water (lagoon, creek, river, dam, lake, pond, stream canal, irrigation channels 4 11 4
IS WATER FROM MAIN SOURCE DRINKABLE
Yes 40 16 25
TREATMENT OF PRIMARY SOURCE OF WATER TO MAKE IT SAFE FOR DRINKING
Add bleach/chlorine/Alum 22 17 30
Boil 79 75 56
Let it stay and settle 26 11 23
Sieve it through cloth 5 3 1 Water filter (ceramic, sand, composite) 8 1 4
METHODS OF WASTE DISPOSAL
Collected by the government (PSP) 36 12 42 Dumping ground in neighborhood 14 54 20 Truck pusher/private refuse collector 42 9 28 Disposal within compound (neighborhood bin/tank) 2 7 1
Government bin 2 1
Burned/ Buried 4 17 9
AN
TE-N
ATA
L C
AR
E/D
ELIV
ERY
ANTENATAL CKECKUPS Yes
96 90 94
TETANUS TOXOID IMMUNIZATION (TTI)
Yes 82 87 67
REASONS FOR THE FAILURE OF TETANUS TOXOID
Unaware of need for immunization
17 18 12
Unaware of need to return for the doses
12 6 3

107
SECTOR INDICATORS SUB GROUP OLUBORI ODUN IFA IDI ARABA MOSAFEJO
IMMUNIZATION (TTI)
Place or time of immunization unknown
11 12
Fear of side reaction 20 6 18
Wrong idea about contraindication
14 6 3
Postponed until another time 13 18 18
Cultural/ religious reasons 11 18
Rumours 13 12
Place of immunization too far 8 12 9
Inconvenient in the time of immunization
5 6 6
REASONS FOR THE FAILURE OF TETANUS TOXOID IMMUNIZATION (TTI)
Absent of vaccinator 4 6 3
No vaccination 2 3
Mother too busy 13 18 15
Family problem including illness of mother
4
Mother ill did not visit health facility
4 6 3
Mother visited health facility but not given Immunization
4 6 3
Long waiting time 54 12 44
Type of Health Facility where Child was Born
Government 54 45 39
Private 44 47 57
Traditional 2 8 3
Assistant used with the delivery
Doctor 55 37 44
Nurse/ midwife 41 55 49
Auxiliary midwife 2 4 4 Trained Traditional birth attendant 2 4 2
Reason for not delivering in a Health Facility
Costs too much 14 12 36
Facility closed (strike) 30 55 38
Too far/ no transportation 10 13 9 Don’t trust facility/ poor quality service 5 4 5
Didn’t think it was necessary 20 8 3

108
SECTOR INDICATORS SUB GROUP OLUBORI ODUN IFA IDI ARABA MOSAFEJO
Religious affiliation 21 8 9 Currently having New Born Baby YES 38 35 40 Currently Breast Feeding Baby YES 36 37 43 Awareness of Exclusive Breast Feeding of Children
YES
90 82 84
Lenght of Exclusively Breast Feedin
1 -5months 6 17 10
6months 29 40 34
7-12months 16 15 23
>12months 49 27 34 Pregnant Women in the Last Five Years
YES 37 43 31
Place of Delivery
Public Hospital/ health centre 57 54 50
Private hospital/clinic 37 34 42
Traditional Herbal clinic 3 3 4
Faith base/ spiritual home 2 6 3
At home 1 4 2
Assistant During Delivery
Doctor 71 48 74
Nurse/ midwife 21 33 16
Auxiliary midwife 3 7 3 Trained Traditional birth attendant 4 6 3
Relative/ friends 1 4 4
Self 1
CHIL
DREN
UN
DER
5
Household Having Children Under 5 YES 85 85 81 Under 5 Children that were Registered after Birth
YES
87 82 77 Documentary Evbidence of Under 5 Children that were Registered after
YES
87 75 89

109
SECTOR INDICATORS SUB GROUP OLUBORI ODUN IFA IDI ARABA MOSAFEJO
Birth
Children With Documentary Evidence Of Registered Birth Certificate
YES
15 18 19 Documentary Evidence From Other Source
YES 9 7 6
Other Sources Of Documentary Evidence Of Registered Birth
Church 68 83 14
Mosque 20 13 86
Traditional Birth Attendant 12 4 0 Children That Have Immunization Card Or Achild Health Handbook
YES
99 100 100 Children That Received Bcg That Causes Scar In The Arm
YES
98 100 100 Children That Received Injection To Prevent Measles At Exactly Nine Months
YES
98 100 100 Children Who Received Vitamin A At 6 Months
YES 98 100 100
Children That Received Vitamin A Second Dose At Exactly 1 Year
YES
98 100 100 Children That Received DPT 1 At 6 Weeks
YES 98 100 100
Children Who Received DPT 2 At 10 Weeks
YES 98 100 100
Children That Received DPT 3 At 14 Weeks
YES 98 100 100
Children That Received OPV 0 At Birth Or Till
YES 98 100 100

110
SECTOR INDICATORS SUB GROUP OLUBORI ODUN IFA IDI ARABA MOSAFEJO
Two Weeks
Children That Received OPV 1 At 6 Weeks
YES 98 100 100
Children That Received OPV 2 At 10 Weeks Of Birth
YES
98 100 100 Children That Received OPV 3 At 14 Weeks After Birth
YES
98 100 100
Immnunization Status Of Children
NOT FULLY IMMUNISED 4 7 17
PARTIALLY IMMUNISED 72 76 56
NOT IMMUNISED 24 17 27 Children Fully Immunized Before One Year
YES 74 75 62
Reasons for children not fully immunized before one year of age
Unaware of need for immunization 12 15 4 Unaware of need to return for 2nd and 3rd dose 4 16 6 Place or time of immunization unknown 6 9 3
Fear of side reaction 9 6 3 Wrong idea about contraindication 3 5 1
Postponed until another time 14 7 30
Cultural/ religious reasons 3 6 2
Rumours 2 7
Place of immunization too far 6 6 11 Inconvenient in the time of immunization 5 2 2
Absent of vaccinator 1 1 1
No vaccination 3 5 5
Mother too busy 10 7 8 Family problem including illness of mother 2 1 4 Child ill brought but not given immunization 2 2 1

111
SECTOR INDICATORS SUB GROUP OLUBORI ODUN IFA IDI ARABA MOSAFEJO
Long waiting time 19 7 20
Experience of any illness by children in the last three months
Yes 41 38 34
No 57 59 65
Can't remember 1 1 1
Don't know 1 2 0
Nature of illness experienced by cChildren
Malaria fever 43 47 37
Typhoid fever 6 9 10 Acute Respiratory Infection (ARI) 1 3 1
Cold/catarrh/ cough 22 19 18
Yellow fever 2 1 3
Migraine 1 0 1
Diabetes 0 0 0
Hypertension 0 0 1
Sickle cell Anemia 1 1 1
Hepatitis 1 0 0
Guinea worm infection 0 3 1
Skin disorder 5 2 13
Cholera 1 0 0
Dysentary 2 1 1
Stomach ache 8 7 10
Epilepsy 0 0 1
Diarrhea 3 6 1
Pneumonia 1 0 0 Where Household went to treat Chilren that had Malria, Cough, Pneumonia and diarrhea
Self medication 10 13 6
Chemist Shop 10 17 26
Private Hospital 24 13 18
Ways to Prevent and Control Malaria
Sleep in Insecticide Treated Net (ITN). 33 33 30
Wearing long sleeves. 6 14 13

112
SECTOR INDICATORS SUB GROUP OLUBORI ODUN IFA IDI ARABA MOSAFEJO
Indoor Residual Spraying 22 20 20
Using prescribed drugs 9 9 9
Using mosquito coil. 14 12 14
Clearing the surroundings 16 11 13 Households who have Insecticide Treated Net
Yes 68 63 49
How Households got or obtained Insecticide Treated Net
Procured 22 23 13
Freely given by Government 71 74 77
Freely given by NGOs 8 4 10
Period when Household procured Insecticide Treated Net
Less than 6 Months 10 15 19
6 - 12 Months 22 20 21
12 - 24 Months 22 25 15
24 - 36 Months 10 10 10
36 - 52 Months ( 3 - 5 years) 18 21 12
Greater than 5 years 1 4 0
Can't remember 17 5 23
Period when Household obtained Insecticide Treated Net Given Freely by Government
Less than 6 Months 6 11 10
6 - 12 Months 19 25 28
12 - 24 Months 26 23 15
24 - 36 Months 10 10 9
36 - 52 Months ( 3 - 5 years) 17 21 15
Greater than 5 years 1 4 1
Can't remember 22 6 23
Period when Household obtained Insecticide Treated Net Given Freely by NGOs
Less than 6 Months 3 9 15
6 - 12 Months 6 14 13
12 - 24 Months 8 12 8
24 - 36 Months 3 4 5
36 - 52 Months ( 3 - 5 years) 3 10 8
Greater than 5 years 6 4 1

113
SECTOR INDICATORS SUB GROUP OLUBORI ODUN IFA IDI ARABA MOSAFEJO
Can't remember 71 47 50
Household who slept in Insecticide Treated Net
Father 11 11 16
Mother 16 20 23
Children under five 26 22 27
Children over five 7 7 8
Everyone 31 28 20
Nobody 10 12 7 Household Awareness of Government Freely Provision of Insecticide Treated Nets
Yes
87 72 72 Household members who benefitted from the Free Insecticide Treated Mosquito Net
Yes
62 57 50 Househild members who received Anti-Malaria Drugs for Prevetion of Malaria at the Last or Index Pregnancy
Yes
78 69 76
Doses of Anti-Malaria received
2 doses of SPs 58 56 58
3 doses of SPs 42 44 42 Household Members who Suffered from Malaria in the Last 12 months
Yes
57 57 56 Number of Household Members who Suffered from Malaria in the Last 12 months
Yes
1047 254 354
Signs and High body temperature / Fever 26 25 22

114
SECTOR INDICATORS SUB GROUP OLUBORI ODUN IFA IDI ARABA MOSAFEJO
Symptoms of Malaria of Malaria
Vomiting 12 18 20
Body pains 14 14 14
Loss of appetite 13 13 12
Headaches. 19 20 20
Loss of energy 16 11 11
Place where Household Members went First for Treatment of Malaria
Self medication (no where) 25 23 18
Chemist 31 52 59
Health Centre 26 14 10
Public Hospital 16 10 9
Traditional herbalist 2 1 4 Household who undergo test before commencement of treatment
YES
37 29 32
Types of drug used for the treatment of Malaria for adult
Artemisinin Combination Therapy (ACT) 23 29 23
Choroquine 14 23 29
Paracetamol 25 24 19
SPs: Fansidar, Amalar etc 26 15 20
Herbs 11 10 9
Types of drug used for the treatment of Malaria for children
Artemisinin Combination Therapy (ACT) 18 21 25
Choroquine 20 34 30
Paracetamol 35 29 23
SPs: Fansidar, Amalar etc 15 7 14
Herbs 12 9 8 Community with Public Health Centre
YES 80 46 50
Distance of Public health facility to dwelling
Not too far (<1km) 63 25 36
Far (1-5km) 24 51 51
Very far (>5km) 13 24 14 Preference for Health Care YES 88 72 77

115
SECTOR INDICATORS SUB GROUP OLUBORI ODUN IFA IDI ARABA MOSAFEJO
Centre in the Community
Where household's member seek for health care
Public Hospital / health centre 62 44 40
Private Hospital / clinic 28 35 44
Private physician 2 5 2
Traditional Herbal Clinic 2 2 1
Faith base / Spiritual home 0 2 1
Pharmacy/ Chemist shop 6 13 12
Patronage of Public Hospital/Health Centre in the last one year
YES
41 32 27
Reasons for not patronising Public Hospital/ Health Centre
Bad quality of services 13 19 24
Far from residence 20 42 28
Non-affordable cost of services 7 11 5 Lack of sufficient medical facilities e.g. building, equipment. 7 2 3
Long waiting time 32 17 21 Attitude of health workers (doctor, nurse) 14 8 11
Lack of skilled personnel 7 1 7
Household's Expenditure on Health Care
<N10, 000 30 39 44
N10, 000-N19, 999 6 2 8
N20, 000-N29, 999 6 2 6
>N29, 999 10 6 6
Refuse 47 52 37
Awareness of National Insurance Scheme in Kosofe
YES
39 26 35 Household's member that registered for
YES 4 7 7

116
SECTOR INDICATORS SUB GROUP OLUBORI ODUN IFA IDI ARABA MOSAFEJO
National Insurance Scheme in kosofe Willingness to pre-pay a defined health care package for parents and four children less than 18 years of age
YES
37 40 26
Amount Household's member willing to pre-pay the next one year
<N10, 000 84 70 63
N10, 000-N19, 999 14 25 33
N20, 000-N29, 999 1 4 3
>N29, 999 1 1 0
Household Health Care cost covered by Insurance
YES
9 16 15
Last time Household member visited Public Hospital/health centre
Within the last three month 33 27 26
Within the last six months 22 41 28
Between six months and one year
21 11 16
More than one year 7 7 9
Can’t remember 11 10 12
Don’t know 7 3 9
Satisfaction with Government Health Centre/Hospital
Satisfied 58 42 43
Not satisfied 29 44 47
Undecided 13 15 10
Reason(s) for choice? "Public hospital / health centre"
Quality of services 23 26 22
Closeness to residence 12 10 14
Affordable cost of services 16 21 15 Sufficient medical facilities e.g building, equipment. 12 12 16
low waiting time 8 5 8

117
SECTOR INDICATORS SUB GROUP OLUBORI ODUN IFA IDI ARABA MOSAFEJO
Availability of skilled personnel 17 16 16
Attitude of health workers 11 9 10
Nothing/Don't Know 1 0 0
Reason(s) for choice? "Private hospital/clinic"
Quality of services 21 20 21
Closeness to residence 16 33 20
Affordable cost of services 10 9 10 Sufficient medical facilities e.g building, equipment. 13 8 12
low waiting time 13 12 13
Availability of skilled personnel 13 9 13
Attitude of health workers 12 8 11
Nothing/Don't Know 1 0 0
Reason(s) for choice? "Private physician"
Quality of services 23 26 22
Closeness to residence 12 10 14
Affordable cost of services 16 21 15 Sufficient medical facilities e.g building, equipment. 12 12 16
low waiting time 8 5 8
Availability of skilled personnel 17 16 16
Attitude of health workers 11 9 10
Nothing/Don't Know 1 0 0
Reason(s) for choice? "Traditional herbal clinic"
Quality of services 19 15 20
Closeness to residence 15 30 20
Affordable cost of services 16 22 20 Sufficient medical facilities e.g building, equipment. 8 0 10
low waiting time 15 19 15
Availability of skilled personnel 13 7 5
Attitude of health workers 9 7 5
Nothing/Don't Know 4 0 5
Reason(s) for Quality of services 19 36 14

118
SECTOR INDICATORS SUB GROUP OLUBORI ODUN IFA IDI ARABA MOSAFEJO
choice? "Faith base/Spiritual home"
Closeness to residence 19 18 14
Affordable cost of services 11 9 21 Sufficient medical facilities e.g building, equipment. 11 0 14
low waiting time 7 18 14
Availability of skilled personnel 11 9 14
Attitude of health workers 19 0 7
Nothing/Don't Know 4 9 0
Reason(s) for choice? "Pharmacy/chemist shop"
Quality of services 17 20 21
Closeness to residence 15 23 16
Affordable cost of services 18 19 17 Sufficient medical facilities e.g building, equipment. 11 5 10
low waiting time 12 13 13
Availability of skilled personnel 14 10 8
Attitude of health workers 10 7 16
Nothing/Don't Know 3 3 0
Government Hospital/ health centre Rating on "Provision of drugs"
Excellent 16 6 9
Good 45 28 35
Fair 30 49 33
Poor 10 17 23
Government Hospital/ health centre Rating on "Medical equipment"
Excellent 18 5 12
Good 52 36 46
Fair 26 48 28
Poor 3 11 15
Government Hospital/ health centre Rating on "Quality of Medical Personnel"
Excellent 17 6 11
Good 55 39 45
Fair 23 43 30
Poor 5 13 14 Government Hospital/ health centre Rating on
Excellent 5 3 2
Good 25 22 26

119
SECTOR INDICATORS SUB GROUP OLUBORI ODUN IFA IDI ARABA MOSAFEJO
"Waiting time" Fair 33 49 29
Poor 37 26 42
Government Hospital/ health centre Rating on "Infrastructure(Building, water, electricity)"
Excellent 11 5 5
Good 51 32 48
Fair 30 52 28
Poor 8 10 19 Government Hospital/ health centre Rating on "Attitude of Medical Personnel towards patients"
Excellent 6 4 2
Good 38 28 33
Fair 36 48 38
Poor 20 20 27
Government Hospital/ health centre Rating on "Cost of Drugs / medical test"
Excellent 8 4 4
Good 43 29 38
Fair 37 54 32
Poor 12 13 25
Government Hospital/ health centre Rating on "Quality of service"
Excellent 14 6 10
Good 52 34 42
Fair 28 51 27
Poor 6 10 21
Problems faced in the most recent visit to Government health facility
Unhygienic facilities 6 8 15
Insufficient medical facility 9 25 16 Unfriendly attitude of medical personnel 22 26 22 Insufficient number of doctors or nurses 8 5 6
Long waiting time 35 25 25
Unaffordable service fees 6 3 7
No drugs/medicines available 14 8 10 Rating of quality of health care services at government hospitals or clinics
Improved Significantly 33 19 34
Improved Fairly 44 60 41
Stayed the Same 19 20 18

120
SECTOR INDICATORS SUB GROUP OLUBORI ODUN IFA IDI ARABA MOSAFEJO
Deteriorated Fairly 3 1 6
Deteriorated Significantly 2 0 2


