Page 1
ii
LAMB WAVE PROPAGATION IN PLATE WITH DIFFERENT DEPTH OF
CORROSION DEFECT
NURUL FAHIMA BINTI MOHD KAMEL
This report submitted in partial fulfilment of the requirements for the award of
Bachelor of Mechanical Engineering (Structure and Material)
Faculty of Mechanical Engineering
Universiti Teknikal Malaysia Melaka
JUNE 2015
Page 2
iii
DECLARATION
I declare that this report entitled “Lamb Wave Propagation in Plate with Different
Depth of Corrosion Defect” is the result of my own research except summaries and
quotations which have been acknowledged. The report has not been accepted for any
other degree and is not concurrently submitted in candidature of any other degree.
Signature : ....................................................................
Name : NURUL FAHIMA BINTI MOHD KAMEL
Date : ……..............................................................
Page 3
iv
DEDICATION
Dedicated to my parents,
Mohd Kamel b Ibrahim & Hosnah Ismail
My supporting siblings,
Muhammad Fahmi Akmal bin Mohd Kamel
Nurul Fazilah binti Mohd Kamel
and
My entire friends in UTeM
For their encouragement
Page 4
v
ACKNOWLEDGEMENT
First of all, I would like to take this opportunity to express my gratefulness to
Allah s.w.t for blessing me with strength to complete this project. I would like to thanks
and acknowledge my supervisor, Dr. Nor Salim bin Muhammad for the guidance and
assistance throughout this project.
I also would like to thanks Final Year Undergraduate Project Coordinator,
Engr. Dr. Md. Fahmi bin Abd Samad @ Mahmood for the effort his put in providing
useful additional information and also guidance. Not to forget, to all the lecturers of
Structure and Material Department from Faculty of Mechanical Engineering whom
shared knowledge and valuable information to complete this research.
Most important of all, thanks to my family and fellow friends whom involved
directly or indirectly for their ever loving care towards the success of this study.
Page 5
vi
ABSTRACT
Lamb wave propagation is one of the guided wave techniques that had been
rapidly develop in the industries especially for the inspection of thin plate structures.
Therefore, a study related on the Lamb wave propagation had carried out with the
purpose on investigating and analysing the wave propagation produced when the wave
is in contact with the defect on the thin plate. The plate modelling is perform using the
ABAQUS software and excitation of the wave propagation will be compare with the
experimental waveform propagation. Behaviour of the wave interaction with the defect
will be compared and discuss. The wave modes that are used in the case study are
symmetrical and anti-symmetrical modes which known as S0-mode and A0-mode
respectively. Both wave modes are excited in 6 mm aluminium plate using a 5 cycles
of tone burst signal at canter frequencies of 80 kHz, 100 kHz, and 120 kHz. The Lamb
wave propagation study covers the effect of the wave propagation when different
depths of rounded defects are applied. The study covers the investigation on effect
frequency and the defect orientation into the wave propagation in the plate structures.
Page 6
vii
ABSTRAK
Penyebaran gelombang Lamb merupakan salah satu teknik gelombang
berpandu yang kian berkembang maju dalam industri terutamanya untuk memeriksa
struktur ke atas plat aluminium yang nipis. Oleh itu, satu kajian ke atas gelombang
Lamb telah dijalankan untuk melihat dan menganalisa kesan terhadap penyebaran
gelombang Lamb apabila melalui kawasan yang rosak atau cacat kesan dari hakisan
pada struktur plat. Proses permodelan plat aluminium dilakukan dengan menggunakan
simulasi ABAQUS untuk mendapatkan kesan penyebaran gelombang Lamb. Kesan
penyebaran Lamb secara simulasi akan dibandingkan dengan keputusan gelombang
yang diperoleh secara ujikaji yang sebenar iaitu pada plat aluminium sepanjang 1 m.
Kajian ini juga merangkumi kesan ke atas penyebaran gelombang apabila kedalaman
hakisan pada struktur plat, perbezaan frekuensi yang digunakan untuk menghasilkan
gelombang serta kedudukan hakisan pada plat aluminium. Selain itu, simulasi pada
plat dilakukan untuk mengetahui jenis mod gelombang yang digunakan dalamkajian
sam ada S0-mod mahupun A0-mod.
Page 7
viii
TABLE OF CONTENTS
CHAPTER CONTENT PAGES
SUPERVISOR DECLARATION
AUTHOR DECLARATION ii
DEDICATION iii
ACKNOWLEDGEMENT iv
ABSTRACT v
ABSTRAK vi
TABLE OF CONTENT vii
LIST OF TABLE ix
LIST OF FIGURE x
LIST OF SYMBOL xi
CHAPTER I INTRODUCTION
1.0 Overview
1.1 Background
1.1.1 Technique to Generate the Lamb Wave
Propagation Using Guided Wave
1.1.2 Lamb Wave Propagation
1.2 Advantages of Lamb Wave Propagation
1.3 Problem Statement
1.4 Objectives
1
1
2
3
4
5
5
Page 8
ix
CHAPTER II LITERATURE REVIEW
2.0 Overview of Literature Review
2.1 Dispersion Curve of Phase Velocity and Group
Velocity
2.1.1 Dispersion Curve
2.1.2 Phase Velocity
2.1.3 Group Velocity
2.2 Symmetrical and Anti-symmetrical
2.3 Difference Between Guided Wave and
Ultrasonic Testing
2.4 Material Properties of Plate and Wedge Material
2.4.1 General and Mechanical Properties of
Aluminium plate
2.4.2 Wave properties of wedges
6
6
7
8
10
11
13
12
13
CHAPTER
III
METHODOLOGY
3.0 Overview of Methodology
3.1 Flowchart
3.2 Different Defects on the Wave Propagation
3.2.1 ABAQUS Simulation of Defect in
Aluminium Plate
3.3 Excitation of Lamb Wave Propagation
3.3.1 Wave Excitation on Different Frequencies
and Thickness
3.3.2 Wave Excitation on Different Geometry
and Orientation
3.3.2.1 Oval Defect
3.3.2.2 Round Defect
3.3.3 Wave Propagation Behaviour and Modes
Excitation
3.4 Excitation of Wave Based on Experimental
Work
14
15
16
17
18
19
19
20
21
23
Page 9
x
3.5 Specification of the Lamb Wave Tools and
Apparatus
26
CHAPTER
IV
RESULTS
4.0 Overview
4.1 Wave Propagation Through A Defected Groove
Structure For 1 m Aluminium Plate
4.1.1 Effect on Different Depth Thickness, h
at Frequency of 100 kHz
4.1.2 Effect on Different Sinewave
Frequency at Groove Depth of 4 mm
4.2 Wave Signal Through A Defected Groove
Structure for Fabricated 1 m Aluminium Plate
4.2.1 Wave signal through different thickness
of 100 kHz
4.2.2 Wave signal through different
frequency at 4 mm depth thickness
4.3 Wave Propagation and Signal Through A Defect
Structure for 5 m Aluminium Plate
4.3.1 Effect on Different Depth Thickness, h
at Frequency of 100 kHz
4.3.2 Effect on Frequency on 4 mm Groove
Defect Depth
4.3.3 Effect on Different Orientation at
Frequency of 100 kHz and Defect
Thickness of 4 mm
4.3.3.1 Oval Defect
4.3.3.2 Round Defect
29
30
38
44
44
47
50
50
58
64
64
70
Page 10
xi
CHAPTER
V
ANALYSIS AND DISCUSSIONS
5.0 Overview
5.1 Signal Behaviour on 1 m Aluminium Plate
5.1.1 Excitation of Different Defect Depth for
U1 and U3 Components
5.1.2 Excitation of the Excitation on Different
Frequency Signals For U1 and U3
Components
5.2 Wave Signal Behaviour Based on The
Experimental Testing
5.2.1 Comparison of wave signals for
experimental and simulation in the
different thickness of 1 m groove defect
5.2.2 Comparison of wave signals for
experimental and simulation in the
different frequency of 1 m groove defect
5.3 Signal Behaviour On 5 m Aluminium Plate
5.3.1 Excitation on Different Defect Depth
for U1 and U3 Components
5.3.2 Excitation of Different Frequency
Signals for U1 and U3 Components
5.3.3 Excitation on Different Orientations in
U1 and U3 Components
a) Oval defect
b) Round Defect
5.4 Relation Between A0-mode and S0-mode
76
77
77
80
82
82
86
89
89
92
95
95
98
100
CHAPTER
VI
CONCLUSION AND RECOMMENDATIONS
6.1 Conclusion
6.2 Recommendation
103
104
BIBLIOGRAPHY 105
APPENDIX 108
BLANK PAGE 111
Page 11
xii
LIST OF TABLES
NO. TITLE PAGES
2.1 Material properties of Aluminium Plate 12
2.2 Wave velocity properties for wedge 13
3.1 The specification and function of the Apparatus setup
for excitation of wave signals in 1m plate
26
5.1 peak-to-peak value for A0-mode and S0-mode at
different depth thickness
101
LIST OF FIGURES
NO. TITLE PAGES
1.1 Guided wave set up 3
2.1 Phase velocity and the frequency dispersion of the
dispersion curve
8
2.2 Group velocity and the frequency dispersion of the
dispersion curve
9
2.3 Anti-symmetrical mode 10
Page 12
xiii
2.3 Symmetrical mode 10
3.1 Flow chart of the research activities 15
3.2 Illustration of groove defect on 1 m aluminium plate 16
3.3 Illustration of groove defect on 5 m aluminium plate 17
3.4 Cross section of groove depth of defect in 2-Dimension
for 1 m and 5 m plate
17
3.5 Oval defect 10 mm x 200 mm in ABAQUS Simulation 19
3.6 Oval defect with different orientation 19
3.7 Round defect with four circle defects orientation 20
3.8 Round defect with multi flaw defects 20
3.9 Wave excitation behaviour when the signal is introduced 21
3.10 Force direction for S0-mode 22
3.11 Force direction for A0-mode 22
3.12 Fabricated of 40 mm groove defect with thickness of 2
mm, 3 mm and 4 mm of defect depth
23
3.13 Block diagram to develop the excitation of wave signal in
1 m aluminium plate experiment testing
24
3.14 Figure (a) and Figure (b) shows the apparatus setup for
the transmitter and receiver wave from the pulser
25
3.15 The configuration for wave propagation excitation 26
4.1 Wave interaction behaviour when in contact with 2 mm
defect
30
4.2
Figure (a) and Figure (b) shows the wave signal for
amplitude against time in U1 and U3 components for 2
mm depth
31
4.3 Wave interaction behaviour when in contact with defect
at 3 mm depth
32
4.4
Figure (a) and Figure (b) shows the wave signal for
amplitude against time in U1 and U3 components for 3
mm depth
33
4.5 Wave interaction behaviour when in contact with defect
for 4 mm depth
34
Page 13
xiv
4.6
Figure (a) and Figure (b) shows the wave signal for
amplitude against time in U1 and U3 components for 4
mm depth
35
4.7 Wave interaction behaviour when in contact with defect
for 5 mm depth
36
4.8
Figure (a) and Figure (b) shows the wave signal for
amplitude against time in U1 and U3 components for 5
mm depth
37
4.9 Wave interaction behaviour when in contact with defect
at 80 kHz
39
4.10
Figure (a) and Figure (b) shows the wave signal for
amplitude against time in U1 and U3 components at
frequency of 80 kHz
39
4.11 Wave interaction behaviour when in contact with defect
at 100 kHz 40
4.12
Figure (a) and Figure (b) shows the wave signal for
amplitude against time in U1 and U3 components at
frequency of 100 kHz
41
4.13 Wave interaction behaviour when in contact with defect
at 120 KHz
42
4.14
Figure (a) and Figure (b) shows the wave signal for
amplitude against time in U1 and U3 components at
frequency of 120 kHz
43
4.15 Signal wave for experimental depth defect testing in 1 m
aluminium plate for A0-mode
45
4.16 Signal wave for experimental depth defect testing in 1 m
aluminium plate for S0-mode
46
4.17 Signal wave for experimental depth defect testing in 1 m
aluminium plate for A0-mode
48
4.18 Signal wave for experimental depth defect testing in 1 m
aluminium plate for S0-mode
49
4.19 Wave interaction behaviour for 2 mm thick groove defect
50
Page 14
xv
4.20 Figure (a) and (b) are the wave interaction behaviour for
3 mm thick groove defect
51
4.21 Wave interaction behaviour for 3 mm thick groove defect
52
4.22 Figure (a) and (b) are the wave interaction behaviour for
3 mm thick groove defect
53
4.23 Wave interaction behaviour for 4 mm thick groove defect
54
4.24 Figure (a) and (b) are the wave interaction behaviour for
4 mm thick groove defect
55
4.25 Wave interaction behaviour for 5 mm thick groove defect
56
4.26 Figure (a) and (b) are the wave interaction behaviour for
5 mm thick groove defect
57
4.27 Wave interaction behaviour for frequency of 80 kHz 58
4.28 Figure (a) and (b) are the wave interaction behaviour for
frequency of 80 kHz.
59
4.29 Wave interaction behaviour for frequency of 100 KHz
60
4.30 Figure (a) and (b) are the wave interaction behaviour for
frequency of 100 kHz.
61
4.31 Wave interaction behaviour for frequency of 120 KHz
62
4.32 Figure (a) and (b) are the wave interaction behaviour for
frequency of 120 kHz. 63
4.34 Wave interaction behaviour for axial (180 deg) oval
defect
64
4.35 Figure (a) and (b) are the wave interaction behaviour for
oval defect orientation.
65
4.36 Wave interaction behaviour for axial defect (90 deg) 66
4.37 Figure (a) and (b) are the wave interaction behaviour for
frequency of perpendicular defect
67
4.38 Wave interaction for oblique defect (45 deg) 68
Page 15
xvi
4.39 Figure (a) and (b) are the wave interaction behaviour for
frequency of perpendicular defect
69
4.40 Wave interaction behaviour for 4 round defects 70
4.41 Figure (a) and (b) are the wave interaction behaviour for
frequency of single round defects orientation
71
4.42 Wave interaction behaviour for 2 round defects 72
4.43 Figure (a) and (b) are the wave interaction behaviour for
double defects orientation
73
4.44 Wave behaviour for 4 round defects orientation 74
4.45 Figure (a) and (b) are the wave interaction behaviour for
4 round defects orientation
75
5.1 Wave signals at U1 and U3 at different depth thickness in
1 m aluminium plate
79
5.2 Wave computational results at U1 for different
thicknesses for 1 m aluminium plate
79
5.3 Wave computational results at U3 for different
thicknesses for 1 m aluminium plate
80
5.4 Comparison of the wave signals with different
frequencies in 1 m plate
81
5.5 Wave computational results at U1 for different frequency
82
5.6 Wave computational results at U3 for different frequency
82
5.7 Comparison of different depth thickness for experimental
and simulation for A0-mode
84
5.8 Comparison of different depth thickness for experimental
and simulation for S0-mode
85
5.9 Comparison of different frequencies for experimental and
simulation for A0-mode
87
5.10 Comparison of different frequencies for experimental and
simulation for S0-mode
88
5.11 Wave signals at U1 and U3 at different depth thickness in
5 m plate
90
Page 16
xvii
5.12 Wave computational results at U1 for different
thicknesses
91
5.13 Wave computational results at U3 for different
thicknesses
91
5.14 Wave signals at U1 and U3 at different frequency
93
5.15 Wave computational results at U1 at different frequency
94
5.16 Wave computational results at U3 at different frequency
94
5.17 Wave signals at U1 and U3 at different oval orientation
defect 95
5.18 Wave computational results at U1 at different oval
orientation defect
96
5.19 Wave computational results at U3 at different oval
orientation defect
97
5.20 Wave signals at U1 and U3 at different round orientation
defect
98
5.21 Wave computational results at U3 at different round
orientation defect
99
5.22 Wave computational results at U3 at different round
orientation defect
99
5.23 Method to calculate peak-to-peak (Vpp) values for S0-
mode and A0-mode for 2 mm depth thickness
100
5.24 The difference of amplitude between A0-mode and S0-
mode in 5 m aluminium plate
101
5.25 The difference of amplitude between A0-mode and S0-
mode in 5 m aluminium plate
102
Page 17
xviii
LIST OF SYMBOL
𝑉𝑙 = group velocity of the incident longitudinal wave
𝑉𝑝 @ 𝑉∅ = phase velocity of the incident longitudinal phase
𝜑 = angle of the incident longitudinal wave
𝜔 = Angular velocity, rad/s
C = Wave speed of material, m/s
𝑘 = Wave number
Page 19
1
CHAPTER I
INTRODUCTION
1.0 OVERVIEW
This chapter will cover the overall introduction about the project background,
problem statement of the project, objectives, and the scope of the project.
1.1 BACKGROUND
The theory of Lamb waves was originally been developed by Horace Lamb in
1916 to describe the characteristics of waves propagating in plates. According to Rose
(2002), Lamb wave type propagation can travel not only in a thin plate but also in
multi-layer plates, rods, tubes, pipe and others where the components of vector can be
in parallel and perpendicular to the particle vibration in the vertical plane through the
structure. The Lamb wave opposed to the horizontal shear wave where the particle
motion is normal to the wave vector in a horizontal plane as the waves are propagates
through the plate structure. The Lamb waves referred to plate waves where it had been
introduce in guided wave propagation especially in the thin plate. The ability of the
Page 20
2
Lamb wave to travel in long distance to detect the defect within the plate (Shelke 2011)
currently had been experimented and analysed especially for non-destructive testing
(NDT). Therefore, when some high frequency wave is been shoot to the plate surface,
the wave will be reflect back toward the transducer and the defect can be observe. The
behaviour of the wave propagations is different due to the geometry and the thickness
of the plate structure (Salim et al. 2013). To study the wave propagation of the guided
wave, the piezoelectric transducer, wedges and also thin plate are needed to excite the
asymmetric and the symmetrical mode of the Lamb wave. Therefore, the reflected
wave will be observed and the flaw pattern are been studied.
1.1.1 Lamb Wave Propagation
Lamb waves can be generate in a plate with free boundaries with an infinite
number of modes for both symmetric and anti-symmetric displacements within the
layer. Lamb waves are similar to longitudinal waves, with compression
and rarefaction, but they are bind by the sheet or plate surface causing a wave-guide
effect.
The partial wave technique where wave propagation in plates is considers as a
combination of bulk waves that are reflecting between the boundaries of the plate. This
method provides insight into the physical nature of the Lamb waves. (Ghandhi 2010)
Page 21
3
1.1.2 Technique to Generate the Lamb Wave Propagation Using Guided Wave
There are two common techniques to generate the guided waves such as using
the angle beam transducer by pulsing a piezoelectric element on the wedge placed on
a test plate which had produce a different variety of waves propagated in the structure.
The piezoelectric will leads to the interference pattern of the wave vector. The second
technique is by using the comb transducer where a number of elements are place on
the structure with some spacing that pumps energy into the structure causing the
guided wave to propagate in both directions along the structure.
However, for this case, the technique used for the Lamb propagation is using
the angle beam transducer where the piezoelectric element and wedge are need.
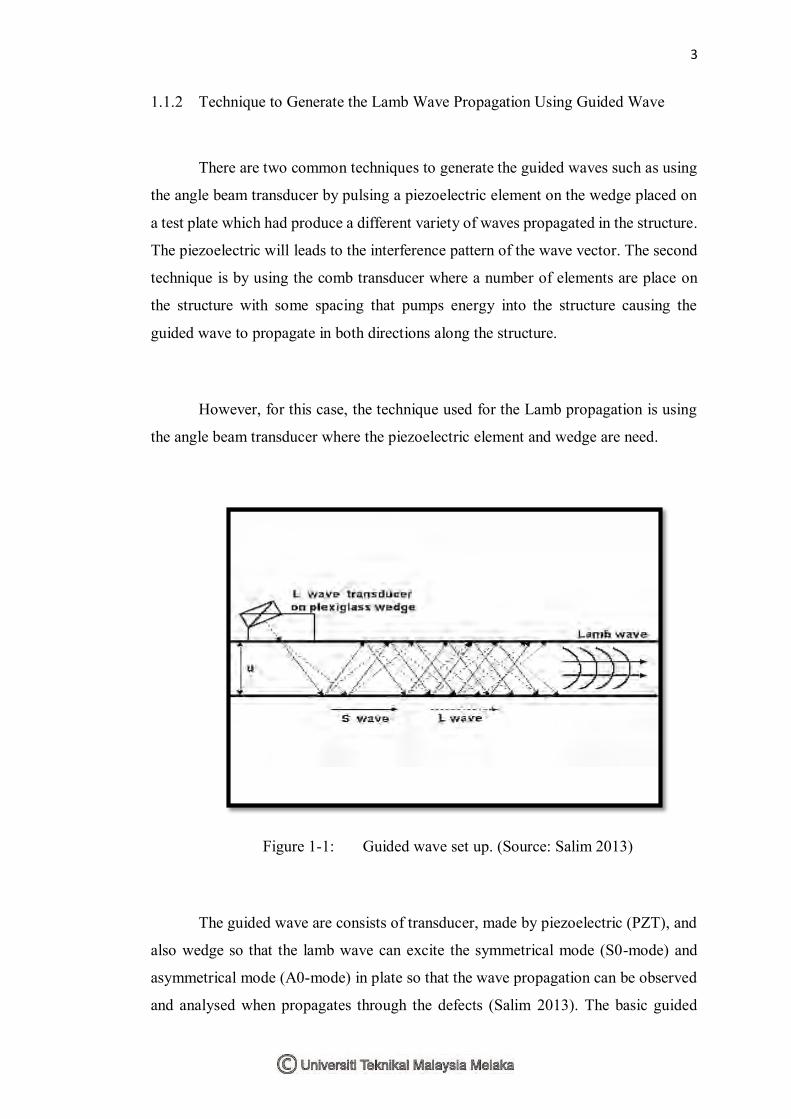
Figure 1-1: Guided wave set up. (Source: Salim 2013)
The guided wave are consists of transducer, made by piezoelectric (PZT), and
also wedge so that the lamb wave can excite the symmetrical mode (S0-mode) and
asymmetrical mode (A0-mode) in plate so that the wave propagation can be observed
and analysed when propagates through the defects (Salim 2013). The basic guided
Page 22
4
setup can be refers in Figure 1.1. The wave can travel in a long inspection distance
where the frequencies for the S0-mode are between 80 kHz to 120 kHz using acrylic
whereas; A0-mode is being excited using the aqualene wedge.
When the Lamb wave propagate through the plate, the defect can be detect
based on the dispersion curve based on the frequency used, therefore the behaviour of
the defect can be measured and analysed (Takahiro et al.2012). The Lamb waves often
refer as the plate wave where the component of the extensional wave is perpendicular
to the surface. The waves are generated when the longitudinal waves are intersects
with a surface and it is very sensitive to a defects. Therefore, as the lamb wave can
travel in a long distance, the defects can easily detected even the spaces are narrow
and difficult to reach.
1.2 ADVANTAGES OF LAMB WAVE PROPAGATION
.
The most important benefit of the guided wave using Lamb wave propagation
is that the inspection area for the specimen in thin plate or pipe will be increase
compared to the Ultrasonic testing technique. The wave propagation of the guided
wave can travel in a long distance with low attenuation. Therefore, most of narrow part
or extremely large area can be inspect easily in a short time. Hence, the defect can be
easily be spotted using the guided Lamb wave propagation.
In addition, using the Lamb wave propagation, the inspected area of plate can
be screened easily using several transducers for the wave excitation. Hence, this
technique will significantly will reduce the time preparation and the work force to do
the inspection testing for industrial purpose.
Page 23
5
For the industrial cases or in a plant, the guided lamb wave techniques are
important to detect the defect on the thin wall of the structure. Hence, any signal
produce on the monitor will signifies the defect on the structure. After all, the
inspection using the Lamb wave are useful as it will gives such a comprehensive
condition information about the defect or crack in or on the structure immediately.
1.3 PROBLEM STATEMENT
Guided wave inspection had been one of the latest techniques in non-
destructive test (NDT) and material evaluation. The propagation of the guided wave
such as Lamb wave are used to detect the defect on the surface structures especially
on the thin plate and reflects the echoes when the defect are detected. The surface
defect can be known when the high frequency of wave is pointed on certain location
of the plate or thin surface. The suitable selection of the guided mode and frequency
range are important for the inspection to be succeeded. As the guided wave
propagation of Lamb wave are still being develop, the potential of guided wave
inspection using Lamb wave propagation to detect the defect are still not being used
domestically in plant and industry. However, the misinterpretation from inexperience
NDT staff might leads to the miss-defect during site inspection. Therefore, this study
will investigate the behavior of wave interaction with different types of defect.
1.4 OBJECTIVES
The objectives in this study are;
1. To study the effect of defect geometries, depths, and orientations on guided wave
propagation.
2. To verify depend of frequency on guided wave propagation.
Page 24
6
CHAPTER II
LITERITURE REVIEW
2.0 OVERVIEW
This chapter will focus on the dispersion curve and the beam focusing on the
guided waves of Lamb Wave propagation. The review are gathered based on the past
research from the journals, technical papers, reference books, which related article on
guided waves of Lamb Wave propagation.
2.1 DISPERSION CURVE OF PHASE VELOCITY AND GROUP
VELOCITY
2.1.1 Dispersion Curve
Based on Rose (2013) in Materials Evaluation, the dispersion curve can be
relate by the relation between the phase velocity and the frequency or the frequency
and thickness of the plate structure. Dispersion curve shows all the constructive
interference zones that could be create as the waves are reflected inside a structure,