688

LANDOLT-BORNSTEIN Numerical Data and Functional Relationships
in Science and Technology
N&v Series Editors in Chief: K.-H. Hellwege - 0. Madelung
Group III : Crystal and Solid State Physics
Volume 19 Magnetic Properties of Metals
Subvolume a
3d, 4d and 5d Elements, Alloys and Compounds
K. Adachi * D. Bonnenberg * J. J. M. Franse R. Gersdorf . K. A. Hempel
K. Kanematsu - S. Misawa * M. Shiga M. B. Stearns * H. l? J. Wijn
Editor: H. P J. Wijn
Springer-Verlag Berlin Heidelberg New York London Paris Tokyo

ISBN 3-540-15904-5 Springer-Vcrlag Berlin Heidelberg New York ISBN o-387-15904-5 Springer-Verlag New York Heidclbcrg Berlin
CIP-Kuntitelnufnnhme der Dcutschcn Bihliothek
Zoldmwrrermd Fenkrioncn our Nnrlrririsst~nsrR~Jf/Ipn md ~~chnili!Lsndolt-RBmstein.- Berlin: Hcidelbcrg:Ncu York: London:Paris:
Tokyo.Springer. Pnrnllclf : Numericnl dntn and functional rclationrhips in science and technology- Tcilw mit d. Erschcinungzorten
Berlin. Hcidcltq?. New York - Teilw. mit d. Erscheinungwrtcn Berlin. Hcidclhcrg. New York.Tokyo - N.S. teilw Geumthrsx : 0.
Madelung
NE. Land&. Han% [Beg]: PT
N.S. Gecnmfhrsg : K.-FL Hellwge: 0. Madclung. Gruppe 3. Kristnll- und Festk6rpcrphysik. Ed. 19. Mngnetirchc EigcnschaRen van
hlcfnllen Teilbd 8. 3d-, 4d- und 5d-Elcmentc. Legicnmgcn und VcrbindungenK Adachi ,., Hrsg.: H.P.J. Wijn. - 19X6.
ISRN 3-530-l 5904-S (Berlin . ..)
ISRN O-387-15901-5 (NW York . ..)
NE: lIcll\~c~e. Karl-Hein-/ [Hrs_c]: Madclung. Otfried [Hrsg.]: Wijn. Heminn PJ. [Hrsg.]; Adachi. Kcng [Mitverf]
This work is subject to copyright. All rights are reserved, whether the whole or part of the material is concerned, specifically those of translation, reprinting, reuse of illustrations, broadcasting,
reproduction by photocopying machine or similar means, and storage in data banks. Under $54 of the German Copyright Law, where copies are made for other than private use, a fee
is payable to “Verwertungsgesellschaft Wart”, Munich.
0 by Springer-Verlag Berlin Heidelberg 1986
Printed in Germany
The use of registered names, trademarks, etc. in this publication does not imply, even in the absence ofa specific statement, that such names arc exempt from the relevant protective laws and regulations
and therefore free for general use.
Typesetting. printing and bookbinding: Briihlschc Universititsdruckerei, Gicsscn
2163/3020-5432 10
Editor
H. P. J. Wijn
Institut IIir Werkstoffe der Elektrotechnik der Rheinisch-Westfalischen Technischen Hoch- schule Aachen, Templergraben 55, D-5100 Aachen
Contributors
K. Adachi Department of Physics, Nagoya University, Chikusa-ku, Nagoya 464, Japan
D. Bonnenberg Institut ftir Werkstoffe der Elektrotechnik der Rheinisch-Westfalischen Technischen Hoch- schule Aachen, Templergraben 55, D-5100 Aachen
J. J. M. Franse Natuurkundig Laboratorium der Universiteit van Amsterdam, Valckenierstraat 65, 1018 XE Amsterdam, Nederland
R. Gersdorf Natuurkundig Laboratorium der Universiteit van Amsterdam, Valckenierstraat 65, 1018 XE Amsterdam, Nederland
K. A. Hempel
Institut fir Werkstoffe der Elektrotechnik der Rheinisch-Westfalischen Technischen Hoch- schule Aachen, Templergraben 55, D-5100 Aachen
K. Kanematsu Department of Physics, Nihon University, Kanda-Surugadai, Chiyoda-ku, Tokyo 101, Japan
S. Misawa Department of Physics, Nihon University, Kanda-Surugadai, Chiyoda-ku, Tokyo 101, Japan
M. Shiga Department of Metal Science and Technology, Kyoto University, Sakyo-ku, Kyoto 606, Japan
M. B. Stearns Department of Physics, Arizona State University, Tempe, Arizona, 85287, USA
H. P. J. Wijn Institut fI.ir Werkstoffe der Elektrotechnik der Rheinisch-Westfalischen Technischen Hoch- schule Aachen, Templergraben 55, D-5100 Aachen

Vorwort
Metalle, Legierungen und Verbindungen, die such andere Elemente des Periodensystems enthalten (eine Inhaltsiibersicht fur den ganzen Band III/19 befindet sich auf der Innenseite des vorderen Buchdeckels). Da jedoch selbst geringe Mengen solcher Elemente einen grol3en EinfluD auf die Eigenschaften der Substanzen haben kiinnen, erschien es verniinftig, im jetzigen Teilband such d-Ubergangselemente und Legierungen mit kleinen, aber genau delinierten Zusatzen anderer Elemente aufzunehmen. Die Definition von ,,gering“ ist natiirlich weitgehend willkiirlich und hangt von der jeweiligen Legierung ab.
In der Forschung und in der Literatur auf dem Gebiet des Magnetismus findet ein allmahlicher Ubergang im Gebrauch von cgs/emu-Einheiten zu SI-Einheiten statt. Es wurde jedoch davon abgesehen, alle Daten in den Einheiten eines einzigen Systems darzustellen, wie vorteilhaft dies such immer von einem systematischen Standpunkt aus betrachtet gewesen ware. Stattdessen ist dem System von Einheiten, das die Autoren der zitierten Arbeiten urspriinglich benutzten, meistens der Vorzug gegeben. Damit treten cgs/emu-Einheiten bei weitem am hauligsten auf. Dem Benutzer des Bandes wird selbstverstandlich auf mehreren Wegen geholfen die Daten in das System von Einheiten zu iibertragen, das ihm am gelaufigsten ist, so z. B. durch eine Liste der Delinitionen, Einheiten und Umrechnungsfaktoren fur die am htiufigsten auftretenden magnetischen Gr6Den. Besonderer Dank gebiihrt den Autoren fur die angenehme Zusammenarbeit, der Landolt- Bornstein-Redaktion, hier insbesondere Dr. W. Finger und Frau G. Burfeindt, fur die grol3e Hilfe beim Bewlltigen der redaktionellen Arbeit, sowie dem Springer-Verlag fur die Sorgfalt bei der Veroffentlichung dieses Bandes.
Wie alle anderen Bande des Landolt-Bbrnstein wurde such dieser Band ohne finanzielle Hilfe von anderer Seite veriiffentlicht.
Aachen, September 1986 Der Herausgeber
Preface Since the appearance in 1962 of Landolt-Bernstein (6th Edition), Volume II, part 9, dealing with the magnetic properties of a wide variety of substances, the number of alloys and compounds with interesting magnetic properties has enormously increased. The prepar- ation of these substances aimed, in the first place, at a better understanding of the magnetic behaviour of the already well-known substances, but it also accelerated the industrial development of new magnetic materials with optimized properties for various applications. Progress in electronics as well as the development of new measuring techniques has also led to an enormous extension of the knowledge of intrinsic magnetic properties. Since 1970 several volumes of the Landolt-Bornstein New Series have been devoted to, or at least contain data about, the magnetic properties of some special groups of substances. The present Volume 19 of Group III (Crystal and Solid-State Physics) will deal with the magnetic properties of metals, alloys and metallic compounds which contain at least one transition element. It was not attempted, however, to be very critical about the metallic character of the substances discussed. Where appropriate, semiconductors and even insulators have been included. Regarding the properties to be listed, not only data on magnetic properties but also on those nonmagnetic properties have been included which, to some extent, depend on the magnetic state of the metallic system. The literature that appeared until about one year before the publication of each subvolume has been covered.

VIII Preface
The amount of information available has become so substantial that a larger number of subvolumes is needed to cover the reliable data on magnetic properties of metals. The data arc not arranged according to specific magnetic properties, but rather follow the lines of the various groups of magnetic substances. It appeared during the organization of the work that in this way the largest coherence within the contents could bc obtained. This was also reflected in the experience that in this way competent authors could be found who, in their contributions to this volume, covered important groups of metals, instead of a single, narrowly defined magnetic property.
The first subvolumcs will deal with the intrinsic magnetic properties of metals, i.e. data on those magnetic properties are represented in tables and figures which depend only on the chemical composition and on the crystal structure of the metal. Data on properties that, in addition. depend on the preparation of the samples used in the mcasurcments, as is for instance the case for thin films and for amorphous alloys, will be given in the last subvolumc. A clean-cut division is of course illusory for at least two reasons. In the first place the properties of metals and alloys can be depend on the chemical purity and on the physical quality of the crystal. And moreover, in alloys the ordering of the various atoms in the crystal lattice may in some cases influence the magnetic properties.
This first subvolumc, 111/19a, deals with the magnetic propcrtics of metals and alloys of the 3d. 4d, and 5d transition elements. Subsequent subvolumes will treat metals, alloys and compounds that also contain other elements of the periodic table (see the survey of contents for the Volume 19 on the inside front cover). However, since small amounts of such elements can have a large influence on the properties of the solvent, it appeared reasonable to include in the present subvolumc d transition metals and alloys that contain very small. but well-defined additions of other elements. The definition of “small” is of course rather arbitrary and may depend on the alloy under discussion.
In the field of magnetism, there is a gradual transition from the use of cgs/emu units to SI units. It was. however, not intended to represent all data in the units of one system, regardless of how nice this would have been from a systematic point of view. Instead, mostly preference was given to the system of units that was originally used by the authors whose work is quoted. Thus cgs/emu units occur most frequently. Of course the user of the tables and figures is helped in several ways to convert the data to the units which he is most familiar with, see, e.g., the list of definitions, units and conversion factors for the magnetic quantities occurring most frequently.
Many thanks are due to the authors for the agreeable cooperation, the Landolt-Biirnstein editorial office in Darmstadt, especially Dr. W. Finger and Frau G. Burfeindt, for the great help with the editorial work, and to the Springer-Verlag for the carefulness with respect to the publication of this volume.
Like all other volumes of Landolt-Bernstein, this volume is published without outside financial support.
Aachen, September 1986 The Editor
List of symbols
Symbol Unit Quantity Introduced in subsect.
Page
A erg crnm3 exchange stiffness constant A A-2 area of extremal Fermi surface cross section AU-) Gcm3g-’ Oe-“2 magnetization expansion coefficient of H”’ term AU-) MHzG-’ ratio of NMR frequency and spontaneous
Ai A; Oe-’
a a, Oij B B B awl 4
&h,, b b II b, bi c,
A K-”
bar G. T T T
magnetization linear saturation magnetostriction coefficient forced linear saturation magnetostriction
coefficient lattice parameter magnetization expansion coefficient of T” term electrical conductivity expansion coefficient bulk modulus magnetic induction applied magnetic flux density residual flux density rf field maximum energy product lattice parameter susceptibility expansion coefficient susceptibility expansion coefficient magnetoelastic coupling constant Curie constant per unit mass
cm
c,. c,.
C
c C
cij D Dn D(EA d E E
GOe A Oem2 K-2 dyn cmm2 cm3 Kg-’ m3K kg- ’ cm3K mol- ’ m3K mol-’ calK-’ mJK-’ A
Curie constant per mole
heat capacity at constant pressure/volume
lattice parameter concentration
ms-’ Mbar eVA2
E.3
A-’ Mbar J, erg ev, RY ergcmm3
velocity of light elastic constant spin wave stiffness constant spin wave stiffness expansion coefficient electronic density of states at the Fermi energy inverse distance of nearest-neighbor plane Young modulus energy
EF ES e
e2clQ F F(rl. El
eV meV
mms-’
(eV)- l
free energy per unit volume of magnetocrystalline anisotropy
Fermi energy spin wave energy electron charge electric quadrupole splitting Stoner (Landau) enhancement factor spectral weight function 1.1.2.9
1.1.2.10 1.1.2.11 1.1.2.4 1.1.2.8
1.1.2.6 1.1.2.6
85 91 34 59
48 49
1.1.2.9 73 1.3.8 513
XIX
1.1.2.8 59
1.3.4 506 1.3.2 494 1.1.2.6 48 1.1.2.3 30
1.1.2.9 72 1.1.2.9 73
1.1.2.5 41
1.1.2.9 72
1.3.1 491 73

List of symbols XIII
Symbol Unit Quantity Introduced in subsect.
Page
F(Q)
? G G G hkl
9
9’
90
91
2
H aPPl
H.4
HC
H eff
H hyp H hyp, eff H core H ext & H orb
H hi res hi’ I I IS J
J K K Kl K orb
KS
K
Ku
KS
KR K&i
k’ k, k k b L L 1 Al/l M
MG Mbar
A-’
mms-’ mms-’
Oe, Am-’
2 Am-’ Oe Oe Oe Oe Oe Oe Oe Oe
Oe
Oe-’
mms-’
meV Mbar
ergcmw3 erg cmm3 erg crnm2
magnetic form factor of the unit cell magnetic crystal structure amplitude magnetic form factor dHvA frequency shear modulus free energy reciprocal lattice vector for hkl reflection spectroscopic splitting factor magnetomechanical ratio ground state splitting excited state splitting free energy expansion coefficient magnetic field applied magnetic field anisotropy field coercive field effective magnetic field magnetic hyperfine field effective magnetic hyperfine field Is, 2s and 3s core electron contribution to Hhyp external field contribution to Hhyp 4s electron contribution to H,,, unquenched orbital moment contribution
to Hhyp
resonance magnetic field magnetostriction coefficient forced magnetostriction coefficient nuclear spin quantum number exchange interaction constant isomer shift total angular momentum quantum number
of atom exchange integral bulk modulus Knight shift d spin contribution to Knight shift d orbital contribution to Knight shift s contact contribution to Knight shift magnetocrystalline anisotropy constant uniaxial anisotropy constant surface anisotropy constant Kerr rotation coefficient expansion coefficient of 1, wavevector Fermi wavevector light extinction coefficient modulus of Jacobian elliptic function Boltzmann constant Widemann-Franz ratio film thickness interatomic distance thermal expansivity ion mass
1.1.2.7 52 1.1.2.7 52
1.1.2.11 91
1.3.4 506 1.1.2.7 52
1.1.2.8 61 1.1.2.8 61 1.3.4 506
XIX
1.1.2.9 72 1.1.2.8 58
1.1.2.8 58 1.1.2.8 58 1.1.2.8 58 1.1.2.8 58
1.1.2.6 48 1.1.2.6 49
1.1.2.3 30
1.3.6 508 1.3.6 508 1.3.6 508 1.3.6 508 1.1.2.5 41
1.1.2.10 85 1.1.2.12 113 1.1.2.6 48
1.1.2.12
1.1.2.13 118
113

XIV List of symbols
Symbol Unit Quantity Introduced in subsect.
Page
hi
nt m* h’ hT hT A II n n Ii
40
P P
P P P
Pelf
Pi Plot PhdPd Porb
Pspin
Ei
:Q
ii QO q 4
4( R R R RO
G Am-‘, T G Am-‘, T PB
g-l, kg-’
states eV atom spin
kbar PB
PB
PB
PB
PB
PB
PB
PB
PB
PB
;I:
kHz mms-’ pVK-’
A-’
A n
RcmG-’ m3C’
magnetization XIX
spontaneous (saturation) magnetization
Fourier transform of unit cell magnetization 1.1.2.7 52 dynamic component of magnetization 1.1.2.10 85 component of the magnetization in direction 1.1.2.7 52
of the magnetic field at position x electron mass effective electron mass number of atoms per unit mass demagnetizing factor Avogadro constant shell parameter number of electrons per atom refractive index complex index of refraction
1.1.2.12 113 1.1.2.12 113
density of states at energy E
probability distribution expansion parameter of magnetocrystalline
anisotropy expansion parameter of R, pressure atomic magnetic moment in paramagnetic
phase atomic magnetic moment in paramagnetic
phase, derived from Curie-Weiss law average magnetic moment (average) magnetic moment per atom (average) conduction electron magnetic moment
1.1.2.5 41
1.1.2.6 48
1.1.2.3 30
1.1.2.3 30
1.1.1.3 7
per atom magnetic moment of impurity atom average localized magnetic moment per atom (average) magnetic moment of atom M orbital magnetic moment per atom spin magnetic moment per atom spin density wavevector wavevector of momentum transfer electric quadrupole splitting quadrupole shift thermoelectric power gyroelectric parameter amplitude of gyroelectric parameter phase of gyroelectric parameter wavevector expansion parameter of 1, atomic radius; distance electrical resistance reflectivity of light roll reduction ordinary (normal) Hall coefficient
1.1.1.3 6
1.1.2.8 61 1.1.2.13 118 1.2.1.2.12 269 1.2.1.2.12 271 1.2.1.2.12 271
1.1.2.6 48
1.1.2.13 118 XIX

List of symbols xv
Symbol Unit Quantity Introduced in subsect.
Page
QcrnG-l m3 C-l A
PB
PB
K, “C K K K K
K K K K, “C K K
K K K K s s s
S
s
cm3 A3 cm3 ems-l
mJmol-’ Ke5j2 K-’
rad
mJmol-’ Km4
extraordinary (spontaneous, anomalous) Hall coefficient
shell radius expansion parameter of 1, atomic long-range order parameter spin quantum number of atom spin density wave amplitude of n-th spin density wave harmonic neutron scattering function expansion parameter of magnetocrystalline
anisotropy shape magnetostriction volume magnetostriction expansion parameter of 1, temperature temperature related to maximum in x annealing temperature ferromagnetic Curie temperature commensurate-incommensurate transition
temperature spin glass freezing temperature Kondo temperature martensitic transition temperature melting point temperature Neel temperature superconducting transition temperature;
transition temperature between two types of magnetic order
spin flip transition temperature spin reorientation temperature tetragonal phase transition temperature transition temperature nuclear longitudinal (spin-lattice) relaxation time nuclear transverse (spin-spin) relaxation time nuclear relaxation times T,, T2 at position x
in the domain wall time annealing time expansion parameter of 1, volume volume per atom molar volume velocity concentration Cartesian coordinates atomic number spin wave specific heat coeffkient linear thermal expansion coefficient ultrasonic attenuation coefficient Kerr effect direction cosine of angle between magnetization
and crystallographic axis lattice specific heat coefficient
1.1.2.13 118 XIX
1.1.2.6 48
1.1.1.3 6 1.1.1.3 6 1.1.2.9 73 1.1.2.5 41
1.3.7 512 1.3.7 512 1.1.2.6 48
1.3.2 494
1.1.2.8 59
1.1.2.6 48
1.1.2.13 118
1.1.2.12 113 1.1.2.5 41
1.1.2.13 118

XVI List of symbols
Symbol Unit Quantity Introduced in subsect.
Page
A2
0e-2 K-2 meV mJmol-’ Ke2 kHzG-’
A eV eV
coefficient in spin wave dispersion relation direction cosine of the direction in which
the change in length due to magnctostriction is measured
expansion coefficient of 1, expansion coefficient of magnetic susceptibility expansion coefficient of magnetic susceptibility magnon lincwidth of spin fluctuations electronic specific heat coefftcicnt gyromagnetic ratio fraction of 3d electrons in E, state amplitude of periodic lattice distortion exchange splitting band gap incommensurability parameter of spin
K K rad. deg
mJmol-‘K
bar-’ A-’ w
Wcm-‘K-l
s-1
Oe-’
s-1
density wave transverse (equatorial) Kerr effect critical exponent of r enhancement factor relating magnetic hyperfine
field to spontaneous magnetization enhancement factor E at position x in the
domain wall thermal expansivity strain dielectric tensor real part of dielectric tensor element imaginary part of dielectric tensor element ellipticity of light reflected in polar Kerr effect paramagnetic Curie temperature Debye temperature angle angle between magnetization and wavevector q
of spin wave nuclear specific heat coeflicicnt light absorption index compressibility inverse correlation range of spin fluctuations photon wavelength thermal expansion thermal conductivity electron-phonon interaction constant Landau-Lifshitz damping parameter linear saturation magnetostriction forced linear magnetostriction expansion coefficient of i, expansion coefficients of %, volume magnetostriction fluctuation term in x(q, 8)
Poisson ratio permeability of free space Bohr magneton nuclear Bohr magneton ground state nuclear magnetic moment frequency
1.1.2.9 72 1.1.2.6 48
1.1.2.6 48 1.3.4 506 1.3.2 493 1.1.2.9 73 1.1.2.13 118
1.1.2.11 92 1.1.2.11 92 1.1.1.3 8
1.1.2.12 113 1.1.2.9 73 1.1.2.8 58
1.1.2.8 58
1.1.2.12 113
1.1.2.3 30
1.1.2.9 72
1.1.2.13 118
1.1.2.9 73
1.3.1 491 1.1.2.10 85 1.1.2.6 48 1.1.2.6 48 1.1.2.6 48 1.1.2.6 50
1.1.2.3 30
1.1.2.8 61
List of symbols XVII
Symbol Unit Quantity Introduced in subsect.
Page
s-1
gcmm3 pR cm pQ cm @cm @cm kbar Gcm3 g-’ Am2 kg-’ Vsmkg-l Gcm3 mol-’ Am2 mol - 1 Vsmmol-’ Gcm3g-l Gcm3g-’
Gcm3g-’
R-l cm-’ R-‘cm-’ 0-l cm-l
R-‘cm-’
S
S
rad, deg eV cm3 g-’ m3 kg-’ cm3 mol- 1 m3 mol-l cm3 cmm3 m3 mm3 cm3g-’ cm3 mol-’ cm3 g-l cm3 g-’ cm3 g-’
cm3 mol-’
cm3 mol-’ cm3 mol-’
NMR frequency expansion coefficient of G density resistivity element of resistivity tensor Hall resistivity magnetoresistance tensile stress magnetic moment per unit mass
1.3.4 506
1.3.8 513 1.1.2.13 118
XIX
magnetic moment per mole XIX
remanence spontaneous (saturation) magnetic moment 1.1.2.4 34
per unit mass magnetic moment per unit mass for magnetic
field in hkl direction electrical conductivity element of electrical conductivity tensor real part of electrical conductivity tensor
1.1.2.12 113 1.3.8 513
element imaginary part of electrical conductivity tensor
element reduced temperature pulse length average time between collisions angle work function magnetic mass susceptibility
1.1.2.11 91
1.1.2.11 94 XIX
magnetic molar susceptibility XIX
magnetic volume susceptibility XIX
high-field magnetic susceptibility 1.1.2.4 34
low-field magnetic susceptibility initial magnetic susceptibility spin susceptibility of noninteracting electrons diamagnetic susceptibility of core electrons diamagnetic susceptibility orbital magnetic susceptibility d-orbital magnetic susceptibility spin-orbit interaction contribution to magnetic
1.3.2 493
1.1.2.4 40 1.3.2 493 1.3.2 493
susceptibility orbital magnetic susceptibility Pauli spin susceptibility s, p, d spin susceptibility spin susceptibility ac susceptibility wavevector-dependent magnetic susceptibility wavevector- and frequency-dependent magnetic
susceptibility
1.1.2.4 40 1.3.2 493 1.3.2 493
1.1.2.9 73 1.1.2.3 30
XVIII List of symbols
Symbol Unit Quantity Introduced in subsect.
Page
4’ 4’
&!I,@ H
rad. deg
s-1
s-1
s-1
Oe-’
angle spin antisymmetric part of quasiparticle
interaction function Landau parameter angular frequency cyclotron frequency spin wave dispersion relation volume magnetostriction spontaneous (saturation) volume
magnctostriction forced volume magnetostriction
1.3.1 491 1.3.1 491
1.1.2.11 91 1.1.2.9 12 1.1.2.6 48
1.1.2.6 52
Definitions, units and conversion factors
In the SI. units are given for both defining relations of the magnetization, B = u,,(H + M) and B = poH + M, respectively. u0=4rt. IO-‘Vs A-’ m- ‘, A: molar mass, e: mass density.
Quantity cgsjemu SI
B G=(ergcm-3)1/2 T=Vsm-* 1Gs 10-4T
H Oe = (erg cme3)*‘* Am-’ IOes 103/4rrAm- ’
M B=H+4nM B=p,(H+M) B=p,H+M G Am-’ T 1GG IO3 Am-’ 4~. 10-4T
P P=MI' P=MV P=MV Gcm3 Am* Vsm 1 Gcm3s 10m3 Am* 47r.lO-l’Vsm
5 o= M/Q ~==M/Q u= M/Q Gcm3g-’ Am* kg- ’ Vsm kg-’ lGcm’g-‘G 1 Am* kg-’ 4n.10-7Vsmkg-’
5, a,,,=cA o,,,=aA o,=aA Gcm3mol-’ Am* mol - ’ Vsmmol-’ 1 Gcm3mol-‘2 10-3Am2mol-1 4rr~10-‘“Vsmmol-1
P=)IH P=xH cm3 m3 lcm3; 4n. 10m6m3 xv = x/v X”=XIV cm3 crne3 m3mm3 1 cm3cmw3& 4nm3me3 xg = x,-/e cm3g-r
xp = xv/e m3 kg-’
lcm3g-‘s 4n.10-3m3kg-1 Xltl=XgA cm3 mol- ’
Xm=XpA m3 mol-’
1 cm3mol-’ 4rt~10-6m3mol-1
P=%PoH m3 4~. 10e6 m3 X”=%lV m3 mw3 47rm3mm3 xp = XVI@ m3 kg- ’ 4x~10-3m3kgg1 Xlll=%gA m3mol-’ 47r~10-6m3mol-1
Ro. R, Q,,= R,Bf4nR,M, ell = ROB+ P~R,M, e,,=RoB+fW, RcmG-’ m3C-’ m3C-’ IRcmG-‘g 100m3C1 100m3Cr
AF AFo AF, AF, ARPES bee CAF CPA cw cw dCEP dhcp dHvA DM DOS EDC F FC fee FI FID FMR GM hcp KK KS L LA LEED LIAF LSDW MAG ME MSM NBS NMR P PAC PP If RKKY RRR RSM RT SAS sCEP SDW SE SG
List of abbreviations
antiferromagnetic commensurate spin density wave state transverse incommensurate spin density wave state longitudinal incommensurate spin density wave state angle-resolved photoemission spectroscopy body-centered cubic commensurate spin density wave state coherent potential approximation Curie-Weiss-type paramagnetism continuous wave d conduction electron polarization double hexagonal close-packed de Haas-van Alphen diffraction method density of states energy distribution curves ferromagnetic field-cooled face-centered cubic ferrimagnetic free induction decay ferromagnetic resonance giant magnetic moment hexagonal close-packed Kramers-Kroenig analysis Kohn-Sham potential Lifshitz point longitudinal acoustic low-energy electron diffraction longitudinal incommensurate spin density wave state longitudinal spin density wave magnetization Miissbauer effect moving-sample magnetometer National Bureau of Standards, nuclear magnetic resonance paramagnetic perturbed angular correlation technique Pauli-type paramagnetism radio frequency Rudermann-Kittel-Kasuya-Yosida residual resistance ratio rotating-sample magnetometer room temperature small-angle scattering s conduction electron polarization spin density wave spin echo spin glass
SRARPES spin-resolved, angle-resolved photoemission spectra
xx List of abbreviations
SRMO SWR SXPS TAS TE TIAF TQ TRM TSDW UPS vBH XPS ZFC
short-range magnetic order spin-wave resonance soft X-ray photoelectron spectroscopy triple axis spectroscopy thermal expansion transverse incommensurate spin density wave state magnetic torque measurement method thermoremanent magetization transverse spin density wave ultraviolet photoemission spectroscopy von Barth-Hedin exchange correlation potential X-ray photoelectron spectroscopy zero-field cooled

Ref. p. 221 1.1.1.1 Ti 1
1 Magnetic properties of 3d, 4d, and 5d elements, alloys and compounds
1.1 3d elements
1.1.1 Ti, V, Cr, Mn
Survey
Metal Property Fig. Table
Ti
v
Cr
a-Mn
p-Mn y-Mn 6-Mn Mn-H
I$-) xm(T) (C/T> (T2> x&T) SDW m magn. phase diagram xg(T) TN (x,14 (Ala) (4 04 latent heat (x) W/l) CT> elastic properties
magn. structure x,( T> e4,,,) PMn
T,(P, xl Knight shift (T)
icAT) x,(T) L(T)
1, 2, 4, 5, 7, 8 3 6
9
10, 12-16, 19 11, 23 17, 18, 30 20-22 23-27, 29 19 28
31 32-34
35 3638 39
4&42 43
36, 38, 44 36,45 36 46,47
1
2
3
4 5
7 8
1.1.1.1 Ti
Titanium metal is a Pauli paramagnet; no localized magnetic moments have been observed. Since Ti becomes superconducting below 0.4 K, probably no magnetic ordering occurs.
The crystallographic structure of a-Ti, the most stable phase at room temperature, is hexagonal; in single crystals the magnetic susceptibility is therefore a function of the angle between the direction of the magnetic field and the c axis.
Next to a-Ti, there are two other phases of Ti known: P-Ti, with a body-centered cubic crystallographic structure, which is stable above 1155 K [56 M 11, and o-Ti, with a hexagonal crystallographic structure, stable only under high pressure, but metastable at pressure zero [74 D 11. The susceptibilities of all phases of Ti are given in Figs. 1...5 and Table 1. For the low-temperature specific heat properties, see Table 2 and Fig. 6.
Dilute alloys of titanium with aluminum have been investigated by [71 C 11, see Fig. 7, and, for completeness, also Fig. 8.
Frame, Gersdorf

2 1.1.1.1 Ti [Ref. p. 22
Table 1. Room temperature values of the magnetic mass susceptibility ,+ of cold-rolled commercial grade cr-Ti. for three directions of the magnetic field [77A 11.
Measuring direction Xe[10-6cm3g-‘]
Rolling direction 3.04 Perpendicular to sheet 3.32 Perpendicular to rolling 3.12
3.8 I -10 5 Cm3 a-Ti
+rl single cryslo
2.6 -xov J , 0 100 200 300 LOO K
I-
Fig. 1. Tempcraturc depcndcncc of the magnctic mass susceptibility xp of various polycrystallinc a-Ti speci- mcns, and of a single crystal of cc-Ti [7OC I].
IO
Sample Impurity in wt%
02 N2 Cl, Mg Sn Fc
TS 0.086 HP 0.037 ID 0.040
Crystal 0.0063
0.01 I - 0.004 0.037 0.003 Cr = 0.0078 Zr=0.002 A1=0.0015
0.01 0.01 0.00 I - - 0.009
(Fe, Cr. Ni) all < 0.001
0.003
Frame, Gersdorf

Ref. p. 221 1.1.1.1 Ti 3
3.02 w6 cm3 - 9
2.94
I 2.90
.& 2.86 I I I 141 I
2.82
2.78
2.14
2.70
4.683 8,
4.682
I
4.681
u 4.680 -
4.679
4.678
4.677 0 50 100 150 200 250 K 3 ;oo
T- Fig. 2. Temperature dependence of the magnetic mass susceptibility xs of a single crystal of pure a-Ti compared with the temperature dependences of the lattice param- eters a and c [67 E 11. The susceptibility of Ti is seen to be practically temperature-independent up to about 70K. The low-temperature upturn is accountable to a trace of dissolved Mn [71 C 11, see also [72V 11.
2.75
2.50 0 50 100 150 200 250 K 300
a T- Fig. 4. Temperature dependence of the magnetic mass susceptibility xp ofpolycrystalline samples of a- and w-Ti. (a) Impurity content of the samples: C and 0: 5 1 . 10m2 at%; Al: < 1. 10m3 at%; S, N, Cu, Fe, V, Mn: ~3. 10e4at%; other elements: < 1. 10m5at% each [74D 13.
1.50 10-6 :m3 s
1.112
I U8 _ G
.34
.30
,951 w ,950
.949
I .948 D
,947
946
,945
60 40-6 cm3 ia
48
40
I 32 E
3
16
8
0 I I I I I I h
200 400 600 800 1000 K 12 T-
Fig. 3. Temperature dependence of the crystalline an- isotropy of the magnetic molar susceptibility. Ax, = xl1 -x1 of Ti, Zr, and Hf [74 V 11.
5.5 ;lOm" Ti --.-- cm3 ,- -
9 ?L-!L--
t
4.5 I
2.5 1 0 500 1000 1500 K 2000
b) shows xn vs. T for an exteL=perature range: the different lines represent data of different authors.
Franse, Gersdorf
4 1.1.1.1 Ti [Ref. p. 22
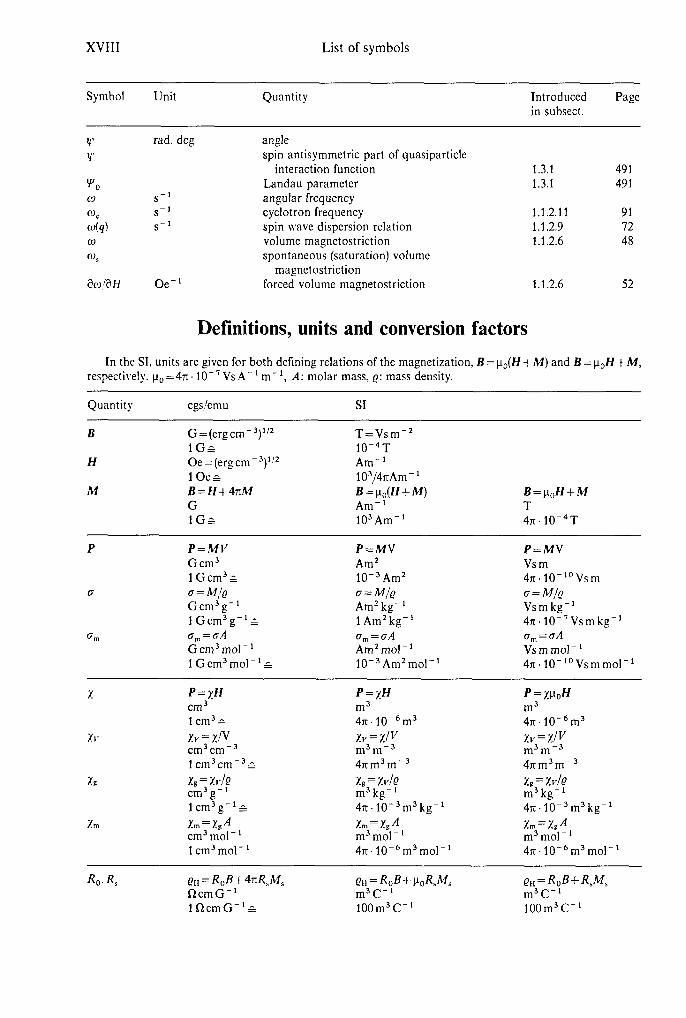
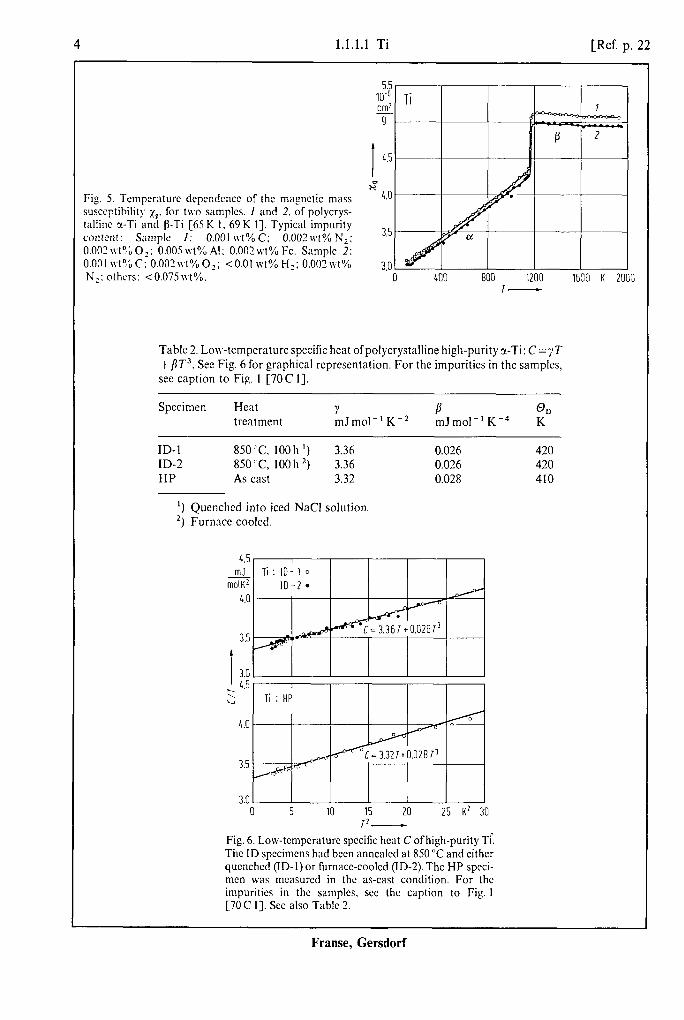
Fig. 5. Tcmpcraturc dcpcndcncc of the magnetic mass susceptibility lE. for two samples. I and 2. of polycrys- tallinc r-Ti and P-Ti [65 K I. 69 K I], Typical impurity content: Sample I: 0.001 wt%C: 0.00-7n?%Nz; 0.002 \vt?b 02; 0.005 \vt% Al: 0.002 vvt% Fc. Sample 2: 0.001 \vt?6 C: O.O02\vt% O>; <O.Ol wt% Hz: O.O02\vt% N?: others: <0.075~1%.
5.5 1O-6 Tj cm3 - g-
I 1.5
2? 4.0
3.5
3.0 0 400 800 1200 1630 K 2003
r-
Table 2. Low-temperature specific heat ofpolycrystalline high-purity x-Ti: C=;T + /IT3. See Fig. 6 for graphical representation. For the impurities in the samples, see caption to Fig. 1 [7OC 11.
Specimen Heat Y B 00 treatment mJmol-’ K-* mJmol-’ Km4 K
ID-l 850 T, 100 h ‘) 3.36 0.026 420 ID-2 850 ‘C, 100 h ‘) 3.36 0.026 420 HP As cast 3.32 0.028 410
‘) Quenched into iced NaCl solution *) Furnace cooled.
L.5 mJ - .
molK* 4.0
3.0 0 5 10 15 20 25 K* 30
Fig. 6. Low-tcmpcraturc spccilic heat C ofhigh-purity Ti. The ID specimens had been anncalcd at 850°C and either qucnchcd (ID-l) or furnace-cooled (ID-Z). The HP spcci- men was mcasurcd in the as-cast condition. For the impurities in the samples. SW the caption to Fig. I [70 C I]. See also Table 2.
Frame, Gersdorf

Ref. p. 221 1.1.1.1 Ti
3.1
I
3.0 @ 9
2.9 3.0 H” I
3.0 2.9 ;
2.9 3.0
3.0 2.9
2.9 1 I I I I 0 100 200 300 K 400
T-
Fig. 7. Temperature dependence of the magnetic mass susceptibility xp ofa family ofsingle-phase (ol) Ti-Al alloys [71 c 11.
2.12 xl-6 cm3 9
I
2.56
x” 248
2.40
0 100 200 300 SKI K 500 I-
Fig. 8. Temperature dependence of the magnetic mass susceptibility xp of a single crystal Ti,Al compared with the temperature dependences of the lattice parameters ~71 c i j.
Franse, Gersdorf

6 1.1.1.2 v/1.1.1.3 Cr [Ref. p. 22
1.1.1.2 v
Vanadium metal is a Pauli paramagnet. Neutron diffraction measurements revealed no localized magnetic moments: if they exist they are smaller than 0.01 pII [77A 23. Since vanadium becomes a superconductor at 5.265 K. probably no magnetic ordering occurs.
Vanadium has a body-centered cubic crystallographic structure; the magnetic susceptibility is isotropic, and a smooth function of temperature above the superconducting transition. see Fig. 9; it is possible that 1 shows a very shallow maximum between IOOK and 200K [65 K 11. A good room temperature value is: ,~,=7.3' lo-‘m3/kg.
Somctimcs discontinuities have been observed in the susceptibility and other physical propertics of V at temperatures between 120.‘.240 K. Rostoker and Yamamoto [5.5 R l] observed a crystallographic transition at - 30 ‘C: this has not been confirmed by later investigations. Kostina [71 K l] found a peak in the susceptibilit) at 240 K. and corresponding anomalies in the resistivity and the Hall effect. Kondorskii [73 K l] found two peaks. respectively at 120K and 190K. and corresponding anomalies in the magnetostriction and thermal expansion.
The nature of these not very reproducible anomalies, which were sometimes interpreted as a hypothetical antifcrromngnetic Nlel point. is at the moment not understood.
The magnetomcchanical ratio of vanadium is g’= 1.18(10) [71 H 11.
6.5 nb ?- 3
6.0
I g 5.5
1.5 0 LOO 800 1200 1600 K 20
T- Fig. 9. Temperature dependence of the magnetic mass susceptibility xc for polycrystallinc V. Curve I: [65 K I], sample impurities. in [wt%]: 0.032C; 0.070,; 0.031 N,; 0.001 H,; others ~0.095. 2: [61 B I]. 3: [62T I]. 4: [53 K I].
1.1.1.3 Cr
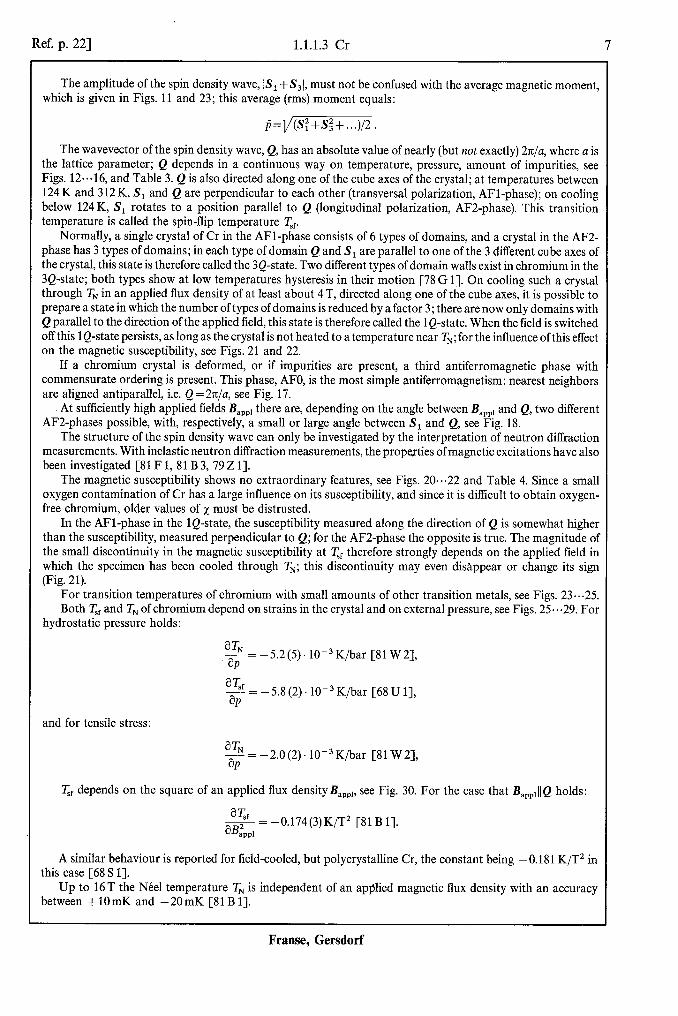
The crystallographic structure of chromium metal is body-centered cubic, and its magnetic structure is very pcculinr. Chromium is antifcrromagnctic at tempcraturcs below the N&l point (T,) of about 312K. This antiferromagnetism is, however. not caused by local magnetic moments aligning themselves antiparallel; Overhauser [62 0 l] showed that the antiferromagnetic ordering in chromium may be described by a spi,~ demit~ 11~71.c in the itinerant 3d-electrons, having a wavelength incommensurate with the lattice constant. For the concurrent sinusoidal periodic lattice distortion (strain wave), see [74T 11. Whereas in some other substances spin density waves only exist as excitations, in Cr metal at low temperatures the ground state is a spin densit) wave with a finite amplitude, set Fig. 10.
Analytically, the magnetic moment per atom in antiferromagnetic Cr, as a function of the position in space. R, is given by:
S(R)=S,cos(Q.R)+S,cos(3Q.R)+...,
where the main amplitude of the magnetic moment, S,, has a value of about 0.6 pu at low temperatures, and a value ofabout 0.2 p” just below TN [6.5A 11. S, is always directed along one of the cube axes of the body-centered cubic crystal lattice: S, is always directed opposite to S,, and has an absolute value of a few percent of S,, the “spin density wave” S(R) is therefore somewhat more “rectangular-like” than a pure sine function, see [81 I l] and Fig. 19.
Frame, Gersdorf
Ref. p. 221 1.1.1.3 Cr 7
The amplitude of the spin density wave, IS, +S,J, must not be confused with the average magnetic moment, which is given in Figs. 11 and 23; this average (rms) moment equals:
The wavevector of the spin density wave, Q, has an absolute value of nearly (but not exactly) 27c/a, where a is the lattice parameter; Q depends in a continuous way on temperature, pressure, amount of impurities, see Figs. 12.. .16, and Table 3. Q is also directed along one of the cube axes of the crystal; at temperatures between 124 K and 312 K, S, and Q are perpendicular to each other (transversal polarization, AFl-phase); on cooling below 124K, S, rotates to a position parallel to Q (longitudinal polarization, AFZphase). This transition temperature is called the spin-flip temperature T,,.
Normally, a single crystal of Cr in the AFl-phase consists of 6 types of domains, and a crystal in the AF2- phase has 3 types of domains; in each type of domain Q and S, are parallel to one of the 3 different cube axes of the crystal, this state is therefore called the 3Q-state. Two different types of domain walls exist in chromium in the 3Q-state; both types show at low temperatures hysteresis in their motion [78 G 11. On cooling such a crystal through TN in an applied flux density of at least about 4 T, directed along one of the cube axes, it is possible to prepare a state in which the number of types of domains is reduced by a factor 3; there are now only domains with Q parallel to the direction of the applied field, this state is therefore called the lQ-state. When the field is switched off this 1 Q-state persists, as long as the crystal is not heated to a temperature near TN; for the influence of this effect on the magnetic susceptibility, see Figs. 21 and 22.
If a chromium crystal is deformed, or if impurities are present, a third antiferromagnetic phase with commensurate ordering is present. This phase, AFO, is the most simple antiferromagnetism: nearest neighbors are aligned antiparallel, i.e. Q = ~TE/U, see Fig. 17.
At sufficiently high applied fields Bapp, there are, depending on the angle between II,,,, and Q, two different AFZphases possible, with, respectively, a small or large angle between S, and Q, see Fig. 18.
The structure of the spin density wave can only be investigated by the interpretation of neutron diffraction measurements. With inelastic neutron diffraction measurements, the properties of magnetic excitations have also been investigated [Sl F 1, 81 B 3, 79 Z 11.
The magnetic susceptibility shows no extraordinary features, see Figs. 20...22 and Table 4. Since a small oxygen contamination of Cr has a large influence on its susceptibility, and since it is difficult to obtain oxygen- free chromium, older values of x must be distrusted.
In the AFl-phase in the lQ-state, the susceptibility measured along the direction of Q is somewhat higher than the susceptibility, measured perpendicular to Q; for the AF2-phase the opposite is true. The magnitude of the small discontinuity in the magnetic susceptibility at 7$ therefore strongly depends on the applied field in which the specimen has been cooled through TN; this discontinuity may even disappear or change its sign (Fig. 21).
For transition temperatures of chromium with small amounts of other transition metals, see Figs. 23...25. Both T,, and TN of chromium depend on strains in the crystal and on external pressure, see Figs. 25...29. For
hydrostatic pressure holds:
Wi -=-5.2(5).10-3K/bar [SlW2], aP
w, -=-5.8(2).10-3K/bar [68Ul], aP
and for tensile stress:
_ = -2.0(2). 10m3K/bar [Sl W2], ap
T,, depends on the square of an applied flux density Bappl, see Fig. 30. For the case that B,,,,JQ holds:
aKf z = -0.174(3)K/T2 [81 B 11. mpp*
A similar behaviour is reported for field-cooled, but polycrystalline Cr, the constant being -0.181 K/T2 in this case [68 S 11.
Up to 16T the NCel temperature TN is independent of an applied magnetic flux density with an accuracy between +lOmK and -2OmK [8lBl].
Franse, Gersdorf
8 1.1.1.3 Cr [Ref. p. 22
Accurate measurements show no detectable hysteresis of the NCel point TN in well-annealed, pure Cr [8OW2]; 7;, has a hysteresis of about 1 K [82 B 11.
Free energy expressions, dependent on the applied field and/or the strain, are given by [81 B 21 (near T,,) and [SOW 1] (near TN).
Surface magnetization of Cr has been mentioned by [82S 11. The magnetic anisotropy torque of Cr in the 3Q-state, and of Cr in the IQ-state, was measured by [64 M I]. It appears that both at Th. and ‘T;, chromium has a first-order phase transition [65A 11. The latent heat of
transition at T,, is 0.04(2) J/mol [82 B 11. For the latent heat at TN, see Table 5. The relative change in the volume at 7;, is - 1.4(6). 10m6 [69 S 11, at TN the change in volume could not be
measured due to a change in the thermal expansion, see Fig. 31; it can be calculated to be about -2. 10e5. In the lQ-state. chromium shows a tetragonal or, depending on the previous treatment, an orthorhombic
deformation (or magnetostriction) of the order of magnitude 10e5 [69 S 11. Small effects of the magnetic ordering on the elastic constants have been investigated, see Figs. 32...34 and
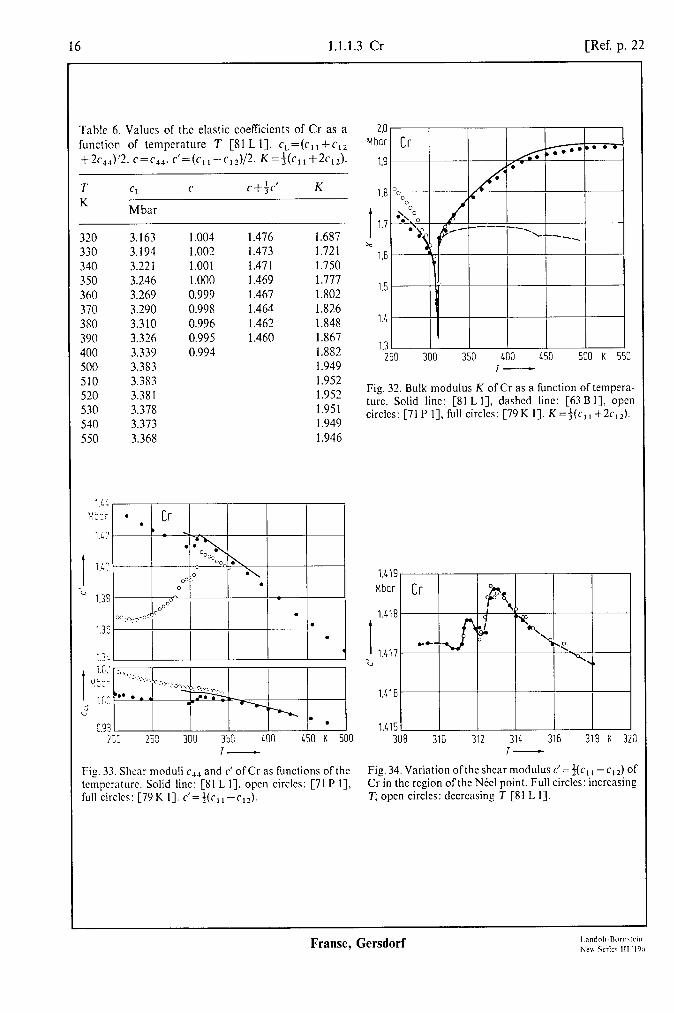
Table 6. The magnetomechanical ratio of chromium metal is q’= 1.21(7) [71 H 11.
Table 3. Data for the magnetic period of the spin density wave in Cr, based on the position of the (100) satellite lines in the neutron diffraction spectrum [64K 11. Q: spin density wavevector, 6-l = (I -Qo/Zx)- 1 : length of antifcrromagnetic modula- tion, see Fig. 10, divided by lattice constant a.
T Q@~ 6-1 K
Cr 197 0.9554 22.4(8) 78 0.9519 20.8 *)
Cr -0.45 at% V 197 0.9480 19.2(8) 78 0.943 1 17.6(8)
*) [62S 11.
Corner atoms
Body-center atoms
Body-center Corner atoms otoms
Fig. 10. Spin density wave in Cr [Sl F 11. The magnetic moments oftwo successive atoms on the body-diagonal of the cubic lattice arc antiparallel. The magnitude of the atomic moments on each sublattice is given by a sinusoi- dal function of the position.
Franse, Gersdorf

Ref. p. 221 1.1.1.3 Cr
Cr-V
Fig. 11. V concentration dependence of the rms average magnetic moment per atom, ~7, for Cr-V alloys, deduced from the total coherent magnetic neutron scattering near the position of the (100) reflection. Solid circle: [62 W 11, open circle: [64K 11, cross: Hamaguchi et al., see [64K 11.
“piiZfX~-l “piiZfX~-l I I
3.2 3.2 l+C ’ 1 c l+C ’ 1 c
Lo Lo
I I 3.6 3.6 /I ~lo-~ ~lo-~ v I
6!= ~(1-6.0.0) 6!= ~(1-6.0.0) I
“.tb K 250 T-
Fig. 13. Incommensurability parameter 6 = 1 -Qu/2rc for a Cr-0.68 at% Mn single crystal as a function of tempera- ture. The hysteresis in 6 persists outside the coexistence region of the commensurate-incommensurate phases [81 G 11. I: incommensurate AFl phase, C: commensu- rate APO phase (S = 0); the AF2 phase does not occur in this alloy.
t
0.960
# Y 0.95E s
0.952
0.948
. -
v
0 0.2 0.4 0.6 0.8 1.0 r/r, -
Fig. 12. Temperature dependence of the relative length Qa/2n of the spin density wavevector for Cr as a function of the reduced temperature T/T,, at various pressures [68Ul].
0.964
0.962
0.960
t 0.958
# 2 0.956 Q
0.948
0.946 0 12 3 4 5 6 kbar 7
P-
Fig. 15. Pressure dependence of the relative length of the spin density wavevector Qaf2x of Cr at two reduced temperatures [68 U 11.
For Fig. 14, see next page.
Franse, Gersdorf
10 1.1.1.3 Cr [Ref. p. 22
0.972’:
0.967:
0.955:
0.97X
0.9525
0.95oc
Cr-0.8ot%Co > I
1Cr-0.780t%Fe I/ I
‘Cr-l.OZot%Fe ) !
300
I 50 100 150 200 250 300 K 350
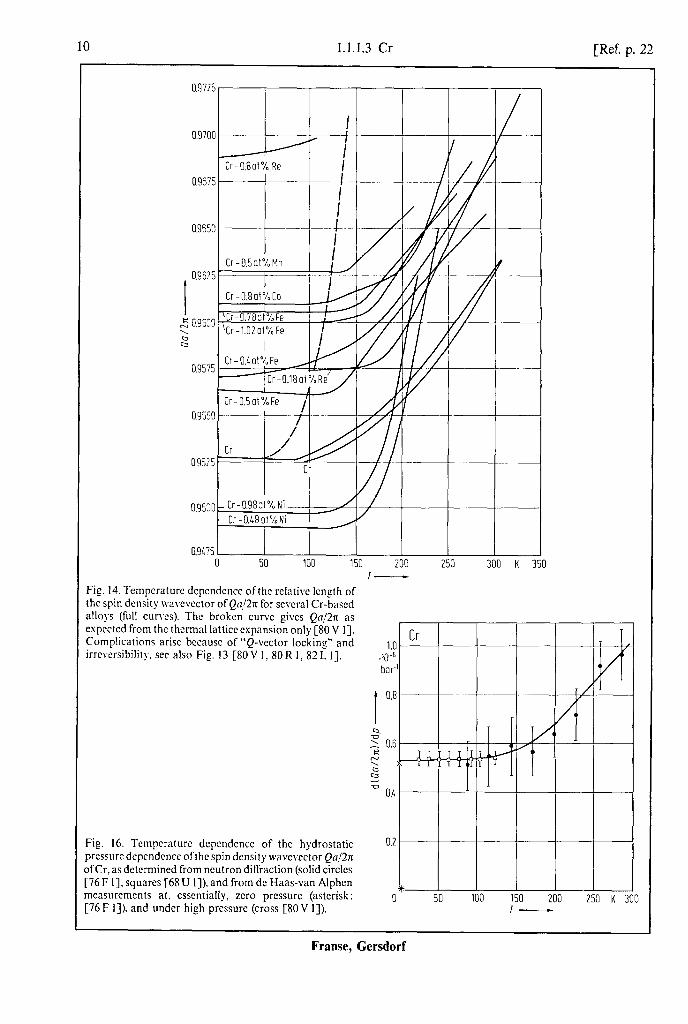
-ig. 14. Temperature dcpcndcncc ofthc rclativc length of hc spin density wavevector of Qo!2rr for scvcral Cr-based alloys (full curves). The broken curve gives Q0/2rt as ,xpcctcd from the thermal lattice expansion only [80 V 1). lomplications arise because of “Q-vector locking” and rreversibility. see also Fig. 13 [80 V I, 80 R 1, 82 L I].
:ig. 16. Tcmpcrature dcpcndcnce of the hydrostatic ncssurc depcndcncc ofthc spin density wavcvcctor Qn/271 fCr, as determined from neutron diffraction (solid circles 76 F I]. squares [68 U I]). and from de Haas-van Alphcn reasurcmcnts at. essentially, zero prcssurc (asterisk: 76 F 11). and under high pressure (cross [SO V I]).
1.c .W bar.
0.2
0
Cr
i
50 100 150 200 250 K : I-
Frame, Gersdorf

Ref. p. 221 1.1.1.3 Cr
0 0 100 200 300 400 K 500
Fig. 17. Magnetic phase diagram in Cr for (a) annealed sample,(b) swaged sample, and (c)crushed powder sample [Sl W 11. P: paramagnetic, AFO: commensurate, Q = 2x/a, AFl : transverse incommensurate, AF2: longi- tudinal incommensurate.
I I Cr-2 1 Cr-?7at%V
I r Cr-0.3at%V--
I I
II I I I I II II I I
0 0.01 0.02 0.03 0.04 0.05 0.06 0.07 0.08
60
20
0 -16 -14 -12 -10 -8 -6 -4 -2 K 0
A hf -
Fig. 18. Phase diagram of Cr in high applied fields B,,,i as derived from ultrasonic attenuation experiments. Q and q are the wavevectors of the spin density wave (parallel to the z axis of the crystal) and the ultrasonic wave, respectively; 0 is the angle between B,,,, and Q. Solid and dashed lines give the position of, respectively, the peaks and humps in the ultrasonic attenuation a(T), separating distinct phases. (a): 0= 1 ll”, (b): 0= 15.8”, (c): 0=21.3” [Sl B 11.
Fig. 19. Ratio of the third harmonic amplitude to the primary spin density wave amplitude S&S,, and the displacement amplitude of the periodic lattice distortion A ofpure Cr, Cr-Mn, and Cr-V alloys as a function ofthe incommensurability parameter 6, Q = 2x/4 1 - 6,0,0). The values determined from the rigid and the deformable spin model are shown by open and solid circles, respec- tively [Sl I 11.
Franse, Gersdorf

12 1.1.1.3 Cr [Ref. p. 22
L.6 .10-5 cm3 9
42
I ?T
3.8
Iable 4. Magnetic mass susceptibility xF of Cr 163 W 11. Impurities: 0.0008 wt%N,, 0.02 wt%O,; netal impurities: very low concentration. Set also Fig. 20.
l- %g T %g K 10-6cm3g-’ K 10-6cm3g-’
100 3.082 1070 150 3.121 1120 200 3.148 1170 250 3.185 1220 290 3.210 1270 3’0 3.23 1320 370 3.24 1370 420 3.27 1420 470 3.30 1470 520 3.32 1520 570 3.34 1570 620 3.40 1620 670 3.42 1670 720 3.43 1720 770 3.46 1770 820 3.47 1820 870 3.52 1870 920 3.56 1920 970 3.61 1970
10’0 3.64 2020
3.67 3.71 3.74 3.75 3.76 3.81 3.88 3.90 3.93 4.02 4.05 4.09 4.14 4.18 4.22 4.23 4.24 4.26 4.29 4.32
I I I
500 1OOC 1500 K 20 I-
Fig. 20. Tempcraturc dcpcndence of the magnetic mass susceptibility xp for polycrystallinc Cr. I: [58 L I]: II: [52M 11; III: [64M2]; IV and V: [64W I]; for sample impurities, see Table 4.
0.3 .lOP r cm:
1
-is-
0.2
E ? P
g 0.1
Fig. 22. Variation of the anisotropy of the magnetic mass susceptibility officld-cooled Cr at 85 K as a function ofthc applied flus density acting on the spccimcn as it cools
n through TX [66P I]. Cooling field
3.2, w cm: 9 3.1
- I I 3.2
G-7
3.1
2.8 7
b LOO K 500 100 125 150 K 175
a Fig. 21. Tempcraturc depcndencc of the magnetic mass (b) Cr cooled through TN in an applied flux density of 5 T susceptibility xp ofsingle-crystal Cr. (a) Cr cooled in zero acting along [OOI]. Open triangles: measurements along applied field; zoo, and lo,, refer to mensurcmcnts along [OlO]; solid triangles: measurements along [OOl]; solid cube cdgcs and face diagonals, respcctivcly. circles: mcasurcments along cube edge for Cr cooled in
zero applied field, included for comparison [66P I], see also [64 M I].
Frame, Gersdorf
Ref. p. 221 1.1.1.3 Cr 13
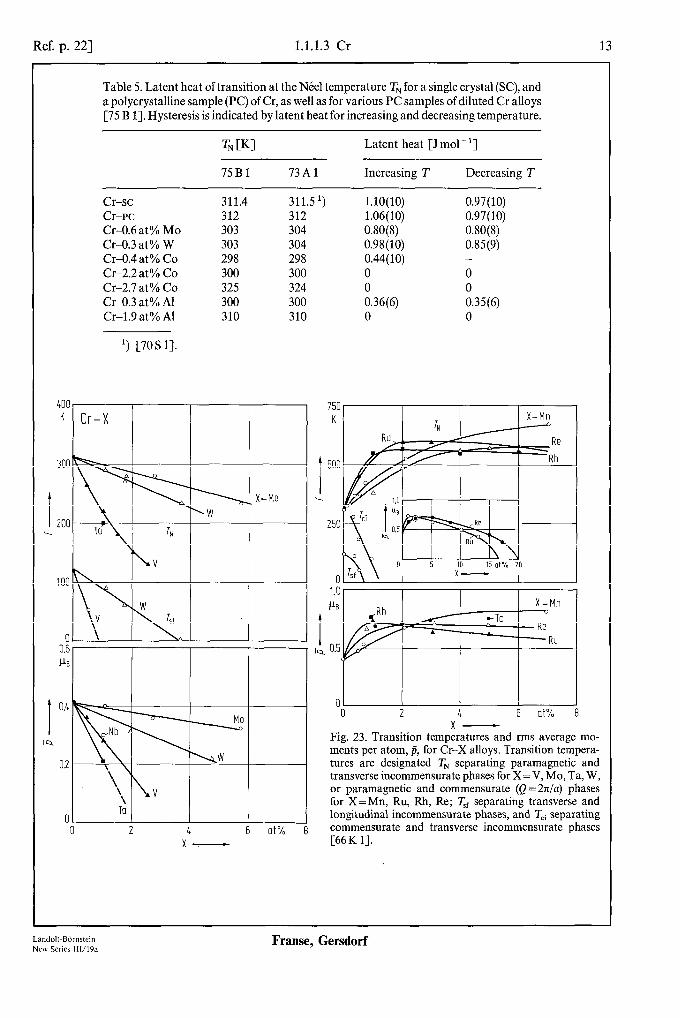
Table 5. Latent heat of transition at the Nbel temperature TN for a single crystal (SC), and a polycrystalline sample (PC) of Cr, as well as for various PC samples of diluted Cr alloys [75 B 11. Hysteresis is indicated by latent heat for increasing and decreasing temperature.
Cr-sc Cr-pc Cr-0.6 at% MO Cr-0.3 at% W Cr-0.4 at% Co Cr-2.2 at% Co Cr-2.7 at% Co Cra.3 at% Al Cr-1.9 at% Al
TN WI
75Bl
311.4 312 303 303 298 300 325 300 310
73Al
311.5 ‘) 312 304 304 298 300 324 300 310
Latent heat [J mol-‘1
Increasing T Decreasing T
l.lO(lO) 0.97(10) 1.06(10) 0.97(10) 0.80(8) 0.80(8) 0.98(10) 0.85(9) 0.44(10) -
0 0 0 0.36(6) :.35(6) 0 0
‘) [7OS 1-J.
0 0 2 L 6 at% 8
x-
01 0 2 $ 6 at% 8
x- Fig. 23. Transition temperatures and rms average mo- ments per atom, j, for Cr-X alloys. Transition tempera- tures are designated TN separating paramagnetic and transverse incommensurate phases for X=V, MO, Ta, W, or paramagnetic and commensurate (Q = 27c/a) phases for X=Mn, Ru, Rh, Re; T,, separating transverse and longitudinal incommensurate phases, and Tci separating commensurate and transverse incommensurate phases [66 K 11.
Landolt-Bornstein New Series 111/19a
Franse, Gersdorf

14 .1.1.3 Cr [Ref. p. 22
v-
16 K
I
kbor 12
0. =: 8 e= m
4
Cr-Co a
310
I
K
285 LT
260
Fig. 24. Concentration depcndcncc of the N&cl tcmpcra- Fig. 25. Nkl temperature TF: and its pressure dependence turc Ts for Cr-V alloys. dcduccd from rcsistivity minima: as functions of the Co concentration in Cr. derived from open circle [64 K I]. solid circles [62 T 11. resistivity mcasurcmcnts [SO K 11.
I
compression
I
290 295 300 305 310 K 3 r, -
320 K\
300 1 h
!g@Jj
0 12 3 4 5 6 lkbor 8 P-
Fig. 26. Variation of the N&l tcmpcraturc TN with Fig. 27. Pressure dependence of the Neel temperature T, hydrostatic prcssurc p for 99.99% Cr [81 W 21, solid lint and the spin flip temperature T,, of Cr [68 U I]. [65hl I].
Frame, Gersdorf

Ref. p. 221 1.1.1.3 Cr
10.0 kbar
I
1.5
5.0 b
2.5
0 310 315 320 325 330 K 3:
TN -
Fig. 28. Variation of the NCel temperature TN of Cr (defined as the minimum in the temperature derivative of the resistivity) with the tensile stress 0 [Sl W 21.
-12 -10 -8 -6 -4 -2 K AT,, -
0 16.9” -v 22.5"
a 28.1" v 33.8"
I
Fig. 30. Depression ofthe spin-flip temperature, AT,,, of Cr by an applied flux density B,,,, making various angles 0 with Q along the z axis, determined from the positions of the peaks in the attenuation a(T) ofultrasonic waves with wavevectors q/IQ. The line corresponding to 0=0 is a least-squares fit to the data points [81 B 11.
325, I
0 2 4 kbor 6
Fig. 29. NCel temperature TN as a function ofpressure for the alloy Cr-3.38 at% Co [SO K 11.
lsf
-30 1 80 120 160 200 240 280 K
T-
-I 320
Fig. 31. Temperature dependence of the differential thermal expansivity E = Al/l of single-Q, single-crystal Cr. Solid curves, crosses, and circled crosses represent data. The dotted curve is a linear interpolation of E, between zero at TN and s,‘just above T,,. The dashed curve is the zero reference resulting from setting E,EO in the AFl phase. In the AFl phase s,=O, sp=(cl/al)-1, E,
=(b,/a,)-1. In the AF2 phase &,=(~~/a~)--1, Ed
=(cJaJ - 1 [69 S 11. LSDW: longitudinal spin density wave, TSDW: transversal spin density wave. The sub- scripts 1 and 2 refer to the AFl and AF2 phase, respectively.
Land&Bdmstein New Series 111/19a
Franse, Gersdorf
16 1.1.1.3 Cr [Ref. p. 22
Table 6. Values of the elastic coeflicicnts of Cr as a function of temperature T [81 L I]. c,=(c,,+c,, + 2c,,) ‘2. c = CJJ. c’=(c,*-c,*)/2. K=f(r,,+2c,,).
T CL c c+fc’ K
K Mbar
320 3.163 1.004 1.476 1.687 330 3.194 1.002 1.473 1.721 340 3.221 1.001 1.471 1.750 350 3.246 1.000 1.469 1.777 360 3.269 0.999 1.467 1 SO2 370 3.290 0.99s 1.464 1.826 3so 3.310 0.996 1.462 1.848 390 3.326 0.995 1.460 1.867 400 3.339 0.994 1.882 500 3.383 1.949 510 3.353 1.952 520 3.3Sl 1.952 530 3.378 1.951 540 3.373 1.949 550 3.365 1.946
2c3 23 300 350 400 450 K 500 I-
Fig. 33. Shear moduli cJ., and c’ of Cr as functions of the tempcraturc. Solid line: [Sl L 11. open circles: [71 P 11, full circles: [79K 11. c’=j(c,,-c,J.
2.0 Mbar Cr
1.4 I I I I I I
I I I 131 I I I I I I '250 300 350 400 450 500 K 553
T-
Fig. 32. Bulk modulus K of Cr as a function of tempcra- turc. Solid line: [8l L I], dashed line: [63 B I]. open circles: [7lP I], full circles: [79K 11. K=f(c,,+Zc,,).
1.415 I I I 308 310 312 311 316 318 K 320
I-
Fig. 34. Variation ofthc shear modulus c’=$(cI, -cr2) of Cr in the region of the N&cl point, Full circles: incrcasins x open circles: decreasing T [81 L I].
Frame, Gersdorf

Ref. p. 221 1.1.1.4 Mn 17
1.1.1.4 Mn a-Mn
The phase of manganese metal which is stable at room temperature, a-Mn, has probably the most complex crystallographic and magnetic structure of all elements. a-Mn has a cubic crystallographic symmetry, the cubic unit cell contains no less than 58 Mn atoms, distributed over 4 nonequivalent sites; the configuration of the surrounding of each site by the other Mn atoms is unique for each of the 4 different sites.
Below the NCel temperature TN=95 K, a-Mn is antiferromagnetic; since the magnitudes of the magnetic moments of the Mn atoms on different sites are highly different, an antiferromagnetic ordering can only be achieved if the atoms of each site order antiferromagnetically among themselves; the magnetization vectors of the 4 different sublattices are not collinear. This structure, which has been analyzed by Yamada in 1970 [7OY l-31, is depicted in Fig. 35.
a-Mn j=l 3 4
~fJfJj)
1.59 pg
- J- -0.50
Site II 0.58
i=l 1, 7 in s it
- 0.27
eI
Table 7. Low-temperature values of the
Site III
j=l & 7 IO
@ @ @ @Q.wB 0.13
magnetic moments pMn on the various atom sites in a-Mn [7OY 21.
Site
I II III IV
Atoms/cubic cell phi Cam, ”
2 1.9 8 1.7
24 0.6 24 0.25
Site l!L 0.11
Fig. 35. Magnetic structure of a-Mn below 95K as determined by Yamada. Vectors represent the magnetic moment for each ofthe 29 atoms in the primitive unit cell. The edges of the right prisms give, in units [uLs], the components of the magnetic moment in, respectively, the x, y, z directions. Integers j number the atoms for each of the crystallographic sites 1.. .IV [70 Y l-31.
From antiferromagnetic resonance measurements, Yamagata [72 Y l] concluded that the site II atoms are divided into two subtypes (each 4 atoms/cubic cell) with a magnetic moment of 1.84 ur, and 1.75 un, respectively; also for sites III and IV the situation is probably more complicated than depicted above.
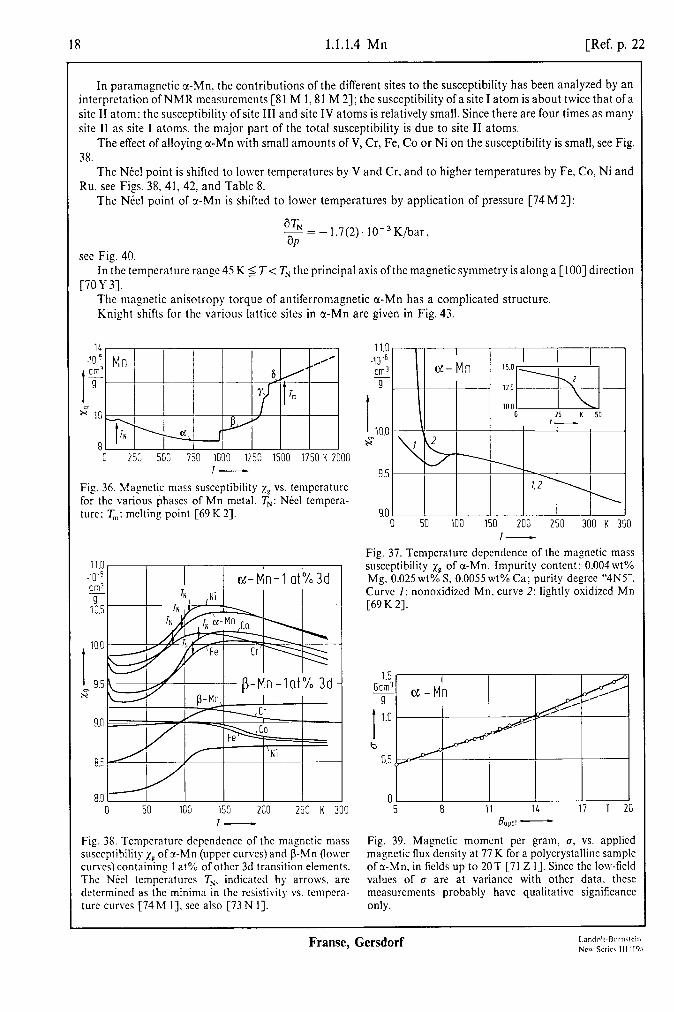
The magnetic susceptibility of c+Mn is only slightly temperature-dependent; it shows a broad maximum above the Ntel point, but no anomaly near TN, see Figs. 36...38. A good room temperature value is xs = 11.7.10-* m3/kg. A weak ferromagnetism, often observed below 45 K, is probably due to contamination of the sample with Mn,O, [7OY 31.
In antiferromagnetic a-Mn the differential magnetic susceptibility increases by about 50% above its low-field value, if the applied field exceeds 11 T, see Fig. 39; this effect can possibly be interpreted as a change in the angle between the antiferromagnetic vectors of atoms on two different sites.
Landolt-Bornctein New Series 111/19a
Franse, Gersdorf
18 1.1.1.4 Mn [Ref. p. 22
In paramagnetic cc-Mn, the contributions of the ditlerent sites to the susceptibility has been analyzed by an interpretation of NMR measurements [8 1 M 1,8 1 M 23; the susceptibility of a site I atom is about twice that of a site II atom: the susceptibility of site III and site IV atoms is relatively small. Since there are four times as many site II as site I atoms. the major part of the total susceptibility is due to site II atoms.
The effect of alloying cr-Mn with small amounts of V, Cr, Fe, Co or Ni on the susceptibility is small, see Fig. 38.
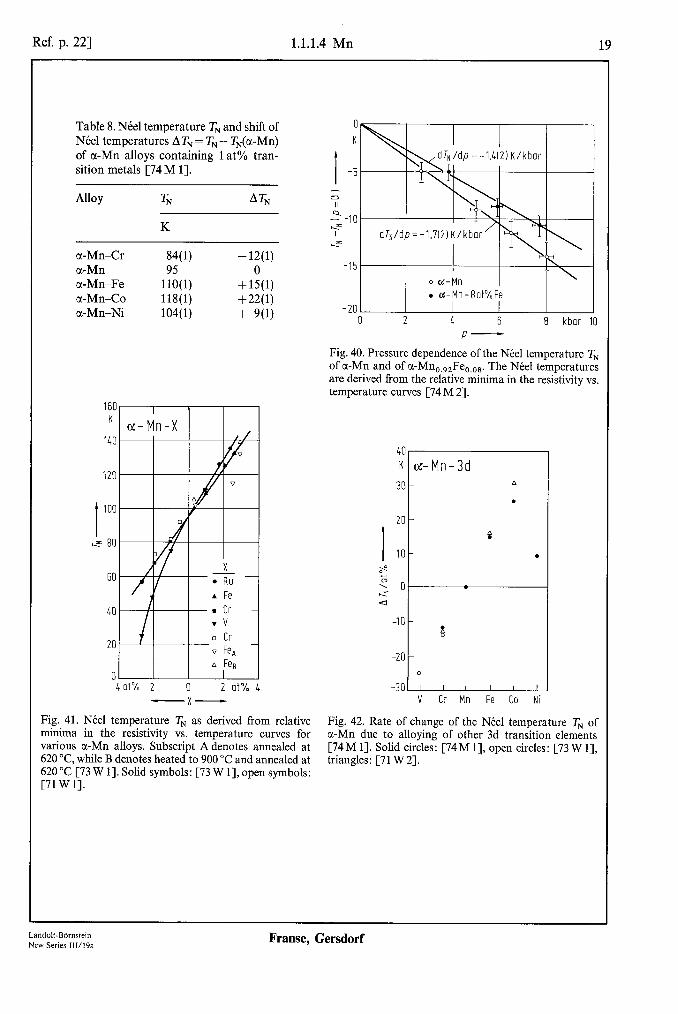
The NSel point is shifted to lower temperatures by V and Cr, and to higher temperatures by Fe, Co, Ni and Ru. see Figs. 38, 41, 42. and Table 8.
The N&l point of z-Mn is shifted to lower temperatures by application of pressure [74 M 23:
aT, --=-l.7(2)~10-3K/bar, af
set Fig. 40. In the temperature range 45 K 5 T< TN the principal axis of the magnetic symmetry is along a [loo] direction
[70)‘3]. The magnetic anisotropy torque of antiferromagnetic a-Mn has a complicated structure. Knight shifts for the various lattice sites in cc-Mn arc given in Fig. 43.
II
.10 5 cm? Mn ! .A'
-ii-.
i
b/' ~-
?: rm w 10 j-7
8 --j-l+
t
B Ih IA
0 253 500 753 1000 1250 1500 1750 K 2000 I-
Fig. 36. h4agnctic mass susceptibility zs vs. temperature for the various phases of Mn metal. Th’: Nkl tempcra- ture: T,,: melting point [69 K 23.
li.0 .10-' e-7 I a-Mn-1 at%3d LItI-
lYl.5
6.5
8.0 0 50 100 150 200 250 K 300
I-
Fig. 3s. Tempcraturc dcpcndcnce of the mngnctic mass susccptibility~~, ofrr-Mn (upper curves) and p-Mn (lower curies) contammg I at% of other 3d transition elements. The N&l temperatures TX. indicated by arrows. arc dctcrmincd as the minima in the rcsistivity vs. tempera- ture cu~cs [74 M 11. XC also [73 N I].
11.0, I I I 40-6 cm3 CL-Mn 15.0 1 1 I
- 9 lv 12.5
I 10.0 0 25 K 50 I-
10.0 x"
9.5 r..? '\
9.0 I 0 50 100 150 200 250 300 K 350
I-
Fig. 37. Temperature dependence of the magnetic mass susceptibility xp of a-Mn. Impurity content: O.O04wt% Mg. 0.025 wt% S, 0.0055 wt% Ca; purity degree “4NS”. Curve I: nonoxidized Mn, curve 2: lightly oxidized Mn [69 K 21.
1.5 &&
9
I 1.0
b 0.5
0 5 11 1L 17 1 20
B OPPl -
Fig. 39. Magnetic moment per gram. G, vs. applied magnetic flux density at 77 K for a polycrystalline sample of a-Mn, in fields up to 20T [7l Z I]. Since the low-field values of cr are at variance with other data. these mcasuremcnts probably have qualitative significance only.
Frame, Gersdorf
Ref. p. 221 1.1.1.4 Mn 19
Table 8. NCel temperature TN and shift of NCel temperatures AT, = TN - T,(a-Mn) of a-Mn alloys containing lat% tran- sition metals [74 M 11.
Alloy TN AT,
K
a-Mn-Cr a-Mn cl-Mn-Fe a-Mn-Co a-Mn-Ni
840) -12(l) 0
l%(l) +15(1 118(l) +22(1 104( 1) + 9(1
160 K
140
120
t
100
z 80
60
40
20
0
I
4 at"/. 2 0 2 at% 4 -x-
Fig. 41. Neel temperature TN as derived from relative minima in the resistivity vs. temperature curves for various a-Mn alloys. Subscript A denotes annealed at 620 “C, while B denotes heated to 900 “C and annealed at 620 “C [73 W 11. Solid symbols: [73 W 11, open symbols: [71 w 11.
0 K
1 -5
D II
p-10 I
LIT
-15
0 cc-Mn I \
. a-Mn-8at%Fe -20
0 2 4 6 8 kbar 10 P-
Fig. 40. Pressure dependence of the NCel temperature TN of a-Mn and of x-Mn,,,,Fe,,,,. The NCel temperatures are derived from the relative minima in the resistivity vs. temperature curves [74 M 21.
-10 8
-20
L
0
-30 V Cr Mn Fe Co N
Fig. 42. Rate of change of the Nirel temperature TN of a-Mn due to alloying of other 3d transition elements [74 M 11. Solid circles: [74 M l], open circles: [73 W 11, triangles: [71 W 2-J.
Landolt-Bdmstein New Series 111/19a
Frame, Gersdorf

20 1.1.1.4 Mn [Ref. p. 22
’ , 7;
m-Mn B
0 . . . , . . a
. . . . . . . . . A
-1
. t
. .
. . I . .a.*
lh
G 53 10G 150 200 250 K 300 T-
Fig. 43. Temperature dependence of the Kni_eht shift for the four dilkrcnt crystallographic sites I...IV m r-Mm It is not conclusive from the expcrimcnts whcthcr the measuring points A and B apply to sites III and IV rcspcctivcly, or vice versa [Sl MI, 81 M 21.
p-Mn
p-Mn is an allotropic modification of manganese which is only stable between 1000 K and 1368 K. It can, however. be retained at room temperature and lower temperatures as a metastable phase by quenching the hot metal in ice-cooled water.
p-Mn has a complex cubic crystalline structure, with 20 atoms per cubic unit cell, divided over 2 different sites. The magnetic structure is. however, very simple: p-Mn is a Pauli paramagnet with a nearly temperature- independent magnetic susceptibility, see Figs. 36 and 38.
Introducing small amounts of Cr, Fe, Co or Ni into p-Mn has only a small influence on the susceptibility at room temperature. At lower temperatures, impurity atoms of Cr, Fe or Co cause an additional term in the susceptibility, proportional to l/T (if T> 80 K). This is explained by assuming that a Cr, Fe or Co atom in a surrounding of p-Mn has a local magnetic moment ofabout 1 pe. Ni atoms in p-Mn behave differently, [74 M I] and Figs. 38 and 44.
-7 300 K 100 50
, fbMn'-lot%i3d 1
, /" I
0 1 8 12 16 .1F3 K-' 20 l/T -
Fig. 44. Change of the magnetic mass susceptibility, Azr: = xa (alloy)-X&P-Mn), for alloys of p-Mn containing 1 at% of other 3d elements, vs. inverse temperature. Dashed lint: Curie law corresponding to perf = I .73 pn per solute atom [74 M I].
Franse, Gersdorf

Ref. p. 221 1.1.1.4 Mn 21
y-Mn
y-Mn is another allotropic modification of manganese, this phase is only stable between 1368 K and 1406 K. y-Mn can be stabilized at low temperatures by alloying manganese with small amounts of C, Fe, Ni, Cu or Pd, and quenching the alloy from high temperatures.
At high temperatures, y-Mn has a face-centered cubic crystalline structure. The Mn-rich alloys in the y-phase at low temperature, however, are antiferromagnetic and have a substantial tetragonal deformation of the crystal lattice in the direction of the sublattice magnetization, which is along [OOl]; the ratio of axes, c/a, is 0.945 [71 E 11.
At low temperatures, the magnetic moment of the Mn atoms in y-Mn is 2.1...2.3 un, and the Neel point is about 500 K [71 E 11. The magnetic susceptibility as a function of temperature is given in Figs. 36 and 45.
IL .lOP cm3 9
I s
IO
8
Fig. 45. Temperature dependence of the magnetic mass susceptibility xe of y-Fe-Mn alloys, stabilized with 5 at% of Cu [71 E 11.
6 0 100 200 300 400 500 K 600
T-
6-Mn
The fourth allotropic phase ofmanganese, S-Mn, is stable between 1406 K and the melting point is at 1517 K; it has a body-centered cubic crystallographic structure. Its magnetic susceptibility at high temperatures has been measured, see Fig. 36; no other magnetic data are available.
Mn-hydrides
The hydrides and deuterides of manganese have a hexagonal close-packed crystallographic structure; it appears that MnH 0.94 is slightly ferromagnetic, with a Curie point near room temperature, [78 B l] and Figs. 46 and 47.
2.0 Gcm3
9
t
1.5
b 1.0
0 50 100 150 200 250 K 300 T-
Fig. 46. Temperature dependence of the mass magneti- zation u of MnH 0.94 in an applied magnetic flux density of 5T (open circles), the same for a-Mn (solid circles) [78 B l]
2.0 Gcm3
9 1.5
I 1.0 b
0.5
0 0.25 0.50 0.75 1.00 x-
Fig. 47. Dependence of the mass magnetization of Mn hydrides (open circles) and Mn deuterides (solid circles) on, respectively, the hydrogen and deuterium content x. Applied magnetic flux density 5 T, temperature 82 K. For a-Mn prepared by decomposition of MnH,.,,, see half black point [78 B 11.
Landolt-BOrnstein New Series 111/19a
Franse, Gersdorf
22 References for 1.1.1 1
52M 1 53K I 55R 1 56M I 5SLl 61 B 1 6201 62s I 62Tl 62T2 62 W 1 63B I 64K I 64 hl 1 64M2 64Wl 65A 1 65Kl 65M I 66K 1 66Pl 67El 68s 1 68U 1 69Kl 69K2 69s 1 7OCl 7OSl 7OY 1 7OY2 7OY3 71Cl 71 E 1 71Hl 71Kl
71Pl 71Wl 71 W2 7121 72V 1
72Y 1 73Al 73K 1
73Nl 73 w 1 74Dl 74M 1 74M2 74Tl 74v 1 75Bl 76Fl
1.1.1.5 References for 1.1.1
McGuire. T.R.. Kriessman, C.J.: Phys. Rev. 85 (1952) 452. Kriessman. C.J.: Rev. Mod. Phys. 25 (1953) 122. Rostoker. W., Yamamoto, A.: Trans. Am. Sot. Met. 47 (1955) 1002. McQuillan. A.D., McQuillan. M.K.:Titanium, London: Butterworth Scient. Publ. 1956. Lingelbach. R.: Z. Phys. Chem. N.F. 14 (1958) 1. Burger, J.P., Taylor, M.A.: Phys. Rev. Lett. 6 (1961) 185. Overhauser, A.W.: Phys. Rev. 128 (1962) 1437. Shirane, G., Takei, W.J.: J. Phys. Sot. Jpn. 17, B III (1962) 35. Taniguchi. S., Tebble, RX, Williams, D.E.G.: Proc. R. Sot. London A 265 (1962) 502. Taylor. M.A.: J. Less-Common Met. 4 (1962) 476. Wilkinson, M.K., Wollan, E.O., Koehlcr, W.C., Cable, J.W.: Phys. Rev. 127 (1962) 2080. Bolef. D.I.. Klerk, J. de: Phys. Rev. 129 (1963) 1063. Komura. S., Kunitomi. N.: J. Phys. Sot. Jpn. 20 (1964) 103. Montalvo. R.A.. Marcus, J.A.: Phys. Lett. 8 (1964) 151. Munday, B.C.. Pepper, A.R., Street, R.: Brit. J. Appl. Phys. 15 (1964) 611. Weiss. W.D., Kohlhaas, R.: Z. Naturforsch. A 19 (1964) 1631. Arrot, A., Werner, S.A., Kendrick, H.: Phys. Rev. Lett. 14 (1965) 1022. Kohlhaas, R., Weiss, W.D.: Z. Naturforsch. A 20 (1965) 1227. Mitsui. T., Tomizuta, CT.: Phys. Rev. 137 (1965) 564. Koehler. WC., Moon. R.M., Trego, A.L., Mackintosh, A.R.: Phys. Rev. 151 (1966) 405. Pepper, A.R.. Street, R.: Proc. Phys. Sot. 87 (1966) 971. Ebneter, A.E.: Thesis. Air Force Inst. of Techn., Wright-Patterson Air Force Base, Ohio USA 1967. Street. R., Munday, B.C., Window, B., Williams, I.R.: J. Appl. Phys. 39 (1968) 1050. Umcbayashi. H., Shirane, G., Frazcr, B.C., Daniels, W.B.: J. Phys. Sot. Jpn. 24 (1968) 368. Kohlhaas, R., Weiss. W.D.: Z. Angew. Phys. 28 (1969) 16. Kohlhaas. R., Weiss. W.D.: Z. Naturforsch. A24 (1969) 287. Steinitz. M.O., Schwartz, L.H., Marcus, J.A., Fawcett, E., Reed, W.A.: Phys. Rev. Lett. 23 (1969) 979. Callings. E.W., Ho, J.C.: Phys. Rev. B2 (1970) 235. Steller. B.: Physica Scripta 2 (1970) 53. Yamada, T.: J. Phys. Sot. Jpn. 28 (1970) 596. Yamada. T., Kunitomi. N., Nakai. Y.: J. Phys. Sot. Jpn. 28 (1970) 615. Yamada, T., Tazawa. S.: J. Phys. Sot. Jpn. 28 (1970) 609. Callings. E.W., Gehlen, P.C.: J. Phys. F 1 (1971) 908. Endoh. Y., Ishikawa. Y.: J. Phys. Sot. Jpn. 30 (1971) 1614. Huguenin. R., Pclls. G.P., Baldock, D.N.: J. Phys. F 1, (1971) 281. Kostina, T.I., Shafigullina. G.A., Kozlova, T.N., Kuznetsov, V.I.: Phys. Met. Metallogr. (USSR) 32 (1)
(1971) 203. Palmer, S.B.. Lee. E.W.: Philos. Mag. 24 (1971) 311. Whittaker. K.C., Dziwornooh, P.A.: J. Low Temp. Phys. 5 (1971) 447. Whittaker, K.C., Dziwornooh, P.A., Riggs, R.J.: J. Low Temp. Phys. 5 (1971) 461. Zavadskii, E.A., Morozov, E.M.: Sov. Phys. Solid State 13 (1971) 1263. Volkenshtein. N.V., Galoshina, E.V., Romanov, E.P., Shchegolikhina, NJ.: Sov. Phys. JETP 34 (1972)
802. Yamagata. H., Asayama, K.: J. Phys. Sot. Jpn. 33 (1972) 400. Arajs. S.. Rao, K.V., Astriim, H.U., De Young, T.F.: Physica Scripta 8 (1973) 109. Kondorskii. E.I., Karstens, G.E., Kostina, T.I., Shafigullina, G.A., Ekonomova, L.N.: Proc. Int. Conf.
Magnetism ICM-73 (Moscow) I(1) (1973) 310. Nagasawa. H., Uchinami, M.: Phys. Lett. 42A (1973) 463. Williams jr.. W., Stanford, J.L.: Phys. Rev. B7 (1973) 3244. Degyareva, V.F., Kamirov, Yu.S., Rabin’kim, A.G.: Sov. Phys. Solid State 15 (1974) 2293. Mekata. M.. Nakahashi, Y., Yamaoka, T.: J. Phys. Sot. Jpn. 37 (1974) 1509. Mdri, N.: J. Phys. Sot. Jpn. 37 (1974) 1285. Tsunota. Y., Mori, M., Kunimoto, N., Teraoka, Y., Kanamori, J.: Solid State Commun. 15 (1974) 287. Volkenshtein. M.V., Galoshina, E.V., Panikovskaya, T.N.: Sov. Phys. JETP 40 (1975) 730. Benediktsson. G., Astr6m, H.U., Rao, K.V.: J. Phys. F 5 (1975) 1966. Fawcett, E.. Gricssen. R., Stanley, D.J.: J. Low Temp. Phys. 25 (1976) 771.
Frame, Gersdorf
References for 1.1.1 23
IlAl llA2
18Bl
78Gl 79Kl 1921 80Kl 80Rl
8OVl 8OWl 8OW2 81Bl 81B2 81B3 81Fl 81Gl
8111 81Ll 81Ml 81M2 81Wl 81W2 82Bl 82Ll 82Sl
Adamesku, R.A., Mityushov, E.A.: Phys. Met. Metallogr. (USSR) 43 (4) (1977) 70. Alikhanov, R.A., Zuy, V.N., Karstens, G.E., Smirnov, L.S.: Phys. Met. Metallogr. (USSR) 44 (3) (1977)
178. Belash, LT., Ponomarev, B.K., Tissen, V.G., Afonikova, N.S., Shekhtman, V.Sh., Ponyatovskii, E.G.:
Sov. Phys. Solid State 20 (1978) 244. Golovkin, V.S., Bykov, V.N., Levdik, V.A.: Sov. Phys. Solid State 20 (1978) 651. Katahara, K.W., Nimalendran, M., Manghnani, M.H., Fisher, E.S.: J. Phys. F9 (1979) 2167. Ziebeck, K.R.A., Booth, J.G.: J. Phys. F9 (1979) 2423. Koning, L. de, Alberts, H.L., Burger, S.J.: Phys. Status Solidi A62 (1980) 371. Ruesink, D.W., Fawcett, E., Griessen, R., Perz, J.M., Templeton, I.M., Venema, W.J.: Int. Conf. on
Phys. of Transition Metals 1980 (Leeds), p. 335. Venema, W.J., Griessen, R., Ruesink, W.: J. Phys. FlO (1980) 2841. Walker, M.B.: Phys. Rev. B22 (1980) 1338. Williams, I.S., Street, R.: J. Phys. FlO (1980) 2551. Barak, Z., Fawcett, E., Feder, D., Lorinck, G., Walker, M.B.: J. Phys. Fll (1981) 915. Barak, Z., Walker, M.B.: J. Phys. F 11 (1981) 947. Booth, J.G., Ziebeck, K.R.A.: J. Appl. Phys. 52 (1981) 2107. Fincher jr., CR., Shirane, G., Werner, S.A.: Phys. Rev. B24 (1981) 1312. Geerken, B.M., Griessen, R., Dijk, C. van, Fawcett, E.: Proc. Intern. Conf. Physics of Transition
Metals, Leeds 1980, 1981, p. 343. Iida, S., Tsunoda, Y., Nakai, Y., Kunimoto, N.: J. Phys. Sot. Jpn. 50 (1981) 2587. Lahteenkorva, E.E., Lenkkeri, J.T.: J. Phys. F 11 (1981) 767. Murayama, S., Nagasawa, H.: J. Phys. Sot. Jpn. 50 (1981) 1189. Murayama, S., Nagasawa, H.: J. Phys. Sot. Jpn. 50 (1981) 1523. Williams, I.S., Street, R.: Philos. Mag. B43 (1981) 893. Williams, I.S., Street, R.: Philos. Mag. B43 (1981) 955. Benediktsson, G., Astrom, H.U.: Phys. Ser. (Sweden) 25 (1982) 671. Littlewood, P.B., Rice, T.M.: Phys. Rev. Lett. 48 (1982) 44. Siegmann, H.C.: J. Appl. Phys. 53 (1982) 2018.
Landolt-Bornstein New Series IWl9a
Franse, Gersdorf
24 1.1.2.1 Fe, Co, Ni: introduction [Ref. p. 134
1.1.2 Fe, Co, Ni
1.1.2.1 Introduction
In the last two decades progress has been made in the solution of the understanding of the origin and behavior of magnetism in the metallic 3d elements. These advances have been achieved by the replacement of the earlier thermodynamic approaches to magnetism with a microscopic understanding in which the magnetic behavior is related to the underlying electronic interactions within and between the atoms. This has been achieved because a number of new and improved experimental techniques became available along with the development of high- speed computers used for both complex data acquisition and analysis and for band structure calculations.
Often in the past the interpretation of magnetic data was made in terms of a purely localized or itinerant model. We now know that these two extreme models are oversimplifications of the real situation and that the d valence electrons have both features. As a result, the type of behavior that is obtained is strongly dependent on the experiment performed. Experiments that probe the regions close to the nucleus such as nuclear magnetic resonance. neutron scattering. etc., are sensitive to the more local, atomic-like character of the electrons while other techniques such as specific heat, transport properties, dc Haas-van Alphen effect that probe mainly the tails of the wave functions are sensitive to the nonlocal or itinerant character.
Some of the significant techniques developed and achievements made in the recent years are: I. Neutron scattering techniques allowed the measurements of the form factors, magnetization distributions
and magnon dispersion relations. 2. The development of Miissbaucr and pulsed nuclear magnetic resonance spectroscopies made possible the
determination of the shape of the s and d conduction-electron polarizations, which showed that the mechanism responsible for the origin of ferromagnetism in 3d metallic ferromagnets is the alignment of the “quasi-local” d moments by the polarized itinerant d electrons rather than by the s valence electrons as was the favored mechanism in the early 1960s.
3. Improvements in de Haas-van Alphen measurements lead to the determination of the Fermi surfaces of these complex metals.
4. The development of angle-resolved photoemission spectroscopy allowed the direct measurement of the excited-state exchange splittings and band structures.
5. The availability of high-speed computers made the complex calculations of the ferromagnetic band structures routine so that the effects of different approximations and potentials could easily be investigated.
The transition elements are ofgreat technological importance precisely because of the complex and versatile character of their outer electrons.
This compilation will concentrate on presenting the current experimental data. It will discuss theory only in so far as it enhances the description of the data or when it is so symbiotic to the data, as in the case of band structure. that it is necessary for a sensible presentation of the data. There are numerous theoretical calculations aimed at describing particular experimental results; no attempt will be made to review these or the present state of the agreement between the theoretical details and experiment.
Data on alloys of Fe, Co and Ni are included in this compilation when they predominately provide information about the host.
1.1.2.2 Phase diagrams, lattice constants and elastic moduli
At atmospheric pressure Fe undergoes the following transitions [670 I, 74D 11:
bee a fee 1665K a bee -liquid.
Earlier measurements [62 J l] found that the room-temperature phase transformation to a hexagonal close packed (hcp) structure occurred at 130 kbar and the triple point at 775 K and 110 kbar. More recent [71 G l] measurements have found it to occur at 107(8) kbar with the triple point at about 750 K and 90 kbar. The theory of the phase diagram for Fe has been discussed by Grimvall [76G 11.
At high temperature Co is fee and at low temperature it is hcp. The transformation is sluggish so that both forms coexist from room temperature to 450°C.
The stable structure of Ni is fee. It has been claimed to have been prepared in the hcp form by several workers [74D 11. It has also been prepared in the bee structure [74D 11.
Stearns

Ref. p. 1341 1.1.2.2 Fe, Co, Ni: phase diagrams, lattice constants 25
Table 1. Lattice constants, interatomic distances, atomic volumes and thermal expansion coefficients of Fe, Co, and Ni [74D 11.
T P Phase i
E “C bar ri x 13 lo-‘jK-’
Fe 20 1 ~1, bee 2.86638(190) - 2.482(8) 11.78 11.7; Fig. 3a 910 1 ct, bee 2.9044 - 2.515(S) 12.25 910 1 Y, fee 3.6467 - 2.579(12) 12.12
1390 1 Y, fee 3.6869 - 2.607(12) 12.53 1390 1 6, bee 2.9315 - 2.5388(g) 12.60
23 130.103 a, bee 2.805 - 2.429(S) 10.43 23 130.103 E, hcp 2.468l) 3.956 2.468 (6)
2.408 (6) 11.03 co 20 1 a, hcp 2.5070(3) 4.0698(9) 2.507(6) 11.08 Figs. 3a, 4a
2.497(6) 20 1 P, fee 3.5445(4) - 2.506(12) 11.13
Ni 20 1 fee 3.5241(7) - 2.492(12) 10.94( 1) 12.5; Fig. 3a 20 1 hcp 2.495(12) 4.048(43) 2.495 (6)
2.484(6) 10.91(16)
20 1 bee 2.775(14) - 2.403 (8) 10.68(16)
‘) For pressure dependence, see Fig. 2.
. 6 calculated
P- P-
Fig. la. Pressure-temperature phase diagram for pure Fe Fig. lb. Pressure-temperature phase diagram for Co [71G1].1:[62K1],2:[60C1],3:[63C1],4:[62J1],5: [63 K 11. hcp: a-Co and fee: P-Co. Other notation used [65B1],6: [65B2], 7,8: [69M2],9: [71Gl]. to designate hcp and fee phases is E-CO and y-Co,
respectively.
Landolt-BBmstein New Series 111/19a
Stearns
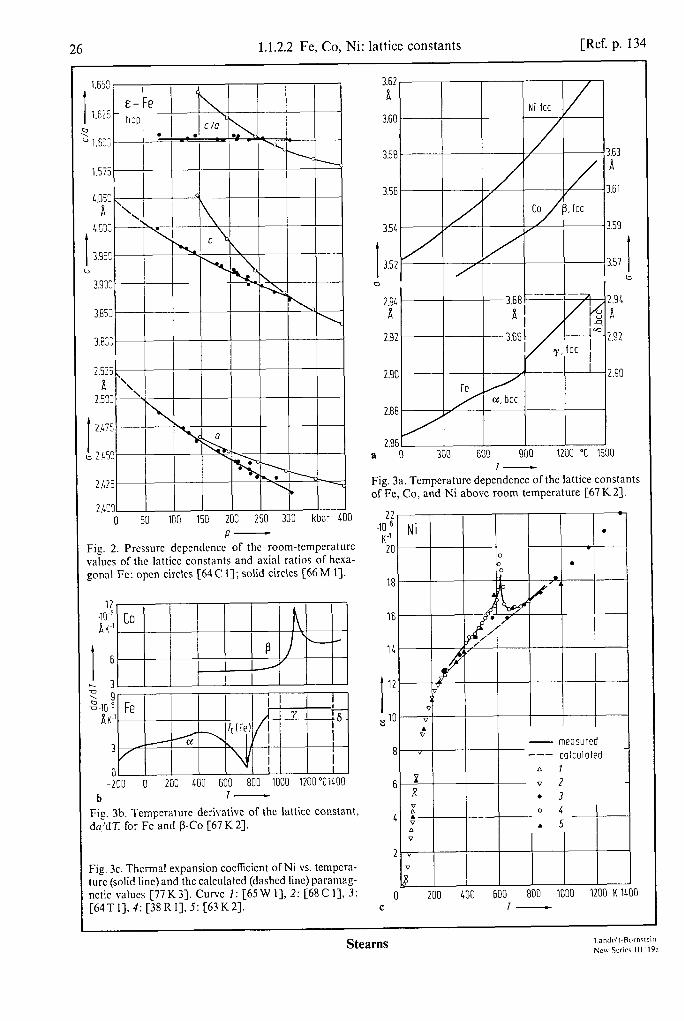
26 1.1.2.2 Fe, Co, Ni: lattice constants [Ref. p. 134
0 50 100 150 200 250 300 kbor LOO
P- Fig. 2. Pressure dependence of the room-temperature values of the lattice constants and axial ratios of hcxa- gonal Fe: open circles [64C I]; solid circles [66 M I].
12 .1rj-5 AK.1
I
6
c, 3
3
0 -2OG 0 200 400 600 800 1000 12oo"cl~oo
b I-
Fig. 3b. Temperature derivative of the lattice constant, dn’dT. for Fe and B-Co [67 K 21.
Fig. 3c. Thermal expansion coefficient of Ni vs. tempcra- turc (solid line) and the calculated (dashed lint) paramag- netic values [77 K 33. Curve 1: [65 W 13, 2: [68 C 11, 3: [64T I]. 4: [38 R I]. 5: [63 K 21.
3.62, I I I /I
ii I I I INifcc I/ I
3.56
cc I
3.56 3.59
1 3.52 3.57 I cl D
2.91 2.91
a a
2.92 2.92
2.86 r I I I I a D 300 60'3 900 1200 "C 1530
Fig. 3a. Temperature dependcncc of the lattice constants of Fc, Co, and Ni above room temperature [67 K 23.
18
16
0 200 400 600 800 1000 1200 K 1400 C T-
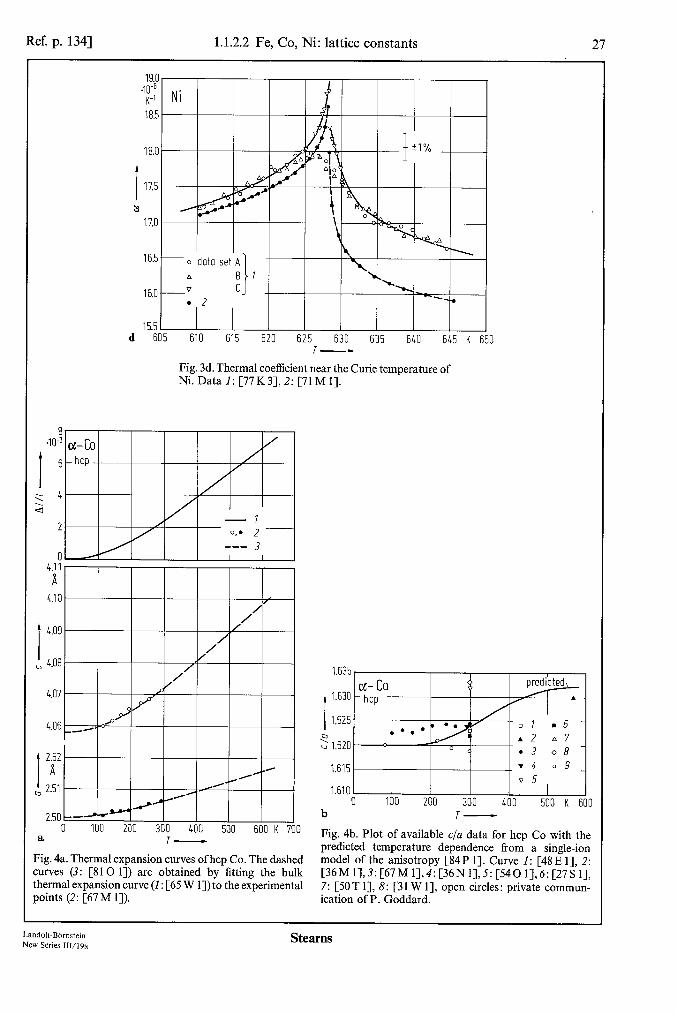
Ref. p. 1341 1.1.2.2 Fe, Co, Ni: lattice constants 27
15.5 II d 605 610 615 620 625 630 635 640 645 K 650
Fig. 3d. Thermal coefficient near the Curie temperature of Ni. Data I: [77 K 3],2: [71 M I].
8 .lO-3
I
6
: 4 z
2
4.06
0 100 200 300 400 500 600 K : a 7-
Fig. 4a. Thermal expansion curves ofhcp Co. The dashed curves (3: [810 11) are obtained by fitting the bulk thermal expansion curve (I: [65 W 11) to the experimental points (2: [67 M 11).
I 1.625 1.630
5 1.620
1.615
1.610 0 100 200 300 400 500 K 600
b T-
Fig. 4b. Plot of available c/a data for hcp Co with the predicted temperature dependence from a single-ion model of the anisotropy [84P I]. Curve 1: [48 E 11, 2: [36M1],3:[67M1],4:[36N1],5:[5401],6:[27Sl], 7: [5OT I], 8: [31 W 11, open circles: private commun- ication of P. Goddard.
Land&-Bbmstein New Series IIV19a
Stearns
2s 1.1.2.2 Fe, Co, Ni: elastic constants [Ref. p. 134
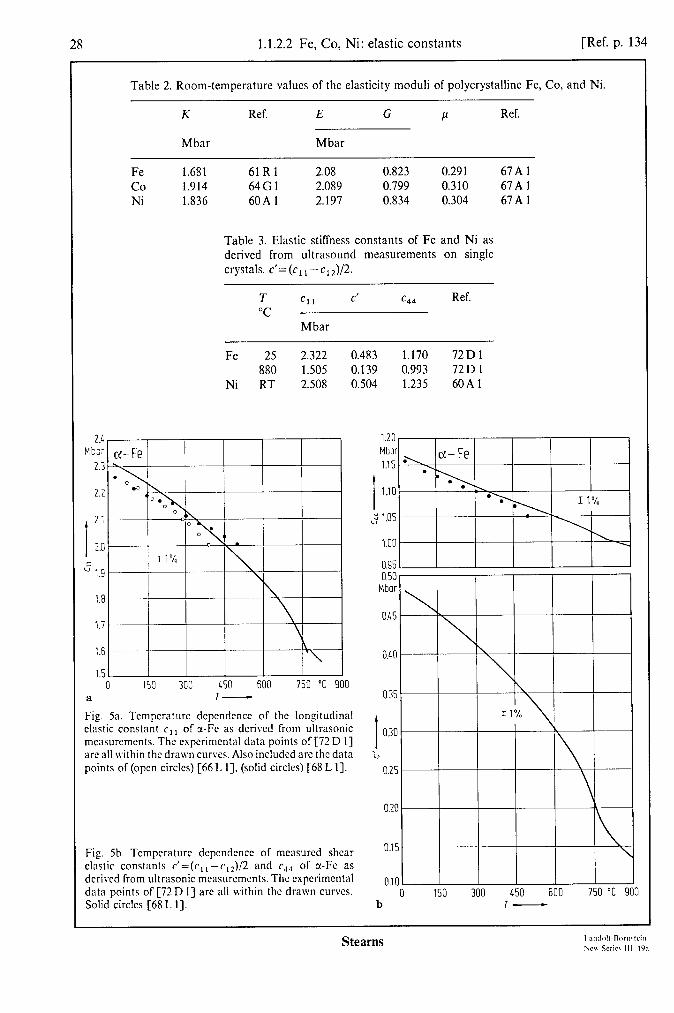
I
2.:
2.0
z 1.9
1.8
1.7
1.6
1.5
a
Table 2. Room-temperature values of the elasticity moduli of polycrystalline Fe, Co, and Ni.
K Ref. E G P Ref.
Mbar Mbar
Fe 1.681 61Rl 2.08 0.823 0.291 67Al co 1.914 64Gl 2.089 0.799 0.310 67Al Ni 1.836 60A 1 2.197 0.834 0.304 67Al
Table 3. Elastic stiffness constants of Fe and Ni as derived from ultrasound measurements on single crystals. c’=(c,, -c,,)/2.
T Cl1 C’ c44 Ref. “C
Mbar
Fe 25 2.322 0.483 1.170 72Dl 880 1.505 0.139 0.993 72Dl
Ni RT 2.508 0.504 1.235 60A 1
153 300 150 600 750 "C 900
1.20 I / 1
I-
Fis. 5a. Temperature depcndencc of the longitudinal elastic constant c, L of r-Fc as dcrivcd from ultrasonic measursmcnts. The expcrimcntal data points of [72 D l] are all within the drawn cuwcs. Also included arc the data points of (open circles) [66 L 11, (solid circles) [6S L 11.
Fig. Sb. Tempcraturc depcndencc of measured shear elastic constants c’=(c,,-c12)/2 and c44 of a-Fc as derived from ultrasonic mcasurcmcnts. The cxpcrimcntal data points of [72 D I] arc all within the drawn curves. Solid circles [6S L I].
Mbor a-Fe
0.95 I I I 0.50 , I I I I I
Mbor/\l I I 1 ( 0.G
0.10
0.35 \
I
1 1%
0.30
L-i
o.loI 0 150 300 450 600 750 "C
b T-

Ref. p. 1341 1.1.2.2 Fe, Co, Ni: elastic constants 29
1.3: Mba
I-
r 2.
I- 1.3(
,-
l-
1.15
l.l[ l-
j 2
i-
0.5c
I O.L7
t 0.44
O.Ll
0.3F 3.4
Mbor
3.3
I
3.2
u' 3.1
3.0
2.E 100 200 300 $00 500 600 700 K 800
T- Fig. 6. Temperature variation of the elastic moduli of Ni ultrasonically measured at 10 kOe applied magnetic field. The vertical dashed line marks the Curie temperature WAU (a> c44, 0~1 c’=h-~~~~/2~ cc> cL=hI+clz + 2c4,)/2. The dashed curve represents the extrapolation to low temperatures of the high-temperature data.
Land&Bbmstein New Series 111/19a
30 1.1.2.3 Fe, Co, Ni: paramagnetic properties [Ref. p. 134
1.1.2.3 Paramagnetic properties
The paramagnetic behavior is studied through the susceptibility above the Curie temperature. A localized magnetic moment follows the Curie-Weiss law given by
NP:U dT)= 3k,o -
C, T-O
Here p is the maximum value of the free-atom’s localized magnetic moment in direction of the applied magnetic field. J denotes the angular momentum quantum number of the atom, 9 the spectroscopic splitting factor, and pa the Bohr magneton. N is the number of atoms per unit mass and 0 the paramagnetic Curie temperature. The magnetic moment associated with itinerant electrons has an enhanced susceptibility and the general expression is given bj
x(4.4 = %0(%4/C1 - I%,(% 4 + 4% 41 (2)
where x0(4. (!I) is the wavevector- and frequency-dcpcndent susceptibility for a noninteracting system ofelectrons, I is an exchange -interaction constant, and I.(q. Q) is a fluctuation term which has been extensively discussed by Moriya et al. [73 M 3, 79 M 21.
In general the itinerant part of the magnetic moment is more polarizable in an applied field than the local part so that the moment obtained by applying eq. (I) in the paramagnetic region results in the paramagnetic moment being larger than the moment obtained from magnetization measurements in the ferromagnetic region.
The susceptibility has been determined by magnetization measurements and neutron scattering, the magnetization measurements corresponding to Q =O. From a plot of l/x vs. T obtained from magnetization measurements the paramagnctic Curie temperature @is obtained from the intercept with the temperature axis, the Curie constant C, and thus pcrr is obtained from the slope.
Table 1. Paramagnctic properties of Fc, Co, and Ni. AT is the temperature interval for which the parameters of the Curie-Weiss law are determined. pa, denotes the magnetic moment per atom in the ferromagnetic phase extrapolated to T=OK. The ratio p/p,, gives an indication of the degree of localization or itineracy of the electrons forming the moment. A completely localized moment would have a value of one and a completely itinerant moment a large value > 10; e.g. Fe,,, ,Cr0.49 has a ratioof 17.6(Tc=9K)and Ni0,43Pt0,57 aratio of 17.2 ( Tc = 23 K) [78 W 11. Thus the moments of Fe, Co, and Ni are seen to have a high degree of localized character.
Fig. 0 K
c, 10m3 cm3 K/g
AT K
Peff PB
PIP,, Ref.
a-Fe la, b.d + 1093(3) 22.0 1100...1180 3.13 1.01 60A2 p-co 1403...1428 20.8 1430...1710 3.15 1.28 38Sl Ni ‘) 3a 654.1 5.546 740...970 1.613 1.375 63A2
3b. c 8.55 1528...1728 73B2 Liquid-Ni 3c 16.7 1728...1928 73B2
‘) Ni does not obey a Curie-Weiss law; at temperatures above 970 K an additional temperature-dependent contribution 1, is found, see Fig. 4.
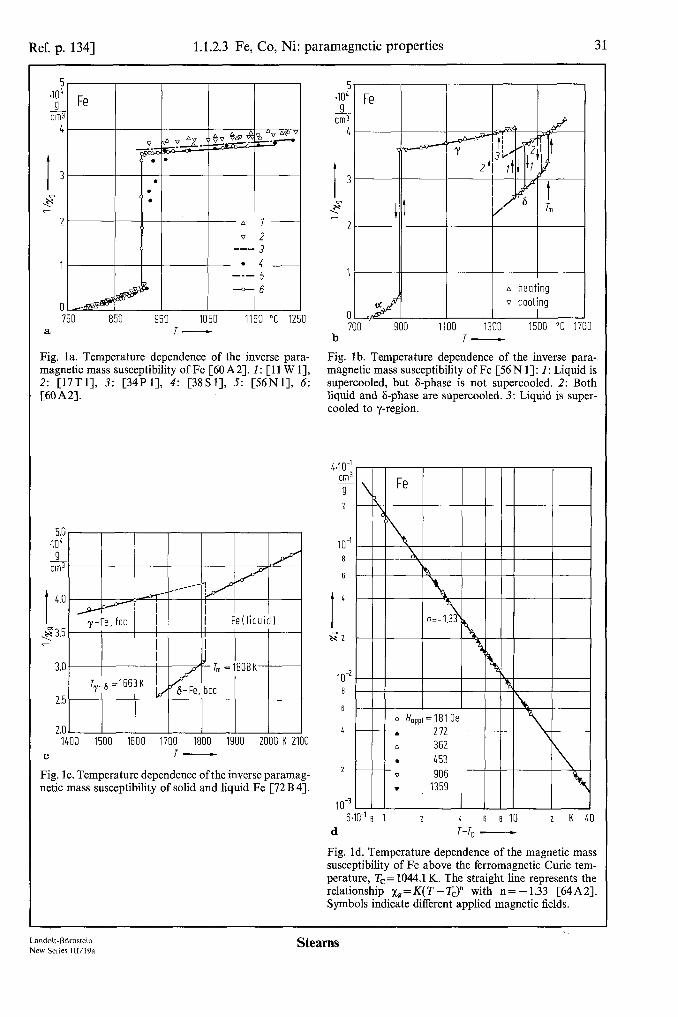
Ref. p. 1341 1.1.2.3 Fe, Co, Ni: paramagnetic properties 31
5 .lOC 9
iiT 4
I 3
G
2
1
0 750 850 950 1050 1150 “C 1250
a T-
Fig. la. Temperature dependence of the inverse para- magnetic mass susceptibility of Fe [60 A2]. I: [ 11 W 11, 2: [17Tl], 3: [34P 11, 4: [38S I], 5: [56Nl], 6: [60A2].
5.0 .in4
;;mc:=rri 1400 1500 1600 1700 1800 1900 2000 K 2100
C I-
Fig. lc. Temperature dependence of the inverse paramag- netic mass susceptibility of solid and liquid Fe [72 B 41.
1100
A heating Q cooling
I 1300 1500 “C 1700
b T-
Fig. lb. Temperature dependence of the inverse para- magnetic mass susceptibility of Fe [56 N 11: 1: Liquid is supercooled, but &phase is not supercooled. 2: Both liquid and &phase are supercooled. 3: Liquid is super- cooled to y-region.
4.10-l cm3 9 2
2
1o-3 6,
d
! I o Hopp~ = 181 Oe
--. 272 \
ir’t7 1 2 4 6 RIO z K 40 T-7, -
Fig. Id. Temperature dependence of the magnetic mass susceptibility of Fe above the ferromagnetic Curie tem- perature, Tc= 1044.1 K. The straight line represents the relationship xp = K( T - 7”)” with n = - 1.33 [64A 21. Symbols indicate different applied magnetic fields.
Landalt-Bbmstein New Series lll/l9a
Stearns

32 1.1.2.3 Fe, Co, Ni: paramagnetic properties [Ref. p. 134
2.5 .l F-
L UT!
2.0
0 cooling “I I 1103 1200 1300 Vi00 1500 “C 1600
a I-
Fig. 2a. Temperature dependence of the inverse paramag- netic mass susceptibility of fee Co [56N 11.
1 2 4 6 8 10 K 20 b r-r, -
Fig. 2b. Temperature dependence of the magnetic mass susceptibility of fee Co above the ferromagnetic Curie temperature, T,= 1388.2 K, in an applied magnetic field H npp,= 181 Oe. Straight lines represent tits to the data of the form xg = K( T- T,)” for various n [65 C 21.
lo-', cm3 9 6
4
I
2
x” 10-2
8
6
4
2.10-3
16
.c Ni d cm3 r, 0
12
I
10
-i! 8
6
0 5
0 .^ .^^^ 1100 1200 1300 1LOO 1500 K 1600 a I-
Fig. 3a. Tempcraturc dcpcndcncc of the inverse para- magnetic mass susceptibility of Ni. Samples 1 and 2: [63 A2],3: [I I W I], 4: [38 S 2], 5: [44 F I].
Stearns

Ref. p. 1341 1.1.2.3 Fe, Co, Ni: paramagnetic properties 33
n HoppI=45.3 Oe . 12.5 . 90.6
2 \ \ I , D 181.2
8,10-' 1 2 4 6 6 IO K 20 b T-Tc -
Fig. 3b. Temperature dependence of the magnetic mass susceptibility of Ni above the ferromagnetic Curie tem- perature, Tc = 626.2 K, as measured for various applied magnetic fields I&.,,,. Straight lines represent fits to the data of the form xp =K( T- Tc” for various n [65A 11.
1.0 40-6 cm3 Ti-
t a
IYIOO 1100 1200 1300 1400 1500 K 1600
18 ,104 s cm3
17
I $16
1500 1600 1700 1800 1900 K 2000 c T-
Fig. 3c. Temperature dependence ofthe inverse paramag- netic mass susceptibility of Ni near its melting point [73 B2].
Fig. 4. The temperature-dependent susceptibility ofNi can be described with a Curie-Weiss law with an additional temperature-dependent susceptibility xa [63 A2].
Landolt-BOrnstein New Series lll/l9a
Stearns
34 1.1.2.4 Fe, Co, Ni: spontaneous magnetization [Ref. p. 134
1.1.2.4 Spontaneous magnetization, magnetic moments and high-field susceptibility
bee Fe, hcp Co, fee Co and fee Ni
The room-temperature magnetic phases of Fe, Co, and Ni are ferromagnetic. The spontaneous magnetiz- ation data. oJT), quoted in the literature are obtained by extrapolating the magnetization a(7; H) to zero internal field.
The general expression for the temperature and magnetic field dependence of the magnetization per unit mass is given b)
a(T.H)=~~(T)+A(T)H’IZ+X,,,(T)H, (1)
where H is the internal field equal to the applied magnetic field minus the demagnetizing field. The second term on the r.h.s. ofthe equation is due to the effect of the magnetic field on the spin waves and xHF(T) is a susceptibility term that must be included at high fields. This term is attributed to various small contributions such as orbital and spin susceptibility of the 3d and 4s electrons [82P 11.
fee Fe
There has been extensive controversy about the magnetic properties of the fee phase of Fe (y-Fe) with several diverse results reported in the literature. From thermodynamic considerations on Fe it was suggested [63 W 1, 63 K 21 that y-Fe has two possible magnetic moment states depending on the lattice constant; a low-moment state at smaller lattice constants and a high-moment state at larger lattice constants. Band calculations indeed show that the magnetic moment of fee Fe should undergo a rather rapid transition from a lower-moment state to a higher-moment state for a small variation in lattice constant, see Fig. 8. The rapid transition is manifestation of the flat (localized) E, bands being very near and intertwined with the Fermi level [78 M l] as seen in a band structure calculation of the paramagnetic state (see subsect. 1.1.2.11 on band structure). Conditions are thus favorable for small changes in the lattice constant to shift the E, bands through the Fermi level and thus cause a rapid variation in the magnetic moment.
Since fee Fe is stable only at high temperatures two separate lines of study have developed. One concerns the nature of the magnetic properties of y-Fe which has been stabilized by various means at room and lower temperatures and the other is the state of y-Fe in the high-tempcraturc region. Neutron scattering measurements at 1320 K have found y-Fe (a= 3.658 A) to be paramagnetic with a magnetic moment of 0.9(1)~, [83 B 21. However. this moment may bc less than the actual magnetic moment since the characteristic interaction time of the neutrons was comparable to or slightly less than the spin-flipping time of the magnetic moment (see subsect. 1.1.2.8).
The low-temperature work has involved considerable controversy. This has usually arisen due to the difficulty of preparing samples that arc free from bee Fe which, if present, appears as a high-spin ferromagnetic state with a high transition temperature. In recent years many of the discrepancies have been resolved by using measurement techniques such as Miissbaucr spectroscopy and neutron diffraction which are capable of correlating the structural properties with the ferromagnetic and antiferromagnetic phases as opposed to techniques which measure more macroscopic properties, such as LEED, X-ray diffraction and magnetization measurements.
Since y-Fe is unstable at low temperatures it has been studied as coherent precipitates (~200...10OOA) in a Cu matrix and as pseudomorphic epitaxial thin films on a Cu substrate, see Table 6.
hcp Fe
Miissbauer effect measurements down to 0.030K in the pressure range from atmospheric pressure to 21.5 GPa detected no measurable hyperline field for the E-phase. This shows that the hcp phase has no magnetic ordering down to 0.030 K in this pressure range [82 C 1,72 W 11. Massbauer effect measurements in an applied magnetic field found that at 50 kOe, upon scaling from the 3d free-ion moment, the induced magnetic moment is ~0.08 pn. the susceptibility is 93. 10-4cm3/mol and the effective hyperfine field at the “Fe nucleus is H,,jp =030 Hap,+ [82T 33. See also Fig. 5 in subsect. 1.1.2.8.
Stearns

Ref. p. 1341 1.1.2.4 Fe, Co, Ni: spontaneous magnetization 35
Table 1. The spontaneous magnetization crs and the high-field susceptibility ~nr, at various temperatures obtained by computer fit of the curves of Figs. la..e with the equation in subsect. 1.1.2.4.1. Applied field direction is indicated. For Fe and Ni no anisotropy in cs or xHF was found. See also Table 3 Fe and Ni [83P l-J, Co [83 P 21.
T 0s XHF
K Gcm3g-’ 10e6 cm3 g-r
Fe [loo]
co [OOOl]
CO [ioiol
Ni [111]
4.21 222.671 24.79 222.596 51.06 222.367 75.34 222.071
100.51 221.825 131.55 221.443 165.81 220.937 197.45 220.346 226.34 219.736 254.53 219.049 286.41 218.210
4.21 163.82 24.79 163.79 55.31 163.68 75.28 163.54
100.46 163.50 131.31 163.44 165.30 163.39 197.01 163.29 225.69 162.99 254.67 162.93 286.61 162.62
4.21 163.00 24.79 162.98 55.36 162.70 75.28 162.65
100.51 162.64 131.31 162.58 165.50 162.46 196.81 162.40 225.74 162.26 254.67 162.08 286.66 161.86
4.21 58.872 25.00 58.810 50.08 58.698 75.15 58.550
100.51 58.349 131.08 58.063 165.49 57.671 196.71 57.223 225.74 56.724 254.82 56.121 286.66 55.370
3.60 3.66 3.70 3.81 3.84 3.79 3.76 3.70 3.81 3.90 3.95
1.59 1.64 1.58 1.52 1.48 1.37 1.21 1.11 1.13 1.18 1.12
For Figs. lb and c, see next page.
a
Fig. 1. Magnetization as a function of the magnetic field, at different temperatures below room temperature, of single crystals of Fe, Co, and Ni [83P 11.
(a) Fe. The magnetic field is applied along, respec- tively, the [ 1001, [ 11 l] and [ 1 lo] directions [83 P 11. The measured change in flux was produced by moving the sample from one pick-up coil to a precisely matched pick- up coil in series opposition in a highly uniform magnetic field. The calibration to absolute values was obtained from the measurements of Danan et al. [68 D l] on Ni as the standard of reference [83P 11. The data was accu- rately fit by eq. (1). It was observed that all the isotherms of magnetization curves had a continuous and well- defined, although small, curvature. Thus the usual proce- dure ofusing an averaged straight line to determine a,(T) is not valid for data of this quality.
Land&Bdmstein New Series III/l9a
Stearns
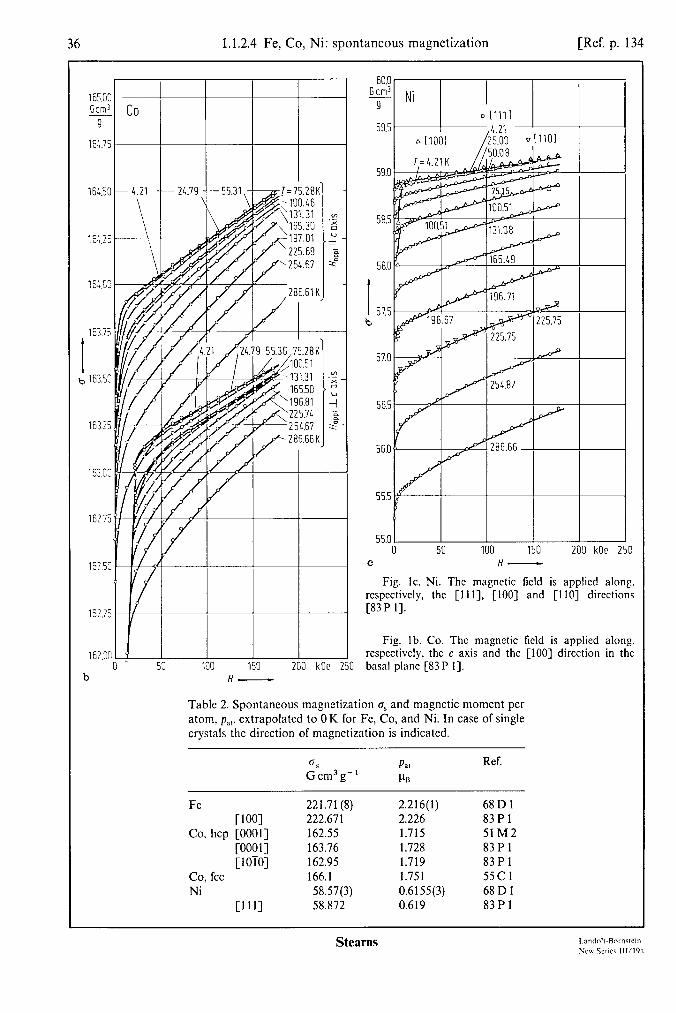
36 1.1.2.4 Fe, Co, Ni: spontaneous magnetization [Ref. p. 134
163.35
I b 163X
16325
16!25
b H-
60.0 Gcm3
9
59.5
I I+F I A225.75 1
5B.U
I 57.5 b
56.5
560
0 C
50 100 150 H-
200 kOe 250
Fig. lc. Ni. The magnetic field is applied along. respcctivcly, the [ill], [IOO] and [I IO] directions [83P 11.
Fig. lb. Co. The magnetic field is applied along, rcspcctivcly, the c axis and the [loo] direction in the basal plant [83P I].
Table 2. Spontaneous magnetization a, and magnetic moment per atom, p,,, extrapolated to 0 K for Fe, Co, and Ni. In case of single crystals the direction of magnetization is indicated.
0s PSI Gcm3g-’ PB
Ref
Fe 221.71 (8) 2.216(l) 68Dl
Cl001 222.67 1 2.226 83 P 1 Co, hcp [0001-J 162.55 1.715 51M2
[0001-J 163.76 1.728 83P 1 poio]i 162.95 1.719 83P 1
co, fee 166.1 1.751 55Cl Ni 58.57(3) 0.6155(3) 68Dl
IIll 58.872 0.619 83Pl
Stearns

Ref. p. 1341 1.1.2.4 Fe, Co, Ni: spontaneous magnetization 31
Table 3. Survey of the spontaneous magnetization of Fe, Co, and Ni [82P 11. Direction of magnetization is indicated. See also Table 1.
T 0s e n/i, 4nM, K Gcm3g-’ gcmm3 G G
Fe [loo] 4.2 222.671 7.93 1766 22189 286.41 218.210 7.87 1717 21580
co [OOOl] 4.21 163.862 9.0 1475 18532 286.61 162.624 8.9 1447 18 188
Ni [111] 4.21 58.872 8.97 528 6636 286.66 55.370 8.91 493 6200
Fig. 2a. Reduced spontaneous magnetization a,( T)/o,(O) of [loo] bee Fe vs. reduced temperature T/T,. 1: [71C1],2:[82P2],3:[81H3].Thedataof[7lCl]was obtained by measuring the force on prolate ellipsoids in a field gradient while that of [81 H 31 was extracted from measurements of the ac susceptibility of iron whiskers. The data of [Sl H3] has been normalized to that of [71 C l] at room temperature and corrected for the lattice expansion to give B, in [Gcm3/g]. The reduced magnetization curve has been empirically fitted to a function [S 1 H 31:
cT,( T) = CT,(O) (1 - z)B/(l - /3r + A?‘2 - W’Z) ,
where /?=0.368, A=O.1098 and C=O.129. (2)
b r/r, -
Fig. 2b. Reduced spontaneous magnetization of Co vs. reduced temperature. I: fee [71 C 11, 2: [OOOl] hcp [SZP 11.
0.8
I _ 0.6 ” d \ kY 0.4
I I I I I
0.2 0.4 0.6 0.8 IO 0 a
1.0
0.8
I - 0.6 0 6” \ G
0.4
0.2
0 c!
T/T, -
0.2 0.4 0.6 0.8 1.0 r/r, -
Fig. 2c. Reduced spontaneous magnetization of [l 1 l] Ni vs. reduced temperature. 1: [71 C 11, 2: [82P 11, 3: [69 K 11.
Land&-Bbmstein New Series III/I%
Stearns

38 1.1.2.4 Fe, Co, Ni: spontaneous magnetization [Ref. p. 134
15.: Gem'
9
12.5
1oc
I b 1.5
5s
2.E
c
500 Oe
LOO
I 300 z
2 200
100
0 1389 1385 1390 1395 1400 K l&O5
a I- b ‘:
15.0 jc&
9
12.5
10.0
I 1.5 b
2.5
1035 1OLO 1015 1050 1055 1060 1065 K 10 I-
Fig. 3. Magnetization of Fe for various applied magnetic fields in the neighborhood of the ferromagnetic Curie temperature [64 A23.
1 1388 K 13
Fig. 4a. Magnetization offcc Co sphere in various applied Fig. 4b. T, offcc Co as a function ofapplied magnetic field. maenetic fields in the neighborhood of the ferromagnetic Cuhc temperature [65 C I].
Tc is the Curie tempcraturc derived from the magnetiza- tion curve in an applied field, see Fig. 4a. as the temperature at which CT starts to decrease [65 C I].
Stearns

Ref. p. 1341 1.1.2.4 Fe, Co, Ni: spontaneous magnetization 39
8
I b 6
620 625 630 635 K 640 a T-
Fig. 5a. Magnetization of Ni in various applied magnetic fields in the neighborhood of the ferromagnetic Curie temperature [65A 11.
Table 4. Curie temperature and pressure dependence of the Curie temperature of Fe, Co, and Ni.
Metal T, K
Ref.
Fe, bee 1044(2) 64A2 1044 O.OO(3); Fig. 6 72Ll 1045(3) 71Cl
Fe, fee 44 ‘) 0.5 ‘); Fig. 9 79Ll co, fee 1388(2) 65Cl
1398 O.OO(5) 72Ll 1390.0 71Cl
Ni, fee 624.0(3) 61Ml 627 0.36(2); Fig. 7 72Ll 631(2) 71 c 1 627(l) 65Al
‘1 TN. “) W’ildp),=o.
100
0 622 623 62L 625 626 627 K 628
b T; -
Fig. 5b. T& as a function of applied magnetic field for two Ni spheres A and B with, respectively, 1Oppm Fe and 0.01 wt% Fe. Td is the Curie temperature derived from the magnetization curve in an applied field as the temperature at which 0 starts to decrease [65A 11.
I
800
h 700
600
300 0 IO 20 30 40 50 60 kbor70
P-
Fig. 6. Curie temperature (solid line and circles) and cl-y phase boundary (broken line) of pure Fe as a function of pressure. (In the insert are shown three different series of measurement for the shift of Curie temperature. The temperature scale has been enlarged 10 times). Magnetic determination ofthe a-y phase upon heating and cooling [72L 11.
Land&Bdmstein New Series 111/19a
Stearns
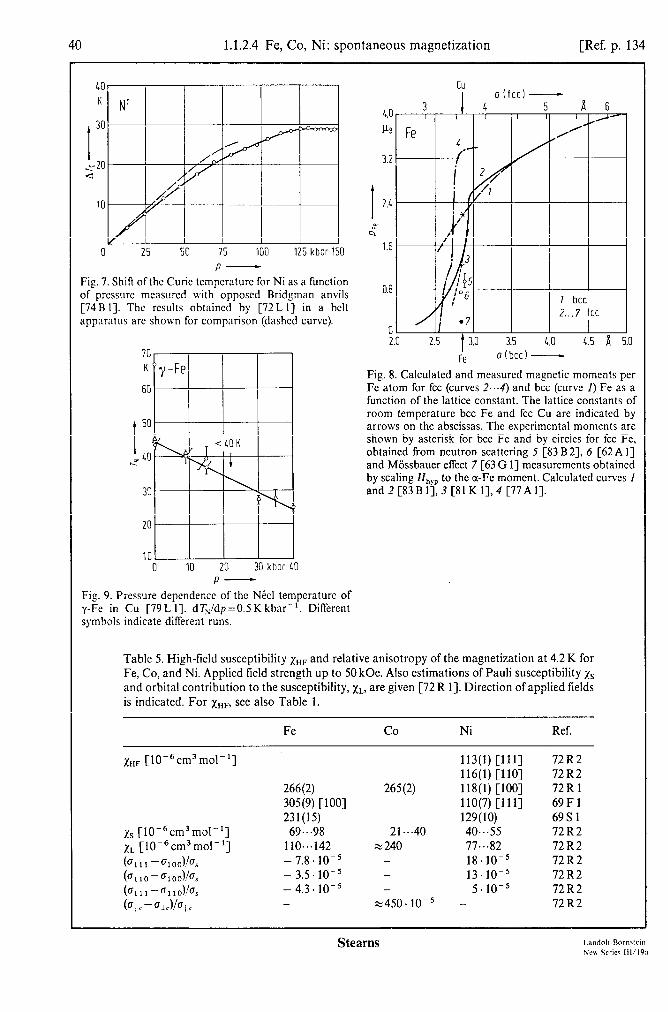
40 1.1.2.4 Fe, Co, Ni: spontaneous magnetization [Ref. p. 134
0 25 50 75 100 125 kbar150
P- Fig. 7. Shift of the Curie tempcraturc for Ni as a function of pressure measured with opposed Bridgman anvils [74B I]. The results obtained by [72L I] in a belt apparatus are shown for comparison (dashed curve).
70, I I I I A atbcc) -
3.2
I 2x
y" Q
1.6
K
60 Fig. 8. Calculated and measured magnetic moments per Fe atom for fee (curves 2...4) and bee (curve I) Fe as a function of the lattice constant. The lattice constants of room temperature bee Fe and fee Cu are indicated by arrows on the abscissas. The experimental moments are shown by asterisk for bee Fe and by circles for fee Fe, obtained from neutron scattering 5 [83 B 21, 6 [62A I] and Mossbauer effect 7 [63 G l] measurements obtained by scaling Hhyp to the a-Fe moment. Calculated curves I and 2 [83 B 1],3 [Sl K I], 4 [77A I].
10 0 10 20 30 kbar 40
P- Fig. 9. Pressure dependence of the Necl tempcraturc of y-Fe in Cu [79L I]. dTs:,ldp=0.5K kbar-‘. Different symbols indicate different runs.
Table 5. High-field susceptibility xHF and relative anisotropy of the magnetization at 4.2 K for Fe, Co, and Ni. Applied field strength up to 50 kOe. Also estimations of Pauli susceptibility xs and orbital contribution to the susceptibility, xL, are given [72 R 11. Direction of applied fields is indicated. For xHF, see also Table 1.
Fe co Ni Ref.
XHF [lo+ cm3 mol- ‘1
266(2) 305(9) [loo] 231(15)
xs [10-6cm3mol-‘] 69...98 xL [10-6cm3mol-1] 110...142 (0 111 - 01 ooh - 7.8. lo-’ b 110 -~,ooY~, - 3.5.10-s (~1*1--~11oY~s - 4.3.10-s (a,,,-~,cM,,c -
113(l) [111] 72R2 116(l) [llO] 72R2
265(2) 118(l) [loo] 72R1 llO(7) [ill] 69Fl 129(10) 69s 1
21...40 40...55 72R2 ~2240 77...82 72R2
- 18.10-5 72R2 - 13.10-5 72R2 - 5.10-5 72R2
w450.10-5 - 72R2

Ref. p. 1341 1.1.2.5 Fe, Co, Ni: magnetocrystalline anisotropy 41
Table 6. Magnetic properties of fee Fe. P: paramagnetic, F: ferromagnetic, AF: antiferromagnetic, RT: room temperature.
Sample Magnetic pFe state PB
TN K
H hw kOe
Measuring method
Ref.
y-Fe, bulk at 1320K
P 0.9(1)6)
precipitates in Cu-matrix: a=3.59...3.61 A
particle size: x25OA AF, P at RT 55(3) x7ooA AF 67(2)
67 0.75 g4)
6OA 46 epitaxial films on Cu: electrolytic
[110] y-Fe, 3OA ‘) F at RT [ill] y-Fe, 6.*.80A F at RT :::8(13) 3,
four layers separated by Cu (ill), (110) or AF, P at RT (100) layers, lg...25 A 20...40
‘) Large fraction of a-Fe appears also in the spectrum. 2, Presence of a-Fe can not be excluded. 3, Independent of thickness. “) Estimated, see [70 J 11. “) K,=-2.0.104ergcm-3. 6, May be less than the actual moment.
polarized neutron scattering
83B2
x24(6) Mijssbauer sp. 63G1 x 23 (6) Mijssbauer sp. 63Gl
neutron diff. 7OJl neutron diff. 62Al Miissbauer sp. ‘) 79 L 1
FMR “) 71Wl magnetization “) 7662,
77Kl
Mijssbauer sp. 77K2, 83Hl
1.1.2.5 Magnetocrystalline anisotropy constants
The anisotropy constants K,, K,, . . . are defined for cubic lattices such as Fe and Ni by expressing the free energy of the crystal anisotropy per unit volume by
with
E,=Ko+K,S+K2P+K3S2+K4SP+... (1)
s = u;u; + c7.g; + c&; and P = ct2c12u2 1 2 3r
where cli, clj, elk are the direction cosines of the angle between the magnetization vector and the crystallographic axes.
For hexagonal lattices, such as Co, it is more convenient to use the definition
where 4 is the angle between the magnetization and the c axis, and 0 is the angle in the basal plane. The measurements are usually made on single-crystal spheres in a field large enough to remove the domain
walls (called technical saturation). It is usually assumed that all the work done in changing the direction of magnetization is used to overcome the crystal anisotropy. The most common techniques used to measure this work are:
1. Measurements of the torque required to change the direction of the saturation field (TQ). 2. Measurements of the magnetization in different crystallographic directions with a moving (MSM) or a
rotating (RSM) sample magnetometer.
Land&Bbmstein New Series 111/19a
Stearns

42 1.1.2.5 Fe, Co, Ni: magnetocrystalline anisotropy [Ref. p. 134
3. Ferromagnetic resonance experiments (FMR). The anisotropy constants depend weakly on the applied field at high fields (> 5.. .lO kOe) and vary greatly in
some temperature ranges. Due to this it is necessary to specify how the data was treated in order to obtain the anisotropy constants.
Comparisons with anisotropy constants obtained from various band structure calculations are discussed in [78 G I. 71 F 1] as well as in a number of papers listed in [SOW 11.
Table 1. Magnetocrystalline anisotropy constants of Fe, as derived from magnetization (M,, M,,) and torque (TQ) measurements. M,: analysis, above technical saturation, of the magnetization perpendicular to the applied field vs. direction of Harp, in the plane indicated. M ,i : analysis, below saturation, of the magnetization parallel to the applied field. direction as indicated, vs. H,,,,.
T Method K, K2 K3 Ref. K
lo5 ergcme3
4.2 M, (110) 4.70 1.90 MI; [1101 5.35 M,; [111] 5.64 1.94
20 TQ 5.20 -0.158
77 M, (110) 4.48 2.41 MI, iIll 5.31 M,, Cl111 5.56 1.79 TQ 5.15 -0.154 TQ ‘1 5.15 TQ 2, 5.02
273 TQ 4.81 0.012 TQ 4.75 w -0.13 TQ 4.50 Xnc 7 4.71
‘) K, vs. H at constant T, extrapolated to zero field. 2, T vs. H at constant K,, extrapolated to zero field. 3, ac susceptibility measurements on whiskers.
6 405 erg - cm3
I
0.E a5
g’ erg
t
cm3
s" ox
?O < <
0.2 -2
-LL 0 0 200 LOO 600 800 1000 K 1200 t
a I- b
0.22 -0.64
0.202
0.25 -0.62
0.711
-0.012 ZO.195
82T4 82T4 82T4
68Gl
82T4 82T4 82T4 68K 1 66Kl
73 El 68Gl 66Kl 81H3
Fe
0 +
CI Y -r ot v +o+
6
+++ 0 900 1000 K 1’
T- Fig. la. Temperature depcndencc of magnctocrystalline K, (3), K2(4)and K, (5)extrapolated to infinite magnetic amsotropy constants of Fe as obtained from torque field. Note the expanded scale for K, and K,. [72 B I]: K, mcnsurcmcnts [66 K I,68 G I], fcrromagnctic rcsonancc (6). [81 H 31: K, (7). [72B I] and ac susceptibility [Sl H 33. [66K I]: K, Fig. lb. Expanded plot of K, near Tc for Fe. For extrapolated to zero magnetic field of (I) K, vs. H at symbols, see Fig. la. constant Tand (2) TVS. H at constant K, data. [68 G I]:
Stearns

Ref. p. 1341 1.1.2.5 Fe, Co, Ni: magnetocrystalline anisotropy 43
10.0 .in6 Ice I 3
I 5.0 i
2.5
aI I I I I I I I I IW -2.51" I __^ .lS.U I I I I I I I I I I I I I
2: I I I I I Rriddmon 1 1 1 1 1 1 1
I &octhski y I 1
I /-
float zone
I lO.OM
1
/
c 1.5 ,’
\ 5.0 \ \
2.5
Ob
5.0 I I I I h
2.5 x
OC B, 50 150 250 350
Fig. 2. Temperature dependence of magnetocrystalline anisotropy constants of single crystals of hcp Co grown in different ways [84P 11. (a) K,, (b) Kz, (c)basal plane anisotropy constant K,.
Landolf-Bdmstein New Series 111/19a
Stearns

44 1.1.2.5 Fe, Co, Ni: magnetocrystalline anisotropy [Ref. p. 134
Fig. 3. Temperature dependcncc of the first and second order uniaxial magnctocrystallinc anisotropj constants. K, and K,, for hcp Co: I: single crystal [61 B43, 2: [54B I], 3: [77 B I], 4: [67 K 41.5: [64 K I], 6: [Sl 0 I]. 7: [70 S I], 8: [54 S l-j, 9:[67Tl]. 10:[84P I].
Fig. 4. Magnetic field dependcncc of the first (a) and second (b) order uninsial magnctocrystallinc anisotropy constants of hcp Co at various tempcraturcs. Note the espanded scale of the vertical axis for the cun’cs above 480 K [Sl 0 I].
10.0 .in6 I I h I I
20 .I05
i
e's cm3
$- 10
5
0 0 100 200 300 400 500 K 600
I- 8.0
,105 co
s
I T= 4.2K
0 3 6 9 12 15 kOe a H OPPl -
1.6 .106 erg - cm3
1.3 290K-
1.1
1.2
I
1.0
9 1.0
0.8
0.82
0.78
0.68
0.6L
0.60 557K
0.56
OS0 616K-
0.46 3 6 9 12 15 kOe 18
H OPPl-

Ref. p. 1341 1.1.2.5 Fe, Co, Ni: magnetocrystalline anisotropy
0” 500 525 550 575 K 600
Fig. 5. Temperature dependence of the angle 6 between the direction ofspontaneous magnetization and the c axis of a single crystal of hcp Co [61 BS]. Points: data. Curve: calculated from sine = (-K1/2K2)“‘.
Table 2. Magnetocrystalline anisotropy constants for fee Co [54 S 11.
T
“C
Kl
lo5 ergcme3
K2
500 550 600 650 700 750 800 850 900 950
- 2.30 - 1.60 - 1.09 -0.80 -0.60 -0.41 -0.23 -0.15 -0.09 - 0.09
-4.31 -3.80 -3.21 -2.50 - 1.91 - 1.35 - 1.03 -0.76 -0.57 -0.36
t 21 \ .
I
IO BOO 1000 K 1200 0 200 400 600 ~
Fig. 6. Temperature dependence of the magnetocry- stalline anisotropy constants Kr and Ks in fee Co [64 D 11. Solid circles: [62 R 11, open circles: [54 S 11. The measurements in [62R l] were with ferromagnetic
Land&-Bdmstein New Series lWl9a
Stearns
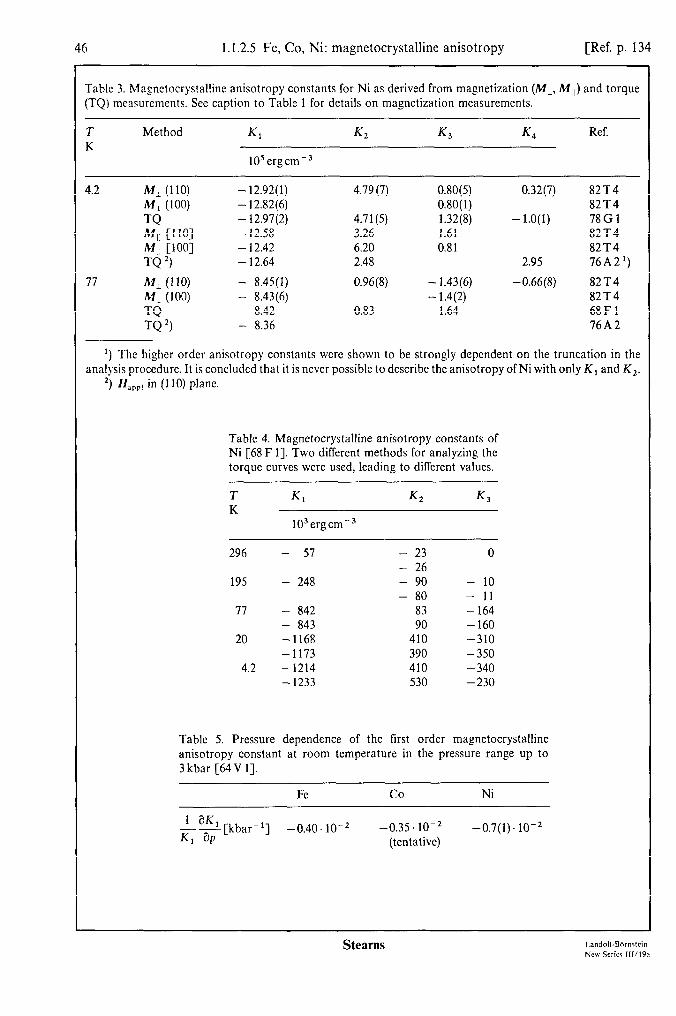
46 1.1.2.5 Fe, Co, Ni: magnetocrystalline anisotropy [Ref. p. 134
Table 3. Magnetocrystalline anisotropy constants for Ni as derived from magnetization (M,, MIi) and torque (TQ) measurements. See caption to Table 1 for details on magnetization measurements.
T Met hod Kl K2 K3 6 Ref. K
105ergcm-3
4.2 M, (110) M, (100) TQ M,, Cl101 M,, Cl001 TQ *I
77 M, (110) M, (100) TQ TQ *I
-12.92(l) - 12.82(6) - 12.97(2) - 12.58 - 12.42 - 12.64
- 8.45(l) - 8.43(6) - 8.42 - 8.36
4.79 (7) 0.80(S) 0.80( 1)
4.71(5) 1.32(8) 3.26 1.61 6.20 0.81 2.48
0.96(8) - 1.43(6) - 1.4(2)
0.83 - 1.64
0.32(7) 8214 82T4
-LO(l) 78Gl 82T4 82T4
2.95 76A2’)
-0.66(8) 82T4 82T4 68Fl 76A2
‘) The higher order anisotropy constants were shown to be strongly dependent on the truncation in the analysis procedure. It is concluded that it is never possible to describe the anisotropy of Ni with only K I and K,.
*I &,,I in (110) plane.
Table 4. Magnetocrystalline anisotropy constants of Ni [68 F 11. Two different methods for analyzing the torque curves were used, leading to different values.
T K, K2 K3
K 103ergcm-’
296 - 57
195 - 248
77 - 842 - 843
20 -1168 -1173
4.2 -1214 - 1233
- 23 - 26 - 90 - 80
83 90
410 390 410 530
0
- 10 - 11 -164 -160 -310 -350 -340 -230
Table 5. Pressure dependence of the first order magnetocrystalline anisotropy constant at room temperature in the pressure range up to 3 kbar [64 V 11.
FC co Ni
&%[kbar-‘1 -0.40.10-2 -0.35.10-2 -0.7(l). 10-2 1 (tentative)

Ref. p. 1341 1.1.2.5 Fe, Co, Ni: magnetocrystalline anisotropy
-0 0 25 50 25 50 75 K 100 75 K 100 a
-1
.I05 erg 3
0 C
Ni
80 160 K 2 T-
-6
.,J
gi 0 0 100 200 300 400 500 K 60[
b T-
Fig. 7. Temperature dependence of magnetocrystallir anisotropy constants ofNi.(a)K,. I: [68 F 1],2: [74T 1 3: [77 B 2],4: [77 0 11. Solid line: calculation [77 0 l].( K,, K,, and K,. Accuracy ofdata is considerably reduce near 7”: dashed lines in the insert [68 A l].(c)K,. I and, [76A 1],3: [69 F 2],4: [77 B 21. Solid line is to guide t1 eye through confidence limits [76A 11.
I
% kOe 0.75
s a
2 0.50 a
2 ; 0.25
02 -100 -50 0 50 “C II
Fig. 8. Relative change of the first order magnetocr: stalline anisotropy constant K, of Ni with magnetic fiel H as a function of temperature [63 V 11. HappI = 10 k0
Landolt-BOrnstein New Series 111/19a
Stearns
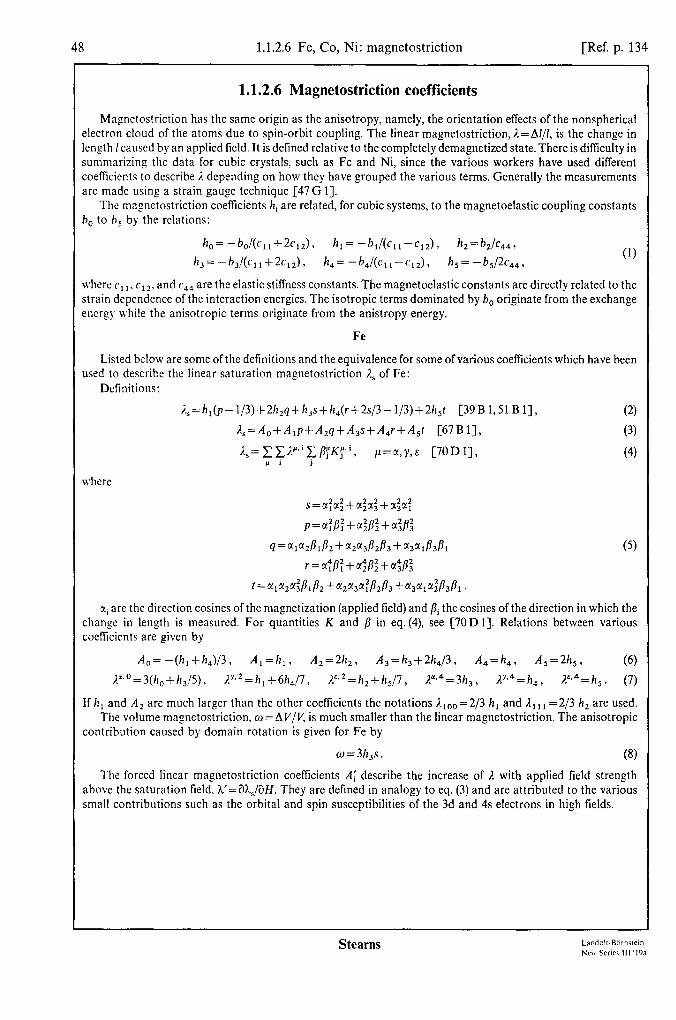
48 1.1.2.6 Fe, Co, Ni: magnetostriction [Ref. p. 134
1.1.2.6 Magnetostriction coefficients
Magnetostriction has the same origin as the anisotropy, namely, the orientation effects of the nonspherical electron cloud of the atoms due to spin-orbit coupling. The linear magnetostriction,l=Al/l, is the change in length /caused by an applied field. It is defined relative to the completely demagnetized state. There is difficulty in summarizing the data for cubic crystals, such as Fe and Ni, since the various workers have used different coefficients to describe I. depending on how they have grouped the various terms. Generally the measurements are made using a strain gauge technique [47G 11.
The magnetostriction coefficients hi are related, for cubic systems, to the magnetoelastic coupling constants h, to h, by the relations:
ho= -bol(c,,+2c,,)> h,= -b,l(c,,-cl,), h,=b,lc,,t h,=-bJ(c1,+2c~dr h,=-b&1,-c,,), As=--k&,,,
(1)
wherec,,,c,,, and cd4 are the elastic stiffness constants. The magnetoelastic constants are directly related to the strain dependence of the interaction energies. The isotropic terms dominated by b. originate from the exchange energy while the anisotropic terms originate from the anistropy energy.
Fe
Listed below are some of the definitions and the equivalence for some of various coefficients which have been used to describe the linear saturation magnetostriction 1, of Fe:
Definitions:
where
i.,=h,(p-l/3)+2h,~+It,s+h,(r+2.~/3-1/3)+2h,t [39B1,51Bl],
i.,=A,+A,p+A,q+A,s+A,rfA,t [67B I],
E.,=~~%“~‘~~;K~~‘, p=a,y,~ [70Dl], P i j
f-4
(3)
(4)
s = a:a$ + a$a: + a:af
p=a:/3:+a$?22+a$?:
q=ala2PIP2+a2a3B2P3+a3aIB3Pl
r=af/lf+a;/li+a‘$:
r=ala2a:BlB2+a2a3atP2B3+a,alatp,pl.
(5)
zi arc the direction cosines of the magnetization (applied field) and pi the cosines of the direction in which the change in length is measured. For quantities K and /? in eq. (4) see [70D 11. Relations between various coefficients are given by
A,= -(h,+h,)/3, A,=h,, A,=2h,, A,=hs+2hJ3, A,=h,, A,=2h,, (6) P0=3(ho+h,/5), %‘l- * = h, + 6h,/7 , F2=hz+h5/7, P4=3h3, ly-4=h 4r P4=h,. (7)
If h r and A, are much larger than the other coefficients the notations Iloo = 2/3 h, and 1, r, = 2/3 h, are used. The volume magnetostriction, Q = AVIV, is much smaller than the linear magnetostriction. The anisotropic
contribution caused by domain rotation is given for Fe by
o=3h,s. (8)
The forced linear magnetostriction coefficients Ai describe the increase of I. with applied field strength above the saturation field, l.‘=aAJi3H. They are defined in analogy to eq. (3) and are attributed to the various small contributions such as the orbital and spin susceptibilities of the 3d and 4s electrons in high fields.
Landolt-Rornrtcin Phv Scricr 111’19a
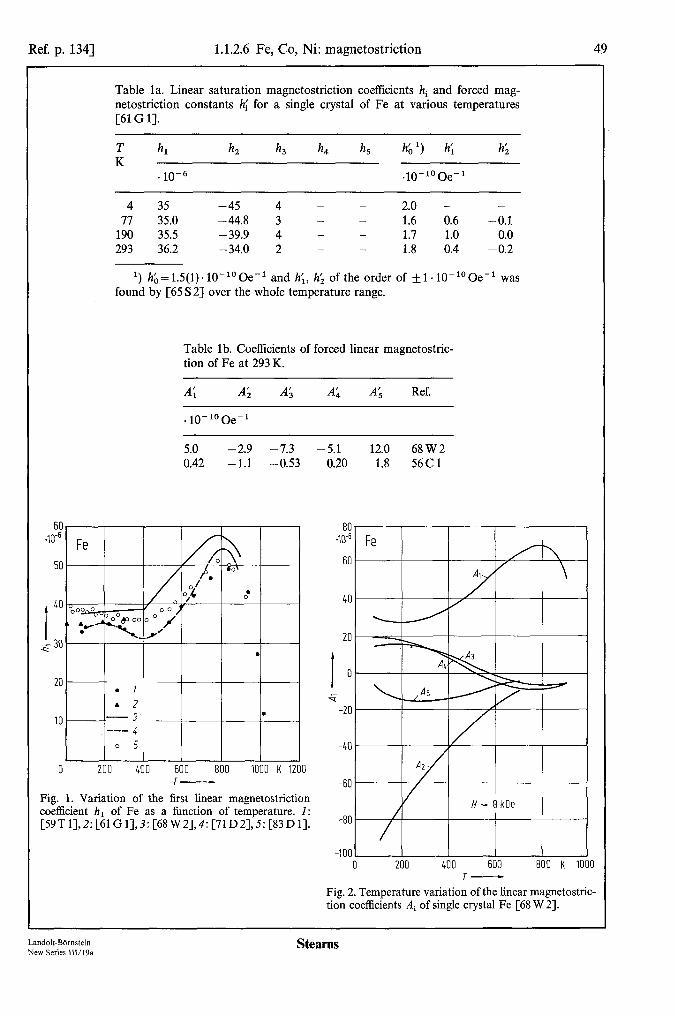
Ref. p. 1341 1.1.2.6 Fe, Co, Ni: magnetostriction 49
Table la. Linear saturation magnetostriction coefficients hi and forced mag- netostriction constants !rl for a single crystal of Fe at various temperatures [61 G 11.
T h, K
.10-6
h, h3 h, h, & ‘) h;
.l()-lOOe-l
h’,
4 35 -45 4 - - 2.0 - - 77 35.0 -44.8 3 - - 1.6 0.6 -0.1
190 35.5 -39.9 4 - - 1.7 1.0 0.0 293 36.2 -34.0 2 - - 1.8 0.4 -0.2
I) ho=1.5(1)~10-‘00e-’ and h;, h; of the order of +l. 10-lOOe-’ was found by [65 S 21 over the whole temperature range.
Table lb. Coefficients of forced linear magnetostric- tion of Fe at 293 K.
4 A; A; Ak A; Ref.
. 10-‘“Oe-’
5.0 -2.9 -7.3 -5.1 12.0 68W2 0.42 -1.1 -0.53 0.20 1.8 56Cl
I 0 200 400 600 800 1000 K 1200
T- Fig. 1. Variation of the first linear magnetostriction coefficient hl of Fe as a fimction of temperature. I: [59T1],2:[61G1],3:[68W2],4:[71D2],5:[83Dl].
0 200 400 600 800 K 1000 T-
Fig. 2. Temperature variation of the linear magnetostric- tion coefficients Ai of single crystal Fe [68 W 21.
Land&Bbmstein New Series lW19a
Stearns

50 1.1.2.6 Fe, Co, Ni: magnetostriction [Ref. p. 134
CO
The widely used notation for the linear saturation magnetostriction for Co is [54 B l]
i., = %,,(s’2 - s’aJIJ) + I.& 1 - a:) (1 - j?:) -s’“] + &[( 1 - a:)bf - s’a,jlJ + 4l.,s’a,fl, , (9)
where s’=rx,~,+a2/?2. The direction cosines relate to the orthogonal axes (l(x), 2(y), 3(z) E c axis), not to the hexagonal axes. Note
that with this definition h=O when the direction of magnetization and length change are both along the c axis so that for Co the change in length is measured from this initial state.
-80
-120
-160 -200 -100 0 100 200 300 "C 4
I-
Fig. 3. Variation with temperature of the linear magnctostriction cocnicicnts of single crystal Co. Also shown is the volume magnctostriction, I.,, = ).A + ,IB + I.,, and ).,,--I., [69H I]. Room-tempcraturc values: ,In = -50.10-6, %,= -107.10-6, %,=126. lO-(j, 1, =-105,10-6, %,~=-31~10-6, which agree with the earlier values of Bozorth [54 B I].
Ni
Again different definitions for I., exist in the literature for Ni. One is given by eq. (3). Another is given by [71 L 1-j:
i.,=h,+k,(p-1/3)+21~,q+h,(s-1/3)+h,(r+2~/3-1/3)+2h,t.
The relation between the coefficients is the same as that given by eq. (6) with the exception that
(10)
A,=h,-(Ir,+h,+h,)/3.
At present there seems to be no satisfactory theory to represent the magnetostriction behavior of these metals [71 L 1, 71 B 1-J.
Stearns
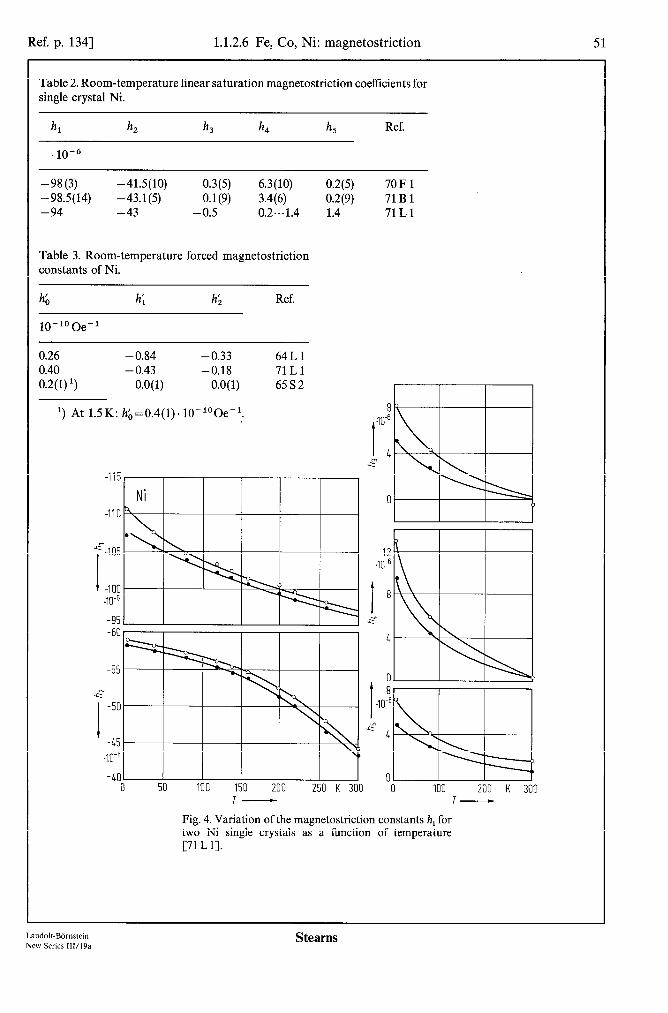
Ref. p. 1341 1.1.2.6 Fe, Co, Ni: magnetostriction 51
Table 2. Room-temperature linear saturation magnetostriction coefficients for single crystal Ni.
h, hz h, h, h, Ref.
.10-6
-98 (3) -41.5(10) 0.3(5) 6.3(10) 0.2(5) 70Fl -98.5(14) -43.1(5) 0.1(9) 3.4(6) 0.2(9) 71 B 1 -94 -43 -0.5 0.2...1.4 1.4 71Ll
Table 3. Room-temperature forced magnetostriction constants of Ni.
h6 h; h:, Ref.
lo-“Oe-’
0.26 -0.84 -0.33 64Ll 0.40 -0.43 -0.18 71Ll 0.2(l) ‘) 0.0(l) 0.0(l) 6582
‘) At 1.5K: hb=0.4(1). 10-‘OOe-l.
x-6 I I I I -95 I -60
-55
P
I
-5c
-45
.m6
-41:
8
I w”
4 c”
12 w6
I 8
Js
4
, 0
I 8 m6
m 2: 4
50 100 150 200 250 K 300 0 100 200 K 300 T- T-
Fig. 4. Variation of the magnetostriction constants hi for two Ni single crystals as a function of temperature [71 L 11.
Land&-BOrnstein New Series 111/19a
Stearns
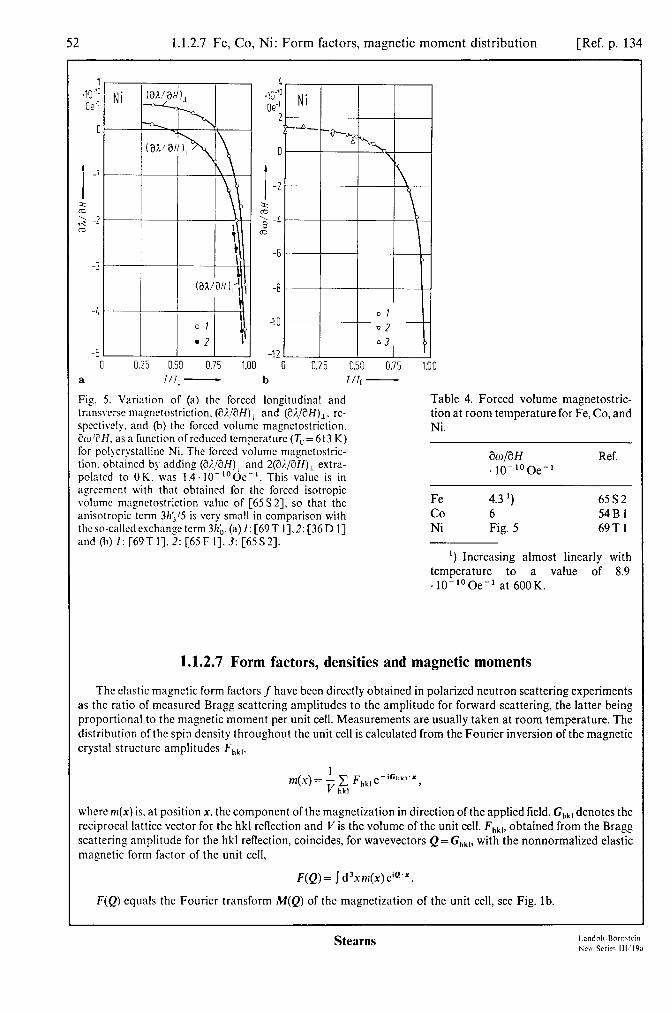
52 1.1.2.7 Fe, Co, Ni: Form factors, magnetic moment distribution [Ref. p. 134
-5
a 0.25 0.50 0.75 1.
I/i, -
4 .10-‘1 Oe-’
i
-10
-12
b 0.25 0.50 0.75 1.00
T/T, -
Fig. 5. Variation of (a) the forced longitudinal and transverse mngnctostriction, (C?LBH) ,, and (X,CUf),, rc- spectlvely, and (b) the forced volume magnctostriction, SW’SH. as a function ofrcduccd tempcraturc (TC= 613 K) for polycrystalline Ni. The forced volume magnctostric- lion. obtnincd by adding (X,GH) ,, and 2(8./W), extra- polated to OK, was 1.4. 10-‘OOe-‘. This value is in agrccmcnt with that obtnincd for the forced isotropic volume magnctostriction value of [65S2]. so that the anisotropic term 3h’,/5 is very small in comparison with the so-called exchange term 311;. (a) I: [69 T 11.2: [36 D I] and (b) I: [69T I]. 2: [65 F I]. 3: [65 S 21.
Table 4. Forced volume magnetostric- tion at room temperature for Fe, Co, and Ni.
&O/Cl H . 10-lOOe-’
Ref.
Fe co Ni
4.3 ‘) 6532 6 54Bl Fig. 5 69Tl
‘) Increasing almost linearly with temperature to a value of 8.9 .lO-“Oe-’ at 600K.
1.1.2.7 Form factors, densities and magnetic moments
The elastic magnetic form factors f have been directly obtained in polarized neutron scattering experiments as the ratio of measured Bragg scattering amplitudes to the amplitude for forward scattering, the latter being proportional to the magnetic moment per unit cell. Measurements are usually taken at room temperature. The distribution of the spin density throughout the unit cell is calculated from the Fourier inversion of the magnetic crystal structure amplitudes F,,,,
where m(x) is. at position x. the component of the magnetization in direction of the applied field. G,,, denotes the reciprocal lattice vector for the hkl reflection and V is the volume of the unit cell. F,,,, obtained from the Bragg scattering amplitude for the hkl reflection, coincides, for wavevectors Q=G,,,, with the nonnormalized elastic magnetic form factor of the unit cell,
F(Q) = 5 d3xm(x) eiQ’*.
F(Q) equals the Fourier transform M(Q) of the magnetization of the unit cell, see Fig. lb.
Stearns

Ref. p. 1341 1.1.2.7 Fe, Co, Ni: Form factors, magnetic moment distribution 53
The magnetic moment densities measured by neutron scattering are the net spin polarizations in the direction of the applied field, averaged over the resolution function related to the finite number of Bragg reflexions being taken into account in evaluating the Fourier sum. In [62 S 21 this resolution function had a width of 0.2 A. In contrast the magnetic moments obtained from hyperfine experiments measure the 4s or 3d conduction electron polarization contributions.
A detailed analysis of the form factor values includes both quenched and unquenched orbital momentum, core polarization of the inner electrons, the 4d conduction electrons and the symmetry population of the 3d quenched electrons. This analysis assumes a magnetization distribution based on free-atom wave functions [62 S 31.
Another Fourier analysis technique assumes that the moment density is composed of a constant average magnetization and a periodic localized contribution. An atomic moment of 2.37(4) pa was found for Fe [71 M 21.
Table 1. Contributions in pn per atom to the atomic moments of Fe, Co, and Ni as obtained from two different analyses of room-temperature coherent polarized neutron scattering data: (i) form factor analysis assuming a magnetization distribution based on free-atom wave functions and (ii) Fourier analysis assuming a periodic localized and a constant average magnetization. The total magnetic moment is simply related to the forward magnetic scattering amplitude. This amplitude was determined for Fe to be 0.589(6). lo-l2 cm per atom from the refractive bending of a thermal neutron beam [71 S 61, corresponding to a magnetic moment per atom of 2.180 prr. For the paramagnetic state, see Table 2 for Fe; for Ni the magnetic form factor in the paramagnetic state at 1060 K and in an applied field of 13 kOe was determined from the first five Bragg reflections. It was found to be similar to the room-temperature values, indicating that there is no gross change in the localized part of the spin density at this temperature [67 C 11.
Metal Form factor analysis Fourier analysis
3d spin 3d orbit Constant Relative Ref. 3d Constant Ref. average population 3, average
T 2!3 E,
Fe 2.25 0.14 -0.21 1.2) 47% 53% 6232 2.37(4) -0.19 71M2 co 1.86(7) 0.13(l) - 0.28(7) “) 64M 1 1.96(4) -0.25 71M2 Ni 0.656 0.055 -0.0105 81(l)% 19(l)% 66M2 0.68(2) -0.10 71M2
‘) The use of this crystal field model has been criticized and it is suggested that the regions of negative polarization are caused by a spin dependence of the radial part of the d electron wave function [71 D 11.
‘) Band calculations have found a variety of 4s polarization values. Some typical values are -0.011 us/atom [68 W 11, a small positive polarization [71 D l] and -0.024... - 0.040 pe/atom [77 C l] which are much smaller than the value of -0.21 pa obtained from the neutron data analysis.
“) For spherical symmetry this would be 60% T,, and 40% E, ‘) A Fourier inversion of the data is in agreement with the model consisting of a nearly spherical distribution
of spin density composed of a positive spin-polarized, 3d’ 4s2 free-atom like, contribution plus a constant negative contribution.
Table 2. Average magnetic moment The characteristic neutron in- per atom, P, for Fe in the paramag- teraction time of these experiments, netic state as obtained from polar- w lo- I3 s, is expected to be slightly ized neutron scattering [83 B 23. longer or comparable to the local-
moment spin-flipping time (some- Fe T P times referred to as the transverse
K PB spin fluctuation time [78 M2, 7911, 79 M2]). Thus the values
bee 1273 1.3(l) measured are likely to be lower (1.25 T,) than the actual local moment.
fee 1320 0.9(l)
Landolt-BBmstein New Series 111/19a
Stearns
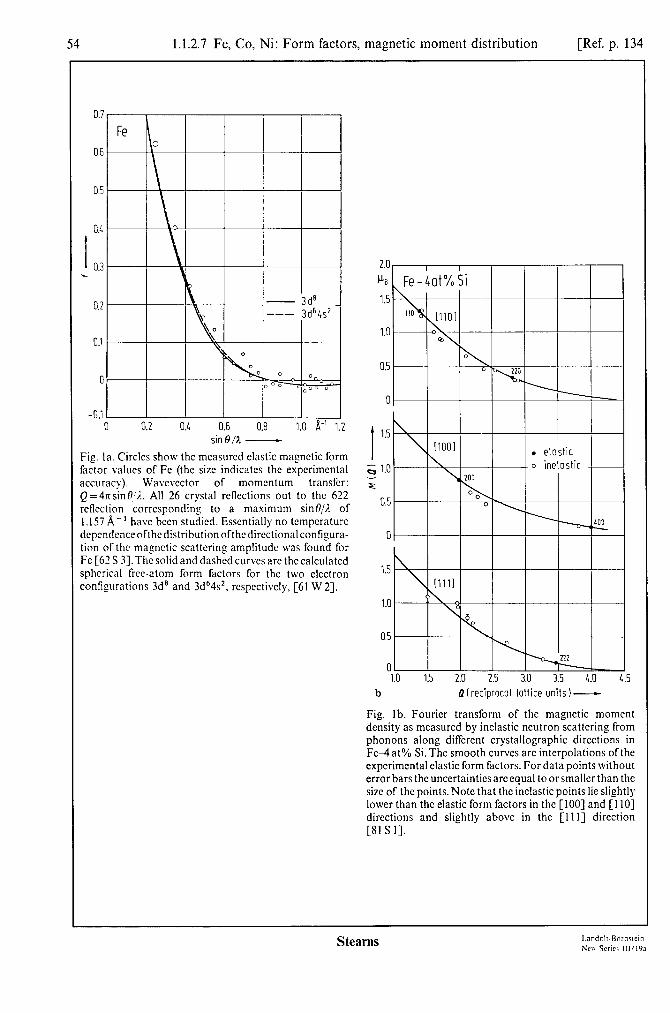
54 1.1.2.7 Fe, Co, Ni: Form factors, magnetic moment distribution [Ref. p. 134
-0.1 0 0.2 0.4 0.6 0.8 1.0 A-’ 1.2
sinB/L - Fig. la. Circles show the measured elastic magnetic form factor values of Fe (the size indicates the experimental accuracy). Wavcvcctor of momentum transfer: Q =4rcsmt?‘L. All 26 crystal reflections out to the 622 reflection corresponding to a maximum sin0/l. of I.157 A- ’ have been studied. Essentially no tempcraturc depcndenceofthcdistributionofthcdircctionalconfigura- tion of the magnetic scattering amplitude was found for Fe [62 S 31. The solid and dashed curves are the calculated spherical free-atom form factors for the two electron configurations 3ds and 3dh4s2, rcspcctivcly, [6l W 23.
1.5
1.0
0.5
0 1.0 1.5 2.0 2.5 3.0 3.5 4.0
b 0 (reciprocal lattice units I-
Fig. lb. Fourier transform of the magnetic moment density as measured by inelastic neutron scattering from phonons along different crystallographic directions in Fe4 at% Si. The smooth curves arc interpolations of the expcrimcntal elastic form factors. For data points without error bars the uncertainties are equal to or smaller than the size of the points. Note that the inelastic points lie slightI) lower than the elastic form factors in the [ IOO] and [I IO] directions and slightly above in the [I II] direction [8l S I].
Stearns

Ref. p. 1341 1.1.2.7 Fe, Co, Ni: Form factors, magnetic moment distribution 55
Fig. 2. Magnetic moment density distribution obtained from the Fourier inversion of the data of Fig. la over (a) the (100) face and (b) the (110) diagonal plane of the Fe unit cell. The asymmetric contour lines show that the 3d electrons are asymmetrically distributed around the Fe nucleus. The values of the spin densities are in units of h/A31> C62 S 21.
Fig. 3. Magnetization distribution in the interstitial region of the Fe unit cell, obtained by averaging over a cube size of0.5 8. The numbers correspond to the magnetization in [kG]. Negative magnetization was found to occur in a series of interlocking rings throughout the Fe lattice [66 s 31.
Landolt-Biirnstein New Series IWl9a
Stearns

56 1.1.2.7 Fe, Co, Ni: Form factors, magnetic moment distribution [Ref. p. 134
0.8 1 co 0.7 p
hcp
0.6 o hcp Co
l fee COD.92 ho0
0.5
I 0.1
t 0.3
0.2
0.i
0
-0.1 0.2 0.6 0.6 0.8 H’ 1.0
Fig. 4. Measured magnetic form factor of hexagonal Co (open circles) [64 M I] and fee Co--8 at%Fe (solid circles) [59N I]. Wavevector of momentum transfer: Q = 471 sin O/L. The solid line emphasizes the almost sphcr- ical symmetry of the hexagonal form factor. The form factor for Co showed no dependence on temperature between 78 and 300K.
0.8 E f
. . measured measured 1 / & 1 1 o calculated B o calculated 0.7 l
*
0.5
0.5 R
;
0.L
ZN 0:
0.3 %
0.2 9: 6%
e” FiR 0.1 90
5
0
-0.1 -0.1 I I I I I 0 0 0.2 0.2 0.L 0.L 0.6 0.6 0.8 0.8 1.0 1.0 Yi’ Yi’ I I
sin 0 /1 -
0.9
Ni
u
--- fJ73K - 300 K
0 0’ 04 04 0.5 0.5 0.6 ti-’ 0.7 0.6 ti-’ 0.7
sin 0 /A - sin 0 /A -
Fig. 5. Form factor offcc Co at 600 “C (dots)compared tf the form factor at room temperature (crosses) [63 M 1: Curves rcprcsent smooth interpolations. Wavevector c momentum transfer: Q = 47t sin O/I..
Fig. 5. Form factor offcc Co at 600 “C (dots)compared tf the form factor at room temperature (crosses) [63 M 1: Curves rcprcsent smooth interpolations. Wavevector c momentum transfer: Q = 47t sin O/I..
(0.0) co.gfl
I -A I
Fig. 6. Projection of magnetic moment density on has; plane of hcp Co. Lower right diagram shows projecte position of atoms in orthorhombic unit cell. Dashed line’ indicate portion of cell shown in density map [64 M I]
Fig. 7. Comparison of the measured (solid circles) ant calculated (open circles) free atom magnetic form factors o Ni. Wavevector ofmomentum transfer: Q =4n sin8/7,.Thc measured magnetic form factor was determined from the first 27 Bragg reflections. The model used in the calculatec form factor consisted of a uniform negative spin contri bution of -0.019 pa/A3,aspincontribution obtained fron unrestricted Hartrcc-Fock calculations for Ni + + [60 W 1 61 W 43, an orbital part and a core contribution [66 M 21 The inelastic magnetic form factor in the [ 1001 directior was found to be the same as that ofthe elastic form facto] [8l S I].
Stearns

Ref. p. 1341 1.1.2.7 Fe, Co, Ni: Form factors, magnetic moment distribution 57
Ni nucleus
a 7-
0
-;s
-0.0085
Ni
Ni nucleus Ill01 - w
I
-0.0085#
-0.0085 -0.0085
b a T-
nucleus
Fig. 8. Contour maps of the magnetic moment density in Ni obtained by Fourier inversion of the data for (a) the (100) plane and (b) the (110) plane. The numbers labelling the contours give the magnetization in [ur,/A3], [66 M 21.
0 100 200 300 400 500 600 K 700
Fig. 9. Temperature dependence of the T,, and E, subband magnetizations per atom in Ni as derived from the temperature dependence ofthe 333 and 511 reflections in a polarized neutron scattering experiment [81 C2].
Land&-Bdmstein New Series IIl/19a
Stearns

58 1.1.2.8 Fe, Co, Ni: hyperfine fields, isomer shifts, relaxation time [Ref. p. 134
1.1.2.8 Hyperfine fields, isomer shifts and relaxation time
The hypcrfinc magnetic fields have been mainly determined using three techniques: nuclear magnetic resonance (NMR), Massbauer effect spectroscopy (ME) for Fe and variations of the perturbed angular correlation technique. A number of books and review articles are written on the subject [64 W 1,65 F I,71 F 1, 74V 11. Only results from NMR and Miissbauer effect measurements will be discussed here.
Magnetic hyperfine field Hhrp
NMR experiments measure the hyperlinc fields by observing the Zeeman splitting of the ground state of nuclei having nuclear magnetic moments, i.e. of nuclei with angular moment quantum number I+O. The resonance linewidths of ferromagnetic materials are naturally relatively large, of the order of 0.5 kOe. These widths are attributed to anisotropy fields and defects. Spin-echo and modulated continuous wave (cw) NMR techniques are used to study these materials.
The Miissbauer effect measures the magnetic hyperline fields and electric quadrupole fields from the Zeeman splittings of the ground and excited states of the nuclear transitions. These splittings are obtained by varying the relative velocity of the source and absorber [62P l] and are given in the practical unit [mms-‘1.
Miissbauer effect measurements can not be made on Co. 61Ni, having a 67.4 keV y-ray, is a possible but poor ME nucleus, “Fe an excellent one.
The hyperfine field Hhyp is made up from several contributions which can be represented by
f&p = Hcorc + Has + Hart, + Ha, . (1)
H core is due to the Fermi contact interaction of the spin-polarized Is, 2s, and 3s core electrons. H,, is the contact term arising from the spin polarization of the 4s conduction electrons which is due to exchange and hybridization interactions with the d spin moment. Herb is the field contribution from the dipolar interactions from any unquenched orbital momentum on the central atom. H,,, is due to external influences such as applied fields. demagnetizing tields and Lorentz fields. This contribution is zero in cubic Fe, Co or Ni when there are no applied or demagnetizing fields, such as in domain walls for NMR experiments or in thin films magnetized in the plane of the films for Miissbauer effect measurements.
Enhancement factor E
An applied rf field causes the electron moments to oscillate, the much smaller nuclear moments will then follow the motion of the electron moments. The rf fields at the nuclei in the domains thus undergo an enhancement by a factor of E,
.c. = fh,,,IM, , (2)
which is about 200 for Fe and 150 for Co and Ni [6OP 11. The rf fields at nuclei in domain walls undergo further enhancement depending on the position of the nuclei in the wall. The finite angles between electron spins in the domain walls cause the magnetic moments of wall nuclei to be turned through larger angles than the moments of domain nuclei. Furthermore the walls have been shown to be pinned around their periphery and to oscillate in a drumhead-like fashion [67 S 11. Due to the angle between electron spins being greatest at the center of the wall, the enhancement E is greatest at the wall center, E,,, and in Fe decreases as:
E(X) = E,, sechx (3)
to the domain value at the edges of the wall, where x is in units of the wall width. The enhancement at the wall center is a factor of 30...100 over that in the domains [67 S 11. The wall enhancement factors are dependent on the purity and heat treatment ofthe material since these affect the domain wall areas [71 S 33. The drumhead wall motion model [67 S 1] has been extended to include a finite excitation bandwidth and a finite spectral distribution of resonance frequencies [79 B 21. Because of the larger enhancement in the walls spin-echo measurements on Fe, Co, and Ni usually measure domain wall nuclei.
Isomer shift
The valence state of the atoms can be obtained from the isomer shifts, i.e. the shifts in the position of the center of the Miissbauer pattern which are dependent on the charge density at the nucleus [67I 1, 74V 1).
Stearns

Ref. p. 1341 1.1.2.8 Fe, Co, Ni: hyperfine fields, isomer shifts, relaxation time 59
Relaxation times 7” and T,
The nuclear longitudinal (spin-lattice), T,, and transverse (spin-spin), T,, relaxation times are measured with the spin-echo technique. There are a number of relaxation mechanisms present in the transition metals. They are the contact interaction with s electrons [5OK 11, dipolar and orbital interaction with non-s electrons [63 0 11, core polarization [64 Y 11; spin-spin interaction via virtual magnons [SS S 1,58 N 1,59 S l] and spin interaction with domain walls [61 W l] and bulk magnons [69 S 23. Care must be taken in measuring relaxation times so that the rffield applied is small enough so that it does not move the wall to a different part of the sample, and thus to different nuclei, during the course of the measurement. Because of the variation of enhancement factor with position in the domain walls the nuclear spins undergo a complex rotation distribution. It is also been shown that the domain walls vibrate like drumheads [71 S 31. Thus the shapes of the relaxation curves differ widely from exponential behavior and are strongly dependent on the product of the rf field B, and the pulse length r which determine the turning angle, 8=ysB,z, of the nuclear spins, y being the gyromagnetic ratio of the nuclei.
It has been shown that for Fe the relaxation rates vary with positions in the walls as:
1 1 -=- W4 T,LOZ
sech’x (4)
and are thus largest at the center of the walls [69 S 21. To, and To2 are the longitudinal and transverse relaxation times at the center of the wall and x is measured in units of the wall thickness.
It is clear from Fig. 13a that meaningful longitudinal relaxation times can not be obtained by assuming an exponential decay but that the details of the excitation and motion of the spins must be considered. Also the relaxation rates have been found to be somewhat dependent on the purity and heat treatment of the sample. Due to these complications in the domain walls the literature unfortunately contains a wide variety of ill-defined relaxation times for Fe, Co, and Ni with few details of the operating conditions or analysis procedures used in obtaining the relaxation times. Many of these results are thus of questionable value as can be seen from the wide range of measured relaxation times listed in Table 5. The behavior of the spins in the domains is much simpler and the results for such spins should be more reliable.
The transverse relaxation time is obtained by measuring the echo height of a pair of pulses separated by a variable time.
In cases where the relaxation times are comparable to the nuclear lifetime the Mossbauer effect can also give information about the relaxation times.
Fe, Ni
For Fe and Ni the spin-echo technique has a resolution which is about a factor of 10 greater than that of the Mijssbauer effect technique.
The temperature dependence of the hyperfine field is found to be slightly different from that of the magnetization [61 B 21. A proportionality factor A(T) has been defined by
v(T) =4Wf,(T) > (5)
where v(T) is the measured hyperfine field resonance frequency and M,(T) is the spontaneous magnetization.
co
Many complex effects are seen in Co spin-echo experiments which do not occur for Fe and Ni. These are due to a number ofproperties of Co such as the large nuclear moment and the 100% isotopic abundance of sgCo which allows nuclear spin-spin (Suhl-Nakamura) interactions to be important in contrast with dilute isotopic materials, the large anisotropy fields in the hcp phase and the two possible phases of Co at low temperatures. The anisotropy field in hcp Co causes the hyperfine fields of the domain wall nuclei to vary with position in the wall. This results in the NMR spectrum of hcp Co being very broad. Other unusual effects seen in Co are single pulse echoes [72 S l] and enhancement of a modulation field on the spin-echo envelope [77 S 11.
Due to all these complexities the hyperfine field values quoted in the literature for Co are often not well defined.
Landolt-Bbmstein New Series III/I%
Stearns

60 1.1.2.8 Fe, Co, Ni: hyperfine fields, isomer shifts, relaxation time [Ref. p. 134
Table la. NMR frequencies and magnetic hyperfinc fields of Fe, Co, and Ni.
Metal Nucleus T KHz
Hhsn Ref. position K kOe
Fe, bee 4.2 46.64 -339(l) ‘) - 339.0(3)
RT 45.43 -330 - 330.4(3)
Co, hcp wall center 4.2 228 - 225.7 ‘) RT 220.5 -218
wall edge 4.2 219.9 -217.7 RT x214.5 2 -212
co, fee 4.2 217.2 3, -215 3, RT 213.1 -211
Ni 4.2 28.46 - 75(l) RT 26.04 - 69(l)
61 B2 71 Vl 61Bl 71Vl 72Kl 72Kl 72K1 72Kl 6OPl 6OPl 63Sl 63Sl
‘) An upper limit for the anisotropy for a single crystal is 1OOOe [SO0 11. ‘1 H hjp.IIc-Hhyp.lc= +8W)kOe [72K 11.
‘) Extrapolated from high-temperature values.
Table 1 b. Temperature dependence of the NMR frequency for 57Fe in iron [61 B I].
T T K LHz K KHz
77 46.52 607 41.45 193 46.09 683 39.73 297 45.43 693 39.39 351 44.99 701 39.32 397 44.55 719 38.68 438 44.09 730 38.39 490 43.42 756 37.72 543 42.58 785 36.79
Table 2. Measured, by a technique which combines Miissbauer and internal conversion electron spectroscopy [74 S 2, 84 B 11, and calculated individual ns shell contributions to the hyperfine magnetic field of Fe metal in [kOe]. Fe band structure calculations are quoted for both the exchange correlation potential of von Barth-Hedin (vBH) and a Kohn-Sham (KS) local-exchange potential.
Shell Contribution to Hhrp [kOe]
Calculated Measured
[68 w l] [75 D 1) vBH [77C l] KS [77C 13 [74S2] 1s - 14 - 21 - 67 2s -739 -623 -388 -451 - 1640(390) 3s + 243 4s + 33 +210 +517(240)
total -409 -347 -213 -343 ‘1
‘) The measured total field is - 339 kOe which includes about 25 kOe of orbital field. So the sum of the contributions from the ns electrons is about -365 kOe. Clearly there is a large unresolved discrepancy between the calculated and measured 2s values.
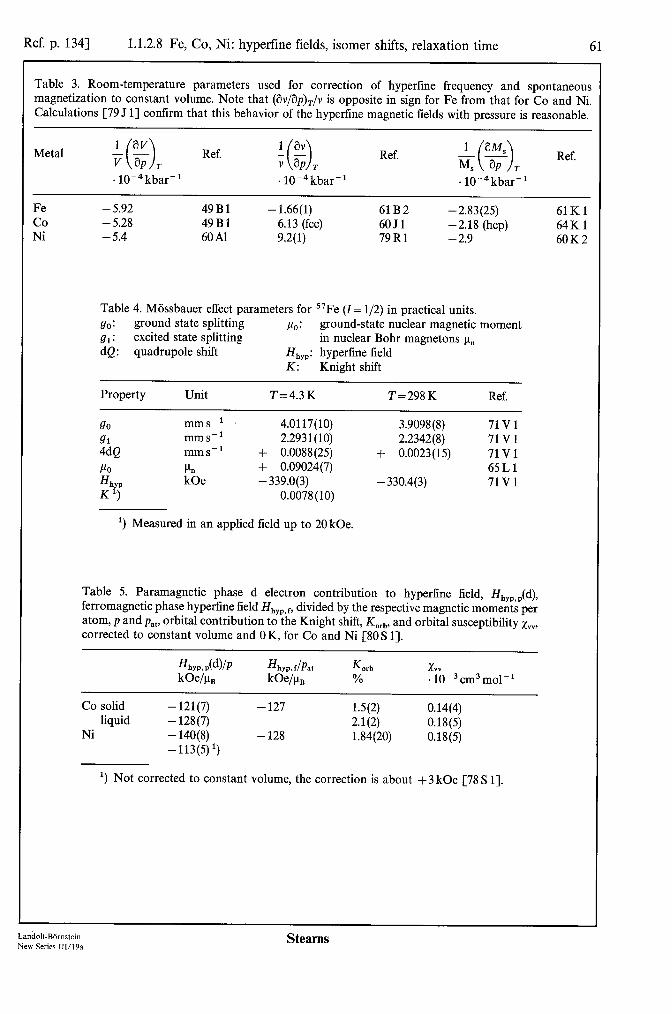
Ref. p. 1341 1.1.2.8 Fe, Co, Ni: hyperfine fields, isomer shifts, relaxation time 61
Table 3. Room-temperature parameters used for correction of hyperfine frequency and spontaneous magnetization to constant volume. Note that (i%/ap),/ v is opposite in sign for Fe from that for Co and Ni. Calculations [79 J l] confirm that this behavior of the hyperfine magnetic fields with pressure is reasonable.
1 av Metal - -
( > Ref.
i av v aP T -(->
1 aM
v aP T
Ref. ( 9 MS aP T
Ref.
. 10Y4 kbar- 1 . 10m4 kbar-l . 10m4 kbar-’
Fe - 5.92 49Bl -1.66(l) 61B2 -2.83(25) 61Kl co - 5.28 49Bl 6.13 (fee) 6051 -2.18 (hcp) 64Kl Ni - 5.4 60 Al 9.2(l) 79Rl -2.9 60K2
Table 4. Mijssbauer effect parameters for 57Fe (I= l/2) in practical units. 90: ground state splitting PO: ground-state nuclear magnetic moment 91: excited state splitting in nuclear Bohr magnetons u,, dQ: quadrupole shift H hyp: hyperfme field
K: Knight shift
Property Unit T=4.3 K T=298K Ref.
90 mms-’ 4.0117(10) 3.9098(g) 71Vl
CiQ mms-’ 2.2931(10) 2.2342(g) 71Vl mms-’ + 0.0088(25) + 0.0023(15) 71Vl
PO + 0.09024(7) 65Ll H hyp he -339.0(3) -330.4(3) 71Vl K’) 0.0078(10)
‘) Measured in an applied field up to 20 kOe.
Table 5. Paramagnetic phase d electron contribution to hyperfine field, H,,,,,(d), ferromagnetic phase hypertine field Hhyp,R divided by the respective magnetic moments per atom, p and pa,, orbital contribution to the Knight shift, Korb, and orbital susceptibility xv”, corrected to constant volume and OK, for Co and Ni [SOS 11.
Co solid liquid
Ni
Hhyp, ,(d)/P h&Pat Korb XV” kOehB B % .10-3cm3mol-1
-121(7) - 127 1.5(2) 0.14(4) - 128(7) 2.1(2) 0.18(5) - 140(8) -128 1.84(20) -113(5)‘)
0.18(5)
‘) Not corrected to constant volume, the correction is about +3 kOe [78 S 11.
Landolt-Bornstein New Series 111/19a
Stearns
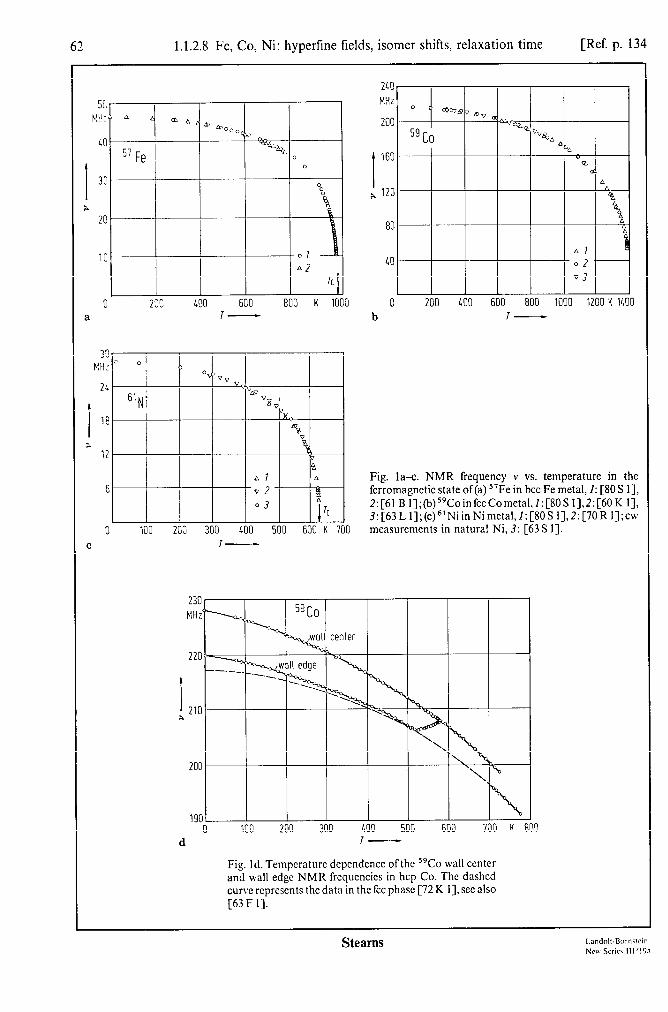
1.1.2.8 Fe, Co, Ni: hyperfine fields, isomer shifts, relaxation time [Ref. p. 134
200 100 600 800 K 1000 T-
30 w:
24
I 18
a 12
6
C
0 100 200 300 LOO 500 600 K 7 I-
230 MHz
d
24c MHz
2oc
I
16C
* 12c
0 200 400 600 800 1000 1200 K 1L' b T-
Fig. lax:. NMR frequency Y vs. temperature in the ferromagnetic state of(a) “Fe in bee Fe metal, I: [SOS I], 2:[61Bl];(b)5gCoinfccCometal,1:[80S1],2:[60Kl], 3:[63LI];(c)61NiinNimetal,l:[80S1],2:[70Rl];cw mcasurcmcnts in natural Ni, 3: [63 S 11.
100 200 300 LOO 500 600 700 K
Fig. Id. Temperature dependence ofthe “Co wall center and wall edge NMR frcquencics in hcp Co. The dashed curve rcprcscnts the data in the fee phase [72 K I], set also [63 F 11.
Stearns

Ref. p. 1341 1.1.2.8 Fe, Co, Ni: hyperfine fields, isomer shifts, relaxation time 63
t 1.0
;; J, 0.9
s
Gy 0.8 0 II
: 0.7 -2
0.6
0.96
I ;; 0.92 11
" -3 =; 0.88
0.80 0 0.2 0.4 0.6 0.8
r/r, -
Fig. 2. (a) The solid curve is the measured reduced spontaneous magnetization as a function of reduced temperature for Fe (see Fig. 2a in subsect. 1.1.2.4). The circles are the measured reduced hyperfine field tie- quencies vs. reduced temperature as measured by Budnick et al. [61 B I]. Both of these measurements are made at constant pressure. (b). Reduced proportionality constant A/A( T = 0) as defined in eq. (5) vs. reduced temperature; the solid line is for the hyperfine field and magnetization data corrected to constant volume [61 B2]; circles are for the uncorrected constant-pressure data shown in (a). The decrease in A/A(T=O) is about 5% lower, than MJA4,(T=O) at T/!&x0.8. It is not surprising that the magnetization and hyperfine field temperature depen- dences are not identical since they are sensitive to and depending on the detailed electronic band structure and their variation with temperature is expected to differ in a number of ways [71 S 2,72 B 23.
I 0 0.2 0.4 0.6 0.8 1.0
r/r, -
Fig. 3. Reduced hyperfine field frequency v and magneti- zation as a function of reduced temperature as derived from NMR measurements for Ni. (a) at constant pres- sure, I: [80 S 1],2: [63 S 1],3: [26 W 1],4: [69 K l], and (b) corrected to constant volume. The difference between the reduced magnetization and hyperfine field decreases from a maximum of about 6% to about 3% after correcting to constant volume [80 S 11.
Land&-Bdmsfein New Series 111/19a
Stearns
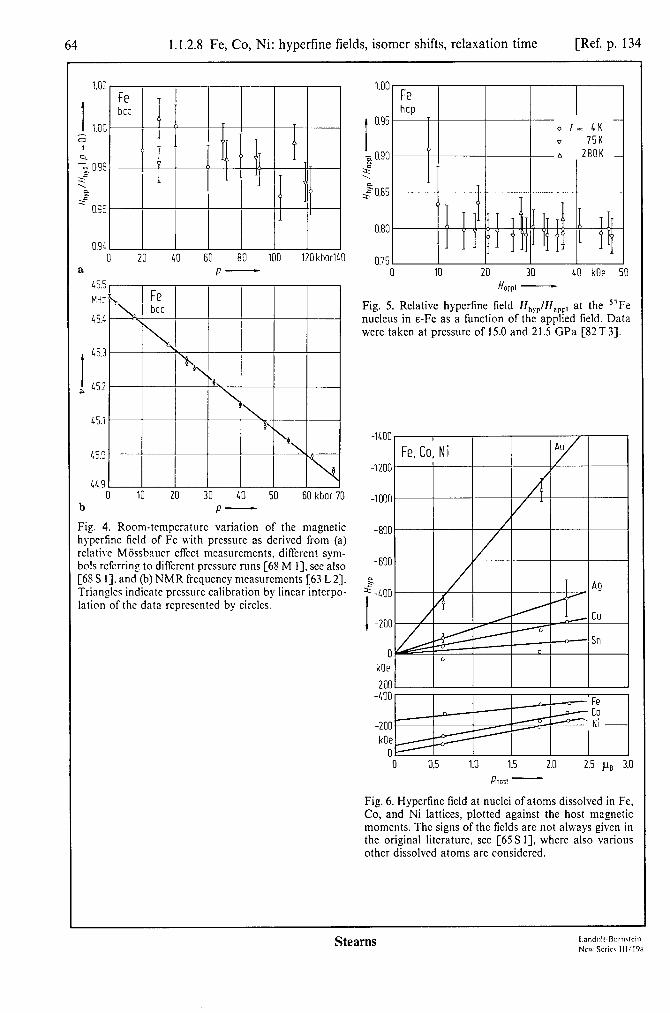
64 1.1.2.8 Fe, Co, Ni: hypcrfine fields, isomer shifts, relaxation time [Ref. p. 134
0 20 40 60 80 100 120kbar140 a P- O 10 20 30 40 kOe 50
45.5 H owl - Kc Fig. 5. Relative hypertine field Hhgp/Ha.pp, at the “Fe
nucleus in E-Fe as a function of the applied field. Data were taken at pressure of 15.0 and 21.5 GPa [82T 33.
45.1
-1400
45.0 -1200
44.9 0 10 20 30 40 50 60 kbor70
b -1000
P-
Fig. 4. Room-temperature variation of the magnetic -800 hypcrfinc ficld of Fe with pressure as dcrivcd from (a) relative M&batter effect mcasurcmcnts. diffcrcnt sym- bols referring to different pressure runs [68 M I], see also -600 [6S S I]. and (b) NMR frequency measurements [63 L 21. Triangles indicate pressure calibration by linear interpo-
z s-400
lation of the data represented by circles.
I -200
0 kOe
200
-200 kOe
0 0 0.5 1.0 1.5 2.0 2.5 pB 3.0
Fig. 6. Hypcrtine field at nuclei of atoms dissolved in Fe, Co, and Ni lattices, plotted against the host magnetic moments. The signs of the fields are not always given in the original literature see [65S 11, where also various other dissolved atoms are considered.
Stearns Landolr-Rornmin NW Scricr 111/19a

Ref. p. 1341 1.1.2.8 Fe, Co, Ni: hyperfine fields, isomer shifts, relaxation time 65
Fig. 7. Si atoms act as near perfect magnetic holes in the Fe lattice so that it was possible to obtain the change in the hyperfine fields of Fe atoms caused by the alloying of Si. Fe,Si contains atoms with three widely seperated hyper- fine fields: Fe(D) with 8 nearest neighbor (nn) Fe(A) atoms; Fe(A) with 4 nn Fe(D) and 4 nn Si Si atoms; and the Si atoms themselves. This allows a determination of hyperfine field contributions due to at least the first six neighbor shells of an Fe atom. The NMR frequency variations as a fnnction of Si content for Fe-Si ordered alloys for the first six neighbor shells are indicated by ANnn, N= 1..~6. The shifts indicated by the vertical arrows labeled ANnn are the hyperfine field contributions due to an Fe atom in the Nth shell. The notation is: &, where m is the number ofFe@) atoms in the Inn shell and n the number of Fe atoms in the 4nn shell to a Fe(A) atom, all the other shells out to the 8nn contain Fe atoms; D,, where m is the number ofFe atoms in the 2nn shell, all the other shells out to the 5nn contain Fe atoms; Si:, where m is the number of Fe(D) atoms in the 3nn shell and n is the number of Fe atoms in the 6nn shell, all the other atoms out to the 9nn shell are Fe atoms. Since the hyperfine field of Fe is negative (points in the opposite direction) with respect to the magnetization, an increase in the frequency due to a neighboring Fe atom corresponds to a negative polarization of the s conduction electrons [71 S 11. The results of these measurements have led to the conclusion that conduction electron polarization of the s electrons can not be responsible for the exchange interaction between the Fe atoms. Polarization by a sufficiently small number of itinerant d electrons, leading to d conduction electron polarization can lead to a positive exchange interaction. Similar reasonings hold for Co and Ni [71 S 2, 66S1,74S1,76Sl].
l- 50 MHz
46
42
I e 38
34
30
26
Fe-Si o3 = 02
- 4 Do Pr
I I I I
17 19 21 23 25 at%
-2.5
7.5 0 0.5 1.0 1.5 2.0 2.5 3.0
Fig. 8. Frequency shift (Av)~ caused by adding an Fe atom into the Nth shell over the number present in Fe,Si vs. shell radius r. A positive shift corresponds to a more negative Hhyp. This can be attributed to a negative s conduction electron polarization contribution caused by the added Fe atom. This polarization is directly propor- tional to the measured shift. Where error bars are not shown the error is less than the size of the symbols [71S 11.
SI -
Landok-Bbmstein New Series 111/19a
Stearns
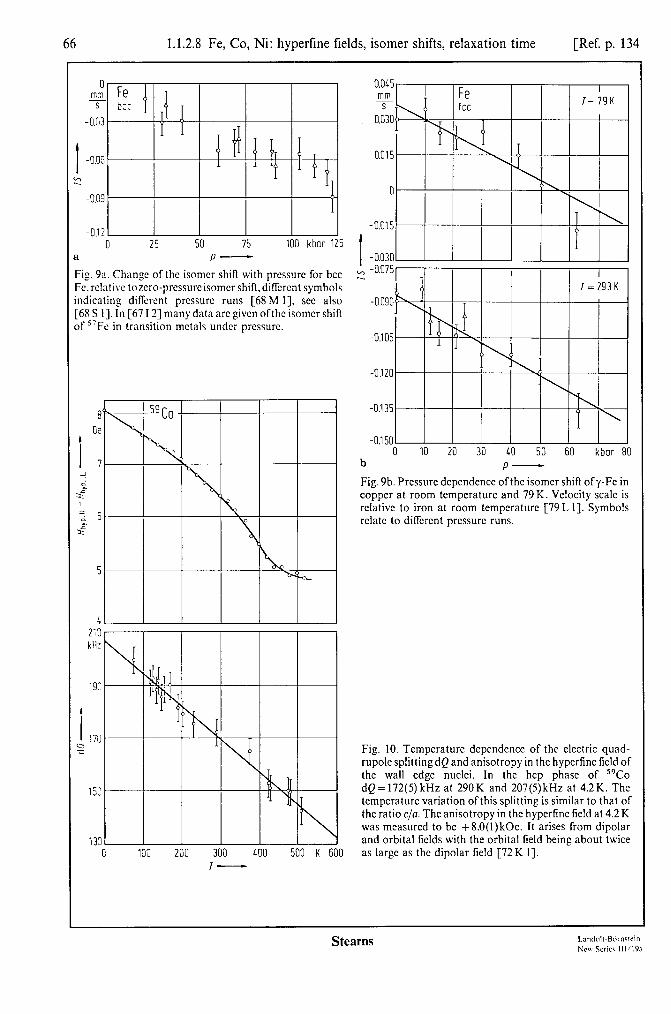
66 1.1.2.8 Fe, Co, Ni: hyperfine fields, isomer shifts, relaxation time [Ref. p. 134
0 mm 5
-0.03
-0.12 0 25 50 75 100 kbar 1
1 P-
?ig. 9a. Change of the isomer shin with pressure for bee %.rclativc tozcro-pressurcisomcr shift.diffcrcnt symbols ndicating dilfcrent pressure runs [68 M I], xc also 168 S I]. In [67 121 many data arc given ofthc isomer shift If 5’F~ in transition metals under prcssurc.
210 kHz
193
I 170 Q n
153
13s \
0 100 200 300 400 500 K 600 I-
0.045 mm
0,;30
0.015
0
t 1
-0.015
I -0.030 $ -0.075
-0.090
-0.105
-0.120
-0135
-01 sn 0 IO 20 30 40 50 60 kbor 80
b P- Fig. 9b. Prcssurc dcpcndencc ofthc isomer shill ofy-Fe in copper at room temperature and 79 K. Velocity scale is rclativc to iron at room temperature [79 L I]. Symbols rclatc to diffcrcnt prcssurc runs.
Fig. IO. Temperature dependence of the electric quad- rupole splitting dQ and anisotropy in the hyperfine field of the wall edge nuclei. In the hcp phase of 59Co dQ=172(5) kHz at 290K and 207(5)kHz at 4.2K. The temperature variation of this splitting is similar to that of the ratio c/a. The anisotropy in the hyperfinc field at 4.2 K was measured to be +8.0(l)kOe. It arises from dipolar and orbital fields with the orbital field being about twice as large as the dipolar field [72 K I].
Stearns

Ref. p. 1341 1.1.2.8 Fe, Co, Ni: hyperfine fields, isomer shifts, relaxation time 67
Fig. 11. High-held Knight shift of 5gCo in ferromagnetic single-crystal hcp Co at 4.2 K. Circles and squares refer to different spherical samples. Curve 1: observed NMR frequency v vs. applied magnetic field, v= ve -yeffHappJ2n. Curve 2: difference between the resonance frequency expected for yerf=y5’ and the observed NMR frequency vs. applied field. ysg/2n = l.O054(20)kHz/Oe. Note that for H .,,,<4nM/3 the sphere is no longer technically saturated and v, even within domains, will not follow the broken part of curve I, but will remain essentially constant. The experimental high-field Knight shift of hcp Co at 4.2 K is:
K=(y,,,-y59)/y59=0.0194(25),
leading to a spin susceptibility for the d electrons of xd =65(25). 10-6cm3/mol and an orbital contribution of xVV = 0.202(25). lo- 3 cm3/mol [76 F 11. By comparing the large value of xd with a calculated value [721 l] it was concluded that hcp Co has spin-up d electrons at the Fermi level.
1250 , kHz 59co
1 t 1000 hcp ' I I I
6
$ 750 ?
2 500 w + ; 250
0 230 MHz
220
I 200
:, 190
180
160
150 0 IO 20 30 LO 50 60 kOe 70
H WI -
600 800 1000 1200 1400 IS00 1800 K 2000 T-
Fig. 12. Knight shift K vs. temperature in paramagnetic Ni and Co. Open symbols: solid state; closed symbols: liquid state. Ni: 1: [SOS 1],2: [78 S 11, Co: 3: [SOS 1],4: [74E 11.
Land&B6mstein New Series 111/19a
Stearns
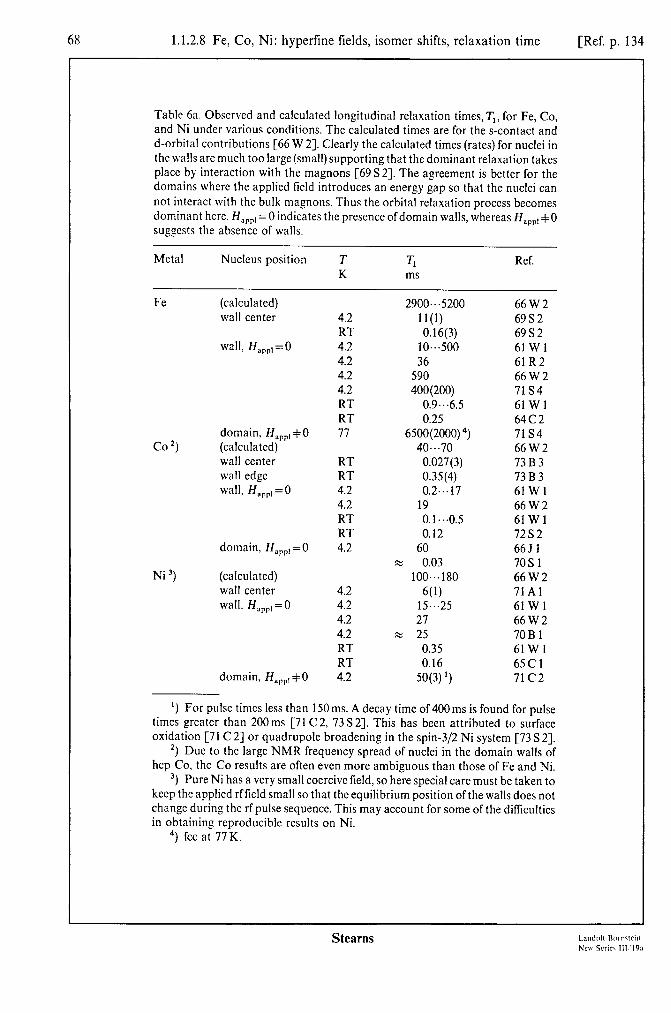
65 1.1.2.8 Fe, Co, Ni: hyperfme fields, isomer shifts, relaxation time [Ref. p. 134
Table 6a. Observed and calculated longitudinal relaxation times, T,, for Fe, Co, and Ni under various conditions. The calculated times are for the s-contact and d-orbital contributions [66 W 21. Clearly the calculated times (rates) for nuclei in the walls are much too large (small) supporting that the dominant relaxation takes place by interaction with the magnons [69 S 23. The agreement is better for the domains where the applied field introduces an energy gap so that the nuclei can not interact with the bulk magnons. Thus the orbital relaxation process becomes dominant here. H,,,, =0 indicates the presence of domain walls, whereas H,,,,, + 0 suggests the absence of walls.
Metal Nucleus position T T K ms
Ref.
Fe (calculated) wall center
wall. Happ, = 0
co 2) domain. Hnpp, $0 (calculated) wall center wall edge wall, Hnpp, =0
domain, H,,,, =0
Ni 3, (calculated) wall center wall. H,,,, = 0
domain, H,,,, + 0
4.2 RT 4.2 4.2 4.2 4.2 RT RT 17
RT RT 4.2 4.2 RT RT 4.2
4.2 4.2 4.2 4.2 RT RT 4.2
2900...5200 II(l) 0.16(3)
IO...500 36
590 400(200)
0.9...6.5 0.25
6500(2000) “) 40...70 0.027(3) 0.35(4) 0.2...17
19 0.1...0.5 0.12
60 M 0.03
100~~~180 6(l)
15...25 27
x 25 0.35 0.16
50(3) ‘1
66W2 69 S 2 69 S 2 61 W I 61R2 66W2 71s4 61 Wl 64C2 71 s4 66W2 73B3 73B3 61Wl 66W2 61 Wl 7282 6651 7OSl 66W2 71Al 61 Wl 66W2 70Bl 61 Wl 65Cl 71C2
‘) For pulse times less than 150 ms. A decay time of 400 ms is found for pulse times greater than 200ms [7l C2, 73S23. This has been attributed to surface oxidation [7l C 21 or quadrupole broadening in the spin-3/2 Ni system [73 S 21.
2, Due to the large NMR frequency spread of nuclei in the domain walls of hcp Co, the Co results are often even more ambiguous than those of Fe and Ni.
3, Pure Ni has a very small coercive field, so here special care must be taken to keep the applied rfficld small so that the equilibrium position ofthe walls does not change during the rf pulse sequence. This may account for some of the difficulties in obtaining reproducible results on Ni.
4, fee at 77K.
Stearns

Ref. p. 1341 1.1.2.8 Fe, Co, Ni: hyperfine fields, isomer shifts, relaxation time 69
Table 6b. Measured transverse relaxation times T, for Fe, Co, and Ni under various conditions. Harp, =0 indicates the presence of domain walls.
Metal Nucleus position T T, Ref. K ms
Fe
co
Ni
wall center
wall, Harp, = 0
wall, Harp1 = 0
wall center wall, Harp, = 0
4.2 1w 6932 RT 0.14(3) 6932 4.2 lo*.*500 61Wl 4.2 90 61R2 RT 0.9...6.6 61Wl 4.2 0.088 61Wl 4.2 0.006 72S2 RT 0.025 61Wl RT 0.006 72S2 4.2 1.0(2) 71Al 4.2 8 61Wl RT 0.35 61Wl
Table 7. Measured relaxation times Toi, To, and enhancement factors e0 at the center of domain walls for various Fe samples [69 S 21.
Sample purity, form
Natural s ‘Fe 99.999%, 1. ..lO urn
Natural 57Fe 99%, 3...5pm 90.7%, “Fe
Natural 5 ‘Fe, 1 at% Co
T, 1 Cmsl L Cmsl co
T=4.2K T=295K T=4.2K T=4.2K T=295K
11(l) 0.16(3) 11(l) 6100(300) 25 OOO(2000) *) *)
10(l) 0.14(3) w 2000 5 500
60(5) % 170(20) 2Z(2)
*) The temperature dependence for the 99.999% natural Fe sample were found to be (ToIT)-’ =22(2) s-l K-l and (T,,T)-’ =28(3) s-l K- ‘. This is evidence that the main mode ofrelaxation is via emission or absorption of single bulk magnons [69 S 21 rather than by wall excitations which would be temperature- independent [61 W 2, 64 J 11.
Table 8. Enhancement factors E of Ni as measured by continuous wave (cw) and pulsed NMR experiments. Using the drumhead model it has been estimated that, for resonable distributions of domain wall areas in Fe and Ni, the maximum enhancement factor is about five times the average enhancement factor [70 W 11.
rf system Sample T & Ref. purity, form K
cw cw cw cw pulsed pulsed pulsed
99.999%, 10 pm 99,99%, < 60 urn 99.95%, 5 mm 99.998% rod 99.995%, 40 pm pure powder single crystal, rod
RT RT RT RT RT 1.3...77 RT
av. 7000 63S2 av. 1600 65Cl av. 33 500(4000) 70R2 av. 32000 70R2 max. 4500 69K2 max. 4000(500) 71Al av. 43000 72Hl
Land&Biirnstein New Series 111/19a
Stearns
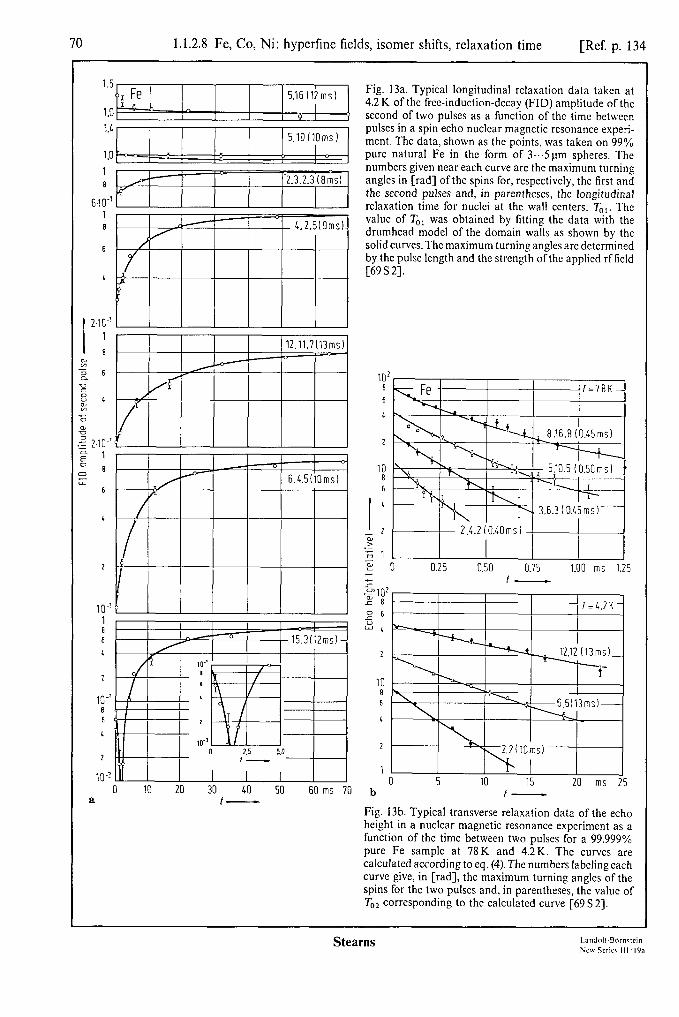
1.1.2.8 Fe, Co, Ni: hyperfine fields, isomer shifts, relaxation time [Ref. p. 134
1.5
'3 !" ~
I 5.16 (12ms)
1.0 I I 0 I
1.4 5.10~10ms)
1.0 4 , : Y
1 a f I 2.3.2.3 (Ems)
6?0-' 1 8
6
b
t 2x-'
I 1
8
0 10 20 30 40 50 60 ms 70 a t-
Fig. 13a. Typical longitudinal relaxation data taken at 4.2 K of the free-induction-decay (FID) amplitude of the second of two pulses as a Lmction of the time between pulses in a spin echo nuclear magnetic resonance experi- ment. The data, shown as the points, was taken on 99% pure natural Fe in the form of 3...S~lrn spheres. The numbers given near each curve are the maximum turning angles in [rad] of the spins for, respectively, the first and the second pulses and, in parentheses, the longitudinal relaxation time for nuclei at the wall centers, TO,. The value of TO, was obtained by fitting the data with the drumhead model of the domain walls as shown by the solid curves. The maximum turning angles are determined by the pulse length and the strength of the applied rf field [69S2].
- 0.25 0.50 0.75 1.00 ms 1.25
I I I ! 7-I 7K
IO 8 6
2
I I I , 1 , I I 0 5 10 15 20 ms 25
b I-
Fig. 13b. Typical transverse relaxation data of the echo height in a nuclear magnetic resonance experiment as a function of the time between two pulses for a 99.999% pure Fe sample at 78 K and 4.2K. The curves are calculated according to eq. (4). The numbers labeling each curve give, in [rad], the maximum turning angles of the spins for the two pulses and, in parentheses, the value of TO2 corresponding to the calculated curve [69 S 23.
Stearns

Ref. p. 1341 1.1.2.8 Fe, Co, Ni: hyperfine fields, isomer shifts, relaxation time 71
60 s-1 K-1
55
50
~ lo3 10-3 10-l
c a
450 600 750 900 K 1050 7-
Fig. 14a. (Tr 7) - ’ and (T, T) - ’ vs. temperature for Fe. The curves are guides to the eye intended to emphasize the difference between bulk samples and powder samples. The inset gives for bulk samples a plot of TZ- ’ vs. E = 1 - T/T, on a log-log scale, T,= 1034.2 K. The peak in the (T,T)-’ bulk data near 600 K is not understood [SOS 11.
.- s-1 2
t ‘i3
1 4
2
,‘ 2
If
6 4
2
IO IO-' 2 4681 2 46BlD 2 4 K 10’
c 7-
Fig. 13~. Variation of the transverse relaxation rate for Fe nuclei at the center of the wall as a function of temperature. The solid line corresponds to (TT,,) -’ =28(3)s-‘K-’ [69S2].
b 7- I 1600 K 2000
Fig. 14b. (TIT)-’ and T,T)-’ vs. temperature for Co: (Tl T) - ’ is represented for liquid (solid circles) and solid (open circles) phases; triangles represent (T2T’-l in the solid state [80 S 11.
For Fig. 14c, see next page.
Landolt-Biirnstein New Series 111/19a
Stearns
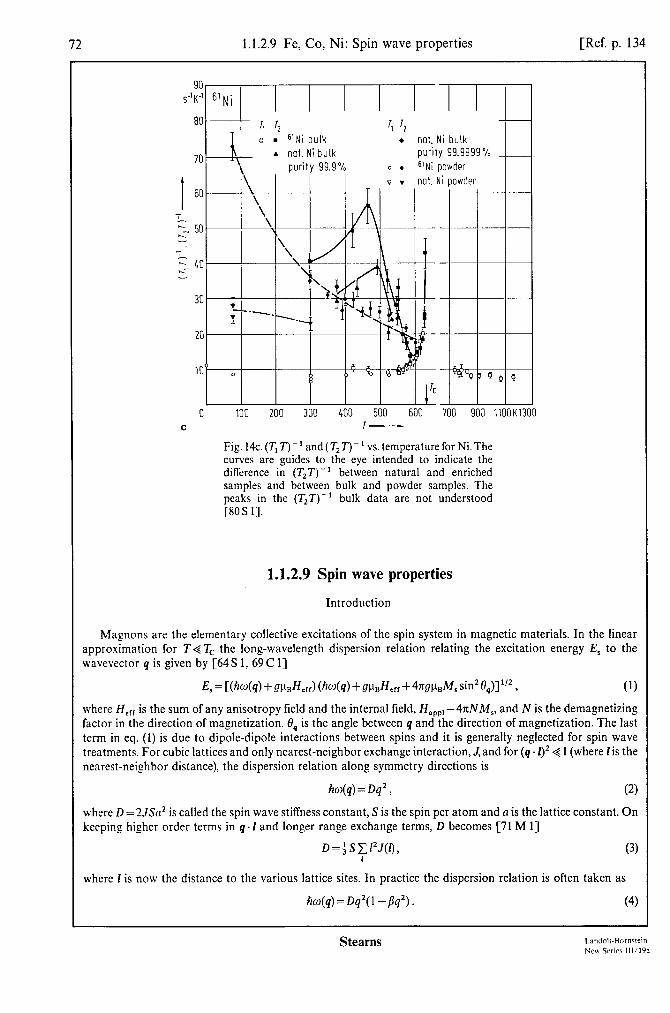
12 1.1.2.9 Fe, Co, Ni: Spin wave properties [Ref. p. 134
0 100 200 300 400 500 600 700 900 llOOK1300 c I-
Fig. 14c.(T,T)-’ and(T,T)-’ vs. temperature for Ni.The curves are guides to the eye intended to indicate the difference in (T,T)- ’ between natural and enriched samples and between bulk and powder samples. The peaks in the (T,T)-’ bulk data are not understood [8OS I].
1.1.2.9 Spin wave properties
Introduction
Magnons are the elementary collective excitations of the spin system in magnetic materials. In the linear approximation for T<T, the long-wavelength dispersion relation relating the excitation energy E, to the wavevector q is given by [64 S 1, 69 C l]
E, = C(Mri) + waKfJ (fi4q) + a.kJ,,, + 4wk&f, sin2 RJI ‘j2 , (1) where If,,, is the sum of any anisotropy field and the internal field, Hnppl -47tNM,, and N is the demagnetizing factor in the direction of magnetization. e4 is the angle between q and the direction of magnetization. The last term in eq. (1) is due to dipole-dipole interactions between spins and it is generally neglected for spin wave treatments. For cubic lattices and only nearest-neighbor exchange interaction, J,and for (q. I)2 < 1 (where lis the nearest-neighbor distance), the dispersion relation along symmetry directions is
Wq) = Dq2, (2)
where D = 2JSn2 is called the spin wave stiffness constant, S is the spin per atom and a is the lattice constant. On keeping higher order terms in q. I and longer range exchange terms, D becomes [71 M l]
D=fLsC12J(r), (3) I
where I is now the distance to the various lattice sites. In practice the dispersion relation is often taken as
hco(q) = Dq2( 1 - Pq’) . (4)
Stearns

Ref. p. 1341 1.1.2.9 Fe, Co, Ni: Spin wave properties 13
Due to spin wave excitations at finite temperatures the temperature dependence of the magnetization is given by [66K 1, 56D 1,71 M l]
where
M,(T) =M,(O) [l -u~,J~‘~ -u,,~T~‘~ - . ..] , (5)
u3,2 =2.612gpa[ks/4xlFJ”‘2/M,(0) =2.612 gpBVo[k,/4.rcD]3’“/j7a,, (6)
where V, is the volume per atom, k, the Boltzmann constant, and fia,t the average magnetic moment per atom. Including the two-magnon interactions (dynamical interactions) D becomes temperature-dependent as given
by
(7)
where D is given by eq. (3) and p = S C 14.J(I) [I I/
30. This temperature dependence is the same for the itinerant
model as for the Heisenberg or localized model of ferromagnetism. The quantity in brackets in eq. (7) is called the renormalization factor. The dynamical interaction also introduces a T4 term in eq. (5) for the magnetization.
The interaction of the spin waves with the electrons which have been excited out of their zero-temperature ground state gives rise to a T2 term [641 l] so that
D(T)=D,-D,T2-D2T5’2. (8)
At high enough CJ values or excitation energies it becomes possible to excite single particle spin flip excitations (often referred to as Stoner excitations) so the dispersion curve merges into the singe1 particle excitation band.
Paramagnetic region
In the paramagnetic region for small momentum transfers in the critical region, the neutron scattering function S(Q, E) for an isotropic magnet can be written as [84 S 1, 84 W 21
%Qt El = 2kBTdq)F(q, El 1 _ ex;r$k B T) 3 (9)
where q is the reduced wavevector associated with the momentum transfer Q and E is the energy transfer. x(q) is the wavevector-dependent susceptibility. At small q, x(q) can be taken of the form
(10)
where x is the inverse correlation range of the spin fluctuations and x(O) denotes the static susceptibility. The spectral weight function F(q, E) at small E 4 k,T, where spin diffusion theory is valid, is a Lorentzian centered at zero energy,
F(q, E) = w Nt-%d12 + E2) ’
where W = &Wdq 5/2 A is a constant and f(x/q) is the Resibois-Piette function [70 R 31. A modified form of F(q, E) for higher tempe;atures and larger q values was proposed to fit the data [84 W 21
where r=Aq6 and
F(q, E) N {T/(r2 + E2)}@‘, (12)
E(E) = 1 for IElrr 1 +a[(IEI -r)/r] for IEl zr
with 6 and a suitably chosen.
Landolt-Bbmstein New Series fWl9a
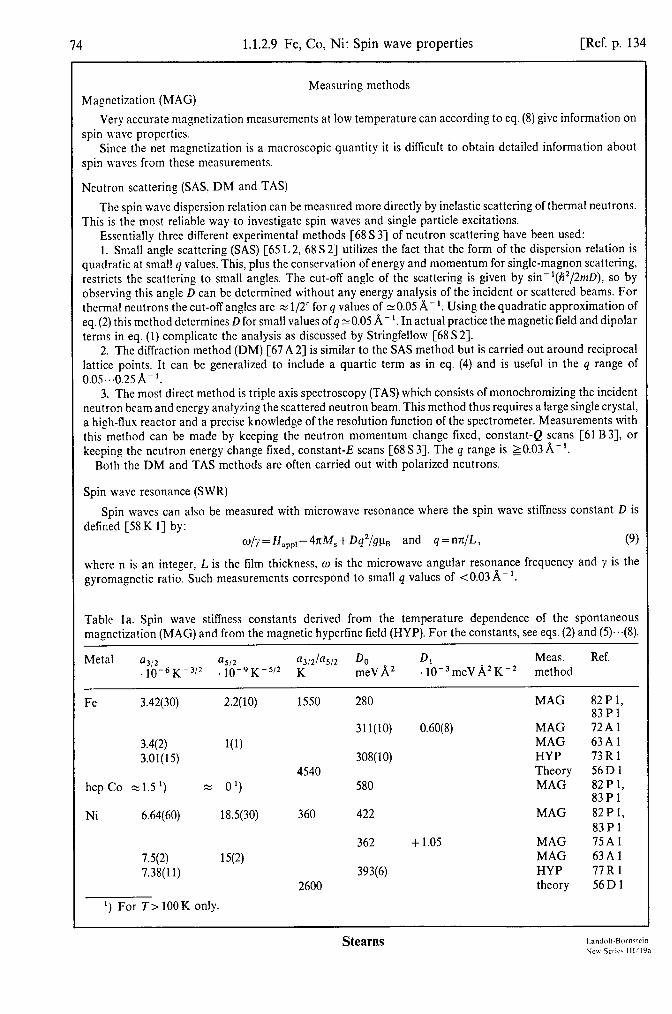
74 1.1.2.9 Fe, Co, Ni: Spin wave properties [Ref. p. 134
Magnetization (MAG) Measuring methods
Very accurate magnetization measurements at low temperature can according to eq. (8) give information on spin wave properties.
Since the net magnetization is a macroscopic quantity it is difficult to obtain detailed information about spin waves from these measurements.
Neutron scattering (SAS, DM and TAS)
The spin wave dispersion relation can be measured more directly by inelastic scattering of thermal neutrons. This is the most reliable way to investigate spin waves and single particle excitations.
Essentially three different experimental methods [68 S 31 of neutron scattering have been used: 1. Small angle scattering (SAS) [65 L 2, 68 S 21 utilizes the fact that the form of the dispersion relation is
quadratic at small q values. This, plus the conservation of energy and momentum for single-magnon scattering, restricts the scattering to small angles. The cut-off angle of the scattering is given by sin-‘(ti2/2mD), so by observing this angle D can be determined without any energy analysis of the incident or scattered beams. For thermal neutrons the cut-off angles are x l/2” for q values of ~0.05 8,-l. Using the quadratic approximation of eq. (2) this method determines D for small values of q ~0.05 A- ‘. In actual practice the magnetic field and dipolar terms in eq. (1) complicate the analysis as discussed by Stringfellow [68 S 21.
2. The diffraction method (DM) [67 A 23 is similar to the SAS method but is carried out around reciprocal lattice points. It can be generalized to include a quartic term as in eq. (4) and is useful in the q range of 0.05...0.25/?-‘.
3. The most direct method is triple axis spectroscopy (TAS) which consists of monochromizing the incident neutron beam and energy analyzing the scattered neutron beam. This method thus requires a large single crystal, a high-flux reactor and a precise knowledge of the resolution function of the spectrometer. Measurements with this method can be made by keeping the neutron momentum change fixed, constant-Q scans [61 B3], or keeping the neutron energy change fixed, constant-E scans [68 S 33. The q range is 20.03 ?I-‘.
Both the DM and TAS methods are often carried out with polarized neutrons.
Spin wave resonance (SWR)
Spin waves can also be measured with microwave resonance where the spin wave stiffness constant D is defined [5SK l] by:
o/y=H,,,,-4xM,+Dq2/gp, and q=nn/L, (9)
where n is an integer, I, is the film thickness, o is the microwave angular resonance frequency and y is the gyromagnetic ratio. Such measurements correspond to small q values of <0.03&l.
Table la. Spin wave stiffness constants derived from the temperature dependence of the spontaneous magnetization (MAG) and from the magnetic hyperfine field (HYP). For the constants, see eqs. (2) and (5)...(8).
Metal 123j2 a32 a3,2/a5,2 Do Dl Meas. Ref. .10-6~-3’2 . lO-gK-5/2 K meVA2 . 10e3meVA2Km2 method
Fe 3.42(30) 2.2(10) 1550 280 MAG 82P1, 83Pl
31 l(10) 0.60(8) MAG 72A1 3.4(2) l(l) MAG 63 A 1 3.01(15) 308(10) HYP 73Rl
4540 Theory 56Dl hcp Co z 1.5 ‘) zz 0’) 580 MAG 82P1,
83Pl Ni 6.64(60) 18.5(30) 360 422 MAG 82P1,
83Pl 362 + 1.05 MAG 75Al
7.5(2) 15(2) MAG 63Al 7.38( 11) 393(6) HYP 77Rl
2600 theory 56Dl
‘) For T> IOOK only.
Stearns
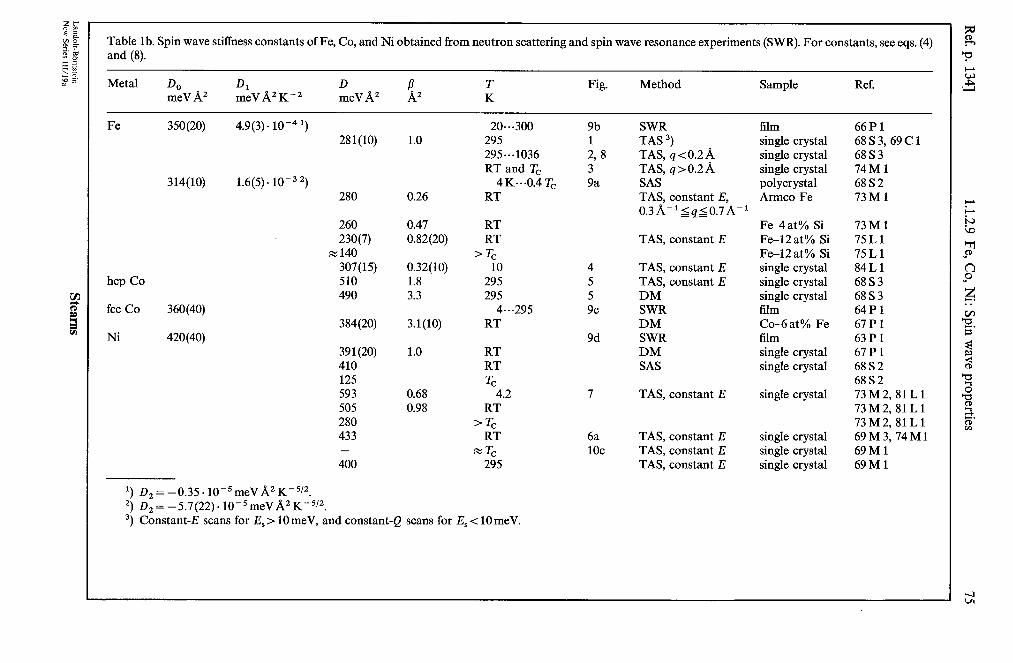
Table lb. Spin wave stiffness constants of Fe, Co, and Ni obtained from neutron scattering and spin wave resonance experiments (SWR). For constants, see eqs. (4) and (8).
Metal D, meV A2
Dl meVA2 Kw2
D meV A2
T K
Fig. Method Sample Ref.
Fe
hcp Co
fee co
Ni
350(20) 4.9(3). 10-4 ‘) 281(10)
314(10) 1.6(5). 1O-3 2, 280
260 230(7)
w 140 307(15) 510 490
360(40) 384(20)
420 (40) 391(20) 410 125 593 505 280 433 - 400
1.0
0.26
0.47 0.82(20)
0.32(10) 1.8 3.3
3.1(10)
1.0
0.68 0.98
2O.e.300 295 295...1036 RT and Tc
4K...0.4 T, RT
RT RT
’ T, 10
295 295
4.e.295 RT
RT RT T,
4.2 RT
’ T, RT
z T, 295
9b 1 2, 8 3 9a
4 5 5 9c
9d
7
6a 1oc
‘) D2=-0.35~10-5meVA2K-5/2. “) D,= -5.7(22). 10-5meVA2K-5’2. 3, Constant-E scans for Es> iOmeV, and constant-Q scans for Es< 10meV.
SWR film TAS “) single crystal TAS, q<O.2/% single crystal TAS, q>O.2/% single crystal SAS polycrystal TAS, constant E, Armco Fe o.3A-‘~q~o.7A-1
TAS, constant E
TAS, constant E TAS, constant E DM SWR DM SWR DM SAS
Fe4at% Si Fe-12 at% Si Fe-12 at% Si single crystal single crystal single crystal film Co-6at% Fe film single crystal single crystal
TAS, constant E
TAS, constant E TAS, constant E TAS, constant E
single crystal
single crystal single crystal single crystal
66Pl 68S3,69Cl 6883 74Ml 6882 73Ml
73Ml 75Ll 75Ll 84Ll 6883 68S3 64P1 67Pl 63Pl 67Pl 6882 6882 73M2, 81Ll 73M2, 81Ll 73M2,81Ll 69M3, 74Ml 69Ml 69Ml
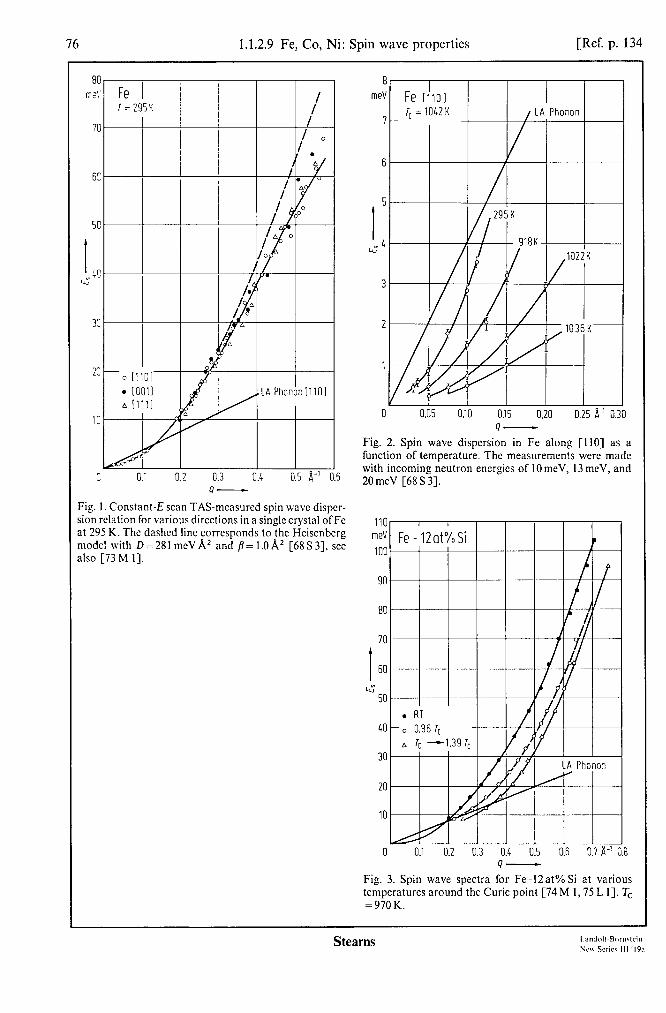
76 1.1.2.9 Fe, Co, Ni: Spin wave properties [Ref. p. 134
U-
Fig. 1. Constant-E scan TAS-measured spin wave dispcr- sion relation for various directions in a single crystal ofFe at 295 K. The dashed line corresponds to the Hciscnbcrg model with D=281 meVA* and /I=l.OA* [68S3], see also [73 M I].
6
5
I G4
3
2
1
0 0.05 0.05 0.10 0.10 015 015 0.20 0.20 0.25 0.25 8;! 8;! 0.30 0.30 U- U-
Fig. 2. Spin wave dispersion in Fe along [I IO] as a function of temperature. The measurements were made with incoming neutron energies of 10 meV, 13 meV, and 20mcV [68S3].
I LA Phonon Y I
Fig. 3. Spin wave spectra for Fe-12at% Si at various tempcraturcs around the Curie point [74 M I, 75 L I]. Tc =970 K.
Stearns
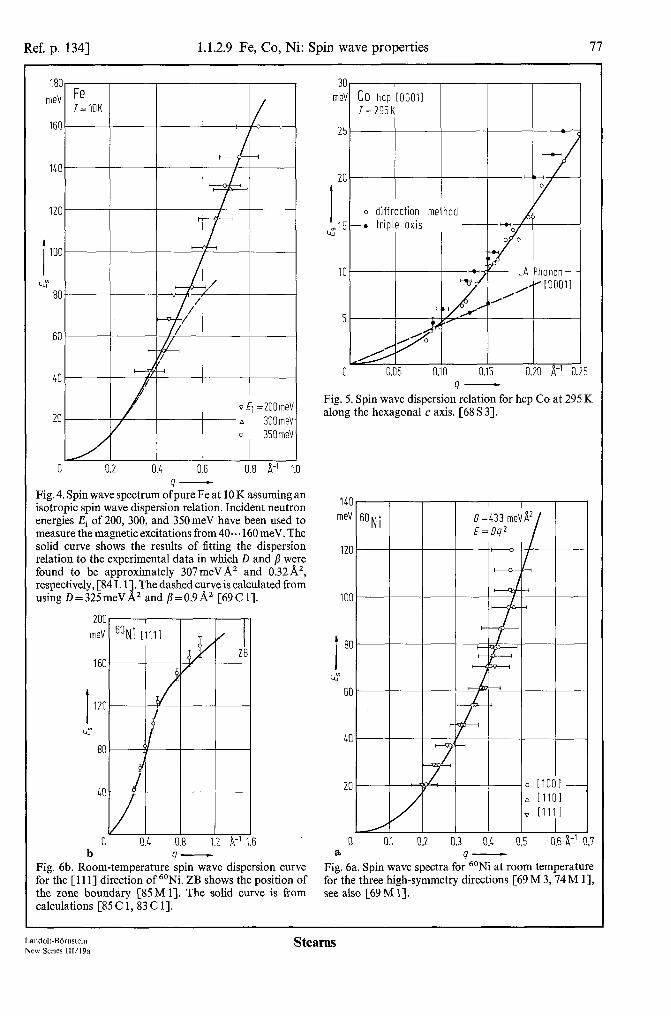
Ref. p. 1341 1.1.2.9 Fe, Co, Ni: Spin wave properties 77
/
0.2
v fi =ZOOmeV a 300 meV- 0 350 meV
0.8 A-’ 1.0 9-
Fig. 4. Spin wave spectrum ofpure Fe at 10 K assuming an isotropic spin wave dispersion relation. Incident neutron energies Ei of 200, 300, and 350meV have been used to measure the magnetic excitations from 40... 160 meV. The solid curve shows the results of fitting the dispersion relation to the experimental data in which D and b were found to be approximately 307meVA’ and 0.32A2, respectively, [84 L 11. The dashed curve is calculated from using D = 325 meV A2 and fi = 0.9 A2 [69 C 11.
200
meV
160
viT!dds 0 . b 9-
Fig. 6b. Room-temperature spin wave dispersion curve for the [ 11 I] direction of 60Ni. ZB shows the position of the zone boundary [85M I]. The solid curve is from calculations [85 C 1, 83 C 11.
meV CO hcp [OOOII T=295K
25 -
IO
5
0 0.05 0.10 0.15 0.20 A-’ 0.25 9-
Fig. 5. Spin wave dispersion relation for hcp Co at 295 K along the hexagonal c axis. [68 S 31.
141: meV
12c
I
“Ni
I
IOC
I
EC
cu” 60
40
20
0 0.1 0.2 I a
t-
‘z d-
3.3 0.4 0.5 0.6 I-’ 9-
Fig. 6a. Spin wave spectra for 6oNi at room temperature for the three high-symmetry directions [69 M 3, 74 M 11, see also [69 M 11.
Land&-Bbmstein New Series lWl9a
Stearns

78 1.1.2.9 Fe, Co, Ni: Spin wave properties [Ref. p. 134
300 m@!
250
0 0.5 1.0 1.5 A-' 2.0 C Q-
Fig. 6c. Room-temperature spin wave dispersion curve for the [IOO] direction in a 60Ni crystal indicating the crossing of the acoustic and optical spin wave branches [S5M I], SW also [79M I]. The solid line is from calculation [SSC 11. While this calculation gives a fair qualitative representation ofthc data. notable departures are observed for the larger q values. ZB: position ofzonc boundary.
40’ me\'1
200 400 600 800 1000 K 1: l-
Fig. 8. Temperature depcndencc ofthc spin wave stiffness constant D for Fe [6S S 33. The broken line corresponds to thin film mensuremcnts by spin wave resonance [66P 11.
60) I I I I rl Y /I / I/ / I
I 0 OS 0.2 0.3 0.4 0.5 0.6 A-: 0.7
9-
Fig. 7. Spin wave dispersion in Ni at various temperatures as derived from constant-E scan TAS [73 M 2. 81 L I].
500 500 meVA2 meVA2
400 400 a al
! I
I I I I
P
P
.
l 200 l
0 0 0.2 0.2 0.4 0.4 0.6 0.6 0.8 0.8 1.0 1.0 ( I/l, 15'2 - t I/l, 15'2 -
I I I I I
0.2 0.4 0.6 0.8 1.0 a l/l, -
Fig. 9a. Tempcraturc dependence of the spin wave stiffness constant D for Fe and Ni vs. (T/Tc)“’ measured by SAS [68 S2]. Note the linear region between 0.4 < T/T,< 0.9 in agreement with eq. (8).
Stearns

Ref. p. 1341 1.1.2.9 Fe, Co, Ni: Spin wave properties 79
b IWJ2-
Fig. 9b. Temperature dependence of the spin wave stitfness constant D for Fe plotted against (T/Q2 for D < T/T, < 0.42. The solid line is eq. (8)with values given in Table lb. The dashed curve is the result from spin wave resonance experiments [66P 11.
5.9 .I@!
erg cm
5.8
0 1 2 3 4 5 40JK"L 6 d T312-
Fig. 9d. Temperature dependence of the spin wave stitiess constant D of Co as derived from spin wave resonance experiments on films at 9.2 GHz [64P 11. lo-” ergcm’~62.41 meVA2.
2m'
Fe /
4
2
10-311 2 L 2 4 K IO3 C T-
Fig. 9c. Temperature dependence of the deviation of the spin wave stiffness constant D of Fe from the low- temperature value D,, as derived from spin wave re- sonance experiments on films at 9.3 GHz [66P 11.
2.10' , I I I I I I ,
PI I III I/l
4 I
2 67 \
ll
IV I I I IO 2 I 6 8 IO2 2 K 4.10'
e T-
Fig. 9e. Temperature dependence of the deviation of the spin wave stiffness constant D of Ni from the low- temperature value D, as derived from spin wave re- sonance experiments on films at 9.2 GHz [63 P 11.
Land&-Bdrnstein New Series 111/19a
Stearns
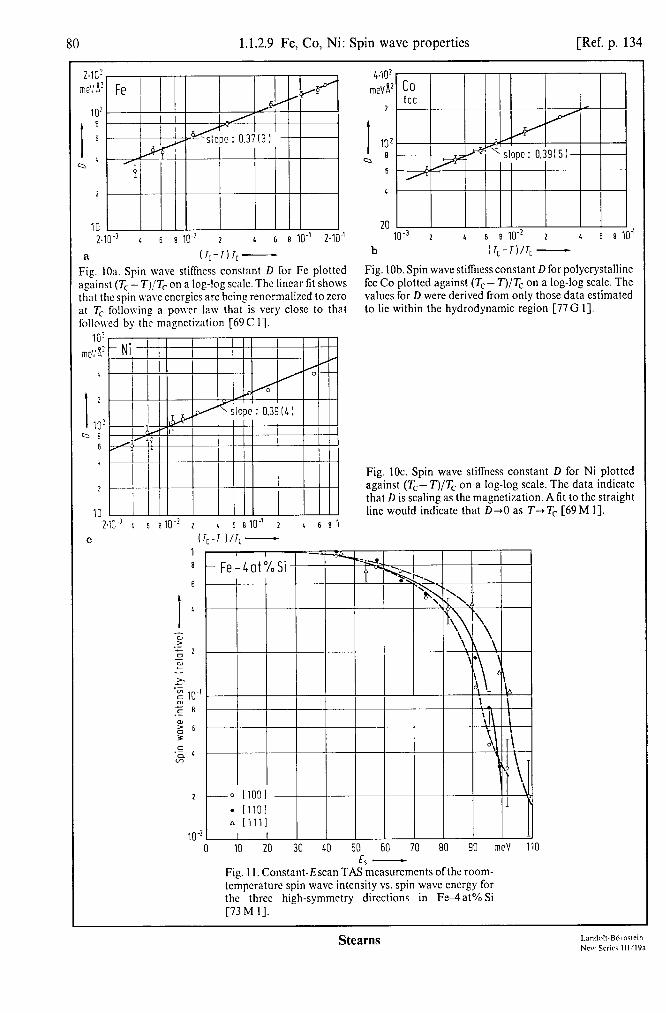
80 1.1.2.9 Fe, Co, Ni: Spin wave properties [Ref. p. 134
102 I I I,"r I I
8 I I I
I
6 m' '
- - slope:
‘ 23
I I
10 I I I I 2.w ‘ 6 8 1P 2 L 6 8 lo- 2.1 0-1
a (I,-r)r,-
10-s 2 4 6 ll 10-2 2 6 6 a lo-'
b tI,-rl/r, -
Fig. IOa. Spin wave stiffness constant D for Fe plotted Fig. lob. Spin wave stiffnessconstant D for polycrystalline against (T,-- 7)/T, on a log-log scale. The linear tit shows kc Co plotted against (T,- T)/T, on a log-log scale. The that the spin wave energies are being renormalizcd to zero values for D were derived from only those data estimated at T, follovcing a power law that is very close to that to lie within the hydrodynamic region [77 G I]. followed by the magnetization [69 C 11.
Fig. 10~. Spin wave stiffness constan --..:--‘ /T ?-\,-I- ^” - I,, I,.. rrnl.3 2 aga,,lsL (lc- 1 ,, IC “11 a rug-rug DLCILG
that D is scaling as the magnetization. 10 line would indicate that D-+0 as T+
2.10-3 i 5 8W 2 1 6 B lo-! 2 ‘ 681 C (1,-T )/I, -
t D for Ni plotted The data indicate
A fit to the straight .Tc [69 M I].
0 10 20 30 40 50 60 70 80 90 meV 110
Fig. 1 I. Constant-Escan TAS measurements ofthe room- tcmpcraturc spin wave intensity vs. spin wave energy for the three high-symmetry directions in Fedat% Si [73 M I].

Ref. p. 1341 1.1.2.9 Fe, Co, Ni: Spin wave properties 81
0 IO 20 30 40 50 60 70 80 90 100 meV 120
Fig. 12. Room-temperature TAS measurements of the spin wave intensity vs. spin wave energy for the three high- symmetry directions in Ni [69 M 31.
2
2-
0 IO 20 IO 20 30 30 40 50 60 40 50 60 70 70 80 meV 90 80 meV 90
Fig. 13. TAS measurements of the integrated intensity of the spin wave scattering as a function of spin wave energy and temperature for the [ 11 l] direction in Ni [S 1 L 11, see also [73 M 21.
Land&-Biirnstein New Series 111/19a
Stearns
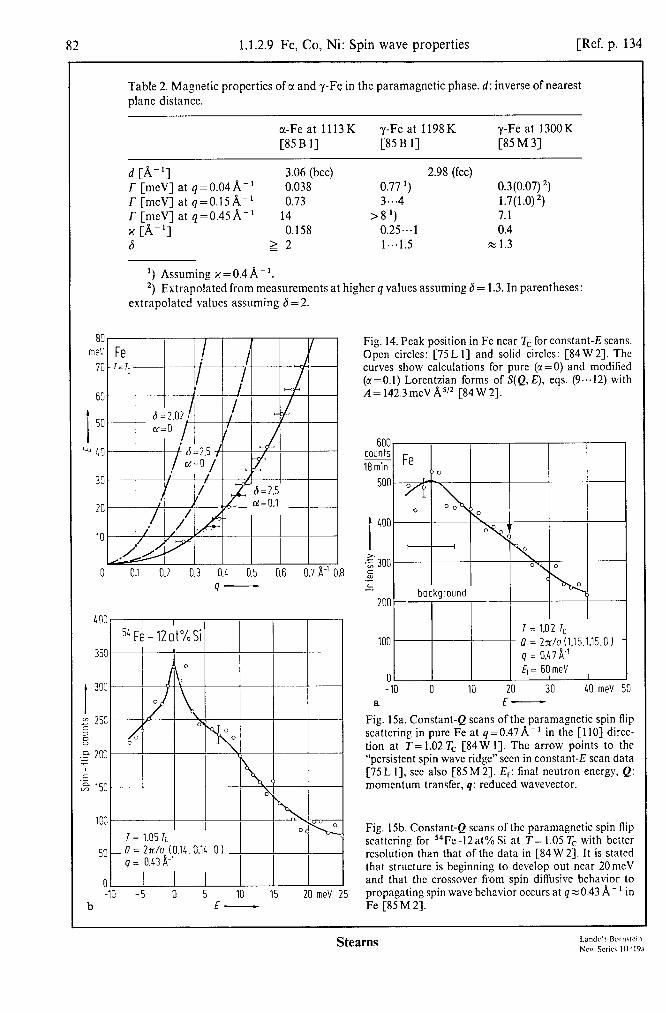
82 1.1.2.9 Fe, Co, Ni Spin wave properties [Ref. p. 134
me!
70
I 303
" 250 c
E .g 2oc
:. '5 153
103
b
Table 2. Magnetic properties of c1 and y-Fe in the paramagnetic phase. d: inverse of nearest plane distance.
cc-Fe at 1113K y-Fe at 1198K y-Fe at 1300 K [85 B l] [85 B l] [85 M 33
d [A-‘] 3.06 (bee) 2.98 (fee) r [mcV] at q=O.O4A-’ 0.038 0.77 ‘) 0.3(0.07) 2) r [meV] at q=O.15&’ 0.73 3...4 1.7(1.0)2) r [mcV] at q=0.45A-’ 14 >8 ‘) 7.1 % [A-‘] 0.158 0.25...1 0.4 6 22 1...1.5 z 1.3
‘) Assuming x=0.4&‘. 2, Extrapolated from mcasuremcnts at higher q values assuming 6= 1.3. In parentheses:
extrapolated values assuming 6 = 2.
I
51Fe-120t%Si I I I
I -5 0 5 10 15 20 meV c
Fig. 14. Peak position in Fe near Tc for constant-E scans. Open circles: [75 L I] and solid circles: [84 W 21. The curves show calculations for pure (x=0) and modified (a(=O.l) Lorentzian forms of S(Q, E), eqs. (9...12) with A= 142.3meVA5/2 [84W2].
-10 0 10 20 30 40 meV 50 a E-
Fig. 15a. Constant-Q scans of the paramagnetic spin flip scattering in pure Fe at q=0.47k1 in the [IIO] direc- tion at T= 1.02 Tc [84W I]. The arrow points to the “pcrsistcnt spin wave ridge” seen in constant-E scan data [75 L 11, see also [85 M 23. E,: final neutron energy, Q: momentum transfer, q: reduced wavevector.
Fig. l5b. Constant-Q scans of the paramagnetic spin flip scattering for 54Fe -12at% Si at T= 1.05 Tc with better resolution than that of the data in [84 W 21. It is stated that structure is beginning to develop out near 20meV and that the crossover from spin diffusive behavior to propagating spin wave behavior occurs at (1~0.43 A-’ in Fe [85 M 23.
Stearns

Ref. p. 1341 1.1.2.9 Fe, Co, Ni: Spin wave properties 83 1
110
100
90 -I, 0 4 8 12 16 20 24 28 32 meV 40
E-
Fig. 16. Constant-Q scans of the paramagnetic spin flip scattering at T= 1.06 Tc in the [ll l] direction of 60Ni for higher q values, showing that the scattering peaks occur at Unite energies rather than at E=O. This behavior of the scattering at the higher q values is interpreted as due to heavily damped propagating spin waves rather than spin diffusion. The solid curves are a least-squares fit to a damped harmonic oscillator form of the spectral weight function. The crossover from spin diffusive to propagating spin wave behavior occurs at q % 0.25 A- 1 [SS M 21. The dashed curve in the q =0.31 A-’ plot is that expected for the resolution used in [83 S 1,84 S 21. Note that the data t?om Fig. 7 would give the peak at x45meV for qzO.4A-‘, as indicated in Fig. 17. E,: Final neutron energy, Q: momentum transfer, q: reduced wavevector.
150 counts 5min
1
120
90
;I
g 60
1 I I 0 0.1 0.2 0.3 0.4 0.5 0.6 8-l
a 9-
600 counts 5min
500
I
400
g 300 al -E - 200
0 -10 0 IO 20 30 40 50 meV 60
b E-
Fig. 17. Demonstrations for ‘joNi at T= L$+ 100 K of (a: the peak in constant-E scans, q in [ 11 l] direction, and (b: the diffusive nature in constant-Q scans for q = 0.40 A-' The solid lines are calculated with a linewidth r = 25 meV, see eq. (1 I), and the appropriate resolution convolution [84 S 21. The arrow indicates where the peak should occur for a propagation spin wave [73 M2 74M 11. There is considerable controversy about the existence ofpropagating spin waves and the nature of thf magnetic excitations seen above Tc in Fe and Ni, E,: fina neutron energy, Q: momentum transfer, q: reducec wavevector.
Landolt-Biirnstein New Series 111/19a
Stearns

84 1.1.2.9 Fe, Co, Ni: Spin wave properties [Ref. p. 134
r . Fe - 5at% Si 7=1273K .
/ .
I L
I .
0 1 3
0 [OOll . Ill01 ,J ill11 .
.
.
f
.
.
f
Fig. IS. Polarized neutron energy-integrated paramagnc- 2 25 tic scattering from Fe5 at% Si at 1273 K along the high- y symmetry directions [82B2]. f(Q): atomic magnetic s form factor. M2(Q) = 12k,7j(q). Q: momentum trans- 20 fer. q: reduced wavevector.
15
10
\ ‘~“‘or~
I 60Ni 11111
\ \ \ \ \ \
\ \
\ \ \, \
2244
‘\ \
\ \
\
15.54 \
-\ \ \
‘\,
\
pi,, = 2.5ap: --&lI,+lOOK
0 1.03 1.06 1.09 1.12 1
Fig. 19. Energy-integrated neutron scattering function for “Ni vs. Q in [ 11 I] direction. M2( Q)= 3k,Tl(q). The q > 0 data was obtained from polarized and unpolarized neu- tron paramagnetic scattering measurements at several temperatures above Tc. The q=O points were obtained from the static susceptibility. The horizontal line gives M2(Q) when there is no correlation between atomic moments, M2( Q) = p& [84 S 21.
Stearns
Ref. p. 1341 1.1.2.10 Fe, Co, Ni: g factors, ferromagnetic resonance 85
1.1.2.10 g factors and ferromagnetic resonance properties
Ferromagnetic resonance (FMR) is described by the equation of motion [55 G 11
dM ~=yMxH,,,+~Mx8’M-~Mx~ dt M,” YW (1)
where A is the exchange stiffness and 1 is a microscopic relaxation parameter. H,, includes applied fields, demagnetizing fields and anisotropy fields. y = -gua/fi denotes the gyromagnetic ratio. Eq. (1) must be solved along with Maxwell’s equations and the exchange boundary conditions am/i% = (K,/A)m, where K, is the surface anisotropy, m represents the dynamic components of the total magnetization, i.e. the deviation from the undisturbed magnetization, and the derivative is taken along the outward normal to the sample surface. There is a significant contribution to the linewidth from the “exchange-conductivity” mechanism, the 2nd term on the r.h.s. of eq. (l), as well as from the ,I term [74B 1, 55 A 1, 59 R 1, 65 H 11.
For a uniaxial system the second term on the r.h.s. of eq. (1) must be replaced by
%A, 2YAII -MxV:M+- M,” M,2
MxV;M.
The analysis of the earlier experimental results did not include the second and third terms on the r.h.s. of eq. (l), so the parameters obtained are not reliable and will not be quoted.
Table 1. Spectroscopic splitting factor g and ferromagnetic resonance damping parameter 1 for Fe, Co, and Ni.
Metal Sample T K ;Hz
9 a Fig. Ref. .1o*s-’
Fe
Co hcp
Ni
whisker RT.. .950 whisker 4...300 crystal ‘) RT whisker 4...700
350 300
crystal RT...650 crystal 4...300
9.6; 23; 31 2.09 1.3 70 0.7 71.52 2.18(l) 60 2.18 1 37 2.18
135 2.18 23; 32 2.21 2.3 22 2.2 2.3
‘) Magnetcrystalline anisotropy constants: K, = 5.22. lo6 erg cmM3 and K, = 0.91. ‘) Rapid increase < 100 K and slow increase from 100...700 K. 3, Rapid increase < 100 K which saturates at z 35 K.
1 72Bl 2 74Bl
64Fl 4? 74Bl
74Bl 74Bl 69Bl
53) 74Bl
lo6 erg cme3.
Land&-BOrnstein New Series III/I%
Stearns

86 1.1.2.10 Fe, Co, Ni: g factors, ferromagnetic resonance [Ref. p. 134
Table 2. Room-temperature values of the linewidth AH of the ferromagnetic resonance lines of Fe and Co whiskers and bulk-grown Ni crystals.
Metal Magnetization direction &Z
AH Oe
Ref.
Fe %[lOO]
hcp Co [OOOl] (disk)
PO11
fee co
Ni [1111
[lOOI, Cl111 (cylinder) (cylindrical crystal)
9.2 32 64F2 36.2 158 64F2 71.5 900 64F2 71.5 950...1200 64Fl 37.0 (350 K) 155 74Bl 60 205 74Bl
135 340 74Bl 9.2 110 64F2
36.2 220 64F2 9.2 460 64F2
36.2 550 64F2 23.3 410 69B1 31.8 x650 69Bl 9 130 74Bl
22 300 74Bl
Table 3. Summary of the measured g’ values from the magnetomechanical factor for Fe, Co, and Ni.
Metal g’ g=d/W- 1) Ref.
Fe
co
Ni
1.938(6) 1.936(8) 1.927(4) 1.929(6) 1.919(6) 1.932(8) 1.917(2) ‘) 1.919(2) 2) 1.928(4) 3, 2.077(10) 1.866(2) 1.859(4) 1.854(8) 1.850(4) 1.838(3) 2.193(9) 1.837(4) 1.831(4) 1.830(6) 1.837(2) 1.835(2)4) 2.198(6)
44Bl 51Ml 51 s 1 52Bl 55Sl 57M 1 6OSl 6OSl 61Ml 44Bl 52Bl 52Sl 56Sl 6682 52Sl 5582 5582 6OSl 62S1
‘) Cylinder. 2, Ellipsoid. 3, Mean value. “) Weighted average value.
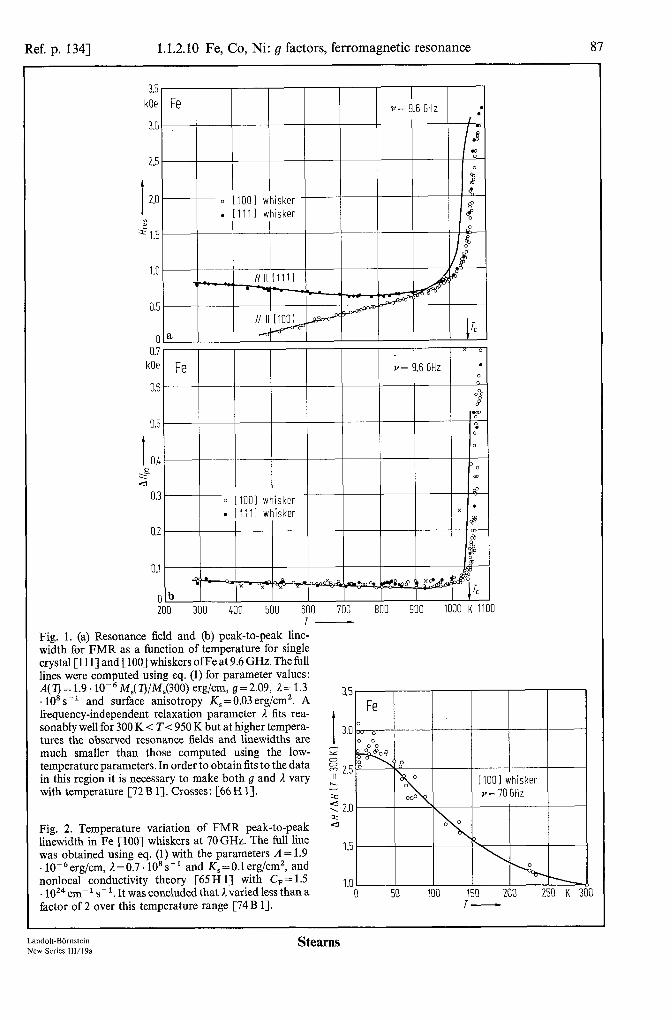
Ref. p. 1341 1.1.2.10 Fe, Co, Ni: g factors, ferromagnetic resonance 87
3.5 , I I I I I I I I I
0.7 kOe
0.6
0 I x 0
Fe v= 9.6GHz l
I
0
0
0%
I
0.5
I 0.4 9 d
0.3
0.2
0.1
C
kOe Fe I
Y= 9.6 GHz l 0 3.0 I
i mJ
2.5 0 0
I 8 3 2.0 o 11001 whisker
E rt 1.5
Fig. 1. (a) Resonance field and (b) peak-to-peak line- width for FMR as a function of temperature for single crystal [ll l] and [loo] whiskers ofFe at 9.6 GHz. The full lines were computed using eq. (1) for parameter values: A(T) = 1.9. 10e6 M,( 7)/)/M,(300) erg/cm, g= 2.09, I= 1.3 . lOas-i and surface anisotropy K, = 0.03 erg/cm’. A frequency-independent relaxation parameter L fits rea- sonably well for 300 K < T< 950 K but at higher tempera- tures the observed resonance fields and linewidths are much smaller than those computed using the low- temperature parameters. In order to obtain fits to the data in this region it is necessary to make both g and 1 vary with temperature [72 B 11. Crosses: [66 H 11.
Fig. 2. Temperature variation of FMR peak-to-peak linewidth in Fe [loo] whiskers at 70 GHz. The full line was obtained using eq. (1) with the parameters A = 1.9 . 10m6erg/cm, 1=0.7. 108s-’ and Z&=0.1 erg/cm’, and nonlocal conductivity theory [65 H l] with C, = 1.5 . 10z4 cm- 1 s- l. It was concluded that I varied less than a factor of 2 over this temperature range [74 B 11.
I 3.0
s z ';; 2.5
” 2 , 2.0 2 d
I.?
IS 50 100 150 200 250 K :
T-
Land&BBmstein New Series IIM9a
Stearns

88 1.1.2.10 Fe, Co, Ni: g factors, ferromagnetic resonance [Ref. p. 134
0 100 200 300 400 500 600 700 800 K ! 300
Fig. 3. Composite data on the observed temperature variations of the ferromagnetic relaxation parameter I, in Fe, Co, and Ni. The data for Fe is from [66H 1, 72 B 1, 74Bl]; for Co from [74Bl] and for Ni from [65Rl, 71 A2,74 B I].
0.8 kOe
0.6
I z 0.4
0.2
0 100 200 300 400 500 600 K 700
Fig. 4. Temperature variation of the peak-to-peak line- width for FMR in [OOOI] whiskers of hcp Co at about 60GHz. The full lint was derived using eq. (1) with the parameters 9=2.18, I.= 1. lo-as-‘, K,=O, A= A, = 2.78. lOma erg/cm has been taken from neutron scatter- ing data, 4rrM,= 17.9 kg, and conductivity theory with parameters Q= 10.6pRcm and C = 1024cm-1 s-l [74B I]. For T> 250K normal coiductivity theory [55A 1, 59 R I] was used. while for Ts250 K nonlocal conductivity theory [65 H I] was used.
26 kOe
2.
Fig. 5. Angular dependence of the external resonance I
magnetic field (V =71.52 GHz) for two thin disks of single f 16
* crystal hcp Co in which (1) the plane is parallel to the [OoOl] axis (points on curve I) and (2) the plane is perpendicular to the [OOOI] axis (points on curve 2). In case 1. ~3 denotes the angle between the easy axis of the
12
crystal and the direction of H; in case 2, w denotes the angle between an arbitrary direction in the sample plane and direction of H. The finI curves are the calculated 8 angular dependences [64F I]. Open and solid circles 0 n refer to different samples.
2 rod
Stearns

Ref. p. 1341 1.1.2.10 Fe, Co, Ni: g factors, ferromagnetic resonance 89
Fig. 6. Measured and calculated (fnll lines) angular dependence of the FMR field at various temperatures of a disc-shaped single crystal of hcp Co at 36.97GHz. The angle v is the angle between the magnetizing field and the [OOOI] axis, both in the disc plane. Tin c”C] : I) 20,2), 250, 3) 275, 4) 300, 5) 325, 6) 350, 7) 375, 8) 400. At all temperatures the value obtained for the g factor was 2.02 which is significantly different from other measured values of 2.18 [73 0 11.
7.0 kOe Ni
kOe
9.5
I 9s
L a?
8.F:
8.0
Fig. 7. Temperature variation of the observed FMR field for a cylindrical single crystal of Ni in (a) the [loo] and [l 1 I] directions at 23.3 GHz and (b) the [IOO] direction at 3 1.8 GHz. The full line was obtained using eq. (1) with g = 2.21. The different symbols stand for results of different heating cycles. The lower-temperature data is good to EZ 10% [69B 11.
Landolt-Bbmstein New Series IWl9a

90 1.1.2.10 Fe, Co, Ni: g factors, ferromagnetic resonance [Ref. p. 134
II I
0.2 b 0 50 100 150 200 250 300 350 "C 400
7-
Fig. 8. Variation ofthe observed FMR peak-to-peak line- width with temperature of a cylindrical single crystal of Ni for (a) the [IOO] and [l I I] directions at 23.3 GHz and (b) the [ 1001 direction at 3 I .8 GHz. The full curve was calculatedwith%=2.3~10ss-‘andg=2.21 [69Bl].The different symbols stand for results of different heating cycles.
1.50 kOe
1.25
0.25
0 I I I I I I
50 100 150 200 250 K 300 T--
Fig. 9. Temperature variation of FMR peak-to-peak lincwidth in single crystal cylinders of Ni at 22 GHz. The symbols represent diffcrcnt samples with resistivity ratios varying between 60...170 [74 B I].

Ref. p. 1343 1.1.2.11 Fe, Co, Ni: Fermi surfaces, band structures, spin polarizations 91
1.1.2.11 Fermi surfaces, band structures, exchange energies and electron spin polarizations
Introduction
In the last decade the band structures of Fe, Co, and Ni have undergone extensive study by a variety of experimental techniques as well as numerous band calculations (see e.g. A.P. Cracknell in Landolt-Bornstein, New Series, Group III, vol. 13c.). One of the problems that arises in comparing the experimental data and the calculations is that the band structure calculations are of the ground state of the system whereas the experiments, of necessity, always perturb the system. This difficulty is well known in studies of atomic energy levels where an emitted electron emerges with less energy than its ground state binding energy because the remaining electrons become more tightly bound due to decreased screening of the nucleus. The usual rationalization of this difficulty in solid state studies is to argue that the Fermi level remains unchanged and the energy levels near it also undergo negligible shifts upon perturbing the system and thus the measurements give a reasonable, accurate picture of the ground state and can be compared to band structure calculations. This type of rationalization obviously depends on the time and energy scales of the measurements. At extremely small times such that the readjustment of the electron cloud has not yet occurred the usual concept of the Fermi level is not applicable. Measurements that occur over long times (> 10-i’ s) and involve small energy excitations such as de Haas-van Alphen measurements perturb the system least and thus most closelv measure the ground state. Although even in these measurements a dependence of the spin-orbit splittings on the applied magnetic field directio;has often been seen.
Measuring methods
a) de Haas-van Alphen (dHvA) measurements
The dHvA oscillations are periodic in the inverse of the magnetic induction B-i with the frequency f given by
(1)
where A is an extremal area of cross section of the Fermi surface in a plane normal to B. Thus the Fermi surface can be obtained by measuring the dHvA frequencies as a function of the applied magnetic field direction.
b) Magnetoresistance
The magnetoresistance is the relative change of the electric resistivity in a high magnetic field defined by:
Aeleo = (e(B) - eo>leo (2)
where Q,, is the resistivity in zero field. It gives information about the presence of open orbits and the connectivity of the Fermi surface when the effect of collisions on the motion of the carriers is negligible compared to the effect of the magnetic field [64 F 21. This requires pure single crystal samples and low temperatures in high fields such that w,z < 1, where o,( = eB/m*c) is the cyclotron frequency, z is the average collision time and m* is the effective mass of the electrons or holes. The variations of the magnetoresistance with magnetic field can be related to the orbits of the carriers on the Fermi surface. The power dependence of the magnetoresistance on the field,
Aeleo = bB: (3)
gives further information about the Fermi surfaces. If the magnetoresistance is large and n = 2 (unsaturated), the metal is compensated (has an equal number of electrons and holes) and open orbits are indicated by sharp minima in the magnetoresistance. If the magnetoresistance is low and saturation occurs (n < 1) for most field directions, the metal is uncompensated and open orbits are indicated by sharp maxima in the magnetoresistance. For data on magnetoresistance, see subsect. 1.1.2.13.
c) Photoemission
Photoemission experiments do not measure the initial ground state energies but the difference in energy between the initial ground state and the final ionized state. A classic discussion of the interpretation of measured energy levels was given by Parratt [59 P 11. Due to the emission of an electron there is decreased shielding of the nucleus in the final excited state. This causes the valence electron states to be more tightly bound so that, except for the electrons at the Fermi level which are pinned, the electrons are emitted with less energy than they would
Land&Bbmstein New Series 111/19a
Stearns

92 1.1.2.11 Fe, Co, Ni: Fermi surfaces, band structures, spin polarizations [Ref. p. 134
have if they came from the unperturbed ground state energy. The measured energy levels thus are shifted up relative to the initial ground state energies. This effect may be small for some valence states and increases with distance from the Fermi level. set Fig. 1.
Fig. 1. Schematic shifts in the measured energy levels due to perturbing the energy levels by the photocmission process. Heavy lines depict the unperturbed ground state
Wovevector - ground state. t: majority spin, 1: minority spin
Table 1. Measured dHvA frequencies A Fermi wavevectors k,, number of itinerant d electrons per atom assuming free electron behavior, n(d,), polarization and the paramagnetic Fermi wavevector kt!’ for the sphere- like Fermi surfaces of Fe [73 B 11. Spin up: majority spin, spin down: minority spin.
Property Spin Crystal plane
(100) (111) (110)
I CMGI ‘) up 436 370 down 71 52
kf l3+71 up 0.51 0.495 down 0.24 0.18
II up 0.28 0.25 down 0.030 0.012
Polarization [%] 80 90 k;” [271/o] 0.42 0.40
349 58 0.43 0.19 0.17 0.014
85 0.35
r) Accuracy + 1%.
Table 2. Measured room-temperature values A, and calculated values A, [77C l] of the exchange splitting for Fe.
4 eV
AC eV
Symmetry point
Crystal surface
Ref.
1.5(2) 1.3 P, 2.08(10) 1.8 I-;, 2 1-’ 25
(111) 80El (110) 82Tl (100) 83Fl
Table 3. Measured exchange splitting A, for Fe at high temperatures (T,= 1043 K).
T 4 K eV
Symmetry point
MJM,(T=O) A,/Am(RT) Ref.
973 1.2 P4 0.60 0.80 80El 983 1.8 T;,(T2,) 0.56 0.90 81H2 886 1.7 l- 25 0.73 0.85 83H2, 83Rl

Ref. p. 1341 1.1.2.11 Fe, Co, Ni: Fermi surfaces, band structures, spin polarizations 93
Table 4. Slope (df/dp)/f of the change in the dHvA frequency with pressure of single crystal Ni. 7: majority spin, -1: minority spin. The subscripts of the field direction symbols refer to the f vs. p plots in Fig. 19.
Part of Fermi surface:
Field direction:
Spin-up neck t
c1111, Cl q3
Spin-down ellipsoid 4 Ref.
[llllb c1m WOI,
f$[lO-‘kbar] 8.0(12) 6.6(25) 6.6(25) lS(8) -0.8(8) 77Vl 6(l) 1.2(3) 75A2
Table 5. Measured room-temperature exchange splitting A,,, and band gaps 6, for Ni as obtained from angle-resolved photoemission spectroscopy. Spin-resolved photo- emission experiments on (110) surface of Ni gave the same splittings [83 R 11, The region of k-space X,(S,) is comprised of considerable hybridization between d and sp states, thus leading to a smaller exchange splitting. t: majority spin.
Symmetry Crystal A, point surface eV
4n eV
Ref.
u34) ‘) (110) 0.17 80H2 X&34) (110) 0.17 81H1,81H2 US4) (110) 0.18(2) 83Rl r-m,) (110) 0.33 81H2 near L3(Ax) (111) 0.31(3) o.l5’0,:;5(L,t) 79Hl near L&J (111) 0.30 82Ml near L [ii21 (111) 0.33(2) 80Gl near L [l lo] (100) 0.26(5) 80E2 l/2 (W-X) (100) 0.28(5) o.lO-‘;::s(X,t) 80E2
‘) The measured band splittings are consistently smaller than those given by tirst- principle one-electron band calculations using the local-density approximation which yield values in the range of 0.4.. .0.6 eV [77 W 11. The measured d band widths are also narrower than those obtained from these calculated band structures. How much these discrepancies are due to inadequacies in the local-density approximation or how much is due to the excited-state effects inherent in photoemission experiments is not known and very difficult to determine.
Table 6. Measured excited-states exchange energies per spin,Jg,and calculated ground state exchange energies .Jp for the same regions of k-space as the quoted measured values for Fe, Co, and Ni. KS: Kohn-Sham potential, vBH: von Barth-Hedin potential. J in [eV].
Fe (r,‘J Ref. co m Ref. Ni 04 Ref.
JE ‘) 1.00(5) 0.8(2) 0.63(5) Jdd c 0.85 (vBH) 77Cl 0.92 (vBH) 77Wl
1.1 (KS) 77Cl 0.88 (KS) 75Bl 1.27 (KS) 77Wl
‘) Obtained from the measured exchange splitting A, divided by the total spin, Jid = A Jp,, in un.
Landok-Bbmstein New Series llVl9a
Stearns

94 1.1.2.11 Fe, Co, Ni: Fermi surfaces, band structures, spin polarizations [Ref. p. 134
Table 7. Spin polarizations, in [%I, of Fe, Co, and Ni as derived from various experiments. Ato: photon energy, @: work function.
Method Fe co Ni ?%i-@ eV
Ref.
Photo- emission
‘) *I Tunneling
between poly- crystalline film and supercon- ductor
34(l) 17(2) 3(2) 2 73Al 5(3) 5 76El g(3) 16 79Bl
26.6 17.5 5.6 > 10 30 20 6 <lO 0.44(2) 0.34(4) 0.11 73Tl 0.45 3) - 0.103) 7782
‘) Calculated for the case that all the valence band electrons are excited, i.e. Pspinlti3d + w &in in PB.
2, Calculated for the case that mainly d-bandelectrons arc excited, i.e.p,,,,/n,,,p,,,,in un. 3, Calculated.
4 t
Fig. 2. First Brillouin zone of the bee lattice.
Stearns Land&Bornstein New Scrie5 111/19a

Ref. p. 1341 1.1.2.11 Fe, Co, Ni: Fermi surfaces, band structures, spin polarizations 95
_-- a Field direction
.
.
IOOI)
I I
0" 15" 30" 45" 60" 75" 90 5" 30" 15" [OOII Ill11 [I101 [OIOI
c Field direction
440 MG
400
360
200
I 160 *-
70
60
0 0" 15" 30"
b [IO01 Field direction
Fig. 3. Graph (a) shows the variation of the intermediate and high dHvA frequency in Fe for B in the (ii0) plane. Dots: [73 B I], solid line: [71 G 2, 74 G 11. Graph (b) shows more detailed variation of the dHvA frequencies for field directions in the (001) plane [80 L 1,84 L 21. Graph (c) is the variation of the E dHvA frequency branches in Fe for B in the (001) and (IiO) planes. Solid circles: field-sweep data. open circles: beat measurements. Sample rotation data for B equal to (open triangles upwards) 33.56 kG, (open triangles downward) 36.11 kG, (solid triangles upward) 46.28 kG and (solid triangles downward) 61.26 kG. [71 G 21. For Fermi surface and extremal orbits, see Fig. 4.7 : majority spin, 1: minority spin.
Landolt-BOrnstein New Series lll/l9a
Stearns
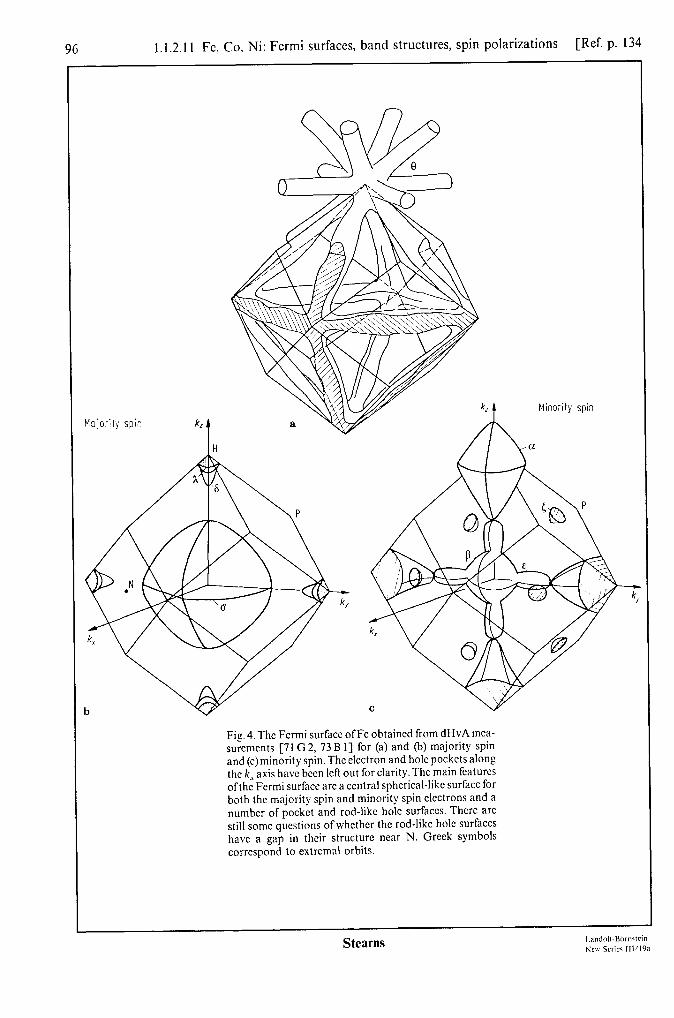
1.1.2.1 1 Fc, Co, Ni: Fermi surfaces, band structures, spin polarizations [Ref. p. 134
Fig. 4. The Fermi surface ofFc obtained from dHvA mea- surcmcnts [71 G 2, 73 B l] for (a) and (II) majority spin and (c)minority spin. The electron and hole pockets along the k, axis have been left out for clarity. The main features ofthc Fermi surface arc a central spherical-like surface for both the majority spin and minority spin clcctrons and a number of pocket and rod-like hole surfaces. There are still some questions of whether the rod-like hole surfaces have a gap in their structure near N. Greek symbols correspond to extrcmal orbits.
Stearns

Ref. p. 1341 1.1.2.11 Fe, Co, Ni: Fermi surfaces, band structures, spin polarizations
2 E-V
t
0
-2 G L -4
-6
-8
-4
-6
-8 F
Fig. 5. The calculated band structure of Fe. The Greek symbols at the Fermi level correspond to the frequencies found in dHvA measurements as shown in Fig. 3, see e.g. [66 W 3, 71 D 1, 71 M 1, 75 S 1, 77 C 1, 78 M 11. Near the center of the Brillouin zone r) the lowest band is due to sp-like electrons and the upper five bands are the d-bands: at r the lower three have Tag symmetry while the upper two have E, symmetry. Upon moving away from the I- point in k-space the symmetry character of the electrons becomes mixed thus the reference to E, and T,, in these regions is used merely to label the states and is not to be taken literally.
As can be already seen the E, bands are quite flat over large regions of k-space indicating that these states have high effective mass and quasi-local character. These are the d states that are responsible for a large part of the Fe moment (= 2 ut,). One of the T,, bands (indicated by the heavier line) is seen to have a high degree of curvature corresponding to a low effective mass comparable to that of free electrons, di.
From both the dHvA measurements and the band calculations it is found that there are about 0.25 spin-up and 0.02 spin-down di electrons in these bands. These d-like electrons are highly mobile and it has been suggested that they are responsbile for the ferromagnetic alignment of the quasi-local moment [63 S I,73 S 11.
For the minority spins s-d hybridization occurs in the H direction near the region where the T,, bands cross the Fermi level. This causes the electron lens and hole pockets that allow open orbits in the H direction [71 G 21. In all other directions the itinerant d bands have little or no sp character at E,. Another feature is that both the E, states responsible for the major part of the moment of Fe are far from and do not cross the Fermi level. Thus they are not affected by alloying Fe with other elements and this accounts for the simple magnetic behavior of Fe alloys, such as simple dilution, etc.
Landolt-Bornstein New Series 111/19a

98 1.1.2.11 Fe, Co, Ni: Fermi surfaces, band structures, spin polarizations [Ref. p. 134
1
eV
6 10 18 eV 26
- I‘ A IJ t H A
Fig. 6. Dispersion curves, E(k), measured by ultraviolet photoemission spectroscopy (UPS) for Fe along the A and F directions and, near H, along the A direction arc shown by circles. Only Ax/F3 symmetry bands are seen for normal emission with s polarization. The crosses denote weak features [80 E I]. The final-state energy scale gives the final-band energies used to determine thecomponent k normal to the crystal surface. Solid and dashed lines denote the majority and minority bands, respectively, calculated using a vBH potential [77 C I]. Solid and open triangles denote the Fermi surface crossings of, respcc- tively, the majority and minority bands determined from dHvA data. Ei: initial-state electron energy, Et: final-state electron energy.
Stearns
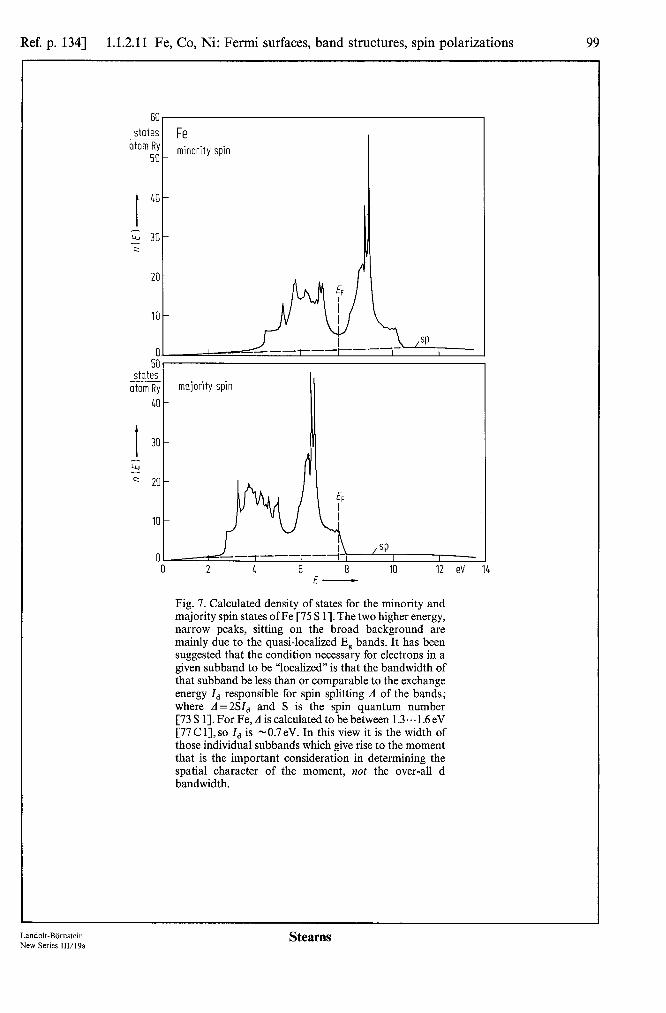
Ref. p. 1341 1.1.2.11 Fe, Co, Ni: Fermi surfaces, band structures, spin polarizations 99
Fig. 7. Calculated density of states for the minority and majority spin states ofFe [75 S 11. The two higher energy, narrow peaks, sitting on the broad background are mainly due to the quasi-localized E, bands. It has been suggested that the condition necessary for electrons in a given subband to be “localized” is that the bandwidth of that subband be less than or comparable to the exchange energy I, responsible for spin splitting A of the bands; where A =2SI, and S is the spin quantum number [73 S 11. For Fe, A is calculated to be between 1.3...1.6 eV [77 Cl],so I, is -0.7eV. In this view it is the width of those individual subbands which give rise to the moment that is the important consideration in determining the spatial character of the moment, not the over-all d bandwidth.
Land&Bbmstein New Series III/l9a
Stearns

1.1.2.11 Fe, Co, Ni: Fermi surfaces, band structures, spin polarizations [Ref. p. 134
-6 -4 -2 0 eV E-E, -
Fig. 8. (a) Spin polarization ofangle- and energy-resolved photoemission from (100) Fe as a hmction of the binding energy of the electron. (b) Energy distribution curve measured simultaneously with the spin polarization [83 F I]. In: photon energy. L
1, a -8 -6 -4 -2 0 eV 2
E-E, -
Fig. 9. Separated spin-up and spin-down intensity curves corresponding to Fig. 8. The peaks A, B, and C corre- spond to symmetriesA,J,A,T,and As?, respectively.Top: Band structure of Fe sampled along the T-A-H direction [77 W I] indicating the exchange-sp!it bands of AS sym- metry which are the allowed initial states for normal emission from normal incident light [83 F I].
Stearns Landolr-Bornwin Ncu Srricc 111/19a

Ref. p. 1341 1.1.2.11 Fe, Co, Ni: Fermi surfaces, band structures, spin polarizations 101
Fig. 10. First Brillouin zone, symmetry points and axes for the hcp structure.
1.8 - (1210)
1.6 -
1.4 -
1.2 - cd
H
K
H 3 201
(0001)
Field dired
L \ H +
rioiol
I I
90” 60” 30” 01 [00011 n
Fig. 11. Angular variation of dHvA frequencies for hcp Co. Dots: [73A2], crosses: [72Rl]. Note that as yet none of the large-radius Fermi surface features have been seen. t: majority spin.
Landolt-BOrnstein New Series IWl9a
Stearns

102 1.1.2.11 Fe, Co, Ni: Fermi surfaces, band structures, spin polarizations [Ref. p. 134
Fig. 12. Fermi surfaces of hcp Co proposed from calcu- lations of [70 W I] as modified to agree with the experimental data. (a) majority spin band, (b) minority spin band, (c) minority spin band around I, (d) minority spin band around L. In (a), (b), and (c) the solid lines are From the calculations. The dashed lines in (a) arc modifi- cations to agree with measured dHvA data [72 R I]. In (d) modifications have been made around the U points as suggested from magnetoresistance measurements [73 C I]. Extremal orbits arc indicated.
Stearns
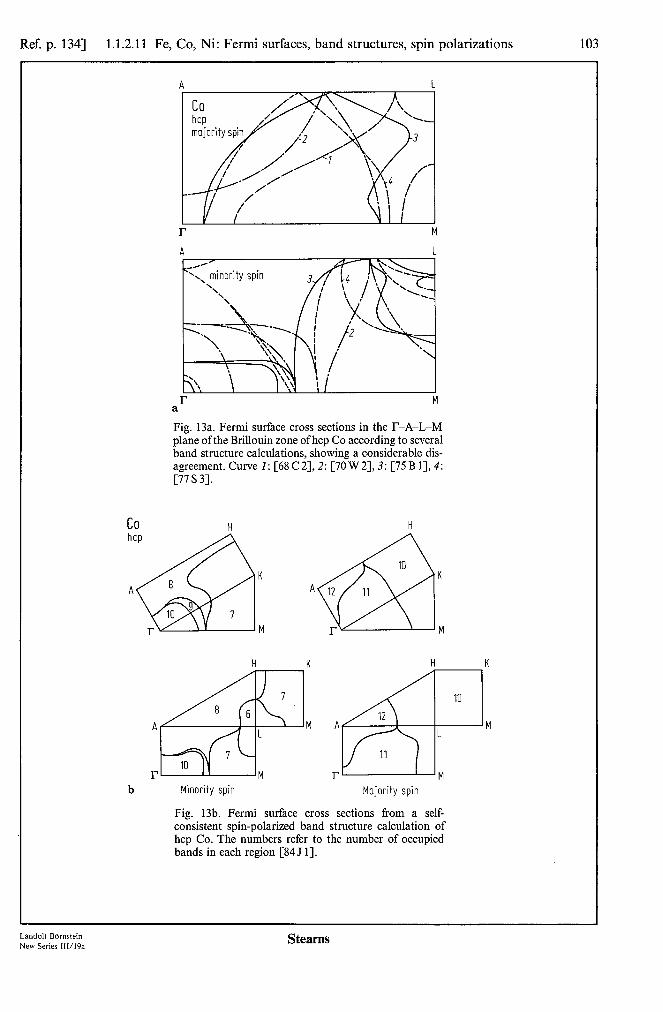
Ref. p. 1341 1.1.2.11 Fe, Co, Ni: Fermi surfaces, band structures, spin polarizations
r M a Fig. 13a. Fermi surface cross sections in the T-A-L-M plane of the Brillouin zone of hcp Co according to several band structure calculations, showing a considerable dis- agreement. Curve 1: [68 C2], 2: [70 W 2],3: [75 B 11, 4: [77S3].
b Minority spin Majority spin
Fig. 13b. Fermi surface cross sections from a self- consistent spin-polarized band structure calculation of hcp Co. The numbers refer to the number of occupied bands in each region [84 J 11.
Landolt-BOrnstein New Series 111/19a

104 1.1.2.11 Fe, Co, Ni: Fermi surfaces, band structures, spin polarizations [Ref. p. 134
0.8 RY
0.6
I 0.4 b.
0.2
0
I I I I I I l- M K l- A 1 H A
Fig. 14. Energy bands of hcp Co in some high-symmetry directions [84J I]. Full lines are the majority bands, broken lines the minority bands. As can bc seen many of the general features that were present for Fe also exist for Co. Namely, the moment is mainly due to some flat, localized d band states being filled for the majority band and empty for the minority band. There are also seen to be parabolic free-electron-like d bands which provide the polarized itinerant d electrons that align the localized d spins. Thus clearly the spin-up d-bands arc not full, a condition that is sometimes referred to as “weak itinerant electron ferromagnetism”.
-r A r L
eV
Fig. 15. Selected spin-up (open circles) and spin-down (solid circles) bands obtained by angle-resolved photo- emission experiments on hcp (0001) Co [80 H I] for 9 eV < fro < 30 eV. Corresponding theoretical spin-up (solid 1ine)and spin-down (dashed line) bands calculated includ- ing Coulomb correlation effects with the Coulomb in- tegral, U = I .5 eV [82 T 21. The calculations were made by transforming fee Co bands ofMoruzzi et al. [78 M I] into hcp bands by an interpolation scheme with the same parameters in both crystalline structures. The optimum U
-$ (0001) ~(000~) (00001 values obtained for Fe and Ni by this approach are 1 eV and 2eV, respectively. t: majority spin, 1: minority spin.
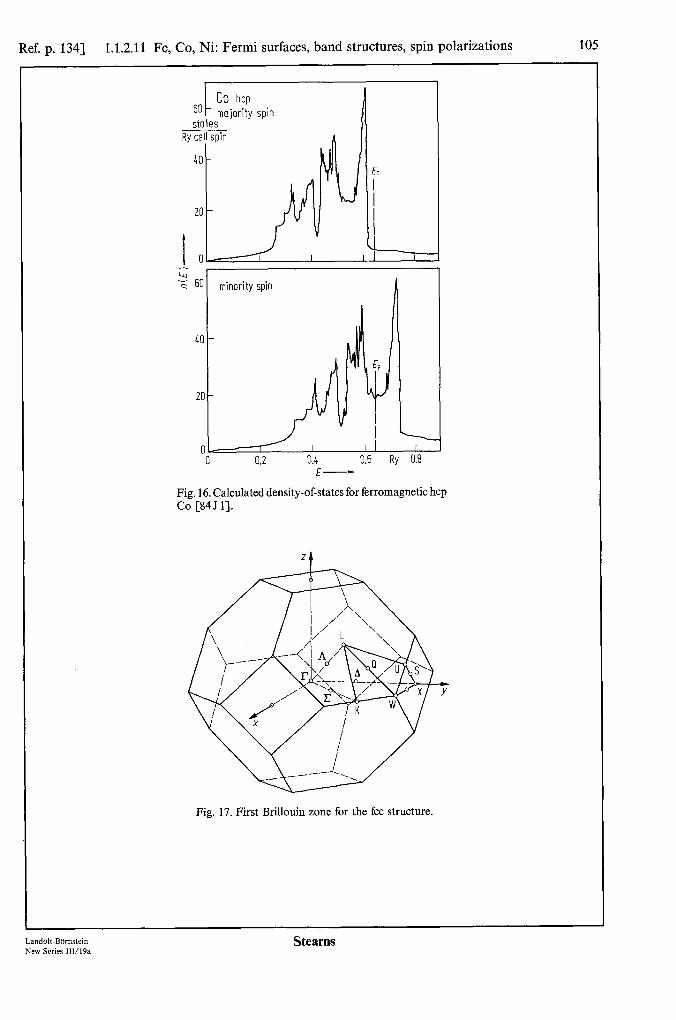
Ref. p. 1341 1.1.2.11 Fe, Co, Ni: Fermi surfaces, band structures, spin polarizations 105
6. CO hw majority spin
dotes
: 60 t
minority spin
40 -
20 -
0 ,,, ,,I, I 0 0.2 0.4 0.6 Ry 0.8
E-
Fig. 16. Calculated density-of-states for ferromagnetic hcp Co [84 J 11.
Fig. 17. First Brillouin zone for the fee structure.
Land&-BOrnstein New Series IIVl9a
Stearns

106 1.1.2.11 Fe, Co, Ni: Fermi surfaces, band structures, spin polarizations [Ref. p. 134
6.5 b!G
6.0 -
0
0
0
0
2.5 I I I I I I I I /,y 30" 15" 0" 15" 30" 45" 60" 75"
0
K(Olll xl0011 Llllll KlllOl Field direction
Fig. 18. Orientation dependence of the dHvA frequencies in Ni [67 T 2, 68 S 43. The lower frequency branch has been identified as due to the neck-like intersections ofthe spin-up Fermi surface with the Brillouin zone face in the L [I I I] direction. This sheet of the Fermi surface is similar to the Fermi surface of Cu; however, the area of contact aith the Brillouin face is about ten times smaller than that ofCu. The IO...25 MG frequencies are associated with the hybridized spd hole pockets near X. Strong spin-orbit induced effects which are dependent on the magnetic field direction are seen in topology along the T-X axis [67Hl,68Rl,70Zl].
10.34 MG
10.32
15.60 MG
15.55
15.50
15.45
I 15.LO
4 b
\- 2.71 MG
2.70 T
ST o!
2.69 0 r;,1 1
2.68 -T 1 I 1 t:.
2.67
11.00 I 0 2 k 6 8 10 kbor
P- Fig. 19. Change of dHvA frequency with pressure of a single crystal of Ni (eJ6ek/e4k z 3000) at I .5 K. Table 4 lists the values of the slopes, (df/dp)/f, for the applied field in various directions [77 V I]. CL, b: dHvA frequency branches, see Table 4 for magnetic field directions.
Stearns

Ref. p. 1343 1.1.2.11 Fe, Co, Ni: Fermi surfaces, band structures, spin polarizations 107
a
(100)
Fig. 20. Cross sections of the Ni Fermi surface in (a) the (110) plane and @) the (100) plane. The solid lines are from calculations [77 W 11. The circles, triangles, and squares are the experimental dHvA results of R.W. Stark and coworkers [77 W I]; the dotted lines are due to the measurements of Tsui and Stark [67 T 2, 68 S 41. The letters designate the various surfaces. 1: minority hole pocket around Xs; 2: minority hole pocket around X,; 3: minority arm hole surfaces surrounding the outer Brillouin zone edges; 4: majority Cu-like electron surface around r; 5: minority electron surface around r. There is considerable spd electron hybridization in some regions of the Ni Fermi surfaces as noted. The electron surfaces 4 and 5 have mainly itinerant d character in the K direction and are highly hybridized with the sp electrons in the X and L directions. i: itinerant, 1: localized.
Landok-Bbmstein New Series 111/19a
Stearns

108 1.1.2.11 Fe, Co, Ni: Fermi surfaces, band structures, spin polarizations [Ref. p. 134
10 4
Ni (loo)
15 I
B- 20 25 30 kG 35 I ' 3 I I
v=277 GHz 1=1.5 K
5 10 15 20 25 kOe 30 H WI -
Fig. 21. Azbel-Kaner cyclotron resonance in Ni showing the third through seventh subharmonic peaks of a relatively light effective mass, m*/m, =0.86, identi- fied as the minority spin d band hole pocket having its major axis along [OOI] [73G I]. dR/dB: surface im- pcdance signal
8
6
1.5” 15” 22.5" 30" 31.5" 45' Field direction - IO111
Fig. 22. Anisotropy of the cyclotron effective mass ob- served in Ni. Many experimental traces for the belly masses showed beat structure with the number p of resonance peaks between beats ranging from 5 to 7. Such traces analyzed as arising from two groups of electrons having the effective masses denoted by the triangles. The circles denote heavy effective masses from traces that did not display beats [73 G I]. r: majority spin, 1: minority spin, WI:,: average effective mass, me: free- electron mass.
Stearns

Ref. p. 1341 1.1.2.11 Fe, Co, Ni: Fermi surfaces, band structures, spin polarizations 109
-8
I I r A x 2 w 0
Fig. 23. Calculated energy bands in Ni along several symmetry directions [77 W 11. Majority spin (t) states are denoted by solid lines and minority spins (1) by dashed lines. The two minority hole pockets surrounding X are not found in Fig. 10. However, Gersdorf [78 G l] has suggested that measurements of magnetocrystalline ani- sotropy provide evidence of the existence of minority X, hole pockets with an effective mass ofabout 197~. Such a high effective mass would be very difficult to see with dHvA measurements. An additional complication may arise in that it has been found that spin-orbit splitting is dependent on the direction of magnetization near X [7OZ l] and thus applying a high magnetic field may perturb the system so that under these conditions the dHvA measurements are no longer of the ground state of Ni. Photoemission experiments found that X,1 is 0.04 eV [81 H 21 and 0.06eV below E, [83 R 11.
Fig. 24. Portions of the energy levels of Ni along the F-X direction as determined from photoemission spectra. The data points show the measured dispersion of the A1 band and a few critical points [80 E 21. The dashed curve is the free-electron final-state band. The solid curves below E, are from calculations of Wang and Callaway with the vBH potential [77 W 1, 74W l] and above E, from Smulowicz and Pease [78 S 21.
A l-
60- eV Ni /
/
1
20
Lqy LL IO-
O-
-2.5 -
-5.0 -
-1.5 -
1.
-10.0 L 0
~I
0.89 A-’ 1
K S X
l- 4 - X
Land&-Bornstein New Series IIl/l9a
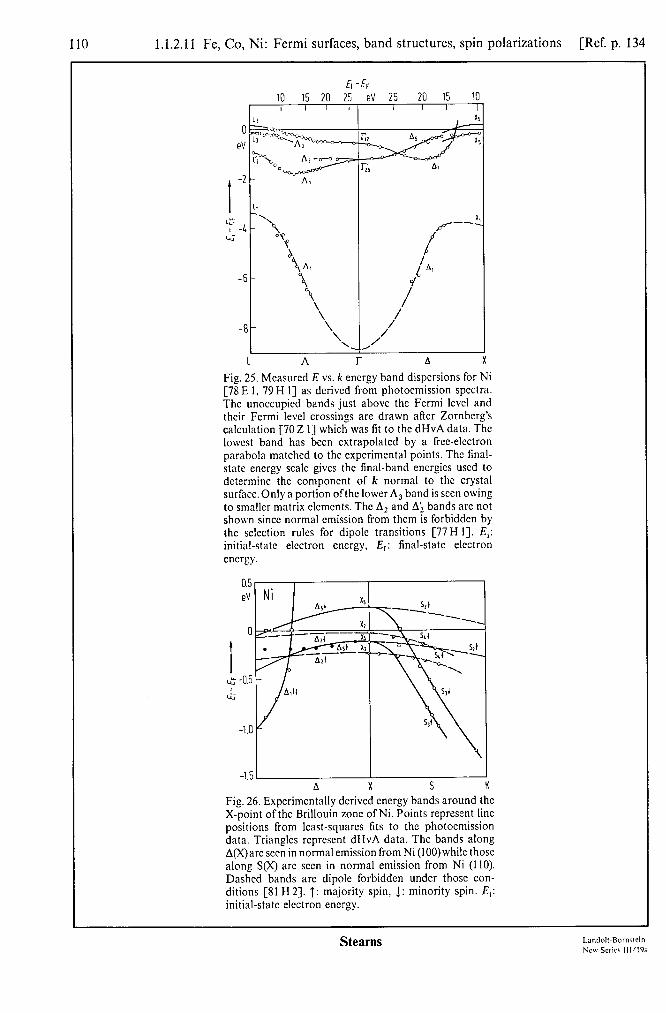
110 1.1.2.11 Fe, Co, Ni: Fermi surfaces, band structures, spin polarizations [Ref. p. 134
-6-
-T- 1 A l-
eV 25 20 15
3
., II Al
10
1 XS
Fig. 25. Measured E vs. k energy band dispersions for Ni [78 E 1, 79 H I] as dcrivcd from photoemission spectra. The unoccupied bands just above the Fermi lcvcl and their Fermi level crossings are drawn after Zornbcrg’s calculation [70 Z I] which was fit to the dHvA data. The lowest band has been extrapolated by a free-electron parabola matched to the experimental points. The tinal- state energy scale gives the final-band energies used to determine the component of k normal to the crystal surface. Only a portion ofthe lower A, band is seen owing to smaller matrix elcmcnts. The A2 and Ai bands arc not shown since normal emission from them is forbidden by the selection rules for dipole transitions [77H I]. Ei: initial-state electron cncrgy, E,: final-state electron energy.
n x s K
Fig. 26. Expcrimcntally derived energy bands around the X-point of the Brillouin zone of Ni. Points represent line positions from least-squares fits to the photoemission data. Triangles rcprcscnt dHvA data. The bands along A(X) seen in normal emission from Ni (100)whiIe those along S(X) arc seen in normal emission from Ni (1 IO). Dashed bands are dipole forbidden under those con- ditions [8l H 21. T: majority spin, 1: minority spin. Ei: initial-state electron energy.
Stearns
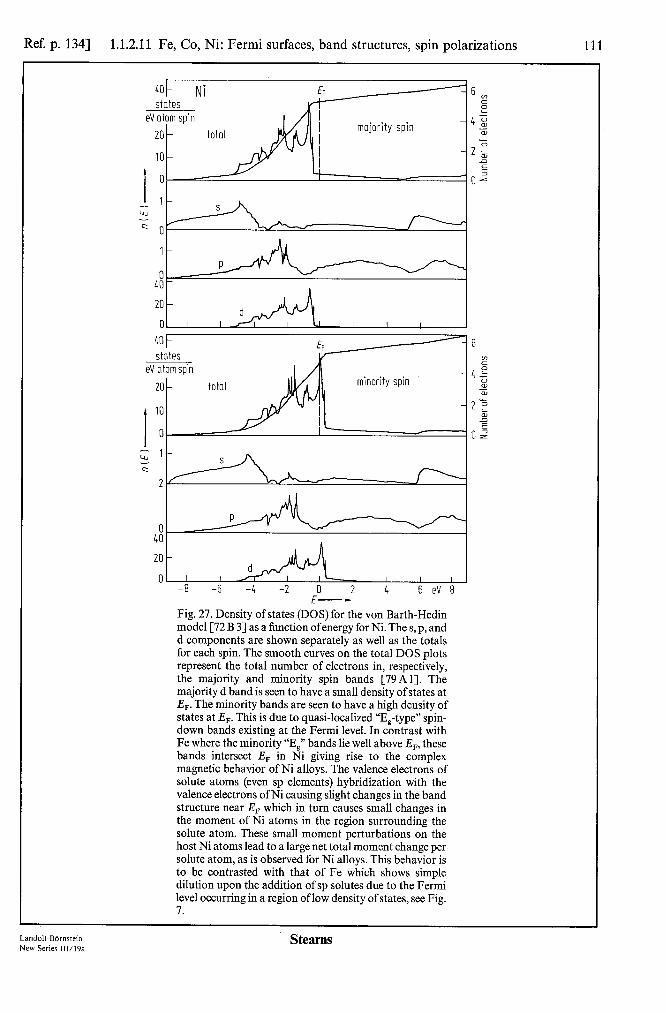
Ref. p. 1341 1.1.2.11 Fe, Co, Ni: Fermi surfaces, band structures, spin polarizations 111
states eV atom spin
20 - total majorlry spin -62
z IO-
-2- z E
LIZ
401 states
tTiG$
20 - total
t
IO-
o-
-8 -6 -4 -2 0 2 4 6 ev 8 E-
Fig. 27. Density of states (DOS) for the von Barth-Hedin model [72 B 31 as a fknction ofenergy for Ni. The s, p, and d components are shown separately as well as the totals for each spin. The smooth curves on the total DOS plots represent the total number of electrons in, respectively, the majority and minority spin bands [79A 11. The majority d band is seen to have a small density ofstates at E,. The minority bands are seen to have a high density of states at E,. This is due to quasi-localized “E,-type” spin- down bands existing at the Fermi level. In contrast with Fe where the minority “Es” bands lie well above E,, these bands intersect E, in Ni giving rise to the complex magnetic behavior of Ni alloys. The valence electrons of solute atoms (even sp elements) hybridization with the valence electrons ofNi causing slight changes in the band structure near E, which in turn causes small changes in the moment of Ni atoms in the region surrounding the solute atom. These small moment perturbations on the host Ni atoms lead to a large net total moment change per solute atom, as is observed for Ni alloys. This behavior is to be contrasted with that of Fe which shows simple dilution upon the addition of sp solutes due to the Fermi level occurring in a region oflow density of states, see Fig. 7.
Landolt-Bdrncfein New Series 111/19a
Stearns
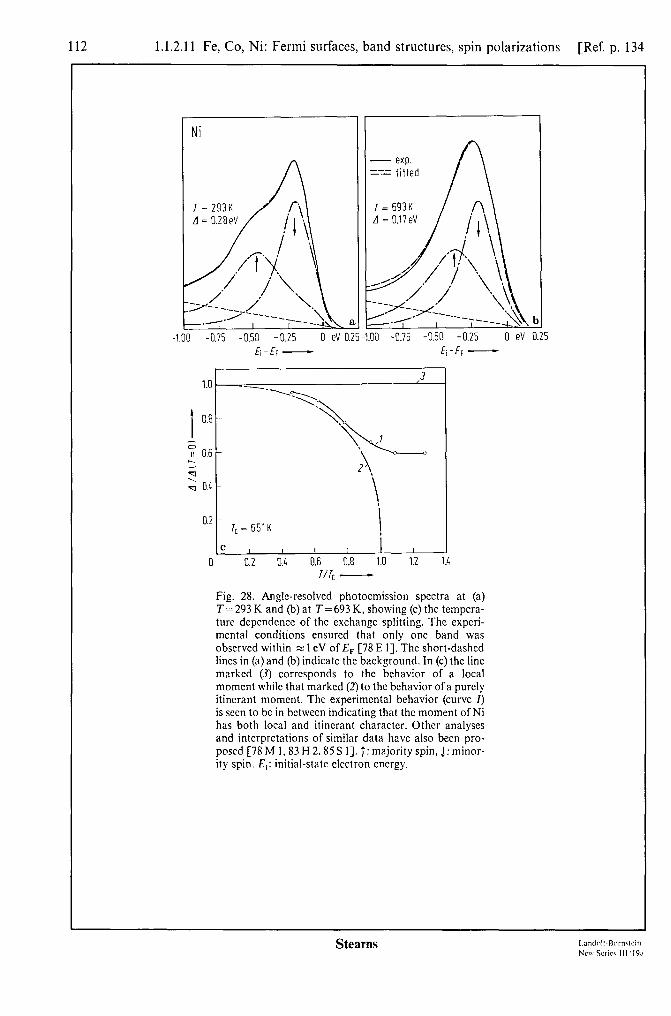
112 1.1.2.11 Fe, Co, Ni: Fermi surfaces, band structures, spin polarizations [Ref. p. 134
Ni
j -0.75 -0.53 -0.25 0 ev 0.25
1.0
1 0.9
5; II 0.6
” q ; 0.4
0.2
00 -0.75 -0.50 -0.25 0 eV 0.25 Ei-fF -
1, = 651 K
c , I I I I I I 0 0.2 0.4 0.6 0.8 1.0 1.2 1.4
l/l, -
Fig. 28. Angle-resolved photoemission spectra at (a) T= 293 K and (b) at T= 693 K, showing (c) the tempera- ture dependence of the exchange splitting. The expcri- mental conditions ensured that only one band was observed within z I eV of E, [78 E I]. The short-dashed lines in (a) and (b) indicate the background. In (c)the lint marked (3) corresponds to the behavior of a local moment while that marked (2) to the behavior of a purely itinerant moment. The experimental behavior (curve I) is seen to bc in between indicating that the moment of Ni has both local and itinerant character. Other analyses and interpretations of similar data have also been pro- posed [78 M I. 83 H 2.85s I J. 7: majority spin, 1: minor- ity spin. &: initial-state clcctron energy.
Stearns Landolr-Rornwin I. ,. . ..I. a

Ref. p. 1341 1.1.2.12 Fe, Co, Ni: optical constants, magneto-optical effects 113
1.1.2.12 Optical constants, magneto-optic Kerr or Faraday effect
The optical constants can be obtained from a variety of experimental measurements. Other desired constants are then derived by using a Kramers-Kroenig (KK) analysis. The most commonly used constants are the complex index of refraction fi= n+ik, the dielectric or permittivity constant E”=s’+is” and the optical conductivity 6=o’+ia”. These are all related by
fp=E”, &‘=n2-k2 and E’! = 2nk, 4rcio”. gj = dij + IJ.
0 For anisotropic materials these quantities become tensors. For low-intensity radiation the dielectric tensor
can be expanded into parts that are even or odd powers of M [71 L l]
El= [$ !! ZJ +i [iI -??= {:I . (2)
even in M odd in M
For M in the z-direction s:, = E& = E:, = sGZ = 0. The Kerr or Faraday magneto-optic effects arise from the sky and $, terms. They are due to the spin-photon
interaction in which the light quanta are elastically scattering from a magnetic crystal without any change in the direction of propagation but with a spatial rotation of 7c/2 of the polarization direction. Thus the direction of polarization of light is changed when the light is reflected by the surface of a magnetized sample. The values of s& and E& are obtained from a measurement of the angle of rotation of the polarization, cc This angle is proportional to the magnetization of the sample. The various configurations of the orientation of the magnetization of the sample, the surface of the sample, and the plane of incidence of the light lead to three classes of Kerr effects.
1. Polar Kerr or Faraday effect
Magnetization perpendicular to the surface of the sample, normal incident linearly polarized light: the polarization is rotated through an angle CI~ given by
uK = K,M
where K, is the polar Kerr constant and M the magnetization.
(3)
2. Longitudinal (or meridional) Kerr effect
Magnetization parallel to the surface of the sample and parallel to the plane of incidence of the linearly polarized light: the reflected light is elliptically polarized, its major axis being rotated with respect to the oscillation plane of the incident light by an angle CI.
3. Transverse (or equatorial) Kerr effect
Magnetization parallel to the surface of the sample and normal to the plane of incidence of the linearly polarized light: linearly polarized light with E parallel to the plane of incidence (p-polarized) undergoes a change of intensity, AI, when reflected from a sample which is subjected to alternating magnetization, induced by an applied magnetic field oscillating in time. The equatorial Kerr effect is given by the relative change of intensity.
S=AIJI. (4)
The values of sky and E& can be derived from 6.
Landolt-Biirnstein New Series 111/19a
Stearns

114 1.1.2.12 Fe, Co, Ni: optical constants, magneto-optical effects [Ref. p. 134
In Fe co Ni :V
n k n k nk
0.64 3.17 6.12 3.87 7.79 3.47 9.09 0.77 3.11 5.39 3.61 7.26 3.14 7.96 0.89 3.09 4.83 3.42 6.77 2.96 7.08 1.02 3.03 4.39 3.17 6.31 2.79 6.43 1.14 2.97 4.06 2.94 5.88 2.65 5.93 1.26 2.92 3.79 2.78 5.50 2.48 5.55 1.39 2.96 3.56 2.65 5.16 2.40 5.23 1.51 2.94 3.39 2.53 4.88 2.26 4.97 1.64 2.87 3.28 2.40 4.64 2.13 4.73 1.76 2.86 3.19 2.31 4.45 2.06 4.50 1.8s 2.92 3.10 2.25 4.27 1.99 4.26 2.01 2.88 3.05 2.19 4.11 1.99 4.02 2.13 2.94 2.99 2.13 3.96 1.96 3.80 2.26 2.95 2.93 2.05 3.82 1.92 3.61 2.38 2.86 2.91 1.97 3.68 1.85 3.42 2.50 2.74 2.88 1.88 3.55 1.82 3.25 2.63 2.67 2.82 1.81 3.41 1.78 3.09 2.75 2.59 2.77 1.74 3.28 1.73 2.95 2.88 2.48 2.71 1.67 3.17 1.71 2.82 3.00 2.35 2.65 1.61 3.05 1.70 2.69 3.12 2.24 2.58 1.57 2.93 1.72 2.57 3.25 2.12 2.50 1.53 2.82 1.72 2.48 3.37 2.02 2.43 1.50 2.71 1.70 2.40 3.50 1.93 2.35 1.49 2.61 1.74 2.32 3.62 1.85 2.27 1.48 2.52 1.78 2.26 3.74 1.78 2.19 1.46 2.44 1.84 2.22 3.87 1.74 2.12 1.45 2.37 1.93 2.19 3.99 1.69 2.06 1.44 2.31 2.01 2.18 4.12 1.67 2.00 1.44 2.25 2.02 2.18 4.24 1.65 1.94 1.44 2.19 2.03 2.20 4.36 1.64 1.88 1.44 2.14 2.03 2.23 4.49 1.62 1.84 1.44 2.09 2.01 2.26 4.61 1.59 1.79 1.44 2.04 1.96 2.29 4.74 1.56 1.75 1.44 2.01 1.89 2.30 4.86 1.53 1.70 1.45 1.97 1.82 2.32 4.9s 1.51 1.66 1.45 1.93 1.73 2.31 5.11 1.50 1.61 1.46 1.91 1.65 2.29 5.23 1.48 1.57 1.47 1.89 1.57 2.25 5.36 1.48 1.53 1.47 1.87 1.49 2.20 5.4s 1.47 1.49 1.45 1.86 1.43 2.15 5.60 1.47 1.47 1.43 1.85 1.38 2.09 5.73 1.47 1.44 1.41 1.84 1.34 2.02 5.85 1.47 1.43 1.38 1.82 1.32 1.96 5.9s 1.49 1.41 1.36 1.78 1.29 1.89 6.10 1.47 1.40 1.32 1.75 1.28 1.82 6.22 1.45 1.40 1.29 1.71 1.28 1.75 6.35 1.42 1.39 1.26 1.67 1.29 1.69 6.47 1.35 1.37 1.21 1.63 1.29 1.64 6.60 1.29 1.35 1.16 1.59 1.26 1.60
Table 1. Room-temperature optical constants for polycrystalline Fe, Co, and Ni determined from invert- ing reflection and transmission measurements of p-polarized light, of 0.64...6.6eV photon energy, inci- dent at an angle of 60”. The estimated error for k is f 1.5% and for n +4% [74 J 11. The imaginary part E” for Ni was seen to be independent of temperature from 78 to 423 K [75 J 11.
1 2 3 k 5 eV 6 a hV-
1 2 3 5 eV 6
Fig. la. Optical conductivities of polycrystalline Fe and Co calculated from the optical constants in Table 1 [74J 11. The width of the curves represents the experi- mental accuracy.
Stearns

Ref. p. 1341 1.1.2.12 Fe, Co, Ni: optical constants, magneto-optical effects 115
0.6
a.5
0 b
4 “% D. ?
-6S
-7.:
-9s 5 ia 15
/Iv-
Fig. lb. Measured normal (11”) incidence reflectivity ofFe for photon energies ranging from 2eV...2leV at 0.1 eV intervals and E’ and E” calculated from KK analysis [76 M 11.
1.0
‘5
i.0
I k.5 Q 4)
I.0
1.5
3
Fig. lc. E’ and s” vs. photon energy for Ni derived from: (solid line) electron energy loss spectra [79 F 11; (dotted curve) reflectivity and transmission data [74 J l] ; (dashed curve) optical absorption data [69 S 41.
Land&Bbmstein New Series 111/19a
Stearns

116 1.1.2.12 Fe, Co, Ni: optical constants, magneto-optical effects [Ref. p. 134
3s .10-' rad 1.5
-6.0
-1.5
-9.0
-10.5
-12.0 1 2 3 4 eV
/IV----- Fig. 2. Polar Kerr effect curves ah derived from the arithmetic mean of the s and p-wave data for Fc, Co, and Ni, The samples wcrc 99.99% pure plates subjcctcd to mechanical polishing. annealing and electrolytic polish- ing before measurcmcnts. The dashed curves wcrc cal- culated from values of E& and E:,. dctcrmincd from equatorial Kerr effect mcnsurcmcnts, see Figs. 3a. b, c [68 K I].
For Fig. 3. see next page.
2 xl-' m:
I
0
8 -2
U 40 i roil
I -2
B
-4
-5 0 0.5 1.0 1.5 2.0 pm
L-
6.0 IO“ rod 4.5
6.0
1.25
0.25
0
-0.25 0 0.5 1.0 1.5 2.0 2.5 3.0 ev 3.5
c /Iv-
Fig. 4. Wavelength dependence of the longitudinal Kerr angle of rotation for Ni, measured with (a) s-polarized light (E normal to plane of incidence) at an incident angle of 60” and (b) p-polarized light (E in plane of incidence) at an incident angle of 75”. The sample was a 1000 8, film evaporated onto a glass substrate at 200 “C in a vacuum of 2.6. IO-* bar and annealed for about 2 h. (c) Photon energy dependence of E& and czr for Ni as derived from the data of (a) and (b) [69 Y 1 J.
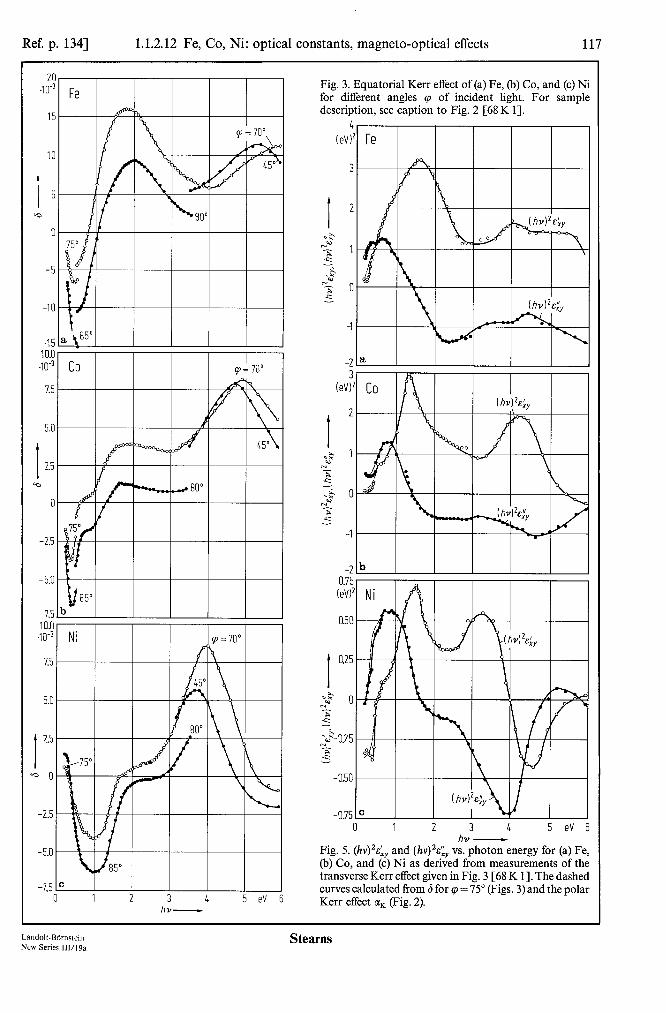
Ref. p. 1341 1.1.2.12 Fe, Co, Ni: optical constants, magneto-optical effects 117
10.0 40-3
1.5
5.0
I
2.5
- 0
-2.5
-5.0
Fig. 3. Equatorial Kerr effect of (a) Fe, (b) Co, and (c) Ni for different angles cp of incident light. For sample description, see caption to Fig. 2 [68 K 11.
a 31 It% I I I I I
ieV)*I co I B B I I I I
-2 b
$0.25 !, , \I 9 I 91 I I\, II
‘3 -o.50 “.b;” -035lc I
0 1 2 3 4 5 eV 6 hv -
Fig. 5. (/Iv)~&~ and (h~)~e!& vs. photon energy for (a) Fe, (b) Co, and (c) Ni as derived from measurements of the
-7.5 Ic 0 1 2 3 b 5 eV 6
hv-
&nsvkrse K&r effect given in Fig. 3 [68 K I]. The dashed curves calculated from S for rp = 75” (Figs. 3) and the polar Kerr effect CI~ (Fig. 2).
Landolt-BBmstein New Series III/19a
Stearns

118 1.1.2.13 Fe, Co, Ni: specific heat [Ref. p. 134
.,& I s-2
1 ;A lo* 3 . 0
-$
-1
-2 0 2 L 6 8 10 ev 12
Fig. 6. Room-tempcraturc values of oa:,. and ocr~, of Ni as a function of photon energy measured with the transvcrsc Kerr e&t. The samples were ~~5000A evaporated films of 99.9% purity Ni. These curves are directly comparable to those of Fig. 5c over their similar photon energy ranges [77 E I].
1.1.2.13 Specific heat, resistivity, magnetoresistance, Hall coefficients, Seebeck coefficients and thermal conductivity
The standard expression for the Hall resistivity (in cgs-units) is
E. r =p,,=R,B+4nR,M, 1
where E, is the transverse electric field appearing for a given longitudinal current .I,. R, is called the normal or ordinary Hall coefficient and R, the spontaneous, extraordinary or anomalous Hall coefficient. Strong applied field and temperature effects are seen due to transition from the low field (w,re 1) to the high field (w,r$ 1).
The general expression for the Seebeck coefficient or thermoelectric power, the potential difference generated by a temperature difference across a sample, is given by
where k, is the Boltzmann constant, e the electron charge, E the energy of an electron, Q the electrical resistivity and p(E) is the electrical resistivity for the metal with Fermi level at energy E.
The Wiedemann-Franz ratio is defined as I/CT, where 3, is the thermal conductivity and Q the electrical resistivity. For a simple, ideal metal it is a constant, La= (71ka/e)~/3 =2.44. 10m8 V2/K2, called the Lorentz number.
Table 1. Low-temperature specific heat coefficients and Debye temperatures for Fe, Co, and Ni [65 D 11. Fe and Ni: least-squares fit to C,=yT+PT3 + aT3j2. Co: least-squares fit to C,=yT+/IT3+~/T2, where x/T2 is a nuclear contribution. /3= 12n4N,k,/50& N,: Avogadro’s number.
Y B a 00 mJ K-‘mol-’ mJ K-4mol-’ mJ K-5’2 mol-’ K
Fe co ‘) Ni
4.755(15) 0.0184(7) 0.021(12) 472.7(60) 4.38(l) 0.0199(7) 460.3(77) 7.039(16) 0.0179(7) 0.011(13) 477.4(62)
‘) x=4,99(6)mJKmol-‘.
Stearns Landolr-Ro,rn<rcin lieu Series 111’19a
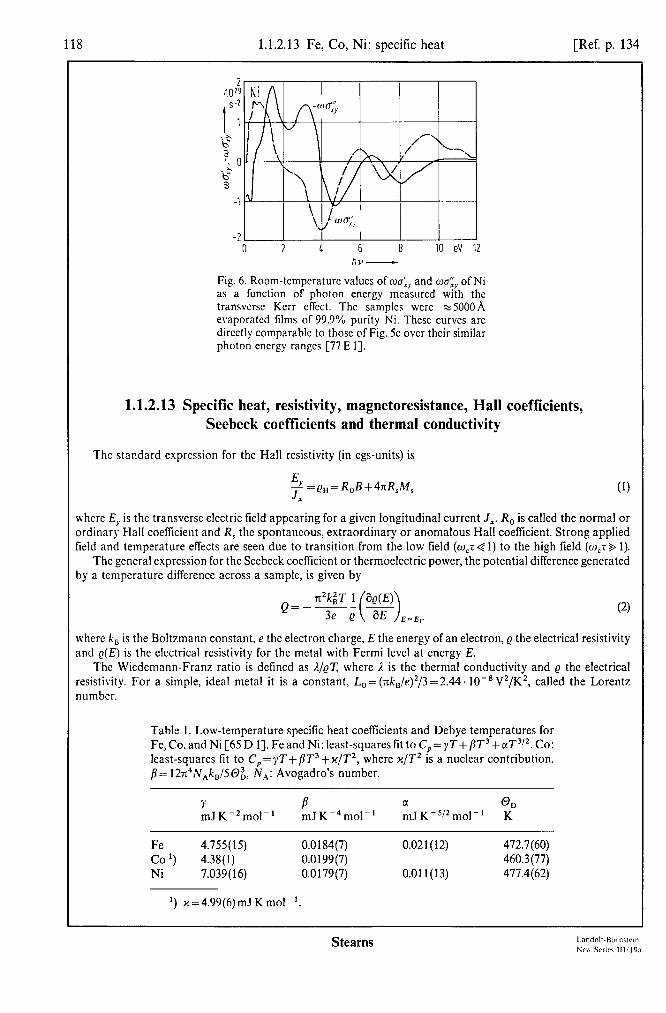

Ref. p. 1341 1.1.2.13 Fe, Co, Ni: specific heat
T 801
-2-- Kmol 76.0
75 I
55
I 50
L? 45
40
35
30
25
20 z 2 "Eprn
15. 300 600 900 1200 1500 1800 K 2100
Fig. 1. Temperature dependence of the specific heat of Fe, Co, and Ni above room temperature. T, is the melting temperature [68 B 11.
40
-J- Kmol
I
38
* 36
34 40
J Kmol
I
3E
z 3E
34 630 631 632 633 K 634
T-
75 J Kmol
70
I 65
$0
55
45 1000 1025 1050 1075 K 1100
Fig. 2. Temperature dependence of the specific heat of Fe around Tc. Tc and the critical exponents U=E’ were evaluated to be 1041.32 K and -0.120 (lo), respectively [74L 1-J
40
J Kmol
38
I 36
L?
34
32
T- Fig. 3. Temperature dependence of the specific heat of Ni around Tc. Tc and the critical exponents C(=CL’ were evaluated to be 631.58 K and -0.10(3), respectively [71 C 31. The data was reevaluated giving 631.52K and -O.O89(2),respectively [74L 11.1: [65P 1],2: [65 B 3],3: [38 S 31, solid line: [71 C 31.
Fig. 4. Temperature dependence of the specific heat of Ni near Tc showing the effects of (a) crystalline inperfec- tions on the apparent rounding of the maximum and (b) various magnetic fields applied parallel to the plane of single crystals [71 C 31. A: annealed single crystal; B, D: annealed polycrystals; C: deformed, unannealed single crystal. I: zero applied field, 2: 25 Oe, 3: 60 Oe, 4: 120 Oe, 5: 240 Oe.
Landolt-B6’msfein New Series lW19a
Stearns
120 1.1.2.13 Fe, Co, Ni: specific heat, resistivity [Ref. p. 134
mJ K2mol
I 7.2
)- 7.1 \ z
5.1
C” J"
1.9
6.8 0 2.5 5.0 7.5 10.0 12.5 15.0 K2 20.0
7.11 7.11 mJ mJ
Kzmol Kzmol
7.07 7.07
I I k k 7.03 7.03 I: I: z. z. Qa Qa
,h ,h 4.80 4.80
4.16 4.16
4.12 4.12 0 0 OX OX 0.8 0.8 1.2 1.2 1.6 1.6 K"' K"' 2.0 2.0
Fig. 5. Variation of C,IT vs. T* of Fe and Ni at low temperature. Evaluating 7 and /I from C,=yT+/IT3gave
Fig. 6. Variation of(C,-j?T3)/Tvs. T”2 of Fe and Ni at
)I=4,780(l)mJK-*mole’ low temperature. Evaluating 7 and c(, the spin wave
and 0,=463.7(ll)K for Fc and y=7.059(l)mJK-2mo!-1 and 0,=459.4(18)K for
cocffcient, from C, = yT+ /?T3+ crT3 *, where the lattice contribution was determined from the elastic constants,
Ni [65D I]
125 &h
251
gave y=4.746(3)mJK-*mol-‘, a=0.028(2) mJK-5:2 mol-‘forFeandy=7.014(5)mJK-2mo!-~,~=0.038(3) mJ Km5/* mol-’ for Ni (65D I].
0 250 500 750 1000 1250 "C 15
Fig. 7.Temperature dependence ofresistivity e ofpolycry- stallinc Fe, Co, and Ni. All measurements are related to the sample dimensions at room temperature [67 K 33, see also [64A I]. Chemical composition of the samples in mm : Fe: 5OC, 5OSi, 16Mn, IOP, 6OS, 500,, and ION,. Co:<lAg.<lAl,<1Ca,<lCu,3Fe,1Mg,2Mn,and 3 Si. Ni: <IAg. <IAl, <lCu,2Fe,2Mg,and <3Si.
Stearns
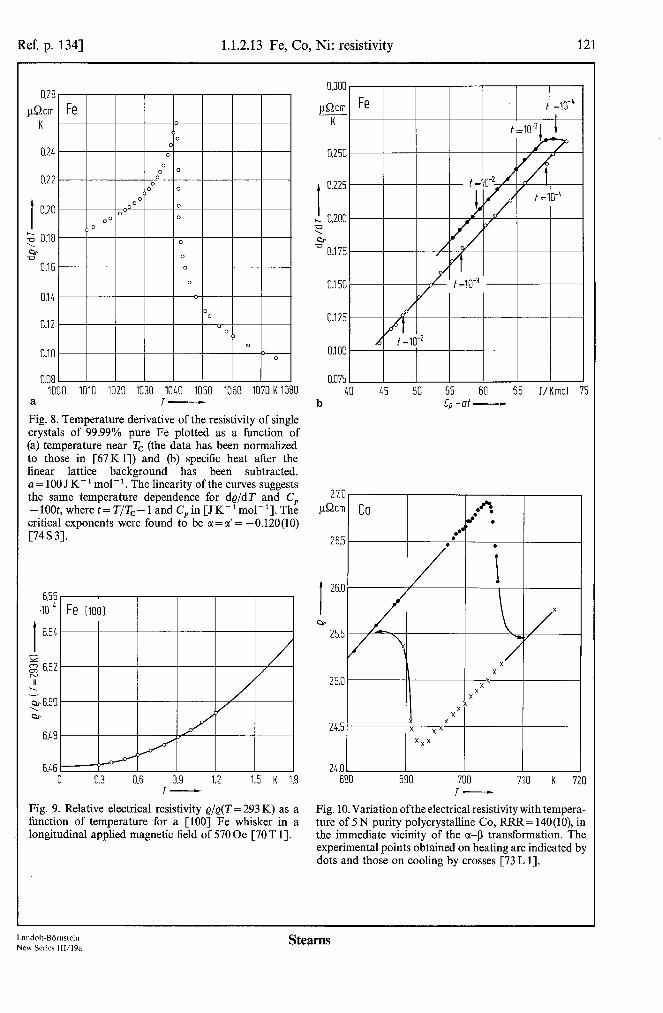
Ref. p. 1341 1.1.2.13 Fe, Co, Ni: resistivity 121
0.300, I I I I I I
K
0.250
I
0.225
k 0.200 -n \ ar I I I I
0.12 0.125
n.m I I I I I I I I I 1000 1010 1020 1030 1040 1050 1060 1070 K 1080
a T-
Fig. 8. Temperature derivative of the resistivity of single crystals of 99.99% pure Fe plotted as a function of (a) temperature near Tc (the data has been normalized to those in [67K 11) and (b) specific heat after the linear lattice background has been subtracted. a = 100 J K- ’ mol- ‘. The linearity of the curves suggests the same temperature dependence for de/dT and C, -lOOt,wheret=T/Tc-landC,in[JK-‘mol-’].The critical exponents were found to be a=~‘= -0.120(10) [74 s 31.
z 652 z II h
5 6.50 cw
6.48
6.46 0 0.3 0.6 0.9 1.2 1.5 K 1.8
T-
Fig. 9. Relative electrical resistivity e/&T=293 K) as a function of temperature for a [loo] Fe whisker in a longitudinal applied magnetic field of 570 Oe [70 T 11.
0.075 I 40 45
b 50 55 60 65 J/Kmol
Go-af-
27.C pQcm
26.5
I 26.0
Qn 25.5
25.0
24.5
24.0 6 6
XLX I 700 710 K 7; T-
Fig. 10. Variation ofthe electrical resistivity with tempers ture of 5 N purity polycrystalline Co, RRR= 140(10), i the immediate vicinity of the cl-p transformation. Th experimental points obtained on heating are indicated 1: dots and those on cooling by crosses [73 L 11.
Land&BOrnstein New Series 111/19a
Stearns
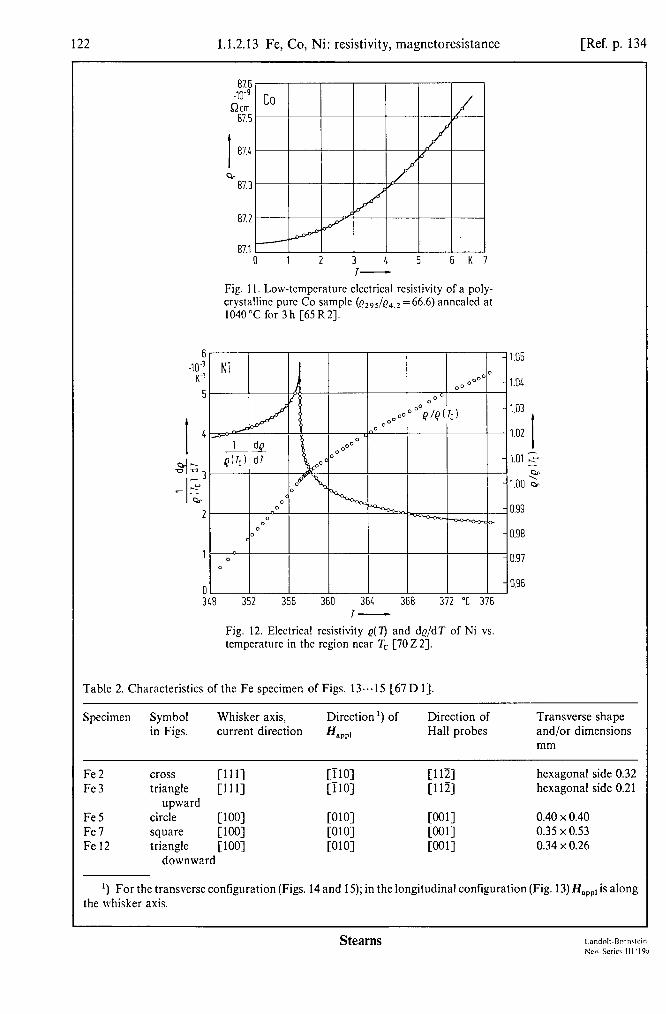
122 1.1.2.13 Fe, Co, Ni: resistivity, magnetoresistance [Ref. p. 134
87.6 mg
Qcm 87.5
I 87.4
O87.3
87.2
87.1 0 12 3 4 5 6 K7
Fig. 1 I. Low-tcmpcraturc electrical rcsistivity of a poly- crystalline pure Co sample (e295/e4,2 = 66.6) annealed at 1040°C for 3 h [65 R2].
0.99
0.98
0.97
0.96
372 "C 376
Fig. 12. Electrical resistivity e(7) and dg/dT of Ni vs temperature in the region near 7” [70 Z 21.
Table 2. Characteristics of the Fe specimen of Figs. 13...15 [67 D 11.
Specimen Symbol Whisker axis, Direction ‘) of Direction of Transverse shape in Figs. current direction H,,,, Hall probes and/or dimensions
mm
Fe2 Fe3
Fe5 Fe7 Fe12
cross Canal [ii01 [llZ] hexagonal side 0.32 triangle Cl111 [ii01 [ll?] hexagonal side 0.21
upward circle Cl001 c0101 WI 0.40 x 0.40 square uw COlOl WI 0.35 x 0.53 triangle Cl001 COlOl WI 0.34 x 0.26
downward
‘) For the transverse configuration (Figs. 14 and 15); in the longitudinal configuration (Fig. 13) H,,,, is along the whisker axis.
Stearns
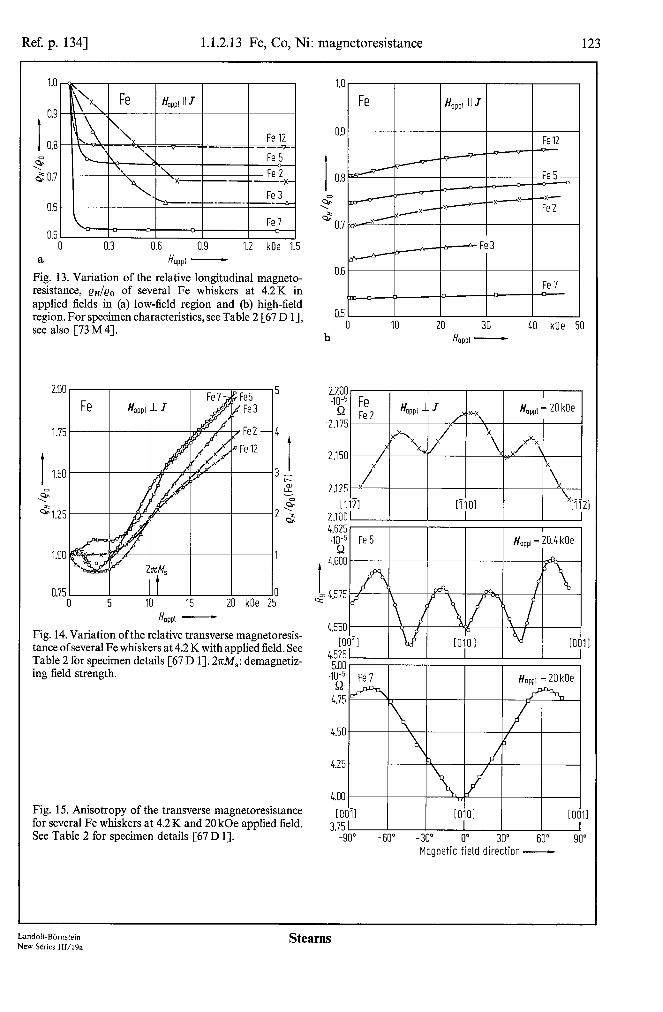
Ref. p. 1341 1.1.2.13 Fe, Co, Ni: magnetoresistance 123
0.9
t 0.8
G s 0.7
0.6
0.5 I I- I I I 0 0.3 0.6 0.9 1.2 kOe 1.5
a H OPPi -
Fig. 13. Variation of the relative longitudinal magneto- resistance, eH/eO of several Fe whiskers at 4.2K in applied fields in (a) low-field region and (b) high-field region. For specimen characteristics, see Table 2 [67 D 11, see also [73 M 41.
1.50
-5 G 1.25
H OPPl -
Fig. 14. Variation ofthe relative transverse magnetoresis- tance ofseveral Fe whiskers at 4.2 K with applied field. See Table 2 for specimen details [67 D 11. ~TcM,: demagnetiz- ing field strength.
Fig. 15. Anisotropy of the transverse magnetoresistance for several Fe whiskers at 4.2 K and 20 kOe applied field. See Table 2 for specimen details [67 D 11.
I 0.8
5
&0.7
0.6
0.5 0 IO 20 30 40 kOe
b H OPPl -
1
1 50
2.200 I
-‘k5 Fe I
Fe 2 HOPPI 1 J y.xq. Hopp, = 20 kOe 2.175 \ I .”
2125y I k
[I121 [ii01 hi21 2.looL I I 4.625 .10-s
52
4.550 10 II
4.525 I I I I I I Fml. cl.“Y
.10-s Q
4.75
4.25
4.00
rodii roio1 rod11 3.75 I I
-90” - 60” -30” 0” 30” 60” 90” Magnetic field direction -
Landolt-BBmstein New Series III/I%
Stearns
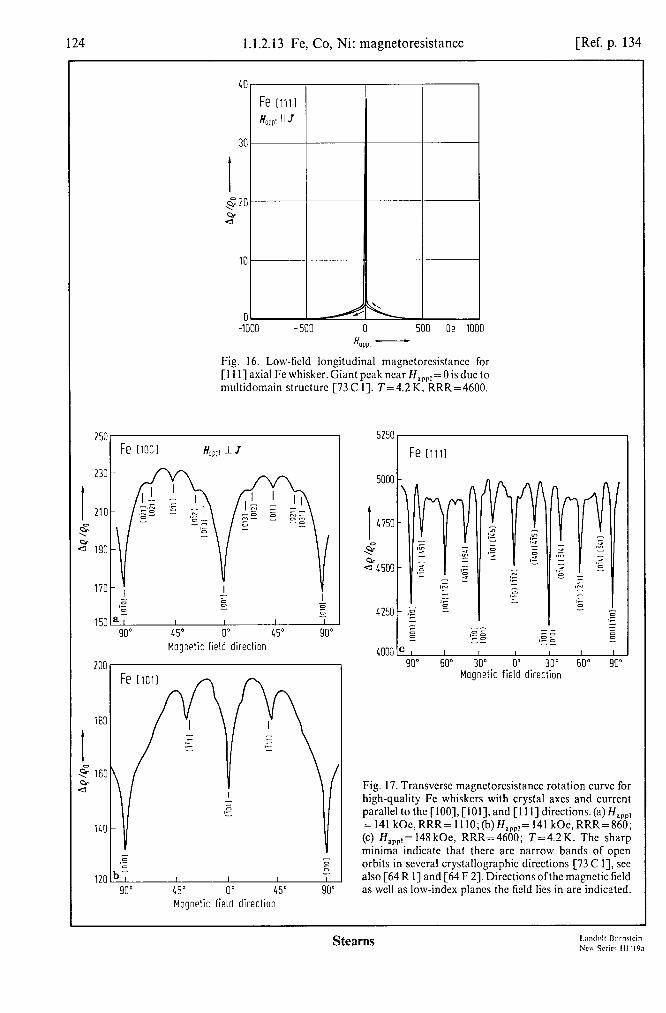
124 1.1.2.13 Fe, Co, Ni: magnetoresistance [Ref. p. 134
40
30
i $20
d”
10
0 -1000 -500 0 500 Oe lOi0
H OPPl -
Fig. 16. Low-field longitudinal magnctorcsistancc for [ 11 I] axial Fe whisker. Giant peak near Hap,,, =0 is due to multidomain structure [73 C I]. T=4.2K. RRR=4600.
250 Fe Ii001 t&p! 1 J
-
153 a ’ D
I ! I I
90” 15” 0” 45” 90” Magnetic field direction
20[
18:
t i? 161 $
l-
l-
3
l-
1-k 45” 0” 45”
Magnetic field direction
90”
5250,
Fe [iii1
I 4750
G 24500
4250
4000 90” 60” 30” 0” 30” 60” 90”
Magnetic field direction
Fig. 17. Transvcrsc magnetoresistance rotation curve for high-quality Fe whiskers with crystal axes and current parallel to the [ IOO], [ lOI], and [ 11 I] directions. (a) H,,,, = 141 kOe,RRR= IllO;(b)H,,,,= 141 kOe,RRR=860; (4 Hnpp,= 148 kOe, RRR=4600; T=4.2K. The sharp minima indicate that there are narrow bands of open orbits in several crystallographic directions [73 C I], see also [64 R I] and [64 F 23. Directions ofthc magnetic field as well as low-index planes the field lies in are indicated.
Stearns hndnlr-Bornrlcin NCN Scrirs 111’19a
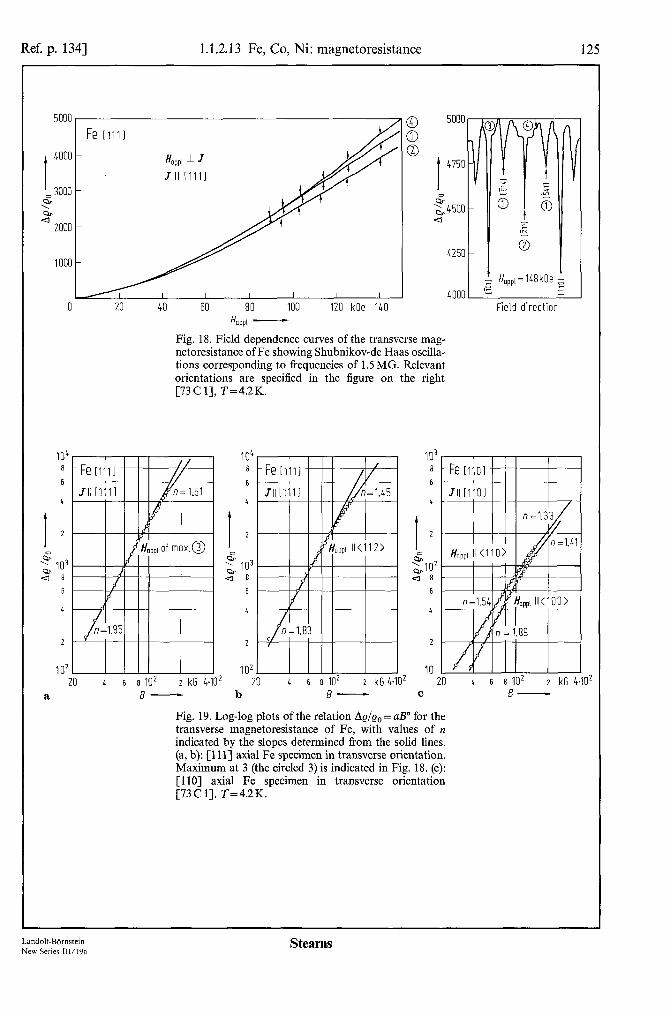
Ref. p. 1343 1.1.2.13 Fe, Co, Ni: magnetoresistance
Fe [Ill1
3 I 4750
D
-Go0 2
4250
20 40 60 80 100 120 kOe 140 H WI -
Fig. 18. Field dependence curves of the transverse mag- netoresistance of Fe showing Shubnikov-de Haas oscilla- tions corresponding to frequencies of 1.5 MG. Relevant orientations are specified in the figure on the right [73 C 11, T=4.2K.
IO2
2
IO2 20 4 6 8 IO/ 2 kG 4.10L 20 6 6 610’ 2 kG 4-10L 20 4 6 8 10’ 2 kG 4.10’
a 5- b 5- c B-
Fig. 19. Log-log plots of the relation AQ/Q~ = aB” for the transverse magnetoresistance of Fe, with values of n indicated by the slopes determined from the solid lines. (a, b): [l 1 l] axial Fe specimen in transverse orientation. Maximum at 3 (the circled 3) is indicated in Fig. 18. (c): [l lo] axial Fe specimen in transverse orientation [73C I]. T=4.2K.
Landolt-Bmxfein New Series 111/19a
Stearns

126 1.1.2.13 Fe, Co, Ni: magnetoresistance [Ref. p. 134
I I I I I I I I
0 20 10 60 80 100 120 kOe
H cq! - a
13.1 j-
2,2011i !b 4 i ,; ; i 1 90” 60” 30” 0” 30” 60” 90”
Magnetic field direction C
6.0 -
/
I I I I I I I
0 20 10 60 80 100 120 kOe 1E
b H OPPl -
28 i” J 10” off c oxis J 10” off c oxis
in ( 11lO ) plone in ( 1170 ) plone
Hoppl = 150 kOe Hoppl = 150 kOe
,“pr;;;;r:II”“‘j,o ,
90” 0” 90” Magnetic field direction
Fig. 20. Transverse magnctorcsistance rotation diagrams and ficld sweeps for Co specimens. (a) Current in the basal plant parallcl to a [ilOO] direction. (b) Current in the (1120) plant 40” off the c axis, RRR=383. (c)Current parallcl to the c axis, RRR=204 [73 C 11. T=4.2 K. Shubnikov-de Haas oscillations arc indicated by arrows.
2.0,
co I
I LO” off c axis in (ll?O) plone
Hopp, II IO001 1
0”
I I 1 1 I I I
20 LO 60 80 100 120 1LO kOe H OPPl -
Fig. 21. Shubnikov-dc Haas oscillations in Co observed for the field to the c axis and the current 40” off the c axis in the (1120) plane [73C I]. T=4.2K.
Stearns
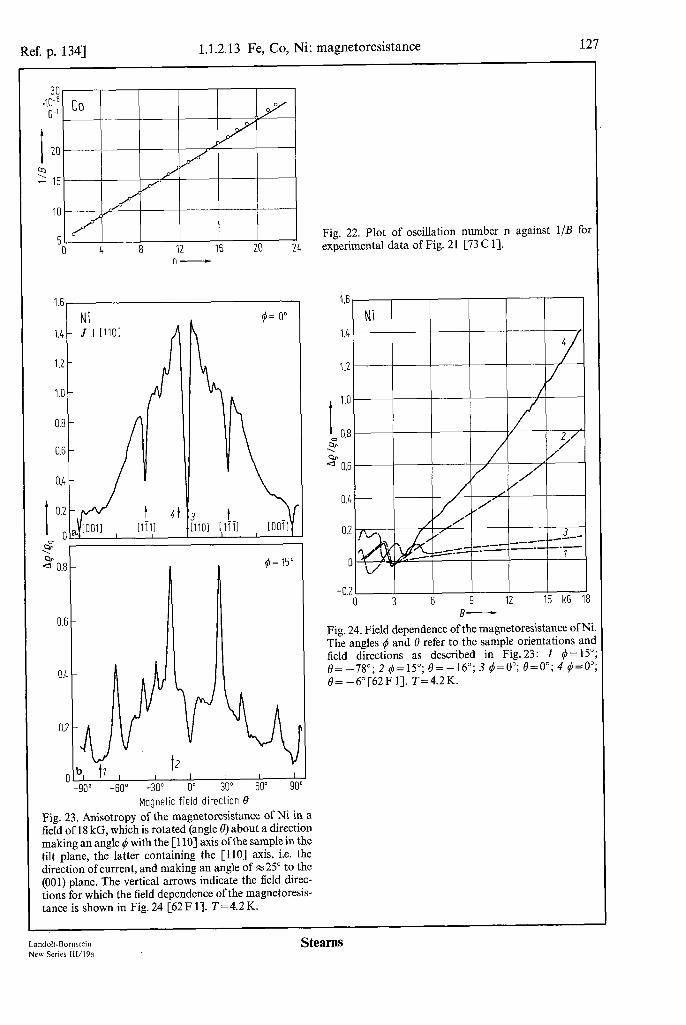
Ref. p. 1341 1.1.2.13 Fe, Co, Ni: magnetoresistance 127
5 0 8 12 16 20 2L
n-
Ni I.4 - J II l1101
1.2 -
1.0 -
ox- rl
0.8 -
0.6 -
Magnetic field direction 6’
Fig. 23. Anisotropy of the magnetoresistance of Ni in a field of 18 kG, which is rotated (angle 0) about a direction making an angle 4 with the [ 1101 axis of the sample in the tilt plane, the latter containing the [l lo] axis, i.e. the direction of current, and making an angle of x25” to the (001) plane. The vertical arrows indicate the field direc- tions for which the field dependence of the magnetoresis- tance is shown in Fig. 24 [62 F 11. T=4.2 K.
Fig. 22. Plot of oscillation number n against l/B for experimental data of Fig. 21 [73 C 11.
B- B- Fig. 24. Field dependence of the magnetoresistance of Ni Fig. 24. Field dependence of the magnetoresistance of Ni The angles 4 and f3 refer to the sample orientations and The angles 4 and f3 refer to the sample orientations and field directions as described in Fig. 23: 1 cj = 15” field directions as described in Fig. 23: 1 cj = 15” 8~ 8~ -78”; -78”; 2 2 4~15~‘; 4~15~‘; lj)= lj)= -16”; -16”; 3 3 q$=O’; q$=O’; e=O”; e=O”; 4 4 4~0 4~0 8= -6”[62F 11. T=4.2K. 8= -6”[62F 11. T=4.2K.
Land&-Bbmstein New Series 111/19a
Stearns

12s 1.1.2.13 Fe, Co, Ni: Hall coefficient [Ref. p. 134
Ch
G
I
-2.5
sr” -5.0
-75
-10.0
-12.5 0 50 100 150 200 250 K 300
a T-
Fig. 25. Temperature dcpcndcncc of the (a) ordinary, R,, and (b) extraordinary. R,. Hall coefftcicnts for Fc, Co, and 7%. The samples wcrc 99.99% pure polycrystallinc materials with residual resistance ratios RRR=Q~~~/c)~,~~ of I I.5 (Fe). 66.3 (Co), and 57.2 (Ni) [60 V I].
0.5
I 0
d -0.5
-2.0 0 50 100 150 200 250 K 300
b
VI I I I I I -20r I I I I
0 25 50 75 100 125 150 175 200 K 225 I-
Fig. 26. Dcrivativc of the Hall rcsistivity, d&d& as a function of tempcraturc for a high-purity [I I I] Fc whisker (RRR=4000). showing that dp,,ldB is clearly not a constant below 80K [74K I]. see also [75C I, 79 hl I].
Jo.: Skm G
3
I 2
4r" 1
Fig. 27. Variation of the extraordinary Hall cocflicicnt with tcmpcraturc ofthc same sample as in Fig. 26. R, was calculated from the intcrccpt of the Hall rcsistivity obtained by extrapolating to B=O. Two approsimatc fits have been used for extrapolation: e,, = R,B + 4rrR,M, (lincar analysis) and Q,, = R,B+4nRJ4,+ CB’ (quadratic analysis) [74 K I]. RRR = 4000.
0
-1
Fe I1111
T . lineor analysis 0 quadratic analysis I
I I I 150 200 K 250
I-
Stearns

Ref. p. 1341 1.1.2.13 Fe, Co, Ni: Hall coefficient 129
200 200 .mg .mg
Bcm Bcm
100 100
I I G O G O
-100 -100
-200 -200 0 0 50 50 100 100 150 150 200 200 kG kG 250 250
Fig. 28. Hall resistivity as a function of B for [loo] Fe Fig. 29. Derivative of the Hall resistivity, d&dB, as a whiskers of various purities at 4.2K. Bll[OOl], Vull[OlO] function of B for the RRR= 7320 Fe whisker shown in and Jll[lOO] [75C 11. T=4.2K. Fig.28 at 4.2K [75 C 11.
C
-25
I -50
5 G
-75
-100
-1251 0 10 20 30 40 40'2
I + Fe[llll RRR=4000 H=20...150kOe 21 Fe [I111 RRR=$OOO H =l5...45kOe 3 l Fe (polycrystal) sample I’ H = 15. . . 70 kOe 4 A Fe(polycrystal) sample1 H = 15 . ..70kOe TFe [Ill] 1 Fe[lOOl H=15...30 kOe
I I
x,
G/ B’Qtl -
Fig. 30. Kohler plot of the relative Hall resistivity Q H/e0 vs. B/Q, for various Fe samples where e0 is the zero-field resistivity. The quantity B/Q, is proportional to w,z. Data 1 and 2 on the [ill] axial whisker with KKK=4000 was taken with Sll[llz] and Vull[ilO] [75 C 11. Data 3 and 4 are from [73 M 41 for the poly- crystals and the solid lines from [67D 11. T=4.2K.
Fig. 3 1. Applied field dependence of Hall resistivity mu at a variety of temperatures for a polycrystalline Ni sample with RRR=650. The major impurity was 15 at. ppm Fe. Data points are omitted for clarity [Sl H 41.
-1 I I I I 50 100 150 200 kG 250
-c
-4
-3 G I -2
.loi Qclr
I-
IO 20 30 40 50 kOe 60 H OPPI -
Land&Bbmstein New Series lWl9a
Stearns

130 1.1.2.13 Fe, Co, Ni: thermoelectric power [Ref. p. 134
I I 0 relative to PI
200 ulo 600 800 "C II 300 I-
Fig. 32. Seebcck coetlicicnt Q of Armco Fe (RRR = 11 .O) and hisher-purity Fe (RRR = 26.2) measured with rcspcct to Pt (top curves). and absolute (bottom curves) [66 F 11.
1.2
I 1.0
5 Q 0.8
0.6
$ 0
I -2
D 4
-6
-A i300 850 900 950 1000 1050 1100 1150 K1200
I-
Fig. 33. Thcrmoclcctric power or Seebeck coefficient Q and relative resistivity e/e0 of Fe at high temperatures [69S3]. 1:[69S3],2:[67K3],3: [62K2].4: [35B 11.5: [69 S 3-j, 6: [67 B 23.
20 !A! K
10
0
I
-10
m -20
-30
-40
-50 0 250 500 750 1000 1250 K 1500
7-
Fig. 34. Temperature dcpcndcncc of the absolute thcrmo- power of Fc [6OL I], 5N pure Co (RRR=l40(10)) [72L2,73Ll]and5NpureNi(RRR=220(10))[76Ll]. The dashed extension for Co is the data of [69 V 11.
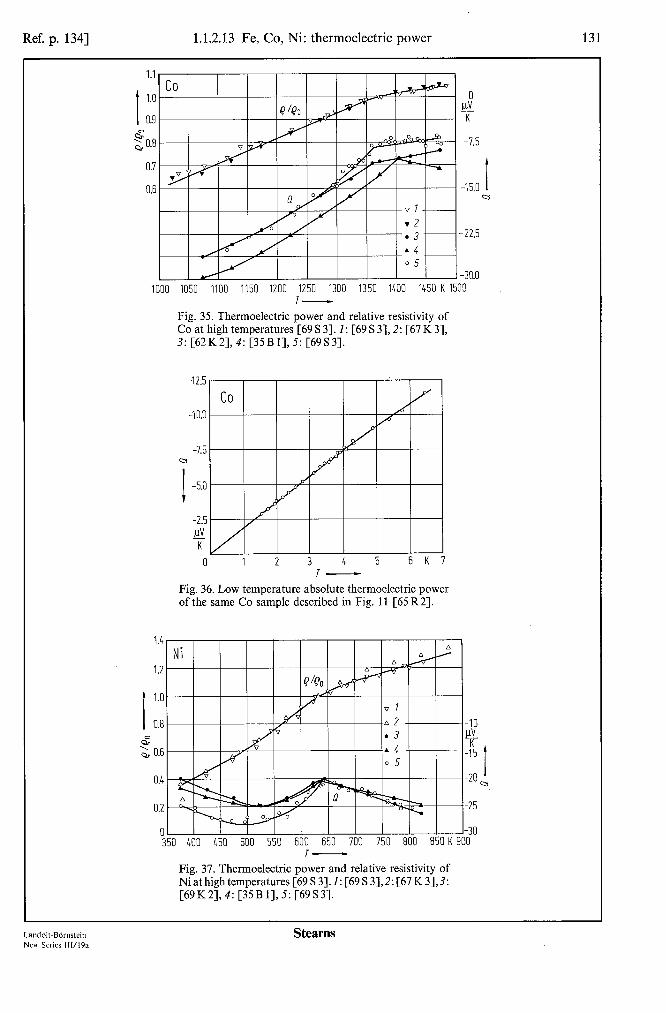
Ref. p. 1341 1.1.2.13 Fe, Co, Ni: thermoelectric power 131
1.1
t
1.0
0.9 0
20.8
0.7
0.6
1
2. K
-7.5
-15.0 I cr
-22.5
-30.0 IO 1050 1100 1150 1200 1250 1300 1350 1400 1450 K 1500
7-
Fig. 35. Thermoelectric power and relative resistivity of Co at high temperatures [69 S 31.1: [69 S 3],2: [67 K 31, 3: [62 K2], 4: [35 B I], 5: [69 S 31.
-7.5 0
I -5.0
0 12 3 4 5 6 Kl
Fig. 36. Low temperature absolute thermoelectric power of the same Co sample described in Fig. 11 [65 R2].
G 2 0.6
Y -15
I -20 cI
I I I I I I-30 550 600 650 700 750 800 850 K 900
Fig. 37. Thermoelectric power and relative resistivity of Ni at high temperatures [69 S 31.1: [69 S 3],2: [67 K 3],3: [69K2],4:[35B1],5:[69S3].
Landolt-BOrnstein New Series 111/19a
Stearns
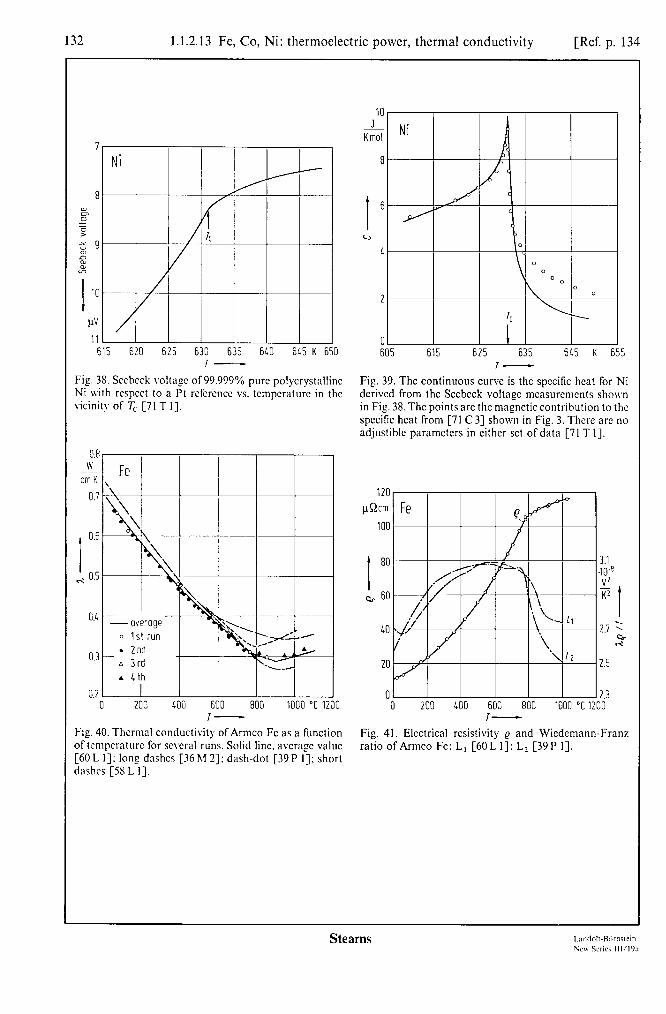
132 1.1.2.13 Fe, Co, Ni: thermoelectric power, thermal conductivity [Ref. p. 134
p!’
11 615 620 625 630 635 640 6L5 K 650
T-
FiS. 3% Sccbcck volta~c of 99.999% pure polycrystallinc Ni with rcspcct to a Pt rcfcrencc vs. tcmpcraturc in the vicinity of r, [71 T I].
0.8 u
cm K
0.7
I 0.6
& 0.5
0.4
0.3
0.2 200 400 600 800 1000 “C I,
T-
Fis. 40. Thermal conductivity of Armco Fc as a function of temperature for several runs. Solid lint. average value [60 L I]: long dashes [36 h4 21: dash-dot [39P I]; short dashes [5S L I].
605 615 625 635 645 K 655 I-
Fig. 39. The continuous curve is the spccitic heat for Ni dcrivcd from the Sccbcck voltage mcasuremcnts shown in Fig. 38. The points arc the magnetic contribution to the specific heat from [71 C 33 shown in Fig. 3. Thcrc are no adjustiblc parameters in either set of data [71 T I].
I c,r 60
40
20
01 0 200 400 600 800 1000 “C 1
I-
3.1
/ii K2
-I
2.1 = ‘5
2.5
2.3 ‘0
Fig. 41. Electrical resistivity Q and Wiedemann-Franz ratio of Armco Fe: L, [60 L I]; L2 [39P 11.
Stearns
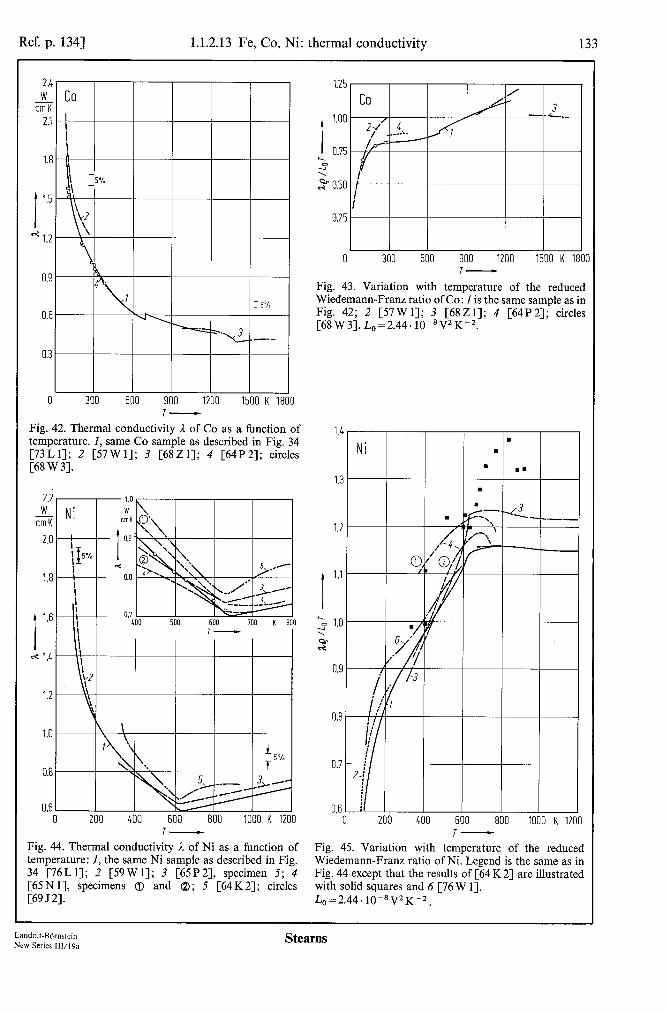
Ref. p. 1343 1.1.2.13 Fe, Co, Ni: thermal conductivity 133
2.4 ) 2.4 I
isIco I I
I I
I I I
W cmK I
I
I 2.1
0.6
0 0 300 300 600 600 900 900 1200 1200 1500 1500 K K 1800 1800 7- 7-
Fig. 42. Thermal conductivity 1 of Co as a function of Fig. 42. Thermal conductivity 1 of Co as a function of temperature. 1, same Co samnle as described in Fin. 34 temperature. 1, same Co sample as described in Fig. 34 [73Ll]; 2 [57Wl]; 3 [68Zl]; 4 [64P2]; circles [68W3]. [73Ll]; 2 [57Wl]; 3 [6iZl]; 4 [64P2]; cikles [68W3].
2.i W
cmK
2.0
1.8
I 1.6
%-z 1.4
1.2
0.6 0 200 400 600 800 1000 K 1200
I- Fig. 44. Thermal conductivity i of Ni as a function of temperature: I, the same Ni sample as described in Fig. 34 [76L 11; 2 [59W 11; 3 [65P2], specimen 5; 4 [65N 11, specimens 0) and a,; 5 [64K2]; circles [69 521.
I 1.00 0.75 k 0 7 2 0.50
0.25
0 300 600 900 1200 1500 K 1801 7-
Fig. 43. Variation with temperature of the reduced Wiedemann-Franz ratio of Co: 1 is the same sample as in Fig. 42; 2 [57 W 11; 3 [68Z 13; 4 [64P 21; circles [68W3]. L,=2.44~10-8VZK-2.
0.8
0.6 0 200 400 600 800 1000 K 1200
T- Fig. 45. Variation with temperature of the reduced Wiedemann-Franz ratio of Ni. Legend is the same as in Fig. 44 except that the results of [64 K 21 are illustrated with solid squares and 6 [76 W 11. L,=2.44. 10-8V2K-2.
Landolt-BOrnstein New Series 111/19a
Stearns

134 References for 1.1.2
1.1.2.14 References for 1.1.2
Books and review articles
Bozorth. R.M.: Ferromagnetism D. Van Nostrand Co, Inc. Princeton, N.J. 1951. Herring. C.: Magnetism. Vol. IV (Rado. G.T., Suh!, H., eds.), New York: Academic Press 1966. Marsha!!. W., Lovesey, S.W.: Theory of Thermal Neutron Scattering Oxford: Clarendon Press 1971. Fabian, D.J., Watson. L.M. (eds.): Band Structure Spectroscopy of Metals and Alloys, New York: Academic
Press 1973. Fawcctt, E.: Adv. Phys. 13 (1964) 139. Portis. A.M.. Lindquist, R.H.: Magnetism, Vol. HA (Rado, G.T., Suh!, H., eds.), New York: Academic Press 1965,
p. 357. Keffcr. F., in: Handbuch der Physik, Berlin. Heidelberg. New York: Springer 18 (1966) 1. Kessler, J.: Rev. Mod. Phys. 41 (1969) 3. Eastman, D.A.. in: Electron Spectroscopy (Shirley, D.A., ed.), Amsterdam: North-Holland Pub!. Co. 1972,
p. 487; in: Techniques of Metals Research VI (Passaglia, E., ed.), New York: Interscience 1972, p. 413. Smith. N.V.: Crit. Rev. Solid State Sci. 2 (1972) 45. lngnlis. R.. van der Woude. F., Sawatzky, G.A.: Mdssbauer Isomer Shifts (Shenoy, G.K., Wagner, F.E., eds.),
Amsterdam: North-Holland Publ. Co. 1974. Hiiffncr. S.: Photocmission in Solids II, Topics in Applied Physics Vol. 27, (Ley, L., Cardona, M., eds.), Berlin,
Heidclbcrg. New York: Springer 1979. Him&. F.J.: Appl. Optics. Dec. 1 1980. Wohlfarth, E.P., in: Ferromagnetic Materials (Wohlfarth, E.P., ed.), Amsterdam: North-Holland Pub!. Co. 1
(19SO) 2. Campbell. LA., Fert, A.. in: Ferromagnetic Materials (Wohlfarth, E.P., ed.), Amsterdam: North-Holland Publ.
co. 3 (19S2) 747.
11 W 1 17Tl 26W1 21s 1 31 w 1 34P 1 35B 1 36M I 36M2 36Nl 3SR I 3SSl 3ss2 3SS3 39B 1 39P 1 44Bl 44Fl 47Gl 48E 1 49B 1 50K I 50Tl 5lMl 51 M2 51Sl 52Bl 52Sl 54Bl
Special references
Weiss, P., Focx. G.: Arch. Sci. Natl. 31 (1911) 89. Terry, E.M.: Phys. Rev. 9 (1917) 394. Weiss. P., Forrcr, R.: Ann. Phys. 5 (1926) 153. Sekito, S.: Sci. Rep. Tohoku Univ. 16 (1927) 545. Wyckoff, R.W.G.: The Structure of Crystals. Chcm. Cat. New York 1931, p. 204. Potter. H.H.: Proc. R. Sot. London Ser. A 146 (1934) 362. Borelius. G.: Handbuch der Metallphysik, Leipzig: Akad. Verlagsgesellschaft 1 (II) (1935) 400 Marick, L.: Phys. Rev. 49 (1936) 831. Maurer. E.: Arch. Eisenhiittenw. 10 (1936) 1945. Neuburgcr, MC.: Z. Kristallogr. 93 (1936) 7. Rosenbohm, E.: Physica 5 (1938) 385. Stoner, E.C.: Proc. R. Sot. London Ser. A 165 (1938) 372. Sucksmith. W., Pearce, R.R.: Proc. R. Sot. London Ser. A 167 (1938) 189. Sykes, C., Wilkinson. H.: Proc. Phys. Sot. (London) 50 (1938) 834. Becker. R., Doring. W.: Ferromagnetismus, Berlin: Springer 1939. Powell. R.W.: Proc. Phys. Sot. 51 (1939) 402. Barnctt. S.J.: Proc. Am. Acad. Arts Sci. 75 (1944) 109. Fallot. M.: J. Phys. Radium 5 (1944) 153. Goldman. J.E.: Phys. Rev. 72 (1947) 529. Ellis. W.C., Greiker. E.S.: Metals Handbook ASM, Cleveland, Ohio 1948, 113. Bridgman. P.W.: Physics of High Pressures, London: Be!! 1949, p. 167. Korringa, J.: Physica 16 (1950) 601. Taylor. A.: J. Inst. Met. 77 (1950) 585. Meyer. A.J.P.: Ann. Phys. 6 (1951) 171. Meyer. H.P., Sucksmith, W.: Proc. R. Sot. London Ser. A 207 (1951) 427. Scott, G.G.: Phys. Rev. 82 (1951) 542. Barnett, S.J., Kenny, G.S.: Phys. Rev. 87 (1952) 542. Scott. G.G.: Phys. Rev. 87 (1952) 697. Bozorth, R.M.: Phys. Rev. 96 (1954) 311.

References for 1.1.2 135
5401 54Sl 55Al 55Cl 55Gl 55Sl 5532 56Cl 56Dl 56Nl 56Sl 57Ml 57Wl 58Kl 58Ll 58Nl 58Sl 59Nl 59 P 1 59Sl 59Tl 59Wl 60Al 60A2 6OCl 6051 60Kl 60K2 6OLl 6OPl 6OSl 6OVl 6OWl 61Bl 61B2 61B3
61B4 61B5 61 G 1 61Kl 61Ml 61 R 1 61R2 61Wl 61W2 61W3 61W4 62Al 62Fl 62Jl 62Kl 62K2 62Pl 62Rl 62Sl 62S2
Owen, E.A., Jones, D. Madoc: Proc. Phys. Sot. (London) Sect. B 67 (1954) 456. Sucksmith, W., Thompson, J.E.: Proc. R. Sot. London Ser. A 225 (1954) 362. Ament, W.S., Rado, G.T.: Phys. Rev. 97 (1955) 1558. Crangle, J.: Philos. Mag. 46 (1955) 499. Gilbert, T.L.: Phys. Rev. 100 (1955) 1243. Scott, G.G.: Phys. Rev. 99 (1955) 1241. Scott, G.G.: Phys. Rev. 99 (1955) 1824. Calhoun, B.A., Carr, W.J., Jr.: Conf. on Mag. Magn. Mater., A.I.E.E., New York 1956, p. 107. Dyson, F.J.: Phys. Rev. 102 (1956) 1217. Nakagawa, Y.: J. Phys. Sot. Jpn. 11 (1956) 855. Scott, G.G.: Phys. Rev. 104 (1956) 1498. Meyer, A.J.P., Brown, S.: J. Phys. Radium 8 (1957) 161. White, G.K., Woods, S.B.: Can. J. Phys. 35 (1957) 656. Kittel, C.: Phys. Rev. 110 (1958) 1295. Lucks, C.F., Deem, H.W.: ASTM Special Publ. #227 (1958) 7. Nakamura, T.: Progr. Theoret. Phys. (Kyoto) 20 (1958) 542. Suhl, H.: Phys. Rev. 109 (1958) 606. Nathans, R., Paoletti, A.: Phys. Rev. Lett. 2 (1959) 254. Parratt, L.G.: Rev. Mod. Phys. 31 (1959) 616. Suhl, H.: J. Phys. Radium 20 (1959) 333. Tatsumoto, E., Okamoto, T.: J. Phys. Sot. Jpn. 14 (1959) 1588. White, G.K., Woods, S.B.: Philos. Trans. R. Sot. London 251 (1959) 273. Alers, G.A., Neighbours, J.R., Sato, H.: J. Phys. Chem. Solids 13 (1960) 40. Arajs, S., Miller, D.S.: J. Appl. Phys. 31 (1960) 986. Claussen, W.F.: Rev. Sci. Instrum. 31 (1960) 878. Jones, R.V., Kaminov, I.P.: Bull. Am. Phys. Sot. 5 (1960) 175. Koi, Y., Tsujimura, A., Yakimoto, Y.: J. Phys. Sot. Jpn. 15 (1960) 1342. Kondorskii, E.I., Sedov, V.I.: Zh. Eksp. Teor. Fiz. 38 (1960) 773; Sov. Phys. JETP 11 (1960) 561. Laubitz, M.J.: Can. J. Phys. 38 (1960) 887. Portis, A.M., Gossard, A.C.: J. Appl. Phys. 31 (1960) 205 S. Scott, G.G.: Phys. Rev. 119 (1960) 887. Volkenshtein, N.V., Fedorov, G.V.: Zh. Eksp. Teor. Fiz. 38 (1960) 64; Sov. Phys. JETP ll(l960) 48. Watson, R.E., Freeman, A.J.: Phys. Rev. 120 (1960) 1125. Budnick, J.I., Bruner, L.J., Blume, R.J., Boyd, E.L.: J. Appl. Phys. 32 (1961) 120s. Benedek, G.B., Armstrong, J.: J. Appl. Phys. 32 (1961) 106 S. Brockhouse, B.N.: Inelastic Scattering of Neutrons in Solids and Liquids, Vienna: Internat. Atomic
Energy Agency 1961, p. 113. Barnier, Y., Pauthenet, R., Rimet, G.: C.R. Acad. Sci. Ser. B 252 (1961) 283. Barnier, Y., Pauthenet, R., Rimet, G.: CR. Acad. Sci. Ser. B 253 (1961) 400. Gersdorf, R.: Thesis, University of Amsterdam, The Netherlands 1961. Kouvel, J.S., Wilson, R.H.: J. Appl. Phys. 32 (1961) 435. Meyer, A.J.P., Asch, G.: J. Appl. Phys. 32 (1961) 330. Rayne, J., Chandrasekhar, B.S.: Phys. Rev. 122 (1961) 1714. Roberts, C.: C.R. Acad. Sci. Ser. B 252 (1961) 1442. Weger, M., Hahn, E.L., Portis, A.M.: J. Appl. Phys. 32 (1961) 124s. Watson, R.E., Freeman, A.J.: Phys. Rev. 123 (1961) 2027. Winter, J.M.: Phys. Rev. 124 (1961) 452. Watson, R.E., Freeman, A.J.: Acta Crystallogr. 14 (1961) 27. Abrahams, S.C., Guttman, L., Kasper, J.S.: Phys. Rev. 127 (1962) 2052. Fawcett, E., Reed, W.A.: Phys. Rev. Lett. 9 (1962) 336. Johnson, P.C., Stein, B.A., Davis, R.S.: J. Appl. Phys. 33 (1962) 557. Koi, Y., Tsujimara, A., Hihara, T., Kushida, T.: J. Phys. Sot. Jpn. 17 (1962) 96. Kolomoets, N.V., Vedernikov, M.V.: Sov. Phys. Solid State 3 (1962) 1996. Preston, R.S., Hanna, S.S., Heberle, H.: Phys. Rev. 128 (1962) 2207. Rodbell, D.S.: J. Phys. Sot. Jpn. 17 (1962) 313. Scott, G.G.: Rev. Mod. Phys. 34 (1962) 102. Shull, C.G., Yamada, Y.: J. Phys. Sot. Jpn. 17, Supp. B-III, (1962) 1.
Landolt-B6’mstein New Series III/19a
Stearns
136 Refcrcnccs for 1.1.2
6283
63A I 63A2 63C’l
63G1 63K I 63 K 2
63 K 3 63L 1 63L2 63M 1 6301 63 P 1 63S1 63Vl 63Wl 64Al 64A2 64C 1 64C2 64D 1
64F 1 64F2 61G 1 641 1 635 1 64K 1 64K2 64Ll 64M 1 64P 1
64P2 64Rl
64Sl 64Tl 64V 1 64 W 1 64Yl 65Al 65B I 65B2 65 B 3 65Cl 65C2 65D1 65F 1
65L 1 65L2 65Nl 65P 1 65P2
Shull. C.G.. in: Electronic Structure and Alloy Chemistry of the Transition Elements (Beck, P.A., ed.), New York: Intcrscience 1962. p. 69.
Argyle. B.E.. Charap. S.H.. Pugh, E.W.: Phys. Rev. 132 (1963) 2051. Arajs. S.. Colvin. R.V.: J. Phys. Chcm. Solids 24 (1963) 1233. Clougherty. E.V., Kaufman, L.: High Pressure Measurements (Giardini, A.A., Lloyd, E.C., eds.).
Washington: Buttcrworths 1963, p. 152. Gonser. U., Mecchan, C.J., Muir. A.H., Wiedersich, H.: J. Appl. Phys. 34 (1963) 2373. Kennedy. G.C., Newton. R.C.: Solids Under Pressure, New York: McGraw Hill Inc. 1963, ch. 7. Kirby. R.K.. in: American Institute of Physics Handbook, 2nd Ed., New York: McGraw-Hill Inc.
1963. pp. 464. Kaufman. L.. Cloughcrty, E.V., Weiss, R.J.: Acta Metall. 11 (1963) 323. LaForce. R.C.. Toth. L.E., Ravitz. S.F.: J. Phys. Chem. Solids 24 (1963) 729. Litstcr. J.D., Bencdek. G.B.: J. Appl. Phys. 34 (1963) 688. Menzinger, F., Paoletti. A.: Phys. Rev. Lett. 10 (1963) 290. Obata. Y.: J. Phys. Sot. Jpn. 18 (1963) 1020. Phillips, T.G., Rosenberg. H.M.: Phys. Rev. Lett. 11 (1963) 198. Strecvcr. R.L., Bcnnctt, L.H.: Phys. Rev. 131 (1963) 2000. Veerman. J., Franse. J.J.M., Rathenau, G.W.: J. Phys. Chcm. Solids 24 (1963) 947. Weiss, R.J.: Proc. Phys. Sot. 82 (1963) 281. Arajs. S., Calvin. R.V.: Phys. Status Solidi 6 (1964) 797. Arajs. S., Colvin. R.V.: J. Appl. Phys. 35 (1964) 2424. Clendenen. R.L., Drickamcr, H.G.: J. Phys. Chem. Solids 25 (1964) 865; Phys. Rev. A 135 (1964) 1643. Cowan. D.L.. Anderson, L.W.: Phys. Rev. I35 (1964) A 1046. Doyle, W.D.. Flanders, P.J.: Proc. Int. Conf. Ma&n., Nottingham, Inst. Phys. and Phys. Sot., London
1964. p. 751. Frait. Z.: Brit. J. Appl. Phys. 15 (1964) 993. Frait. Z.. Heinrich, B.: J. Appl. Phys. 35 (1964) 904. Gschneider. K.A., Jr.: Solid State Phys. 16 (1964) 276. Izuyama. T.: Phys. Lett. 9 (1964) 293. Janak. J.F.: Phys. Rev. 134 (1964) A 411. Kouvel. J.S., Hartclius, C.C.: J. Appl. Phys. 35 (1964) 940. Kirichenko, P.I.. Mikryukov, V.E.: Teploliz. Vys. Temp. 2 (1964) 939. Lourens. J.H.J., Albcrts. L.: Solid State Commun. 2 (1964) 141. Moon. R.M.: Phys. Rev. 136 (1964) A 195. Phillips. T.G.. Rosenberg. H.M.: Proc. Int. Conf. Ma&n., Nottingham, Inst. Phys. and Phys. Sot. 1964,
p. 306. Powell. R.W.: Cobalt 24 (1964) 1. Reed. W.A., Fawcctt. E.: Phys. Rev. 136 (1964) A 422; Proc. Int. Conf. Magn., Nottingham, Inst. Phys.
and Phys. Sot. 1964, p. 120. J. Appl. Phys. 35 (1964) 754. Sparks. M.: Ferromagnetic Relaxation Theory, New York: McGraw Hill Inc. 1964. Totskii, E.E.: Teploliz, Vys. Temp. 2 (1964) 205. Vecrman. J., Rathcnau. G.W.: Proc. Int. Conf. Magn., Nottingham, Inst. Phys. and Phys. Sot. 1965. Wertheim. G.W.: Miissbaucr Effect: Principles and Application, New York: Academic Press 1964. Yafet, Y., Jaccarino. V.: Phys. Rev. 133 (1964) A 1630. Arajs. A.: J. Appl. Phys. 36 (1965) 1136. Bundy. F.P.: J. Appl. Phys. 36 (1965) 616. Blackburn. L.D., Kaufman, L., Cohen. M.: Acta Mctall. 13 (1965) 533. Braun. M.. Kohlhans. R.: Phys. Status Solidi 12 (1965) 429. Cowan. D.L.. Anderson. L.W.: Phys. Rev. A 139 (1965) 424. Calvin. R.V., Arajs. S.: J. Phys. Chcm. Solids 26 (1965) 435. Dixon. M.. Hoare. F.E., Holden, T.M., Moody, D.E.: Proc. R. Sot. London Ser. A 285 (1965) 561. Freeman. A.J.. Watson. R.E.: Magnetism IIA (Rado, G.T., Suhl, H., eds.), New York: Academic Press
1965. p. 167. Lochner. R.P., Geschwind. S.: Phys. Rev. 139 (1965) A 991. Londe. R.D.: J. Appl. Phys. 36 (1965) 884. Neimnrk. B.E.. Bykova, T.1.: Inzh. Fiz. Zh. 8 (1965) 361. Panel. R.E., Stansbury, E.E.: J. Phys. Chcm. Solids 26 (1965) 757. Powell. R.W.. Tye. R.P., Hickman, M.J.: Int. J. Heat Mass Transfer 8 (1965) 679.
References for 1.1.2 137
65Rl 65R2 65Sl 6582 65Wl 66Fl 66Jl 66Hl 66Kl 66Ll 66Ml 66M2 66Pl 66Sl 6682 6633 66Wl 66W2 67Al 67A2 67Bl 67B2 67Cl 67Dl 67Hl 6711 6712 67Kl
67K2 67K3 67K4 67Ml 6701 67Pl
67Sl 67Tl 67T2 68Al 68Bl 68Cl 68C2 68Dl 68Fl 68Gl 68Kl 68L1 68Ml 68Rl 68Sl 6882 6883 6834 68Wl 68W2 68W3 6821
Rodbell, D.S.: Physics 1 (1965) 279. Radhakrishna, P., Nielsen, M.: Phys. Status Solidi 11 (1965) 111. Shirley, D.A., Westerbarger, G.A.: Phys. Rev. 138 (1965) A 170. Stoelinga, J.H.M., Gersdorf, R., DeVries, G.: Physica 31 (1965) 349. White, G.K.: Proc. Phys. Sot. 86 (1965) 159. Fulkerson, W., Moore, J.P., McElroy, D.L.: J. Appl. Phys. 37 (1966) 2639. Jaccarino, V., Kaplan, N., Walstedt, R.E., Wernick, J.H.: Phys. Lett. 23 (1966) 514. Heinrich, B., Frait, Z.: Phys. Status Solidi 16 (1966) K 11. Klein, H.-P., Kneller, E.: Phys. Rev. 144 (1966) 372. Lord, A.E., Beshers, D.N.: J. Appl. Phys. 36 (1966) 1620. Mao, H.-K., Bassett, W.A., Takahashi, T.: J. Appl. Phys. 37 (1966) 272. Mook, H.A.: Phys. Rev. 148 (1966) 495. Phillips, T.G.: Proc. R. Sot. London Ser. A 292 (1966) 224. Stearns, M.B.: Phys. Rev. 147 (1966) 439. Scott, G.G.: Phys. Rev. 148 (1966) 525. Shull, C.G., Mook, H.A.: Phys. Rev. Lett. 16 (1966) 184. Walstedt, R.E., Jaccarino, V., Kaplan, N.: J. Phys. Sot. Jpn. 21 (1966) 1843. Wakoh, S., Yarnashita, J.: J. Phys. Sot. Jpn. 21 (1966) 1712. d’Ans-Lax: Taschenbuch fur Chemiker und Physiker (Lax, E., ed.), Berlin, Heidelberg: Springer 1967. Alperin, H.A., Steinvoll, O., Nathans, R., Shirane, G.: Phys. Rev. 154 (1967) 508. Benninger, G.N., Pavlovic, A.S.: J. Appl. Phys. 38 (1967) 1325. Blat& F.J., Flood, D.J., Rowe, V., Shroeder, P.A., Cox, J.E.: Phys. Rev. Lett. 18 (1967) 395. Caglioti, G., Cooper, M.J., Minkiewicz, V.J.: J. Appl. Phys. 38 (1967) 1245. Dheer, P.N.: Phys. Rev. 156 (1967) 637. Hodges, L., Stone, D.R., Gold, A.V.: Phys. Rev. Lett. 19 (1967) 655. Ingalls, R.: Phys. Rev. 155 (1967) 157. Ingalls, R., Drickamer, H.G., DePasquah, G.: Phys. Rev. 155 (1967) 165. Kraftmakher, V.A., Romashina, T.Y.: Fiz. Tverd. Tela 9 (1967) 1851; Sov. Phys. Solid State 9 (1967)
1459. Kohlhaas, R., Dunner, P., Schmitz-Pranghe, N.: Z. Angew. Phys. 23 (1967) 245. Kierspe, W., Kohlhaas, R., Gonska, H.: Z. Angew. Phys. 24 (1967) 28. Kadena, Y.: J. Sci. Hiroshima Univ. Ser. AI1 31 (1967) 21. Muller, S., Dunner, P., Pranghe, N.S.: Z. Angew. Phys. 22 (1967) 403. Orr, R.L., Chipman, J.: Trans Met. Sot. AIME 239 (1967) 630. Pickart, S.J., Alperin, H.A., Minkiewicz, V.J., Nathans, R., Shirane, G., Steinsvoll, 0.: Phys. Rev. 156
(1967) 623. Stearns, M.B.: Phys. Rev. 162 (1967) 496. Tajima, K., Chikazumi, S.: Jpn. J. Appl. Phys. 6 (1967) 897. Tsui, D.C.: Phys. Rev. 164 (1967) 669. Aubert, G.: J. Appl. Phys. 39 (1968) 504. Braun, M., Kohlhaas, R., Vollmer, 0.: Z. Angew. Phys. 25 (1968) 365. Clark, A.F.: Cryogenics 8 (1968) 231. Connolly, J.W.D.: Int. J. Quantum Chem. 11s (1968) 257. Danan, H., Herr, A., Meyer, A.J.P.: J. Appl. Phys. 39 (1968) 669. Franse, J.J.M., deVries, G.: Physica 39 (1968) 477. Gengnagel, H., Hofmann, U.: Phys. Status Solidi 29 (1968) 91. Krinchik, G.S., Artem’es, V.A.: Sov. Phys. JETP 26 (1968) 1080. Lease, J., Lord, A.E.: J. Appl. Phys. 39 (1968) 3986. Moyzis, J.A., Jr., Drickamer, H.G.: Phys. Rev. 171 (1968) 389. Ruvalds, J., Falicov, L.M.: Phys. Rev. 172 (1968) 508. Southwell, W.H., Decker, D.L., Vanfleet, H.B.: Phys. Rev. 171 (1968) 354. Stringfellow, M.W.: J. Phys. C (Proc. Phys. Sot.) l(2) (1968) 950. Shirane, G., Minkiewicz, V.J., Nathans, R.: J. Appl. Phys. 39 (1968) 383. Stark, R.W., Tsui, D.C.: J. Appl. Phys. 39 (1968) 1056. Wakoh, S., Yamashita, J.: J. Phys. Sot. Jpn. 25 (1968) 1272. Williams, G.M., Pavlovic, A.S.: J. Appl. Phys. 39 (1968) 571. Wilkes, K.E.: Thesis, Purdue Univ. Lafayette, In. 1968. Zinovev, V.F., Krentsis, R.P., Petrova, L.N., Gel’d, P.V.: Fiz. Met. Metalloved. 26 (1968) 60.
Landolt-Bbmstein New Series 111/19a

13s References for 1.1.2
69BI 69C 1 69Fl
69F2 69H 1 695 1 6952 69K I 69K2 69 h1 1 69 M 2 69 M 3 69s I 69S2 69S3 69S4 69-l-l 69V 1 69Y1 70BI 70D1 70Fi 7051 70R 1 70R2 70R3 7OSl 7os2 70Tl 70 w 1 70 w 2 7021 7022 71Al 71A2 71Bl 71Cl 71C2 71c3 71Dl 71 D2 71Fl 71 F2 71Gl 71G2 71Ll 71 L2 71Ml 71 hI2 71M3 71Sl 71s2 71s3 71s4 71S6 71T1 71Vl
Bhagat, S.M., Chicklis, E.P.: Phys. Rev. 178 (1969) 828. Collins. M.F., Minkiewicz. V.J., Nathans, R., Passel, L., Shirane, R.: Phys. Rev. 179 (1969) 417. Foncr. S., Freeman. A.J., Blum, N.A., Frankel, R.B., McNiff, E.J., Praddaude, H.C.: Phys. Rev. 181
(1969) 863. Fransc. J.J.M.: PhD Thesis, University of Amsterdam, The Netherlands 1969. Hubert, A., Unger, W., Kranz, J.: Z. Physik 224 (1969) 148. Jain. SC.. Narayan, V., Gocl, T.C.: Br. J. Appl. Phys. 2 (1969) 101. Jackson. P.J., Saunders. N.H.: J. Sci. Instrum. 2 (1969) 939. Kaul. R.. Thompson, E.D.: J. Appl. Phys. 40 (1969) 1383. Koster. E., Turrcll. B.G.: Can. J. Phys. 47 (1969) 1231. Minkiewicz. V.J.. Collins. M.F., Nathans, R., Shirane, G.: Phys. Rev. 182 (1969) 624. Millet. L.E.. Decker, D.L.: Phys. Lett. 29A (1969) 7. Mook. H.A., Nicklow, R.M., Thompson, E.D., Wilkinson, M.K.: J. Appl. Phys. 40 (1969) 1450. Stoclinga. J.H.M., Gersdorf, R., deVrics, G.: Physica 41 (1969) 457. Stearns. M.B.: Phys. Rev. 187 (1969) 648. Schrodcr. K.. Giannuzzi. A.: Phys. Status Solidi 34 (1969) K 133. Shiga. M., Pells. G.P.: J. Phys. C 2 (1969) 1847. Tangc. H., Tokunaga, T.: J. Phys. Sot. Jpn. 27 (1969) 554. Vcdernikov. M.V.: Adv. Phys. 18 (1969) 337. Yoshino, T., Tanaka. S.: Opt. Commun. 1 (1969) 149. Bancroft. M.H.: Phys. Rev. B2 (1970) 182. Du Tremotet De Lachcisserie, E.: Ann. Phys. (Paris) 5 (1970) 267. Franse. J.J.M., Stolp, M.: Phys. Lett. 32A (1970) 316. Johanson. G.J., McGirr, M.B., Wheeler, D.A.: Phys. Rev. Bl (1970) 3208. Rotter. M., Sedlak. B.: Czech. J. Phys. B20 (1970) 1285. Reeves. G.K., Street. R.. Wilson, G.V.H.: J. Phys. C 3 (1970) S230. Resibois. R.. Piette. C.: Phys. Rev. Lett. 24 (1970) 514. Sievert, J.D., Zehler. V.: Z. Angew. Phys. 30 (1970) 251. Shaw, E.D.: Phys. Rev. B 2 (1970) 2746. Trussel. C.W., Christopher, J.E., Coleman, R.V.: J. Appl. Phys. 41 (1970) 1424. Wilson. G.V.H., Perczuk. B., Reeves, G.K.: J. Phys. C 3 (1970) S241. Wakoh, S.. Yamashita, J.: J. Phys. Sot. Jpn. 28 (1970) 1151. Zornberg. E.I.: Phys. Rev. B 1 (1970) 244. Zumsteg. F.C., Parks, R.D.: Phys. Rev. Lett. 24 (1970) 520. Asik. J.R., Stearns, M.B.: Bull. Am. Phys. Sot. 16 (1971) 403. Anders. W., Bastian. D., Biller, E.: Z. Angew. Phys. 32 (1971) 12. Bower, D.I.: Proc. R. Sot. London Ser. A 326 (1971) 87. Cranglc. J.. Goodman, G.M.: Proc. R. Sot. London Ser. A 321 (1971) 477. Chornik. B.: Phys. Rev. B 4 (1971) 681. Connelly, D.L., Loomis. J.S., Mapother, D.E.: Phys. Rev. B3 (1971) 924. Duff, K.J., Das, T.P.: Phys. Rev. B3 (1971) 192, 2294. Du Plessis. P. De V., Viljocn, P.E., Albcrts, L.: J. Phys. F 1 (1971) 328. Feldman. D., Kirchmayr, H.R., Schmolz, A., Velicescu, M.: IEEE Trans. Magn. Mag. 7 (1971) 61. Franse. J.J.M.: J. Phys. Paris C l-32 (1971) 187. Gilts. P.M., Longenbach. M.H., Marder, A.R.: J. Appl. Phys. 42 (1971) 4290. Gold. A.V., Hodges. L., Panousis, P.T., Stone, D.R.: Int. J. Magn. 2 (1971) 357. Lee. E.W., Asgar, M.A.: Proc. R. Sot. London Ser. A 326 (1971) 73. LeGall. H.. Jamet. J.P.: Phys. Status Solidi (b) 46 (1971) 467. Major. J., Mezci. F., Nagy, E., Svab, E., Ticky, G.: Phys. Lett. 35A (1971) 377. Moon, R.M.: Int. J. Magn. l(1971) 219. Maglic. R., Mueller, F.M.: Int. J. Magn. 1 (1971) 289. Stearns. M.B.: Phys. Rev. B4 (1971) 4069. Stearns. M.B.: Phys. Rev. B4 (1971) 4081. Stearns. M.B., Ullrich, J.F.: Phys. Rev. B4 (1971) 3825. Streever, R.L., Caplan. P.J.: AIP Conf. Proc. 5 (1971) 1185. Schneider, C.S., Shull, C.G.: Phys. Rev. B3 (1971) 830. Tang, S.H.. Craig, P.P., Kitchens, T.A.: Phys. Rev. Lett. 27 (1971) 593. Violet. C.E.. Pipkorn, D.N.: J. Appl. Phys. 42 (1971) 4339.
References for 1.1.2 139
71Wl 72Al 72Bl 72B2 72B3 72B4 72Dl 72Hl 7211 72Kl 72Ll 72L2 72Rl 72R2 72Sl 7282 72Wl 73Al 73A2 73Bl 73B2 73B3 73Cl 73El 73Gl 73Ll 73Ml 73M2 73M3 73M4 7301 73R 1 7382 7383 73Tl 74Bl 74Dl 74El 74Gl 7451 74Kl 74Ll 74Ml
74Sl 7432 7483 74Tl 74Vl 74Wl 75Al 75A2
75Bl 75Cl 7.5Dl 75Jl 75Ll
Wright, J.G.: Philos. Mag. 24 (1971) 217. Aldred, A.T., Froehle, P.H.: Int. J. Magn. 2 (1972) 195. Bhagat, S.M., Rothstein, M.S.: Solid State Commun. 11 (1972) 1535. Butler, M.A., Wertheim, G.K., Buchnan, D.N.E.: Phys. Rev. B5 (1972) 990. von Barth, U., Hedin, L.: J. Phys. C 10 (1972) 1629. Briane, M.: C.R. Acad. Sci. Ser. B275 (1972) 673. Dever, D.J.: J. Appl. Phys. 43 (1972) 3293. Hafen, G., Bromer, H., Schwink, Ch.: Int. J. Magn. 3 (1972) 59. Ishida, S.: J. Phys. Sot. Jpn. 33 (1972) 369. Kawakami, M., Hihara, T., Koi, Y., Wakiyama, T.: J. Phys. Sot. Jpn. 33 (1972) 1591. Leger, J.M., Loriers-Susse, C., Vodar, B.: Phys. Rev. B 6 (1972) 4250. Laubitz, M.J., Matsumura, T.: Can. J. Phys. 50 (1972) 196. Rosenman, I., Batallan, F.: Phys. Rev. B5 (1972) 1340. Rebouillat, J.P.: Thesis Grenoble 1972. Stearns, M.B.: AIP Conf. Proc. No. 10 (1972) 1644. Stearns, M.B.: unpublished. Williamson, D.L., Bukshpan, S., Ingalls, R.: Phys. Rev. B6 (1972) 4194. Alder, H., Campagna, M., Siegmann, H.C.: Phys. Rev. B8 (1973) 2075. Anderson, J.R., Hudak, J.J., Stone, D.R.: AIP Conf. Proc. No. 10 (1973) 46. Baraff, D.R.: Phys. Rev. B8 (1973) 3439. Briane, M.: C.R. Acad. Sci. Paris 276 (1973) 3789. Butler, M.A.: Int. J. Magn. 4 (1973) 131. Coleman, R.V., Morris, R.C., Sellmyer, D.J.: Phys. Rev. B8 (1973) 317. Escudier, P.: Thesis, Grenoble, quoted in [80 W]. Goy, P., Grimes, C.C.: Phys. Rev. B7 (1973) 299. Laubitz, M.J., Matsumura, T.: Can. J. Phys. 51 (1973) 1247. Mook, H.A., Nicklow, R.M.: Phys. Rev. B7 (1973) 336. Mook, H.A., Lynn, J.W., Nicklow, R.M.: Phys. Rev. Lett. 30 (1973) 556. Moriya, T., Kawabata, A.: J. Phys. Sot. Jpn. 34 (1973) 639; 35 (1973) 669. Majumda, A.K., Berger, L.: Phys. Rev. B 7 (1973) 4203. Onoprienko, L.G., Shiryaeva, O.I., Shur, Y.S.: Sov. Phys. Solid State 15 (1973) 757. Riedi, P.C.: Phys. Rev. BS (1973) 5243. Streever, R.L., Caplan, P.J.: Phys. Rev. B7 (1971) 4052. Stearns, M.B.: Phys. Rev. B 8 (1973) 4383. Tedrow, P.M., Meservey, R.: Phys. Rev. B7 (1973) 318. Bhagat, SM., Lubitz, P.: Phys. Rev. B 10 (1974) 179. Donohue, J.: The Structure of the Elements, New York: J. Wiley&Sons Ltd. 1974. El-Hanany, U., Warren, W.W.: Bull. Am. Phys. Sot. 19 (1974) 202. Gold, A.V.: J. Low Temp. Phys. 16 (1974) 3. Johnson, P.B., Christy, R.W.: Phys. Rev. B9 (1974) 5056. Klaffiy, R.W., Coleman, R.V.: Phys. Rev. B 10 (1974) 2915. Lederman, F.L., Salamon, M.B.: Phys. Rev. B9 (1974) 2981. Mook, H.A., Lynn, J.W., Nicklow, R.M.: AIP Conf. Proc. 18, American Institute of Physics 1974,
p. 781. Stearns, M.B.: Phys. Rev. B9 (1974) 2311. Song, C., Trooster, J., Benczer-Koller, N.: Phys. Rev. B 9 (1974) 3854. Shacklette, L.W.: Phys. Rev. B 9 (1974) 3789. Tokunaga, T.: J. Sci. Hiroshima Univ. 38A (1974) 215. Van der Woude, F., Sawatzky, G.A.: Phys. Lett. 12C (1974) 335. Wang, C.S., Callaway, J.: Phys. Rev. B 9 (1974) 4897. Aldred, A.T.: Phys. Rev. B 11 (1975) 2597. Anderson, J.R., Heiman, P., Schirber, J.E., Stone, D.R.: AIP Conf. Proc. No. 29, Mag. Magn. Mater.
(1975) 529. Batallan, F., Rosenman, I., Sommers, C.B.: Phys. Rev. B 11 (1975) 545. Coleman, R.V.: AIP Conf. Proc. No. 29 (1975) 520. Duff, K.J., Das, T.P.: Phys. Rev. B 12 (1975) 3870. Johnson, P.B., Christy, R.W.: Phys. Rev. Bll (1975) 1315. Lynn, J.W.: Phys. Rev. B 11 (1975) 2624.
Landoll-BBmstein New Series III/l9a
Stearns
140 References for 1.1.2
75Sl 76Al 76A2 76E1 76F 1
76Gl 76G2 76Ll 76Ml 76s I 76S2 76 W 1 77Al 77Bl 77B2 77Cl 77E 1 77Gl 77H 1 77K 1 77 K 2
77K 3 7701 77R 1 77s1 77s2 77s3 77V! 77 w 1 78E 1 78Gl 78 hl 1
78Sl 78s’ 7833 7s w 1 79Al 79B1
79B2 79F 1 79H 1 7911 795 1 79L 1 79 h,l 1 79 hf 2 79R I 80El SOE:! 80G 1 SOH! 80H2 SOL 1
Singh. M.. Wang. C.S., Callaway, J.: Phys. Rev. B 11 (1975) 287. Amighian. J., Corner. W.D.: J. Phys. F 6 (1976) L 309. Auhcrt. G.. Ayant. Y., Bclorizky, E., Casalegno, R.: Phys. Rev. B 14 (1976) 5314. Eib. W.. Alvarado, S.F.: Phys. Rev. Lett. 37 (1976) 444. Fekete. D., Grayevskey, A.. Shaltiel. D., Goebel, U., Dormann, E., Kaplan, N.: Phys. Rev. Lett. 36
(1976) 1566. Grimval!. G.: Physica Scripta 13 (1976) 59. Gradmann. U., Kummerlc. W., Tillmanns, P.: Thin Solid Films 34 (1976) 249. Laubitz. M.J., Matsumura. T., Kelly, P.J.: Can. J. Phys. 54 (1976) 92. Morovec. T.J., Rift. J.C., Dexter, R.N.: Phys. Rev. B13 (1976) 3297. Stearns, M.B.: Phys. Rev. B 13 (1976) 1183. Stearns. M.B., Feldkamp, L.A.: Phys. Rev. B 13 (1976) 1198. Watson. T.W., Flynn. D.R., Robinson. H.E.: NBS Washington, D.C. 1976, unpublished data. Andersen. O.K.. Madsen, J., Paulsen, U.K., Jepsen, O., Kollar, J.: Physica 86-88 B (1977) 249. Burd. J.. Huq. M.. Lee. E.W.: J. Mag. Magn. Mater. 5 (1977) 135. Birss. R.R., Keeler, G.J., Shepherd, C.H.: Physica 8&88B (1977) 257. Callaway. J.. Wang. C.S.: Phys. Rev. B 16 (1977) 2095. Erskine. J.L.: Physica 89 B (1977) 83. Glinka. C.J.. Minkiewicz. V.J., Passcll, L.: Phys. Rev. B 16 (1977) 4084. Hermanson. J.: Solid State Commun. 22 (1977) 9. Kummerlc. W., Gradmann, U.: Solid State Commun. 24 (1977) 33. Keunc. W., Halbauer. R., Gonser. U., Lauer, J., Williamson, D.L.: J. Appl. Phys. 48 (1977) 2976; J. Mag.
Magn. Mater. 6 (1977) 192. Kollie. T.G.: Phys. Rev. B 16 (1977) 4872. Ono. F.: J. Phys. Sot. Jpn. 43 (1977) 1194. Riedi. P.C.: Phys. Rev. B 15 (1977) 5197. Searle. C.W., Kunkel, H.P., Kupca. S., Maartcnsc, I.: Phys. Rev. B 15 (1977) 3305. Stearns. M.B.: J. Mag. Magn. Mater. 5 (1977) 167. Singa!. C.M.. Das. T.P.: Phys. Rev. B16 (1977) 5068. Vinokurova. L.I.. Gaputchcnko, A.G., ltskcvich, E.S.: JETP Lett. 26 (1977) 317. Wang. C.S.. Callaway, J.: Phys. Rev. B 15 (1977) 298. Eastman. D.E., Him@. F.J.. Knapp, J.A.: Phys. Rev. Lett. 40 (1978) 1514. Gersdorf. R.: Phys. Rev. Lett. 40 (1978) 344. Moruzzi. V.L., Janak. J.F., Williams, A.R.: Calculated Electronic Properties of Metals, New York:
Pergamon Press 1978. Segransan. P.J.: Chabrc. Y., Clark. W.G.: J. Phys. F8 (1978) 1513. Smulowicz. F.. Pcasc, D.M.: Phys. Rev. B 17 (1978) 3341. Stearns. M.B.: Phys. Today 31 (1978) 34. Wohlfarth. E.P.: J. Mag. Magn. Mater. 7 (1978) 113. Anderson. J.R.. Papaconstantopoulos, D.A., Boyer, L.L.. Schirbcr, J.E.: Phys. Rev. B20 (1979) 3172. Brinfcr. A.. Campagna. M.. Fcdcr, R., Gudat, W., Kisker, E., Kuhlmann, E.: Phys. Rev. Lett. 42 (1979)
1705. Blacha. A., Bromer. H.: Verhandl. DPG(VI) 14 (1979) 176. Feldkamp. L.A., Stearns. M.B.. Shinozaki. S.S.: Phys. Rev. B 20 (1979) 1310. Himpsel. F.J., Knapp. J.A.. Eastman, D.E.: Phys. Rev. B 19 (1979) 2919. Ishikawa. Y.: J. Mag. Magn. Mater. 14 (1979) 123. Janak. J.F.: Phys. Rev. B 20 (1979) 2206. Liu. C.M., Ingalls, R.: J. App!. Phys. 50(3) (1979) 1751. McAlister. S.P., Hurd, C.M.: J. Appl. Phys. 50 (1979) 7526. Moriya. T.: J. Mag. Magn. Mater. 14 (1979) 1. Riedi. P.C.: Phys. Rev. B20 (1979) 2203. Eastman. D.E., Himpse!. F.J., Knapp, J.A.: Phys. Rev. Lett. 44 (1980) 95. Ebcrhardt. W., Plummer. E.W.: Phys. Rev. B21 (1980) 3245. Gerhardt. U., Maetz. C.J., Schutz, J., Dietz. E.: J. Mag. Magn. Mater. 15-18 (1980) 1141. Himpsel. F.J., Eastman, D.E.: Phys. Rev. B21 (1980) 3207. Heimann. P., Neddermeyer, H.: J. Mag. Magn. Mater. 15-18 (1980) 1143. Lonzarich. G.G.: Electrons at the Fermi Surface (Springford, ed.), Cambridge: University Press 1980,
ch. 6.
Stearns
References for 1.1.2 141
8001 8OSl 81Cl 81C2 81Hl 81H2 81H3 81 H4 81Kl 81Ll 810 1 81Sl 82Bl 82B2
82Cl 82Ml 82Pl 82P2 82Tl 82T2 82T3 82T4 83Bl 83B2
83Cl 83Dl 83Fl 83Hl 83H2
83Ll 83Pl
83P2 83Rl 83Sl 84Bl 84B2 84Jl 84Ll
84L2 84Pl 84Sl 8482 84Wl 84W2 85Bl 85Cl 85Ml 85M2 85M3 85Sl
Oppelt, A., Kaplan, N., Fekete, D.: J. Mag. Magn. Mater. 15-18 (1980) 660. Shaham, M., Barak, J., El-Hanany, U., Warren, W.W., Jr.: Phys. Rev. B22 (1980) 5400. Clauberg, R., Gudat, W., Kisker, E., Kuhlmann, E., Rothberg, G.M.: Phys. Rev. Lett. 47 (1981) 1314. Cable, J.W.: Phys. Rev. B 23 (1981) 6168. Himpsel, F.J., Heimann, P., Eastman, D.E.: J. Appl. Phys. 52 (1981) 1658. Heimann, P., Himpsel, F.J., Eastman, D.E.: Solid State Commun. 39 (1981) 219. Hanham, S.D., Arrott, AS., Heinrich, B.: J. Appl. Phys. 52 (1981) 1941. Hurd, C.M., Shiozaki, I., McAlister, S.P.: J. Appl. Phys. 52 (1981) 2214. Kiibler, J.: Phys. Lett. 81 A (1981) 81. Lynn, J.W., Mook, H.A.: Phys. Rev. B23 (1981) 198. Ono, F.: J. Phys. Sot. Jpn. 50 (1981) 2564. Steinsvoll, O., Moon, R.M., Koehler, W.C., Windsor, C.G.: Phys. Rev. B24 (1981) 4031. Brown, P.J., Deportes, J., Givord, D., Ziebeck, K.R.A.: J. Appl. Phys. 53(3) (1982) 1973. Brown, P.J., Capellmann, H., Deportes, J., Givord, D., Ziebeck, K.R.A.: J. Mag. Magn. Mater. 30
(1982) 243. Cort, G., Taylor, R.D., Willis, J.O.: J. Appl. Phys. 53 (1982) 2064. Maetz, C.J., Gerhardt, U., Dietz, E., Ziegler, A., Jelitto, R.J.: Phys. Rev. Lett. 48 (1982) 1686. Pauthenet, R.: J. Appl. Phys. 53 (1982) 2029 and 8187: C.R. Acad. Sci. Ser. B295 (1982) 331, 1067. Pauthenet, R., Picoche, J.C., Rub, P.: C.R. Acad. Sci. Ser. B295 (1982) 121, 331, 1069. Turner, A.M., Erskine, J.L.: Phys. Rev. B25 (1982) 1983. Treglia, G., Ducastelle, F., Spanjaard, D.: J. Physique 43 (1982) 341. Taylor, R.D., Cort, G., Willis, J.O.: J. Appl. Phys. 53 (1982) 8199. Tung, C.J., Said, I., Everett, G.E.: J. Appl. Phys. 53 (1982) 2044. Bagayoko, D., Callaway, J.: Phys. Rev. B28 (1983) 5419. Brown, P.J., Capellmann, H., Deportes, J., Givord, D., Ziebeck, K.R.A.: J. Mag. Magn. Mater. 31-34
(1983) 295. Callaway, J., Chatterjee, A.K., Singhal, S.P., Ziegler, A.: Phys. Rev. B28 (1983) 3818. Du Tremolet de Lacheisserie, E., Mendia Monterroso, R.: J. Mag. Magn Mater. 31-34 (1983) 837. Feder, R., Gudat, W., Kisker, E., Rodriguez, A., Schroder, K.: Solid State Commun. 46 (1983) 619. Halbauer, R., Gonser, U.: J. Mag. Magn. Mater. 35 (1983) 55. Hopster, H., Raue, R., Guntherodt, G., Kisker, E., Clauberg, R., Campagna, M.: Phys. Rev. Lett. 51
(1983) 829. Lynn, J.W.: Phys. Rev. B 11 (1983) 6550. Pauthenet, R.: Conf. on High Field Magn. (Date, M., ed.), Amsterdam: North-Holland Publ. Co. 1983,
p. 77. Pauthenet, R.: C. R. Acad. Sci. Paris V 297(II) (1983) 13. Raue, R., Hopster, H., Clauberg, R.: Phys. Rev. Lett. 50 (1983) 1623. Steinsvoll, O., Majkrzak, C.F., Shirane, G., Wicksted, J.: Phys. Rev. Lett. 51 (1983) 300. Benczer-Koller, N.: private communication. Brown, P.J., Ziebeck, K.R.A., Deportes, J., Givord, D.: J. Appl. Phys. 55(6) (1984) 1881. Jarlborg, T., Peter, M.: J. Mater. 42 (1984) 89. Loong, C.-K., Carpenter, J.M., Lynn, J.W., Robinson, R.A., Mook, H.A.: J. Appl. Phys. 55(6) (1984)
1895. Lonzarich, G.G.: J. Mag. Magn. Mater. 45 (1984) 43. Paige, D.M., Szpunar, B., Tanner, B.K.: J. Mag. Magn. Mater 44 (1984) 239. Shirane, G., Steinsvoll, O., Uemura, Y.J., Wicksted, J.: J. Appl. Phys. 55(6) (1984) 1887. Steinsvoll, O., Majkarzah, CF., Shirane, G., Wicksted, J.P.: Phys. Rev. B 30 (1984) 2377. Wicksted, J.P., Shirane, G., Steinsvoll, 0.: Phys. Rev. B 29 (1984) 488; J. Appl. Phys. 55 (1984) 1893. Wicksted, J.P., Biini, P., Shirane, G.: Phys. Rev. B30 (1984) 3655. Boni, P., Shirane, G., Wicksted, J.P., Stassis, C.: Phys. Rev. B31 (1985) 4597. Cooke, J.F., Blackman, J.A., Morgan, T.: Phys. Rev. Lett. 54 (1985) 718. Mook, H.A., McPaul, D.: Phys. Rev. Lett. 54 (1985) 227. Mook, H.A., Lynn, J.W.: J. Appl. Phys. 57 (1985) 3006. Murani, A.P.: unpublished. Stearns, M.B.: J. Appl. Phys. 57 (1985) 3030.
Land&-BBmstein New Series lWl9a
Stearns
142 1.2.1 Fe Co Ni: introduction [Ref. p. 274
1.2 Alloys between 3d elements
1.2.1 Alloys between Fe, Co or Ni
Introduction
In this section the magnetic properties of binary and ternary alloys between the elements Fe, Co or Ni are given. as well as the influence ofsmall amounts ofothcr elements (designated by X in the Survey) on the properties of the alloys. Nonmagnetic properties arc given in as far as they depend on the magnetic state of the alloy. Secondary mn_rnetic properties like permeability, coercive force, hysteresis losses, etc., which depend to a large degree on the preparation technique. crystal size. and on the various treatments of a polycrystalline sample. can be found in subvolume 19d dealing with the properties of technically applied magnetic materials.
Fe Co system
In Fi_g. I the equilibrium phase diagram of the Fc-Co system is rcproduccd [82 K 11. The equintomic alloy FcCo shows a CsCI type ordering. The phase boundary between the Co-rich fee phases
(~-CO) and hcp phases (E-CO) is shown in Fig. 2. The uncertainty for very low Fe concentrations reflects the variation in the experimental results. The crystal structures of the hcp phases arc shown in Fig. 3. The lattice constants and related properties arc given in Figs. 4 and 5.
Fe -Ni system
In Fig. 6 the equilibrium phase diagram of the Fe-Ni system is reproduced [82K 11. For the mnznctic propcrtics at room tempcraturc the preparation technique of the alloy is of prime
importance. For Fe-rich alloys the transformation of the cubic crystal structure from bee to fee, the y-y transition, has a
pronounced temperature hysteresis. see Fig. 7 [SS H 1). This diffusionless mnrtcnsitic transition is supprcsscd even at liquid-He tempcraturcs in an alloy consisting of
small particles [62K 11. Also minor substitutions with a third kind of atom. e.g. Si, or by the addition of interstitial atoms. e.g. C or N, the fee phase can bc more or less stabilized in the cooling process.
Thin films with 20...40 at% Ni have after deposition the bee structure, but they can bc transformed to the fee lattice as a result of heating [67 S2], which gives a possibility to study the magnetic propcrtics of bee and fee Fe, -,Ni, alloys in the same composition range.
Alloys having a composition around about 25 at% Ni have not been established as a stable Fe,Ni compound. nor has a supcrlattice been found. Morcovcr alloys with about 20,..35at% Ni are in a metastable state. Their magnetic propcrtics, which have been and arc still the subject of cxtendcd investigations, dcpcnd to a high degree on the distribution of Ni and Fe atoms in the alloy [79 G 11. Their very low thermal expansion coeflicient: lirst indication [l897G I]. and the almost temperature-independent elastic coefficients, first indication [20G 11, of these alloys at room temperature arc the basis for the technically important Invar and Elinvar alloys, rcspectivcly. These propcrtics arc lossed when the mctastablc “invar” state is destroyed, for instance by electron irradiation at temperatures up to about 250 ‘C. The alloy distintegrates into two phases, a Ni-rich FeNi and a Fe- rich Fc,Ni phase [79 C 11. The magnetic propcrtics of the y-phase can be examined in the residual austenite by means of neutron diffraction experiments. Coexistence of ferromagnetism and antiferromagnetism at low temperature is then established in invar Fc-Ni alloys [SOY 11.
The alloy FeNi, and alloys in a wide composition range around this point can bc obtained with the atoms ordered in a Cu,Au-type superlatticc crystal structure when appropriate annealing and cooling cycles are applied. SW Figs. 8a. b and 9. The supcrstructurc is stabilized by atoms like Si and Mn [69G I] and by Ge [70G I]. it is destroyed by additions of Cr or MO [69G 1] and by Cu [70G 11.
The FeNi, alloys form the basis for the technically very important Permalloys, which have abnormally high magnetic susceptibilities at room tempcraturc. first indication [lo P 11, according to [51 B I].
The alloy FeNi can be in an ordcrcd state with the AuCu structure.
Co-Ni system
In Fig. 17 the equilibrium phase diagram of the Co-Ni system is reproduced [58 H 11. Lattice constants and related propcrtics arc given in Fig. 18.
Bonnenberg, Hempel, Wijn
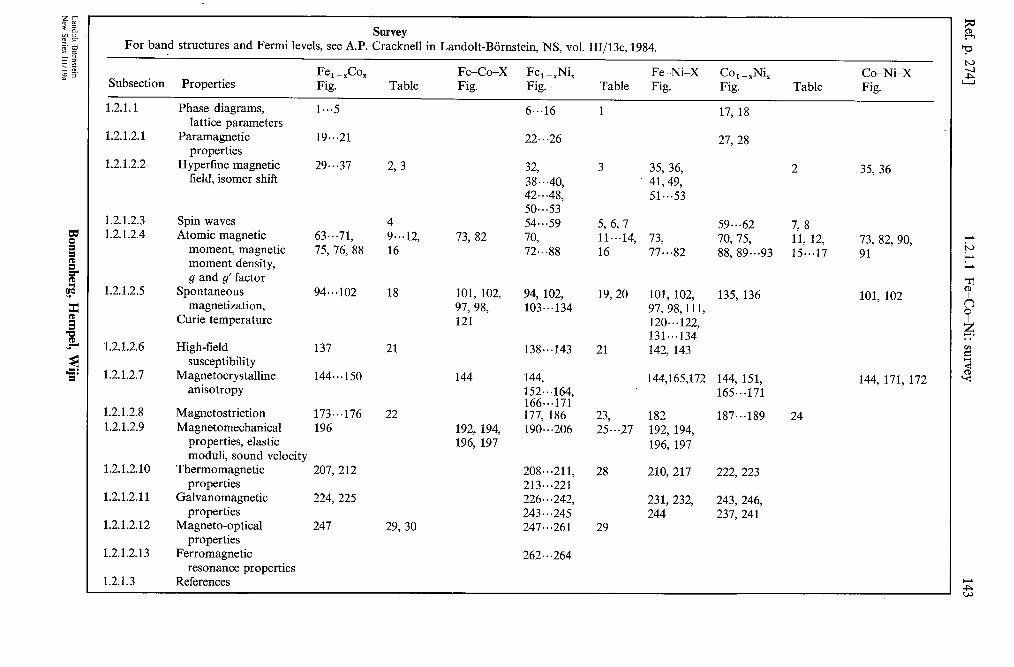
Survey For band structures and Fermi levels, see A.P. Cracknell in Landolt-Bornstein, NS, vol. 111/13c, 1984.
Fe, -.Jo, Fe-Co-X Fe, -,Ni, Subsection
Fe-Ni-X Co,-,Ni, Properties
Co-Ni-X Fig. Table Fig. Fig. Table Fig. Fig. Table Fig.
1.2.1.1 Phase diagrams, 1...5 6...16 1 lattice parameters
17, 18
1.2.1.2.1 Paramagnetic 19...21 22...26 27,28 properties
1.2.1.2.2 Hypertine magnetic 29...37 2, 3 32, 3 35, 36, 2 field, isomer shift
35, 36 38...40, I 41,49, 42...48, 51*..53
1.2.1.2.3 50...53
Spin waves 4 1.2.1.2.4
54...59 5, 6, 7 Atomic magnetic
59...62 63...71,
7, 8 9...12, 73, 82 70, 11...14, 73, 70, 75, 11, 12, 73, 82, 90,
moment, magnetic 75, 76, 88 16 72...88 16 77...82 88, 89...93 15...17 91 moment density, g and g’ factor
1.2.1.2.5 Spontaneous 94...102 18 101, 102, 94, 102, 19,20 101, 102, 135, 136 101, 102 magnetization, 97, 98, 103...134
Curie temperature 97, 98,111,
121 120...122,
1.2.1.2.6 131...134
High-field 137 21 138...143 21 142, 143 susceptibility
1.2.1.2.7 Magnetocrystalline 144...150 144 144, 144,165,172 144, 151, 144, 171, 172 anisotropy 152...164, 165...171
1.2.1.2.8 Magnetostriction 166...171
173...176 22 177, 186 23, 182 1.2.1.2.9
187...189 24 Magnetomechanical 196 192, 194, 190...206 25...27 192, 194,
properties, elastic 196, 197 196, 197 moduli, sound velocity
1.2.1.2.10 Thermomagnetic 207, 212 208...211, 28 210, 217 222, 223 properties 213...221
1.2.1.2.11 Galvanomagnetic 224,225 226.. .242, 231, 232, 243, 246, properties 243.‘.245
1.2.1.2.12 244 237,241
Magneto-optical 247 29, 30 247...261 29 properties
1.2.1.2.13 Ferromagnetic 262.. .264 resonance properties
1.2.1.3 References

144 1.2.1.1 Fc--Co-Ni: phase diagrams, lattice parameters [Ref. p. 274
Fe co - co 17d 10 20 30 1 40 50 I 60 I 70 80 90wt% 100
/, I, / I, , , I, I, I, I Fe - Co s
9 / / I I !’ i
lL95’C
i 65Ol’l. co
"C
1633
1X:
14X
139’ d
12c:
110:
1 1CX
95:
89
7G2
633
535
400
3OL
I
I I I I i’-Fe
lllS’C7
;
/
10 20 30 40 50 60 70 80 90 at%100 Fe
1.2.1.1 Phase diagrams, lattice parameters
Fig. 1, Equilibrium phase diagram of the Fc-Co system. The curves lab&d T, rcprcscnt the ferromagnetic Curie points for the various alloys [82 K I]. T,,: melting point tcmpcraturc.
0 1 2 3 4 5 at% 6 a co Fe - Fig. 2a. Tcmpcraturc hysteresis of the phase boundary between the Co-rich fee phases (y-Co) and hcp phases (E-CO) [82 K I]. Fig. 2b. Phase diagram in the dilute Fc,Co, -I alloy system as dcrivcd from dilatation curves [84 I I].
600 I
“’ FexCol-x o . therm.expansion
0 0 0.01 0.02 0.03 0.04 0.05 0.06
co x-
Bonnenberg, Hempel, Wijn
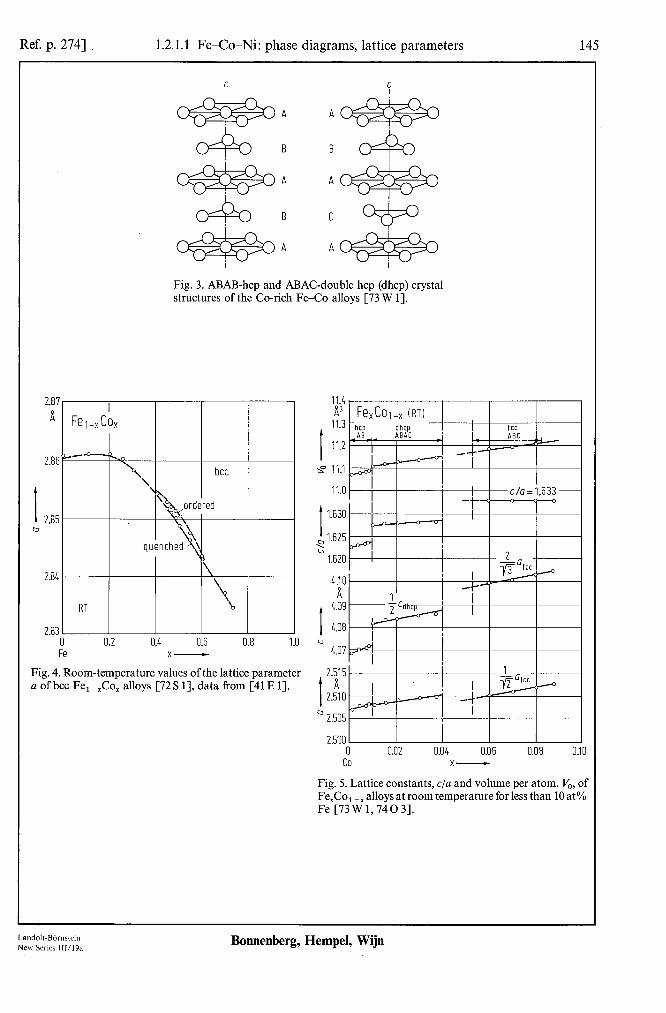
Ref. p. 2741 1.2.1.1 Fe-Co-Ni: phase diagrams, lattice parameters 145
Fig. 3. ABAB-hcp and ABAC-double hcp (dhcp) crystal structures of the Co-rich Fe-Co alloys [73 W 11.
~
bee 2.86
I 2.85 D
2.8L
2.83 0 0.2 OA 0.6 0.8 ’ Fe x-
Fig. 4. Room-temperature values of the lattice parameter a of bee Fe, $o, alloys [72 S 11, data from [41 E 11.
111,
@‘I Fe,Col_l, (RT) I
I “..I hcp dhcp I fee
A0 , ABA1
11.2 - -/ ’ -I A-
l 1” 11.1 I I I I
2.500 I 0 0.02 0.04 0.06 0.08 0
CO x-
Fig. 5. Lattice constants, c/a and volume per atom, V,, of Fe&To, --I alloys at room temperature for less than 10 at% Fe [73W 1,7403].
Land&BBrnstein New Series 111/19a
Bonnenberg, Hempel, Wijn
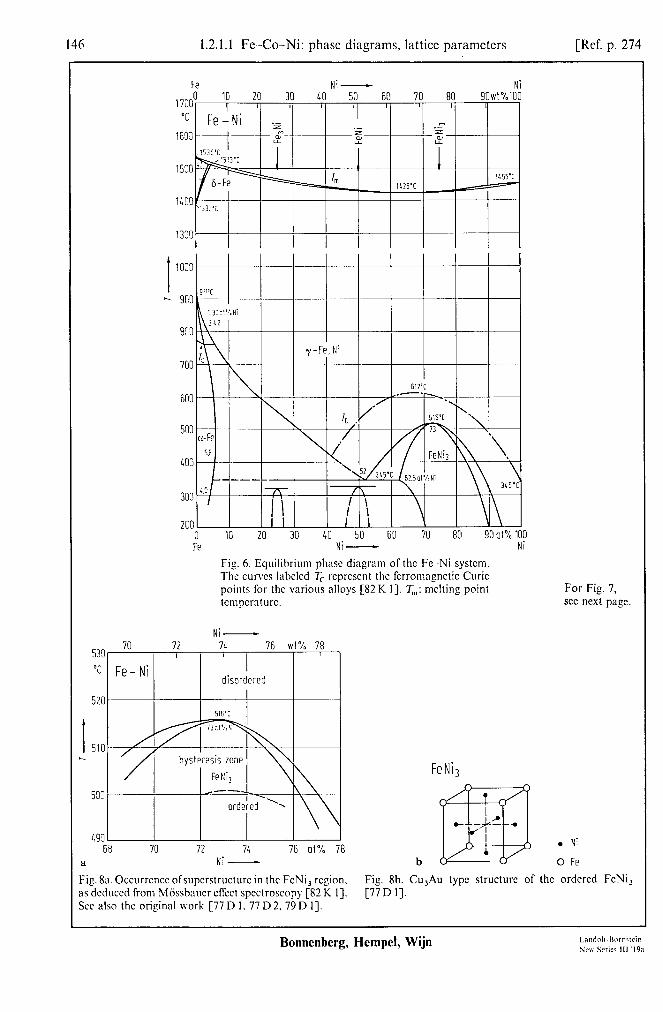
1.2.1. I Fc -Cog--Ni: phase diagrams, lattice parameters [Ref. p. 274
520
I 510 .
693 f
a
fa' 10 20 Ni- Ni
30 LO so fin 70 En 9nw1%inn
I in00
2001 I I I III I 0 10 20 30 co 50 60 70 Fe
\
80 90 0t% in0 Ni- Ni
Fig. 6. Equilibrium phnsc diagram of the Fe -Ni system. The ct~rvcs labeled Tc rcprcscnt the fcrromagnctic Curie points for the various alloys [82 K I]. T,: melting point tempcralurc.
Ni-
70 72 71 76 ot% 78 Ni - b
FeNi
For Fig. 7, xc next page.
. Ni
0 Fe
Fig. 83. Occurrcncc ofsupcrstructurc in the FcNi, region. Fig. 8b. Cu,Au type structure of the ordered FeNi, as dcduccd from Miisshnucr cffcct spectroscopy [82 K I]. [77 D I]. SW also the original work [77 D I. 77 D 2. 79 D I].
Bonnenberg, Hempel, Wijn

Ref. p. 2741 1.2.1.1 Fe-Co-Ni: phase diagrams, lattice parameters 147
Fe Ni- ,oooO 5 IO 15 20 25 30 wt% 35 I I I I II II
'I 'I
800
-100 \
-200 90%
0 5 IO 15 20 25 30 at% 35 Fe Ni-
Fig. 7. Temperature hysteresis of the cl-y transition of Fe- rich Fe-Ni alloys. The field between the curves I and 3 are the points with more than 90% E- or y-phase when the alloy is heated or cooled through the corresponding temperature range, respectively, as is indicated by the arrows [58 H 11.
750 “C
600
_I
450
300
150
0 300 600 900 1200 h 1500 Annealing time -
Fig. 9. Annealing conditions for the high degree of FeNi, long-range ordering as derived from the order-sensitive magnetocrystalline anisotropy. Curve 1: [53 B 11, 2: [83 H2].
Land&Bbmstein New Series 111/19a
Bonnenberg, Hempel, Wijn

14s 1.2.1.1 FeCo-Ni: phase diagrams, lattice paramctcrs [Ref. p. 274
3.6 1
3< c
3.5
I 3c 0 ‘-
3’
3.:
3.:
\
0.2 0.4 0.6 0.8 1.0
2.86L kX
2.863
I
2.862
0
2.861
2&C I
I 0 0.01 0.02 0.03 0.04 0.05
2.85!
a Fe X- NI 1) te x-
Fiz. IOn. Lattice parameter n at various tcmpcraturcs as Fig. IOh. Lattice paramctcr at room temperature for bee dcpcrtdcnt on the composition of fee Fe,-,Ni, alloys Fe, -,Ni, alloys. Upper broken line: Vegard’s law for a [71S I]. dat:t from [37 0 I ,..3]. hypothetical bee Ni with an interatomic distance equal to
that offcc Ni; lower broken lint: the interatomic distance in Ni is corrcctcd to allow for the contraction due to the change in coordination [55 S 21. 1 kX& 1.002 A.
3.600 H
3.595
I 3.590
0
3.585
3.575 0.21 0.28 0.32 0.36 0.40 0.44 0.18 I
x-
Fig. I I. Room-tcmpcraturc values of the lattice para- mctcrs o of the fee invar-type Fe, -,Ni, alloys before and after irradiation with 2 McV electrons with an intensity of IO’” clcctrons,‘cm2. Solid circles: [4l 0 I]. other symbols: [79 c I].
Bonnenberg, Hempel, Wijn

Ref. p. 2741 1.2.1.1 Fe-Co-Ni: phase diagrams, lattice parameters 149
3.620
3.615
3.610
3.605
I
3.600
0 3.595
3.590
x=0.3.
3.585 /
3.580
0.24
3.570 l-l
4 I . . J . : t l 1
02 - ---3 extrapolation of a J-l.-Ld paromognetic lattice
constant to 15°C
-200 -100 0 100 200 300 400 500 "C 600 T-
Fig. 12. Lattice parameter a offcc Fe, -,Ni, invar alloys as dependent on temperature. Arrows indicate the Curie temperatures. Curves 1: [69A3], 2: [3701...3], 3: extrapolation from the paramagnetic state.
Landolt-BOrnstein New Series III/I%
Bonnenberg, Hempel, Wijn
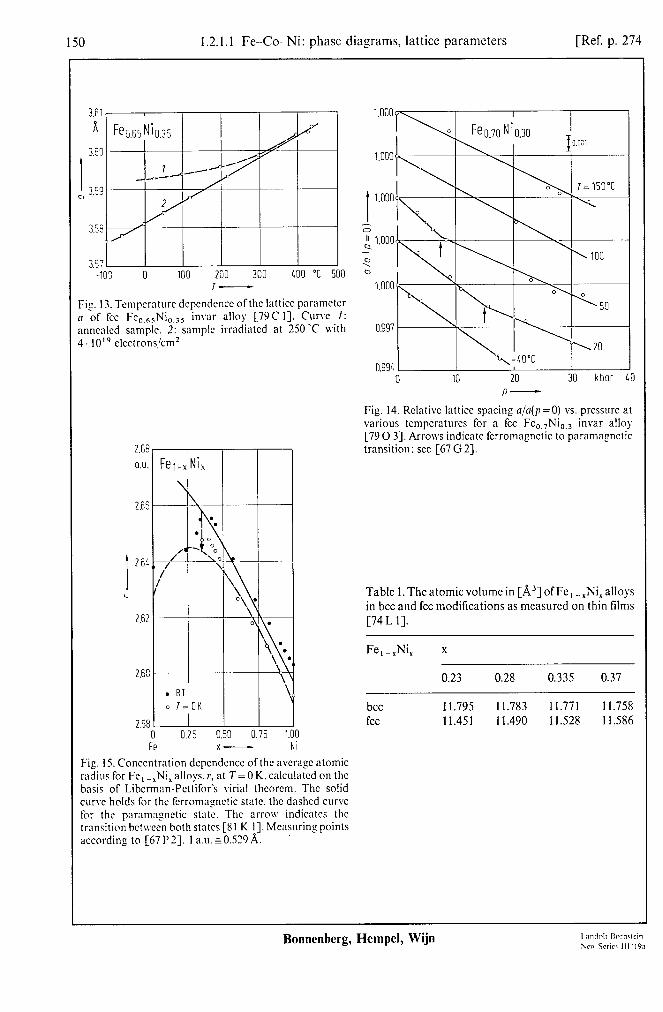
150 1.2.1.1 FeCo--Ni: phase diagrams, lattice parameters [Ref. p. 274
3.61 A
3.5:
I 35 5
3.5s
3.5:
I-
Fig. 13. Tcmperaturc dcpcndcncc ofthc lattice pnrnmctcr !I of fee Fc,,5Ni,,, invnr alloy [79C I]. Curve I: annealed sample. 2: sample irradintcd at 250-C with 1. lOI elcclronskm2
2.6E
O.U.
2.6:
I
2.64
L
2.6;
I- I
)-
i
,-
l-
I-
2.6[
2.5t -0 Fe
. RT \
o I=OK
0.25 0.50 0.75 1 x-
Fig. IS. Concentration dcpcndcncc of the avcragc atomic radius for Fe, -,Ni, alloys. r, at T= 0 K. calculated on the basis of Libcrman-Pcttifor’s virial theorem. The solid curve holds for the fcrromngnctic state. the dashed curve for the paramngnctic state. The arrow indicates lhc transition bctwccn both states [8l K I]. Measuring points according to [67P 21. I a.u.~O.529 A.
" 1.000, -4 ? CJ
1.000~
0.997
0.991 0 10 20 30 kbor
Fig. 14. Relative lattice spacing ala(p=O) vs. pressure at various tcmpcraturcs for a fee Fc,,,Ni,,, invar allo) [790 33. Arrows indicate fcrromagnctic to paramqnctic transition; xc [67 G 23.
Table 1. The atomic volume in [A31 of Fe, -,Ni, alloys in bee and fee modifications as measured on thin films [74 L 11.
Fe,-,Ni, x
0.23 0.28 0.335 0.37
bee 11.795 11.783 1 I.771 11.758 fee 11.451 11.490 11.528 11.586
Bonnenberg, Hempel, Wijn

Ref. p. 2741 1.2.1.1 Fe-Co-Ni: phase diagrams, lattice parameters 151
16OC “C
12oc
I h 800
400
0
9.0 I
5 Fe,-,Ni, I
/ I
T=-273"C(P+) /
8.6 I I I \/v/ /
?C I I I
0 0.2 0.4 0.6 0.8 1.0 Fe x- Ni
Fig. 16. X-ray densities of Fe,-.Ni, alloys [Sl B 11.
I Ni- 20 40 60 80 wt% 100
1495°C Tm I 1152°C
Co - Ni .L?
1115°C z
. . s
-4c
‘\ I
\
fee -\.
42O’C \.
‘\ ,’
\
\ E 360°C
hcp ‘1, c
\ z
20 40 60 80 at% 100 Ni -
Fig. 17. Equilibrium phase diagram of the Co-Ni system. T,: melting point temperature [SS H 11.
3.540, 3.540 I I I I I kX
3.535
I
3.530
3.525
r
3.520
P 3.51 5oL
!O !O 40 40 60 60 80 80 100 100 Ni co - co
Fig. 18. Lattice parameters of Co-Ni alloys annealed at 900 “C and slowly cooled to room temperature in 14 days [5OTl]. lkX&l.O02A.
Landolt-Bornstein New Series 111/19a
Bonnenberg, Hempel, Wijn

152 1.2.1.2.1 Fe-Co-Ni: paramagnetic properties [Ref. p. 274
1.2.1.2 Magnetic properties
1.2.1.2.1 Paramagnetic properties
4.5 40' 9
3 4.0
3.5
3s
I 2.:
T,-
2s
1:
1.
0.
/ ‘elex Cox
y-w , I 'x = 0.073
a I-
Fig. 19a. Tempcraturc dcpcndcncc of the invcrsc para- magnetic mass susceptibility 1; ’ of Fc, -.$o, for the fee alloys, whcrc x 5 0.76, and for the hexagonal alloys, where x20.76. The arrows indicate the hystcrcsis in the a-y transformation [43 F I].
Bonnenberg, Hempel, Wijn
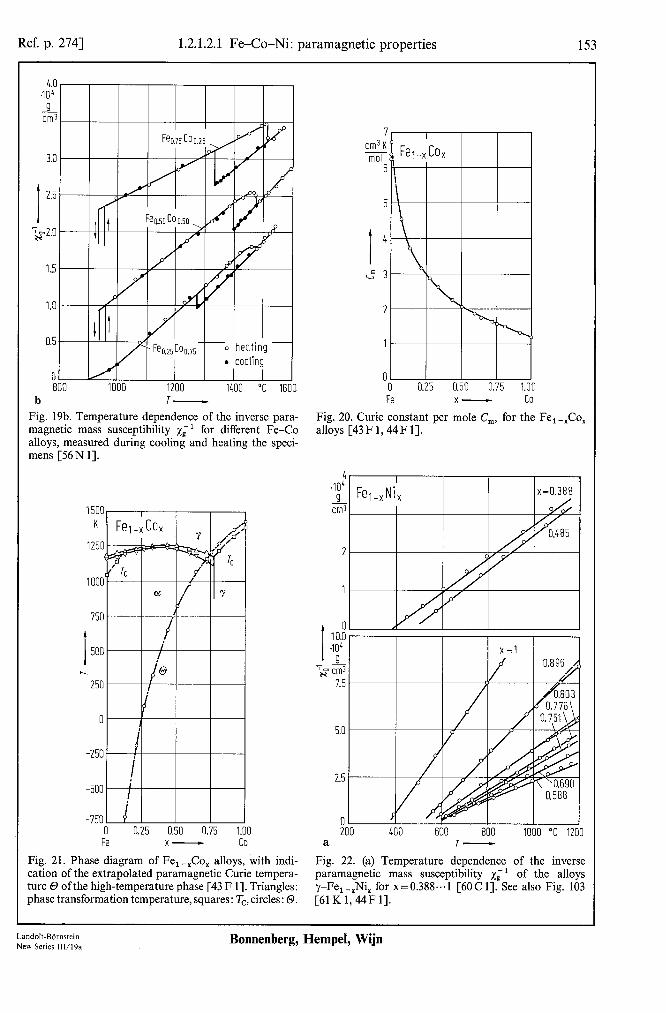
Ref. p. 2741 1.2.1.2.1 Fe-Co-Ni: paramagnetic properties 153
1.0
0 6
b 1000 1200 1400 "C 1601
Fig. 19b. Temperature dependence of the inverse para- magnetic mass susceptibility xi’ for different Fe-Co alloys, measured during cooling and heating the speci- mens [56N 11.
0 0.25 0.50 0.75 1.00 Fe x- co
Fig. 21. Phase diagram of Fe,-$0, alloys, with indi- cation of the extrapolated paramagnetic Curie tempera- ture 0 of the high-temperature phase [43 F 11. Triangles: phase transformation temperature, squares: Tc, circles: 0.
a T- Fig. 22. (a) Temperature dependence of the inverse paramagnetic mass susceptibility xi’ of the alloys y-Fe,-,Ni, for x=0.388.,.1 [6OC 11. See also Fig. 103 [61 K 1,44F 11.
Fig. 20. Curie constant per mole C,, for the Fe,-$0, alloys [43 F 1,44F 11.
4 I “f Fe,-,Ni,
Landolt-BOrnstein New Series 111/19a
Bonnenberg, Hempel, Wijn

154 1.2.1.2.1 Fe-Co-Ni paramagnctic propertics [Ref. p. 274
b I- I 600 800 1000 1200 K 11
4 *lo4 9 cm3
2
00 1100 1300 K 1500
Fig. 2%. Tempcraturc dcpcndcncc of the invcrsc para- mqnctic mass susceptibility xi ’ for invar-type
Fig. 22~. Tempcraturc depcndcncc of the inverse mass
y-Fe, -,Ni, alloys. x=O.27.~.0.388. Mcasurcmcnts car- susceptibility 1;’ for y-phase alloys Fe,-,Ni, with
ried out for incrcasinc fcmncraturcs. The sham incrcasc x=O.O47...0.193 [62C I],
L .
in x; ’ vs. Tcorrcsponds to the structural transition a-ty [63 C I]. SW also for polycrystallinc material [Sl 0 I].
90 G cm3
9 lx I
61
I 5:
b
IC I
Fig. 23. Tempcraturc dcpcndcncc of the inverse mass susceptibility x; ’ and the magnetic moments per unit mnss u ofsingle crystals of Fc, -INi, invar alloys. T, is the fcrromagnctic Curie tempcraturc [79 C2].
533 550 600 653 700 750 800 850 900 950 1000 1050 K 1
1.6
Bonnenberg, Hempel, Wijn
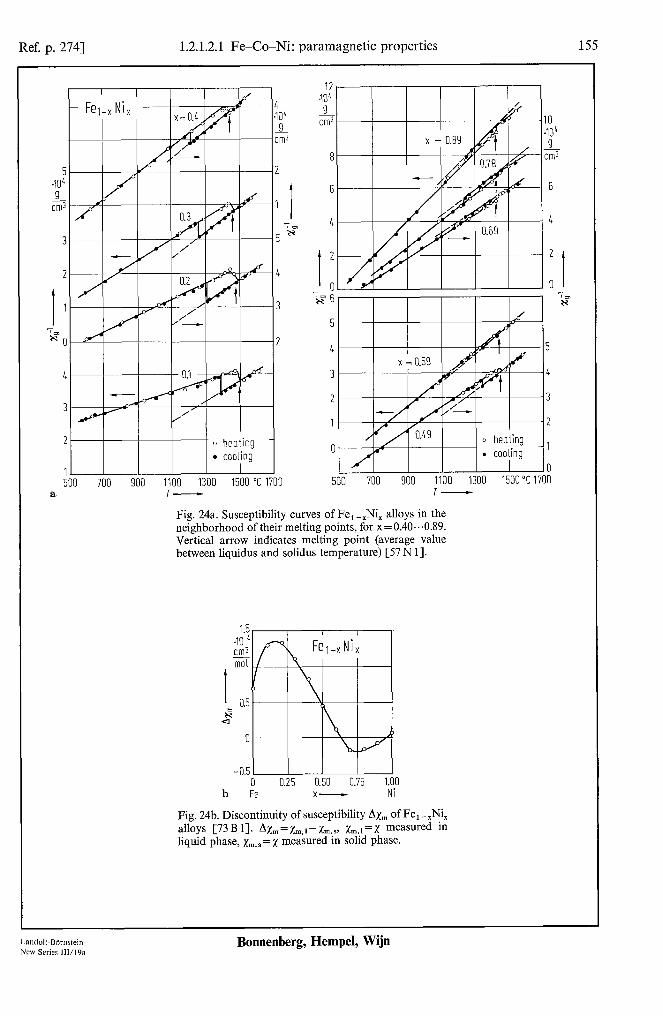
Ref. p. 2741 1.2.1.2.1 Fe-Co-Ni: paramagnetic properties 155
cm3
5 2 .I@ 9
zl7 1 I
-k? 3 5
2 4
I 1 3
-i.n "0 2
;omt: :::yz 1 700 900 1100 1300 1500 "C 1700
”
cm3
6 6
41 I v "V, 4
t 2
cg
5 I I x=0.59 I
4
3
I-A /P-l 2
1
0 500 700 900 1100 1300 1500°C 1700
a T- T-
Fig. 24a. Susceptibility curves of Fe, -,Ni, alloys in the neighborhood of their melting points, for x = 0.40...0.89. Vertical arrow indicates melting point (average value between liquidus and solidus temperature) [57 N 11.
1.5 1.5 n4 n4 cm3 cm3 - - mol mol
t t E 0.5 0.5 E
27 27
0 0
-0.5 I 0 0.25 0.50 0.75 1.00
b Fe x- Ni
Fig. 24b. Discontinuity of susceptibility Ax,,, of Fe, -,Ni, alloys [73 B 11. AX,,, = xm,, - xrn,:, xrn, t = x measured in liquid phase, xm,s =x measured m solid phase.
Landolt-Bornstein New Series 111/l%
Bonnenberg, Hempel, Wijn

156 1.2.1.2.1 Fe-Co-Ni: paramagnctic properties [Ref. p. 274
1033 K
503'
I
G
Q -530
-10%
-15X
-2033 0 0.2i 0.53 0.75 1
a Fe x- Ni
Fig. 2%~ Paramagnctic Curie tempcraturc 0 and the effective paramagnctic moment per atom pen for the y-phase alloys Fe, -,Ni, [62 C I].
5 cm3 K m-! i
4
0 0 Fe
0.2 0.L 0.6 [ x---r
-1
1.0 Ni
250 K
000
750
I 0
500
250
0
Fig. 26. Curie constant per mole. C,. and paramagnctic Curie tempcraturc. 0. for the solid (s) and the liquid (I) state. respectively. of Fc, -,Ni, alloys. as derived from the straight lines in Fig. 24a [57 N 11.
400 600 800 1000 1200 1400 "C 1600 b I-
Fig. 25b. Tempcraturc dcpcndencc of the inverse para- magnetic mass susceptibility for diffcrcnt Fe -Ni alloys. measured during cooling and heating the specimens [56 N 1-J.
.V”
40.6 cm3 - 9
75
I 60
-c-r
L5
0 900 1050 1200 1350 1500 1650 "C 1800
a I-
Fig. 27a. Temperature dependence of the paramagnetic mass susceptibility zr for the alloys Co,Ni, --I [77S I].
Bonnenberg, Hempel, Wijn
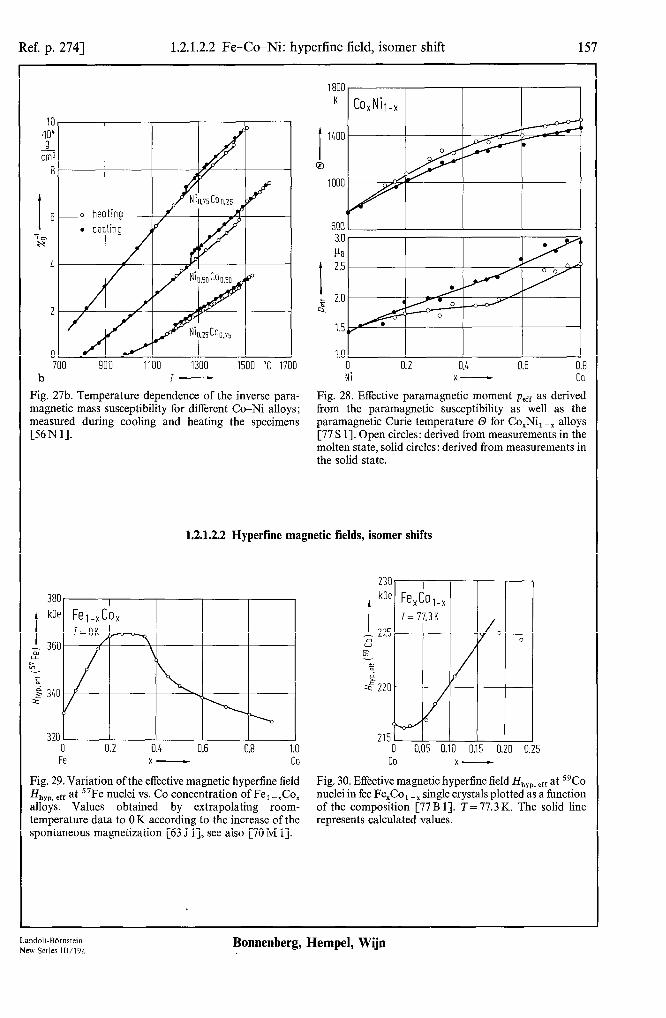
Ref. p. 2741 1.2.1.2.2 Fe-Co-Ni: hyperfine field, isomer shift
2
0 700 900 1100 1300 1500 “C Ii
b T-
I.01 0 0.2 0.4 0.6 0.8 Ni x- CO
Fig. 27b. Temperature dependence of the inverse para- Fig. 28. Effective paramagnetic moment pen as derived magnetic mass susceptibility for different Co-Ni alloys; from the paramagnetic susceptibility as well as the measured during cooling and heating the specimens paramagnetic Curie temperature 0 for Co,Ni, --x alloys [56N 11. [77 S 11. Open circles: derived from measurements in the
molten state, solid circles: derived from measurements in the solid state.
1.2.1.2.2 Hyperfine magnetic fields, isomer shifts
380
I
kOe
3201 I I 0 0.2 0.4 0.6 0.8 1.0 Fe x- co
Fig. 29. Variation of the effective magnetic hypertine field H syp, eff at 57Fe nuclei vs. Co concentration of Fe, $0, alloys. Values obtained by extrapolating room- temperature data to 0 K according to the increase of the spontaneous magnetization [63 J I], see also [70 M 11.
230 kOe
I z 225
w z ? z x 220
21s 0 0.05 0.10 015 0.20 0.25 CO x-
Fig. 30. Effective magnetic hyperfine field H,,,, eff at 5gCo nuclei in fee Fe,Co, --x single crystals plotted as a function of the composition [77B 11. T=77.3K. The solid line represents calculated values.
Landolt-Bdmsfein New Series 111/19a
Bonnenberg, Hempel, Wijn

158 1.2.1.2.2 Fe-Co-Ni: hyperfinc field, isomer shift [Ref. p. 274
Hhyp - 3 280.1 283.9 287.1 290.9 kOe 297.9 329.6 334.3 339.0 3L3.7 kOe 35:
I 1 , I I I I I I
h.99 Co0.01
spin -echo
super- regeneration
II
I I I I I I I I I
5 282 285.5 289 292.5 MHz 299.5 45.35 46.00 16.65 17.30 MHz L8
2K
spin -echo
51 Fe
super- I I regenerotion
/b-i
a
Fig.31a.Hypcrfineticld,H,,.,.spcctrafors9Coand “Fein an ~~~~~~~~~~~~ alloy mcasurcd with spin-echo and super-regenerative NMR tcchniqucs at 4.2 K [68 R 23.
I I I Li.5 15.0 L6.5 17.5 48.0 k8.5 MHz ’
b 1’ -
Fe - Co
I I I 0.2 ,
280 285 290 295 MHz 300 C Y-
Fig. 31b. S’Fc spin-echo NMR spectra in Fc-Co alloys at Fig. 31 c...e. s9Co spin-echo zero-field NMR spectra for 1.35K [70B 11. Fe-Co alloys. The main peak corresponds to single Co
sites, the satellite lines S,, S,, and S, are assigned to first. second and third neighbor pairs, respectively, while S; and S’i correspond to nearest-neighbor Co triplets [83P 21, see also [71 S4]. (c) Alloys anncalcd at 700°C and quenched in ice water, (d) Fe,,,&o,,,, spectrum on enlarged scales,(e) Fe,,,,Co,,Oz, solid circles: annealed at 700°C and open circles: annealed at 900°C.
Bonnenberg, Hempel, Wijn
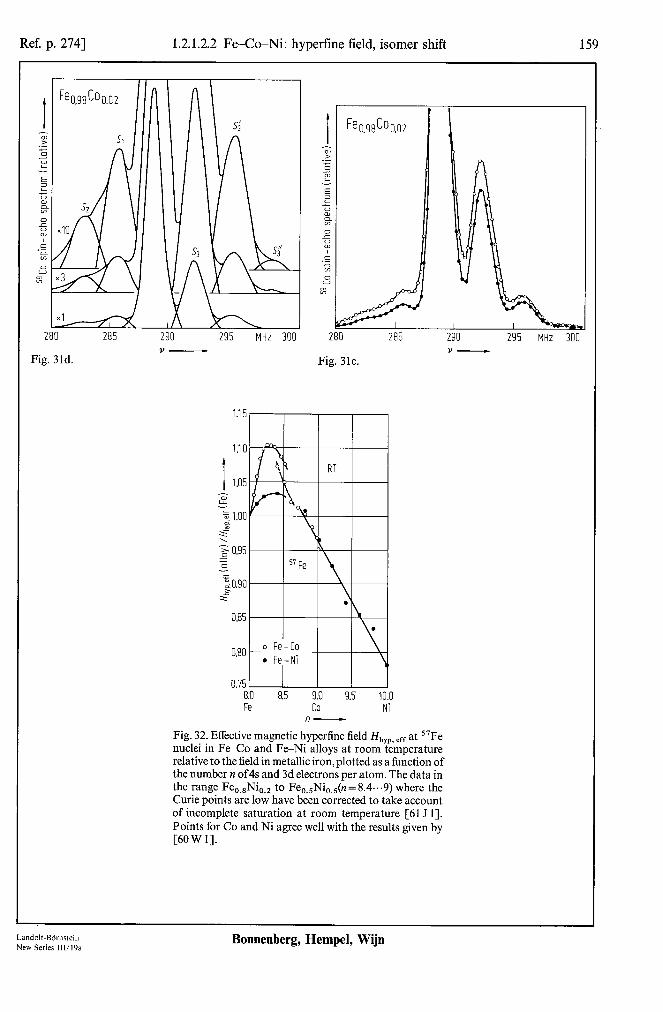
Ref. p. 2741 1.2.1.2.2 Fe-Co-Ni: hype&e field, isomer shift
280 285 290 295 MHz 300 Y---
Fig. 31d.
I 285 290 295 MHz 300
Fig. 31e.
8.0 8.0 8.5 8.5 9.0 9.5 9.0 9.5 10.0 10.0 Fe Fe co co Ni Ni
Fig. 32. Effective magnetic hyperfine field Hhyp, eff at 57Fe nuclei in Fe-Co and Fe-Ni alloys at room temperature relative to the field in metallic iron, plotted as a function of the number II ofb and 3d electrons per atom. The data in the range Fe,,,Ni,,, to Fe,,,Ni,,,(n= 8.4...9) where the Curie points are low have been corrected to take account of incomplete saturation at room temperature [61 J 11. Points for Co and Ni agree well with the results given by [60 W I].
Landolt-Bdmrtein New Series 111/19a
Bonnenberg, Hempel, Wijn

160 1.2.1.2.2 Fe-Co-Ni: hyperfine field, isomer shift [Ref. p. 274
I
263 270 283 290 300 MHz: I’ -
310
Fig. 33a. 59Co spin-echo NMR spectra ofFeO,s+,Coo,s-, allovs at 77 K for ordered samples annealed for 30 days at 55O’“C. S, corresponds to Co atoms with another Co atom replacing Fe in the 1st ncarcst neighbor shell. S, corresponds to Co atoms with a 2nd nearest neighbor Co atom replaced by Fe [76 M 41.
b Y-
Fig. 33b. s9Co spin-echo NMR spectra of Fe,,,Co,,, at 77 K for alloys annealed for various periods at a tempera- turc of 550°C [76M4]. (1) As quenched. (2) annealing time 5 min., (3) annealing time 35 min., (4) annealing time 30 days
0.16, I I I I
H,,,(57Fe) - Fig. 33~. Distribution function P(H,,J of the “Fc hypcrfinc field in disordcrcd Fe,,sCo,,S alloy at various temperatures. as derived from Miissbauer spectra [79 N I].
kOe 390
Bonnenberg, Hempel, Wijn

Ref. p. 2741 1.2.1.2.2 Fe-Co-Ni: hyperfine field, isomer shift 161
280, I I I I I I 3751 I I I I
. .
1801 0 100 200 300 400 500 600 700 K 800
T-
Fig. 34. Temperature dependence of the effective hyperfine field Hhyp, eff for “‘Sn on Co sites in Fe,,,Co,,, contain- ing 1 at% of Sn. The dashed curve represents the relative spontaneous magnetization [72 H 41, see also [78 C 11.
Feo.65 ( Nil-xCox )0.35 A
0 I I I I
100 200 300 400 kOe 5 HhYP P7Fe) -
Fig. 36. Distribution function P(H,,,,J of the 57Fe hyper- fine field as calculated from the Miissbauer spectra of Feo.65Wl-xCoxh3~ alloys at 80 K [79 B 11.
I
kOe
300
s
” 225 s 5
x 150
x- Fig. 35. Effective average ‘?Fe magnetic hyperfine field H hyp, eff, substituted Fe,,&Ii,-X?oX),,,, and Fe,,~,$-XM~~f,5 ata&% [79 B 11.
Table 2. Variation of the effective hyperfine field, H hyp,eff at 5gCo nuclei in Fe-Co and Co-Ni alloys as derived from specific heat measurements. Extra- polated to OK.
Alloy Fe co Ni
H hm eff Ref. at% kOe
95.2 4.8 - 314(9) 59Al 82.8 17.2 - 293(10) 59Al 41.3 58.7 - 256(3) 59Al
8.5 91.5 - 223 (4) 59Al - 100 - 219(4) 59Al - 60 40 161(3) 59Al - 65 35 162 68Hl - 50 50 143 68Hl - 33.4 66.6 120 68Hl - 20 80 106 68Hl - 10 90 94 68Hl - 6 94 88 68Hl
Landolt-Biirmtein New Series 111/19a
Bonnenberg, Hempel, Wijn
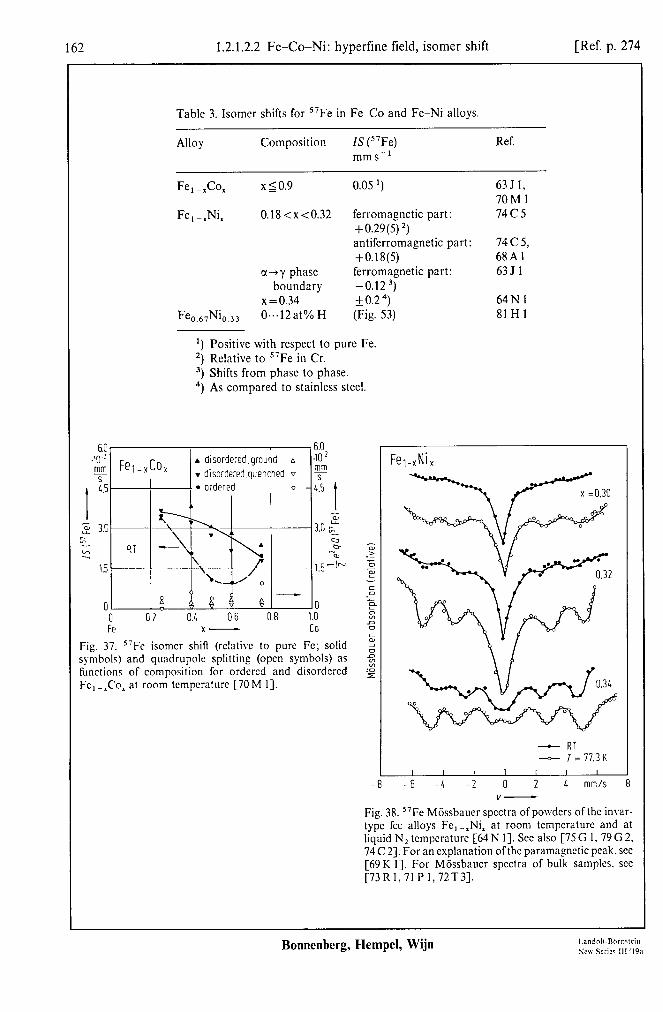
162 1.2.1.2.2 Fe-Co-Ni: hyperfine field, isomer shift [Ref. p. 274
Table 3. Isomer shifts for “Fe in Fe-Co and Fe-Ni alloys.
Alloy Composition IS (“Fe) mms-’
Ref.
Fe,-,Co, - x10.9 0.05 1) 6351, 70M 1
Fe, -,Ni, 0.18<x<O.32 ferromagnetic part: 74c.5 +0.29(5) 2, antiferromagnetic part: 74c5, +0.18(5) 68A1
a-+y phase ferromagnetic part: 6351 boundary -0.123)
x = 0.34 +o.24) 64Nl Fe 0.67%.33 0,..12at% H (Fig. 53) 81Hl
‘) Positive with respect to pure Fe. 2, Relative to 57Fe in Cr. 3, Shifts from phase to phase. 4, As compared to stainless steel.
/ 6.0
Fei-XCO, A disordered.ground A .10~2 mm
I v disordeied.quenched v s , l ordered 0 - 4.5
,
Fe x- co
Fig. 37. “Fe isomer shift (rclativc to pure Fe; solid k
symbols) and quadrupolc splitting (open symbols) as 2
functions of composition for ordcrcd and disordcrcd c 9
Fe, _XCo, at room tcmpcraturc [70 M 11.
Fe,.xN~y
- RT - T=77.3K
I I I I I I I
-6 -4 -2 0 2 1 mm/s 8 V-
Fig. 38. “Fe Miissbauer spectra ofpowders of the invar- type fee alloys Fe, -,Ni, at room temperature and at liquid N, temperature [64 N 11. Set also [75 G 1, 79 G 2, 74 C 23. For an explanation ofthc paramagnetic peak. see [69K 11. For Miissbaucr spectra of bulk samples. see [73Rl, 71 P 1,72T3].
Bonnenberg, Hempel, Wijn
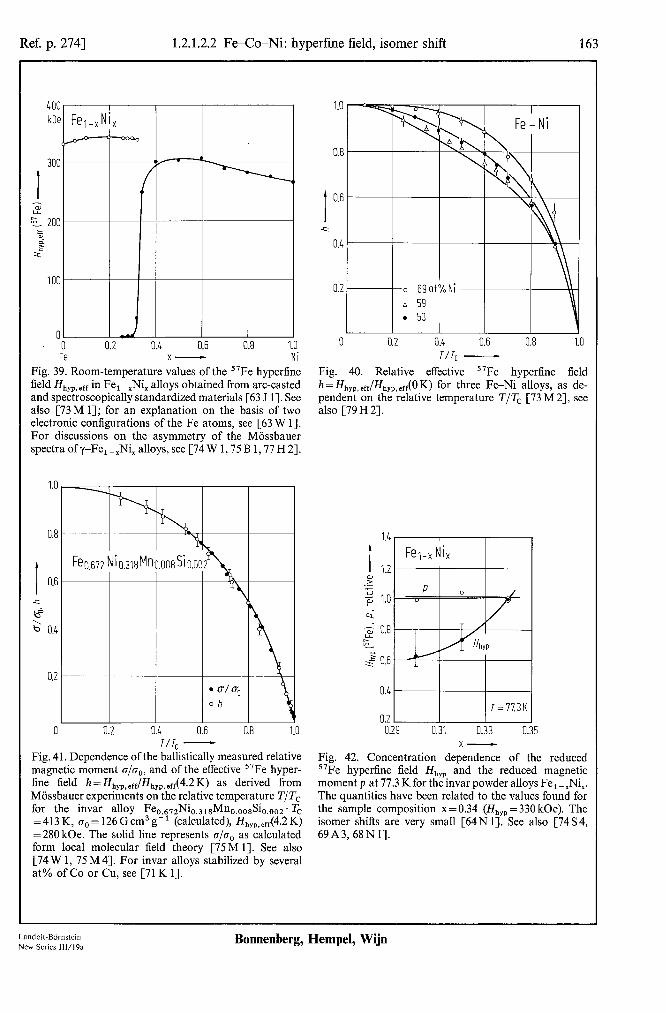
Ref. p. 2741 1.2.1.2.2 Fe-Co-Ni: hyperfine field, isomer shift 163
400 kOe
x- Ni Fig. 39. Room-temperature values of the 57Fe hypertine field Hhyp. eff in Fe, -,Ni, alloys obtained from arc-casted and spectroscopically standardized materials [63 J 11. See also [73 M 11; for an explanation on the basis of two electronic configurations of the Fe atoms, see [63 W 11. For discussions on the asymmetry of the Miissbauer spectra ofy-Fe, -XNi, alloys, see [74 W 1,75 B 1,77 H 21.
I 0.6
< t? 2 0.4
1.0
0.8
I 0
I
0.; 0.8 T/T, -
Fig. 41. Dependence of the ballistically measured relative magnetic moment a/g,,, and of the effective 57Fe hyper- fine field h = Hhyp, ,rJHhyp, err( 4.2 K) as derived from Mijssbauer experiments on the relative temperature T/Tc for the invar alloy Fe,,,7,Nio,31sMn,,,,,Si~,~~~. Tc =413 K, B,, = 126 Gcm3 g-l (calculated), H,,,,,,r(4.2 K) = 280 kOe. The solid line represents c/a0 as calculated form local molecular field theory [75 M 11. See also [74 W 1, 75 M 43. For invar alloys stabilized by several at% of Co or Cu, see [71 K 11.
0.8
0 0.2 0.4 0.6 0.8 T/T, -
Fig. 40. Relative effective 57Fe hyperfine field h = f&p, e&hyp. eu (OK) for three Fe-Ni alloys, as de- pendent on the relative temperature T/T, [73 M 21, see also [79 H 21.
1.4
I 1.2 ? .-
$l 1.0
c; a 0.8 E. 2 0.6
0.4
0.2 0. 29
Fel-x NI,
p 0 / ‘.
T /
WP
T=77.3K
0.31 0.33 0. x-
Fig. 42. Concentration dependence of the reduced s7Fe hyperfine field Hhyp and the reduced magnetic moment p at 77.3 K for the invar powder alloys Fe, -.Ni,. The quantities have been related to the values found for the sample composition x = 0.34 (Hhyp = 330 kOe). The isomer shifts are very small [64N 11. See also [74S4, 69A3,68N I].
Land&BBmstein New Series 111/19a
Bonnenberg, Hempel, Wijn

164 1.2.1.2.2 Fe-Co-Ni: hyperfine field, isomer shift [Ref. p. 274
t koe Felmx Ni, I I
60 I 60 I I
I
koe Felmx Ni,
2% LO T z !. Q .\ z ‘y 2
.l. 20 4 . . T
I = L.2 K
0’ 0.175 0.225 0.275 0.325 a9175 0.225 0.275 0.325
x-
Fig. 43. Concentration depcndcncc of the cllicctivc hypcr- line field as dcrivcd from “Fc M&Jx~ucr spectra at 4.2K for fine particles of the invar alloys Fc, -,Ni, [68AI].
U.J
x = 0.372
0 100 200 300 kOe H,j;PFel---
Fig. 4-1. Tcmpcraturc-dcpcndcnt distribution function P( H,,,) of mqnctic hypcrfinc liclds at “Fc nuclei in fee Fe, -,Ni, alloys as detcrmincd from Mfissbaucr spectra. Tht temperature is indicated in terms of the rcduccd tcmpcrnturc [71 T3]. For a thcorctical trcatmcnt of the local environment effect on the distribution function of H ,!,.sec[83Kl.S3K2].
LOO kOe
350
I 250
2 E 200
= ? “, r
=z 150
I
FeNi, I l increasing 1
70 decreasing 7. - A metostoble dlsordered sample
200 400 600 800 K 1000
Fig.45. Effcctivc hypcrfinc field H,j,,,,I vs. temperature 7 at “Fc nuclei in FeNi,. In the insert the transition region for the ordering is given on a larger scale [77 D 2). set also [79 D I].
Bonnenberg, Hempel, Wijn
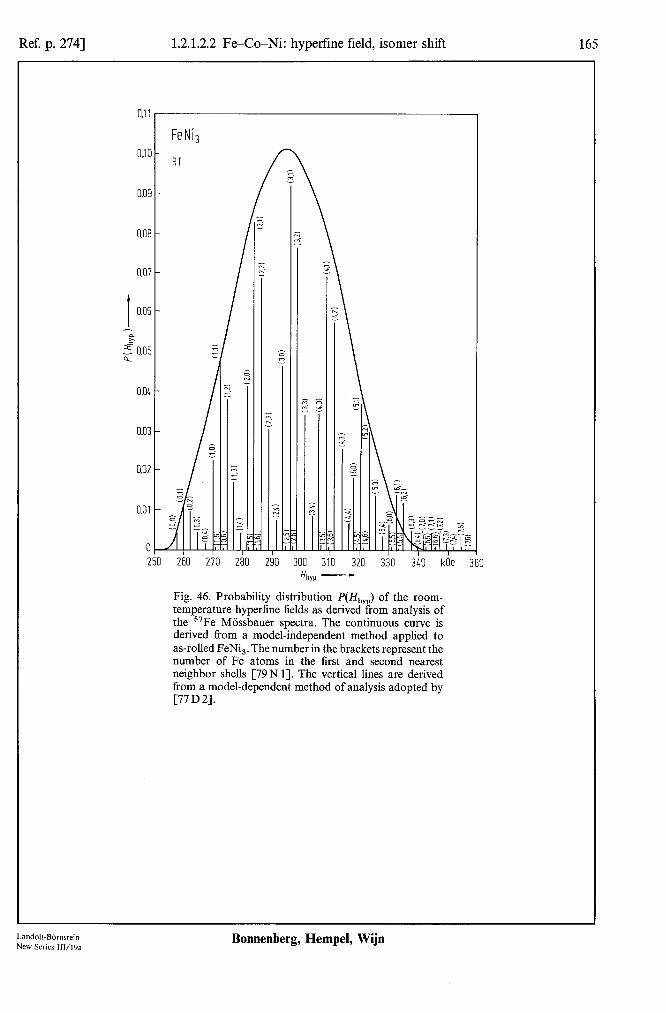
Ref. p. 2741 1.2.1.2.2 Fe-Co-Ni: hyperfine field, isomer shift 165
Cl.11
03c
OSIE
O.OE
0.07
1 0.06
E ; 0.05
0.04
0.03
0.02
0.01
0 2jo
FeNi
RT
290 3do 3io 320 330 340 kOe 360
h - Fig. 46. Probability distribution P(Hhyp) of the room- temperature hyperfine fields as derived from analysis of the 57Fe Miissbauer spectra. The continuous curve is derived from a model-independent method applied to as-rolled FeNi,. The number in the brackets represent the number of Fe atoms in the first and second nearest neighbor shells [79N 11. The vertical lines are derived from a model-dependent method of analysis adopted by [77D2].
Landolt-Bdmstein New Series III/l%3
Bonnenberg, Hempel, Wijn
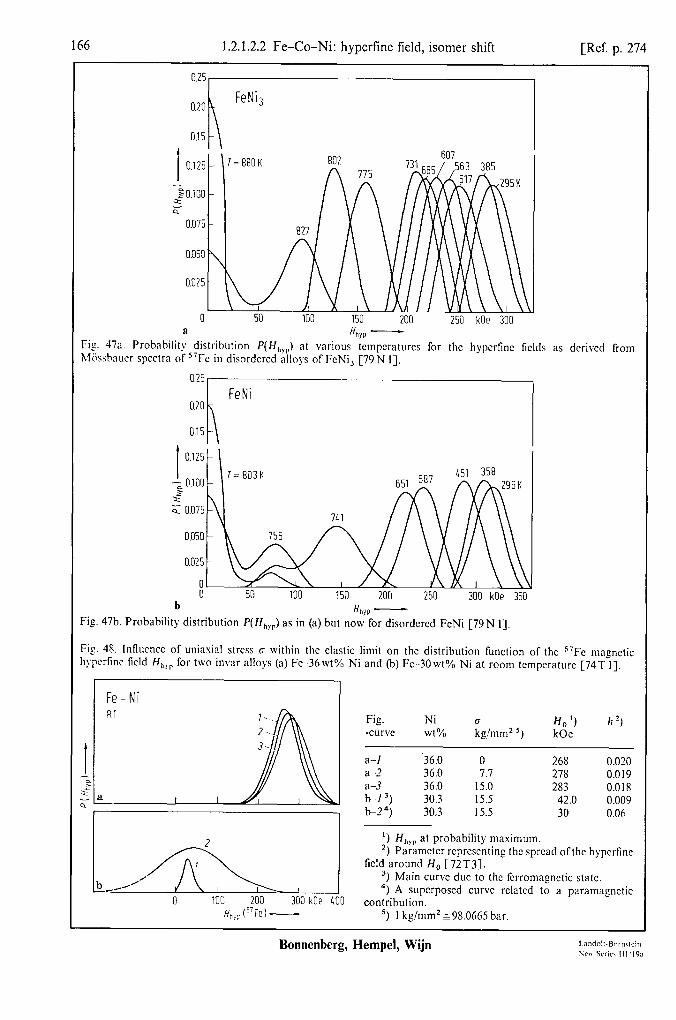
166 1.2.1.2.2 Fe-Co-Ni: hypcrlinc field, isomer shift [Ref. p. 274
0 50 100 150 200 250 kOe 300 a H W -
Fig 47x Probnbility distribution P(H,,,.,) al various tcmpcraturcs for the hypcrfinc fields as derived from hfiissbnucr spectra of 57F~ in disordcrcd alloys of FcNi, [79 N I].
I 0.125
p. 0100 s ;; 0.075
0.050
0.025
! 50 100 150 200 250 300 kOe 350 b HhYP -
Fig. 47b. Probability distribution P(H,,,) as in (a) but now for disordered FeNi [79N I].
Fig. 48. Influence of uninsial stress g within the elastic limit on the distribution function of the 57Fe maenetic hypcrfine field H,,, for tvvo invar alloys (a) Fc 36wt% Ni and (b) Fc ~30wt% Ni at room tcmpcrature [74Ti].
Fe-Ni RT
I I
Fig. -curve
Ni wt% &/mm* 5,
H,‘) h2) kOc
0 4, A supcrposcd curve rclatcd to
100 200 300 kOe LOO a paramagnetic
contribution. Hh,; ?'Fe) - ‘) I kg/mm* g-98.0665 bar.
Bonnenberg, Hempel, Wijn

Ref. p. 2741 1.2.1.2.2 Fe-Co-Ni: hyperfine field, isomer shift 167
0.12 I I I I I I
T=4K 7=4K
I 0.09
-Z 0.06 .2 3 4
0.03
0 I I I I I I
Feo.635 Nio.do 0.105 T-4K Fe0.605 Nio.doo.lo5 T=4K
0.09
-= 0.06 s c
0.03
0 0 100 200 300 kOe 400 0 100 200 300 kOe 400
H hyp - H he - Fig. 49. Probability P(Hhyp) ofthe 57Fe hyperfine field as calculated from the Mijssbauer spectra of four different Fe-Ni-Co alloys measured at 4K in (a and b) the absence of an applied magnetic field, and in (c and d) the presence of an applied magnetic field [77 M 11.
420, I
Fe0.67N’0.33 /\ T=77K
- C free
--- carburized
0 100 200 300 kOe 4 Hhyp(57Fe)-
Fig. 50. Analytical curves of the distribution function P(iY,,,) for the internal hyperfine field of the invar
Fig. 51. Magnetic hyperfine field Hhyp of Fe atoms vs. the distance r from an interstitial C atom in a bee Fe-6 wt%,
Fe 0.67%.33 at 77 K for C free and the carburized sample Ni-1.8wt% C alloy. 1st (0) and 1st (t) denote the first [Sl H 11. neighboring Fe atom for the octahedral and the tetra-
hedral interstitial C atom, respectively [74 S 31.
Landolt-BCmstein New Series 111/19a
Bonnenberg, Hempel, Wijn

1.2.1.2.3 Fe-Co-Ni : spin waves [Ref. p. 274
- H free --- fl-hybride
Fig. 52. Internal magnetic field distributions P(H,,,) as derived from MGssbnuer spectra mcasurcd at 77K on rolled heat-treated and polished specimen with a thick- ness of 30pm. Solid lines show those of alloys bcforc hydrogenation. broken lines show those of hydrides [79S4].
I 2
0.14 mm
052
010
0.08
0.06
004 45 %
30,
15
0 0 3 6 9 12 at% 15
H-
Fig. 53. Effective hypcrfine field for “Fe isomer shift relative to pure Fe and the fraction of the weak fer- romagnctic component of an Fc,,,,No,,,, invar alloy at 77 K for various grades of hydrogenization expressed as the H content [Sl H I].
1.2.1.2.3 Spin waves
Table 4. The second-moment exchange integrals J, in [K], between atom pairs in Fe-Co alloys 1 K t 0.0862 meV.
Znd-moment exchange integral [K]
bee ‘) fee 2)
J’? Fc Fe ~500 <o
J’?‘- Fc Co x800 >o J’? co co ? %400 >o
‘) As derived from Curie and ordering tempera- tures [SOL 11.
2, [78Bl].
Bonnenberg, Hempel, Wijn
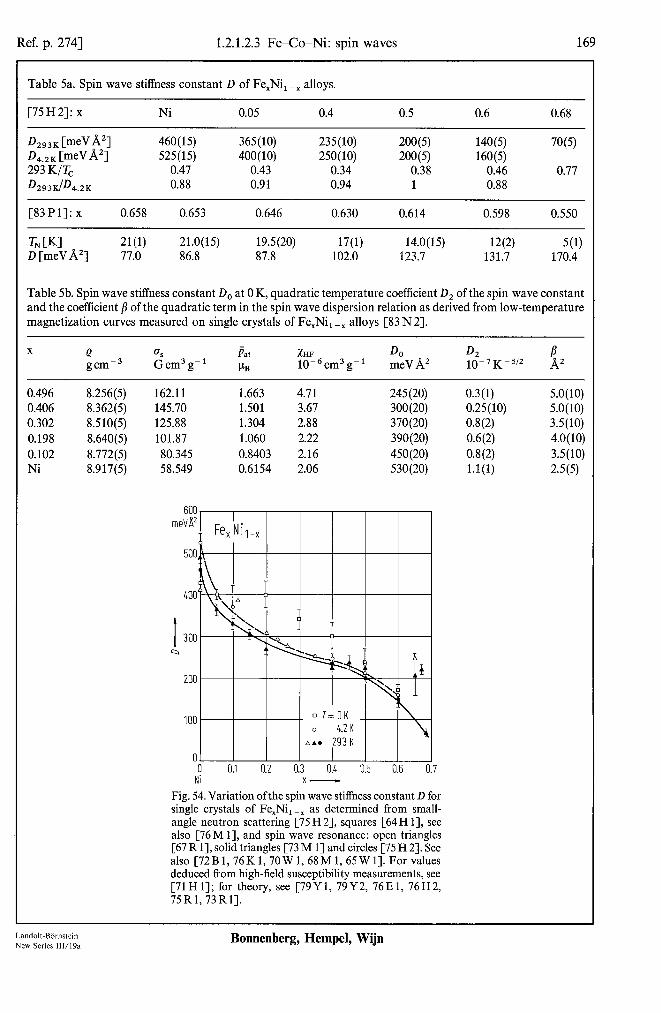
Ref. p. 2741 1.2.1.2.3 Fe-Co-Ni: spin waves 169
Table 5a. Spin wave stiffness constant D of Fe,Ni, -x alloys.
[75H2]: x Ni 0.05 0.4 0.5 0.6 0.68
D2,,, CmeVA’l 460(15) 365(10) 235(10) 200(5) 140(5) 70(5) Da., K CmeV A21 525(15) 400(10) 250(10) 200(5) 160(5) 293 K/T, 0.47 0.43 0.34 0.38 0.46 0.77 D,,, KID~.~K 0.88 0.91 0.94 1 0.88
[83Pl]: x 0.658 0.653 0.646 0.630 0.614 0.598 0.550
TN CKI 21(l) 21.0(15) 19.5(20) 17(l) 14.0(15) W2) 5(l) D [meV A21 77.0 86.8 87.8 102.0 123.7 131.7 170.4
Table 5b. Spin wave stiffness constant D, at 0 K, quadratic temperature coefficient D, of the spin wave constant and the coefficient j? of the quadratic term in the spin wave dispersion relation as derived from low-temperature magnetization curves measured on single crystals of Fe,Ni, --x alloys [83 N 21.
X e as Pat XHF DO D2
gcme3 Gcm3g-’ ~~ 10m6 cm3 g-’ meV A2 10-7~-5/2 L
0.496 8.256(5) 162.11 1.663 4.71 245 (20) 0.3(l) 5.0(10) 0.406 8.362(5) 145.70 1.501 3.67 300(20) 0.25(10) 5.0(10) 0.302 8.510(5) 125.88 1.304 2.88 370(20) 0.8(2) 3.5(10) 0.198 8.640(5) 101.87 1.060 2.22 390(20) 0.6(2) 4.0(10) 0.102 8.772(5) 80.345 0.8403 2.16 450(20) 0.8(2) 3.5(10) Ni 8.917(5) 58.549 0.6154 2.06 530(20) 1.1(l) 2.5(5)
600 meVW2
500
400
t 300 Q
200
100
0 0 0.1 0.2 0.3 0.4 0.5 0.6 0.7
Ni x-
Fig. 54. Variation ofthe spin wave stiffness constant D for single crystals of Fe,Ni,-, as determined from small- angle neutron scattering [75 H 21, squares [64 H I], see also [76M 11, and spin wave resonance: open triangles [67 R I], solid triangles [73 M I] and circles [75 H 21. See also[72B1,76K1,70W1,68M1,65W1].Forvalues deduced from high-field susceptibility measurements, see [71Hl]; for theory, see [79Yl, 79Y2, 76E1, 76H2, 75R1,73Rl].
Landolt-Bbmstein New Series IW19a
Bonnenberg, Hempel, Wijn

170 1.2.1.2.3 Fe-Co-Ni: spin waves [Ref. p. 274
2LO me\!A’
2iO
60
30
0 a (r/r,P - b x- Ni
Fig. 55a. Temperature variation of the exchange stiffness constant D as derived from neutron spin wave scattering esperimcnts for two single crystals, Fc,,,Ni,,, and Fe,,,Ni,,,, [79 121. For the spin wave stiffness constant and its temperature variation as detcrmincd from magnet- ization mcasurcmcntson a single crystal ofFe,,,,SNi,,,,, invnr alloy. see [80 N I].
1.5 .lO" K-s!?
t
1.0
G 0.5
0
I
Fepx Ni,
0.1 0.5 0.6 0.7 0.8 0.9 1.0 C x- Ni
Fig. 55~. Quadratic temperature cocflicicnt D, ofthc spin wave stiffness constant of fee Fc, -,Ni, alloys. derived from mn,onctization mcasurcmcnts (I) and neutron scat- tcrin_c (2...4). I: [83N2], 2: [75H 21. 3: [7912], 4: [73 M 31.
meVA2 Fe,., Ni, 550
I f
/.. 500
I/: T
250 /
01 +5 ~2
200 ~6
v3 -7 x4 l 8
0.L 0.5 0.6 0.7 0.8 0.9 1.0
Fig. 55b. Low-temperature spin wave stiffness constant Do for fee Fc,-,Ni, alloys, derived from magnetization mcasurcmcnts (I) and neutron scattering (2...8). 1: [83 N 2). 2: [75 H 2],3: [79 12-j, 4: [64 H 1-J 5: [73 M 31. 6: [68 M I], 7: [70 W I], 8: [76 M 21.
7.5 A2 FelexNlx
I 5.0 a l- --_
---_
9 2.5 t-
Y .- -. i 1 .l. ‘I
-6
0 7 A2 0
04 0.5 0.6 0.7 0.8 0.9 1.0 d x- Ni
Fig. 55d. CocfTicient j3 of the quadratic term in the spin wave dispersion relation for Fe, -,Ni, alloys. I: magneti- zation mcasurcmcnts [83 N 23. The value for x =0.45 is from [83N 33.2: neutron scattering [68 M I, 71 A23.
Bonnenberg, Hempel, Wijn

Ref. p. 2741 1.2.1.2.3 Fe-Co-Ni: spin waves 171
1.5 meV
i
1.0
Fig. 56. Magnon linewidth r as determined by neutron spin wave scattering on a single crystal of Fe,,,,Ni,,,, measured at different temperatures and plotted as a function of the square of the magnon wavevector 4. For comparison the same property is given for other fer- romagnetic substances [79 121.
0.5
0 0.03 0.06 0.09 0.12 0.15 A-2 0.18
lC TH;
I I x =0.32 I I I
I I I
5 IO 15 20 THz 25
Fig. 57. Intrinsic magnon linewidth r vs. energy of the magnon as determined by inelastic neutron scattering from disordered single crystals of Fe,-,Ni, in various crystal directions hkl. 1 THz P 4.136 meV. Open and solid symbols refer to different spectrometers [80 H 11.
Table 6. Exchange integrals J between atom pairs in Fe, -.Ni, alloys as derived from inelastic small-angle scattering of neutrons by spin waves.
Exchange integral [meV]
bee ‘) fee ‘) fee “)
n 1.0
I 0.8
< 0.6 2
0.4
0.2
0 0.2 0.3 0.4 0.5 0.6 0.7 0.8 0.9 1.0
JFe-Fe + 18.2(5) - 9.0(26) JFe-Ni -41(13) +39(5) JNi-Ni - + 52(3)
‘) Second moments [64 H 11. ‘) [75M2].
- 8(l) +38(4) + 52(5)
x- Ni
Fig. 58. Effective magnetic exchange parameter J for fee Fe, -,Ni, alloys relative to JNi, the quantity for pure Ni. I: specific heat measurements [73 T 2],2: Curie temperature measurements [73 T 2],3: neutron scattering experiments [64H 1],4: spin wave resonance [67 R 11.
Landolf-Bbmstein New Series III/l%
Bonnenberg, Hempel, Wijn
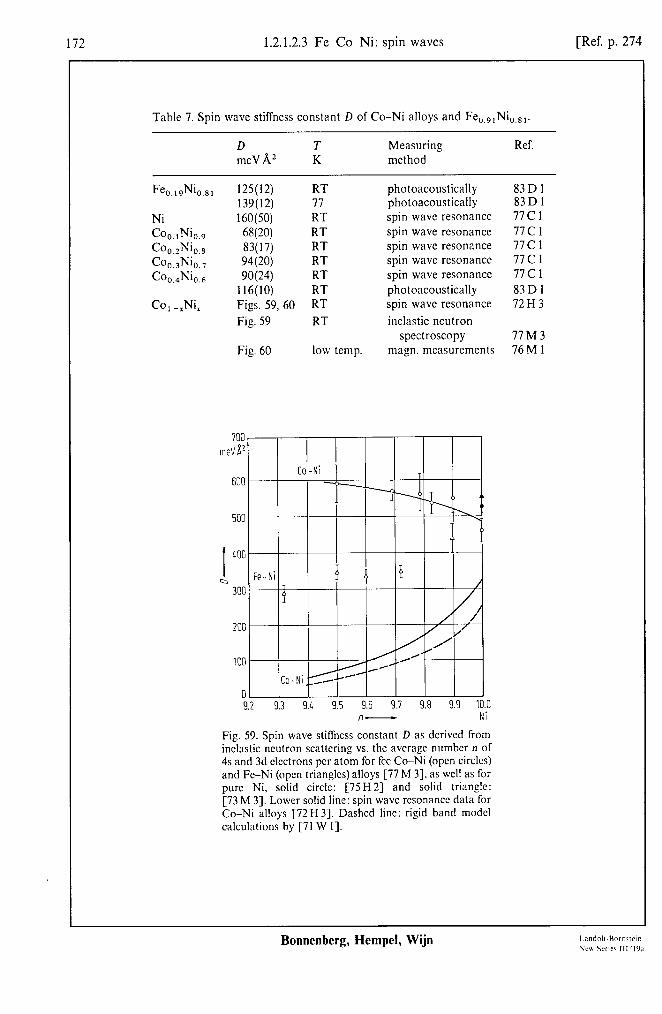
172 1.2.1.2.3 Fe-Co-Ni: spin waves [Ref. p. 274
Table 7. Spin wave stiffness constant D of Co-Ni alloys and Fe,,,,Ni,,,,.
D T Measuring Ref. meV A2 K method
Fe o.19Nio.sl WW FT 139(12)
Ni 160(50) RT
Coo.lNio.9 68(20) RT
Coo.2Nio., 83(17) RT
Coo,3Nio.7 94(20) RT
Coo.4Nk6 90(24) RT 116(10)
Co, -xNi, Figs. 59, 60 :T’ Fig. 59 RT
Fig. 60 low temp.
photoacoustically photoacoustically spin wave resonance spin wave resonance spin wave resonance spin wave resonance spin wave resonance photoacoustically spin wave resonance
inelastic neutron spectroscopy
ma&n. measurements
83D 1 83D 1 77Cl 77c1 77Cl 77Cl 77Cl 83Dl 72H3
77M3 76M1
700 meV8*
600
200 / /
./ / /,/ ,’
100 /*
<A--- Co -Ni ;s-’
0 9.2 9.3 9.L 9.5 9.6 9.7 9.8 9.9 10.0
/I- Ni
Fig. 59. Spin wave stiffness constant D as derived from inelastic neutron scattering vs. the avcragc number n of 4s and 3d clcctrons per atom for fee Co-Ni (open circles) and Fe-Ni (open triangles) alloys [77 M 31, as well as for pure Ni, solid circle: [75H2] and solid triangle: [73 M 33. Lower solid line: spin wave resonance data for Co-Ni alloys [72 H 33. Dashed line: rigid band model calculations by [71 W I].
Bonnenberg, Hempel, Wijn
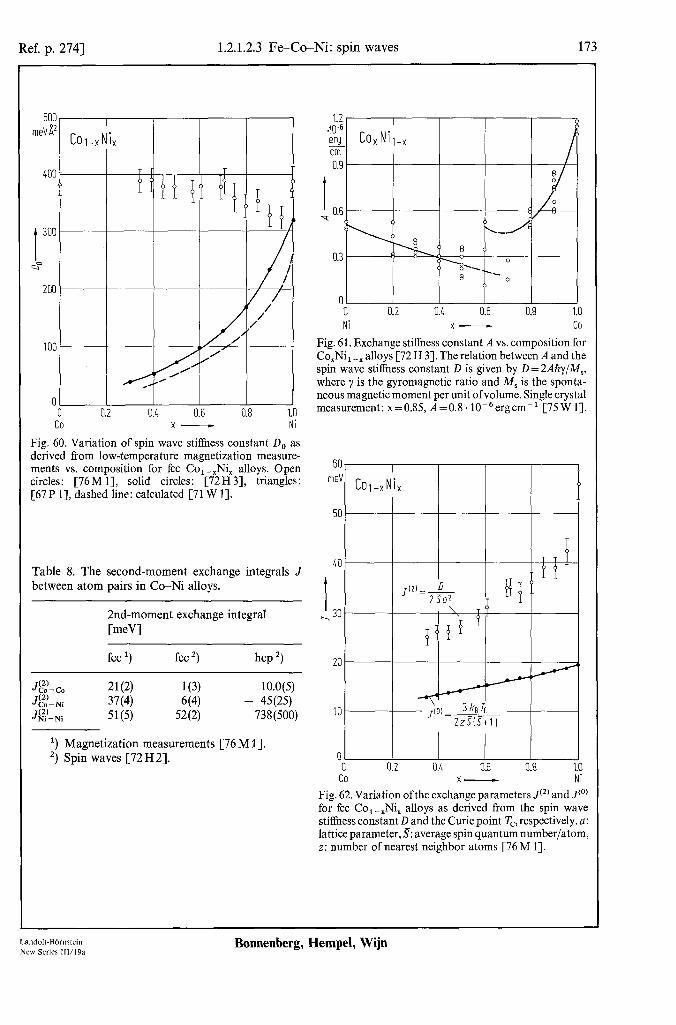
Ref. p. 2741 1.2.1.2.3 Fe-Co-Ni: spin waves 173
500, I
m&H2 I
Col-xNi, I
400 .- T
I 300
a”
200
100
4
“OW co
/’
?f
/’
S’ /
0.6 x-
3.8
1
1.0 Ni
Fig. 60. Variation of spin wave stiffness constant D, as derived from low-temperature magnetization measure- ments vs. composition for fee Co,-,Ni, alloys. Open circles: [76 M 11, solid circles: [72 H 31, triangles: [67P 11, dashed line: calculated [71 W 11.
Table 8. The second-moment exchange integrals J between atom pairs in Co-Ni alloys.
2nd-moment exchange integral CmeVl
fee ‘) fee “) hcp ‘)
JL?oL 21(2) l(3) 10.0(5) Jg- Ni 37(4) b(4) - 45(25) J$$,‘- Ni 51(5) 52(2) 738(500)
r) Magnetization measurements [76 M I]. “) Spin waves [72 H 21.
- r-m
01 0 0.2 0.4 0.6 0.8 1.0 Ni x- co
Fig. 61. Exchange stiffness constant A vs. composition for Co,Ni, --): alloys [72 H 31. The relation between A and the spin wave stiffness constant D is given by D = 2Afiy(M,, where y is the gyromagnetic ratio and M, is the sponta- neous magnetic moment per unit ofvolume. Single crystal measurement: x=0.85, A=0.8.10-6ergcm-’ [75W 11.
0 0.2 OX 0.6 0.8 1. .O c LO x- Ni
Fig. 62. Variation ofthe exchange parameters J(‘) and J(O) for fee Co, -,Ni, alloys as derived from the spin wave stihhess constant D and the Curie point Tc, respectively. a: lattice parameter, S: average spin quantum number/atom, z: number of nearest neighbor atoms [76 M 11.
Landolt-Bbmstein New Series 111/19a
Bonnenberg, Hempel, Wijn

174 1.2.1.2.4 Fe-Co-Ni: magnetic moment, g-factor [Ref. p. 274
2.5
Pa 2.4
I 23 h
2.2
2.1
1.2.1.2.4 Atomic magnetic moment, magnetic moment density, g and g’ factor
0 0.1 0.2 0.3 0.4 0.5 0.6 0.7 a Fe x- co
Yig. 63a. Mean magnetic moment per atom j,, as dcrivcd iom magnetization mcasurcmcnts for bee Fc, -XCo, alloys [69 B I].
3.2
Pa
0.2 0.4 0.6
b Fe x- CO
Fig. 63b. Average spin polarization &,in,a, of disordered Fe,-$0, alloys at OK [84V I]. Solid circles: experi- mental results [69 B I] taking into recount the 9 factors from [61 M I], open circles: calculated using tight - binding scheme with single-site, t%ll-orbital interactions [84V 11.
1.8E
PO
1.82
I 1.75
Ih 1.7c
1.7:
1.7[ Fig. 64. Atomic ma?nctic moments p,+ and pcO in bee Fe, _,Co, alloys. Trlanglcs: neutron diffuse scattering a data [63C2. 64G I]. open circles: calculation results based on the tight-binding model of 3d electrons with
1.728
allowance for local-environment effects [79 H 21, solid MS
circles: mean atomic magnetic moment for the alloy [69 B I]. l.72&
I 1.720
1.716
Fig. 65. (a) Mean magnetic moment j,, in hcp, dhcp and fee Fe-Co alloys as derived from the saturation magnet- 1.71 ization of polycrystalline samples at 4.2 K. (II) Enlarged graph for the hcp region [73 W 21. b
2 4 6 8 ot% 10
r Fe-Co 1 hcp I
I 0.1%
‘I 0 0.2 0.4 0.6 0.8 at% 1.0
CO Fe - Fe
Bonnenberg, Hempel, Wijn

Ref. p. 2741 1.2.1.2.4 Fe-Co-Ni: magnetic moment, g-factor 175
0.5
0 0 0.2 0.4 0.6 0.8 1.0 Fe x- co
11 0 220
5.16
3.76
2.11
0.93
0.37
536 3.76 2.11 093 0.37 032 0 -0.05 -0.09
000 400
Fig. 66. Mean magnetic moment per atom as derived from magnetization measurements of fee Fe, -$o, alloys
Fig. 67. Map ofthe magnetic moment density,in [&A3],
precipitated from Cu, as a function ofconcentration. The for a Co,.,,Fe,.,, alloy in the (100) plane [70 D 11.
solid lines in the figure indicate the magnetic moment of bulk Fe-Co alloys [69 N 11.
00; 111 ---
jg-Lzq 2
Fig. 68. Map ofthe magnetic moment density, in [+,/!I~], for a Coo.92Feo.os alloy in the (110) plane [70 D 11.
Fig. 69. Magnetic moment density distribution m along the three major crystal axes in Co,,,,Fe,,,, [70 D 11.
6 Ps -27
4
I 2 F
-2 0 0.1 0.2 0.3 0.4 0.5 0.6
Landolt-BOrnstein New Series 111/19a
Bonnenberg, Hempel, Wijn
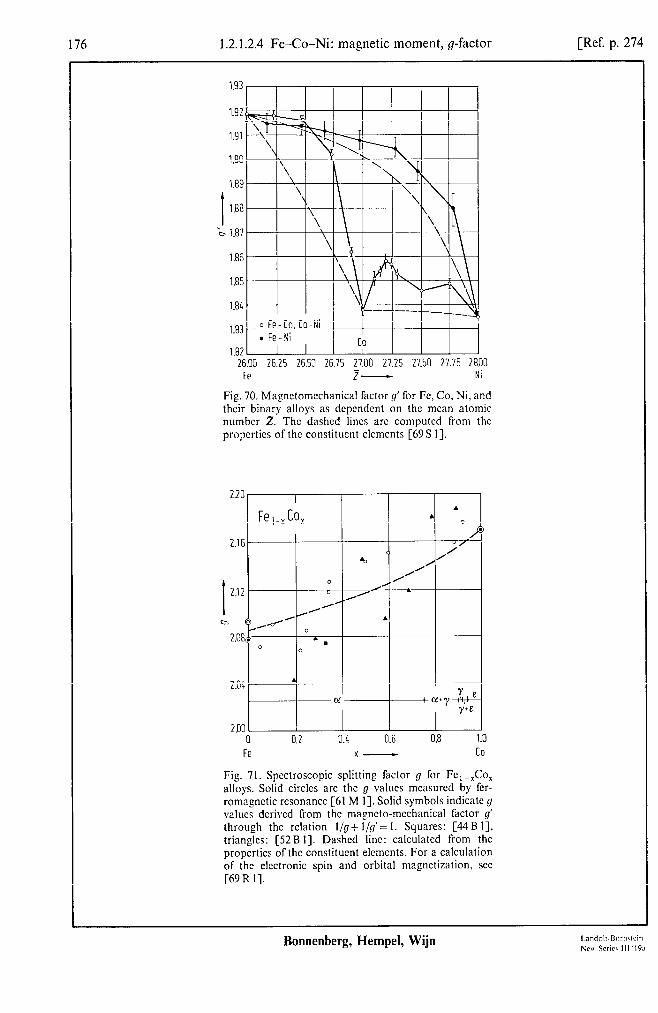
176 1.2.1.2.4 Fe-Co-Ni: magnetic moment, g-factor [Ref. p. 274
I I I ‘\I I\ I I ‘\ I \Ir 1 1 1.88
'Ll 1.87
1.86
1.85
1.84
1.83 l- o Fe- Co, Co-Ni 1 Y
. Fe - Ni I rn
lR?I I I L” I
26.00 26.25 26.50 26.75 27.00 27.25 27.50 27.75 28.00 Fe z- Ni
Fig. 70. Magnctomcchanical factor g’ for Fc, Co, Ni, and their binary alloys as dcpcndent on the mean atomic number z. The dashed lines arc computed from the properties of the constituent elcmcnts [69 S 1).
2.16 / ‘ a /’
/ /’
I
,/ 2.12 /’ 0 .,’
.’ . . .
I 0,
2.00 I I 0 0 0.2 0.2 0.4 0.4 0.6 0.6 0.8 0.8 1.0 1.0
220, I I I I
Fe,.Jo, . .
Fe x- CO
Fig. 71. Spectroscopic splitting factor g for Fc, -,Co, alloys. Solid circles arc the g values mcasurcd by fer- romagnctic rcsonancc [61 M I]. Solid symbols indicate 9 values dcrivcd from the magneto-mechanical factor g’ through the relation l/g+ l/g’= I. Squares: [44 B I], triangles: [52B I]. Dashed lint: calculated from the properties of the constituent elements. For a calculation of the electronic spin and orbital magnetization, see [69 R I].
Bonnenberg, Hempel, Wijn

Ref. p. 2741 1.2.1.2.4 Fe-Co-Ni: magnetic moment, g-factor 177
Table 9. Magnetic moment distribution in Fe, Jo, alloys [70D 1, 72M3, 62S2].
g: gyromagnetic ratio derived from magnetic form factors as obtained from polarized neutron scattering
&,: mean atomic moment &: average conduction electron polarization per atom y: fraction of 3d electrons in an E, state
X 9 Y Pat PE Ref. PB PB
0.9175 2.17 0.472( 1) 2.057(40) -0.39(3) 70Dl 0.8865 2.14 0.474(2) 2.15(6) -0.43(7) 70Dl 0.883 2.16 0.476( 1) 2.15(4) -0.46(3) 70Dl 0.858 2.16 0.478(l) 2.06(3) -0.33(2) 70Dl 0.91 0.471(11) 1.99(2) -0.31(3) 72M3 0.91 ‘) 0.463(13) 1.75(2) -0.28(7) 72M3 1.00 7 1.86(7) -0.28(7) 6282
Table 10. Magnetomechanical ratio g’ for Fe-Co alloys [69 S 11.
Composition 9’
Fe Fe-20 wt % Co Fe-50 wt% Co Fe-75 wt% Co Fe-90 wt% Co co
1.919 (2) 1.918 (2) 1.916 (2) 1.902 (2) 1.862 (2) 1.838 (2)
‘) At 600°C. “) Inapplicable.
Table 11. Room-temperature values of the relative orbital magnetic moment, por,,/&,, for binary alloys between Fe, Co or Ni, as obtained from Einstein-de Haas gyromagnetic ratio measurements according to the relation g’= 2- 2por,,/&. .Z: mean atomic number [69 R 11. The values g’ are from [62 S 1, 66 S 1, 69 S 11.
Fe
wt%
co Ni
100 0 0 26.00 4.22(12) 90 0 10 26.18 4.44(22) 75 25 0 26.24 4.28(9) 75 0 25 26.48 4.49(22) 50 50 0 26.49 4.38(9) 65 0 35 26.68 4.60(9) 25 75 0 26.74 5.15(10) 10 90 0 26.90 7.41(15) 50 0 50 26.98 4.80(24) 0 100 0 27.00 8.81(9) 0 90 10 27.10 8.05(16) 0 85 15 27.15 7.88(8) 0 80 20 27.20 7.64(15) 0 75 25 27.25 7.70(15)
35 0 65 27.28 5.04(20) 0 70 30 27.30 7.93(8)
25 0 75 27.48 5.54(22) 0 50 50 27.51 8.34(16) 0 25 75 27.75 8.17(8)
10 0 90 27.79 6.38(32) 0 0 100 28.00 8.92(9)
1.919(2) 1.915(4) 1.918(2) 1.914(4) 1.916(2) 1.912(2) 1.902(2) 1.862(2) 1.908(4) 1.838(2) 1.851(3) 1.851(2) 1.858(3) 1.857(2) 1.904(4) 1.853(2) 1.895(4) 1.846(3) 1.849(2) 1.880(6) 1.835(2)
Landolt-BOrnstein New Series lll/l9a
Bonnenberg, Hempel, Wijn

178 1.2.1.2.4 Fe-Co-Ni: magnetic moment, g-factor [Ref. p. 274
Table 12. Room-temperature values of electron spin magnetic moment pspin and orbital magnetic moment porb per atom of binary alloys between Fe, Co or Ni. Also the relation 9-l +g’-‘ between the spectroscopic splitting factor 9 (obtained from interpolation ofdata from [61 M 11) and the magnctomechan- ical factor 9’ (obtained from interpolation of the data from [62S 1, 66 S 1, 69 S 11) is indicated [69 R 11.
Fe
wt%
co Ni P orb PSpi” g-‘+g’-’ Pfl Pa
100 0 0 0.0918(33) 2.083(23) 90 0 10 0.0962(76) 2.070(46) 75 25 0 0.1036(37) 2.319(26) 75 0 25 0.0910(62) 1.934(43) 50 50 0 0.1047(37) 2.288(25) 65 0 35 0.0638(28) 1.322(28) 25 75 0 0.1085(34) 2.096(21) 10 90 0 0.1353(35) 1.691(17) 50 0 50 0.0729(48) 1.447(32) 0 100 0 0.1472(34) 1.523(15) 0 90 10 0.1291(41) 1.475(18) 0 85 15 0.1228(31) 1.436(18) 0 80 20 0.1156(38) 1.397(26) 0 75 25 0.1127(28) 1.350(15)
35 0 65 0.0676(43) 1.273(28) 0 70 30 0.1121(28) 1.301(15)
25 0 75 0.0618(37) 1.053(24) 0 50 50 0.0986(31) 1.083(13) 0 25 75 0.0725( 18) 0.8 15(V)
10 0 90 0.0539(27) 0.790( 19) 0 0 100 0.0508 (12) 0.518(6)
Fig. 72a. Variation of the mean magnetic moment per Fig. 72b. Average magnetic moment per atom p,, and atom j,, with composition for Fe, -xNi, alloys as dctcr- mined from the mcasurcmcnts of the saturation magncti-
high-field susceptibility xHF in a magnetic field H,,,, =16.5 kOc at a temperature of 4.2K for fee Fe,-,Ni,
zation [7OC2]. Bee: solid circles [63C4]; fee: open alloys. Open circles: [83N2], crosses: [63C4], solid circles [63 C43. crosses [52 K I], triangles [70 C 23. circles: [77 Y 11, squares: [77 R I].
-0 0.2 0.4 0.6 0.8 1.0 a Fe x- Ni
2.0 Ilri
I
1.5
I< 1.1 I-
O! i-
1.009 0.9994 0.9986 0.9985 0.9920 0.9987 0.9930 0.9980 0.9987 1.002
1.001
1.005 0.998
0.4 0.6 0.8 1.0 b X- Ni
Bonnenberg, Hempel, Wijn
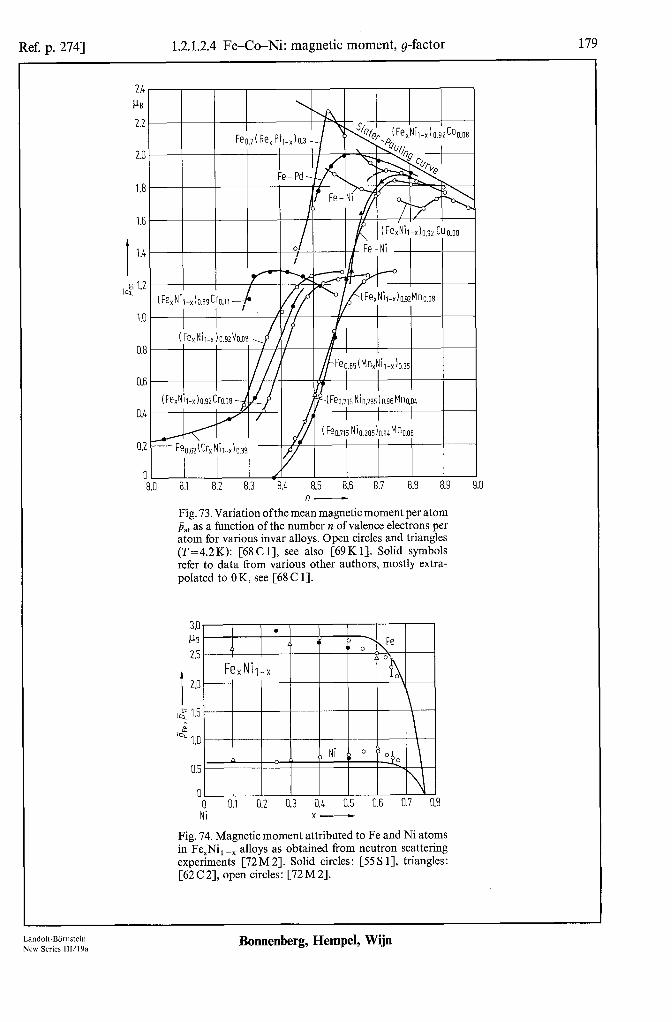
Ref. p. 2741 1.2.1.2.4 Fe-Co-Ni: magnetic moment, g-factor 179
2.2 I I I I
Feo,7(Re, Pt,.,)0.3 p $1 , ~JC~,.,p(Fe,Nil-,)o.92C00.08
1.8
0.8
( Feo.715 %.2do.gaMno.06 i i i
01 I I I I 8.0 8.1 8.2 8.3 8.4 8.5 8.6 8.7 8.8 8.9 9.0
fl- Fig. 73. Variation ofthe mean magnetic moment per atom j&t as a function of the number n of valence electrons per atom for various invar alloys. Open circles and triangles (T=4.2K): [68Cl], see also [69K 11. Solid symbols refer to data from various other authors, mostly extra- polated to 0 K, see [68 C 11.
,a' 1.5
14" 1.0
0.5
0 0 0.1 0.2 0.3 0.4 0.5 0.6 0.7 I Ni x-
Fig. 74. Magnetic moment attributed to Fe and Ni atoms in Fe,Ni,-, alloys as obtained from neutron scattering experiments [72 M 21. Solid circles: [55 S 11, triangles: [62 C 21, open circles: [72 M 21.
Land&-Bbmstein New Series lWl9a
Bonnenberg, Hempel, Wijn

180 1.2.1.2.4 Fe-Co-Ni: magnetic moment, g-factor [Ref. p. 274
Table 13. Magnetic moments J),,~ and pNi attributable to Fe and Ni atoms in Fe, -XNi, alloys, as derived from maenctic structure factors obtained from neutron scattering with either polarized (pol) or unpolarized (unpol) neutrons at room temperature. For theoretical calculations based on various theories, see [71 H 2: 72 H 1,7.5 R I, 79 I 1.81 K 11 for coherent potential approximation; [74 M3, 78 H 1,79 H 1,79 H 2,SO H 1,83 K 1,83 K 21 for similar calculations takin_c into account a chemical local environment effect; [79 M 21 for Hartree-Fock approximation in the itinerant electron theory. The samples arc polycrystalline, unless otherwise stated.
Fe _ Ni ,r I Sample PPe PNi PF~PNI Measuring Ref. X Ff3 Pa lb method
0.10 0.10 0.32 0.34 0.35 0.40 0.40 0.499 0.50 0.601 0.70 0.70 0.743 0.75
0.80 0.85 0.90
disordered 2.41(8) disordered ‘) 2.4 I (4) crystal. invar 1.10 invar 1.8o(15)3) crystal. invar 2.3(25) 2, disordered ‘) 2.44(8) disordered 2.42(17) disordered 2.60 crystal. disordered 2.54( 16) disordered 2.65 annealed 3.02(12) disordered 2.66(9) disordered 2.91 crystal. disordered 3.13(15) crystal, ordered ‘) 3.10(l) polycrystalline 2.97(15) disordered ‘) 2.99(l) disordered 2.56(33) disordered 2.58(14)
0.94(20) 0.93(10) 0.64 0.46 0.87(20) 3,
0.83(6) 0.82( 13) 0.67 1.93 (20) 0.78(4) 0.65 2.06(21) 0.63 & 0.09 0.63 +- 0.08 0.60 2.3 1(22) 0.63 (5) 0.68(5) 0.62(5) 2.35(20)
0.64(5)
Pal unpol Pal Pal unpol unpol Pal unpol unpol unpol unpol unpol unpol Pal Pal unpol unpol unpol unpol
63C2 62C2 82C1 7913 65C2 62C2 63C2 55Sl 73Cl 55Sl 62C2 62C2 55Sl 73Cl 73c1 55Sl 74Nl 74Nl 62C2
‘) In these polycrystallinc samples still an appreciable amount ofshort range order is present, which has been accounted for [62 C 2, 73 C 11. For a calculation of the local environment effect on the magnetic states of the atoms. see [79 H I. 79 M 21.
2, In the paramagnetic state the apparent iron atomic moment is pFe= 1.4(3)~,. see also [83 N 11. 3, AI 77 K. pee = 2.41(15) IL,, and pNi =0.82(5) 11~ [79 131.
0 CoCr P CoMn v CoNi
A FeCo v FeNi
D Ni Cr m Ni Cu q NiMn n NiV
01 I I 8.5 9.0 9.5 10.0 8.0 8.5 9.0
/I-
Fig. 75. Mean magnetic moment per atom p,, plotted Fig. 76. Mean magnetic moment per atom jj,, plotted against the avcragc number PI of 3d and 4s electrons per against the average number II of 3d and 4s electrons per atom for binary alloys with the same fee structure atom for binary alloys with the same bee structure [63C4]. NiCu [SSA I]. FcCo, CoNi [29W I]. FcNi [63C4]. [63C4]. NiCr. NiV. NiMn [32S 11, CoCr, CoMn [57C2].
7 NiCu
Bonnenberg, Hempel, Wijn
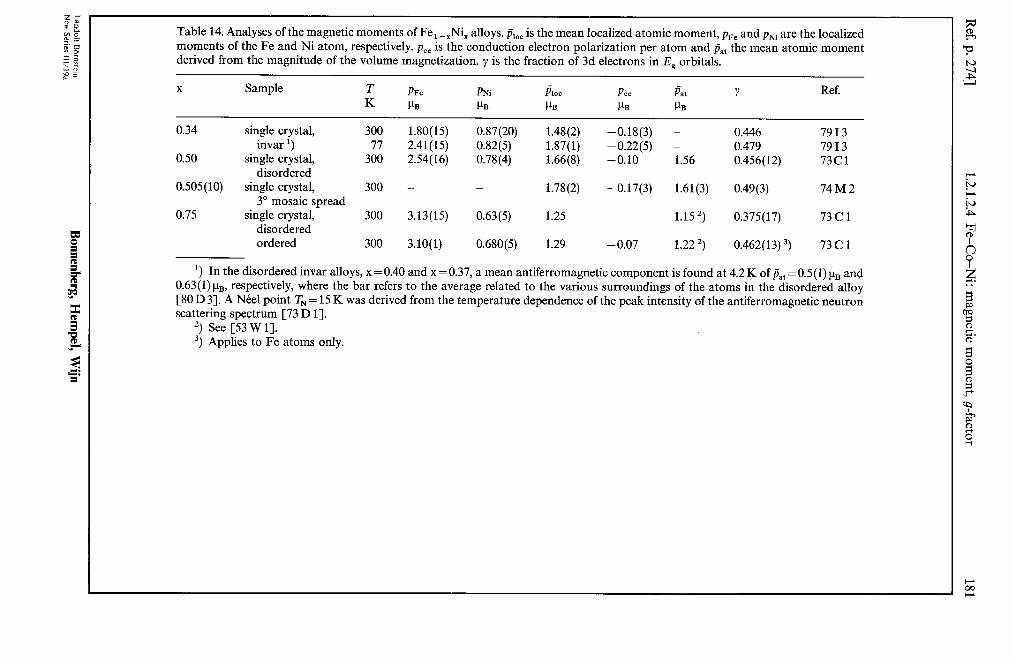
Table 14. Analyses of the magnetic moments of Fe, -xNi, alloys. pi,, is the mean localized atomic moment, pFe and pNi are the localized moments of the Fe and Ni atom, respectively. p,. is the conduction electron polarization per atom and pat the mean atomic moment derived from the magnitude of the volume magnetization. y is the fraction of 3d electrons in E, orbitals.
X Sample T PFe PNi PIOC PC, Pat Y Ref. K PB PB PB PB PB
0.34 single crystal, 300 1.80(H) 0.87(20) 1.48(2) invar ‘)
-0.18(3) - 0.446 7913 77 2.41(15) 0.82(5) 1.87(l) -0.22(5) - 0.479 7913
0.50 single crystal, 300 2.54(16) 0.78(4) 1.66(8) -0.10 1.56 0.456(12) 73Cl disordered
0.505(10) single crystal, 300 - - 1.78(2) -0.17(3) 1.61(3) 0.49(3) 74M2 3” mosaic spread
0.75 single crystal, 300 3.13(15) 0.63(5) 1.25 - 1.15 “) 0.375(17) 73Cl disordered ordered 300 3.10(l) 0.680(5) 1.29 -0.07 1.22 “) 0.462(13) “) 73Cl
‘) In the disordered invar alloys, x = 0.40 and x = 0.37, a mean antiferromagnetic component is found at 4.2 K of p,, = 0.5 (1) uB and 0.63(l) l.tB, respectively, where the bar refers to the average related to the various surroundings of the atoms in the disordered alloy [80 D 31. A Neel point TN = 15 K was derived from the temperature dependence of the peak intensity of the antiferromagnetic neutron scattering spectrum [73 D 11.
‘) See [53 W 11. 3, Applies to Fe atoms only.

182 1.2.1.2.4 Fe-Co-Ni: magnetic moment, g-factor [Ref. p. 274
1
2.0
PE
1.5
I
1.5
I+;-
1.0
0.5
0 0.3 0.6 0.9 1.2 Y-
Fig. 77. Depcndencc of the mean magnetic moment per atom A, derived from the extrapolated spontaneous mqnetixttion at OK and at atmospheric prcssurc on the hydrogen content of disordcrcd fee Fc, -,Ni,H, alloys. The dashed-dotted line is calculated for NiH; [78A I].
0 2.5 5.0 1.5 at% Al -
Fig. 78. Mean magnetic moment per atom j,, vs. Al concentration for fee Fe -Ni--AI alloys [67 B 11.
2.5 I
Fe-Ni-Al . Fe-Ni o 5at%Al A lOat%Al
1 1.5
n 1s"
1.0
0.5
0 8.00 8.25 8.50 8.75 9.00 9.25 9.50 9.75 10.00
/7-
Fig. 79. Mean magnetic moment per 3d-atom j&, vs. number n of valcncc electrons per atom for FcNikAI alloys [67 B I], solid triangles [39 S I]. The dashed line is calculated for random alloys containing 20at% Al.
Bonnenberg, Hempel, Wijn
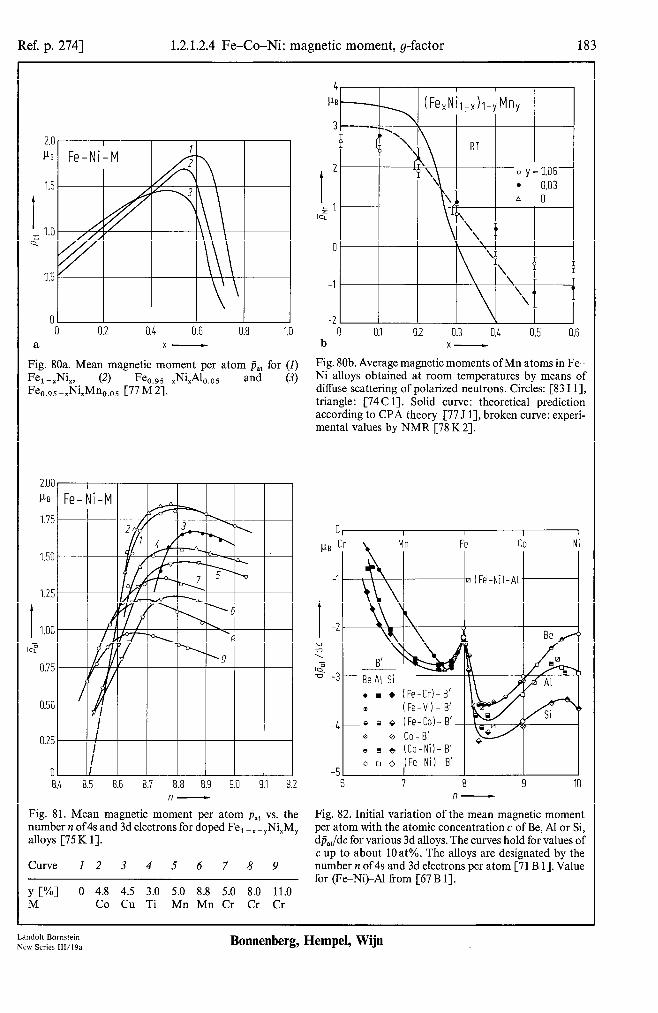
Ref. p. 2741 1.2.1.2.4 Fe-Co-Ni: magnetic moment, g-factor 183
0 0.2 0.4 0.6 0.8 1.0 a x-
Fig. 80a. Mean magnetic moment per atom j,, for (I) Fe, -,Ni,, (4 Feo.95-xW~o.05 and (3) Feo.95 -xNi,Mno.05 C77 M 21.
8X 8.5 8.6 8.7 8.8 8.9 9.0 9.1 5 /I-
I.2
Fig. 81. Mean magnetic moment per atom Pat vs. the number n of4s and 3d electrons for doped Fe, -,-,Ni,M, alloys [75 K 11.
Curve I 2 3 4 5 6 7 8 9
Y WI 0 4.8 4.5 3.0 5.0 8.8 5.0 8.0 11.0 M Co Cu Ti Mn Mn Cr Cr Cr
0 01 0.2 0.3 06 0.5 0.6 b x-
Fig. 80b. Average magnetic moments of Mn atoms in Fe- Ni alloys obtained at room temperatures by means of diffuse scattering of polarized neutrons. Circles: [83 I 11, triangle: [74C 11. Solid curve: theoretical prediction according to CPA theory [77 J 11, broken curve: experi- mental values by NMR [78 K 21.
I Fe
I
I I CO Ni
% B'
- Be Al Si . n + (Fe-Cr)-8' e (Fe-V)- B'
-0 q o (Fe-Co)-B' 0 8 Co-B' e q e (Co-Ni)-B' o q o (Fe-Nil-B'
I
9 10 n-
Fig. 82. Initial variation of the mean magnetic moment per atom with the atomic concentration c of Be, Al or Si, dji,,/dc for various 3d alloys. The curves hold for values of c up to about lOat%. The alloys are designated by the number n of4s and 3d electrons per atom [71 B 11. Value for (Fe-NikAl from [67 B 11.
Landolt-Bornstein New Series III/l9a
Bonnenberg, Hempel, Wijn
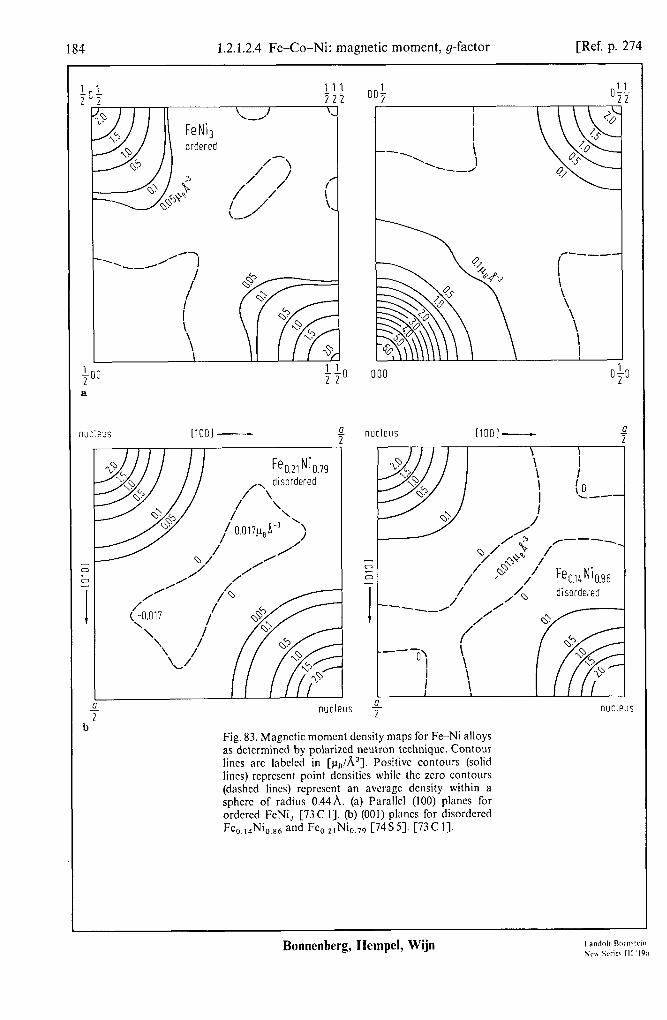
184 1.2.1.2.4 Fe-Co-Ni magnetic moment, g-factor [Ref. p. 274
a
L
nucleus
00; I
I -\ \ \ ‘-A-/
/----
I \ \ \
\
\ 1
000 050
nucleus IlOOl-
0 Q,/$ //I----
;; ,/ ,@ ,’ Fe0.1LNi0.86
l-
/ ,A disordered
----/ / /
/
_--- 0’ c
I \
I \ \
0 2 nucleus
Fig. 83. Magnetic moment density maps for Fe-Ni alloys as determined by polarized neutron technique. Contour lines arc labeled in [pn/A3]. Positive contours (solid lines) represent point dcnsitics while the zero contours (dashed lines) represent an average density within a sphere of radius 0.44,k (a) Parallel (100) planes for ordered FeNi, [73C 1 J. @) (001) planes for disordered FC O.ld%.lh and %21Nio,79 C74S 51. C73 C Il.
Bonnenberg, Hempel, Wijn
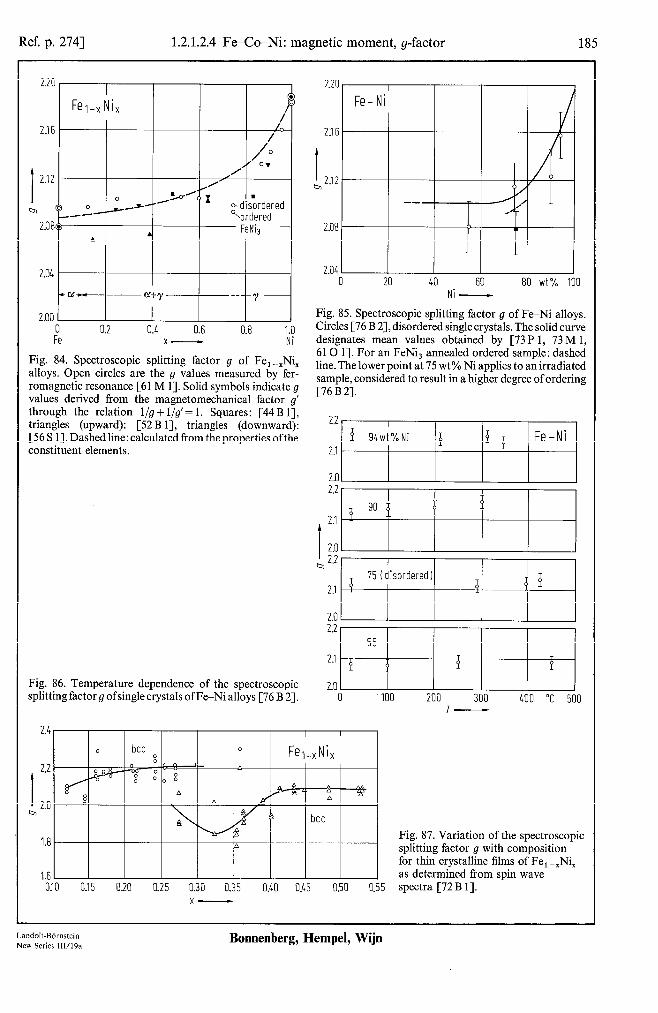
Ref. p. 2741 1.2.1.2.4 Fe-Co-Ni: magnetic moment, g-factor 185
2.04
2.00 I
Fe 0.2 0.4 0.6 0.8 1.0
x- Ni
Fig. 84. Spectroscopic splitting factor g of Fe,-xNi, alloys. Open circles are the g values measured by fer- romagnetic resonance [61 M 11. Solid symbols indicate g values derived from the magnetomechanical factor g’ through the relation l/g + l/g’ = 1. Squares: [44 B 11, triangles (upward): [52 B 11, triangles (downward): [56 S 11. Dashed line: calculated from the properties ofthe constituent elements.
Fig. 86. Temperature dependence of the spectroscopic splitting factor g ofsingle crystals of FeNi alloys [76 B 21.
2.16
I b232
2.08
0 20 40 60 80 wt% 100 NI -
Fig. 85. Spectroscopic splitting factor g of Fe-Ni alloys. Circles [76 B 21, disordered single crystals. The solid curve designates mean values obtained by [73P 1, 73 M 1, 610 11. For an FeNi, annealed ordered sample: dashed line. The lower point at 75 wt% Ni applies to an irradiated sample, considered to result in a higher degree of ordering [76 B 21.
ZJqIqq 0 100 200 300 400 “C 500
T-
2.4
1.6 030 0.15 0.20 0.25 0.30 0.35 0.40 0.45 0.50 0.55
x-
Fig. 87. Variation of the spectroscopic splitting factor g with composition for thin crystalline films of Fe, -,Ni, as determined from spin wave spectra [72 B I].
Landolt-Bbmstein New Series IIl/19a
Bonnenberg, Hempel, Wijn

186 1.2.1.2.4 Fe-Co-Ni: magnetic moment, g-factor [Ref. p. 274
2.2C
I
2.15
ca
2.10
2D5
200 1
[
x I I
75 E IOat%Ni Ni ’ \ ‘CO
I I
g-2 =2-
v Fe-Co
I 1.85 1.90 1.95 2 9’-
Fig. 88. Room-tempcraturc values of the spectroscopic splitting factor n plotted vs. the magnetomechanical 9’ factor for Fe -Ni, Fe Co, Co-Ni [61 M I]. The 9 value of Co has been extrapolated from the g of the Fe-Co and Co-Ni alloys. The numbers beside the points give the concentration in [at%] of the clement added.
Table 15. Atomic magnetic moments for Co,,,,Ni,,,, and Co,,,Ni,,, [65C 11.
Alloy PI31 IPro-PNil PC0 PNi
co 0.25Ni0.75 0X9(2) 1.26(4) 1.84(5) -0.05(5)
or 0.58(2) 1.21(2)
%.s-Nio.5 1.14(2) 1.12(4) 1.70(3) 0.58(3)
or 0.W) 1.70(3)
0 0.25 0.50 0.75 1.00 x-
Fig. 89. Atomic magnetic moments pen and pNi in Co, -,Ni, alloys. Open circles: [65 C I], triangles: [63 C2, 63C3]. The curves drawn arc based on the coherent potential approximation (CPA) [77 M 41, see also [72 H I].
Bonnenberg, Hempel, Wijn

Ref. p. 2741 1.2.1.2.4 Fe-Co-Ni: magnetic moment, g-factor 187
Table 16. Mean magnetic moment contributions per atom, in [pB], for fee Co-Ni alloys at room temperature [71 A 1,70 A 11, Ni [66 M 11.
co o.91Feo.,, Coo.65Nio.35 Coo.50Nio.50 %.25%75 Coo.lo%90 Ni
Pat 1.820(10) 1.342(6) 1.173(23) 0.876(5) 0.712(5) 0.579(5) Porb 0.135(8) 0.105(6) 0.097(5) 0.072(4) 0.062(4) 0.053(3) Pspin 1.993(21) 1.421(9) 1.217(8) 0.927(6) 0.737(6) 0.621(5) PC0 -0.308(25) -0.184(12) -0.141(25) -0.123(9) - 0.087(9) -0.095(7)
“+A--~.~ I I f-b ~>l<Cox%-xh.9~ M n 0.02
3r IT \
f
\ 600 K 2' h’T \
1: 480
i i P 111 \~~
-. \ -- -. \
t
1 \
I
360
I
\ -- \,
Id 0 \ IZ
1
\
240 \
-1 - \.
:/ 1 ". ;; IOOK "');
0
I 0 0.3 0.6 0.9 1.2 1.5 0 0.1 0.2 0.3 0.4 0.5 0.6
n- x-
Fig. 90. Mean magnetic moment per 3d atom pa,t Fig. 91. The mean magnetic moment &,” of the Mn atoms derived Tom low-temperature magnetization measure- in OxNil -xlo.9sMno.02 alloys [79S2]. Dashed line: ments and T, for hydrogenated Co, -,Ni, alloys. The H calculation based on the coherent potential approxim- concentration is given by the ration between the number ation (CPA) [76 J I]. of H atoms and metal atoms [SO A 11.
LandoIl-Bbmstein Bonnenberg, Hempel, Wijn New Series 11~19~3
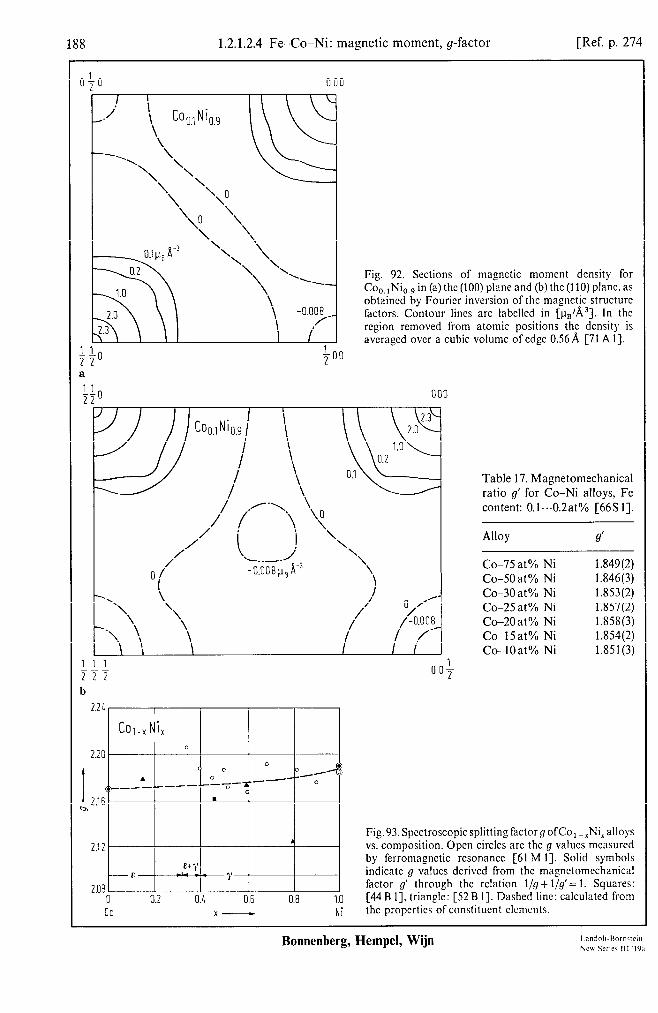
188 1.2.1.2.4 Fe-Co-Ni: magnetic moment, g-factor [Ref. p. 274
Te
\ \ ‘\O \ \ ‘1 ’ \ a&co \ ’ ‘\\\ \ \ -_
\ \ -0.008 \ /’
,/ Fig. 92. Sections of magnetic moment density for Coo. l%.9 in (a) the (100) plane and (b) the (110) plane. as obtained by Fourier inversion of the magnetic structure factors. Contour lines arc labclled in [un/A3]. In the region removed from atomic positions the density is averaged over a cubic volume of edge 0.56 A [71 A I].
000
99
/ .r-\ \ ,/ / ‘\, y\
,’ \ 1 \
Of
L.-- i -o.oo8p,8-3
‘\ \
-\ \ \
>
\ ,/ O/Y’
---Y \ \ \
I \
,/ ,1-y”
I I I 1 00;
Table 17. Magnetomechanical ratio g’ for Co-Ni alloys, Fe content: 0.1...0.2at% [66S 11.
Alloy
Co-75 at% Ni Co-50 at% Ni Co-30 at% Ni Co-25 at% Ni Co-20 at % Ni Co-15 at% Ni Co-lOat% Ni
9’
1.849(2) 1.846(3) 1.853(2) 1.857(2) 1X58(3) 1.854(2) 1.851(3)
/ COJ.~ Ni,
0 0 (’ 0 . 0 . 0 0 __-- 1 --- -:-
x.-- ,“-- c .
0.6
Fig. 93. Spectroscopic splitting factor g ofCo, -,Ni, alloys vs. composition. Open circles arc the g values mcasurcd by ferromagnetic resonance [61 M I]. Solid symbols indicate g values dcrivcd from the magnetomcchanical factor g’ through the relation l/g+l/g’= 1. Squares:
1.0 [44 B I], triangle: [52 B I]. Dashed line: calculated from Ni the propcrtics ofconstitucnt clcmcnts.
Bonnenberg, Hempel, Wijn
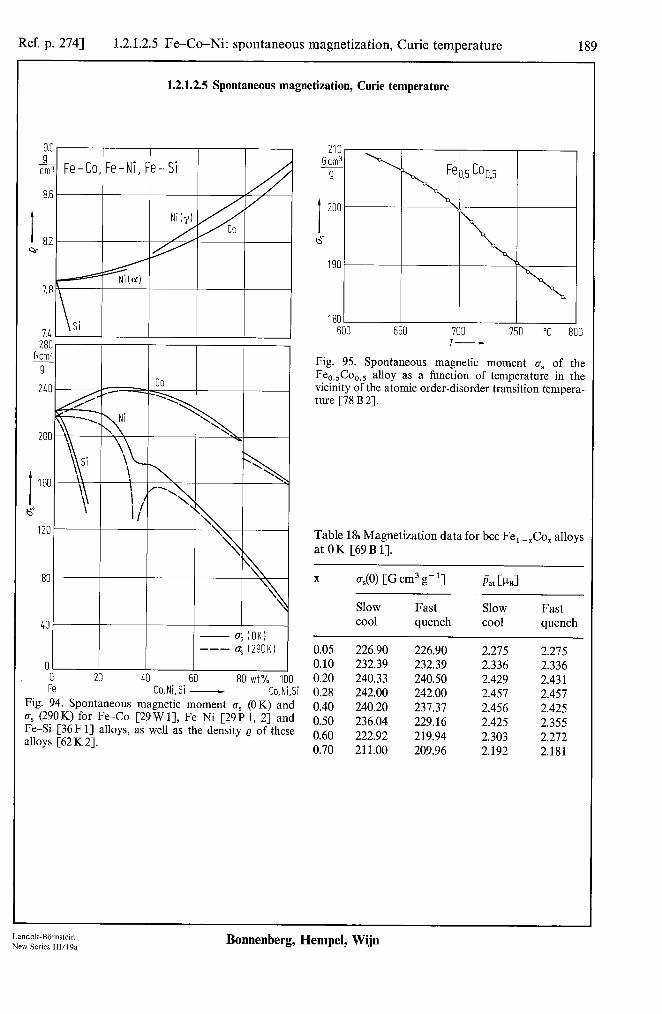
Ref. p. 2741 1.2.1.2.5 Fe-Co-Ni: spontaneous magnetization, Curie temperature 189
9.0 9
Tic
8.6
I 8.2 9F
1.2.1.2.5 Spontaneous magnetization, Curie temperature
Fe-Co, Fe-Ni, Fe-Si
0 20 xl 60 80 wt% 100 Fe Co. Ni. Si - Co.Ni,Si
Fig. 94. Spontaneous magnetic moment cs (OK) and o, (290 K) for Fe-Co [29 W 11, Fe-Ni [29P 1, 21 and Fe-Si [36 F l] alloys, as well as the density Q of these alloys [62 K 21.
600 650 i I
I 750 “C E
Fig. 95. Spontaneous magnetic moment c’s of the %dh,.5 alloy as a function of temperature in the vicinity of the atomic order-disorder transition tempera- ture [78 B 21.
Table 18) Magnetization data for bee Fe, -$!o, alloys at OK [69B 11.
X
0.05 0.10 0.20 0.28 0.40 0.50 0.60 0.70
o,(O) [G cm3 g-l] Lt CPBI
Slow Fast Slow cool quench cool
226.90 226.90 2.275 232.39 232.39 2.336 240.33 240.50 2.429 242.00 242.00 2.457 240.20 237.37 2.456 236.04 229.16 2.425 222.92 219.94 2.303 211.00 209.96 2.192
Fast quench
2.275 2.336 2.43 1 2.457 2.425 2.355 2.272 2.181
Land&BOrnstein New Series llVl9a
Bonnenberg, Hempel, Wijn
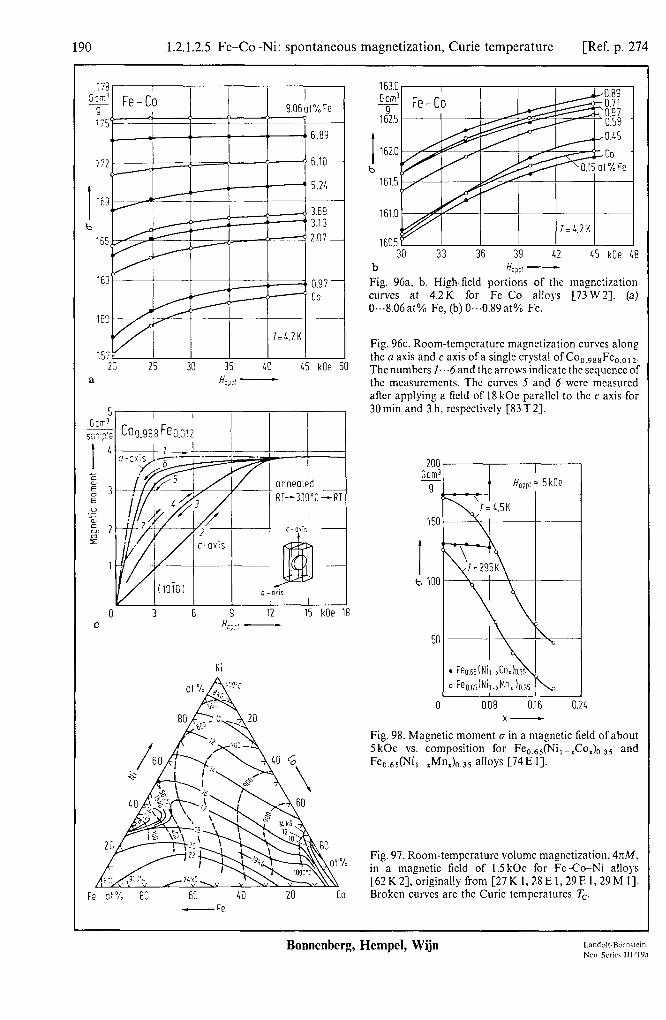
190 1.2.1.2.5 Fe-Co-Ni: spontaneous magnetization, Curie temperature [Ref. p. 274
178 GT'
9 175
zc 25 30 35 40 45 kOe 50 a Hy o-p! -
Gci,? I
So Co0.9de0.0t2 ’ I I I
V I I I I I I 0 3 6 9 12 15 kOe 18
C Ho>,, -
Ni
F? 01 “i. 80 60 20 CO
163.0 I Gcm3 Fe-Co
Is925 I
I 162.0
b 161.5
161.0
16OSr I 30 33 36 39 L2 15 kOe
I 19
b H VP’ -
Fig. 96a. b. High-ticld portions of the magnetization curves at 4.2K for Fe-Co alloys [73 W 23. (a) 0...8.06 at% Fe, (b) 0...0.89 at% Fe.
30 nun-and 3-h, rcspcctivcly [83T 21.
2oc Gem'
Q
15c
I b IOC
I H opp: = 5kOe
Fig. 96~. Room-tempcraturc magnetization curves along the o axis and c axis of a single crystal of Co,,,,Fe,,,,,. The numbers I...6 and the arrows indicate the sequence of the mcasurcmcnts. The curves 5 and 6 were measured after applying a field of 18 kOe parallel to the c axis for
0 0.08 0.16 0.21, x-
Fig. 98. Magnetic moment u in a magnetic field of about 5 kOe vs. composition for Fe,,,,(Ni, -rCo,)0,35 and Feo.6S(Ni,-,Mn,h.35 alloys C74E II.
Fig. 97. Room-temperature volume magnetization. 4rrh4, in a magnetic field of 1.5 kOc for Fe -CoPNi alloys [62 K 21, originally from [27 K 1, 28 E I, 29 E I, 29 M I]. Broken curves arc the Curie tcmpcraturcs Tc.
- Fe
Bonnenberg, Hempel, Wijn
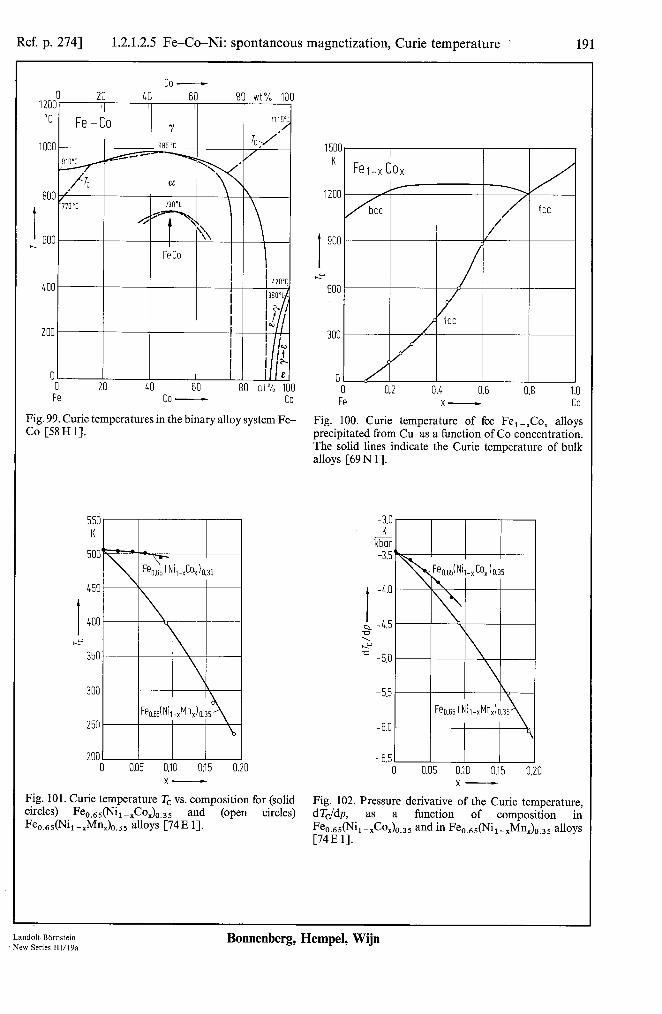
Ref. p. 2741 1.2.1.2.5 Fe-Co-Ni: spontaneous magnetization, Curie temperature . 191
01 I ’ I
0 20 40 60 90 at% :OO Fe co - co
Fig. 99. Curie temperatures in the binary alloy system Fe- Co [5SH 11.
550 550 K K
500 500
450 450
t t 400 400
k-!! k-!! 350 350
300 300
250 250
200 0 0.05 0.10 0:15
x- 2ooON
x-
Fig. 101. Curie temperature Tc vs. composition for (solid circles) Feo.6dW -xCo,h35 and (open circles) %65WLMnxh35 alloys C74E 11.
bee /- / fee
I
1’ 900
b-Y 600
0 0.2 0.4 0.6 0.8 1.0 Fe x- co
Fig. 100. Curie temperature of fee Fe,-$0, alloys precipitated from Cu as a function of Co concentration. The solid lines indicate the Curie temperature of bulk alloys [69 N 11.
-3.0 K kbar -3.5
I -4.0
Q -4.5 ?
s -5.0
-5.5
-6.0
-6.5 ( 0 0.05 0.10 0.15 0.20
x-
Fig. 102. Pressure derivative of the Curie temperature, dTJdp, as a function of composition in Feo,dW -xCox1~.35 and in Feo,60Jil -xMnxh.35 alloys [74E 11.
Landolt-Bbmctein New Series lll/l9a
Bonnenberg, Hempel, Wijn
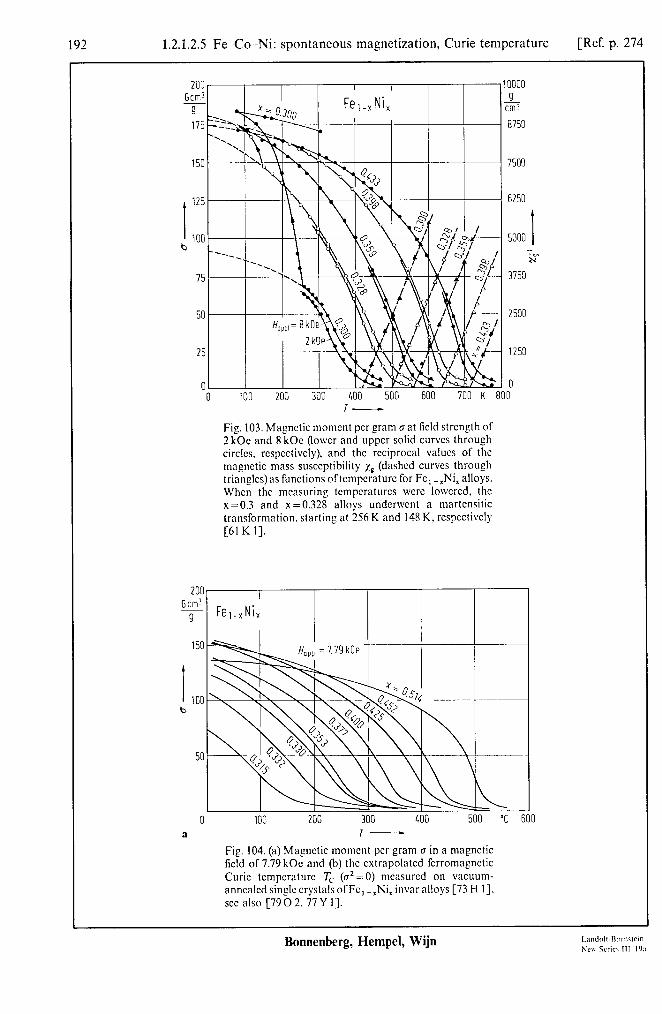
192 1.2.1.2.5 Fe-Co-Ni: spontaneous magnetization, Curie temperature [Ref. p. 274
200 Gcm3
9 175
10000 9 cm! 8750
7500
I 125
100 b
6250
5000 I 7s
, 3750
I 2500
, 1253
1 0 II 100 200 300 LOO 500 600 700 K 800
1st
I 101 b
0 a
I-
Fig. 103. Magnetic moment per gram u at ticld strength of 2 kOc and 8 kOc (lower and upper solid curves through circles. rcspcctivcly). and the reciprocal values of the magnetic mass susceptibility xp (dashed curves through trianglcs)as functions oftempcraturc for Fc, -INi, alloys. When the measuring tcmpcraturcs wcrc lowcrcd, the x=0.3 and x=0.328 alloys underwent a martcnsitic transformation. starting at 256 K and I48 K, rcspcctivcly [6l K I].
100 200 300 400 500 "C 600 I-
Fig. 104. (a) Magnetic moment per gram r~ in a magnetic licld of 7.79 kOe and (b) the extrapolated ferromagnetic Curie tcmpcraturc T, (02=0) mcasurcd on vacuum- anncalcd single crystals ofFc, -,Ni, invar alloys [73 H I]. see also [7902. 77Y I].
Bonnenberg, Hempel, Wijn

Ref. p. 2741 1.2.1.2.5 Fe-Co-Ni: spontaneous magnetization, Curie temperature 193
1.; 40'
g&l 92
I
01
“b
0.4
165
I
160
b 155
130 0 50 100 150kOe 2
1 ‘00
a H-
Fig. 105a. Magnetic moment per unit mass (r vs. internal magnetic field H for a single crystal of Fe,,,,,Ni,,,,, along the easy axis of magnetization. At the lower temperature a hysteresis is found when a field above a certain critical field H,, is applied. At 4.2K, H,, =60(10)kOe for Fe,,,,,Ni,,,,, [83P 11, see also [8ON I].
b
lL5.65 c
162.05
!
1 = k.2 K
I I I I I
0 3 6 9 12 15 kOe 18 b H OPP’ -
Fig. 105b. Variation of the magnetic moment per gram with applied magnetic field, Happ,, at a temperature of 4.2 K for spherical single crystals of fee Fe, -XNi, alloys. The arrows indicate the magnitude of the demagnetizing field strength H, [83N2].
Landolt-Bdmkn New Series lll/l9a
Bonnenberg, Hempel, Wijn
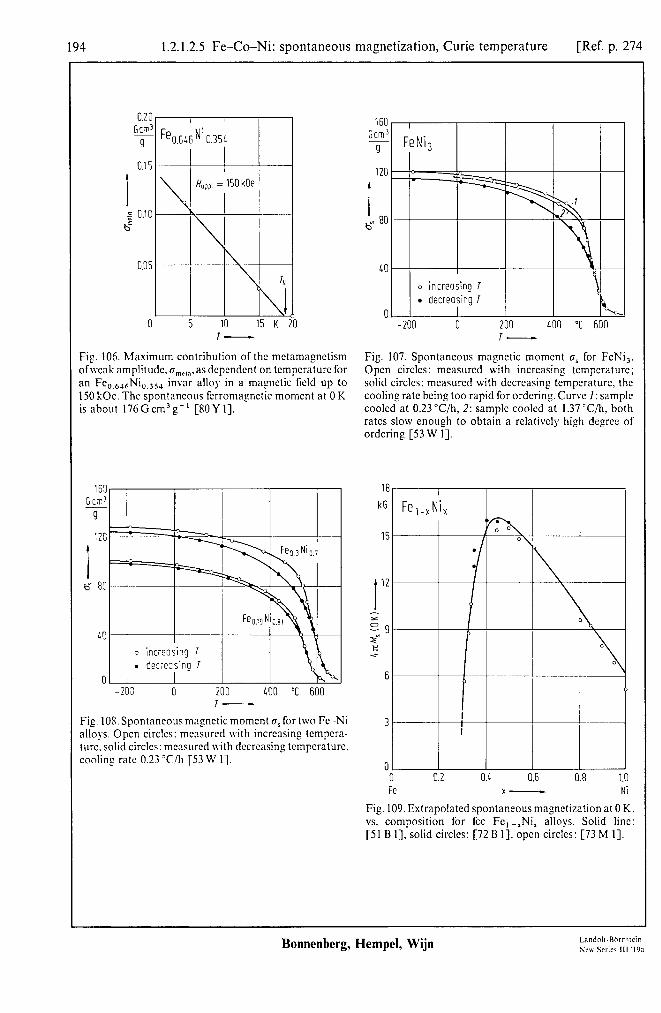
194 1.2.1.2.5 Fe-Co-Ni: spontaneous magnetization, Curie temperature [Ref. p. 274
0.15
I \
e G.iO
2
0.05
E 0
HcJs' =l5OkDe ~
I
3.k 4
I 10 15 K
-L 5
I-
Fig. 106. Maximum contribution of the mctamagnctism ofweak amplitude,cr,,,,. as dependent on tcmpcraturc for an b 6&‘i~.3sJ invnr alloy in a maynctic field up to I50 kOe. The spontaneous ferromagnetic moment at 0 K is about 176Gcm3g-’ [SOY I].
0 increasing 1
. decreasing T
0 -2K 0 200 400 "C 600
I-
Fig. 10s. Spontaneous magnetic moment gs for two Fc -Ni alloys. Open circles: mcnsurcd with increasing tempcra- turc. solid circles: measured with dccrcnsing tcmpcraturc. cooling rate 0.23 ‘C/h [53 W I].
160r Gcm3
9
120
I d 80
40
0
I
0 increasing I
. decreasing 7 I 0 100 "C 600
I-
Fig. 107. Spontaneous magnetic moment G, for FeNi,. Open circles: measured with increasing tcmpcraturc; solid circles: measured with decreasing temperature. the cooling rate being too rapid for ordering. Curve 1: sample cooled at 0.23 “C/h, 2: sample cooled at I .37 ‘C/h, both rates slow enough to obtain a relatively high degree of ordering [53 W I].
0 0.2 OX 0.6 0.8 1.0 Fe x- Ni
Fig. 109. Extrapolated spontaneous magnetization at 0 K. vs. composition for fee Fe,-,Ni, alloys. Solid line: [Sl B 11. solid circles: [72 B I], open circles: [73 M I].
Bonnenberg, Hempel, Wijn
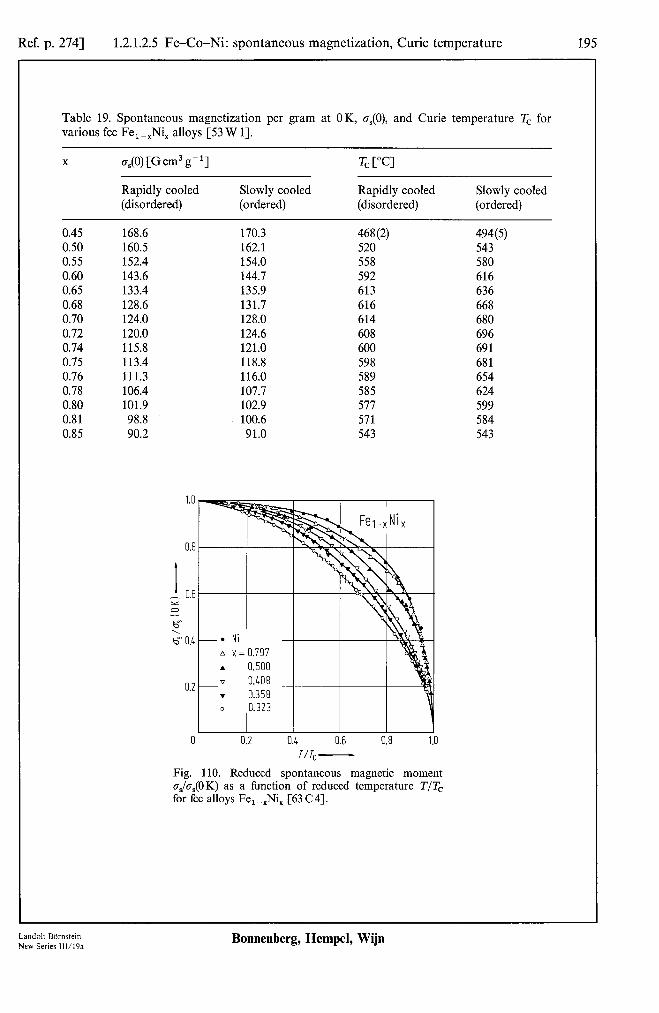
Ref. p. 2741 1.2.1.2.5 Fe-Co-Ni: spontaneous magnetization, Curie temperature 195
Table 19. Spontaneous magnetization per gram at OK, a,(O), and Curie temperature Tc for various fee Fe, -.Ni, alloys [53 W 11.
X o,(O) [Gcm3 g-l] T, iX1
Rapidly cooled Slowly cooled Rapidly cooled Slowly cooled (disordered) (ordered) (disordered) (ordered)
0.45 168.6 170.3 468(2) 494(5) 0.50 160.5 162.1 520 543 0.55 152.4 154.0 558 580 0.60 143.6 144.7 592 616 0.65 133.4 135.9 613 636 0.68 128.6 131.7 616 668 0.70 124.0 128.0 614 680 0.72 120.0 124.6 608 696 0.74 115.8 121.0 600 691 0.75 113.4 118.8 598 681 0.76 111.3 116.0 589 654 0.78 106.4 107.7 585 624 0.80 101.9 102.9 577 599 0.81 98.8 100.6 571 584 0.85 90.2 91.0 543 543
Fig. 110. Reduced spontaneous magnetic moment a&,(OK) as a function of reduced temperature T/T, for fee alloys Fe, -,Ni, [63 C4].
Landolt-BBrnstein New Series 111/19a
Bonnenberg, Hempel, Wijn

196 1.2.1.2.5 Fe-Co-Ni: spontaneous magnetization, Curie temperature [Ref. p. 274
1.0
Fig. 1 I I. Solid circles show the rcduccd spontaneous magncti7ation o/u,, as a function ofrcduccd temperatures T/7’,‘, for the invar alloy
u,=125Gcm3g-‘, T,=413(2)K
The small amount of Mn lowers the temperature of the martcnsitic transition to the bee phase from l30K to below 4.2 K. (The curve is the result of local molecular ticld calculations.) Open circles rcprcsent the relative values of the avcragc effective hypcrfinc field. /I = l?hyp,erl/&,efr (4.2 K). I?,,,,,,, (4.2 K)= 280 kOc. The average refers to the various neighborhoods ofan Fe atom [75M I]. For the local environment effect. see also [83 K I], For a comparison of the temperature de- pcndcncc of the magnetization with the integrated intcn- sity of the magnon spectra. see [79 123.
717, -
I 1.c: 0 - 0.05 . 0.10 . L Y
0.15 I 1 0 0.20 / Ni Y c.93 3 <-“ r/7, - \ n nnz n,n
0 30 60 90 120 K 150 I-
Fig. 112. Expcrimcntally dctcrmincd tcmpcraturc vari- ations of the rcduccd mngncti7ation MS/M, (OK) for Fc,,,Ni,,, and Fc,,,,Ni,,,, single crystals. For com- parison also the results for pure Ni arc given. The solid curves arc calculated by spin wave theory using the spin wave stiffness constants of Fig. 551 [8l 0 23. See also [SOI I. 76K I].
1000 /
G Fe,., Ni,
750 Y
I 2 500
250
n VI I I I I 1
-100 0 100 200 K 300 7-&-
Fig. 113. Temperature depcndcncc of the held-induced magnetization M measured with a pulse field of 1000 kOe for various invar alloys Fe, -,Ni, in the paramagnetic state. Ni data arc given for comparison. The temperature scale is shifted for each material in such a way that their Curie points T, fall togcthcr [77 H I]. For more evidence regarding a magnetic phase transition brought about by an external magnetic field. see [82 W I].
Bonnenberg, Hempel, Wijn

Ref. p. 2741 1.2.1.2.5 Fe-Co-Ni: spontaneous magnetization, Curie temperature 197
0 w5 atm-’
-3
-4
0
==--.-
RT
0 0.2 0.4 0.6 0.8 a Fe x-
Fig. 114a. Relative change of the spontaneous magnetic moment under a change of the applied hydrostatic pressure for Fe,-.Ni, alloys at room temperature. 1 atme 1.013 bar. Open circles: [37 E 11, squares: [58 G 11, triangles: [59K 11, solid circles: [61 K 11.
0 .I@ bar-
-0.5
I -1.0
%
-ig -1.5
-2.0
-2.5
I 4
7 0 RT A I=77K
‘I 62 K
0.30 0.34 0.38 0.42 b x-
Fig. 114b. Relative change of the spontaneous magnetic moment with pressure vs. Ni concentration at various temperatures for Fe, -,Ni, invar alloys [69 M I].
t ;; 0.9 II 4 r f 0.8
0.7 I I cl 4
I I I 8 12 16 kbar 20
P- Fig. 114~. Pressure dependence of the relative magneti- zation M/M(p=O) ofa fee Fe0.65Ni,,,, alloy at 4.2 K and room temperature [81 H 21.
Land&-BBrnstein New Series 111/19a
Bonnenberg, Hempel, Wijn

198 1.2.1.2.5 Fe-Co-Ni: spontaneous magnetization, Curie temperature [Ref. p. 274
r
0 0 10 20 30 kg/mm2 4
Fig. 116. Relative change of the room-tempcraturc spontaneous magnetization A~,/~, of invar-type Fe- Ni alloys as caused by plastic deformation. The degree of deformation is semi-quantitatively expressed by the avcr- age strain E over the specimen [71 E I]. For 36wt% Ni values for AG,/G, of -0.013 and -0.024 were found for E = 0.07 and 0.14, respectively [73 V I].
0 10 20 30 kg/mrr2 LC
Fig. 115. Increase ofthe magnetization. AM, in a magnetic field of 950Oc, resulting from an applied mechanical tension u within, or somewhat above, the elastic limit for Fe-Ni invar alloys. The results are closely related to incomplete a+y transitions as revealed by X-ray spectra [80T4]. I kg/mm’c98.0665 bar. (a) Invar with 30,3l or 35 wt% Ni: room-tempcraturc curves. reversible. Invar with (b) 34 wt% Ni and (c) 36 wt% Ni: curves for various temperatures. Invar with (d) 32 wt% Ni and (e) 36wt% Ni: increasing (open circles), decreasing (solid circles) tension. The highest tension is beyond the elastic limit.
28 30 32 3L 36 ~1% 38 Ni -
Bonnenberg, Hempel, Wijn
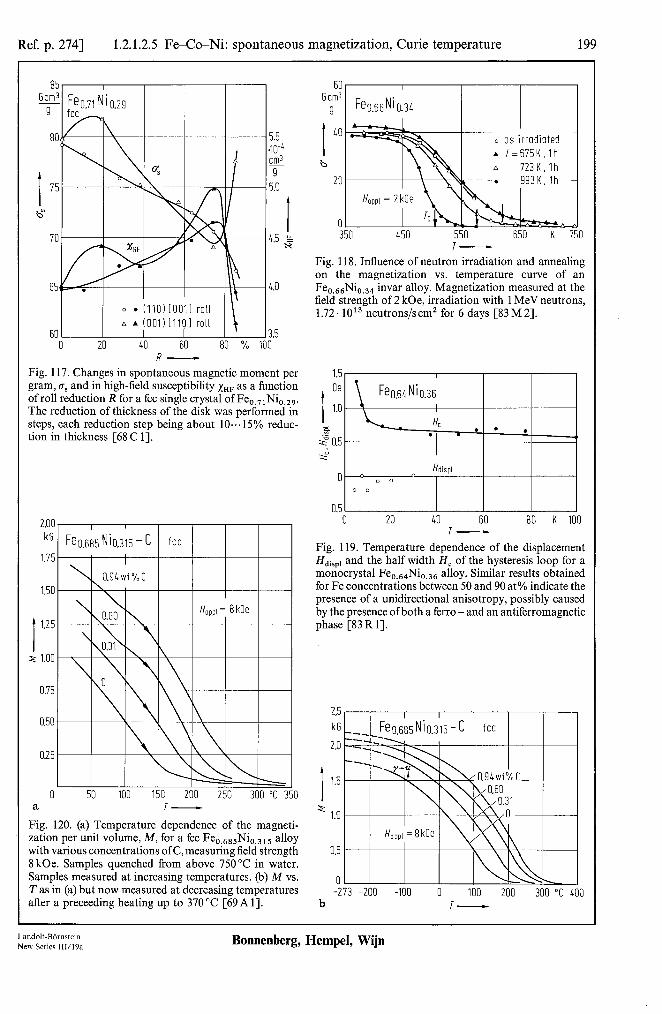
Ref. p. 2741 1.2.1.2.5 Fe-Co-Ni: spontaneous magnetization, Curie temperature 199
65 4.0
I I A . fnnlirllnl rnll I L I
4.0
l (110) [OOII roll
3.5 40 60 80 % 100
13.5 0 20 40 60 80 % 100
5.5 5.5 40~” 40-” cm3 cm3 9 9
5.0 5.0
I I 4.5 4.5 2 2
R- Fig. 117. Changes in spontaneous magnetic moment per gram, 0, and in high-field susceptibility xHF as a function of roll reduction R for a fee single crystal of Fe,,,,Ni,,,,. The reduction of thickness of the disk was performed in steps, each reduction step being about 10...15% reduc- tion in thickness [68 C 11.
I 1.25
z 1.00
I I I
0 51 0 100 150 200 250 300 “C 350 a T-
Fig. 120. (a) Temperature dependence of the magneti- zation per unit volume, M, for a fee Fe,,,,,Ni,,,,, alloy with various concentrations of C, measuring field strength 8 kOe. Samples quenched from above 750°C in water. Samples measured at increasing temperatures. @) M vs. T as in (a) but now measured at decreasing temperatures after a preceeding heating up to 370 “C [69A 11.
60 Gcm3
9
I
40
b 20
0
I
Feo.ssNlo.34 I I
0 as irrodioted . I=675K. Ih n 723K. Ih . 993K. Ih
Happl = 2 kOe
b 3 450 550 650 K
T- Fig. 118. Influence of neutron irradiation and annealing on the magnetization vs. temperature curve of an Fe 0.d%34 invar alloy. Magnetization measured at the field strength of 2 kOe, irradiation with 1 MeV neutrons, 1.72. 1013 neutrons/scm’ for 6 days [83 M 21.
-0.5l 0 20 40 60 80 K 100
T-
Fig. 119. Temperature dependence of the displacement Hdispl and the half width H, of the hysteresis loop for a monocrystal Fe,,64Ni,,3, alloy. Similar results obtained for Fe concentrations between 50 and 90 at% indicate the presence of a unidirectional anisotropy, possibly caused by the presence ofboth a ferro - and an antiferromagnetic phase [83 R 11.
0
kG I I
Fe0.685 Ni0.315 - c fee
A
-273 -200 -100 0 100 200 300 “C 400 b I-
Land&Bbmstein New Series 111/19a
Bonnenberg, Hempel, Wijn

200 1.2.1.2.5 Fe-Co-Ni: spontaneous magnetization, Curie temperature [Ref. p. 274
2.1 1
kG Fe,.,Ni, -C 2.0 I fee
I 7 = 30°C Hops, 7 8kOe - ,
1.81 I V.V”J
0.9 I I 0 0.2 0.4 0.6 0.8 wt % 1.0
C c- Fig. 120~. Magnetization mcasurcd in a field of 8 kOc of fee Fe, -,Ni, alloys with various concentration ofC. The samples wcrc qucnchcd to room tcmpcraturc. The measuring points dcnotcd L wcrc found after annealing for 20 h at 450 “C. Measuring temperature 30 “C [69A I].
6 Feo.sgR Nim: C0s.o~~
1.5 kli
I 1.0
i 3.5
l- l- I- Fig. 121. Tempcraturc dependence of the spontaneous magnetic moment per unit volume M, as well as the temperature dcpcndcncc of the forced linear magncto- striction in high magnetic liclds, CV./aH, for the alloys Fe-Ni. FeNiXu and Fc -Ni-Co [7l K I].
Bonnenberg, Hempel, Wijn
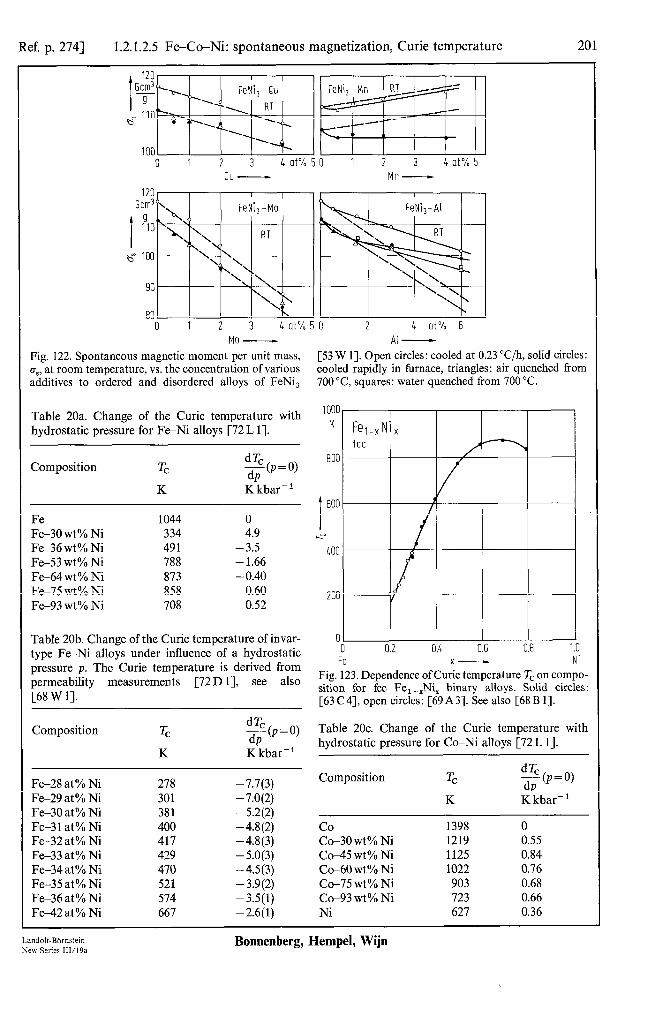
Ref. p. 2741 1.2.1.2.5 Fe-Co-Ni: spontaneous magnetization, Curie temperature 201
0 1 2 3 4 at% 5 0 1 2 3 4 at% 5 cu - Mn-
120 Gcm3
1910
80 0 12 3 4 at% 5 0 2 4 at% 6
MO - Al-
Fig. 122. Spontaneous magnetic moment per unit mass, [53 W 11. Open circles: cooled at 0.23 “C/h, solid circles: crs, at room temperature, vs. the concentration of various cooled rapidly in furnace, triangles: air quenched from additives to ordered and disordered alloys of FeNi, 700 “C, squares: water quenched from 700 “C.
Table 20a. Change of the Curie temperature with 1000
hydrostatic pressure for Fe-Ni alloys [72 L 11. K
Composition T, K
Fe 1044 Fe-30 wt% Ni 334 Fe-36 wt% Ni 491 Fe-53 wt% Ni 788 Fe-64 wt % Ni 873 Fe-75 wt% Ni 858 Fe-93 wt% Ni 708
ts(p=O) 800
K kbar-’
I
600 0
-4.9 hy -3.5 400 -1.66 -0.40
0.60 200 0.52
I-
I_
0 Table 20b. Change of the Curie temperature of invar- type Fe-Ni alloys under influence of a hydrostatic pressure p. The Curie temperature is derived from permeability measurements [72 D 11, see also [68W 11.
0
Fe Fig. 123. Dependence of Curie temperature Tc on compo- sition for fee Fe,-,Ni, binary alloys. Solid circles: [63 C4], open circles: [69A3]. See also [68 B 11.
Composition T, K K kbar-’
Fe-28 at % Ni 278 Fe-29 at% Ni 301 Fe-30 at% Ni 381 Fe-3 1 at % Ni 400 Fe-32 at % Ni 417 Fe-33 at% Ni 429 Fe-34 at% Ni 470 Fe-35 at% Ni 521 Fe-36 at% Ni 574 Fe42 at % Ni 667
-7.7(3) -7.0(2) -5.2(2) -4.8(2) -4.8(3) -5.0(3) -4.5(3) -3.9(2) -3.5(l) -2.6(l)
I I I I I 0.2 0.4 0.6 0.8 1.0
x- NI
Table 20~. Change of the Curie temperature with hydrostatic pressure for Co-Ni alloys [72 L 11.
Composition dT, -j-$=0)
K kbar-’
co 1398 0 Co-30 wt% Ni 1219 0.55 Co-45 wt% Ni 1125 0.84 Co-60 wt% Ni 1022 0.76 Co-75 wt% Ni 903 0.68 Co-93 wt% Ni 723 0.66 Ni 627 0.36
Landolt-Bbmstein New Series 111/19a
Bonnenberg, Hempel, Wijn

202 1.2.1.2.5 Fe-Co-Ni: spontaneous magnetization, Curie temperature [Ref. p. 274
633 K
I
40:
k
20:
c
53 kO
40
I 30
= =. ",
s'
20
10
1 8.4 8.8 '
Fe x-
Fig. 124. Evidence for a low-tempcraturc short-range antifcrromagnetic ordering in the ferromagnetic matrix of invar type Fe, -,Ni, alloys has been derived from small- angle neutron scattering. In the magnetic phase diagram Tc dcnotcs the ferromagnetic Curie temperature of the long-range ferromagnetic ordering and 7” is the upper limit of the tempcraturc for the existence of the short- range antiferromagnetically ordered clusters. From an analysis of low-tempcraturc Miissbauer spectra of pow- der samples the N&cl tcmpcraturcs TN of the alloys were found to range from 24 to 30 K for values ofx from 0.18 to 0.28 [74 C 53. The broken curve denotes the ferromagne- tic Curie temperature T, of the fee phase when no martcnsitic phase transformation would have occurred (M, is proportional to the spontaneous magnetization of the ferromagnetic phase.) [79G I]. See also [73 D 1, 75 M 3, 77 M 23, for a model, see [79 K I].
Fig. 125. FCC magnetic phase diagram of the Fe,-,Ni, alloys, showing the Curie tempcraturc and the N&cl tcmpcraturc (Ts for xSO.22). as well as the effcctivc hypertine fields Hhjp,rrI for “Fe at 4.2 K. )I indicates the number of 4s and 3d electrons per atom [79 G 21.
000 K
800
600
1
400
200
0
600
t 500 P-!?
400
300 028 032 036 040
x-
Fig. 126. Time dcpcndcnce of the Curie points of various Fe, -INi, invar alloys, derived from mcasuremcnts of the magnetic permeability. The points ofcurve 2 were mcasu- red aRcr storage of the samples of curve I at room tempcraturc for four years [74 D I, 80 D 23.
Bonnenberg, Hempel, Wijn

Ref. p. 2741 1.2.1.2.5 Fe-Co-Ni: spontaneous magnetization, Curie temperature 203
-80
-100
-120 \ 0 IO 20 30 40 50 kbar 60
P-
Fig. 127. Pressure shift of the Curie temperature, AT,, for fee Fe-Ni alloys [72 L 11. See also [54P 1, 61 K 11, for theory, see [83 F 1, 81 W 11.
K
I 600
b-Y 500
400 I 1 I 200 350 500 650 800 950 K 1100
/- Fig. 129. Effect of annealing at various temperatures on the Curie temperature of an Fe,,,,Ni,,,, invar alloy irradiated with 1.72. 1013 neutrons/scm’ for 6 days. Neutron energy: 1 MeV. Annealing effect on a splat quenched sample [8OM l] is given for comparison [83 M 21.
1000
K Fe-Ni r, ,
2 K
kbar
800
I
600
hy 400
02r-8 80 wt% 100 NI-
Fig. 128. Curie temperature T, and the pressure derivative ofthe Curie temperature dTJdp for Fe-Ni alloys [72 L 11.
650 650 K K
600 600
550 550
I I 500 500
625 625 450 450
400 400
350 350
300 0 5 IO 15 20 kbar 25 3ooOW 20 kbar 25
Fig. 130. Dependence of the Curie temperature Tc on the hydrogen pressure pH2 for the alloys Fe,-.Ni,. Open circles refer to hydrogen atmosphere, solid circles to an atmosphere of an inert gas [76P 11.
Land&-Bbmstein New Series 111/19a
Bonnenberg, Hempel, Wijn
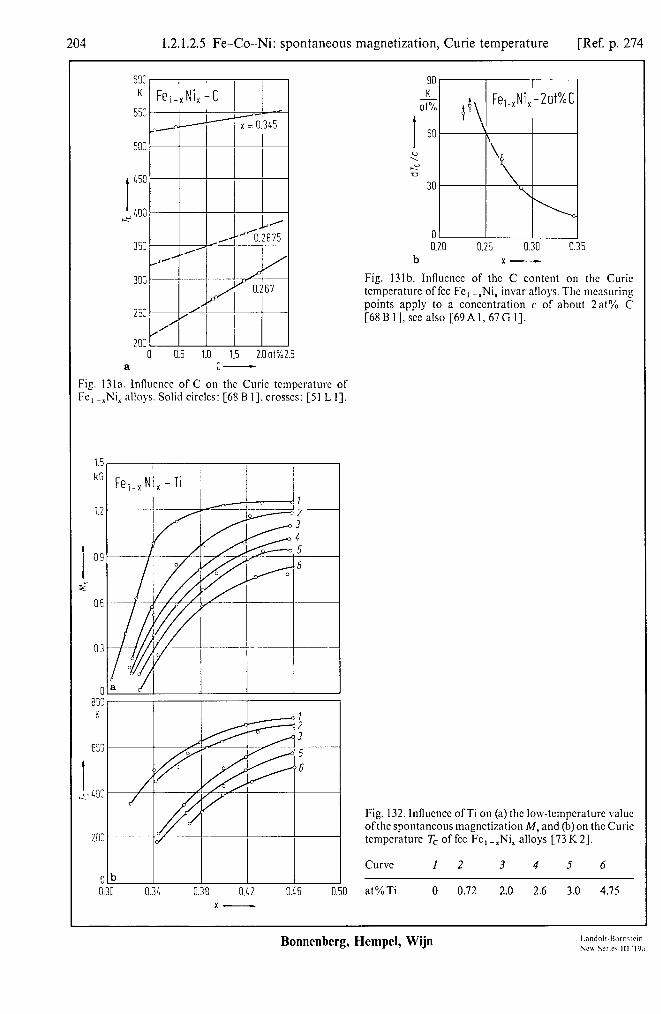
204 1.2.1.2.5 Fe-Co-Ni: spontaneous magnetization, Curie temperature [Ref. p. 274
Fig. Fe,.
OJLl ,
K FeiFxNix -C
a c-
131n. Influence of C on the Curie tcmpcraturc of ..Ni, alloys. Solid circles: [68 B I]. crosses: [Sl L I].
1.5, I / /
“1 Fei_,Ni,-Ti / / /
1.2
I 0.9
f ‘
OE
0.3
0 ___
90 I - Fe,.,Ni,-Zat%C
I
ok dp\
60 \ \
? I? ‘P n
30
0 0.20 0.25 0.30 0.35
b x-
Fig. 13lb. Influcncc of the C content on the Curie temperature of fee Fc, -,Ni, invar alloys. The measurin_r points apply to a concentration c of about 2at% C [68 B I], see also [69A 1, 67 G I].
Fig. 132. Influence ofTi on (a) the low-tcmpcrature value ofthc spontaneous magnetization M, and (b)on the Curie tcmpcrature T, of fee Fe, -,Ni, alloys [73 K 21.
Curve 1 2 3 4 5 6
at%Ti 0 0.72 2.0 2.6 3.0 4.75
Bonnenberg, Hempel, Wijn
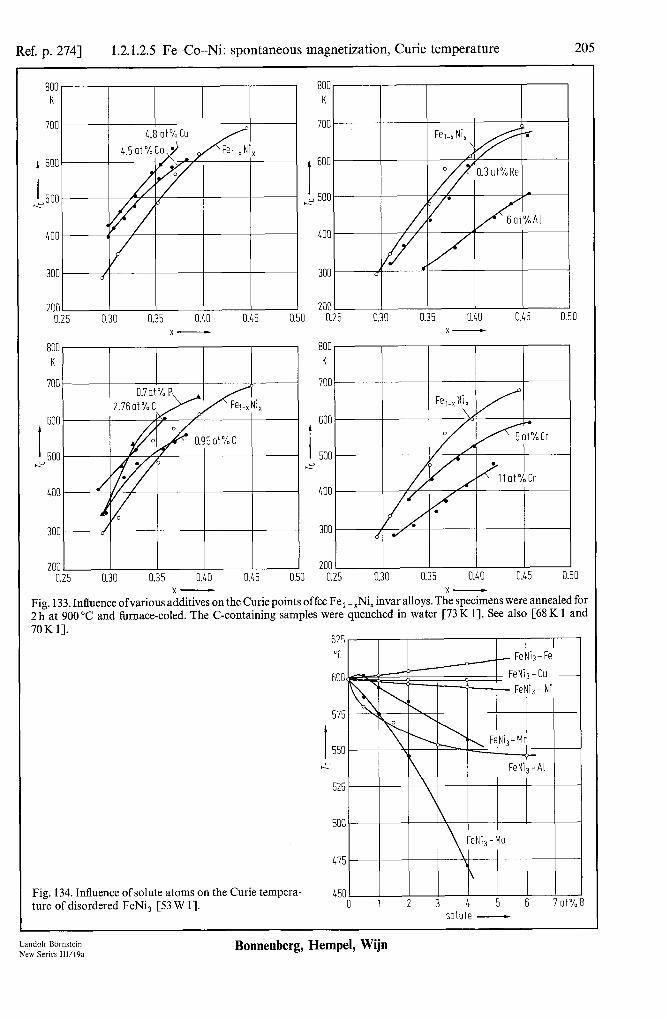
Ref. p. 2741 1.2.1.2.5 Fe-Co-Ni: spontaneous magnetization, Curie temperature 205
800 K
700
t
600
,500
400
3oc
2OC 0.25 0.30 0.35 0.40 0.45 U
x-
800, I I I I 8001 I I I I
KI I I I I
600
I &y so0
400
800 K
700
I 600
h” 500
400
2001 I I I I 2001 I I I I 0.25 0.30 0.35 0.40 0.45 0.50 0.25 0.30 0.35 0.40 0.45 0
600
I 500 62 400
300
X----c x- Fig. 133. Influence ofvarious additives on the Curie points offcc Fe, -xNi, invar alloys. The specimens were annealed for 2 h at 900 “C and furnace-coled. The C-containing samples were quenched in water [73 K 11. See also [68 K 1 and 70K 11.
625, I I I I I I I
Fig. 134. Influence of solute atoms on the Curie tempera- ture of disordered FeNi, [53 W 11.
“C Feh3-Fe
eN&Cu -
FeNi - Ni I I
575 I I
t 2 FeNi,-Mn 1 550
h”
525
500
475
450 o I 2 3 4 5 6 7 at%
soiute -
Land&-Bdmstein New Series 111/19n
Bonnenberg, Hempel, Wijn
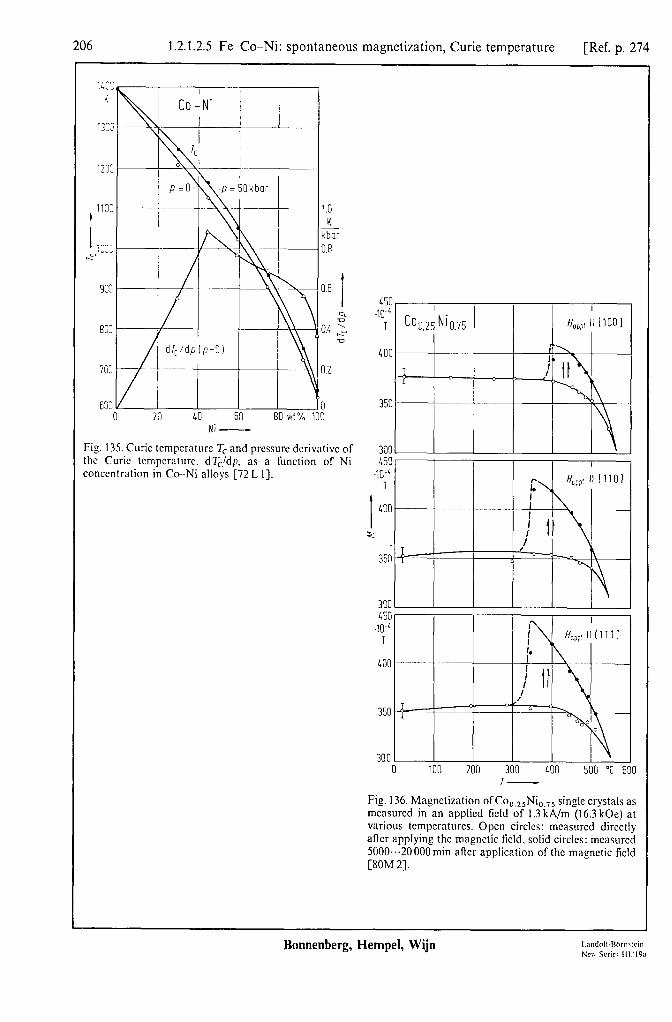
1.2.1.2.5 Fe-Co-Ni: spontaneous magnetization, Curie temperature [Ref. p. 274
lkbor
1.0 K -
kbor 0.8
0 20 40 60 80 v/t % 100 NI -
Fig. 135. Curie tcmpcraturc T, and prcssurc derivative of the Curie tcmpcraturc. dT,idp. as a function of Ni concentration in Co -Ni alloys [72 L I].
450 1 40-L
H-m.. II lllrll
450 .10-G 7\
I HL., 1111111
300 0 100 200 300 400 500 "i 600
:ip 136 Maqnrfi7ntinn nfCo0,25Ni0,75 single crystals as ..__.._ - _.. -I-r..-- .icld of 1.3 kA/m (16.3 kOe) at
various temperatures. Open circles: measured directly lftcr applying the magnetic field. solid circles: measured j000..~20000min after application of the magnetic field .n, L&M 21
Bonnenberg, Hempel, Wijn

Ref. 2741 p. 1.2.1.2.6 Fe-Co-Ni: high-field susceptibility 207
1.2.1.2.6 High-field susceptibility
For theories, models and calculations, see [SO S 1,79 H 1, 79 I 1, 79 S 3, 79 Y 2,77 K 2,72 H 1, 71 S 3, 69 S 23.
/J-
4 +I 4 cm3
mg I 2
1.2 - cm3
rJ.Bm A atom A
0 0.2 0.4 0.6 0.8 1.0 0.8 x-
Fig. 138. High-field susceptibility xHF of Fe, -.Ni, alloys, measured in a magnetic field of 40 kOe at liquid helium
0.6 l temperature [79 R 1, 72 R2, 74R 11.
H’ 0.4
Fig. 137. High-field susceptibility xHF for Fe, $0, alloys [66 S 2,69 S 41. n: number of4s and 3d electrons per atom,
0 0.2 0.4 0 xs: spin wave contribution, Pauli-paramagnetism
0.6 0.8 1.0 contribution, xorb: xp:
orbital contribution, xdia: total diama- Fe x- co gnetic contribution.
Table 21. The high-field susceptibility xHF as measured at various temperatures for Fe-Co and Fe-Ni alloys. The spin wave contribution to the high-field susceptibility, ~u~,~, was calculated taking into account total exchange energies W [69S4]. 10-12~Batom-1A-‘m~0.444~10-6cm3mol-1.
Alloy T, XHF XHF,S W Fe co Ni
10-‘2~Batom-‘A-‘m 10-12u,atom-’ A-’ m at% K 4.2 K 77K 301 K 77K 301K eV
100 0 0 1043 520(35) 595(35) 1060(50) 105(15) 590(80) 0.21 94.4 5.6 0 1104 530(35) 555(35) 1120(50) lOO(15) 555(80) 0.22 83.6 16.4 0 1210 500(35) 585(35) 1290(50) 90(15) 500(80) 0.23 73.8 26.2 0 1272 360(35) 455(35) 920(50) 85(15) 475(80) 0.24 69.7 30.3 0 1313 360(35) 445(35) 900(50) 80(15) 460(80) 0.25 65.0 35.0 0 1340 300(35) 400(35) 670(50) 80(15) 450(80) 0.25
49.7 50.3 0 1405 310(35) 385(35) 700(50) 70(15) 410(80) 0.26 25.5 74.5 0 1260 290(35) 350(35) 540(50) 75(15) 425(80) 0.29
7.5 92.5 0 1340 430(35) 540(35) 990(50) 91.1 0 8.9 1023 630(35) 870(35) 1580(60) llO(15) 625(80) 0.22 80.4 0 19.6 993 630(35) 890(35) 1650(120) 115(15) 645(80) 0.22 71.1 0 28.9 863 1400(90) 1960(60) - 0 (single) 100 631 290(35) 330(35) 725(35) 70(5) 440(30) 0 (POlY) 100 631 300(25)
Land&-Bbmstein New Series 111/19a
Bonnenberg, Hempel, Wijn
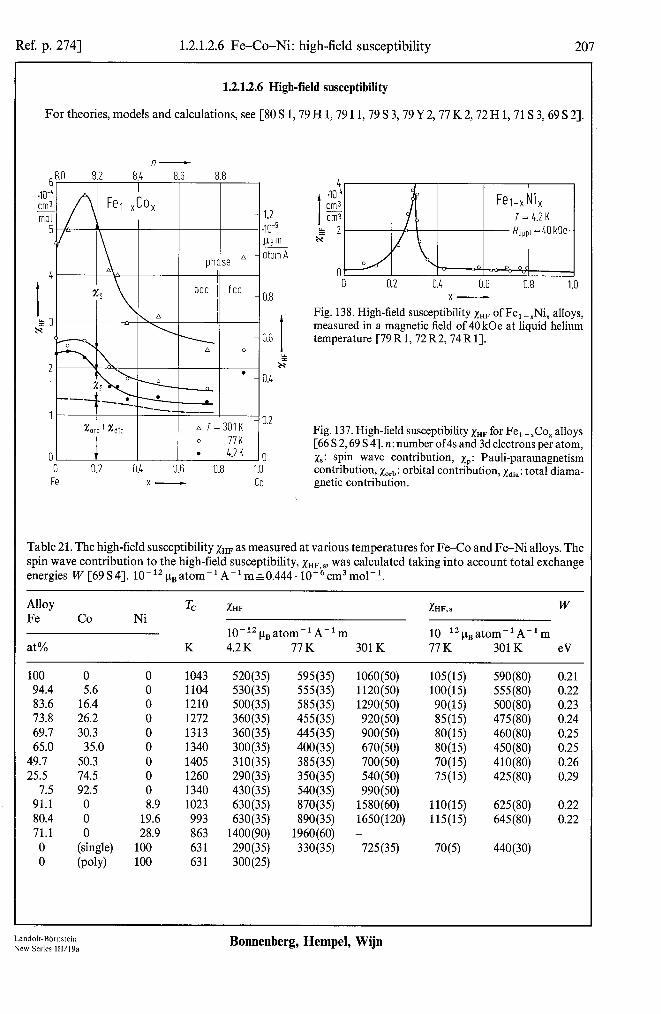

20s 1.2.1.2.6 Fe-Co-Ni: high-field susceptibility [Ref. p. 274
Fe;-x Ni, I I I H = LOkOe 5.0 , I I /
H = 4OkOe .IlOOi @ Fe,.x Ni,
-I1 i cm3 9 fee i - Lb-4 i i I
253 303 350 400 450 500 550 600 650 K 700 a I-
Fig. 139~ High-field susceptibility x,,r of Fe, -,Ni, invar alloys mcnsurcd in a mngnctic ticld of 4OkOc and in a temperature range from room tcmpcraturc up to above the Curie tempcraturc T, [79 Y 31.
2.5
0 253 303 350 400 450 500 550 600 650 K 700
C I-
Fig. 139~. Temperature dependcncc of the high-ticld susceptibility lur for a single crystal ofan Fe,,,,,Ni,,,,, invar alloy at two diffcrcnt internal mngnctic ficld strcn_rths [84Y I].
3.5
I
3.0
% 2.5 u I x
7” L.” v-
1.5 -n L, / \
250 300 350 400 150 500 550 600 650 K 703 b I-
Fig. l39b. The high-field susceptibility at higher tempera- tures for some single crystals of fee Fe, -,Ni, invar alloys [83Y I].
9 w cm3 - mol
7
6
I 5 k
x4
0 50 100 150 200 250 K 3 I-
Fig. 140. Temperature dependence of the high-ticld sus- ceptibility I,,~ mcasurcd bctwccn 30 and 80 kOc for various fee Fe, -,Ni, alloys [7l Y I]. See also [71 H I] and [77 Y I] for comparable results.
Bonnenberg, Hempel, Wijn
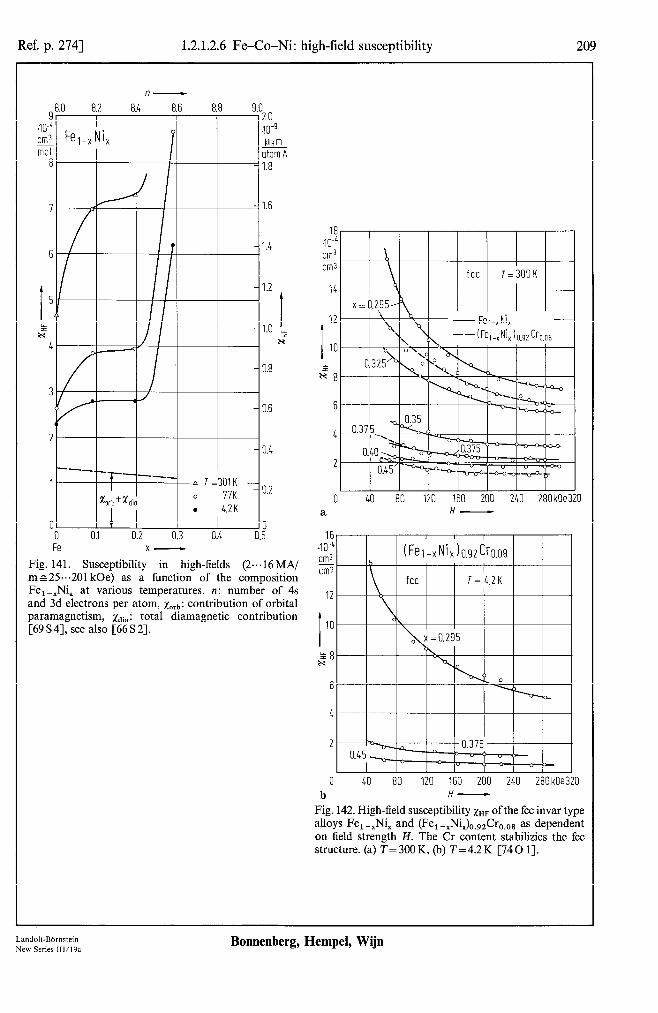
Ref. p. 2741 1.2.1.2.6 Fe-Co-Ni: high-field susceptibility 209
fl- _ 8.0 8.2 8.4 8.6 8.8 (
2.0 luq yBm itom A 1.8
1.6
1.2
t 1.0 &
w
0.8
0.6
0.4
3.2
0 i
Fig. 141. Susceptibility in high-fields (2...16 MA/ mr25...201 kOe) as a function of the composition Fe,-.Ni, at various temperatures. n: number of 4s and 3d electrons per atom, xorb: contribution of orbital paramagnetism, xdia: total diamagnetic contribution [69S4], see also [66S2].
I IO
GE
0 40 80 120 160 200 240 280kOe320 a H-
16 .10-c cm3 cm3
12
I
IO
E8
6
0 40 80 120 160 200 240 280kOe320 b H-
Fig. 142. High-field susceptibility xHF ofthe fee invar type alloys Fe, -xNi, and (Fe, -xNi,),,,,Cr,,,, as dependent on field strength H. The Cr content stabilizies the fee structure. (a) T=300 K, (b) T=4.2 K [740 11.
Landolt-Bornctein New Series lll/l9a
Bonnenberg, Hempel, Wijn
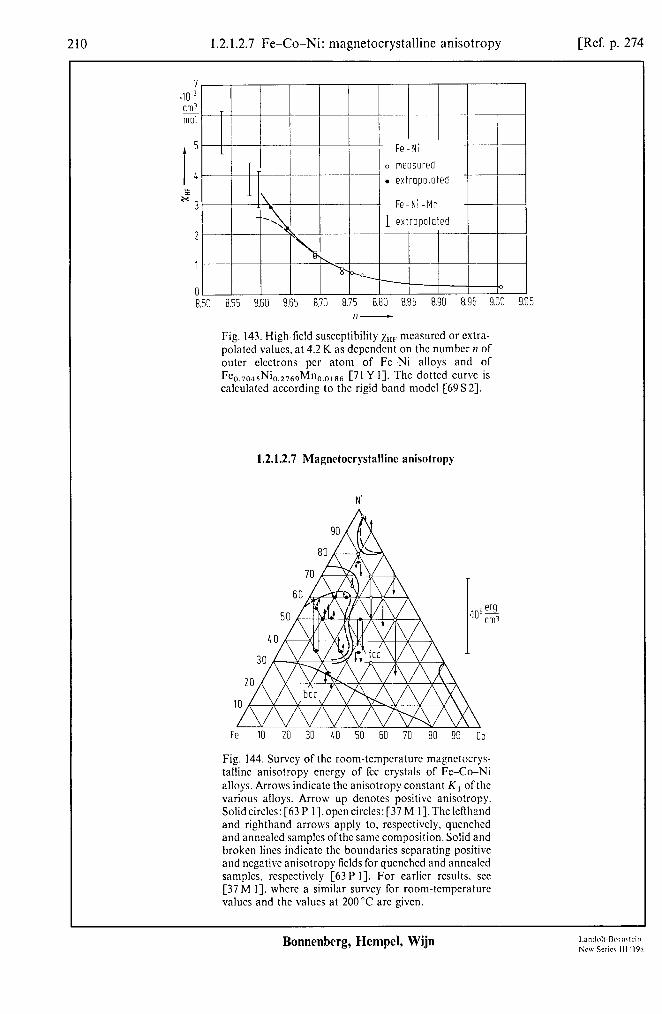
210 1.2.1.2.7 Fe-Co-Ni: magnetocrystalline anisotropy [Ref. p. 274
7 .lO 3 cm! mol
- Fe-Ni
o measured
1
0 8.53 8.55 8.60 8.65 8.70 8.75 8.80 8.85 8.90 8.95 9.00
fl-
Fig. 143. High-field susceptibility z,,,- mcasurcd or cxtra- polatcd V~LICS. at 4.2 K as dcpcndcnt on the number II of outer electrons per atom of Fe Ni alloys and of FC o.~0~sNio.~~~oMno.o~,6 [71 Y I]. The dotted curve is calculated according to the rigid band model [69 S 23.
1.2.1.2.7 Magnetocrystalline anisotropy
Ni
80
1
Fe 10 20 30 10 50 60 70 80 90 co
Fig. 144. Survey of the room-tcmpcraturc magnctocrys- tallinc anisotropy energy of fee crystals of Fe-Co-Ni alloys. Arrows indicate the anisotropy constant K, of the various alloys. Arrow up denotes positive anisotropy. Solid circles: [63 P I],opcn circles: [37 M l].Thc lefthand and righthand arrows apply to, respcctivcly, quenched and annealed samples ofthc same composition. Solid and broken lines indicate the boundaries separating positive and negative anisotropy ticlds for quenched and annealed samples. rcspcctively [63 P I]. For earlier results. see [37 M I]. where a similar survey for room-tempcraturc values and the values at 200 “C are given.
Bonnenberg, Hempel, Wijn

Ref. p. 2741 1.2.1.2.7 Fe-Co-Ni: magnetocrystalline anisotropy 211
5.0 IO6 ' erg Fe, Colex cm3 _
hcp (ABAB) I dhcp(~~~C)
0
I p-i--
g-2.5 -
s
-5.0 -
-7.5 - T=XlOK
mT ,
-10.0 0
a
I I I 0.5 1.0 1.5 2.0
x- 2.5
Fig. 145a. Room-temperature values of the magnetocrys- talline anisotropy constants K, and K, for hexagonal Fe,Co,-, alloys in hcp (ABAB) and dhcp (ABAC) configuration [64 C 2,73 W 11. From the calculation ofthe anisotropy constants from the energy bands of the electrons in the dhcp configuration it is found that K 1 = -8.3. 106ergcmm3 and K,= -1.1. 106ergcme3 [74M 11. See also [83 M 11.
L50 "C Fe-Co
. . fee LOO .\
hcp ‘---‘..
350 \.
.
300’1
5om 0
0 0.5 1.0 1.5 2.0 at% 2.5 c co Fe -
Fig. 145b. Magnetocrystalline anisotropy constant K, vs. temperature T for hcp Fe-Co alloys. The inversibility with respect to the change of temperature is indicated by the arrows along the curves. Phase transitions are in- dicated by vertical arrows [SOT 31. Fig. 145~. Diagram showing the direction of the easy axis @A.) of magnetization for hcp Fe-Co alloys [SOT 31.
4 e c
B 3” ‘s m3
8 406 !!Y cm3
I
t
-12 -8
I-12 0 100 200 300 "C LOO
b T-
50 .I04 I--.
I
e'gy Fe - Co
cm3 h,
K! ‘\?
bee
30 \
‘\ RT 20
-30 - o quenched /
. slowly cooled \ \ ’
\,/I -40
-50 0 IO 20 30 40 50 60 wt% 70 Fe co -
Fig. 146. Magnetocrystalline anisotropy constants K, and K, ofbcc Fe-Co alloys at room temperature [62 L 1, 36 S 1, 37 M 11. Symbols: results obtained by [59 H 11.
Land&-Bdmstein New Series lll/l9a
Bonnenberg, Hempel, Wijn

212 1.2.1.2.7 Fe-Co-Ni: magnetocrystalline anisotropy [Ref. p. 274
‘5.3
14.5 -53 -40 -20 0 20 40 "C 60
T- Fig. 147. The mqnctic anisotropy cncrgy AE,=2K, + K,Q in the (100) plane as a function of tcmpcraturc for a sit& crystal of F~,,&o,,,~ [72 N I].
BOO
1 600..
200
0
40 53 6: 70 80 90 v: t % 100 co - co
Fig. 149. Room-temperature values of the induced uni- axial magnetic anisotropy constant K, for polycrystallinc bee Fe Co alloys. combined vvith the equilibrium phase dinSram. Open circles: [7S T I]. samples prc-annealed at 1200 “C. and cooled in a magnetic field of 4lOOc at the rate of 2OO”C,/h. Solid circles: [55 M I], samples prc- annealed at a temperature below the ~-+r transition.
Fig l50b. The mqnctic cnsy direction ofCo0,0RRFc0,0,2 can bc changed from the c plane to the c asis by an applied mqnctic ficld at room tcmpcraturc. The tigurc shows the relation bctvvcen the direction of the magnetic ficld in the (10iO)planc and the field strength ncccssary to induct the chan_rc in the direction of easy magnetization from the hcxnSonnl axis (solid circles) to the basal plant (open circles). The shadowed area gives the region where dhcp -+hcp transformation occurs as found from electron diffraction studies [8! TZ].
13 .I05 erg
(110) 120/O
I cm3
G --+q
a 11
10 -60 -40 -20 0 20 40 "C 60
I-
Fig. 148. The magnetic anisotropy energy
AE,=3K,/2$ K,/4$K,l32 in the (I IO) plant as a function oftemperaturc for a single crystal of Fc,,,&o~,~~ [72 N I].
I I I I I
0 0.5 1.0 1.5 2.0 2.5 3.0 3.5 a X-
Fig. 150a. Room-tcmpcraturc values of the induced uniaxial magnetic anisotropy constant K, for hcp and dhcp Fc,Co, -I alloys anncalcd at 950°C and then cooled in a magnetic ticld of 1.6 kOc at a rate of 14”Cimin [76W I].
Co-l.Zat%Fe ClOiO, RT
b H lc -
Bonnenberg, Hemp& Wijn

Ref. p. 2741 1.2.1.2.7 Fe-Co-Ni: magnetocrystalline anisotropy 213
0 .I03 erg - cm3 -20
Fig. 15 1. Room-temperature values ofthe induced magne- tic anisotropy constants K,, and K,, as a function of roll reduction R for a crystal of an Ni,,,Co,,, alloy. The anisotropy of rolled Ni,,,,Co,,,, crystals where lower than 10’ ergcme3. (a)(OOl) [llO] roll, (b)(llO) [OOl] roll. The roll magnetic anisotropy E, is given by
E,= -$K,,cos28-$K,,cos40,
where 0 is the angle between magnetization and roll direction [62 T I].
0
-20
-40
-60
cc c
t f (IlO)lOOll roll
0 20 40 60 80 % 100 R-
Cooling rate -
Fig. 154. Room-temperature value of the magnetocrys- talline anisotropy constant of the fee Fe,,,,Ni,.,, alloy as dependent on the cooling rate in the temperature range from 600 to 300°C [53 B 11.
RT
j 0.06 0.09 0.12 0.15 0.18 x-
Fig. 152. Magnetocrystalline anisotropy constant K, vs. composition for bee Fe, -,Ni, alloys at room temperature [39 T 11.
20 403 pro Fe-Ni 2 cm3
0
t
-10
g-20
-30
-40
-50
1
-601 30 40 50 60 70 80 90wt% 100
Ni - Ni Fig, 153. Magnetocrystalline anisotropy constant K, vs. composition for fee Fe-Ni alloys at room temperature. Cooling rate between 600 and 300°C either lO’“C/h (quenched), or 2.5 “C/h (slowly cooled) [53 B 11.
LandoIl-BBmstein New Series 11~1% Bonnenberg, Hempel, Wijn

1.2.1.2.7 Fe-Co-Ni: magnetocrystalline anisotropy [Ref. p. 274
-I
-200 -100 0 100 200 300 "C LOO I-
20 Xl3 L?Gl cm:
0
I -20
SC
-LO
-60
-0.5 40 erg - cm3
-25
-35 0
-103 erg
I
G3
Fig. 155. Tempcraturc dcpcndcncc of the magnctocrys- tallinc anisotropy constant K, for Fe,-,Ni, alloys as derived from torque measurements on single crystals. For similar results derived from ferromagnetic resonance data, see [76B2]. Open circles: annealed, i.e. cooled from 600 to 300°C in the course of 15...20 days, solid circles: qucnchcd. i.e. heated by 700 “C and cooled in water [61 P 11.
Bonnenberg, Hempel, Wijn

Ref. p. 2741 1.2.1.2.7 Fe-Co-Ni: magnetocrystalline anisotropy 215
0 10 20 30 40 50 60at% 70 Ni Fe -
Fig. 156. Magnetocrystalline anisotropy constant K, vs. composition for quenched fee Fe-Ni alloys, measured at various temperatures [61 P I].
IO, I /
390 410 430 450 470 490 510 530°C E b 70 -
Fig. 157b. Room-temperature first order magnetocrys- talline anisotropy constant K, vs. annealing temperature T, for various FeNi,-type alloys. The samples were in the perfectly ordered state before annealing for 1 h in se- quence at each T,. For T,=51O”C the samples become disordered [83 H 2-J.
I RT
-20 I
k?
-501 0 100 200 300 400 "C 500
a cl- Fig. 157a. Room-temperature values of the magnitude of the magnetocrystalline anisotropy constant K, vs. an- nealing temperatur T, for a single crystal of FeNi,. The crystal was annealed at 900 “C and very slowly cooled to room temperature, resulting in K, = -38.5 . lo3 erg cme3. Subsequently the specimen was annealed at the various temperatures T, and rapidly cooled to room temperature for measurement [SOT 11.
IO, I IO3 e's cm3
0
67 70 73 76 79 wt% 82 C Ni-
Fig. 157~. Isothermal annealing curves of the first order magnetocrystalline anisotropy constant K, for various Ni,Fe-type alloys [83 H 21. Solid circles: [53 B2,53 B 11.
Landolt-Bhmstein New Series 111/19a
Bonnenberg, Hempel, Wijn

1.2.1.2.7 Fe-Co-Ni: magnetocrystallinc anisotropy [Ref. p. 274
/
10 I
20 I I
30 LO kOe ’
a x- Ni
Fig. 159a. Induced uniaxial magnetic anisotropy constant K, of Fe,-,Ni, alloys due to a magnetic annealing [55 C I], or mechanical rolling. crows: [4l R I], solid circles: [55 C I]. For variations ofannealing temperature and the influcncc of neutron irradiation with curves derived from measurcmcnts on polycrystallinc samples. see also [SS F I, 74 R 21. For kinetics of the process. see [82 H I].
H op:' -
Fig. 15s. The mngnctocrystallinc anisotropy constant K, 1s depcndcnt on the magnitude of the mngnctic Iicld for Fe, -,Ni, invar alloys at 4.2 K, as derived from torque ncnsurcments on single crystals [820 I]. For room- :empcrature results. see [73 0 I].
b Fe Ni -
Fig. l59b. Magnetic anisotropy constant K, of Fe-Ni alloys induced by magnetic cooling through y+r trans- formation tcmpcraturc. Cooling rate 4”C/min in a mag- netic field Hap,,,= IO kOe. Solid curve after cooling to room temperature, broken curve after cooling to liquid nitrogen tempcraturc [660 I].
Bonnenberg, Hempel, Wijn

Ref. p. 2741 1.2.1.2.7 Fe-Co-Ni: magnetocrystalline anisotropy 217
t
1.8
Fig. 160. Induced uniaxial magnetic anisotropy constant K, as a function of the orientation of the magnetic annealing field in an (110) ablate single crystal of FeNi, after cooling from 600 “C at various rates. The direction of the magnetic annealing field is given by the angle 0 measured with respect to the [loo] direction in the crystal plane. The first order magnetocrystalline constant K, is also given [56 C 1, 57 C 11.
0 perfect order -3.2
0 20 LO 60 80 % 100 a R-
1.2 1.2
3.9 3.9
0.6 0.6
0.3 0.3 A A S”C/min S”C/min D l”C/min D l”C/min
0 0 I I 0” 15” 30” 45” 60” 75” 90” 0” 15” 30” 45” 60” 75” 90”
-0.L 0 0
b b
. perfect order I I
40 40 60 60 80 80 % % 1 1 R- R-
Fig. 161b. Variation of the uniaxial roll magnetic an- isotropy constant K, with the progress of (001) [llO] rolling of a FeNi, crystal [64 C 11.
Fig. 161a. Variation of the uniaxial roll magnetic an- isotropy constant K, with the progress of (110) [loo] rolling of a FeNi, crystal [64 C 11.
Landolt-Bbmstein New Series 111/19a
Bonnenberg, Hempel, Wijn
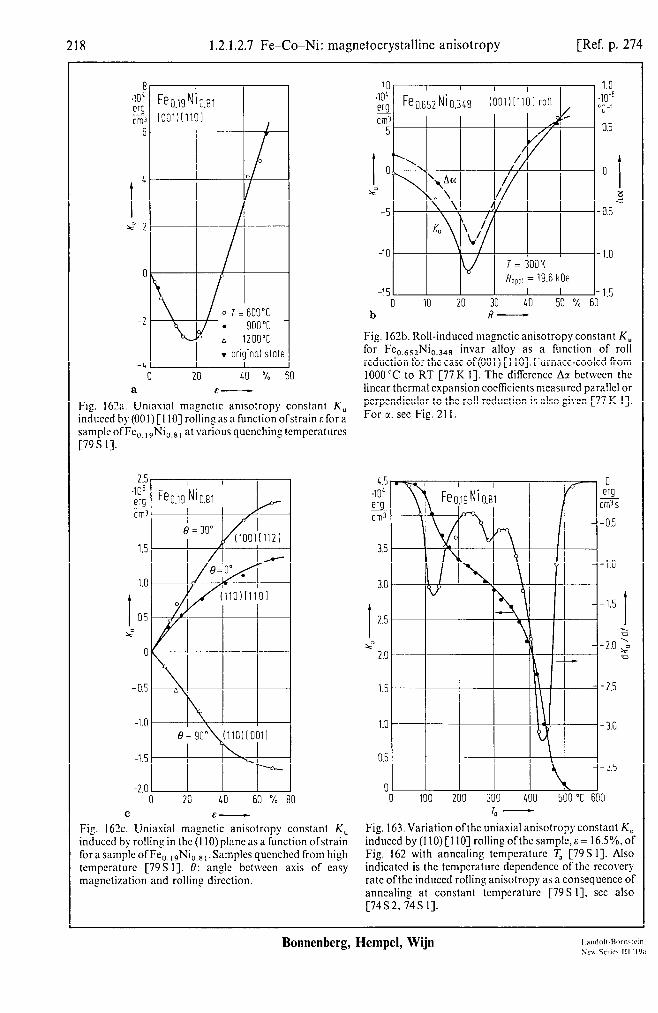
218 1.2.1.2.7 Fe-Co-Ni: magnetocrystalline. anisotropy [Ref. p. 274
Fe ’ 1 I I
0.652 NhB lOOl)[llOl roll
cm3 5
A4
/
(I
1.0 10-5 'C-:
0.5
0 I 23 4
0.5
1.0
-- 1.5 0 10 20 30 40 50 % 60
b R-
a
Fig. 162b. Roll-induced magnetic anisotropy constant K, for Fe,,,,,Ni,~,,, invar alloy as a function of roll reduction for the cast of(001) [ I lO].Furnace-cooled from 1000 “C to RT [77 K I]. The diffcrcnce Ar between the linear thermal expansion coctkicnts measured parallel or
Fig. l62a. Uniaxial masnctic anisotropy constant K, pcrpcndicular to the roll reduction is also given [77 K I].
induced by (001) [I IO] rollin! as a function ofstrain c for a For a. see Fig. 2 I I.
samplcofFc,,,,Ni,,,, at vartous quenching tcmpcraturcs [79S I].
2.5 2.5 .105 .105 erg erg 3 3
1.5 1.5
1.0 1.0
I I 0.5 0.5
s s
0 0
-0.5 -0.5
-1.0 -1.0
-1.5 -1.5
-2.0 I I I I I 0 20 40 60 % 80
e’s. cm3
s 2.0
1.5
1.0
-2.5
0 0 100 200 300 400 500 "C 630
0 erg
cm3 s
-0.5
-1.0
C E- 70 -
Fig. 162~. Uniasial magnetic anisotropy constant K, Fig. 163. Variation ofthc uniaxial anisotropy constant K, induced by rolling in the (I IO) plane as a function ofstrain induced by (I IO) [I IO] rolling of the sample, E = I6.5%, of for a sample of Fe,, ,,Ni,,, r. Samples qucnchcd from high Fig. 162 with annealing temperature T, [79S I]. Also temperature [79S I]. 0: angle bctwccn axis of easy indicated is the tcmpcraturc dependence of the recovery magctization and rolling direction. rate ofthc induced rolling anisotropy as a consequence of
annealing at constant tcmpcraturc [79 S I]. set also [74S2,74S 11.
Bonnenberg, Hemp& Wijn

Ref. p. 2741 1.2.1.2.7 Fe-Co-Ni: magnetocrystalline anisotropy 219
2.50 *IO3 erg
I
cm3
g 2.00 k
1.75
1.50
a 50 100 150 200 250 "C 300
erg
I
cm3
0 100 100 200 200 300 300 400 400 500 "C 600 500 "C 600
L - b b-
Fig. 164. The magnitude of the compression-induced magnetic anisotropy I& vs. annealing temperature for a FeNi, alloy single crystal. After annealing at 900 “C the sample was very slowly cooled to room temperature in order to obtain a high degree of ordering. The specimen was compressed to (a) E= 14% perpendicular to its (110) surface at room temperature [76T 11, see also [77T 1, 77 T 2,78 T 3,80 T 21; (b)s = 3% and now in a wider range of annealing temperatures [83 T 11.
1.6 1-1
‘$i Fe-Ni-C cm3 1.6
RT
I 1.2
I SF s
0.8 0.8
0.4 0.4
0 0 0 0.2 0.4 0.6 0.8 wt % 1.0 0 01 0.2 0.3 0.4wt% 0.5
a Fe.Ni c- , Fe,Ni c- C
Fig. 165. Induced uniaxial magnetic anisotropy constant 0
K, as a function ofC content for fee FeNi polycrystalline 50
and texture-free samples. Magnetic field annealing at 403
200°C measurements at room temperature. Before field- e’s cm3
annealing the samples had been water-quenched from about 1000 “C unless otherwise stated in order to keep the C in solid solution [69 A 21. See also [68 R 1,67 A 11. For co o,osNi,.,,: K,=5. 103ergcmm3, K,=O [75W 11. Fe content (a) 2 50 wt%, (b) 2 50 wt%.
Fig. 166. Magnetocrystalline anisotropy constant K, of -300 I fee CoNi alloys at room temperature. Solid circles: 20 30 4Owt%50 [59 H 11, open circles: [36 S 11, triangles: [37 M 11.
N; I0 co -
Landott-Bbrnstein New Series 111/19a
Bonnenberg, Hempel, Wijn

220 1.2.1.2.7 Fe-Co-Ni: magnetocrystalline anisotropy [Ref. p. 274
Co-Ni ZOv:t%Ni
-, %-ye. \ hcp‘1 fee
1
0 1
GO
1
0
1
0
0
-1
-!
-31 I I I I I I J 0 1OC 200 300 400 500
Fig. 167b. Tempcraturc depcndcncc of the second order 600 K 71 30
a I- uniaxial magnctocrystallinc anisotropy constant K2 for
Fig. 167a. Tempcraturc dcpcndcncc of the first order hcp Co--Ni alloys [78T2]. The tempcraturc 7;, for the
minxial magnetocrystallinc anisotropy constant K, for phase transition from hcp to FCC is indicated. For a
ncp Co-Ni alloys [7S T 21. calculation of the anisotropy constant from the d-band model. see [83 M I].
.105 erg G-3
8
6 4
0 lb1 , I I I I I
0 100 200 300 400 500 600 K ; b I-
4.5 ,105 erg cm3
i
1.5
Ly 0
4c
-1.5
-3.0
-4.5 0 100 200 300 400 500 600 K 700
I-
Fig. 169. Tcmpcraturc dcpcndcncc of the cubic mag- nctocrystallinc anisotropy constants K, and K, for the fee Co-30wt% Ni alloy. On cooling through 250K the transformation to hcp structure takes place [78 T 21.
Bonnenberg, Hempel, Wijn

Ref. p. 2741 1.2.1.2.7 Fe-Co-Ni: magnetocrystalline anisotropy 221
I
xl" o I
erg” 0 Co - Ni cm3 - 1 I
T,,(300K)-
900 I
K Co-Ni ! I
800 + &
0 5 IO 15 20 25 30wt% 35 a Co NI -
Fig. 169a. First and second order uniaxial magnetocrys- talline anisotropy constants K, and K, vs. Ni con- centration in hcp Co-Ni alloys at 77 K, 300 K and at the temperature 7;,, just below the temperature of the ~(hcp) +y(fcc)phase transformation [78 T 21. For ‘I;, vs. compo- sition, see Fig. 17.
Fig. 170. Room-temperature values of the induced uni- axial magnetic anisotropy constant K, for polycrystalline Co-Ni alloys as a consequence of magnetic annealing. Open circles: [79T 11, solid circles: [62G 11, crosses: [60 T 11. Triangles: cold rolling [79 T 11.
fee
400
300
,0°0< 30 wt% 35 b Co NI -
Fig. 169b. Relation between the temperature where the first order uniaxial anisotropy constant K, = 0 and the Ni concentration of hcp Co-Ni alloys [78 T 23.
IO, I
105 ero Co-Ni
IRTl I !47-b! 6
4
t
2
0 s
-2
-4
-I005 co Ni -
wt%
Landolf-Bdmstein New Series llVl9a
Bonnenberg, Hempel, Wijn

1.2.1.2.8 Fe-Co-Ni: magnetostriction [Ref. p. 274
0 0.1 0.2 0.3 0.i wt% 0.5 0.3 0.4 0.5 0.6 0.7 0.8 0.9 1.0 CO-X c- x- Ni
Fig. 171. Room-temperature values of the induced uni- Fig. 172. Room-temperature values of the induced uni- axial magnetic anisotropy constant K, for Co -Ni alloys axial magnetic anisotropy constant per wt% of C con- containing some C. Annealing temperature 200°C ccntration, KU/c for Co-Ni and FecNi alloys. The an- [69 A2J. isotropy contribution in Co-Ni alloys is independent on
C concentrations up to 0.5 wt% C [69A 21.
1.2.1.2.8 Magnetostriction
Table 22~1. Linear forced magnetostriction constants I(, of polycrystallinc Fe, -,Co, alloys [65 S2].
7-M 11; [lO-loOe-l]
x: 0 0.054 0.164
293 1.5(l) 1.7(l) 1.9(l) 17 l.S( 1) 1.7( 1) 1.8( 1)
1.5 1.5( 1) 1.6( 1) 1.8(l)
‘) X-ray analysis for the y-phase.
0.262 0.303 0.35 0.503 0.145 0.925 ‘)
1.4(l) 1.1(l) 0.8(l) OX(l) 0.9(l) 1.7(l) 1.2(l) 0.8(l) 0.7( 1) 0.7( 1) 0.8(l) 1.7(l) 1.1(l) 0.6( 1) 0.6( 1) 0.8(l) 0.8(l) 1.6(l)
Table 22b. Room-temperature values of the linear magnetostriction constants for hcp and dhcp Fe-Co alloys, defined by the equation:
i.=i~‘(Bt+PI)(r:-~)+j.S28:(~XjZ--f) +RyL{f(~:-~:)(a:-a:)+2~,~2al~2} +21,cz(~,cr, +~2~2)r3~3, where xi and /Ii are the direction cosines of the magnetization and of the measured change in length. respectively, set [65 C 3, 84 I 1] and also [63 C 11. The constants are only weakly dependent on composition,
106 2.;: 106. )Q ‘2 106 . 1.Y’ 106. )Q
hcp 78 -134 -234 dhcp 28 - 85 :; - 51
*) I.?2 gradually decreases with increasing Fe content, without an appreciable change at the phase transition (see Fig. 174a).
Bonnenberg, Hempel, Wijn
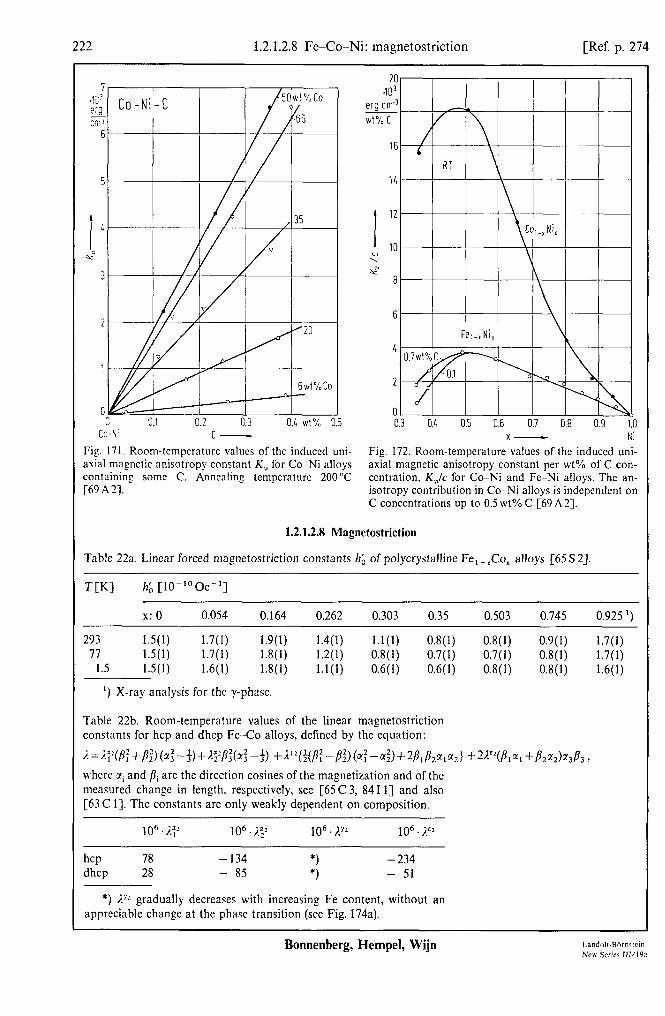
1.2.1.2.8 Fe-Co-Ni: magnetostriction [Ref. p. 274
0 0.1 0.2 0.3 0.i wt% 0.5 0.3 0.4 0.5 0.6 0.7 0.8 0.9 1.0 CO-X c- x- Ni
Fig. 171. Room-temperature values of the induced uni- Fig. 172. Room-temperature values of the induced uni- axial magnetic anisotropy constant K, for Co -Ni alloys axial magnetic anisotropy constant per wt% of C con- containing some C. Annealing temperature 200°C ccntration, KU/c for Co-Ni and FecNi alloys. The an- [69 A2J. isotropy contribution in Co-Ni alloys is independent on
C concentrations up to 0.5 wt% C [69A 21.
1.2.1.2.8 Magnetostriction
Table 22~1. Linear forced magnetostriction constants I(, of polycrystallinc Fe, -,Co, alloys [65 S2].
7-M 11; [lO-loOe-l]
x: 0 0.054 0.164
293 1.5(l) 1.7(l) 1.9(l) 17 l.S( 1) 1.7( 1) 1.8( 1)
1.5 1.5( 1) 1.6( 1) 1.8(l)
‘) X-ray analysis for the y-phase.
0.262 0.303 0.35 0.503 0.145 0.925 ‘)
1.4(l) 1.1(l) 0.8(l) OX(l) 0.9(l) 1.7(l) 1.2(l) 0.8(l) 0.7( 1) 0.7( 1) 0.8(l) 1.7(l) 1.1(l) 0.6( 1) 0.6( 1) 0.8(l) 0.8(l) 1.6(l)
Table 22b. Room-temperature values of the linear magnetostriction constants for hcp and dhcp Fe-Co alloys, defined by the equation:
i.=i~‘(Bt+PI)(r:-~)+j.S28:(~XjZ--f) +RyL{f(~:-~:)(a:-a:)+2~,~2al~2} +21,cz(~,cr, +~2~2)r3~3, where xi and /Ii are the direction cosines of the magnetization and of the measured change in length. respectively, set [65 C 3, 84 I 1] and also [63 C 11. The constants are only weakly dependent on composition,
106 2.;: 106. )Q ‘2 106 . 1.Y’ 106. )Q
hcp 78 -134 -234 dhcp 28 - 85 :; - 51
*) I.?2 gradually decreases with increasing Fe content, without an appreciable change at the phase transition (see Fig. 174a).
Bonnenberg, Hempel, Wijn
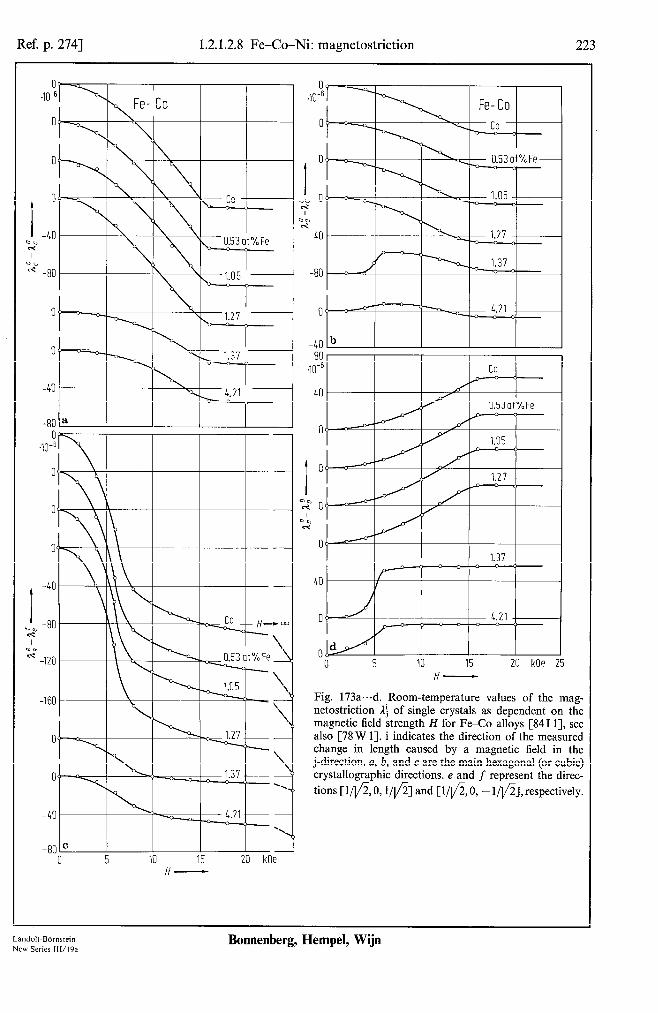
Ref. p. 2741 1.2.1.2.8 Fe-Co-Ni: magnetostriction 223
-80 ' 0 5
-.
10 15 20 kOe- II
-80
0 5 IO 15 20 kOe 25 H-
Fig. 173a...d. Room-temperature values of the mag- netostriction 4 of single crystals as dependent on the magnetic field strength H for Fe-Co alloys [8411], see also [78 W 11. i indicates the direction of the measured change in length caused by a magnetic field in the j-direction. a, b, and c are the main hexagonal (or cubic) crystallographic directions. e and f represent the direc- tions [1/1/z, 0, I@] and Cl/@, 0, - Ifi], respectively.
Landolt-BOrnstein New Series 111/19a
Bonnenberg, Hempel, Wijn

224 1.2.1.2.8 Fe-Co-Ni: magnctostriction [Ref. p. 274
0 O .y-’ .y-’
-!O -!O
-20 -20
I I
-3; -3;
..A0 ..A0 ti ti
-50 -50
-E? -E?
-70 -70
43 43 0 0 1 2 3 4 5 1 2 3 4 5 6 ot% I 6 ot% I
a Co a Co Fe - Fe -
Fig. 174a. Dcpcndcncc ofthc saturation magnctostriction &=i(j.,; -iJon Fe concentration in polycrystallinc Fc Co alloys at room tempcraturc, measured in an applied masnctic field of 20 kOe. i.;, and I., arc the magnctostric- tions parallel and perpendicular to the field direction, respectively [S4 I I].
Fig. 174a. Dcpcndcncc ofthc saturation magnctostriction &=i(j.,; -iJon Fe concentration in polycrystallinc Fc Co alloys at room tempcraturc, measured in an applied masnctic field of 20 kOe. i.;, and I., arc the magnctostric- tions parallel and perpendicular to the field direction, respectively [S4 I I].
120 ,
m” Co-8at%Fe 90
-90 0
C
150 300 150 600 750 K 900 I-
Fig. 174~. Temperature depcndcncc of the saturation ma_enetostriction constants Ai of fee Co-S at% Fc, mca- sured in a field of 14 kOe [70 H I, 65 S 21. The dashed line represents data for h, [67 B 23.
-20 0
-20 0
-20 -100 0 100 200 300 400 500 600 “C 70G
b 7-
Fig. 174b. Dependence ofthe saturation magnetostriction I., on tempcraturc for polycrystalline Fe-Co alloys, measured in an applied field of 20 kOe. h-f, d-f, h-d denote transitions between (h) hexagonal. (f) face centered cubic and (d) double hcxaeonal close oacked structures [S4I I]. x ’
-0 0.2 0.1 0.6 0.8 1.0 a Fe x- CO
Fig. 175a. Linear forced magnetostriction constant of polycrystallinc Fe, -,Co, alloys [65 S 23.
Bonnenberg, Hempel, Wijn

Ref. p. 2741 1.2.1.2.8 Fe-Co-Ni: magnetostriction 225
I 2[ .10-1’0 OF’
1:
I
-1c I
-II: I 0 100 200 300 400 500 600 700 K 800
b T-
Fig. 175b. Temperature dependence of forced magneto- striction AAJAH,,,, as measured in saturating fields for fee Co-8 at% Fe [70 H 11.
I Xhl
-3
40
0 J
-40 l - slowly cooled
I 0 20 40 60 80 wt% 100 Fe co - co
Fig. 176. Magnetostriction constants 1,,,, and a, r r of fee Fe-Co alloys at room temperature [62 K 21. Open sym- bols: [59 H 11, solid symbols: [52U I], crosses: [62 K 21.
0 2.00 400 600 800 K 1000 0 200 400 600 800 K 1000
Fig. 177. Temperature dependence of the spontaneous volume magnetostriction w of fee Fe-Ni alloys evaluated from observed thermal expansion data. Dashed lines: extrapolated from high temperature [73 H 21.
Landolt-Biirnstein New Series 111/19a
Bonnenberg, Hempel, Wijn

226 1.2.1.2.8 Fe-Co-Ni: magnetostriction [Ref. p. 274
-9.3 0.3 0.1 0.5 0.6 0.7 0.8 0.9 1.0
x- Ni
Fip. 17% Spontaneous volume mngnetostriction (II at 0 K vs. composition for fee Fe-Ni alloys [83 N 33, SW also [74 K I]. Triangles: [73 H 21. solid circles: [7l T 21, open circles: [79 0 21. The solid line represents calculated results [Sl Y I]. we also [73 z I].
2.5
I I I 0 5% 103 150 200 250 K 31
,-
Fig. ISO. Variation of the volume magnctostriction with applied mqnctic licld. &$~H,pp,. as a function of the temperature. (a) Obtained from mcasurcmcnts on single cq%~ls of Fe -Ni and for magnetic fields bctwccn 5 and 30 kOe. The arrows indicate the tcmpcraturc of martcns- itic transfomxltion [78 K I]. (b) Mcasurcd in a magnetic applied field up to IO kOc for Fc,,,Ni,,, [6OA I].
I 3
2.4 I I
1.6
I 1.2 a
0.8
0.4 h \ Y
Olb \I 0 100 200 300 400 K 500
I- Fig. 179. Tcmpcrature dcpcndcncc of the spontaneous volume magnctostriction o for Fe-Ni invar alloys (a) Feo.7%.3 and (b) Fc,,,,Ni 0,35 at various pressure as dcrivcd from X-ray lattice constants [Sl 0 41.
b I-
Bonnenberg, Hempel, Wijn

Ref. p. 2741 1.2.1.2.8 Fe-Co-Ni: magnetostriction 227
o++----c : 738K 01 -I- ” *
0 5 IO 15 20 kOe C H- 250
.10-‘0
I 150
--- a
w
$100 cu
50
-50 -501 I n n 20 20 LO LO 60 60 80 80 ot% 100 ot% 100
e ie Ni - Ni
i
0 I / I 0 200 LOO 600 800 K
d T-
Fig. 180~. Volume expansion w under the influence of a magnetic field H at various temperatures T for Fe 0.636%.364. The Curie temperature determined from Arrott plots is T, = 529 K [85 I 11, see also [84 Y 11.
Fig. 180d. Forced volume magnetostriction ao/aH vs. temperature T for Fe-Ni alloys. Solid circles: derived from low-field measurements, 0 < H < 6 kOe, open circles: derived from higher-field measurements, 10 < H < 20 kOe. The arrows indicate the Curie temperatures derived from Arrott plots [85 I 11, see also [84Y 11.
Fig. 180e. Forced volume magnetostriction &o/aH at various temperatures for Fe-Ni alloys. The spontaneous volume magnetostriction w, is also indicated [85 I I].
J
Landolt-BOrnstein New Series 111/19a
Bonnenberg, Hempel, Wijn

22s 1.2.1.2.8 Fe-Co-Ni: magnetostriction [Ref. p. 274
3: .!C ' Oe-
2:
2[
1 :- t :
s c \ 3
c2 li
5.!
2.i
(
'-I I I Fei-,NI,
0 0.2 0.1 0.6 0.8 1.0 F? x- Ni
Fig. ISI. Variation of the volume magnctostriction with applied mayctic fcld. &?/SH,,,,. as a function of Ni concentration of Fe-Ni alloys [SS G I], xc also [7S K I]. 1:[02Nl].2:[31h41].3:[35K1].4:[37SI].Thcsamc quantity. but derived from changes of the spontaneous mqnetizntion with prcssurc. 5: [37 E I]. 6: [53 G I], 7: [jS G I].
Table 23b. Linear saturation magnetostric- tion constant i., of polycrystalline Fe-Ni alloys [OSH I].
wt % Ni I., . IOh
TT20C -186°C
36 20.3 30.5 46 25.4 30.7 50 24.3 26.8 70 11.6 12.6
0 0.01 0.02 0.03 0.04 Fe x-
Fig. 182. Variation of the volume magnctostriction with applied magnetic field, &@H,,,, at room temperature for the fee alloys Fe,,, +,Ni,., - 2rMnr [Sl z I]. I A-‘m&79.5770ee1.
Table 23a. Linear forced magnetostriction constants hb as in Table 22a, but now for polycrystalline Fe, -xNi, alloys [65 S 23.
TCKI hb [lO-loOe-l]
x: 0 0.094 0.192 0.287
293 56(5) ‘1 293 1.5(l) 3.3(l) 3.3(l) 8.0(l) 2, 234 38 (2) ‘) 173 2w ‘1 77 1.5(l) 3.1(l) 3.6(l) 8.0(2) 2,
1.5 1.5(l) 3.1(l) 3.6( 1) 8.0(2) 2,
‘) bee + fee. 2, bee.
Table 23~. Influence of ordering on the linear saturation magnetostriction constant i,, of FeNi, at room temperature according to various authors.
2,. 10”
disordered ordered
Ref.
1.9 4.15 49Gl 7.1 10.1 54Tl 8.5 10.7 53Bl
Table 24. Linear forced magnetostriction constants hb for single crystals of Fe, Ni and Ni-Co alloys [65 S 21.
TCKI /lb [lo-“Oe-‘I
Fe Ni Ni-25 at% Co Ni-50 at % Co
293 1.5 (I) 0.2(l) 0.5( 1) 0.6( 1) 77 1.5 (I) 0.5(l) 0.6( 1) 0.8(l)
I.5 1.5 (I) 0.4(l) 0.6( 1) 0.7(l)
Bonnenberg, Hempel, Wijn
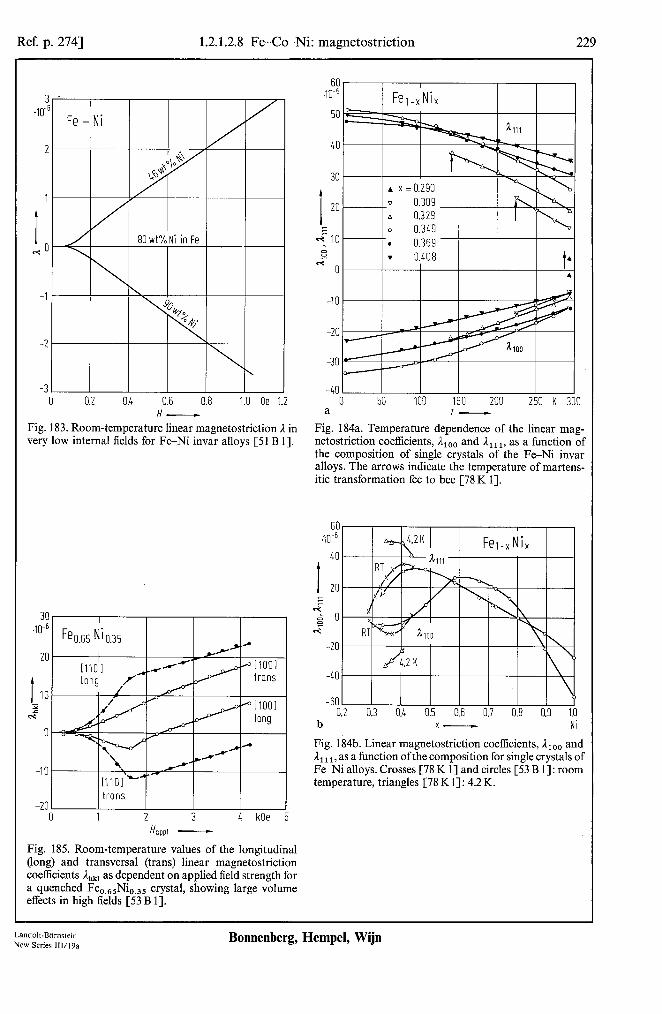
Ref. p. 2741 1.2.1.2.8 Fe-Co-Ni: magnetostriction 229
3 .I@
2
1
t *o
-1
-2
-3 0.2 1.0 Oe 1.2
H- Fig. 183. Room-temperature linear magnetostriction ,I in very low internal fields for Fe-Ni invar alloys [Sl B 11.
0 1 2 3 4 kOe 5 H OPPl -
Fig. 185. Room-temperature values of the longitudinal (long) and transversal (trans) linear magnetostriction coefficients A,,, as dependent on applied field strength for a quenched Fe,,,,Ni 0.35 crystal, showing large volume effects in high fields [53 B 11.
60 .m6
50
40
30
I 20
x,0
B + 0
-10
-20
-30
-40
a
I
Felmx Nix
---t- 0.369 ‘1
50 100 150 200 250 K 300
Fig. 184a. Temperature dependence of the linear mag- netostriction coeffkients, A,,, and A,,,, as a function of the composition of single crystals of the FeNi invar alloys. The arrows indicate the temperature of martens- itic transformation fee to bee [78 K I].
60 m6
40
I 20 z
2 0 T-z
-20
-40
0.6 0.8 0.9 1.0 b x- Ni
Fig. 184b. Linear magnetostriction coefficients, IIOo and 3, r1 r, as a function ofthe composition for single crystals of FeeNi alloys. Crosses [78 K l] and circles [53 B 11: room temperature, triangles [78 K l] : 4.2 K.
Landolt-Bbmstein New Series 111/19a
Bonnenberg, Hempel, Wijn

230 1.2.1.2.8 Fe-Co-Ni: magnetostriction [Ref. p. 274
10s .!I--’
75
1 SC T-2
2:
a 0 5 10 15 20 kOe
H%g>! - 0 5 10 15 20 kOe
b H OPPl -
Fig. 186a. b. Linear magnctostriction ). as dcpcndent on applied field strength for polycrystallinc samples of (a) FC 0,63Ni0,J7 and (b) Fe,,,,Ni,,,, at various temperatures [5l T 11.
P bee
0 c Fe
, 75
.10-'
1
SC
d
2E
l-
b-
L fee
I
Felmx Nix
I I
A 293 K -0 77K -
o 1.5 K
_I 0.8
x- Ni d H-
4)
1.0
Fig. 186~. Linear forced magnetostriction constant of polycrystallinc Fe, -,Ni, alloys [65 S 21. Solid circles: [60 K I].
13.5 I
“o-6 F’3msNi 0.36k , I b
9.0
I
7.5
s-z 6.0
0 0.5 1.0 1.5 2.n 2.5 3.0 kOe 1 :.o
Fig. 186d. Longitudinal forced linear magnetostriction 1 mcasurcd in the field direction plotted against the internal magnetic held. Measuring sample is a single crystal sphcrc of an Fe,,,,, temperature T =555 K c84yl;ljo164 invar alloy. Curie
C
Bonnenberg, Hempel, Wijn
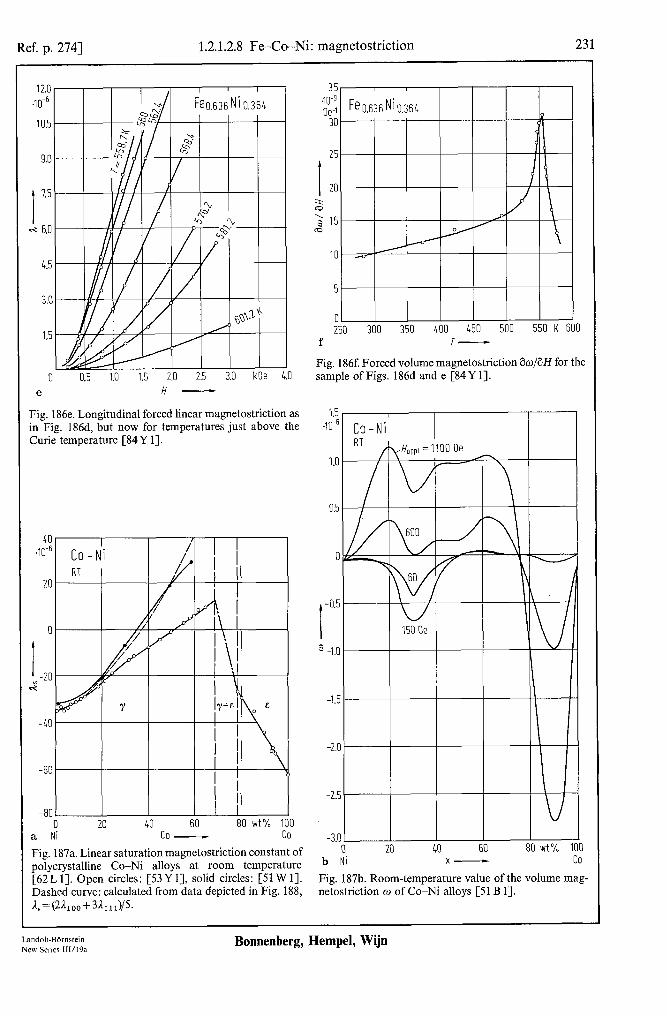
Ref. p, 2741 1.2.1.2.8 Fe-Co-Ni: magnetostriction 231
I
I.5
ci 6.0
0 0.5 1.0 1.5 2.0 2.5 3.0 kOe
e H-
J
;;‘O
Fig. 186e. Longitudinal forced linear magnetostriction as in Fig. 186d, but now for temperatures just above the Curie temperature [84 Y 11.
LO I I .10-6
I Co - Ni //, 1 ! II
01 I /I/I YI I\ I I //I P I I\I
I -20 cz
-801 II 0 20 40 60 80 wt% 100
a Ni co - CO
Fig. 187a. Linear saturation magnetostriction constant of polycrystalline Co-Ni alloys at room temperature [62L 11. Open circles: [53Y I], solid circles: [Sl W 11. Dashed curve: calculated from data depicted in Fig. 188, &=Wmo+341dP.
01 I I I I I 250 300 350 400 450 500 550 K 600
f T-
Fig. 186f. Forced volume magnetostriction &o/aH for the sample of Figs. 186d and e [84Y 11.
1.5 m6
1.0
0.5
0
I
-0.5
3 -1.0
-1.:
-2s
-2.:
-3s
I
b
I 0 20 40 60 80 wt% 100 Ni x- co
Fig. 187b. Room-temperature value of the volume mag- netostriction w of Co-Ni alloys [Sl B 11.
Landolt-B6’mslein New Series lll/l9a
Bonnenberg, Hempel, Wijn

232 1.2.1.2.8 Fe-Co-Ni: magnetostriction [Ref. p. 274
83
I 63
cz LO
20
a
-!C
-IO
-60 NY ‘0 20 30 - LO 50 60 wt% 70
co
Fig. 18% Magnetostriction constants I.,,, and I., , , of fee Co-Ni alloys at room tempcraturc [62K2]. Crosses: [5SY I]. circles and triangles: [59H I], dashed line: [53 Y I].
0
-10
I -20
0 *.10-f
-10
-20
-30
0 100 200 300 400 500 600 “C ; T-
Fig. 189. Linear magnetostriction constants of co 0.2sNi,,,s single crystals as measured in an applied magnetic ficld of 6.4 kA/m (80.4 Oe) at various tempera- tures. Open circles: measured directly after applying the magnetic field, solid circles: measured after 5000.~.20000 min after application of the magnetic fields [SO M 23. Crosses: calculated from the experimental values for the [loo] and [I 1 I] direction.
Bonnenberg, Hempel, Wijn
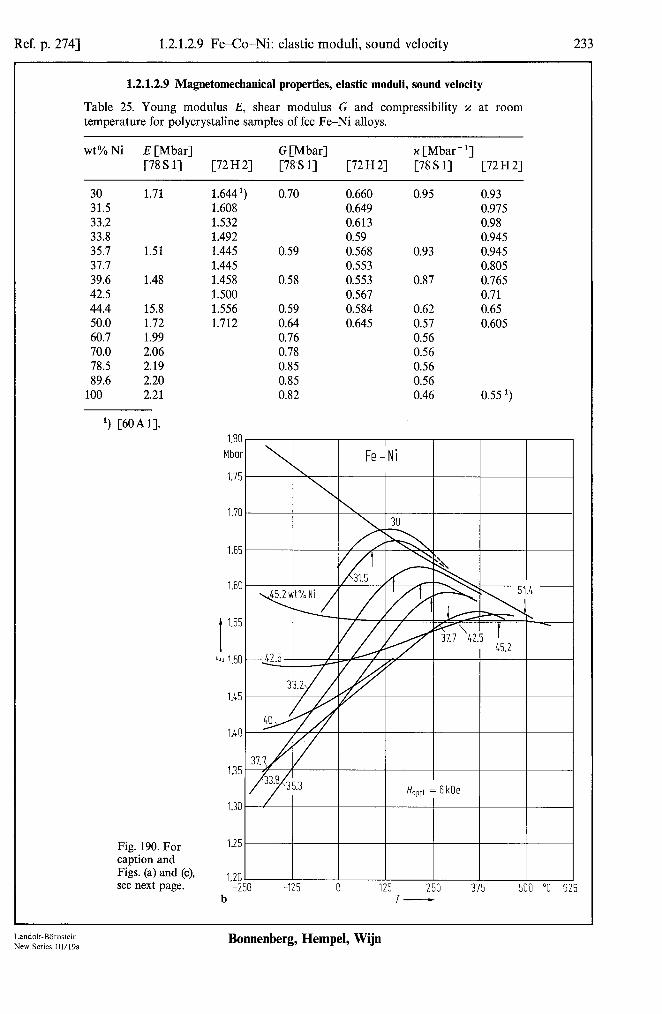
Ref. p. 2741 1.2.1.2.9 Fe-Co-Ni: elastic moduli, sound velocity 233
1.2.1.2.9 Magnetomechanical properties, elastic mod&, sound velocity
Table 25. Young modulus E, shear modulus G and compressibility x at room temperature for polycrystaline samples of fee Fe-Ni alloys.
wt % Ni E [Mbar] G [Mbar] II [Mbar- ‘1 [78 s l] [72 H 21 [78 S l] [72 H 21 [78 S l] [72 H 21
30 1.71 1.644 ‘) 0.70 0.660 0.95 0.93 31.5 1.608 0.649 0.975 33.2 1.532 0.613 0.98 33.8 1.492 0.59 0.945 35.7 1.51 1.445 0.59 0.568 0.93 0.945 37.7 1.445 0.553 0.805 39.6 1.48 1.458 0.58 0.553 0.87 0.765 42.5 1.500 0.567 0.71 44.4 15.8 1.556 0.59 0.584 0.62 0.65 50.0 1.72 1.712 0.64 0.645 0.57 0.605 60.7 1.99 0.76 0.56 70.0 2.06 0.78 0.56 78.5 2.19 0.85 0.56 89.6 2.20 0.85 0.56
100 2.21 0.82 0.46 0.55 ‘)
‘) [6OA 11.
Fig. 190. For caption and Figs. (a) and (c), see next page. -250 -125 0 125 250 375 500 “C 625
b T-
Landolt-Biirnsfein New Series 111/19a
Bonnenberg, Hempel, Wijn

234 1.2.1.2.9 Fe-Co-Ni: elastic moduli, sound velocity [Ref. p. 274
a
Fig. 190. (a) Young’s modulus E vs. temperature T for polycrystallinc samples of fee Fe -Ni alloys. The measure- mcnts wcrc taken in the process ofcooling of the samples to room temperature in a magnetic field of 1.2 kOe. The arrows indicate the Curie temperature Tc. The linear extrapolation below the Curie tcmpcraturc shows values of the Young’s modulus as extrapolated from the para- magnetic region. The vertical scale is equal for all compositions and is given by the length ofthc line showing a scale of0.2 Mbar [70 T 2,78 S I]. (b) YoungTs modulus E vs. tempcraturc T as in (a) but now for Fe-N1 invar alloys and ff,,,, = 6 kOe [72 H 21; for the influence ofannealing. see [63 T 23.
2.L Mbor
2.2
I
2.0
cu 1.8
1.6
1 I I I I I I I
LO 50 60 'IO 80 90 w! % 1oc Ni-
Fig. l9Oc. Young’s modulus E vs. Ni concentration for fee Fc -Ni alloys at various tcmpcraturcs. Curves arc dcrivcd from Fig. 190a [70T2, 78 S I].
0 0 0.05 0.10
a x-
-0.25 0 0.1 0.2 0.3
b x-
Fig. 191. Rclativc change of Young’s modulus AE/E at T= - 100°C upon hydrogenation of (a) Fe,,,,Ni,,,, alloys and (b) Fe,,,,Ni,,,, alloys [83 H I].
Bonnenberg, Hempel, Wijn
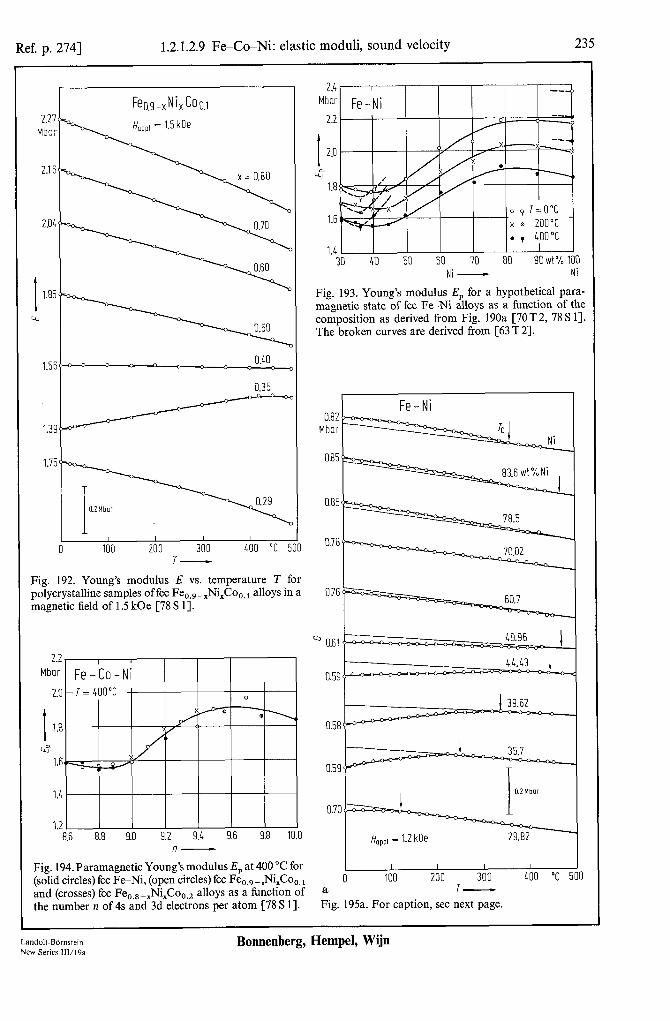
Ref. p. 2741 1.2.1.2.9 Fe-Co-Ni: elastic mod&, sound velocity 235 1
I hd, c00.1
- I I I I I
0 100 200 300 400 "C 500 T-
Fig. 192. Young’s modulus E vs. temperature T for polycrystalline samples of fee Fe,,, -XNi,Co,,, alloys in a magnetic field of 1.5 kOe [78 S 11.
8.6 8.8 9.0 9.2 9.4 9.6 E 1.8 10.0
Fe-Ni I Mbar
0.85
0.76
2.4 . I -- Mbar Fe-Ni
2.2 ----/-----T---7 A- . , 400°C
1.4 I 30 40 50 60 70 80 90 wf% 100
Ni - Ni
Fig. 193. Young’s modulus E, for a hypothetical para- magnetic state of fee FeNi alloys as a function of the composition as derived from Fig. 190a [70T2, 78 S 11. The broken curves are derived from [63 T2].
Fig. 194. Paramagnetic Young’s modulus E, at 400 “C for I I I I I I (solid circles) fee Fe-Ni, (open circles) fee Fe,,, -XNi,Co,,, 0 100 200 300 400 "C 500 and (crosses) fee Fe,,,-,Ni,Co,,, alloys as a function of a T- the number n of 4s and 3d electrons per atom [78 S 11. Fig. 195a. For caption, see next page.
Landolt-Biirnstein New Series 111/19a
Bonnenberg, Hempel, Wijn

236 1.2.1.2.9 Fe-Co-Ni: elastic moduli, sound velocity [Ref. p. 274
0.703 1 b!>:-
I Fe-Ni
0.659
I I I I
-2is -125 II 125 250 375 b T-
Fig. 195. (a) Shear modulus G vs. temperature T for polycrystallinc samples of Fc--Ni alloys. The mcasurc- ments were taken in the process ofcooling the samples to room temperature in a magnetic field of 1.2 kOe. The arrows indicate the Curie temperature Te. The linear extrapolation bcloa the Curie tcmpcraturc shows the G values as extrapolated from the paramagnctic region. The vertical scale is equal for all compositions and is given by the length of the lint showing a scale of 0.2 Mbar [70 T 2, 78 S l].(b) Shear modulus G vs. Tas in (a). but now for Fc-- Ni invar alloys and H,,,, = 6 kOe [72 H 21.
Fig. 196. (a) Shcnr modulus G vs. temperature T for polycrystallinc samples offcc Fe,,,-,Ni,Co,, alloys in a mnpnetic held of I.5 kOc [7S S l].(b) Shear modulus G as dependent on the number II of 4s and 3d electrons per atom for various fee alloys, measured at H,,,, = I .5 kOc (solid triangle: Fc~,~,CO~,~~. solid circles: Fe, -,Ni,. open circles: (Fc, 61Ni0,36), -$Zrr, open triangles, up- ,xard (Fe,-,Ni,),,Cr,,,) and in zero ticld (open trian- ;lcs. downward (Fc, -xNi,),,,Co, J [72 T I].
500 "C 625
0.8E Mboi
0.68'
0.68 -oh - - _ - 0.50
c3
o.571-----=
I I I I
0 100 200 300 400 "C : a I-
Bonnenberg, Hempel, Wijn

Ref. p. 2741 1.2.1.2.9 Fe-Co-Ni: elastic moduli, sound velocity 237
1.2 Mbor
1.0
t 0.8 Q
OL11 10.0 b n-
Fig. 196b.
Fig. 198. Temperature derivative of the Young’s modulus E and of the shear modulus G as a function of the temperature T for various samples of fee Fe-Ni alloys in the magnetically saturated state. Open circles: (dE/dT)/E, solid circles: (dG/dT)/G [70 T 2,78 S 11. The vertical scale is equal for all compositions and is given by the length of the line showing a scale of 4. 1O-4/“C.
8.6 8.8 9.0 9.2 9.L 9.6 9.8 10.0 n----c
Fig. 197. Paramagnetic shear modulus G, at 400 “C for (solid circles) fee Fe-Ni and (open circles) fee Fe,,,-,Ni,Co,,, alloys as a function ofthe number n of4s and 3d electrons per atom [78 S 1,72T 11.
I _ 11.0
p 2.2 2 Iz 0
? z -1.7
2
5 z 2 -3.0
-3.2
-3.8
-co
I
0 ;;2 0 t
60.7
70.02 0 ^
78.5 - .
89.6
I I I I 100 200 300 LOO "C 500
7-
Landolt-BBrnstein New Series 111/19a
Bonnenberg, Hempel, Wijn

238 1.2.1.2.9 Fe-Co-Ni: elastic moduli, sound velocity [Ref. p. 274
70.02 -- ..- nc.h -
0.55'r""""""
60.7
0.5$~-
0 100 200 300 LOO "C F a l-
Fig. 199a. Adiabatic compressibility x vs. temperature T for polycrystallinc fee Fe -Ni alloys. as dcrivcd from the data of Figs. 190a and 195a according to the relation x =9,‘E - 3,/G [70 T 2. 78 S I]. The vertical scale is equal for all compositions and is given by the length of the lint showing a scale of 0.2 Mbar- ‘.
0.016 r
Ryo.u
I 0. 0 1 RT =C2 K
I 0.2 0.1 0.6 0.8
x-
Fig. 199b. Concentration dependence ofthe bulk modulur B for Fe, -,Ni, alloys at T=O K,calculated on the basis o Libcrman-Pettifor’s virial theorem. The solid line hold! for the ferromagnetic state, the dashed curve for the paramagnetic state. The arrow means that the bulk modulus has the singular value B=O at that point [8l K 1). 1 Ry a.u.o 147.25 Mbar. Measuring points ac cording to [73 H I].
Bonnenberg, Hempel, Wijn L.andolr-Bomlcin NW Sericc 111’19a
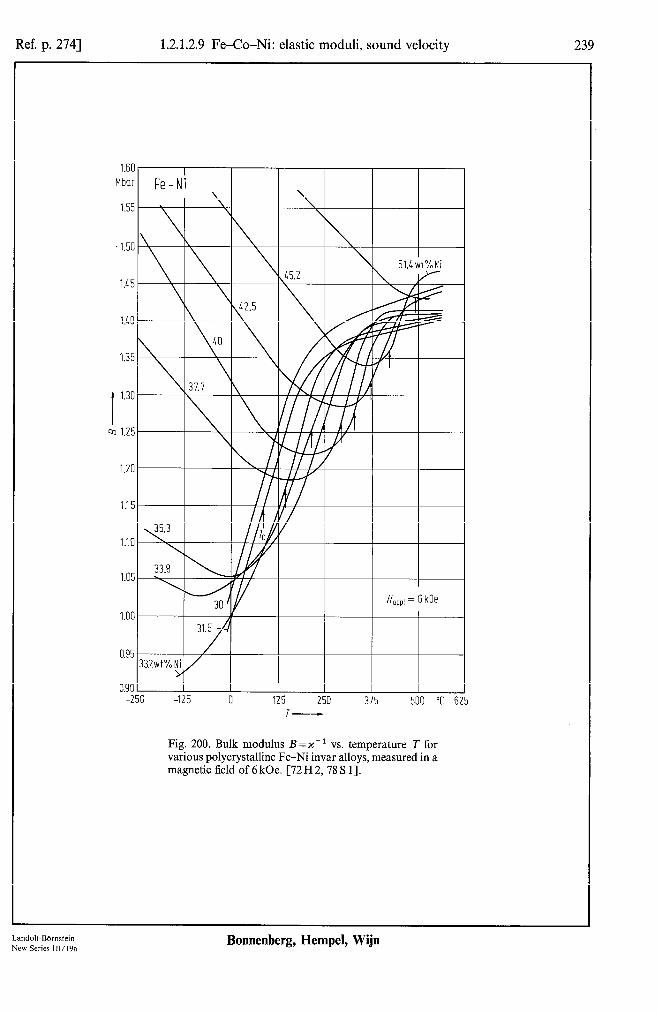
Ref. p. 2741 1.2.1.2.9 Fe-Co-Ni: elastic moduli, sound velocity 239
1.60 1.60 Mbar Mbar
1.55 1.55
'1.50 '1.50
1x5 1x5
l.Ml l.LO
1.35 1.35
I I 1.30 1.30
Q Q 1.25 1.25
1.20 1.20
I.15 I.15
1.10 1.10
1.05 1.05
1.00 1.00
0.95 0.95
0.90 0.90 -250 -250 -125 -125 0 0 125 125 250 250 375 375 500 500 "C "C 625 625
T- T-
Fig. 200. Bulk modulus B=x-’ vs. temperature T for Fig. 200. Bulk modulus B=x-’ vs. temperature T for various polycrystalline Fe-Ni invar alloys, measured in a various polycrystalline Fe-Ni invar alloys, measured in a magnetic magnetic field field of of 6 6 kOe. kOe. [72 [72 H H 2, 78 2, 78 S S 11. 11.
Landolr-Bbmstein New Series lWl9a
Bonnenberg, Hempel, Wijn

240 1.2.1.2.9 Fe-Co-Ni: elastic moduli, sound velocity [Ref. p. 274
Hbar
I
2.0
6 1.6
6 .I' -- 1.2
-J
2.4 2.4 Mbar Mbar
I I 2.0 2.0
Tl.6 Tl.6 6 6
1.2 1.2
0.8 0.8 0 0 100 100 200 200 300 300 LOO LOO 500 500 K K 600 600
I-
Fig. 201. Bulk moduli B, and B, as a function of temperature T for Fe -Ni invar alloys, (a) Fc,,,Ni,,3 and (b) Fe,,,sNi,,,,, for both the ferromagnetic phase and the pressure-induced paramagnctic phase. I: [Sl 0 33, 2: [67G2],3:[60Al].4:[79E2],5:[73HI].
Table 26. Cubicelasticconstants c, ,, ct2, and cd4, in [Mbar], at room temperature for fee Fe-Ni alloys [78 S I].
wt% Ni Cl1 Cl2 c44
[78 Sl] [72 H 23 [78 S l] [72 H 23 [78 S 11 [72 H 21
30 1.46 ‘) 0.881 1) 1.13 1) 35 1.40 1.36 0.92 0.9 1 1.11 1.042 40 1.57 1.59 1.09 1.16 0.96 1.024 45 1.96 1.76 1.42 1.27 0.83 1.035 50 2.12 2.00 1.55 1.42 0.90 1.072 60 2.24 1.51 1.12 70 2.33 1.46 1.27 80 2.41 1.43 1.38 90 2.52 1.43 1.39
100 2.88 2.508 ‘) 1.81 1.50 ‘) 1.24 1.235 ‘)
1) [60A 1-J.
Bonnenberg, Hempel, Wijn
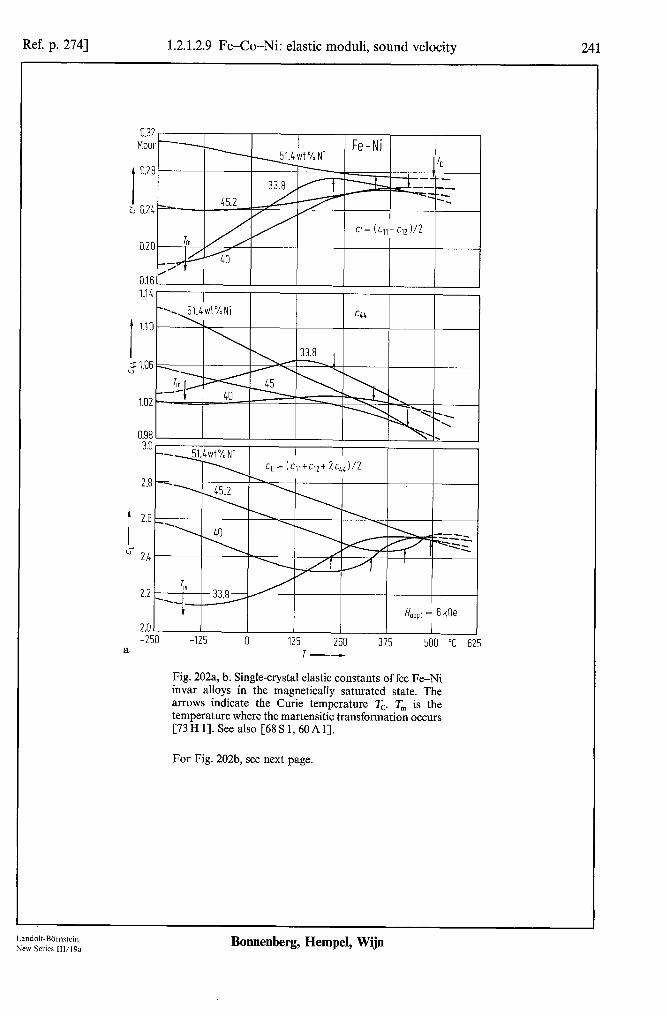
Ref. p. 2741 1.2.1.2.9 Fe-Co-Ni: elastic moduli, sound velocity 241
O.l6lL I.14 - I
-I 51.4wt%Ni Cl/ t 1.10 I\
2.0 I I I I -250 -125 0 125 250 375 500 "C 625 a T-
Fig. 202a, b. Single-crystal elastic constants of fee Fe-Ni invar alloys in the magnetically saturated state. The arrows indicate the Curie temperature Tc. T, is the temperature where the martensitic transformation occurs [73 H 11. See also [68 S 1,60A 11.
For Fig. 202b, see next page.
. 3.0
t-=1 I I CL= (c,,+c,*t 2c,,)/2
HoppI = 6kOe
Landolt-Bbmstein New Series 111/19a
Bonnenberg, Hempel, Wijn

1.2.1.2.9 Fe-Co-Ni: elastic moduli, sound velocity [Ref. p. 274
-250 -125 0 125 250 375 500 "C 625
b
Fig. 202b.
I
01 3G LO 50 60
Fig. 203. Room-temperature values of the elastic con- stants c1 ,, c12, and c+, offcc FeeNi alloys in the ma_rneti- tally saturated state. Solid circles: [69S3], see also [64 S I], open circles: [73 H I], squares: [64S I], trian- gles: [6OA I].
70 80 90wt%100 Ni - Ni
I i.6
u I.2
Bonnenberg, Hempel, Wijn Landol!.Rornrlcin Nea Srricr 111’19~
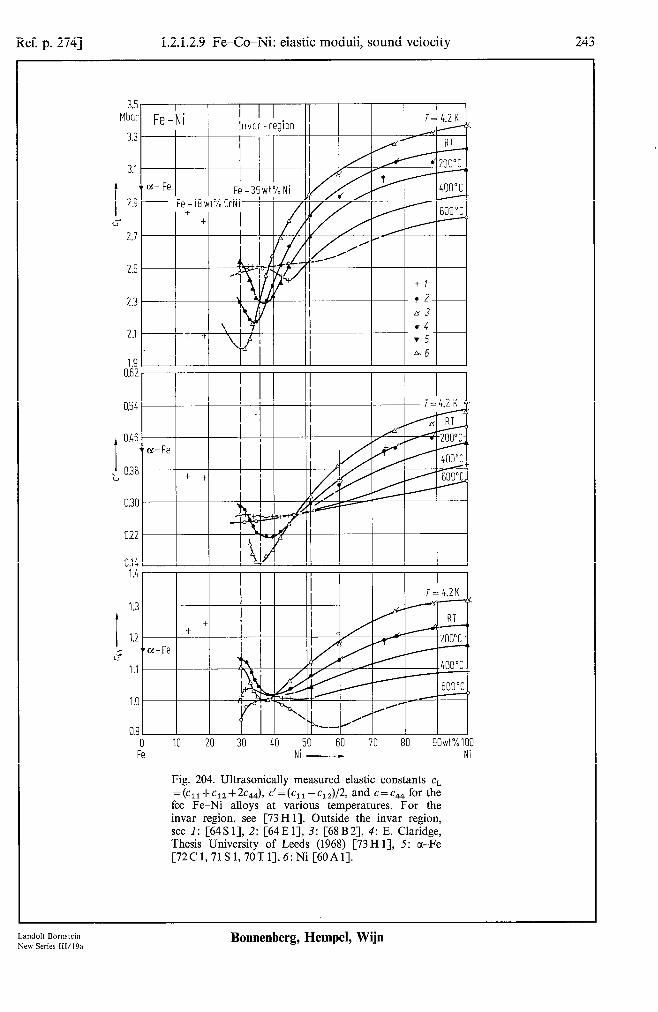
Ref. p. 2741 1.2.1.2.9 Fe-Co-Ni: elastic moduli, sound velocity
3.5 Mbar
3.3
3.1
I 2.9
u' 2.1
2.5
2.3
2.1
1.9 0.62
0.54
I
0!+6
L 0.3 I
0.31: I-
022
a.14
-
r-73
I ~, I
1.2 f T I
2 w-Fe
-l i/ 1.1
Fe NI - Ni
Fig. 204. Ultrasonically measured elastic constants cL =(c,,+c,,+~c,,), c’=(c,,-c,,)/2, and c=cG4 for the fee Fe-Ni alloys at various temperatures. For the invar region, see [73 H 11. Outside the invar region, see 1: [64S 11, 2: [64E 11, 3: [68 B 21, 4: E. Claridge, Thesis University of Leeds (1968) [73 H 11, 5: cl-Fe [72C 1,71 S 1,70T 1],6: Ni [60Al].
Landolt-Bbmstein New Series 111/19a
Bonnenberg, Hempel, Wijn
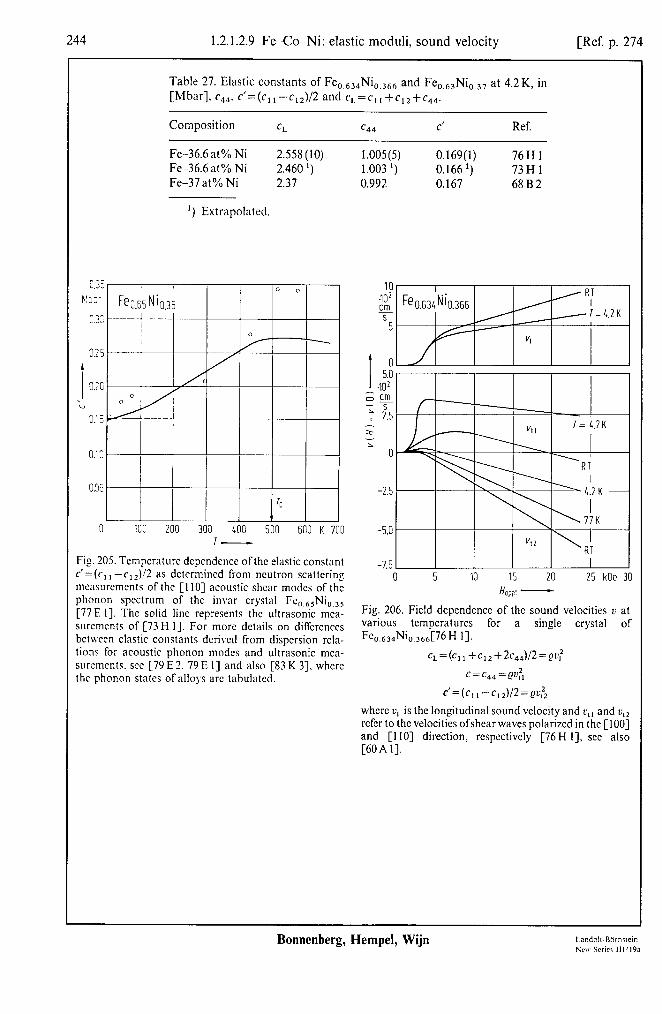
244 1.2.1.2.9 Fe-Co-Ni: elastic moduli, sound velocity [Ref. p. 274
Table 27. Elastic constants of Fe0.634Ni0,366 and Fe,,,,Ni,,,, at 4.2K, in [Mbar]. cd4. c’=(c,,-c,J/2 and c,=c,,+c,,+c,,.
Composition CL c44 c’ Ref.
Fe-36.6 at% Ni 2.558 (10) Fe-36.6 at% Ni 2.460 ‘) Fe-37 at% Ni 2.37
‘) Extrapolated.
1.005(S) 0.169(l) 76Hl 1.003 ‘) 0.166 1) 73H 1 0.992 0.167 68B2
0.35 K>:.:
0.X
025
0.26
0: 5
035
0 100 2OG 300 LOO 500 600 K 700 I-
Fig. 205. Temperature depcndencc ofthc elastic constant r’=(cI, -c12)/2 as determined from neutron scattering measurements of the [l IO] acoustic shear modes of the phonon spectrum of the invar crystal Fc,,,,Ni,,,, [77E I]. The solid line represents the ultrasonic mea- surcmcnts of [73 H 11. For more details on diffcrcnccs betlvccn elastic constants derived from dispersion rela- tions for acoustic phonon modes and ultrasonic mca- surcmcnts. xc [79 E 2. 79 E I] and also [83 K 33, where the phonon states of alloys arc tabulated.
0 5 10 15 20 25 kOe H oppl -
Fig. 206. Field depcndencc of the sound velocities t’ at various temperatures for a single crystal of Fc 0.634%366C76 H Il.
c,=(c,,+c,,+2c4,)/2=QI::
c = c44 = p:,
whcrc u, is the longitudinal sound velocity and c,r and c,~ refer to the velocities ofshcar waves polarized in the [ IOO] and [I IO] direction, respectiveI; [76 H 11, see also [60A 11.
Bonnenberg, Hempel, Wijn
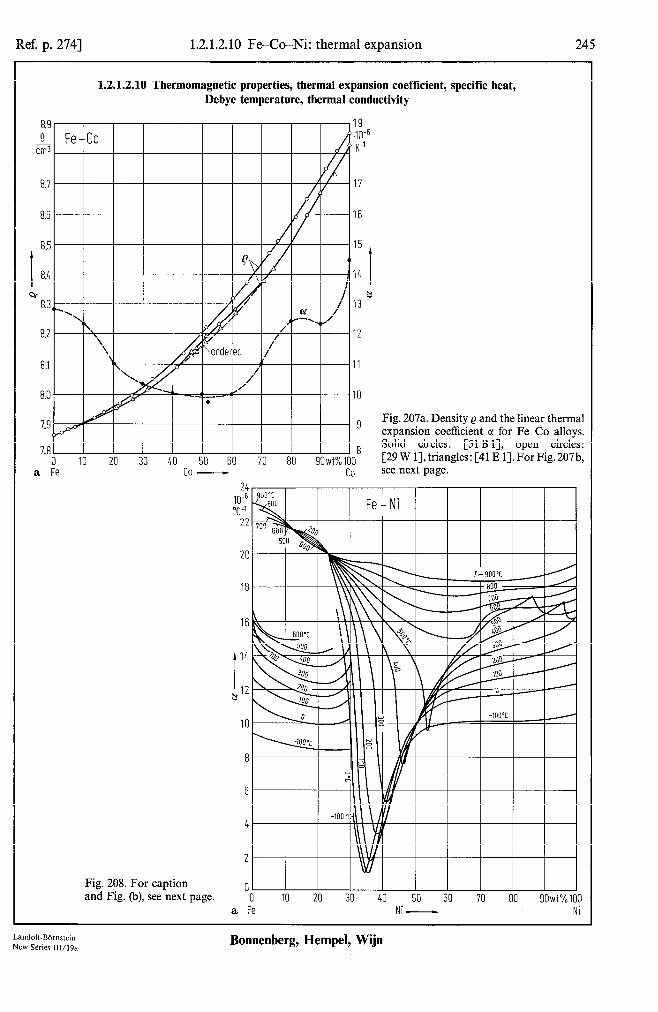
Ref. p. 2741 1.2.1.2.10 Fe-Co-Ni: thermal expansion
8.9 9
cm3
8.6
8.5
I 8.4
cl0 8.3
8.2
8.1
8.0
7.3
7.8
a
1.2.1.2.10 Thermomagnetic properties, thermal expansion coefficient, specific heat, Debye temperature, thermal conductivity
IO 20 30 40 50 60 70 80 co - co
Fig. 207a. Density Q and the linear thermal expansion coefficient LX for Fe-Co alloys. Solid circles: [Sl B 11, open circles: [29 W I], triangles: [41 E 11. For Fig. 207b, see next page.
Fig. 208. For caption and Fig. (b), see next page.
18 t
16
8
0 IO 20 30 40 50 60 70 80 90wt%100 a Fe NI - Ni
Landok-BBmstein New Series 111/19a
Bonnenberg, Hempel, Wijn

0 200 300 “C ! b I-
I Fig. 207b. Thermal expansion of polycrystallinc Fe-Co i alloys. The arrows indicate the phase transition. The , ja+cd lines apply to samples cooled from about 400°C I [S-l I I].
246 1.2.1.2.10 Fe-Co-Ni: thermal expansion [Ref. p. 274
Fig. 208. (a) Linear thermal expansion coetkient tl at various tcmpcratures for Fe-Ni alloys [Sl B fl. (b. c) Temperature dependence of the linear thermal expansion coefficient c( for fee Fe, -XNi, alloys above room tempera- turc(b)x~0.5(c)x~0.5[7lT2],secalso[70T1,73Z1, 17C1,28Cl].
Bonnenberg, Hempel, Wijn
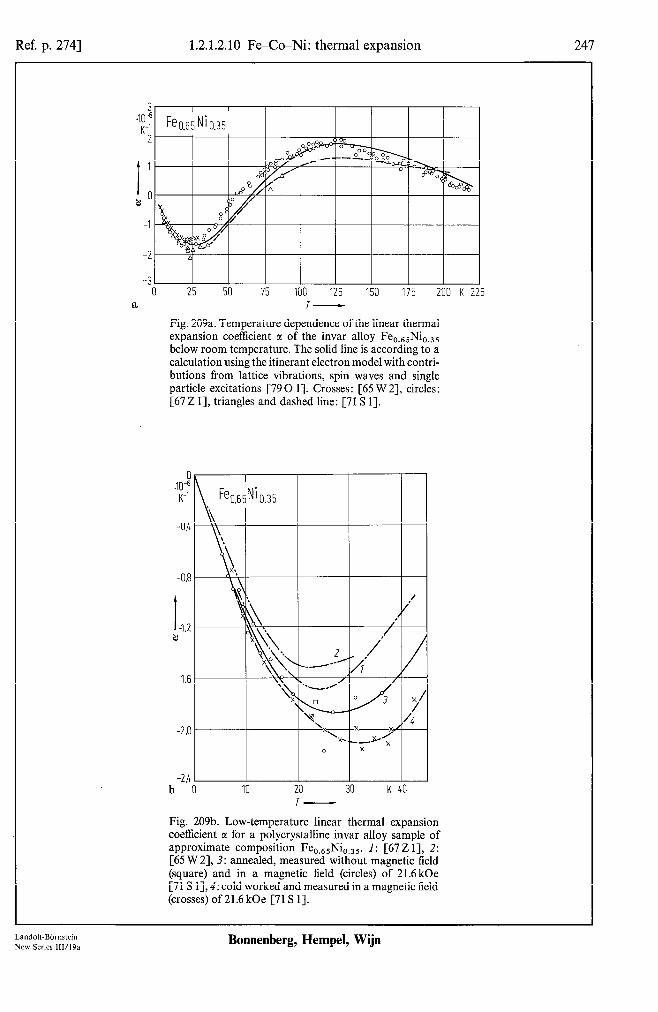
Ref. p. 2741 1.2.1.2.10 Fe-Co-Ni: thermal expansion 247
-2
-:
a 25 50 75 100 125 150 175 200 K 225
T-
Fig. 209a. Temperature dependence of the linear thermal expansion coefficient tl of the invar alloy Fe,.,,Ni,,,, below room temperature. The solid line is according to a calculation using the itinerant electron model with contri- butions from lattice vibrations, spin waves and single particle excitations [79 0 11. Crosses: [65 W 21, circles: [67Z I], triangles and dashed line: [71 S 11.
-0.8
I -1.2 b
-2.41 I I I I b 0 IO 20 30 K 40
Fig. 209b. Low-temperature linear thermal expansion coefficient CI for a polycrystalline invar alloy sample of approximate composition Fe,,,,Ni,,,,. I: [67 Z 11, 2: [65 W 2],3: annealed, measured without magnetic field (square) and in a magnetic field (circles) of 21.6 kOe [71 S 1],4: cold worked and measured in a magnetic field (crosses) of 21.6kOe [71 S 11.
Landolt-Bijrnstein New Series 111/19a
Bonnenberg, Hempel, Wijn
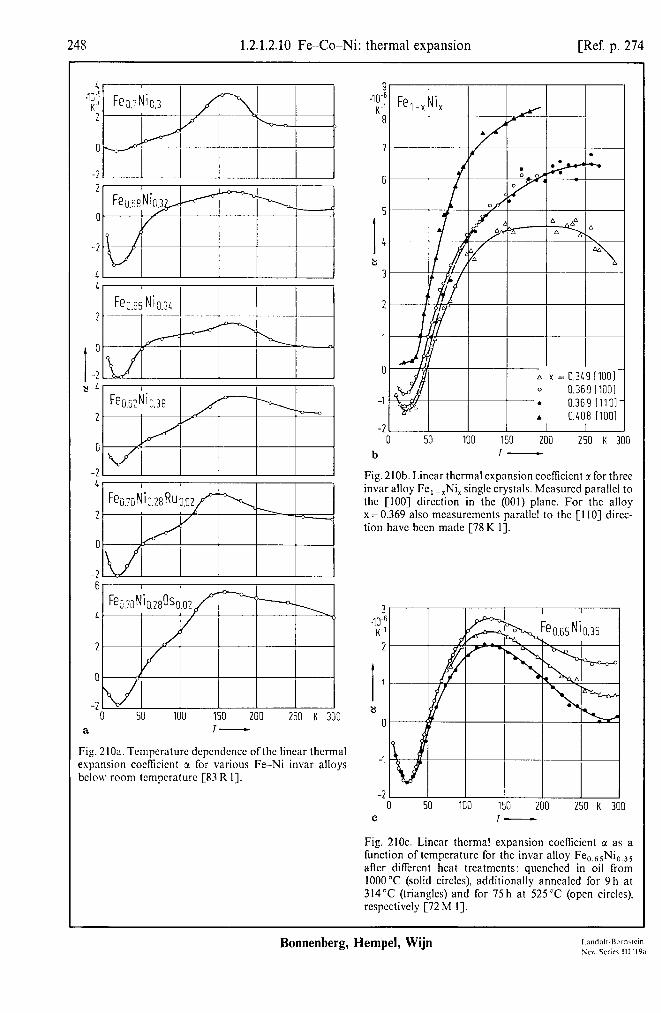
248 1.2.1.2.10 Fe-Co-Ni: thermal expansion [Ref. p. 274
2
0
-2
-4 4
2
I
0
-2 84
2
0
-2 4
2
0
-2 6
4
2
rl
-2
a 50 100 150 200 250 K 300
J-
Fig. 2lOa. Temperature dcpcndcncc ofthc linear thermal expansion cocflicient r for various Fe-Ni invar alloys below room temperature [83 R I].
1J I I. I* 6
-1
-2
b
0.369 [llOl 0.408 I1001
I I I I I -- 5u 100 150 200
I- 250 K 300
Fig. 2lOb. Linear thermal expansion cocfkicnt z for three invar alloy Fe, -,Ni, single crystals. Measured parallel to the [IOO] direction in the (001) plane. For the alloy x =0.369 also mcasurcmcnts parallel to the [I IO] direc- tion have been made [78 K I].
3 m' K-1
2
I 1
8 0
-1
-2 0
C
50 100 150 200 250 K 300 T-
Fig. 210~. Linear thermal expansion coefficient a as a function of tempcraturc for the invar alloy Fe,,,,Ni,,,, after diffcrcnt heat trcatmcnts: qucnchcd in oil from 1000°C (solid circles), additionally annealed for 9 h at 314°C (triangles) and for 75 h at 525°C (open circles). rcspcctivcly [72 M I].
Bonnenberg, Hempel, Wijn

Ref. p. 2741 1.2.1.2.10 Fe-Co-Ni: thermal expansion 249
21 21 .'a-4 .'a-4
18 18
15 15
I I 12 12
: :
a9 a9
6 6
3 3
0 0 -180 -150 -120 -90 -60 -30 "C 0
d T-
Fig. 210d. Temperature dependence ofthe linear thermal expansion Al/l for hydrogenated Feo,zsNio,,5 alloys. The thermal expansion coefficient is given by the gradient of the curves [83 H 11.
15 10-6
K-1
I
IO
8
5
0 0 0.05 0.10 015
f x-
15.0, I I I I I I
xm4 k0.67 Ni0.33 H, c A 12.5
&* . Yl
10.0 . 0
a a .
. . A
-180 -150 -120 -90 -60 -30 "C 0 e T-
Fig. 210e. Temperature dependence of the linear thermal expansion AZ/1 as in Fig. 210d, but now for Fe,,,,Ni,,,,H, [83 H 11.
g x-
Fig. 210f. Hydrogen concentration dependence of linear Fig. 210g. Hydrogen concentration dependence of the thermal expansion coefficient CI for Fe,,,,Ni,,,, alloys in linear thermal expansion coefficient c( as in Fig. 21Of, but the temperature range on - 150 to 0 “C [83 H 11. now for Fe,,,,Ni,,,, alloys [83 H I].
Fig. 211. Low-temperature value of the linear thermal expansion coefficient cc of an Fe,,,,,Ni,,,,s invar alloy single crystal as a function of roll reduction R for the case of(OO1) [ 1 lo] rolling, measured parallel (open circles) and perpendicular (solid circles) to roll reduction. For the difference Act between both expansion coefficients as a function of R, see Fig. 162b [77 K 11. 0 IO 20 30 40 50 % 60
R-
Landolt-Bbmstein New Series lll/l9a
Bonnenberg, Hempel, Wijn

2.50 1.2.1.2.10 Fe-Co-Ni: specific heat [Ref. p. 274
0.50 col
gK
045
O.LO
c 0.30
0.25
0.20
0.15
0.10 600 700 800 900 1000 1100 1200 K 1:
Fig. 212. Spccitic heat C, vs. tcmpcraturc T for the alloy Fe,,,Co,,,. Different symbols refer to diffcrcnt runs [7402]. I cal~4.187 J. The lower lint rcprcscnts the lattice and conduction electron contribution to C,
Table 28. The low-temperature spccitic heat of fee FeNi alloys as the sum of three terms: C,=~T+/?T3+aT3’*, electronic, lattice, and spin wave contributions, respectively [68 D 11, see also [74 C 43.
at% Ni Y P c( mJmol-‘K-* mJmol-‘K-4 mJmol-LK-5/2
100
95.7 90.3 86.2 81.1 68.7 59.2 55.1 50.1 45.0
7.039(16) ') 0.0179(7) O.Oll(13) 7.028(27) ‘) 0.0186(12) 0.026(22) 6.411(26) 0.0184(13) 0.043(22) 5.58 l(35) 0.0189(17) 0.074(29) 4.957(20) 0.0167(10) 0.083(17) 4.418(16) 0.0175(8) 0.072(14) 3.899(14) 0.0187(6) 0.115(12) 3.986(20) 0.0194(9) 0.165(17) 4.028(16) 0.0226(g) 0.045(14) 4.429(40) 0.0257(20) 0.149(35) 4.929(24) 0.0278(12) 0.235(21)
‘) Values from [65 D 11.
Bonnenberg, Hempel, Wijn

Ref. p. 2741 1.2.1.2.10 Fe-Co-Ni: specific heat 251
0.25
mr& 0.20
0.15
I 0.10 8
Fig. 213. Spin wave specific heat coefficient c( offcc Fe-Ni alloys as derived from various measurements. Triangles: specific heat measurements [68 D 11, open circles: specific heat measurements of [68 D l] combined with ultrasonic measurements of the elastic constants [68 B2], solid circles and line: neutron scattering measurements [64H 11. Cross: disordered FeNi, [70 K 21.
-0.05 0 0.1 0.2 0.3 0.4 0.5 0.6 0.7 Ni x- -^ s.u
mJ mol K2
ordered -cc))-I-
-- --
CD = 2.286.10-2T3t3.301 T
3.0 0 2 4 6 8 IO 12 14 16 18 K2 20
Fig. 215. For caption, see p. 253.
T2 - Fig. 214. Low-temperature specific heat capacity C, of ordered and disordered FeNi, [70 K 21.
8
0 200 400 600 800 K IC 0 200 400 600 800 K II a
Fig. 215a. T- b
Fig. 215b. T-
Land&Bbmstein New Series III/I%
Bonnenberg, Hempel, Wijn
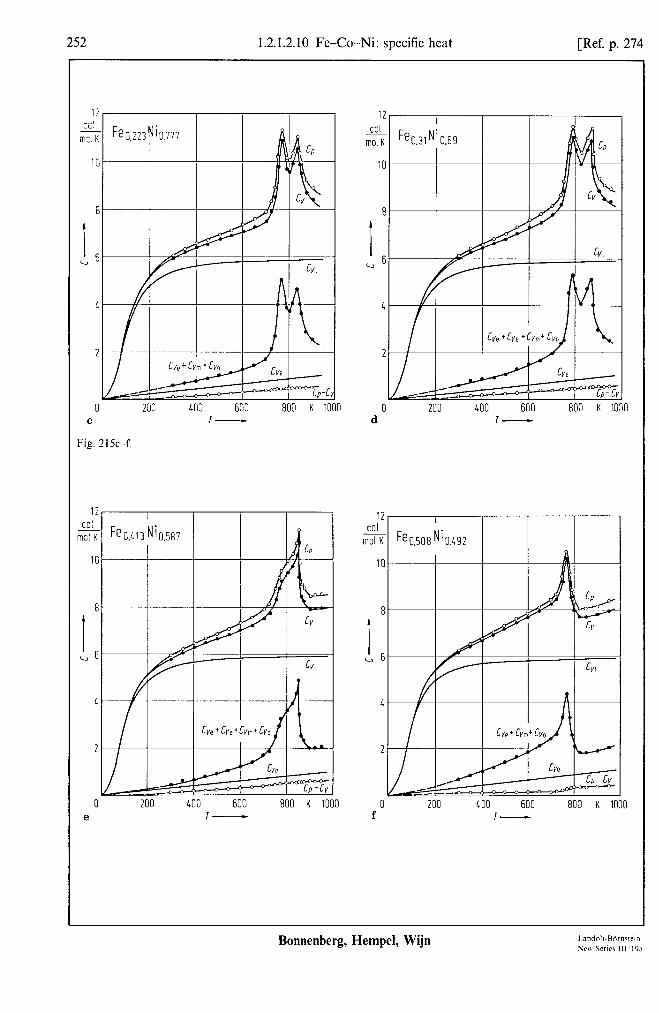
252 1.2.1.2.10 Fe-Co-Ni: specific heat [Ref. p. 274
12 Cii
mz’ K
10
8
I ,6
4
2
0 C
I Fed%.:77 I I H P
I
200 400 600 800 K 1000 I-----
Fig. 21.5~ -f.
1; CUl
mzl K
l[
0 200 400 600 800 K 1000 e I-
12 COI
mol K
10
8
I cl6
4
2
Ii COI
mol K
200 400 600 800 K 1030 T-
Fe0.508 Ni0.492 I I I I
f0 200 400 600 800 K 1000
T-
-l
Bonnenberg, Hempel, Wijn
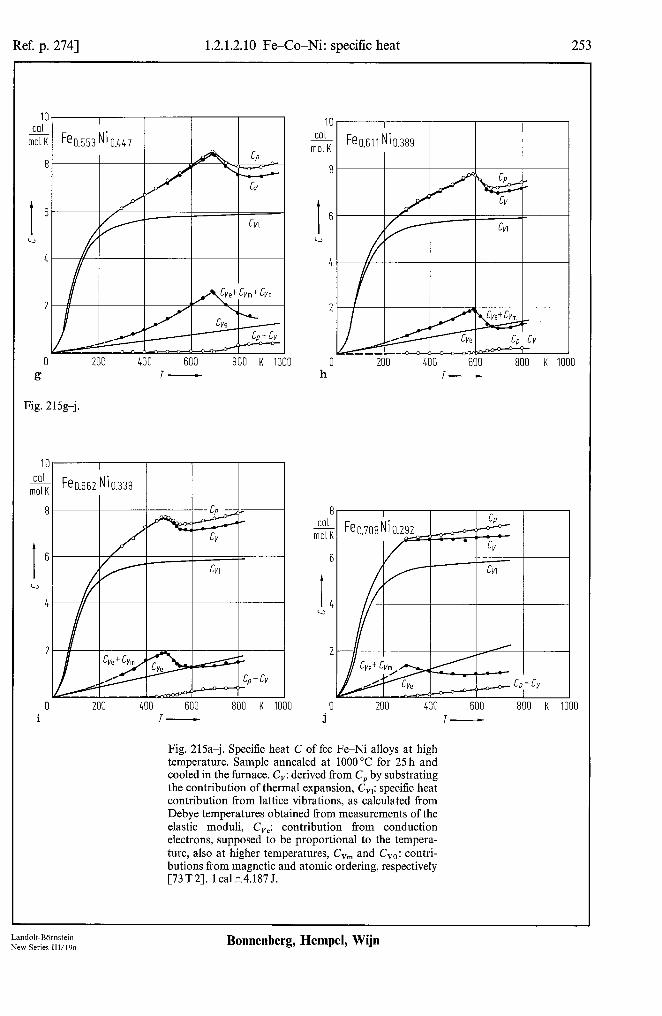
Ref. p. 2741 1.2.1.2.10 Fe-Co-Ni: specific heat 253
IO col
mol K
8
200 400 600 800 K IC T-
Fig. 215g-j.
IC col
mol K
8
I
FeO.662 Ni0.338
I 200 400 600 800 K 1000 i T-
0 200 400 600 800 K 1000 h T-
81 I I r I I
%I Fe0.708,i0@ / 1
61 cv
I 4 u
0 200 400 600 800 K 1000 j T-
Fig. 215a-j. Specific heat C of fee Fe-Ni alloys at high temperature. Sample annealed at 1000 “C for 25 h and cooled in the furnace. C,: derived from C, by substrating the contribution of thermal expansion, C,,: specific heat contribution from lattice vibrations, as calculated from Debye temperatures obtained from measurements of the elastic moduli, C,,: contribution from conduction electrons, supposed to be proportional to the tempera- ture, also at higher temperatures, Cv, and Cv,: contri- butions from magnetic and atomic ordering, respectively [73T2]. lcal~4.1875.
Landolf-Bijrnstein New Series 111/19n
Bonnenberg, Hempel, Wijn
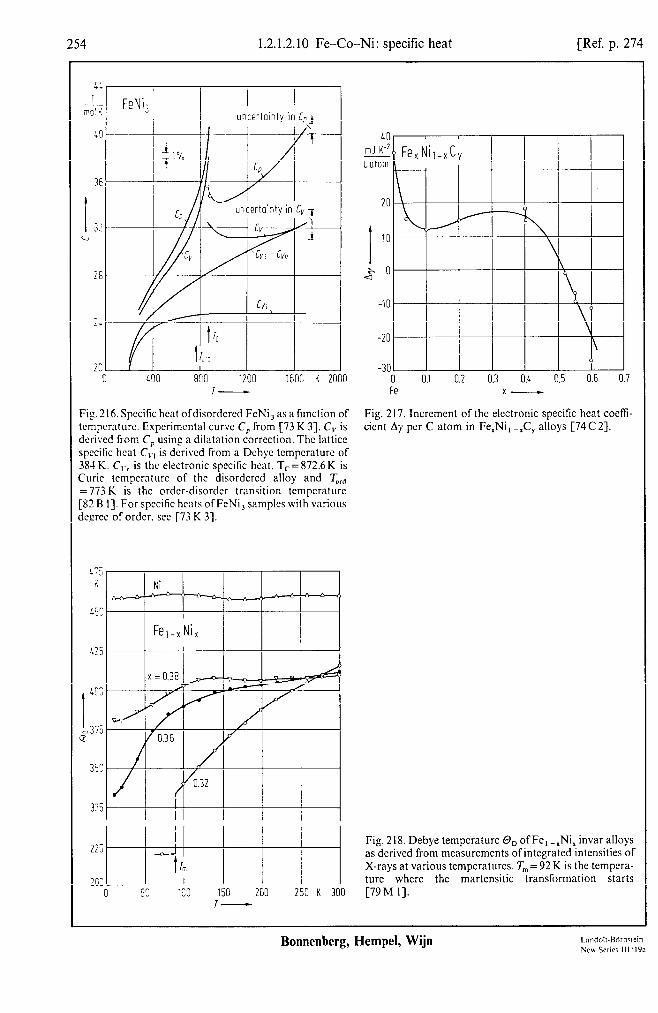
254 1.2.1.2.10 Fe-Co-Ni: specific heat [Ref. p. 274
2E
2i
2G
i JGT7-- 1 I unFertoinly in,CvJ
( 2000
Fig. 216. Specific heat ofdisordered FeNi, as a function of temperature. Experimental curve C, from [73 K 31. C, is derived from C, using a dilatation correction. The lattice specific heat C,., is derived from a Dcbye tempcraturc of 38-l K. C,., is the electronic specific heat. T,=872.6K is Curie temperature of the disordered alloy and Trd = 773 K is the order-disorder transition temperature [82 B I]. For specific heats ofFcNi, samples with various degree of order. see [73 K 33.
0 so 100 150 200 250 K 300 I-
40 mJ K.* Cotom
20
I 10
6 O
-10
-20
-30 Cl.1 0.2 0.3 0.4 0.5 0.6 0.7 0
Fe X-
Fig. 217. Increment of the electronic specific heat coefli- cicnt Ay per C atom in Fc,Ni, -,C, alloys [74C 23.
Fig. 218. Debye temperature 0, ofFe, -,Ni, invar alloys as derived from measurements ofintegrated intensities of X-rays at various temperatures. T, = 92 K is the tempera- ture where the martensitic transformation starts [79 M 11.
Bonnenberg, Hempel, Wijn
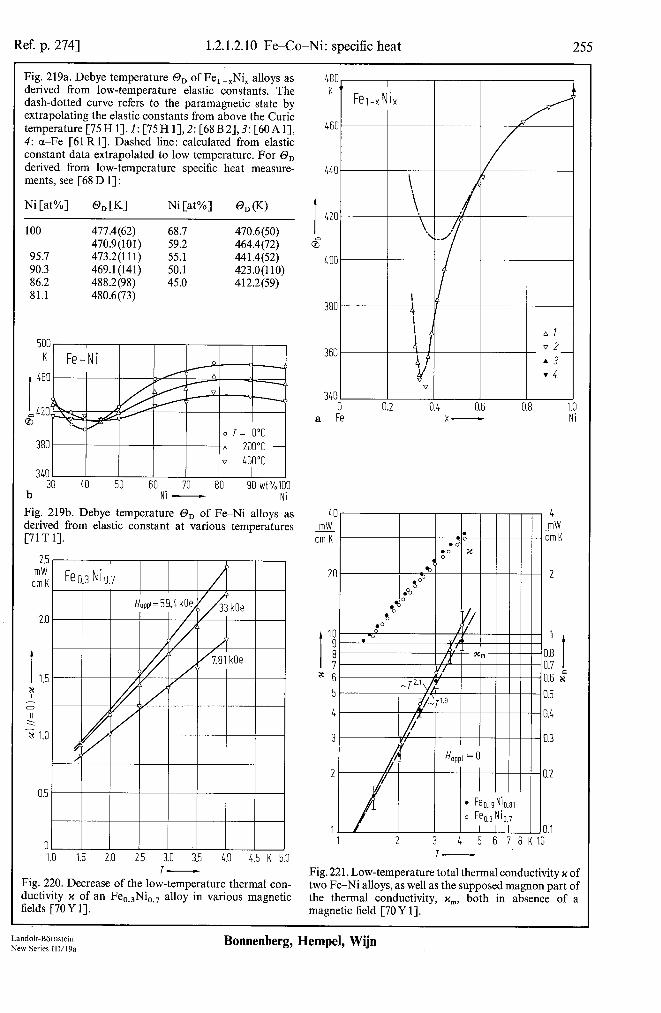
Ref. p. 2741 1.2.1.2.10 Fe-Co-Ni: specific heat 255
Fig. 219a. Debye temperature On of Fe,-.Ni, alloys as derived from low-temperature elastic constants. The dash-dotted curve refers to the paramagnetic state by extrapolating the elastic constants from above the Curie temperature [75 H 11.1: [75 H 1],2: [68 B 2],3: [6OA 11, 4: cl-Fe [61 R 11. Dashed line: calculated from elastic constant data extrapolated to low temperature. For 0, derived from low-temperature specific heat measure- ments, see [68 D l] :
Ni [at%]
100
95.7 90.3 86.2 81.1
@D CKI
477.4(62) 470.9(101) 473.2(111) 469.1(141) 488.2(98) 480.6(73)
Ni [at%] @n iw
68.7 470.6(50) 59.2 464.4(72) 55.1 441.4(52) 50.1 423.0(110) 45.0 412.2(59)
500 K
I
460
,420 0
380
v 400°C 3LO
30 40 50 60 70 80 90 wt%loo b Ni - Ni
Fig. 219b. Debye temperature On of Fe-Ni alloys as derived from elastic constant at various temperatures [71 T 11.
2.5 mW cmK
0.5
01 1.0 1.5 2.0 2.5 3.0 3.5 4.0 L.5 K 5.0
T- Fig. 220. Decrease of the low-temnerature thermal con- ductivity II of an Fe,,,Ni,,, alloy in various magnetic fields [70 Y 11.
a Fe 0.6 0.8 1.0
x- Ni
40 4
mW mW - cmK
w . oc cmK
.O Ir! 0
20 -b Tl 2
.O .0O
I ‘! ; 0.8 0.7 1 I x 6 0.6 x'
5 0.5
4 0.4
3 0.3
2 0.2
1 0.1 1 2 3 4 5 6 7 EKIO
T-
Fig. 221. Low-temperature total thermal conductivity x of two Fe-Ni alloys, as well as the supposed magnon part of the thermal conductivity, x,, both in absence of a magnetic field [70 Y 11.
Landolt-Biirncfein New Series 111/19a
Bonnenberg, Hempel, Wijn
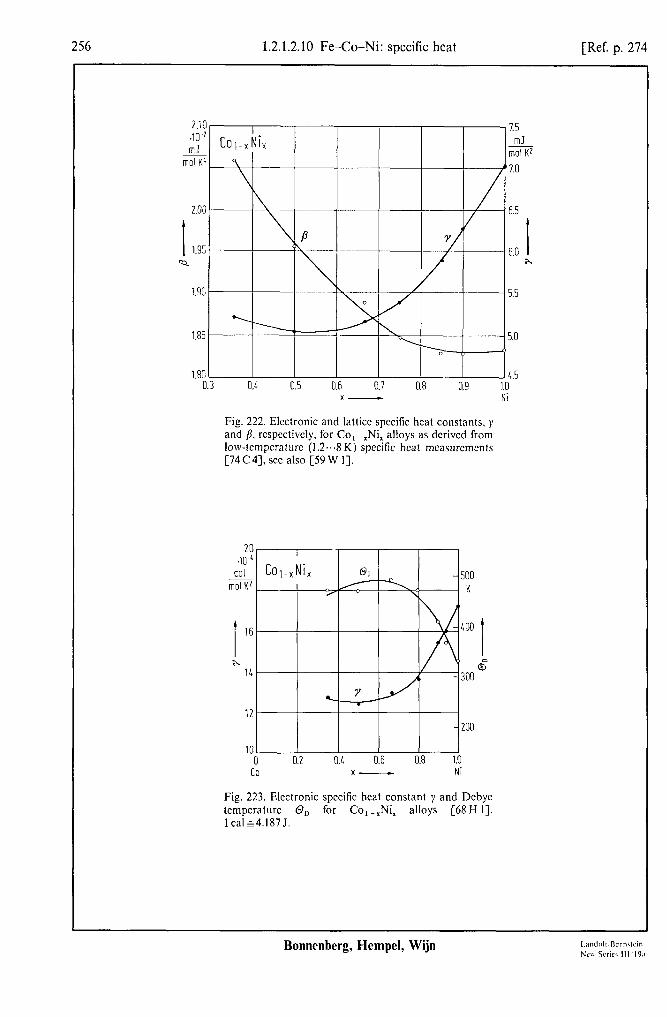
256 1.2.1.2.10 Fe-Co-Ni: specific heat [Ref. p. 274
molKL \
\ /
1.8Ol 0.3 0.4 0.5 0.6 0.7 0.8 0.9
X- Ni
Fig. 222. Electronic and lattice specific heat constants, 1 and /?, rcspcctivcly, for Co, -,Ni, alloys as dcrivcd from low-tempcraturc (1.2.‘.8 K) specific heat mcasurcmcnts [74C4]. see also [59 W I].
A 14
>:I D
0 - 300
I 16 400
0 0.2 0.4 0.6 0.8 1.0 co x- Ni
Fig. 223. Electronic specific heat constant y and Debyc tempcraturc 0, for Co,-,Ni, alloys [68 H I]. lcal&4.187J.
25 mJ
molK2
7.0
6.5
6.0 I x
5.5
5.0
4.5 I
Bonnenberg, Hempel, Wijn
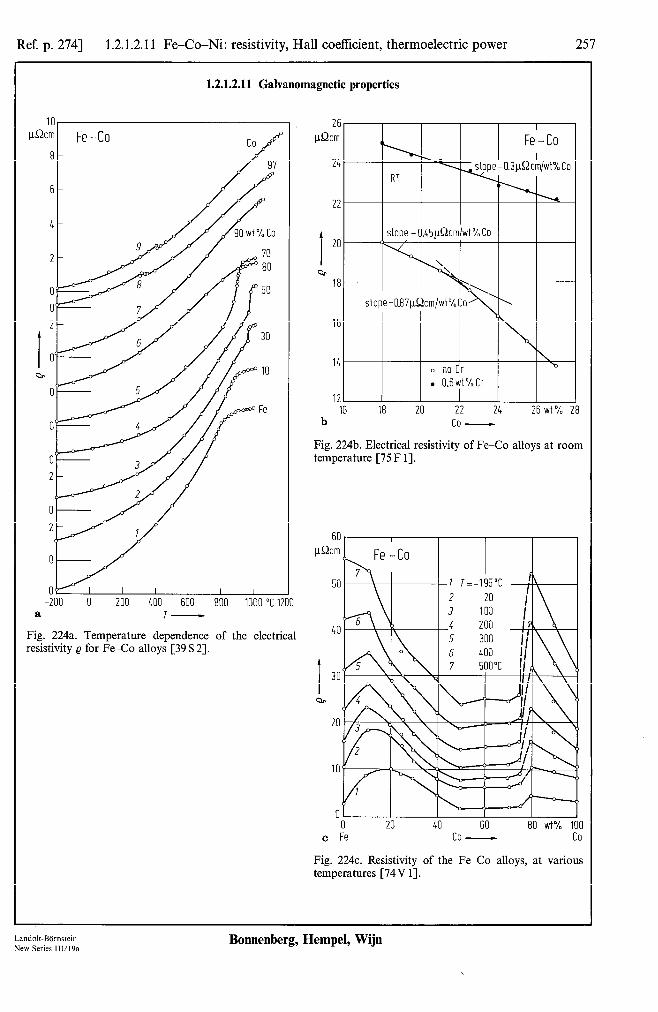
Ref. p. 2741 1.2.1.2.11 Fe-Co-Ni: resistivity, Hall coefficient, thermoelectric power 257
1.2.1.2.11 Galvanomagnetic properties
p.Qcm 1 Fe-Co
0 2
I 30
0 Qn IO
0
Fe
0
0
2
0
2
0
Okdl -200 0 800 1000 "C Ii a T-
Fig. 224a. Temperature dependence of the electrical resistivity Q for Fe-Co alloys [39 S 21.
26, I I I I I
I 20
Qr 18
16
16 18 20 22 24 26 wt% ; b co -
Fig. 224b. Electrical resistivity of Fe-Co alloys at room temperature [75 F 11.
UI 0 20 40 60 80 wt% 1’
c Fe co - co
Fig. 224~. Resistivity of the Fe-Co alloys, at various temperatures [74V 11.
Land&Bbrnstein New Series lll/l9a
Bonnenberg, Hempel, Wijn

258 1.2.1.2.11 Fe-Co-Ni: resistivity, Hall coefiicient, thermoelectric power [Ref. p. 274
4s .?i -2
3.f
Fe-Co
3.2
2.6
2.4
0.E
0.4
C
-0.i 1 20 1
a FE
Fig. 225a. Longitudinal magnctorcsistancc. i.e. the rcla- tive change of the electrical rcsistivity, AQ ,/Q. as a conscqucncc of an applied ficld of I.5 kOc for Fc Co allow at various tempcraturcs [39 S 2). 60 80 wt%
co - co
I = -195°C
i
-195°C
I 60
sr” 40
20
0
-20 0 20 40 60 80 wt% 100
c Fe co - co
Fig. 225~. Concentration depcndcncc of the anomalous Hall constant R, for Fe--Co alloys at various tempera- tunes [74V I].
80
I 63
d
40
20
0
-20
b -200 -100 0 100 200 300 400 500 "C 601
Fig. 225b. Tcmpcraturc depcndcncc of anomalous Hall constant R, for
0 Fc Co alloys [74V I].
Bonnenberg, Hempel, Wijn I.andolr.Rornrlcin Neu Scricr III ‘19:s
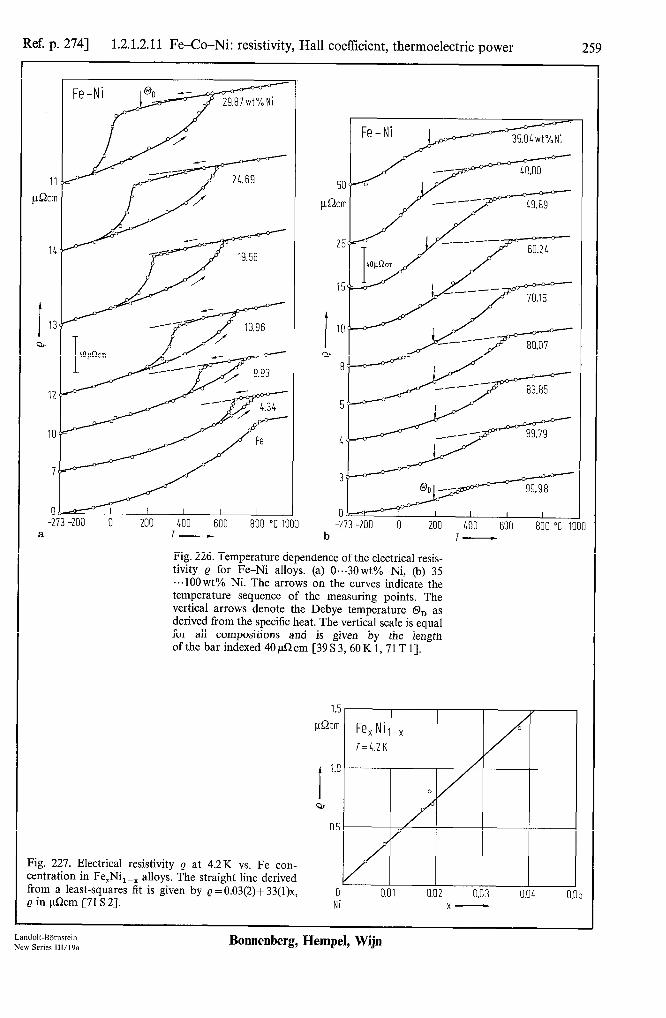
Ref. p. 2741 1.2.1.2.11 Fe-Co-Ni: resistivity, Hall coefficient, thermoelectric power 259
rc-‘y’ n 29.87wt%Ni
11
p!h
IL -F- j 19.56
I 13
Qr
12
IO
7
-!73 I I I
-200 II 200 400 600 800 “C IC a 7-
Fe-Ni
0 -273 -200 0 200 KIO 600 800 “C I[
b 7-
Fig. 226. Temperature dependence of the electrical resis- tivity Q for FeNi alloys. (a) 0...30wt% Ni, (b) 35 . ..lOO wt% Ni. The arrows on the curves indicate the temperature sequence of the measuring points. The vertical arrows denote the Debye temperature On as derived from the specific heat. The vertical scale is equal for all compositions and is given by the length ofthebarindexed40@2cm[39S3,60K1,71T1].
1.F
pQcm
I
1.C
Q
0.5
Fig. 227. Electrical resistivity Q at 4.2K vs. Fe con- centration in Fe,Ni,-, alloys. The straight line derived
0.0 1 0.02 0.03 O.OL 0 trom a least-squares fit is given by @=0,03(2)+33(1)x, 0 p in @cm [71 S 21. NI x-
Landolt-BBmstein New Series Ill/~%
Bonnenberg, Hempel, Wijn

260 1.2.1.2.11 Fe-Co-Ni: resistivity, Hall coefficient, thermoelectric power [Ref. p. 274
I quenched from1400K 2 equilibrium at 767 3 755 4 735 5 713
6 1000 1200 K 1L
Fig. 228. Electrical rcsistivity Q vs. tempcraturc T for FeNi, alloys after various heat trcatmcnts leading to rarious degrees of atomic ordering [73 K 31. See also [82 0 21. Krd: order-disorder transition tempcraturc.
0 10 20 30 LO 50 60 70 K 80 I-
Fig. 230. Tcmpcraturc dcpcndcncc of the rclativc change of the electrical rcsistivity for small incrcmcnts of the magnetic field. (Aplp,)‘A,H at high values of the magnetic licld strength H. i.e. in the range ofthc pnraproccss for Fe Ni invar alloys. 40 denotes the rcsistivity in zero magnetic licld [59 K I].
5 0 10 20 30 40 50 60 70 K 80 I-
Fig. 229. Temperature dependence of the relative change of the electrical rcsistivity under hydrostatic pressure p, (A?/+)/Ap, for an invar alloy Fe,,,,Ni,,,,. where o0 is the rcslstlvity under ambient pressure [59 K I].
0 0.1 0.2 0.3 0.1 0.5 0.6 0.7 0.8 Ni x-
Fig. 23 1. lncrcmcnt of the residual (i.e. low temperature) rcsistivity per atom percent c of C. A.o,lc, for (Fe,Nil -,) C, alloys [74 C 23.
Bonnenberg, Hempel, Wijn I.andolr.Bornrrcin Nea Scrim III ‘19n
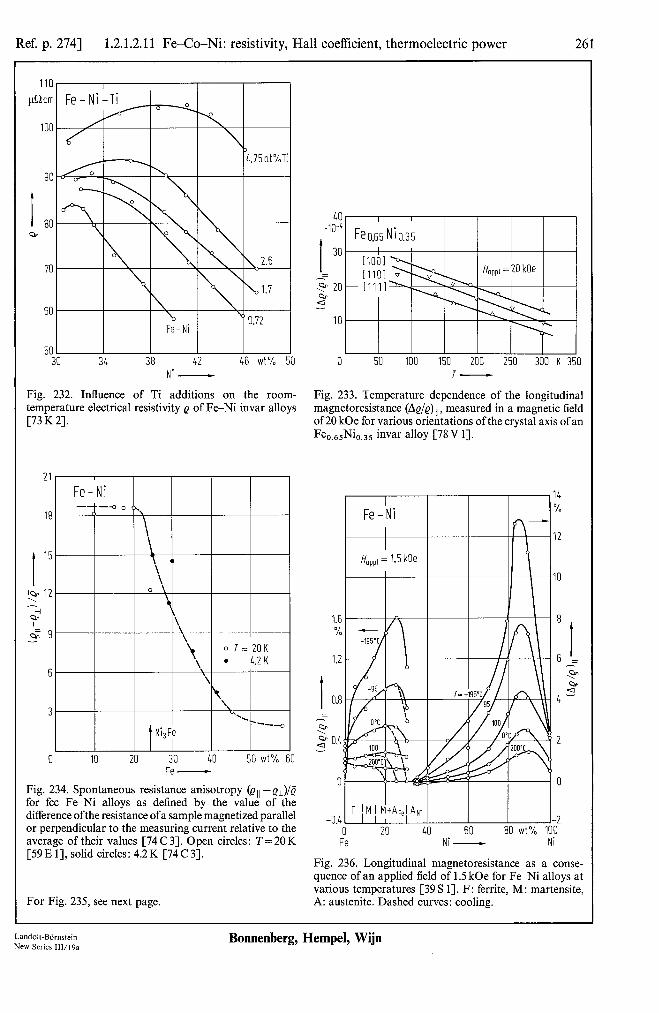
Ref. p. 2741 1.2.1.2.11 Fe-Co-Ni: resistivity, Hall coefficient, thermoelectric power 261
110 I
pQcm Fe-Ni-Ti 0 AT
u-o 100
0 3 4.75 at%Ti
60
30 34 38 42 46 wt% 50 NI -
Fig. 232. Influence of Ti additions on the room- temperature electrical resistivity Q of Fe-Ni invar alloys [73K2].
I I I I I I I
0 0 IO IO 20 20 30 40 30 40 50 wt”/o 50 wt”/o Fe -
Fig. 234. Spontaneous resistance anisotropy (Q ,, - el)/Q for fee Fe-Ni alloys as defined by the value of the difference ofthe resistance ofa sample magnetized parallel or perpendicular to the measuring current relative to the average of their values [74 C 31. Open circles: T=20K [59 E 11, solid circles: 4.2 K [74C 31.
For Fig. 235, see next page.
0 50 100 150 200 250 300 K 350 T-
Fig. 233. Temperature dependence of the longitudinal magnetoresistance (A@/@) ,, , measured in a magnetic field of 20 kOe for various orientations of the crystal axis of an %65%35 invar alloy [78 V 11.
1.6 8 %
1.2 6 ‘=
I
G ch
0.8 4s =
F 2 0.4 2
0 0
F 1 M I d+AFpI ANi -0.4 I I I I
0 20 40 60 80 wt% lOi Fe NI - Ni
Fig. 236. Longitudinal magnetoresistance as a conse- quence of an applied field of 1.5 kOe for FeNi alloys at various temperatures [39 S 11. F: ferrite, M: martensite, A: austenite. Dashed curves: cooling.
Landolt-Bdmstein New Series I11/19a
Bonnenberg, Hempel, Wijn
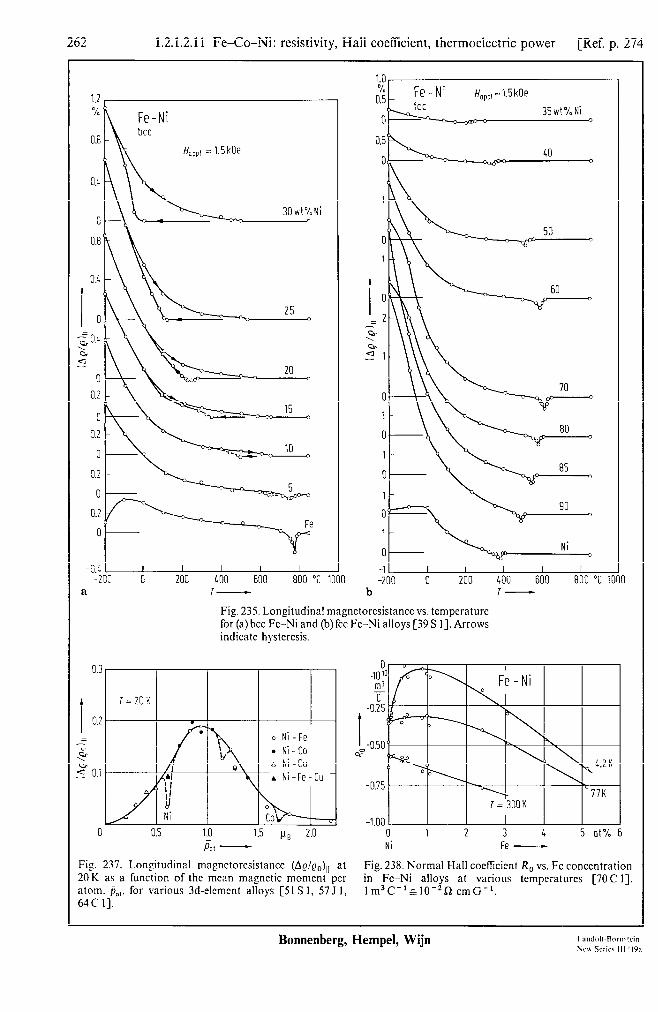
262 1.2.1.2.11 Fe-Co-Ni: resistivity, Hall coefficient, thermoelectric power [Ref. p. 274
1.2 %
0.8
0.1
0
0.8
0.1
I 0 204 ,a G 4 -
0
0.2
0
0.2
0
0.2
0
0.2
0
-0.4 I I I I I I -203 0 200 400 600 800 “C
I- a
0.3
I 0.2
= G T- 2 0.i
0
0
1
0
1
C
1
0
1
0
1; b
I I I I I 0 200 400 600 800 “C
T-
Fig 235. Longitudinal magnetoresistance vs. temperature for (a) hcc Fc-Ni and @) fee Fe-Ni alloys [39 S I]. Arrows indicate hystcrcsis.
‘;,y 0.; 0
0.5
0
1
0
1
I 0
= 2
5
z- 1
Fe-Ni Hopp, = 1.5 kOe fee 35wl%Ri - -_) ?
40 0
1=20K
41 ) ;’
II d Ni
0.5 1.0 1 PO: -
o Ni -Fe l Ni-Co A Ni-Cu
-A Ni-Fe-k
u
0 Cob
Ps 2.0 Ni Fe -
Fip. 237. Longitudinal magnetoresistancc (AQ/Q,,),, at Fig. 238. Normal Hall coefficient R, vs. Fe concentration 20K as a function of the mean magnetic moment per in Fc-Ni alloys at various temperatures [7OC I]. atom. &,, for various 3d-element alloys [Sl S 1, 575 1, lm3C-‘nIO-2R cmG-‘. 64C I].
Bonnenberg, Hempel, Wijn

Ref. p. 2741 1.2.1.2.11 Fe-Co-Ni: resistivity, Hall coefficient, thermoelectric power 263
0 0 .lO" .lO" N i _ Fe N i _ Fe
I I ?- ?-
2 2
-‘!b 1.2 p&m 1.8
P-
Fig. 239. Anomalous Hall angle Q, JQ vs. the resistivity Q for Fe-Ni alloys with small concentration in the range from 0.5 up to 5at% Fe. T=4.2K. Open circles: [75 D I], solid circle: [74 J 11. can: en = R,B + eaH.
5
0 40 80 120 160 200 240 280 K 320 b T-
Fig. 240b. Low-temperature values of the spontaneous Hall coefficients R, of Fe-Ni alloys [65S 11. 1m3C-‘~10-Z~cmG-1.
Fig. 240~. Temperature dependence of the spontaneous Hall coefficient R, for small Fe concentrations in Fe-Ni alloys NQ): annealed at 105O”C, 1 h [65H I]. 1 m3 C-l& 10-2ficmG-‘. The original literature gives the absolute values of R,.
2000 III4000
1600 3200
t I 1200 2400 z
.s
CT s K
800 1600~
400 800
0 0
-400 -800 -200 0 200 400 “C 600
a T-
Fig. 240a. Temperature dependence of the spontaneous Hall coefficient R, for Fe-Ni alloys. The scale on the right-hand side applies to 55wt% Fe [64K I]. lm3C-1~10-ZQcmG-1.
t -4+. 3.09 1 I Y\\\ I\ \ I d 4.07 1 I F-h\\ u\
. 2.44 P I.08 I f 1~1 i
-6
-7
-8
c
-0 0.89 0 0.43 a 0.35
-v 0.07 o NiII
t -91
0 50 100 150 200 250 K : C T-
Landolt-BBrnsfein New Series lll/l9a
Bonnenberg, Hempel, Wijn

264 1.2.1.2.11 Fe-Co-Ni: resistivity, Hall coefficient, thermoelectric power [Ref. p. 274
-1.2 0 50 100 150 200 250 K
=a
b
\ - 4
--a-
300 d I-
Fi_e. 240d. Normal Hall coetlicicnt R, vs. temperature for small Fe concentrations in FeNi alloys [65H I]. NiI(II): annealed at 1200 “C (1050 “C) for 2 h (I h). then cooled at a rate of S”C!min. The original literature gives the absolute values of R, [65 H I].
-0.E
-0.E
-0,s 0 Ni
I
-0x
oe
-0.8
-1.6
-2.0
e
c
1 I 15ot% Ni
0 I
0
. -0.5
80 160 2LO K 320 I-
Fig. 240~. Low-temperature values of the normal Hall coefftcicnts R, of Fe-Ni alloys [65S I]. n: effective number of electrons per atom, n = - l/R,Ne, where N is the number of atoms per m3 and e is the electron charge 1 m3C-‘a 10-ZRcmG-‘.
0.5 1.0 1.5 2.0 2.5 3.0 3.5 L.0 4.5 ot% 5.5 Fe, Co, Cu -
Fig. 241. Normal Hall coctlicicnt R, for alloys ofNi with Fe.Co,andCu[65Hl].lm3C-r&IO-*ficmG-’.Thc original litcraturc gives the absolute values of R,.
Bonnenberg, Hempel, Wijn
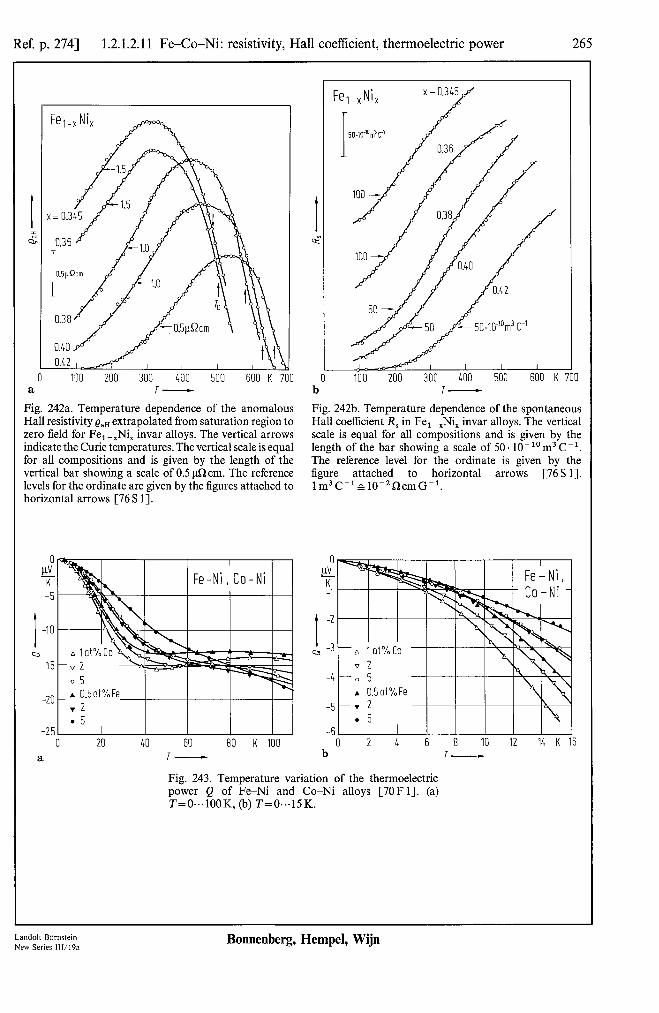
Ref. p. 2741 1.2.1.2.11 Fe-Co-Ni: resistivity, Hall coefficient, thermoelectric power 265
Fel-x Ni,
0 100 200 300 400 500 600 K 71 a T-
Fe,-, Ni,
100 200 300 400 500 600 K I-
Fig. 242a. Temperature dependence of the anomalous Fig. 242b. Temperature dependence of the spontaneous Hall resistivity can extrapolated from saturation region to Hall coefficient R, in Fe,-,Ni, invar alloys. The vertical zero field for Fe,-,Ni, invar alloys. The vertical arrows scale is equal for all compositions and is given by the indicate the Curie temperatures. The vertical scale is equal length of the bar showing a scale of 50.10-lo m3 C-‘. for all compositions and is given by the length of the The reference level for the ordinate is given by the vertical bar showing a scale of 0.5 @I cm. The reference figure attached to horizontal arrows [76 S 11. levels for the ordinate are given by the figures attached to 1m3C-‘~10-2~cmG-‘. horizontal arrows [76 S 11.
0 20 40 60 80 K 100 a 7-
0 2 4 6 8 10 12 14 K 16 b T-
Fig. 243. Temperature variation of the thermoelectric power Q of Fe-Ni and Co-Ni alloys [70F 11. (a) T=O...lOOK, (b) T=0...15K.
Landolt-Bbmstein New Series IWl9a
Bonnenberg, Hempel, Wijn
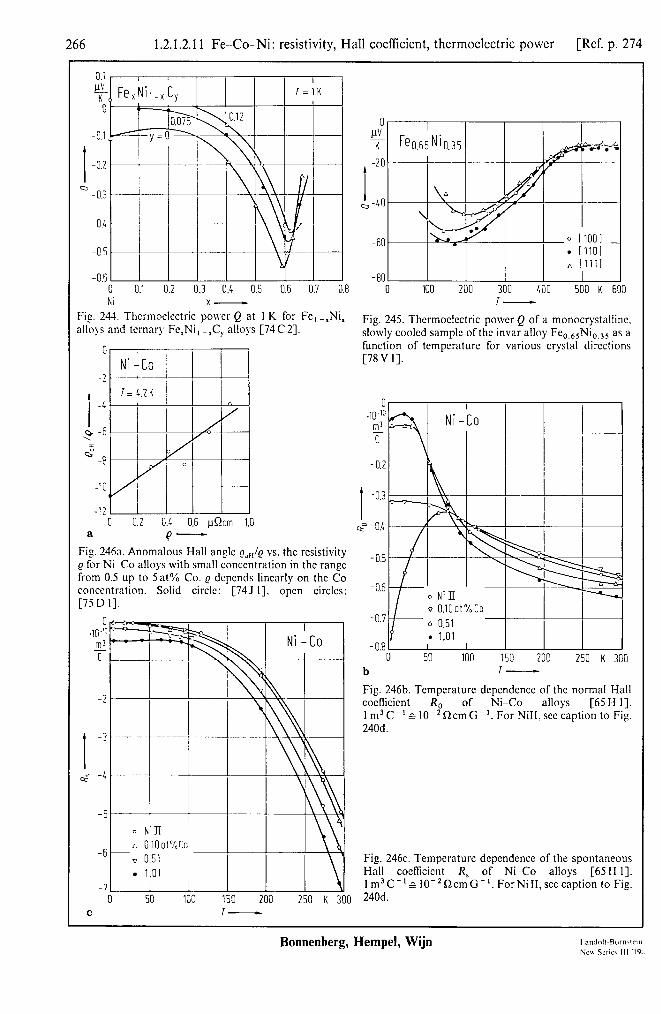
266 1.2.1.2.11 Fe-Co-Ni: resistivity, Hall coefficient, thermoelectric power [Ref. p. 274
-0.5 0 0.1 0.2 0.3 0.1 0.5 0.6 0.7 0.8 Iii XM
Fig. 24-l. Thcrmoclcctric power Q at I K for Fc,-,Ni, alloys and tcmary FqNi, - ,C, alloys [74 C 21.
G Ni -Co
-2
0 c.2 0.4 0.6 pQcn 1.0 a 4-
Fig. 246n. Anomalous Hall angle P,,,/Q vs. the rcsistivity e for Ni-Co alloys with small concentration in the range from 0.5 up to 5at% Co. e depends linearly on the Co concentration. Solid circle: [74 J I]. open circles: [75 D I].
. 1.01 -1
0 50 100 150 200 250 K 300 C I-
0 100 200 300 LOO 500 K 600 I-
Fig. 245. Thermoelectric power Q of a monocrystallinc. slowly cooled sample of the invar alloy Fe,,,,Ni,,,, as a function of tcmncraturc for various crvstal directions [78Vl]. L
.
I -0.3
$= -04
-0.5
-0.6
- 0.8 0 50 100 150 200 250 K 300
b I-
Fig. 246b. Temperature dcpcndencc of the normal Hall cocffkicnt R, of Ni--Co alloys [65 H I]. I m3C-‘~10-20cmG-‘. For NiII,scccaption to Fig. 240d.
Fig. 246~. Temperature dcpcndence of the spontaneous Hall coefficient R, of Ni -Co alloys [65H I]. lm3C-‘a10-252cmG-‘.ForNiII,scecaption toFig. 240d
Bonnenberg, Hempel, Wijn
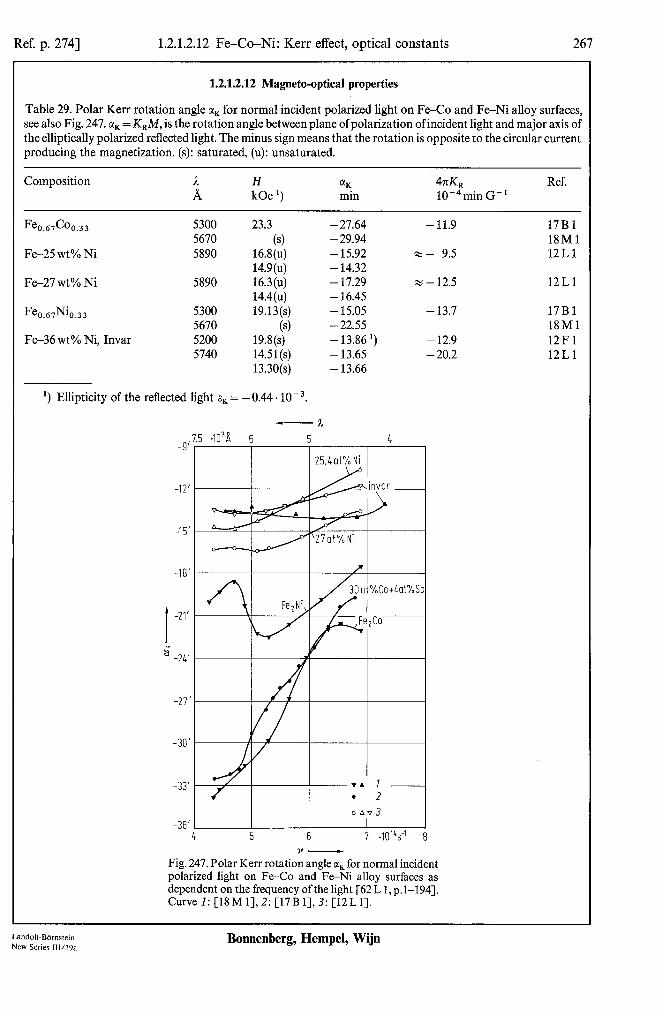
Ref. p. 2741 1.2.1.2.12 Fe-Co-Ni: Kerr effect, optical constants 267
1.2.1.2.12 Magneto-optical properties
Table 29. Polar Kerr rotation angle ak for normal incident polarized light on Fe-Co and Fe-Ni alloy surfaces, see also Fig. 247. aK = K&f, is the rotation angle between plane of polarization of incident light and major axis of the elliptically polarized reflected light. The minus sign means that the rotation is opposite to the circular current producing the magnetization. (s): saturated, (u): unsaturated.
Composition H kOe ‘)
EK
min 41tK, 10m4 min G-r
Ref.
Fe 0.67COO.33
Fe-25 wt% Ni
Fe-27 wt % Ni
5300 23.3 5670 6) 5890 16.8(u)
14.9(u) 5890 16.3(u)
14.4(u) Fe 0.67Ni0.33 5300 19.13(s)
5670 (4 Fe-36 wt% Ni, Invar 5200 19.8(s)
5740 14.51(s) 13.30(s)
-27.64 - 11.9 - 29.94 - 15.92 x - 9.5 - 14.32 - 17.29 z - 12.5 - 16.45 - 15.05 - 13.7 - 22.55 - 13.86 ‘) - 12.9 - 13.65 - 20.2 - 13.66
17Bl 18Ml 12Ll
12Ll
17Bl 18Ml 12Fl 12Ll
‘) Ellipticity of the reflected light ak = -0.44.10 - 3.
J .lO"A 6 5
-- l 2 OAV.7
-36' I 4 5 6 7 .1rl'4s-' 8
Y-
Fig. 247. Polar Kerr rotation angle c~k for normal incident polarized light on Fe-Co and Fe-Ni alloy surfaces as dependent on the frequency of the light [62 L 1, p. l-1941. Curve I: [18M 1],2: [17B 1],3: [12L 11.
Landolt-Bdmstein New Series 111/l%
Bonnenberg, Hempel, Wijn
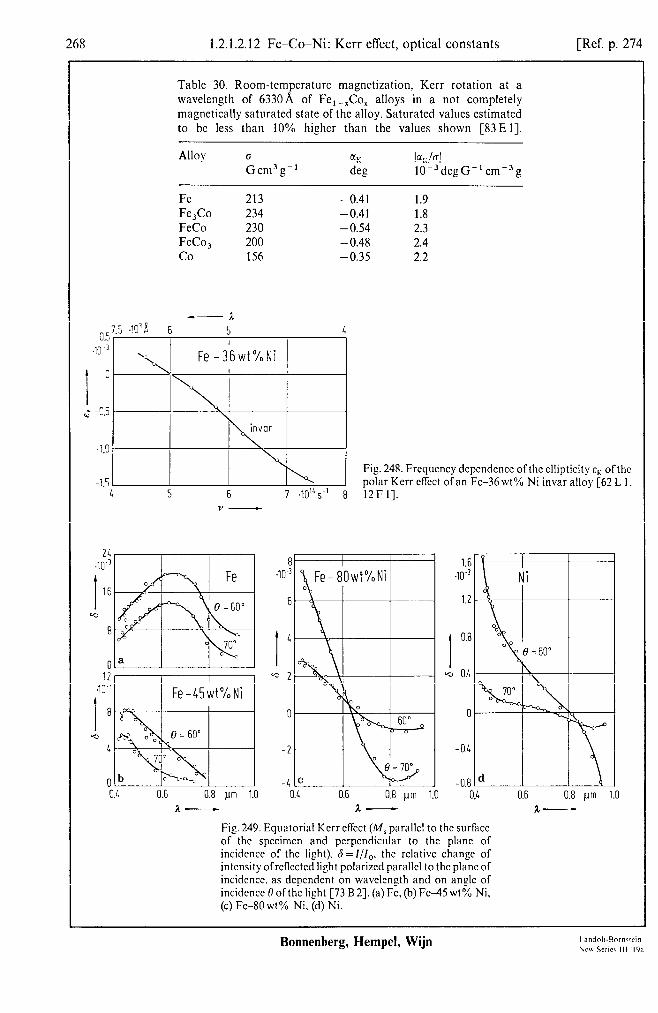
268 1.2.1.2.12 Fe-Co-Ni: Kerr effect, optical constants [Ref. p. 274
Table 30. Room-temperature magnetization, Kerr rotation at a wavelength of 633OA of Fe, -Co, alloys in a not completely magnetically saturated state of the alloy. Saturated values estimated to be less than 10% higher than the values shown [83E 11.
Alloy 0 Gcm3g-’
% deg
I%;/4 10-3degG-1cm-3g
Fe 213 -0.41 1.9 Fe,Co 234 -0.41 1.8 FeCo 230 -0.54 2.3 FeCo, 200 - 0.48 2.4 co 156 -0.35 2.2
I
Fe -36wt%Ni
Fig. 248. Frcqucncy dcpcndcncc of the cllipticity Ed of the polar Kerr effect of an Fe-36 ~1% Ni invar alloy [62 L I.
5 6 7 .lO“ s-1 8 12Fl].
0.L 0.6 0.8 pm 1.0 A-
6
0
-2
0.6 0.8 pm 1 L-
.O
-0.4
-0.E
i- I
, _
I-
I-
b! 0.6 0.8 pm 1.0 A-
Fig. 249. Equatorial Kerr effect (M, parallel to the surface of the specimen and pcrpcndicular to the plant of incidence of the light). 6=1/l,. the relative change of intensity ofrctlcctcd light polarized parallel to the plant of incidcncc. as dcpcndcnt on wavclcngth and on angle of incidcncc 0 ofthc light [73 B 21. (a) Fe,(b) Fe-45 wt% Ni, (c) Fe-EOwt% Ni. (d) Ni.
Bonnenberg, Hemp& Wijn

Ref. p. 2741 1.2.1.2.12 Fe-Co-Ni: Kerr effect, optical constants 269
-50 0 20 40 60 80wt%100 Fe Ni- Ni
60 .10-i
50
-40
-50 0 20 40 60 80wt%100 Fe Ni - Ni
Fig. 250. Components of the magneto-optical parameter Q = Q, -iQ, as dependent on the composition of Fe-Ni alloys for several wavelengths ofthe light, as derived from the equatorial Kerr effect. Q = is&,, (H in z direction). [73 B 21. Curve I: 6700 A, 2: 6000 A, 3: 5400 A, 4: 4700 & 5: 4400 A.
Fig. 251. Longitudinal Kerr rotation angles (M, parallel to surface of the specimen and plane of incident light) a, and tlP for light polarized normal or in the plane of incidence, respectively, as dependent on the angle of incidence f3 for Fe,,,Ni,,, . The wavelength ofthe light is a parameter. Room-temperature measurements [68 J 1, see also 66 T 11. The sign of the Kerr angle is chosen positive when the rotation and the direction of the reflected beam form a right-handed screw.
1 05'
8 0'
-05'
-1 0'
-1 5'
-20' 0" 15" 30" 45" 60" 75" 90"
Landolt-BBmstein New Series 111/19a
Bonnenberg, Hempel, Wijn
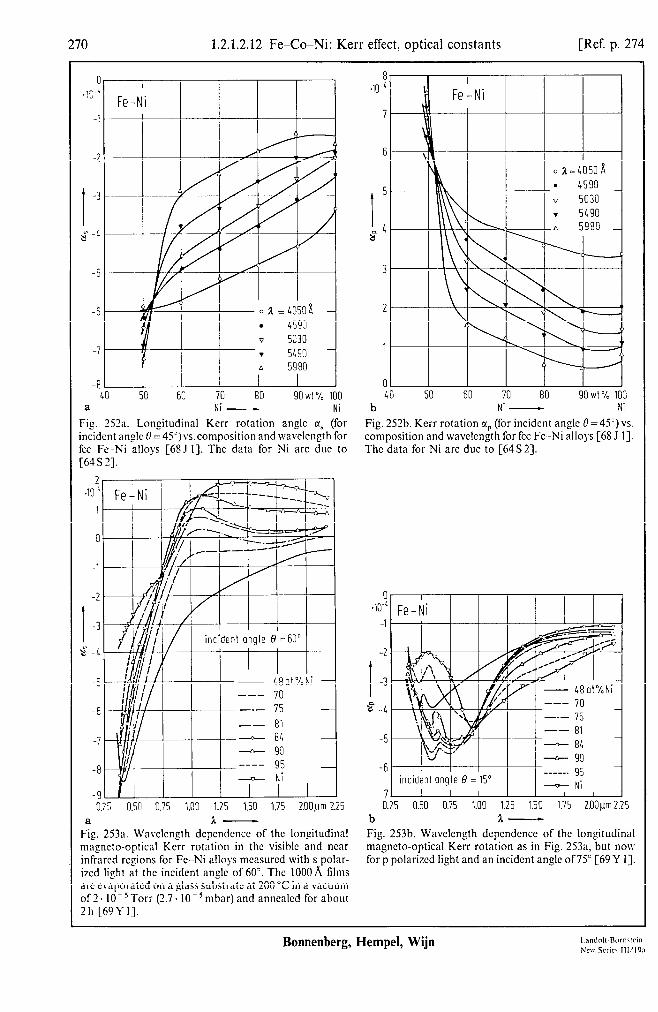
270 1.2.1.2.12 Fe-Co-Ni: Kerr effect, optical constants [Ref. p. 274
I I
Fe-Ni I
I I I I I I 50 63 70 80 90 wt % 100
NI - Ni
Fig. 25%. Longitudinal Kerr rotation angle tl, (for incident angle 0 =45’)vs.composition and wavclcngth for fee Fe -Ni alloys r68 J I]. The data for Ni arc due to [61S7]. - - -
0.25 0.50 0.75 1.00 1.25 1.50 1.75 2.00$25
FY 1.-
g. 253a. Wavelength dependence of the longitudinal ma_rncto-optical Kerr rotation in the visible and near infrared regions for Fe-Ni alloys mcasurcd with s polar- ized light at the incident angle of 60”. The 1000 A films are evaporated on a glass substrate at 200 “C in a vacuum of 2. IO-‘Torr (2.7. 10e5 mbnr) and annenlcd for about 2h [69YI].
t 5.
1 CT 4
3
2
1
0
J’ r
40 50 60 70 80 90 VA O/c 103 b Ni - Ni
Fig. 252b. Kerr rotation (xP (for incident aqle 0 =4Y) vs. composition and wavelength for fee Fe -Ni alloys [68 J I]. The data for Ni arc due to [64 S 23.
0 I *lo-‘ Fe-Ni
-1 I
-6
-7 0.
b
IEot%Ni
70 75 81 84 90 95 Ni
I 2.ooplr ; 25 0.50 0.75 1.00 1.25 1.50 1.75 z.25
L- Fig. 253b. Wavclcngth dependence of the longitudinal magneto-optical Kerr rotation as in Fig. 2.53a, but nou for p polarized light and an incident angle of7Y [69Y I].
Bonnenberg, Hempel, Wijn

Ref. p. 2741 1.2.1.2.12 Fe-Co-Ni: Kerr effect, optical constants 271
-41 I I I I I I
-2 I I I I I
--•-- Fe-BOwt% Ni
0” IO” 20” 30” 40” 50” 60” 70” 80” Q-
Fig. 254. Longitudinal Kerr rotation for light polarized in the plane ofincidence, as dependent on angle of incidence, 0, of light, and the composition of Fe-Ni alloys evaporated films. Wavelength of the light 5OOOA [76 M 31. Solid circles and dashed line: [68 J 11.
2i .,o-?
2c
IE
I 14
0” 12
IO
8
6
4 1
I
Fe-Ni
0 n=40508, . 4590
-v 5030 . 5490 A 5980
I
50 60 70 80 90 wt% 100 NI - Ni
Fig. 256. Amplitude Q, of the magneto-optical parameter Q =is.&,, (H in z direction), vs. wavelength and compo- sition for fee FeNi alloys, as derived from longitudinal Kerr-effect [68 J 11. Q = Q, expiq.
.lO” Fe- Ni
14 a= 5000 A
12
IO
8
t 6
r
0 0 IO” 20” 30” 40” 50” 60” 70” 80”
Fig. 255. Kerr ellipticity sK for Fe-Ni films as a hmction of the angle of incidence 0. Longitudinal arrangement, light wavelength 5000& polarized in the plane of incidence [76 M 31.
Fe-Ni ’ 4J-N I 0.6
40 50 60 70 80 90 wt% 100 Ni - Ni
Fig. 257. Phase factor of the longitudinal magneto- optical parameter, q, as a function of composition and wavelength for fee Fe-Ni alloys [68 J 11. Q=Q,expiq = isx,,/.s,, (H in z direction).
Landolt-Bbmstein New Series lll/l9a
Bonnenberg, Hempel, Wijn

272 1.2.1.2.12 Fe-Co-Ni: Kerr effect, optical constants [Ref. p. 274
20’ r
0”
t -20’ b
0 LO50 v 5550 I -Ci tit7 3’ -film
20 40 60 80 wt% 100 NI -
Fig. 258. Phase factor (I of the longitudinal magncto- optical parameter Q = Q. expiq = ic,)./c,, (H in z direction) as a function of composition for Fe-Ni alloys [76 M 33. Circles: [76 hl33. squares: [12 F I], upward triangles: [63 R 11, crosses and open circles [68 J 11. lozcngc and downward triangles: [63 T I].
1.9
1.8
I 1.7
x
1.6
1.5
1.4 4[ L500 5000 5500 1 6000
1-
Fig. 260. Imaginary part of rcfractivc index. x(n=n, .( I -ix)), as a function of wavclcngth and composition for fee FeNi alloys [68 J I].
IIIrFq--j-
1.6 o SOwt%Ni l 80
v 70 . 60
1.4 I I I 4000 1500 5d30 5500 1 E
Fig. 2.59. Rcfractivc index n,(n = nO( 1 -ix)) vs. wavelength and composition for fee Fc-Ni alloys [68 J I].
0 20 40 60 80 VA% 100 Fe NI - Li
Fig. 261. Rcfractivc index II = nO( 1 -ix)vs. composition of Fc-Ni alloys, measured at 5OOOA. Circles: [76M 33. triangles: [68 J I], squares: [63 R I], lozenges [06 I I].
Bonnenherg, Hempel, Wijn I.andol~-Rornwin
Ncu Sericq 111’19n
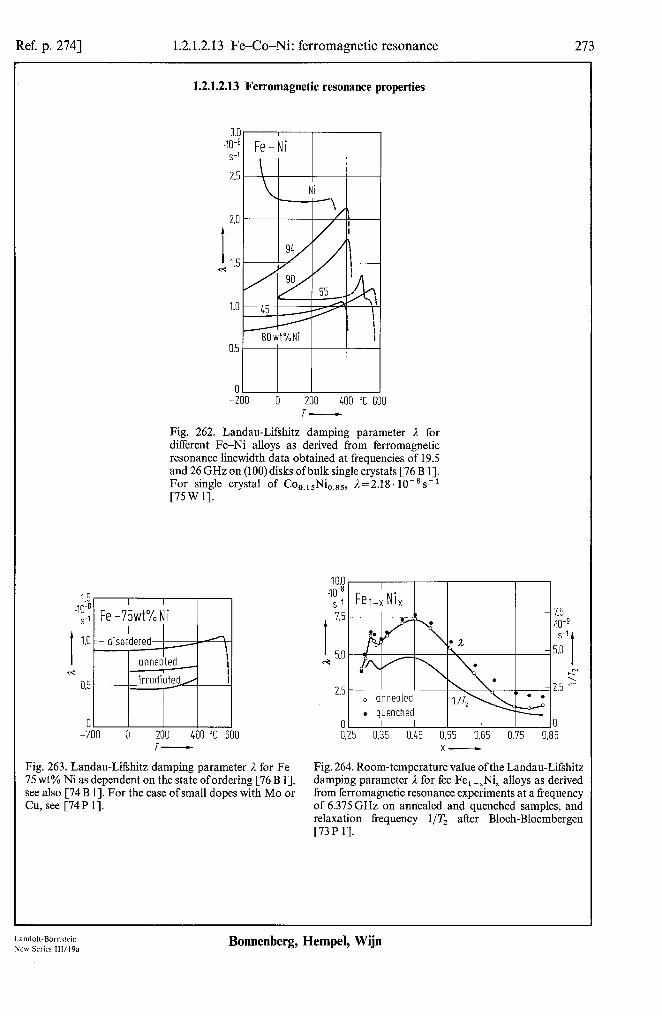
Ref. p. 2741 1.2.1.2.13 Fe-Co-Ni: ferromagnetic resonance 273
1.2.1.2.13 Ferromagnetic resonance properties
Fig. 262. Landau-Lifshitz damping parameter L for different FeNi alloys as derived from ferromagnetic resonance linewidth data obtained at frequencies of 19.5 and 26 GHz on (100) disks of bulk single crystals [76 B 11. For single crystal of Co,,,,Ni,.,,, 1=2.18. 10-8s-1 [75W 11.
Fig. 263. Landau-Lifshitz damping parameter 1 for Fe- 75 wt% Ni as dependent on the state of ordering [76 B 11, see also [74 B 11. For the case of small dopes with MO or Cu, see [74P 11.
10.0 w*
s-1
t
1.5
~ 5.0
2.5
0
I
Fel+ Ni, 1.5 mg s-1
5.0 I
c-”
2.5 2
0 0.25 0.35 0.45 0.55 0.65 0.75 0.85
x-
Fig. 264. Room-temperature value ofthe Landau-Lifshitz damping parameter L for fee Fe, -,Ni, alloys as derived from ferromagnetic resonance experiments at a frequency of 6.375GHz on annealed and quenched samples, and relaxation frequency l/T, after Bloch-Bloembergen [73P 11.
Landolt-B6mstein New Series lll/l9a
Bonnenberg, Hempel, Wijn

274 Refcrcnccs for 1.2.1
1.2.1.3 References for 1.2.1
1897 G 1 Guillaume, SE.: CR. Acad. Sci. 125 (1897). 02Nl OSH 1 0611 lOP1 12F 1 12Ll 17Bl 17c 1 18M 1 20G 1 25P 1 25P2 27K I 28C1 28E 1 29E 1 29M 1 29Wl 31 M 1 3’Sl 35K I 36Fl 36Sl 37El 37M 1 3701 3702 3703 37s1 39Sl 3932 39s3 39Tl 41 E 1 4101 41R1 43F 1 44Bl 44Fl 49G 1 50Tl 51 Bl 51Ll 51Sl 51Tl 51Wl 52B 1 52K 1 52u 1 53B 1 53B2 53Gl 53 w 1 53Y 1 54B 1
Nagaoka. H.. Honda. K.: Philos. Msg. 4 (1902) 45. Honda. K.. Shimizu, S.: Philos. Msg. 10 (1905) 548. Ingersoll. L.R.: Philos. Mag. 11 (1906) 41. Pancbianco. G.: Rend. Accad. Sci. Fis. Mat. Sot. Naz. Sci. Napoli 16 (1910) 21b. Foote. P.D.: Phys. Rev. 34 (1912) 96. Loria. S.: Ann. Physik 38 (1912) 889. Barker. S.G.: Proc. Phys. Sot. (London) 29 (1917) 1. Chcvenard. M.P.: Rev. Met. Paris 14 (1917) 610. Martin. P.: Ann. Physik 55 (1918) 561. Guillaume. SE.: Proc. Phys. Sot. (London) 32 (1920) 374. Pcschard. M.: Rev. Met. Paris 8 (1925) 490. Pcschard. M.: Rev. Met. Paris 8 (1925) 581. Kase. T.: Sci. Rept. Tohoku Univ. 16 (1927) 491. Chevenard. P.: Rev. Met. Paris 10 (1928) 14. Eimen. G.W.: J. Franklin Inst. 206 (1928) 317. Ehnen. G.W.: J. Franklin Inst. 207 (1929) 583. Masumoto. H.: Sci. Rept. Tohoku Univ. 18 (1929) 195. Weiss, P., Forrer, R.: Ann. Phys. Paris 12 (1929) 279. Masiyama. Y.: Sci. Rept. Tohoku Univ. 20 (1931) 574. Sadron. C.: Ann. Phys. Paris 17 (1932) 371. Kornetzi, M.: Z. Phys. 98 (1935) 371. Fallot. M.: Ann. Phys. Paris 6 (1936) 305. Shih. J.W.: Phys. Rev. 50 (1936) 376. Ebert. H., KuBmann, A.: Phys. Z. 38 (1937) 437. McKeehan. L.W.: Phys. Rev. 51 (1937) 136. Owen. E.A.. Yates. E.L. et al.: Proc. Phys. Sot. (London) 49 Own. E.A.. Yates. E.L. et al.: Proc. Phys. Sot. (London) 49 Owen. E.A., Yates. E.L. et al.: Proc. Phys. Sot. (London) 49 (’ Snoek. J.L.: Physica IV 9 (1937) 853. Shirakawa. Y.: Sci. Rept. Tohoku Univ. 27 (1938) 485. Shirakawa. Y.: Sci. Rept. Tohoku Univ. 27 (1938) 532. Sucksmith. W.: Proc. R. Sot. London Ser. A 171 (1939) 525.
1937) 17. 1937) 178. 1937) 307.
Tarasov, L.P.: Phys. Rev. 56 (1939) 1245. Ellis, W.C., Grciner. E.S.: Trans. Am. Sot. Met. 29 (1941 ) Ovvcn. L.A., Sully, A.H.: Philos. Mag. 31 (1941) 314. Rathenau, G.W., Snack. J.L.: Physica VIII 6 (1941) 555. Fallot. M.: Metaux Corrosion-Ind. 18 (1943) 214. Barnett. S.J.: Phys. Rev. 66 (1944) 224. Fallot, M.: J. Phys. Radium VIII 5 (1944) 153. Goldman. J.E.: Phys. Rev. 76 (1949) 471. Taylor, A.: J. Inst. Metals 77 (1950) 585.
415.
Bozorth. R.M.: Ferromagnetism, Toronto, New York, London: D. van Nostrand Comp. Inc. 1951. Lement. B.S., Averbach. B.L., Cohen, M.: Trans. ASME 43 (1951) 1072. Smit. J.: Physica 16 (1951) 612. Tsuji. T.: J. Phys. Sot. Jpn. 13 (1958) 1310. Went. J.J.: Physica 17 (1951) 98. Barnett. S.J., Kenny, G.S.: Phys. Rev. 87 (1952) 723. Kondorskii, E.J., Fedotov, J.N.: Izv. Akad. Nauk. SSSR 16 (1952) 432. Urquhart. H.M.A., Goldman, J.E.: Phys. Rev. 87 (1952) 210. Bozorth, R.M., Walker, J.G.: Phys. Rev. 89 (1953) 624. Bozorth. R.M.: Rev. Mod. Phys. 25 (1953) 42. Galpcrin, D., Larin. C., Schischkow, A.: Doklady Akad. Nauk. USSR 89 (1953) 419. Wakelin. R.J.. Yates. E.L.: Proc. Phys. Sot. (London) Sect. B66 (1953) 221. Yamamoto. M., Misyasawa, R.: Sci. Rept. Tohoku Univ. A 5 (1953) 113. Bozorth. R.M.: Phys. Rev. 96 (1954) 311.
Bonnenberg, Hempel, Wijn

References for 1.2.1 275
54Pl 54Tl SC1 55Ml 55Sl 5582 56Cl 56Nl 56Sl 57Cl 57C2 5751 57Nl 58Al 58Fl 58Gl 58Hl 58Yl 59Al 59El 59Hl 59Kl 59Wl 60Al 6OCl 60Kl 60Tl 6OWl 61Jl 61 K 1 61 M 1 6101 61Pl 61Rl 62Cl 62C2 62Gl 62Kl 62K2 62Ll
62Sl 6282 62Tl 63Cl 63C2 63C3 63C4 6351 63Pl 63Rl 63Tl 63T2 63Wl 64Al 64Cl 64C2 64El
Patrick, L.: Phys. Rev. 93 (1954) 384. Taoka, T., Ohtsuka, T.: J. Phys. Sot. Jpn. 9 (1954) 712. Chikazumi, S., Oamura, T.: J. Phys. Sot. Jpn. 10 (1955) 842. Marechal, M.J.: J. Phys. Radium 16 (1955) 122. Shull, C.G., Wilkinson, M.K.: Phys. Rev. 97 (1955) 304. Sutton, A.L., Hume-Rothery, W.: Philos. Mag. 46 (1955) 1295. Chikazumi, S.: J. Phys. Sot. Jpn. 11 (1956) 551. Nakagawa, Y.: J. Phys. Sot. Jpn. ll(l956) 855. Scott, G.G.: Phys. Rev. 103 (1956) 561. Chikazumi, S., Suzuki, K., Iwata, H.: J. Phys. Sot. Jpn. 12 (1957) 1259. Crangle, J.: Philos. Mag. 2 (1957) 659. Jan, J.P.: Solid State Phys. 5 (1957) 73. Nakagawa, Y.: J. Phys. Sot. Jpn. 12 (1957) 700. Ahern, S.A., Martin, M.J.C., Sucksmith, W.: Proc. R. Sot. (London) Ser. A248 Ferguson, E.T.: J. Appl. Phys. 29 (1958) 252. Gugan, D.: Proc. Phys. Sot. (London) 72 (1958) 1013. Hansen, M.: Constitution of binary alloys, New York: McGraw-Hill (1958) 31’ Yamamoto, M., Nakamichi, T.: J. Phys. Sot. Jpn. 13 (1958) 228. Arp, V., Edmonds, D., Petersen, R.: Phys. Rev. Lett. 3 (1955) 212. Elst van, H.C.: Physica 25 (1959) 708. Hall, R.C.: J. Appl. Phys. 30 (1959) 816. Kondorskii, E.I., Sedov, V.L.: Soviet Phys. JETP 35 (8) No. 4 (1959) 586. Walling, J.C., Bunn, P.B.: Proc. Phys. Sot. (London) 74 (1959) 417. Alers, G.A., Neighbours, J.R., Sato, H.: J. Phys. Chem. Solids 13 (1960) 40. Cherchernikow, V.I.: Phys. Met. Metallogr. (USSR) 10 (1960) 37. Kondorskii, E.J., Sedov, V.L.: Soviet Phys. JETP 11 (1960) 561. Takahashi, M., Kono, T.: J. Phys. Sot. Jpn. 15 (1960) 936. Wertheim, G.K.: Phys. Rev. Lett. 4 (1960) 403.
1958) 145.
486, 677.
Johnson, C.E., Ridout, MS., Cronshaw, T.E., Madson, P.E.: Phys. Rev. Lett. 6 (1961) 450. Kouvel, J.S., Wilson, R.H.: J. Appl. Phys. 32 (1961) 435. Meyer, A.J.P., Asch, G.: J. Appl. Phys. 32 (1961) 330s. Ondris, M., Frait, Z.: Czech. J. Phys. Bll (1961) 88. Puzei, I.M.: Phys. Met. Metallogr. (USSR) 11 (1961) 44. Rayne, J.A., Chandrasekhar, B.S.: Phys. Rev. 122 (1961) 1714. Chechernikov, V.I.: Sov. Phys. JETP 15 (1962) 659. Collins, M.F., Jones, R.V., Lowde, R.D.: J. Phys. Sot. Jpn. 17 (1962) 19. Graham, C.D., Jr.: J. Phys. Sot. Jpn. 17 (1962) 321. Kachi, S., Bando, Y., Higushi, S.: Jpn. J. Appl. Phys. 1 (1962) 307. Kneller, E.: Ferromagnetism, Berlin, Giittingen, Heidelberg: Springer 1962, p. 148. Landolt-Bornstein, 6’h ed.: Magnetische Eigenschaften I (Hellwege, K.-H., Hellwege, A.M., eds.), Berlin, Giittingen, Heidelberg: Springer, vol. II/9 1962. Scott, G.G.: J. Phys. Sot. Jpn. 17 (1962) 372. Shull, C.G., Yamada, Y.: J. Phys. Sot. Jpn. 17 (1962) 1. Tamanawa, N., Nakanawa, Y., Chikazumi, S.: J. Phvs. Sot. Jpn. 17 (1962) 1256. Callen, E.R., Callen, H.B.: Phys. Rev. 129 (1963) 578. - ~ ’ Collins, M.F., Forsyth, J.B.: Philos. Mag. 8 (1963) 401. Collins, M.F., Wheeler, D.A.: Proc. Phys. Sot. (London) 82 (1963) 633. Crangle, J., Hallam, G.C.: Proc. R. Sot. London Ser A272 (1963) 119. Johnson, C.E., Ridout, M.S., Cranshaw, T.E.: Proc. Phys. Sot. (London) 81 (1 Puzey, I.M.: Phys. Met. Metallogr. (USSR) 16 (1963) 19. Robinson, CC.: J. Opt. Sot, Am. 53 (1963) 1089. Tanaka, S.: Jpn. J. Appl. Phys. 2 (1963) 548. Tino, Y., Maedo, T.: J. Phys. Sot. Jpn. 18 (1963) 955. Weiss, R.J.: Proc. Phys. Sot. (London) 82 (1963) 281. Argyle, B., Charap, S.: J. Appl. Phys. 35 (1964) 802. Chikazumi, S.: Phys. Magn., New York: Whiley 1964. Chikazumi, S., Wakiyama, K., Yosida, K.: Proc. Int. Conf. Magn. 1964, p. 756. Einspruch, N.G., Claiborne, L.T.: J. Appl. Phys. 35 (1964) 175.
963) 1079.
Landolt-Bbmstein New Series 111/19a
Bonnenberg, Hempel, Wijn

276 Refercnccs for 1.2.1
64G 1 64H 1
64K 1 64N 1 64s 1 64 S 2 65Cl 65C2 65C3 65D 1 65H 1 65Sl 65S2 65F 1 65 W 1 65 W 2 66M1 660 1 66Sl 66S2 66Tl 67Al 67Bl 67B:! 67G1 67G2 67P 1
67P2
67R 1 67s 1 67S2 672 1 68A 1 68B 1 6SB2 6SC1 6SDl 6SHl 655 1 68K 1 6SM 1
6SNl 6SR 1 65 R 2 6SS 1 68 W 1 69A 1 69A2 69A3 69Bl 69G 1
69K 1 69 M 1
Gomnn’kow, V.I., Loshmanov, A.A.: Bull. Acad. Sci. USSR, Phys. Series 28 (1964) 357. Hntherly, M.. Hirakawa. K.. Lowde, R.D., Mall&t. J.F., Stringfellow, M.W., Torrie, B.H.: Proc. Phys.
Sot. 84 (1964) 55. Kondorskii. E.I., Cheremushkina. A.V., Kurbaniyazov, N.: Sov. Phys. Solid State 6 (1964) 422. Nakamura. Y., Shiga. M., Shikazono, N.: J. Phys. Sot. Jpn. 19 (1964) 1177. Sakurai. J., Fujii. M., Nakamura, Y., Takaki, H.: J. Phys. Sot. Jpn. 19 (1964) 308. Swindell. W.: Ph.D. Thesis. Univ. of Sheffield 1964. Cable, J.W., Wollan. E.O., Koehler, WC.: Phys. Rev. 138 (1965) A755. Collins. M.F.: Proc. Phys. Sot. 86 (1965) 973. Clark. A.E.. DeSavagc, B.F., Bozorth, R.: Phys. Rev. 138 (1965) A 216. Dixon. M.. Hoare. F.E.. Holden, T.M., Moody, D.E.: Proc. R. Sot. London Ser. A 285 (1965) 561. Huguenin. R.. Rivier, D.: Helv. Phys. Acta 38 (1965) 900. Soffer. St.. Dreesen. J.A.. Pugh. E.M.: Phys. Rev. 140 (1965) A 668. Stoelinga. J.H.M.. Gersdorf, R., De Vries, G.: Physica 31 (1965) 349. Fujimori. H., Saito. H.: J. Phys. Sot. Jpn. 20 (1965) 293. Webcr. R., Tannenwald, P.E.: Phys. Rev. 140 (1965) A49S. White. G.K.: Proc. Phys. Sot. (London) 86 (1965) 159. Mook. H.A.: Phys. Rev. 2. Ser. 148 (1966) 495. Ohashi. N., Chikazumi. S.: J. Phys. Sot. Jpn. 21 (1966) 2086. Scott. G.G.: Phys. Rev. 148 (1966) 525. Stoelinga. J.H.. Gersdorf, R.: Phys. Lett. 19 (1966) 640. Tanaka. S.. Yoshino. T., Takahashi, T.: Jpn. J. Appl. Phys. 5 (1966) 994. Adler. E.. Radeloff. Ch.: Z. Metallkd. 58 (1967) 905. Bardos. D.I., Aldred. A.T., Beck, P.A.: J. Appl. Phys. 38 (1967) 1260. B&on. H.S.: J. Appl. Phys. 38 (1967) 1327. Georgieva. I.Y.E.. Maksimova. O.P.: Phys. Met. Metallogr. (USSR) 24 (1967) 200. Graham, R.H., Anderson, D.H., Holland, J.R.: J. Appl. Phys. 38 (1967) 223. Pickart. S.J.. Alpcrin. H.A., Minkiewics, V.J., Nathans, R., Shirane, G., Steinsvoll, 0.: Phys. Rev. 156
(1967) 623. Pearson, W.E.: A Handbook of Lattice Spacings and Structures of Metals and Alloys, New York
Pergamon Press 1967, Vol. 1, 2. Rusov, G.I.: Sov. Phys. Solid State 9 (1967) 146. Shiga. M.: J. Phys. Sot. Jpn. 22 (1967) 539. Suzuki. T., Witts. C.H.: J. Appl. Phys. 38 (1967) 1356. Zakharov, A.I., Fedotov, L.N.: Phys. Met. Metallogr. (USSR) 23 (1967) 201. Asano. H.: J. Phys. Sot. Jpn. 25 (1968) 286. Boiling. G.F., Arrott. A., Richman, R.H.: Phys. Status Solidi 26 (1968) 743. Bower, D.I.. Claridge. E., Tsong. I.S.T.: Phys. Status Solidi 29 (1968) 617. Chikazumi, S., Mizoguchi, T., Yamaguchi, N., Beckwith, P.: J. Appl. Phys. 39 (1968) 939. Dixon, M., Hoare, F.E., Holden, T.M.: Proc. R. Sot. London Ser. A 303 (1968) 339. Ho, J.C., Viswanathan, R.: Phys. Rev. 172 (1968) 705. Jackson, J.H., Lee. E.W.: Brit. J. Appl. Phys. Ser. 2, 1 (1968) 1397. Khomenko. O.H.: Fiz. Met. Metalloved. 26 (1968) 269. Menzinger. F., Caglioti, G., Shiranc, G., Nathans, R., Pickart, S.J., Alperin, H.A.: J. Appl. Phys. 39
(1968) 455. Nakamura. Y., Takeda. Y., Shiga. M.: J. Phys. Sot. Jpn. 25 (1968) 287. Radeloff. C.. Adler. E.: Z. Angew. Phys. 25 (1968) 46. Rubinstcin. M.: Phys. Rev. 172 (1968) 277. Salnma. K.. Alers. G.A.: J. Appl. Phys. 39 (1968) 4857. Wayne, R.C.. Bartel. L.C.: Phys. Lett. 28A (1968) 196. Adler. E., Radeloff, C.: Z. Angew. Phys. 26 (1969) 105. Adler. E.. Radeloff, C.: J. Appl. Phys. 40 (1969) 1526. Asano. H.: J. Phys. Sot. Jpn. 27 (1969) 542. Bardos. D.I.: J. Appl. Phys. 40 (1969) 1371. Goman’kov, V.I.. Puzey, I.M., Loshmanov, A.A., Mal’tsev, Ye.1.: Phys. Met. Metallogr. (USSR) 28
(1969) 77. Kachi. S.. Asano. H.: J. Phys. Sot. Jpn. 27 (1969) 536. h{atsumoto, M.. Kancko. T., Fujimori, H.: J. Phys. Sot. Jpn. 26 (1969) 1083.
Bonnenberg, Hempel, Wijn

References for 1.2.1 277
69Nl 69Rl 69Sl 69S2 69S3 6934 69Yl 70Al 70Bl 7OCl 7OC2 70Dl 70Fl 70Gl 70Hl 70Kl 70K2 70Ml 70Tl 70T2 7OWl 7OYl 71Al 7lA2 71Bl 71El 71Hl 71H2 71Kl
71Pl 71Sl 71S2 71s3 71s4 71Tl 71T2 71T3 71Wl 71Yl 72Bl 72Cl 72Dl 72Hl 72H2 72H3 72H4 72Ll 72Ml
72M2 72M3 72Nl 72Rl 72R2 72Sl 72Tl 72T2
Nakamura, Y., Shiga, M., Santa, S.: J. Phys. Sot. Jpn. 26 (1969) 210. Reck, R.A., Fry, D.L.: Phys. Rev. 184 (1969) 492. Scott, G.G., Sturner, H.W.: Phys. Rev. 184 (1969) 490. Shimizu, M., Hirooka, S.: Phys. Lett. 30 A (1969) 133. Skirakawa, Y., Tanji, Y., Morija, H., Oguma, J.: Sci. Rept. Res. Inst. Tohoku Univ. A21 (1969) 187. Stoelinga, J.H.M., Gersdorf, R., Vries de, G.: Phyisca 41 (1969) 457. Yoshini, T., Tanaka, S.-I.: Opt. Commun. 1 (1969) 149. Antonini, B., Lucari, F., Menzinger, F.: Solid State Commun. 8 (1970) 1. Budnick, J.I., Burch, T.J., Skalski, S., Raj, K.: Phys. Rev. Lett. 24 (1970) 511. Campbell, LA.: Phys. Rev. Lett. 24 (1970) 269. Cochrane, R.W., Graham, G.M.: Canadian J. Phys. 48 (1970) 264. Dobrzynski, L., Maniawski, F., Modrzejewski, A., Sikorska, D.: Phys. Status Solidi 38 (1970) 103. Farrell, T., Greig, D.: Proc. Phys. Sot. J. Phys. C Ser. 2, 3 (1970) 138. Gomankov, V.I., Puzey, I.M., Mal’tsev, Ye.1.: Phys. Met. Metallogr. (USSR) 30 (1970) 237. Headley, L.C., Pavlovic, A.S.: J. Appl. Phys. 41 (1970) 1026. Kalinin, V.M., Dunaev, F.N., Kornyakov, V.A.: Sov. Phys. J. 13 (1970) 655. Kollie, T.G., Scarbrough, J.O., McElroy, D.L.: Phys. Rev. 2 (1970) 2831. Mayo de, B., Forester, D.W., Spooner, S.: J. Appl. Phys. 41 (1970) 1319. Tanji, Y., Shirakawa, Y.: J. Jpn. Inst. Met. 34 (1970) 228. Tanji, Y., Shirakawa, Y., Moriya, H.: J. Jpn. Inst. Met. 34 (1970) 417. Werner, S.A., Wiener, E., Giirmen, E., Arrot, A.: J. Appl. Phys. 41 (1970) 1363. Yelon, W.B., Berger, L.: Phys. Rev. Lett. 25 (1970) 1207. Antonini, B., Menzinger, F., Paoletti, A., Sacchetti, F.: Int. J. Magn. 1 (1971) 183. Antonini, B., Menzinger, F.: Solid State Commun. 9 (1971) 417. Besnus, M.J., Herr, A., Meyer, A.J.P.: J. Phys. (Paris) 32 (1971) C l-868. Echigoya, J., Hayashi, S., Nakamichi, T., Yamamoto, M.: J. Phys. Sot. Jpn. 30 (1971) 289. Hiriyoshi, H., Fujimori, H., Saito, H.: J. Phys. Sot. Jpn. 31 (1971) 1278. Hasegawa, H., Kanamori, J.: J. Phys. Sot. Jpn. 31 (1971) 382. Kalinin, V.M., Kornyakov, V.A., Dunyaev, F.N., Turchikov, Ye.Ye.: Fiz. Met. Metalloved. 31 (1971)
299., Phys. Met. (1971) 73. Peretto, P., Rechenberg, H., Billard, L., Chamberod, A.: Phys. Status Solidi (b) 44 (1971) K 77. Schlosser, W.F., Graham, G.M., Meincke, P.P.M.: J. Phys. Chem. Solids 32 (1971) 927. Schwerer, F.C., Conroy, J.W.: J. Phys. F 1 (1971) 877. Shimizu, M.: J. Phys. (Paris) 32 (1971) C l-l 116. Stauss, G.H.: Phys. Rev. B 4 (1971) 3106. Tanji, Y.: J. Phys. Sot. Jpn. 3d (1971) 133. Tanji, Y.: J. Phys. Sot. Jpn. 31 (1971) 1366. Tomiyoshi, S., Yamamoto, H., Watanabe, H.: J. Phys. Sot. Jpn. 30 (1971) 1605. Wakoh, S.: J. Phys. Sot. Jpn. 30 (1971) 1068. Yamada, O., Pauthenet, R., Picoche, J.C.: J. Phys. (Paris) 32 (1971) C 1-119. Bauer, C.A., Wigen, P.E.: Phys. Rev. B5 (1972) 4516. Chamberod, A., Billard, L., Rechenberg, H.: Solid State Commun. 10 (1972) 483. Dubovka, G.T., Ponyatovskiy, Ye.G.: Fiz. Metal. Metalloved. 33 (1972) 640. Hasegawa, H., Kanamori, J.: J. Phys. Sot. Jpn. 33 (1972) 1599. Hausch, G., Warlimont, H.: Z. Metallkd. 63 (1972) 547. Hinoul, M., Witters, J.: Solid State Commun. 10 (1972) 749. Huffmann, G.P., Dunmyre, G.R.: AIP Conf. Proc. No. 10 Mag. Magn. Mater. (1972) 1361. Leger, J.M., Loriers-Susse, C., Vodar, B.: Phys. Rev. B 6 (1972) 4250. Men’shikov, A.Z., Arkhipov, V.Ye., Zakharov, AI., Sidorov, S.K.: Phys. Met. Metallogr. (USSR) 34
(1972) 78. Men’shikov, A.Z., Sidorov, SK., Arkhipov, V.E.: Sov. Phys. JETP 34 (1972) 163. Menzinger, F., Paoletti, A.: 11 nuovo Cimento 10 B (1972) 565. Nowicki, L., Aubert, G., Frazao, L.: Phys. Status Solidi (b) 53 (1972) 497. Rebouillat, J.P.: Thesis, Univ. de Grenoble 1972. Rode, V.E., Krynetskaya, I.B.: Sov. Phys. Solid State 14 (1972) 533. Shiga, M.: IEEE Trans. Magn. (1972) 666. Tanji, Y., Moriya, H.: Phys. Status Solidi (a) 13 (1972) K 13. Tanji, Y., Asano, H., Moriya, H.: J. Jpn. Inst. Met. 36 (1972) 1100.
Land&-Bdmstein New Series 111/19a
Bonnenberg, Hempel, Wijn
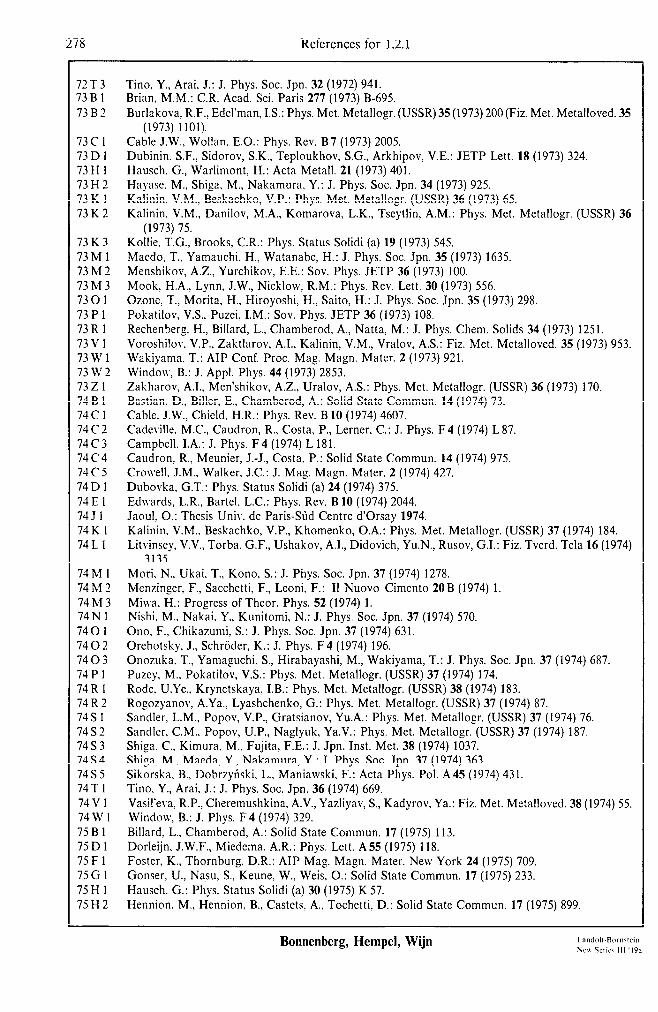
278 References for 1.2.1
12T3 73B I 73B2
73c1 73D 1 73Hl 73H2 73K 1 73K2
73K3 73M 1 73 M 2 13 h4 3 730 1 73 P 1 13R 1 73v 1 73 w 1 73 w 2 732 1 74Bl 74c 1 74C2 74c3 74c4 74c5 74D1 74El 745 1 74K 1 74Ll
14 hl 1 74M2 74M3 74Nl 7401 7402 7403 74P1 74R 1 14R2 74s1 7432 7483 1434 74S5 74Tl 74Vl 74 w 1 15B 1 75Dl 75F 1 75Gl 75H 1 75H2
Tino, Y., Arai, J.: J. Phys. Sot. Jpn. 32 (1972) 941. Brian, M.M.: C.R. Acad. Sci. Paris 277 (1973) B-695. Burlakova. R.F., Edel’man, I.S.: Phys. Met. Metallogr. (USSR) 35 (1973) 200 (Fiz. Met. Metalloved. 35
(1973) 1101). Cable J.W., Wollan. E.O.: Phys. Rev. B7 (1973) 2005. Dubinin. SF., Sidorov, S.K., Teploukhov, S.G., Arkhipov, V.E.: JETP Lett. 18 (1973) 324. Hausch. G., Warlimont. H.: Acta Metal!. 21 (1973) 401. Hayase. M., Shiga. M., Nakamura. Y.: J. Phys. Sot. Jpn. 34 (1973) 925. Kalinin. V.M., Beskachko, V.P.: Phys. Met. Metallogr. (USSR) 36 (1973) 65. Kalinin. V.M., Danilov, M.A., Komarova, L.K., Tscytlin, A.M.: Phys. Met. Metallogr. (USSR) 36
(1973) 15. Kollie. T.G., Brooks, C.R.: Phys. Status Solidi (a) 19 (1973) 545. Maedo, T., Yamauchi. H., Watanabe. H.: J. Phys. Sot. Jpn. 35 (1973) 1635. Menshikov, A.Z., Yurchikov, E.E.: Sov. Phys. JETP 36 (1973) 100. Mook. H.A., Lynn, J.W., Nicklow, R.M.: Phys. Rev. Lett. 30 (1973) 556. Ozone, T., Morita. H., Hiroyoshi, H., Saito, H.: J. Phys. Sot. Jpn. 35 (1973) 298. Pokatilov, V.S., Puzei, I.M.: Sov. Phys. JETP 36 (1973) 108. Rechenberg, H., Billard, L., Chamberod, A., Natta, M.: J. Phys. Chem. Solids 34 (1973) 1251. Voroshilov, V.P., Zaktlarov, A.I., Kalinin, V.M., Vralov, A.S.: Fiz. Met. Metalloved. 35 (1973) 953. Wakiyama. T.: AIP Conf. Proc. Mag. Magn. Mater. 2 (1973) 921. Window, B.: J. Appl. Phys. 44 (1973) 2853. Zakharov, AI., Men’shikov, A.Z., Uralov, AS.: Phys. Met. Metallogr. (USSR) 36 (1973) 170. Bastian. D., Biller, E., Chamberod, A.: Solid State Commun. 14 (1974) 73. Cable. J.W., Chield. H.R.: Phys. Rev. B 10 (1974) 4607. Cadeville. M.C., Caudron, R., Costa, P., Lerner, C.: J. Phys. F 4 (1974) L 87. Campbell. LA.: J. Phys. F4 (1974) L 181. Caudron, R., Meunier. J.-J., Costa, P.: Solid State Commun. 14 (1974) 975. Crowe!!. J.M.. Walker, J.C.: J. Mag. Magn. Mater. 2 (1974) 427. Dubovka. G.T.: Phys. Status Solidi (a) 24 (1974) 375. Edwards, L.R., Bartel. L.C.: Phys. Rev. B 10 (1974) 2044. Jaou!. 0.: Thesis Univ. de Paris-Slid Centre d’Orsay 1974. Kalinin. V.M.. Beskachko, V.P., Khomenko, O.A.: Phys. Met. Metallogr. (USSR) 37 (1974) 184. Litvinsey, V.V., Torba. G.F., Ushakov, A.I., Didovich, Yu.N., Rusov, G.I.: Fiz. Tverd. Tela 16 (1974)
3135. Mori. N., Ukai. T., Kono, S.: J. Phys. Sot. Jpn. 37 (1974) 1278. Menzinger. F., Sacchetti, F., Leoni, F.: II Nuovo Cimento 20B (1974) 1. Miwa. H.: Progress of Theor. Phys. 52 (1974) 1. Nishi. M.. Nakai. Y., Kunitomi, N.: J. Phys. Sot. Jpn. 37 (1974) 570. Ono, F., Chikazumi, S.: J. Phys. Sot. Jpn. 37 (1974) 631. Orehotsky, J., Schrader, K.: J. Phys. F4 (1974) 196. Onozuka. T., Yamaguchi. S., Hirabayashi, M., Wakiyama, T.: J. Phys. Sot. Jpn. 37 (1974) 687. Puzey. M., Pokatilov, VS.: Phys. Met. Metallogr. (USSR) 37 (1974) 174. Rode. U.Ye.. Krynetskaya, I.B.: Phys. Met. Metallogr. (USSR) 38 (1974) 183. Rogozyanov, A.Ya.. Lyashchenko, G.: Phys. Met. Metallogr. (USSR) 37 (1974) 87. Sandier, L.M., Popov, V.P., Gratsianov, Yu.A.: Phys. Met. Metallogr. (USSR) 37 (1974) 76. Sandier. CM.. Popov, U.P., Naglyuk, Ya.V.: Phys. Met. Metallogr. (USSR) 37 (1974) 187. Shiga. C., Kimura, M., Fujita, F.E.: J. Jpn. Inst. Met. 38 (1974) 1037. Shiga. M.. Maeda. Y., Nakamura, Y.: J. Phys. Sot. Jpn. 37 (1974) 363. Sikorska. B., Dobrzyhski. L., Maniawski, F.: Acta Phys. PO!. A45 (1974) 431. Tino, Y., Arai, J.: J. Phys. Sot. Jpn. 36 (1974) 669. Vasil’eva, R.P., Cheremushkina, A.V., Yazliyav, S., Kadyrov, Ya.: Fiz. Met. Metalloved. 38 (1974) 55. Window, B.: J. Phys. F4 (1974) 329. Billard. L.. Chamberod, A.: Solid State Commun. 17 (1975) 113. Dorleijn. J.W.F., Miedema, A.R.: Phys. Lett. A55 (1975) 118. Foster, K., Thornburg. D.R.: AIP Mag. Magn. Mater. New York 24 (1975) 709. Gonser. U., Nasu, S., Keune, W., Weis, 0.: Solid State Commun. 17 (1975) 233. Hausch. G.: Phys. Status Solidi (a) 30 (1975) K 57. Hennion. M., Hennion, B., Castets, A., Tochctti, D.: Solid State Commun. 17 (1975) 899.
Bonnenberg, Hempel, Wijn

References for 1.2.1 279
75Kl 75Ml 75M2 75M3 75M4 75Rl 75Wl 75W2
76Bl 76B2 76El 76Hl 76H2 76Jl 76Kl 76Ml 76M2 76M3 76M4 76Pl 76Sl 76Tl 77Bl
77Cl 77Dl 77D2 77El 77Hl 77H2 7751 77Kl 77K2 77Ml 77M2 77M3 77M4 77Sl 77Tl 77T2 77Yl 78Al
78Bl 78B2 78Cl 78Hl 78Kl 78K2 78Sl
78Tl 78T2
78T3 78Vl 78Wl
Kalinin, V.M.: Phys. Met. Metallogr. (USSR) 39 (1975) 201. Makarov, V.A., Puzei, I.M., Sakharova, T.V., Gutovskii, LG.: Sov. Phys. JETP 40 (1975) 382. Menshikov, A.Z., Kazantsev, V.A., Kuzmin, N.N., Sidorov, S.K.: J. Mag. Magn. Mater. 1 (1975) 91. Mokhov, B.N., Goman’kov, V.I.: JETP Lett. 21 (1975) 276. Makarov, V.A., Puzey, I.M., Sakarova, T.V.: Phys. Status Solidi (a) 30 (1975) K21. Riedinger, R., Nauciel-Bloch, M.: J. Phys. F5 (1975) 732. Wu, C.Y., Quach, H.T., Yelon, A.: AIP Conf. Proc. Mag. Magn. Mater. 29 (1975) 681. Wakiyama, T., Chin, G.Y., Robbins, M., Sherwood, R.C., Bernardini, J.E.: AIP Conf. Proc. 29 (1975)
11977)
560. Bastian, D., Biller, E.: Phys. Status Solidi (a) 35 (1976) 113. Bastian, D., Biller, E.: Phys. Status Solidi (a) 35 (1976) 465. Edwards, D.M., Hill, D.J.: J. Phys. F6 (1976) 607. Hausch, G.: J. Phys. F6 (1976) 1015. Hennion, M., Hennion, B., Nauciel-Bloch, M., Riedinger, R.: J. Phys. F6 (1976) L 303. Jo, T., Miwa, H.: J. Phys. Sot. Jpn. 40 (1976) Kohgi, M., Ishikawa, Y., Wakabayashi, N.: Solid State Commun. 18 (1976) 509. Maeda, I., Yamauchi, H., Watanabe, H.: J. Phys. Sot. Jpn. 40 (1976) 1559. Mikke, K., Jankowska, J., Modrzejewski, A.: J. Phys. F 6 (1976) 631. Muyahara, T., Takahashi, M.: Jpn. J. Appl. Phys. 15 (1976) 291. Muraoka, Y., Shiga, M., Yasuoka, H., Nakamura, Y.: J. Phys. Sot. Jpn. 40 (1976) 414. Ponyatovskii, E.G., Antonov, V.E., Belash, I.T.: Sov. Phys. Solid State 18 (1976) 2131. Soumura, T.: J. Phys. Sot. Jpn. 40 (1976) 435. Takahashi, S., Ishikawa, Y.: Phys. Status Solidi (a) 33 (1976) K 141. Bessmertnyi, A.M., Mushailov, E.S., Pyn’ko, V.G., Suvorov, A.V.: Sov. Phys. Solid State 19 (
1473. Cullis, I.G., Heath, M.: Solid State Commun. 23 (1977) 891. Drijver, J.W., Woude van der, F., Radelaar, S.: Phys. Rev. B 16 (1977) 985. Drijver, J.W., Woude van der, F., Radelaar, S.: Phys. Rev. B 16 (1977) 995. Endoh, Y., Noda, Y., Ishikawa, Y.: Solid State Commun. 23 (1977) 951. Hatta, S., Hayakawa, M., Chikazumi, S.: J. Phys. Sot. Jpn. 43 (1977) 451. Hesse, J., Mtiller, J.B.: Solid State Commun. 22 (1977) 637. Jo, T.: Physica 86-88B (1977) 747. Kagawa, H., Chikazumi, S.: J. Phys. Sot. Jpn. 43 (1977) 1097. Kanamori, J., Akai, H., Hamada, N., Miwa, H.: Physica 91 B (1977) 153. Makarov, V.A., Puzey, I.M., Sakharova, T.V.: Phys. Met. Metallogr. (USSR) 44 (1977) 64. Menshikov, A.Z., Shestakov, V.A.: Phys. Met. Metallogr. (USSR) 43 (1977) 38. Mikke, K., Jankowska, J., Modrzejewski, A., Frikkee, E.: Physica 86-88 B (1977) 345. Mizia, J., Kajzar, F.: Phys. Status Solidi (b) 80 (1977) K 75. Singer, V.V., Radovskiy, I.Z.: Russ. Metall. 1 (1977) 65. Takahashi, S.: Phys. Status Solidi (a) 42 (1977) 201. Takahashi, S.: Phys. Status Solidi (a) 42 (1977) 529. Yamada, O., Ono, F., Nakai, I.: Physica 91 B (1977) 298. Antonov, V.E., Belash, LT., Degtyareva, V.F., Ponomarev, B.K., Ponyatovkii, E.G., Tissen, V.G.: Sov.
Phys. Solid State 20 (1978) 1548. Bansal, C.: Phys. Status Solidi (a) 48 (1978) K 119. Billard, L., Villemain, P., Chamberod, A.: J. Phys. C: Solid State Phys. 11 (1978) 2815. Campbell, C.C.M., Schaf, J., Zawislak, F.C.: J. Mag. Magn. Mater. 8 (1978) 112. Hamada, N., Miwa, H.: Progress of Theor. Phys. 59 (1978) 1045. Kim, C.-D., Matsui, M., Chikazumi, S.: J. Phys. Sot. Jpn. 44 (1978) 1152. Kitaoka, Y., Ueno, K., Asayama, K.: J. Phys. Sot. Jpn. 44 (1978) 142. Shirakawa, Y., Tanji, Y.: Phys. and Appl. of Invar Alloys. Honda Mem. Series Mat. Science 3 (1978)
137. Takahashi, M., Kono, T.: Jpn. J. of Appl. Phys. 17 (1978) 361. Takahashi, M., Kadowaki, S., Wakiyama, T., Anayama, T., Takahashi, M.: J. Phys. Sot. Jpn. 44 (1978)
825. Takahashi, S.: Phys. Status Solidi (a) 45 (1978) 133. Vasil’eva, R.P., Puzei, I.M., Akgaev, A.: Sov. Phys. J. 21 (1978) 383. Wakiyama, T., Brooks, H.A., Gyorgy, E.M., Bachmann, K.J., Brasen, D.: J. Appl. Phys. 49(1978) 4158.
Landolt-BOrnstein New Series 111/19a
Bonnenberg, Hempel, Wijn

2ao References for 1.2.1
79B 1 79c I 79C2 79Dl 79E 1 79E2 79Gl 79 G 2 79H 1 79H2 79 H 3 7911 7912 7913 79K 1 79M 1 79 M 2 79N 1
790 1 7902 79 0 3 79Rl 79Sl 79s2 7933 79s4 79Tl
79Y 1 79Y2 79 Y 3 80A 1
80Dl 80D2 80D3
80H 1 8011 8OLl 80Ml 80M2 80Nl 8OSl 80Tl SOT2 80T3 80T4 8OYl 81Hl 81 H2 81Kl 8101 8102 8103 8104 81 W 1
Bansal. C., Chandra. G.: J. Phys. Coil. C 2, 40 (1979) C2-202. Chnmberod. A.. Laugicr. J.. Pcnissan. J.M.: J. Mag. Magn. Mater 10 (I 979) 139. Chikazumi. S.: J. Mag. Magn. Mater. 10 (1979) 113. Deen van, J.K.. Woude van der, F.: Phys. Rev. B20 (1979) 296. Endoh. Y.: J. Mag. Magn. Mater. 10 (1979) 177. Endoh. Y., Noda, Y.: J. Phys. Sot. Jpn. 46 (1979) 806. Goman’kov, V.L., Mokhov, B.N., Nogin, N.I.: Russ. Metall. 4 (1979) 97. Gonser, U., Nasu, S., Kappes, W.: J. Msg. Magn. Mater. 10 (1979) 244. Hamada. N.: J. Phys. Sot. Jpn. 47 (1979) 797. Hamada. N.: J. Phys. Sot. Jpn. 46 (1979) 1759. Hesse. J., Wiechmann. B.? Miiller, J.B.: J. Mag. Magn. Mater. 10 (1979) 252. Inone. J., Yamada. H., Shimizu, M.: J. Phys. Sot. Jpn. 46 (1979) 1496. Ishikawa. Y., Onodera. S., Tajima. K.: J. Mag. Magn. Mater. 10 (1979) 183. Ito. Y., Akimitsu. J.. Matsui, M., Chikazumi, S.: J. Mag. Magn. Mater. 10 (1979) 194. Komura. S., Takeda. T.: J. Mag. Magn. Mater. 10 (1979) 191. Matsui. M.. Adachi. K.: J. Mag. Magn. Mater. 10 (1979) 152. Miwa. H.: J. Mag. Magn. Mater. 10 (1979) 223. Narayanasamy, A.. Nagarajan. T., Muthukumarasamy, P., Radhakrishnan, T.S.: J. Phys. F9 (1979)
2261. Ono, F.: J. Phys. Sot. Jpn. 47 (1979) 84. Ono, F.: J. Phys. Sot. Jpn. 47 (1979) 1480. Oomi, G., Mori, N.: J. Mag. Magn. Mater. 10 (1979) 170. Rode, V.E.: Phys. Status Solidi (a) 56 (1979) 407. Sandler. I.M.. Popov, V.P., Nagljluk, Ya.V.: Phys. Status Solidi (a) 55 (1979) 271. Shiozaki. Y., Nakai. Y., Kunitomi, N.: J. Phys. Sot. Jpn. 46 (1979) 59. Skvortsov, 1.1.: Phys. Met. Metallogr. (USSR) 45 (1979) 178. Sohmura. T., Fujita. F.E.: J. Mag. Magn. Mater. 10 (1979) 255. Takahashi. M.. Kadowaki. S., Wakiyama, T., Anayama, A., Takahashi, M.: J. Phys. Sot. Jpn. 47 (1979)
1110. Yamada. H., Inouc. J., Shimizu, M.: J. Phys. Sot. Jpn. 47 (1979) 103. Yamada. H., Inoue. J., Shimizu, M.: J. Mag. Magn. Mater. 10 (1979) 241. Yamada, O., Nakai. I., Fujiwara, H., Ono, F.: J. Msg. Magn. Mater. 10 (1979) 155. Antonov, V.E., Belash. I.T., Pnomarev, B.K., Ponyatovskii, E.G., Thiessen, V.G.: Phys. Status Solidi
(a) 57 (1980) 75. Decn van. J.K., Woude van der, F.: J. Phys. 41 (1980) C l-367. Dubovka. G.T.: Phys. Status Solidi (a) 59 (1980) K 35. Dubinin. S.F., Teplouchov, S.G., Sidorov, S.K., Izyumov, Yu.A., Syromyatnikov, V.N.: Phys. Status
Solidi (a) 61 (1980) 159. Hennion. B.. Hennion. M.: J. Phys. F 10 (1980) 2289. Ishikawa. Y., Tajima. K., Noda, Y., Wakabayashi, N.: J. Phys. Sot. Jpn. 48 (1980) 1097. Morin-L6pez, J.L., Falicov, L.M.: J. Phys. C: Solid State Phys. 13 (1980) 1715. Morita. H., Hiriyoshi. H., Fujimori, H., Nakagawa, Y.: J. Mag. Magn. Mater. 15-18 (1980) 1197. Masumoto, H., Takahashi, M., Nakayama, T.: Trans. Jpn. Inst. Met. 21 (1980) 515. Nakai, I., Ono, F., Yamada, 0.: J. Phys. Sot. Jpn. 48 (1980) 1105. Shimizu, M.: J. Mag. Magn. Mater. 19 (1980) 219. Takahashi. S.: Phys. Lett. 78A (1980) 485. Takahashi. S.: Phys. Status Solidi (a) 59 (1980) K 135. Takahashi, M., Kadowaki, S.: J. Phys. Sot. Jpn. 48 (1980) 1391. Tino, Y., Nakaya, Y.: J. Phys. Sot. Jpn. 49 (1980) 2198. Yamada, O., Pauthenet, R., Picoche, J.-C.: C.R. Acad. Sci. Paris, t 291 (1980) SCr. B-223. Harada. S., Sohmura, T., Fujita, F.E.: J. Phys. Sot. Jpn. 50 (1981) 2909. Hayashi. K., Mori, N.: Solid State Commun. 38 (1981) 1057. Kakehashi. Y.: J. Phys. Sot. Jpn. 50 (1981) 2236. Ono. F.: J. Phys. Sot. Jpn. 50 (1981) 2231. Onodera, S.. Ishikawa, Y., Tajima, K.: J. Phys. Sot. Jpn. 50 (1981) 1513. Oomi. G.. Mori, N.: J. Phys. Sot. Jpn. 50 (1981) 2917. Oomi, G.. Mori, N.: J. Phys. Sot. Jpn. 50 (1981) 2924. Wagner. D., Wohlfarth. E.P.: J. Phys. F 11 (1981) 2417.
Bonnenberg, Hempel, Wijn
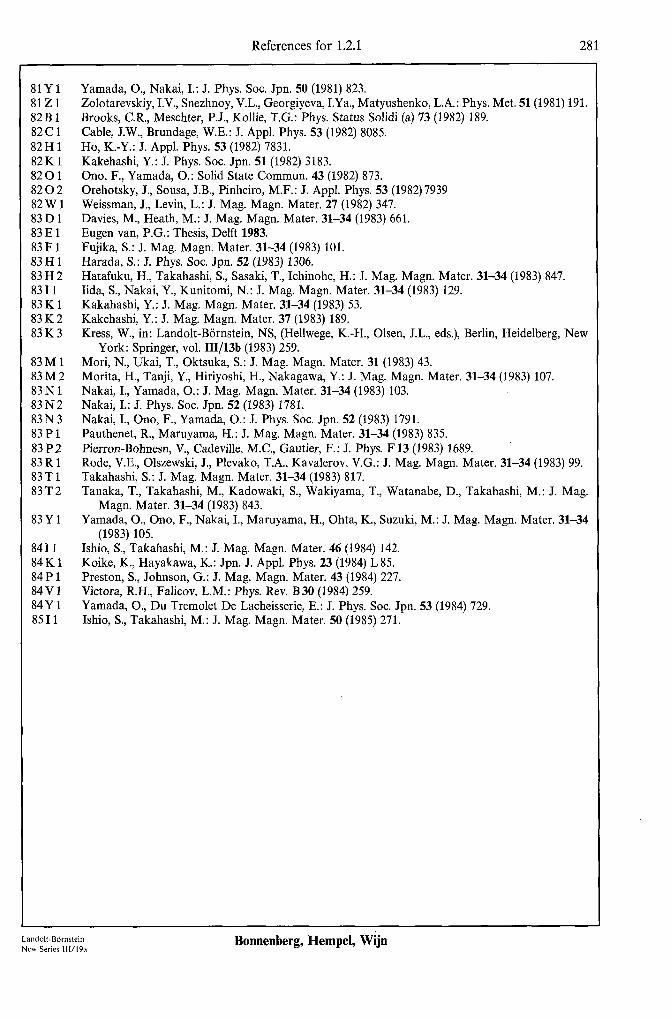
References for 1.2.1 281
81Yl 8121 82Bl 82Cl 82Hl 82Kl 8201 8202 82Wl 83Dl 83El 83Fl 83Hl 83H2 8311 83Kl 83K2 83K3
83Ml 83M2 83Nl 83N2 83N3 83Pl 83P2 83Rl 83Tl 83T2
83Yl
8411 84Kl 84Pl 84Vl 84Yl 8511
Yamada, O., Nakai, I.: J. Phys. Sot. Jpn. 50 (1981) 823. Zolotarevskiy, I.V., Snezhnoy, V.L., Georgiyeva, I.Ya., Matyushenko, L.A.: Phys. Met. 51(1981) 191. Brooks, C.R., Meschter, P.J., Kollie, T.G.: Phys. Status Solidi (a) 73 (1982) 189. Cable, J.W., Brundage, W.E.: J. Appl. Phys. 53 (1982) 8085. Ho, K.-Y.: J. Appl. Phys. 53 (1982) 7831. Kakehashi, Y.: J. Phys. Sot. Jpn. 51 (1982) 3183. Ono, F., Yamada, 0.: Solid State Commun. 43 (1982) 873. Orehotsky, J., Sousa, J.B., Pinheiro, M.F.: J. Appl. Phys. 53 (1982)7939 Weissman, J., Levin, L.: J. Mag. Magn. Mater. 27 (1982) 347. Davies, M., Heath, M.: J. Mag. Magn. Mater. 31-34 (1983) 661. Eugen van, P.G.: Thesis, Delft 1983. Fujika, S.: J. Mag. Magn. Mater. 31-34 (1983) 101. Harada, S.: J. Phys. Sot. Jpn. 52 (1983) 1306. Hatafuku, H., Takahashi, S., Sasaki, T., Ichinohe, H.: J. Mag. Magn. Mater. 31-34 (1983) 847. Iida, S., Nakai, Y., Kunitomi, N.: J. Mag. Magn. Mater. 31-34 (1983) 129. Kakahashi, Y.: J. Mag. Magn. Mater. 31-34 (1983) 53. Kakehashi, Y.: J. Mag. Magn. Mater. 37 (1983) 189. Kress, W., in: Landolt-Bornstein, NS, (Hellwege, K.-H., Olsen, J.L., eds.), Berlin, Heidelberg, New
York: Springer, vol. 111/13b (1983) 259. Mori, N., Ukai, T., Oktsuka, S.: J. Mag. Magn. Mater. 31 (1983) 43. Morita, H., Tanji, Y., Hiriyoshi, H., Nakagawa, Y.: J. Mag. Magn. Mater. 31-34 (1983) 107. Nakai, I., Yamada, 0.: J. Mag. Magn. Mater. 31-34 (1983) 103. Nakai, I.: J. Phys. Sot. Jpn. 52 (1983) 1781. Nakai, I., Ono, F., Yamada, 0.: J. Phys. Sot. Jpn. 52 (1983) 1791. Pauthenet, R., Maruyama, H.: J. Mag. Magn. Mater. 31-34 (1983) 835. Pierron-Bohnesn, V., Cadeville, M.C., Gautier, F.: J. Phys. F 13 (1983) 1689. Rode, V.E., Olszewski, J., Plevako, T.A., Kavalerov, V.G.: J. Mag. Magn. Mater. 31-34 (1983) 99. Takahashi, S.: J. Mag. Magn. Mater. 31-34 (1983) 817. Tanaka, T., Takahashi, M., Kadowaki, S., Wakiyama, T., Watanabe, D., Takahashi, M.: J. Mag.
Magn. Mater. 31-34 (1983) 843. Yamada, O., Ono, F., Nakai, I., Maruyama, H., Ohta, K., Suzuki, M.: J. Mag. Magn. Mater. 31-34
(1983) 105. Ishio, S., Takahashi, M.: J. Mag. Magn. Mater. 46 (1984) 142. Koike, K., Hayakawa, K.: Jpn. J. Appl. Phys. 23 (1984) L 85. Preston, S., Johnson, G.: J. Mag. Magn. Mater. 43 (1984) 227. Victora, R.H., Falicov, L.M.: Phys. Rev. B30 (1984) 259. Yamada, O., Du Tremolet De Lacheisserie, E.: J. Phys. Sot. Jpn. 53 (1984) 729. Ishio, S., Takahashi, M.: J. Mag. Magn. Mater. 50 (1985) 271.
Land&-B6mstein New Series lll/l9a
Bonnenberg, Hempel, Wijn

282 1.2.2 Alloys between Ti, V, Cr, Mn [Ref. p. 480
1.2.2 Alloys between Ti, V, Cr or Mn
1.2.2.0 General remarks
In this subsection magnetic properties of binary alloys between Ti, V, Cr or Mn are represented while in the following one, subsection 1.2.3, binary alloys of Ti, V, Cr or Mn and Fe, Co, or Ni are dealt with. The latter subsection also includes magnetic data on V-Cr-Mn and the pseudo-binary alloys ofTi, V, Cr or Mn and Fe, Co or Ni in which one the 3d transition metals is partially substituted by a third 3d metal.
The data is compiled in figures and tables. References have been made to the main papers that appeared before 1975. For the time from 1975 to 1983, about 80% of the relevant papers cited in the Chemical Abstracts have been selected for quoting important and reliable properties of the alloys under discussion. For each alloy system a chronological listing of relevant references precedes the representation of the data. These lists also include rcfcrcnces to papers not cited subsequently in the figures and tables. The complete list of references is provided at the end of subsection 1.2.3.
The arrangement of the alloys is in the order of increasing atomic numbers of their constituent elements. Each of the following subsections is devoted to a particular binary alloy between Ti, V, Cr or Mn. For details, see Survey 1. Since figures and tables for a given material may contain also data of other alloys for comparison, information on a particular alloy may be found in the other subsections as well. The retrieval of such scattered information is facilitated by Survey 2 which provides all the figures and tables in which, for a given alloy and property. data is represented.
Survey 2. For each binary alloy between Ti, V, Cr or Mn the figures and tables are listed in which data on the properties specified is provided. Reference is given not only to subsect. 1.2.2 (Figs. 1...58 and Tables 1...12) but also to subsect. 1.2.3 (Figs. 59...427 and Tables 13...88). Numbers in roman and italic refer to figures and tables, respectively.
Allo) Phase diagram. lattice constants
Susceptibility, paramagnetic properties
Magnetic transformation temperatures
Magnetization, average magnetic moment
Atomic magnetic moments, g-factor, spin structure
V-Ti 1 2...4
Cr-Ti 11 I I
Cr-V 311,312 3, 13, 14, 101, 102
Mn-Ti Mn-V 25,311 3, 26...29
7 Mn-Cr ‘) 35,41,311 36,..39, 41, 101,
162, 224
‘) Young’s modulus: Fig. 39.
12
15...17 20 19, 21, 47, 49, 264, 266
2, 9, 74 2,3, 74 2, 3, 9, 10, 74
6
166, 227 30,31 6, 7 15, 40, 42, 43, 20, 42.. .45 19, 21, 46...49, 162, 166, 227 264, 266 2, 6, 8, II, 12, 2 2, 9...12, 74 39, 74
Ref. p. 4801 1.2.2 Alloys between Ti, V, Cr, Mn 283
Cr Mn
-
1.2.2.6 dil - diso, a-Mn bee, y-Mn
Survey 1. The subsections devoted to the binary alloys between Ti, V, Cr or Mn are given, as well as information on atomic ordering and crystallographic phases considered.
dil: dilute alloy, diso: disordered alloy, (3: 1): Cu,Au-type superlattice, (1: 1): CuAu-type super-lattice, (l/l): CsCl-type compound, (cr): o-phase, (L): Laves phase.
Ti V
Cr
Mn
Ti
- 1.2.2.1 diso 1.2.2.2 dil diso (L) 1.2.2.4
(4,(L)
V
- 1.2.2.3 dil diso
1.2.2.5 dil diso O/l)
High-field susceptibility
NMR, Mijssbauer effect
5, 8, 9
Spin waves, exchange
Magnetic anisotropy, magneto- striction
Specific heat, thermal expansion
5...7, 10 5
Alloy
V-Ti
Cr-Ti
50
5, 8, 18, 22, 23
4
5, 32...34, 179
5, 51.e.56, 179, 318 II
5, 10, 17, 24 Cr-V
5 Mn-Ti Mn-V
57, 58 Mn-Cr ‘)
5
Landolt-Bbrnstein New Series 111/19a

284 1.2.2.1 V-Ti [Ref. p. 480
3.0 .lG-' Cm! TiT" .,
I 2.4
r:
2s
1.8
1.5
I v a-Ti
0 20 40 60 80 ot% 100 a 11 v- V
Fig. 2a. Room-tempcraturc magnetic molar susceptibility xrn for V-Ti alloys qucnchcd from about 1000 “C into iced brine [75 C 23.
“C kl V-Ti 1 1 (
II- dhcp) ’ I I I sod ’
0 5 10 15 ot% 20
600
200 200 \ \ \ \
‘1 0 J 0 4 8 0 4 8 12 at% 16 12 at% 16
a Ti v- b Ti v-
Fig. 1. (a) Equilibrium phase diagram for V-Ti alloys [QAI]. (b) Noncquilibrium phase diagram for V-Ti quenched from the elevated-tcmpcraturc, bee phase to the temperature indicated on the scale [53 D 1, 75C23. M, and M, indicate the start and the end of the martcnsitic transition. respectively.
1.95 xl 4 cm3 mol
I 1.85
6 1.80
b
/ 1
Ti - lSat%V
1 IO 102 h 10:
4 -
Fig. 2b. Variation of the room-temperature magnetic molar susceptibility I,,, for Ti-15 at% V as a consequence of annealing the alloy for various times t, at 300 “C (open symbols). Solid circles: various samples quenched from about 1000 “C into iced brine [75 C 23.
Adachi
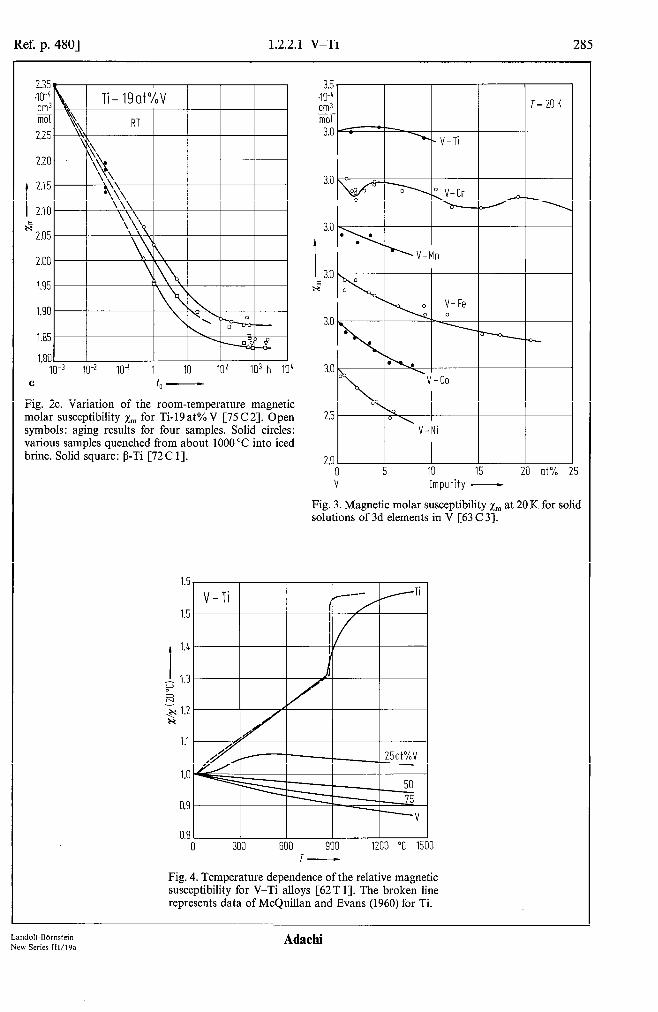
Ref. p. 4801 1.2.2.1 V-Ti 285
10-3 104 1 10 IO2 IO3 h IO4 c 4 -
Fig. 2c. Variation of the room-temperature magnetic molar susceptibility x,, for Ti-19at%V [75C2]. Open symbols: aging results for four samples. Solid circles: various samples quenched from about 1000°C into iced brine. Solid square: P-Ti [72 C 11.
V-Mn
\ 3.0 ’ .
\I v-co
2.5 \4 0 I V-Ni
2.0 0 5 IO 15 20 at% 25 V Impurity -
Fig. 3. Magnetic molar susceptibility x,,, at 20 K for solid solutions of 3d elements in V [63 C 31.
.--I V-Ti 1 1 ,k---PTi
I 1.4
;; 1.3 0 R Ix -&
1.2
1.1
1.0
0.9
Fig. 4. Temperature dependence of the relative magnetic susceptibility for V-Ti alloys [62T 11. The broken line represents data of McQuillan and Evans (1960) for Ti.
Landolf-BCi’msfein New Series 111/19a
Adachi

286 1.2.2.1 V-Ti [Ref. p. 480
‘i ‘r
4
3d alloys - 60 w col
mol K2 50
0
- 40
0. S5Plrl
0
*b 5’v 0 -30 I 0 > x -
Y - 20
- 10 x
0 V Cr Mn 5 6
t-l- 1
Fig. 5. Nuclear spin-lattice relaxation time 7” (expressed as its product with temperature T) for paramagnetic V-Ti. Cr-V and Mn-V alloys and antiferromagnetic Mn-Cr alloys. Also given is the electronic spccitic heat coeflicient 7 [73T I]. “Mn in (open circles) Mn-Cr [73T I] and (solid circles) Mn-V [7l M I]. “V in (crosses) hln-V [71 M I] and (triangles) V-Ti [64 M 3, 64 K 21 and Cr-V [64 B I]. Solid line: y [60 C 3,62 C I]. n: average number of 4s and 3d electrons per atom.
Ti
Fig. 7. Electronic specific heat coefticient y for bee V-Ti alloys [62 C I].
25
I I I I I I 0 10 20 30 40 50 60 K2 70
12 - Fig. 6. Specific heat divided by temperature, C,/T, vs. the square of temperature, T*, for bee V-Ti alloys [62 C I].
I I 16
I I 0 l-l’
-4.0 4.5 5.0 5.5 6.0 n-
Fig. 8. Nuclear spin-lattice relaxation time Tr for ‘IV in V-3d transition metal alloys and the density of states at the Fermi surface IV(&), as dependent on the average number of4s and 3d electrons per atom, n, [64 M 33; the experimental data for Cr-V alloys are from [64 B I].
Adachi

Ref. p. 4801 1.2.2.2 Cr-Ti 287
0.7 % V-Ti
0 20 LO 60 80 at% 100 Ti v- V
Fig. 9. Knight shift K for 51V in bee V-Ti alloys at room temperature [62 V 21.
Cd
K*mol
IO
0
x in Ti Fe~.,Co,-
I 1 I I I V Cr Mn Fe co 5 6 7 8 9
n-
Fig. 10. Electronic specific heat coefficient y of 3d transition metal alloys vs. the average valence electron (4s 3d) concentration per atom, n, [68 B 11. x corresponds to compositionin TiFe, $0,. Dashed line: bee Ti-V, V-Cr, Cr-Fe and Fe-Co alloys, solid line: Fe-Co-Ti and CoNi-Ti alloys [62 S 2, 60 C 2, 62 C 11.
1.2.2.2 Cr-Ti
References: 68 A 2, 71 C 2.
3.35 @ ‘i$ Cr-Ti cm3 9 Y
I 3.25 I 3.25 3.30 3.30 D” D”
x” 3.20 x” 3.20 - cm3 - cm3 9 9
3.15 3.15 3.20 3.20
3.10 3.10 3.15 3.15 t t 0, 0,
3.10H 3.10H
I / 3.05 3.05
3.00 3.00
(((111112.95 (((111112.95 0 50 100 150 200 250 300 K 350
T-
Fig. 11. Magnetic mass susceptibility xs vs. temperature for Cr-Ti alloys [71 C 21.
e 5.8 330.3 K K
I e 5.6 270.4 I
z e e 5.1 221.4
efr* 181.3 0 0.2 0.1, 0.6 0.8 at% 1.0
a Cr Ti - 125 K
t 120
z 115
b Cr Ti -
Fig. 12. Neel temperature TN (a) and spin-flip temperature T,, (b) vs. composition for Cr-Ti alloys. Cr : TN = 3 11 K [71 C2].
Landolt-Bornctein New Series 111/19a
Ada&i
Table 1. Crystal and magnetic properties of Lavcs phase compounds. P: Pauli paramagnetism, F: ferromagnctism, AF: antiferromagnctism, x,,,: susceptibility per mole, Tc and TN: Curie and N&cl temperatures, respectively, pco: magnetic moment per Co atom, H,,,: hypcrfine magnetic field for 57Fe obtained from Miissbaucr effect measurements. NiTi, and CoTi, were reported to have a cubic Laves structure [63 n I, p. 1461 but the magnetic properties are unknown.
Crystal ‘) a ‘) c ‘) xmW) G TN pco F,yp,F,W K) Remarks structure
A 10-4cm3mol-’ K PB kOe
Ni,Sc MgCu, co,sc MgCuz Fe,Sc MgNi, Mn,Sc WW Co,Ti MD, co 2.13Ti0.87 MgNi, Fe,Ti MS&
Cr,Ti
6.926 - P [69C l] 0.76 6.921 - P [69C I] 6.95 4.972 16.278 F [64N I] 5.033 8.278 P [70B2] 6.706 - AF [66A 1, 68N l] 4.729 15.41 F [66A 1, 68N 13 4.779 7.761 AF [64W3] 273
- NMR [66B2] - NMR [66 B 21 202 [64N l] -
43 - 44 0.12 -
97.3 [64Nl] InT,-,Fe,+,,AFforx<O,Fforx>O r68 N 21
resistivityC69 I 1, 71 I 1, 721 11, thermal expansion [66 G 11, specific heat [67 w l]
‘) [63n 1, p. 146).
6.493 - P [68A2] 5.16 4.17
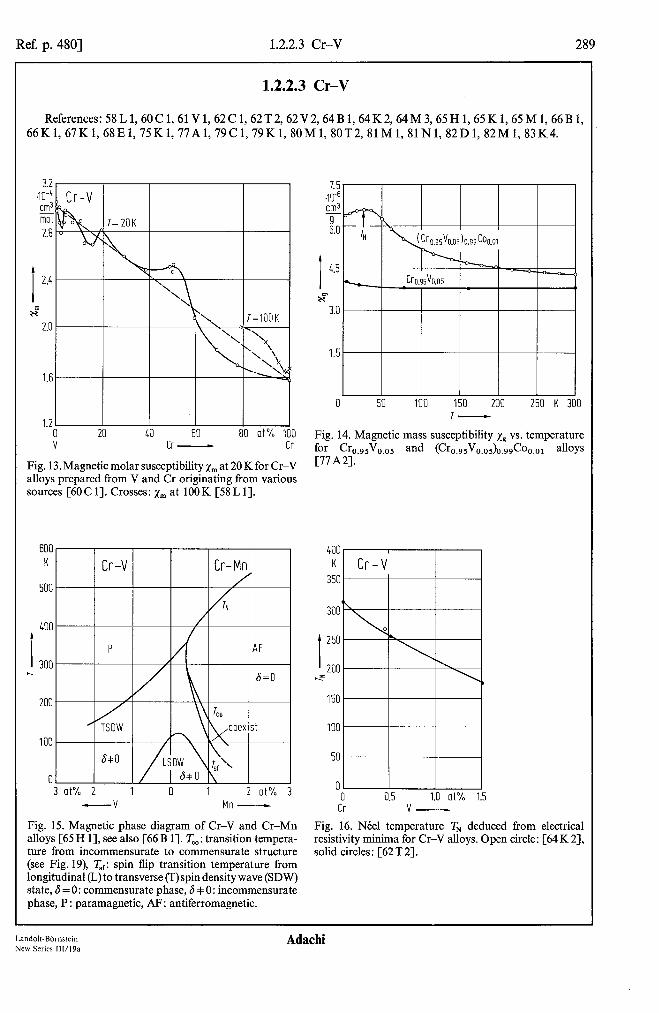
Ref. p. 4801 1.2.2.3 Cr-V 289
1.2.2.3 Cr-V
References: 58 L 1,60 C 1,61 V 1,62 C 1,62 T 2,62 V 2,64 B 1,64 K 2,64 M 3,65 H 1,65 K 1,65 M 1,66 B 1, ~~~~~~~~~~~~~~~~~~~~~~~~~~~~~~~~~~~~~~~~~~~~~~~~~~~~~~~~~~~~~~~~~~~~~~
3.2 w4 cm3 mol 2.8
1.6
1.2 0 20 40 60 80 at% 100 V Cr- Cr
Fig. 13. Magnetic molar susceptibility x,,, at 20 K for Cr-V alloys prepared from V and Cr originating from various sources [60 C 11. Crosses: x,,, at 100 K [58 L 11.
600, I I I I I
I 3001
2001 I A I \\I \ I
100 II ii*0 dew i;),
0 1 s*o \
-v Mn-
3
Fig. 15. Magnetic phase diagram of Cr-V and Cr-Mn alloys [65 H 11, see also [66 B 11. To: transition tempera- ture from incommensurate to commensurate structure (see Fig. 19), T,,: spin flip transition temperature horn longitudinal (L) to transverse (f) spin density wave (SDW) state, 6 = 0: commensurate phase, 6 $0: incommensurate phase, P : paramagnetic, AF: antiferromagnetic.
I I I I I I I
0 50 100 150 200 250 K 300
Fig. 14. Magnetic mass susceptibility xs vs. temperature for Cb.95Vo.05 and (Cro.9~Vo.o~)o.99Coo.o~ alloys [77A2].
I
250
200 h' h'
150 150
100 100
50 50
0 0
fr fr 0.5 0.5 1.0 at% 1.0 at%
v---b v---b
Fig. 16. Neel temperature TN deduced from electrical resistivity minima for Cr-V alloys. Open circle: [64 K 21, solid circles: [62 T 21.
Landolt-BHnstein Adachi New Series lll/l9a
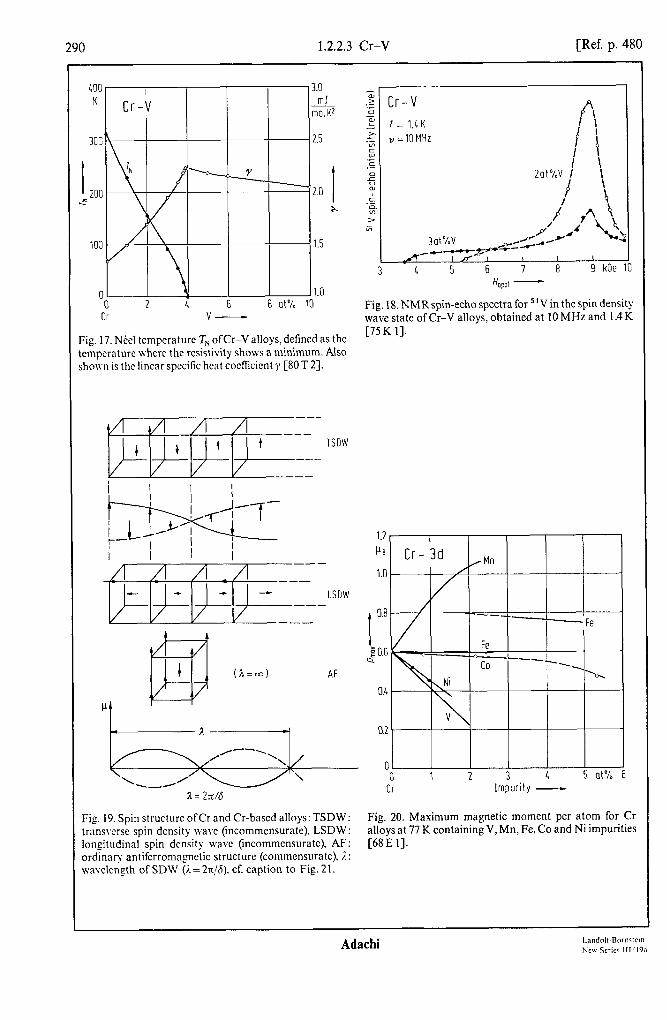
290 1.2.2.3 Cr-V [Ref. p. 480
400 K
33C
I _2Of
1OC
c
3.0 mJ
molK2
2.5
Cr v-
Gg. 17. Neel temperature TN ofCr-V alloys, defined as the cmperature where the rcsistivity shows a minimum. Also ,hown is the linear specific heat coefficient y [80T 21.
(?*=m) AF
Fig. 19. Spin structure ofCr and Cr-based alloys: TSDW: transverse spin density wave (incommensurate). LSDW: longitudinal spin density wave (incommensurate), AF: ordinary antifcrromag.nctic structure (commensurate), I.: wavelerqth of SDW (/.=2x!@, cf. caption to Fig. 21.
Fig. 18. NMRspin-echo spectra for 5’V in the spin density wave state of Cr-V alloys, obtained at 10 MHz and I .4 K [75 K 1-J.
I 0.8
g 0.6 9
0.4
0.2
0 a 1 2 3 4 5 at% 6
Cr Impurity -
Fig. 20. Maximum magnetic moment per atom for Cr alloys at 77 K containing V, Mn, Fe, Co and Ni impurities C68El-J.

Ref. p. 4801 1.2.2.3 Cr-V 291
1.00
0.99
I
0.98
co
L 0.97
0.96
0.95
0.94
Table 2. Neel temperature TN, average magnetic moment per atom, J?, and wavevector Q of the spin density waves in Cr-V and Cr-Mn alloys at 77K [67 K 11.
v Mn TN p QaPn
at % K PB
Cr’) - - 310 0.40(2) 0.95 18 Cr-V 0.45 - 268(5) 0.36(3) 0.9431(25)
1.00 - 220(5) 0.28(3) 0.9300(25) Cr-Mn - 0.70 440(5)
- 1.85 545(5)
‘) [62Wl].
c! 1 2 3 It at% 5
Impurity -
Fig. 21. Variation of 1 - 6 for Cr alloys containing V, Mn, Fe, Co and Ni impurities at TN (dashed curve) and at 0 K (solid curve) [68E 11. The satellite of the magnetic
reflection appears at 5 (1 k 6,0,0), etc. The wavelength of a
the SDW is A=~Tc//~, see Fig. 19.
Table 3. Spin density wave properties of Cr-V alloys in comparison with Cr: spin density wavevector Q, wavelength of antiferromagnetic modulation, 1, and average (rms) magnetic moment per atom, p.
V QaPn ala P Ref. at% PB
78K 197K 78K 197K OK 78K 197 K
Cr 0.9519 0.9554 0.45 0.943 1 0.9480 1 0.93 1.9
‘) [62S3]. ‘) [62 W 11. 3, Room temperature.
20.8 ‘) 22.4(8) 0.40(2) “) 64K2 17.6(8) 19.2(8) 0.36(3) 0.35(3) 0.26(3) 64K2 13.2 0.28(3) <O.l”) 65Hl
<O.l 3) 65Hl
Landolt-Bbmstein Adachi New Series lWl9a
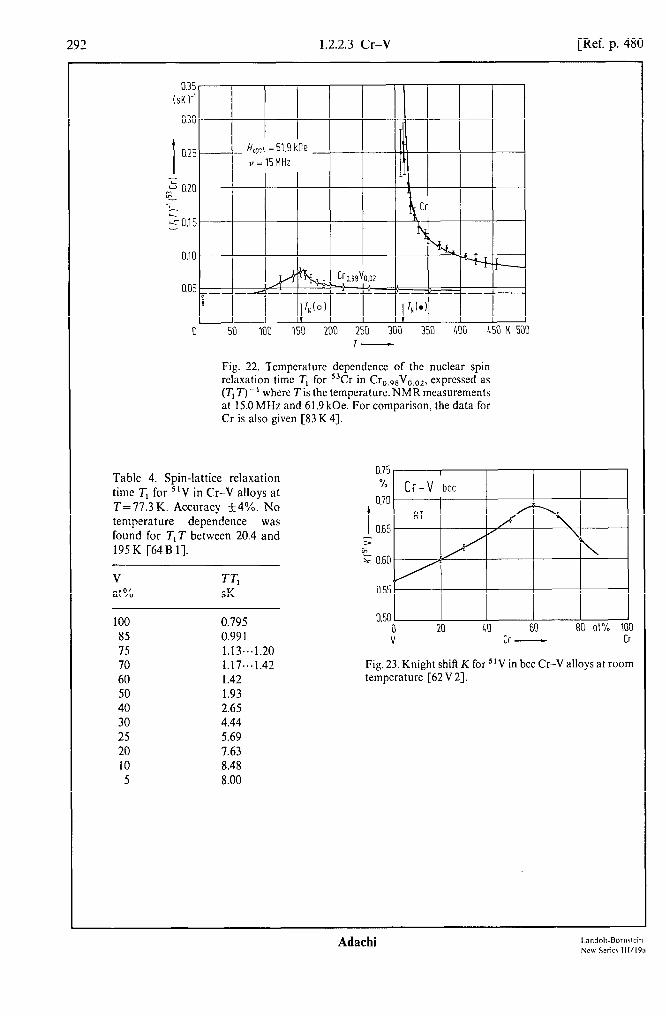
292 1.2.2.3 Cr-V [Ref. p. 480
0.35 (SK i-'
0.30
i
0.25 Hoppt = 61.9 kOe v =lSMHz
i l,(o) l,(o)
0 50 100 150 200 250 300 350 400 450 K 500 l-
Fig. 22. Tempcraturc dependence of the nuclear spin relaxation time T, for 53Cr in Cr,,,,VO,,,, expressed as (Tr 7) - r where T is the temperature. NMR measurements at 15.0MHz and 61.9 kOe. For comparison, the data for Cr is also given [83 K 41.
Table 4. Spin-lattice relaxation time T, for “V in Cr-V alloys at T=77.3K. Accuracy +_4%. No temperature dependence was found for TIT between 20.4 and 195K [64B 11.
V TT at% SK
100 0.795 85 0.991 75 1.13...1.20 70 1.17...1.42 60 1.42 50 1.93 40 2.65 30 4.44 25 5.69 20 7.63 10 8.48 5 8.00
1 0.65 1 I I/ I I \t
T I /f I ‘6 I
0.50 I I I I I I a 20 40 60 80 at% 100 v Cr - Cr
Fig. 23. Knight shift K for 51V in bee Cr-V alloys at room tempcraturc [62 V 23.
Adachi Land&Bbrncwin Neiv Scriec 111/19a
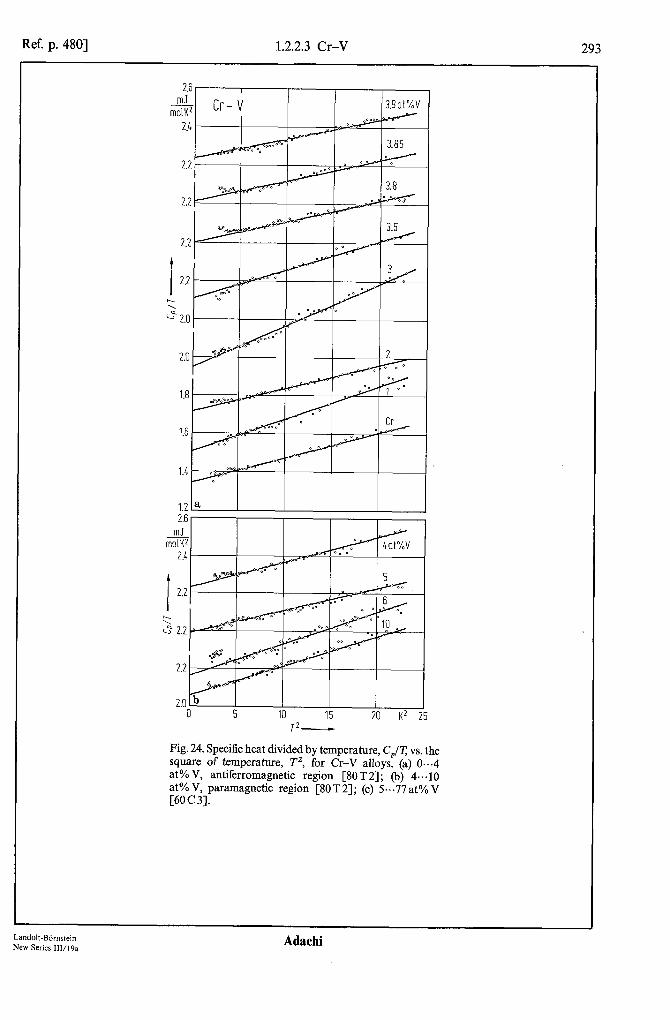
Ref. p. 4801 1.2.2.3 Cr-V
-a molK*
2.4
2.2
2.2
2.2
! 2.2
\ z 2.0
1.8
1.6
T*-
Fig. 24. Specific heat divided by temperature, C,/T, vs. the square of temperature, T’, for Cr-V alloys. (a) O..A at% V, antiferromagnetic region [SOT 21; (b) 4.. .lO at% V, paramagnetic region [SOT 21; (c) 5’1.77 at% V [6OC3].
Landolt-BOrnstein New Series 111/19a

294 1.2.2.3 Cr-V [Ref. p. 480
x-’ Cr- V ml O! I I ^ ̂ ”
16
6
6
Fig. 24. For caption see previous page.
0 2 4 6 8 12 14 16 L-
18 K2 20
Table 5. Specific heat properties for bee 3d transition metal alloys, according to the equation C,=yT+/?T3. E is the standard deviation of the data points from the least- squares fit. 0, is the Debye temperature [60 C 33. Over-all accuracy: y+ 2%, On+ 15 K.
Y P E @D 10-4calmol-1 K-’ cal mol-’ Kv4 % K
Tio.sVo.s x22
Vo.77Cro.23 14.2 Vo.sCro.s 11.6 Vo.26Cro.74 5.31 Vo.*Cro.* 5.15 vo. 1cro.9 5.17 V0.0sCro.9s 5.54
Cro.9Mno. 1 5.33 Cro.Nno., <16 Cr o.69Mno.31 <29 Cro.61Mno.39 <47 Cro.sMno.s < 56(60.6)
Vo.deo.o, 16.1 Vo.d’eo.~s 12.4 Vo.sFeo.2 9.4 Vo.76Feo.24 - 10.0 Vo.74Feo.26 <13 V 0.72Fe0.28 < 18.5 Vo.7Feo.3 <21 V o.69Feo.31 < 22(22.9) Vo.66Feo.34 16.7 V a:s;:o.4s 13.1 V 0.67 8.63
0.0410 0.3 484 0.1507 0.3 314 0.0663 0.4 412 0.0627 0.5 420 0.0373 0.3 500 0.0469 0.2 463 0.0454 0.4 467
(-0.249) 1.2 0.0666 0.2 0.0397 0.2 0.0352 0.6
(-0.0516) 0.3 0.0867 0.4 0.0468 0.5 0.0917 0.4
412 489 509
377 463 369
Adachi

Ref. p. 4801 1.2.2.4 Mn-Ti, 1.2.2.5 Mn-V 295
Table 5 (continued).
Y 10m4 calmol-l K-’
P E @D
calmol-’ Km4 % K
Cro.98Feo.02 Cro.&‘eo.o~ Cro.90Feo.l~ Cro.~4%l~ cro.8Peo.18
Cro.81Feo.l~
Cro.80Feo.20
Cro.70Feo.30
Cr o.63Feo.37 Cro.53Feo.47 Cro.z&o.7s Cro.15Feo.85 Cr o.06Feo.94
< 7.7 < 16.6
25.2 32.2 39.4
<41(42.4) (43.0)
37:3 28.4 16.4 14.3 9.87 9.36
10.2
0.353 0.355 0.0405
(-0.086) (-0.123)
0.0151 0.0433 0.171 0.137 0.0768 0.0632 0.0433
0.4 236 0.5 235 0.5 486
0.4 675 0.5 475 0.4 301 0.4 324 0.6 392 0.4 419 0.6 475
1.2.2.4 Mn-Ti
Reference: 74 K 2.
Table 6. Composition dependence of the magnetic state for P-Mn-3d transition metal alloys at 4.2 K [74 K 21. The range of composition for paramagnetism (P) and antiferromagnetism (AF) is given in [at%] of the 3d metal.
Ti V Cr Fe co Ni
at%
P 2 2...4 2...4 1 0.1...0.5 AF 2.,.20 0.7...35 0.5.e.12
1.2.2.5 Mn-V
References: 63 C 3, 69 s 1, 69 V 1, 71 V 1, 74 K 2, 77 A 1, 80 M 3, 81 M 2, 83 M 1.
Table 7. Magnetic susceptibility of CsCl-type compounds Ti-3d and MnV. PP: Pauli type paramagnetism, CW: Curie-Weiss type paramagnetism.
NiTi ‘) PP X(T)=(5.1...8.9)10-6cm3g-1 for T=77+~.823K [62Bl, 68W2] CoTi cw See Figs. 185, 186, 190 FeTi cw See Fig. 69 Field-induced ferromagnetism appears, (0.061 uJFe) [60 N 1, 73 A 21 MnV PP x(CsC1) < X(disorder). See also Figs. 27, 28 [Sl M 21
‘) The CsCl-type structure is formed above ca. 380 K and transforms into a complex triclinic structure at low temperature.
Landolt-Bbmstein New Series 111/19a
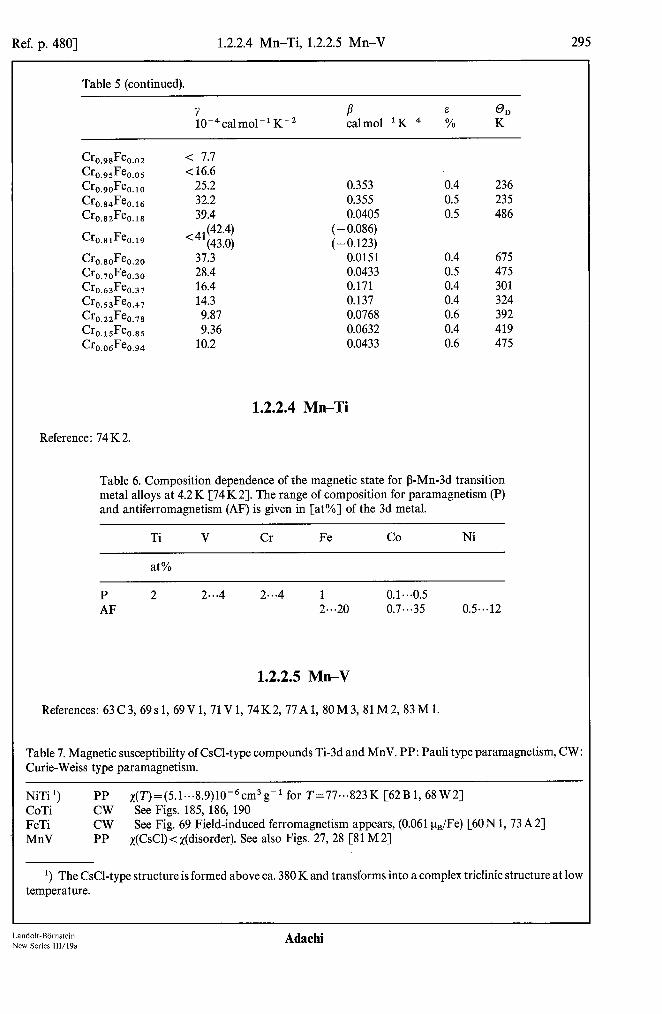
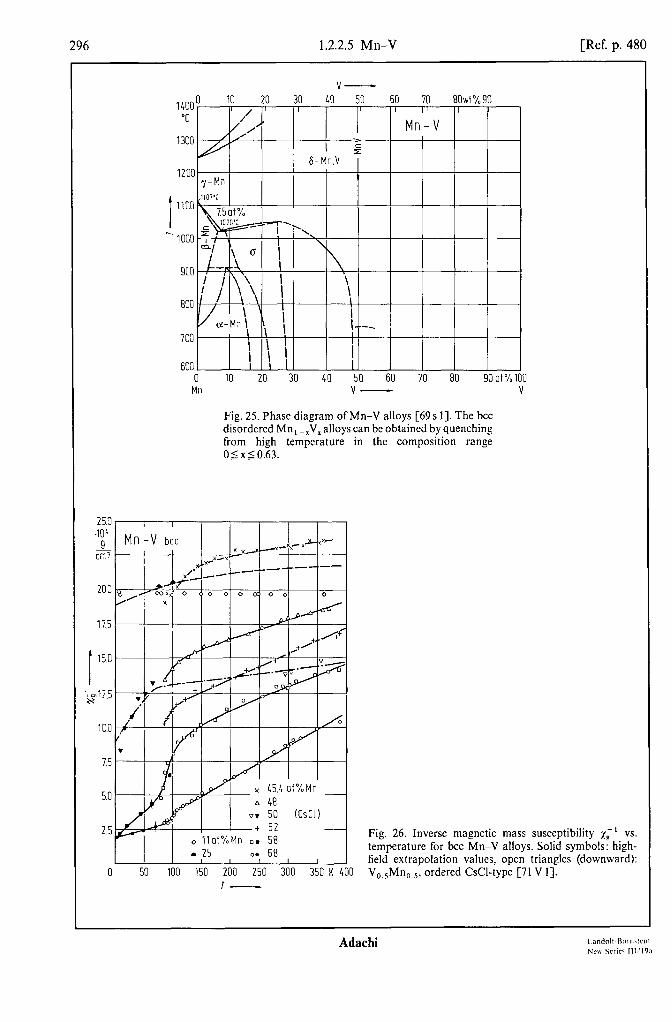
296 1.2.2.5 Mn-V [Ref. p. 480
v- m 3n rn v7 rn yn ,Looo 10 L" <" .," .Ju ou IU 80wt%90 ,
1’ I I I I 1 II I /
“C / Mn-V 1
1200 -,-Mn
\ \ I I---- I I
6OC1 1 I I II II II I
0 IO 20 30 40 50 60 70 80 90 at % 100 Mn v- V
Fig. 25. Phase diagram of Mn-V alloys [69 s 11. The bee disordered Mn, -XV, alloys can be obtained by quenching from high temperature in the composition range 05x50.63.
25.0 .lOL 9 KIT!
I
15.0
$12.5
2.5 0 llof%Mn 0. 58
M n
. 25 0. 68 I I 0 50 100 150 200 250 300 350 K 400
I-
Fig. 26. Inverse magnetic mass susceptibility xi’ vs. temperature for bee Mn-V alloys. Solid symbols: high- field extrapolation values, open triangles (downward): V,,,Mn,,,, ordered CsCl-type [71 V I].
Ada&i I andolt-Rornrrcin New Scric< lll~‘l9n
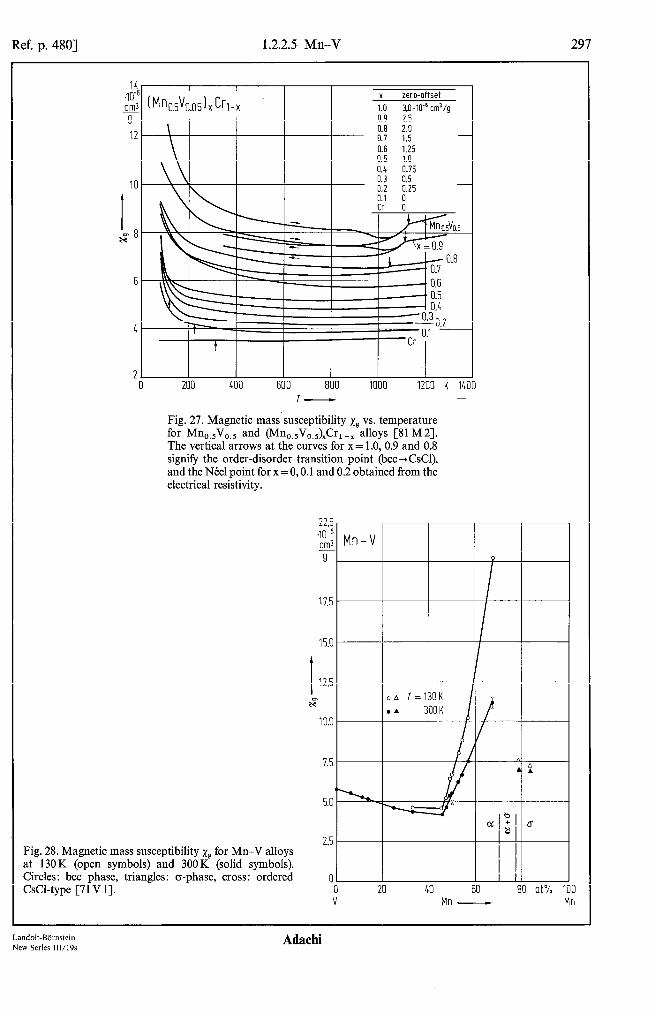
Ref. p. 4801 1.2.2.5 Mn-V
14 r 40.' cm! 9
12
6
I I
(Mn0.5V0.05)xCrl-x I
Y zero-offset
1.0 3.0 .lOP cm’/g 0.9 2.5
Cr -"
200 400 600 800 1000 1200 K T-
Fig. 27. Magnetic mass susceptibility xp vs. temperature for Mno.5Vo.5 and (Mno,,Vo,&r,-, alloys [Sl M2]. The vertical arrows at the curves for x = 1 .O, 0.9 and 0.8 signify the order-disorder transition point (bcc-CsCl), and the NCel point for x = 0,O.l and 0.2 obtained from the electrical resistivity.
Fig. 28. Magnetic mass susceptibility xs for Mn-V alloys at 130K (open symbols) and 300K (solid symbols). Circles: bee chase. trianeles: o-nhase. cross: ordered CsCl-type [7iV 11.’ - A
2.5
I I 0 0 20 40 60 80 at% 100 v Mn - Mn
Landolt-Bdmstein New Series 111/19a
Adachi
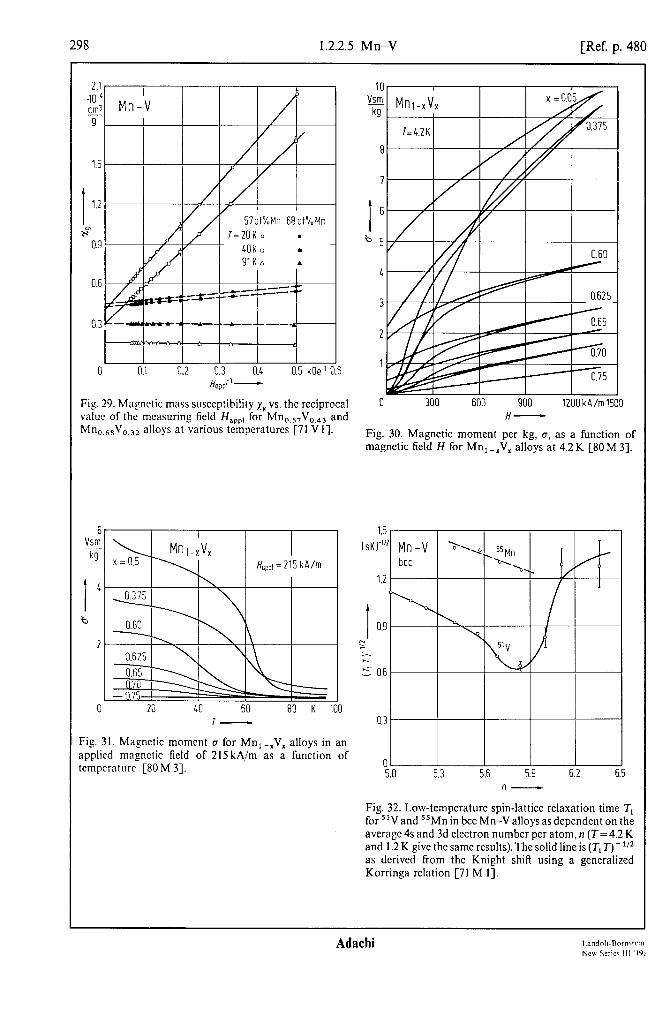
298 1.2.2.5 Mn-V [Ref. p. 480
2.11 I I
.$ Mn-V 9
/ /
1.5 /
II I Y/l 57ot%Mn 68ot%Mn
I I I I I I
0 0.1 0.2 0.3 0.1 0.5 kOe-'
Fig. 29. Magnetic mass susceptibility xp vs. the reciprocal value of the measuring field H,,,, for Mn,,5,V,,,, and Mn,,,,V,,,, alloys at various temperatures [71 VI].
6 vsm - kg
I 4
b
2
0 20 LO 60 80 K
Fig. 31. Magnetic moment D for Mn,-,V, alloys in an applied magnetic field of 215 kA/m as a function of temperature [80 M 31.
in, /_ .- "2 MnlmxVx I I
x =o.ot ko A
H-
Fig. 30. Magnetic moment per kg, 6, as a function of magnetic field H for Mn, -XV, alloys at 4.2 K [80 M 33.
1 0.9
" -I
5 0.6
5.6 5.9 6.2 R-
Fig. 32. Low-temperature spin-lattice relaxation time Tr for “V and 55Mn in bee Mn-V alloys as dependent on the average 4s and 3d electron number per atom, n (T=4.2 K and 1.2 K give the same results). The solid line is (T, 7) - U* as derived from the Knight shift using a generalized Korringa relation [71 M I].
Ada&i

Ref. p. 4801 1.2.2.5 Mn-V 299
0 0 IO 20 30 40 50 60 at% 80 V Mn -
Fig. 33. Spin-spin relaxation rate, Tzml, for ‘IV in Mn-V alloys at low temperature (T =4.2 K and 1.2 K give similar results) [71 M 11.
V Mn - Mn
0 50 100 150 200 250 300 K 35C T-
Fig. 34. Knight shifts K for (a) ’ ‘V and (b) ’ ‘Mn in Mn-\ alloys at 11.4 kOe and 300K. Open circles: bee phase disordered; solid circles; bee with CsCl ordering; oper triangles: pure o-phase; solid triangles: mixec a+ o-phase [71 V 11, see also [69 V 11. (c)Knight shift fo: ‘IV in Mn,,,V,,s as a function of temperature [71 V l]
I 1.5
g 1.0 K c
0.5
0 20 40 60 80 at%
Landolt-Bbrnstein New Series IW19a
Ada&i
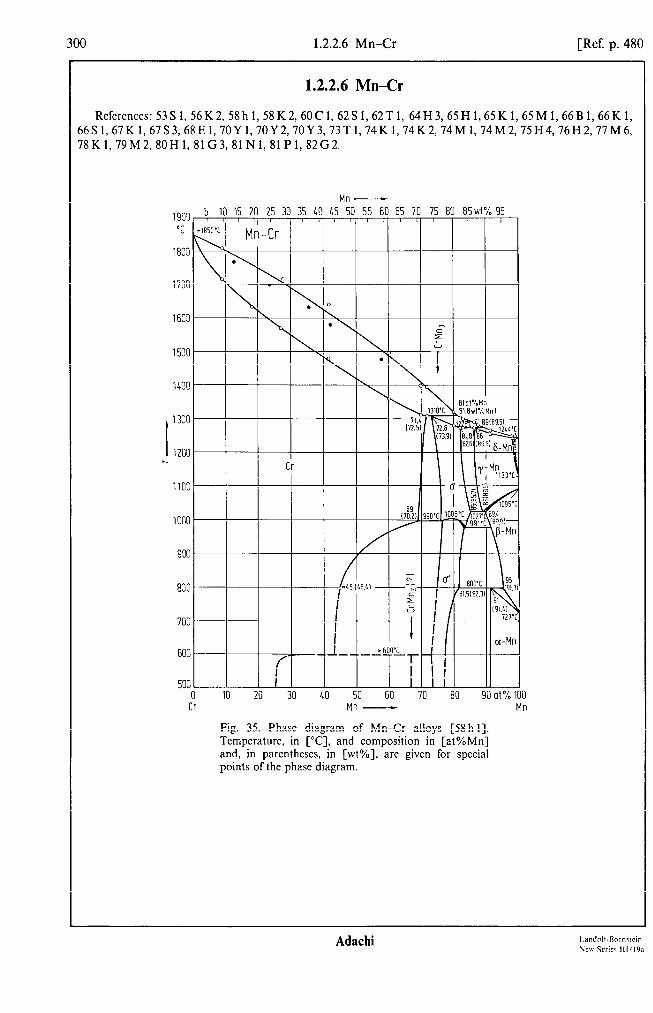
300 1.2.2.6 Mn-Cr [Ref. p. 480
Mn-
163:
12Oi
9K
80[
5 10 15 20 25 30 35 10 45 50 55 60 65 70 75 80 85wt% 95
I 1 I CY-MI
/--~ A- -~6OO'c
-- I
r I I II
10 20 30 40 50 60 70 80 90 at%
c
7 ‘C
1
31
‘C.
1
100 Cr Mn - Mn
Fig. 35. Phase diagram of MnXr alloys [58h I]. Temperature, in c”C], and composition in [at%Mn] and, in parenthcscs, in [wt%], arc given for special points of the phase diagram.

Ref. p. 4801 1.2.2.6 Mn-Cr 301
11.5
11.0
I 10.5 s
2 a-Mw5ot%Cr
5 a-Mn-Sat%Fe
10.0
9.5
8.01 0 50 100 150 200 250 K 300 7-
Fig. 36. Magnetic mass susceptibility xg of Mn and Mn-based alloys [62 S 11.
24 w6 cm3 - 9
0 200 400 600 800 1000 K I; a
3.0’ 120 150 180 210 240 K 270
b 7-
Fig. 37. Magnetic mass susceptibility xg vs. temperature for Mn-Cr alloys. (a) [79 M2], see also [62T 11; (b) [66S 11. The arrows indicate NCel temperatures deter- mined by electrical resistivity measurements.
300 3.40 I 350 400 450 K 500
Fig. 38. Magnetic mass susceptibility xp vs. reduced temperature for Cr-0.8 at% Mn. The NCel temperature, TN = 456 K, is derived from hyperfine-field measurements [Sl P 11.
Landolt-BOrnstein New Series lWl9a
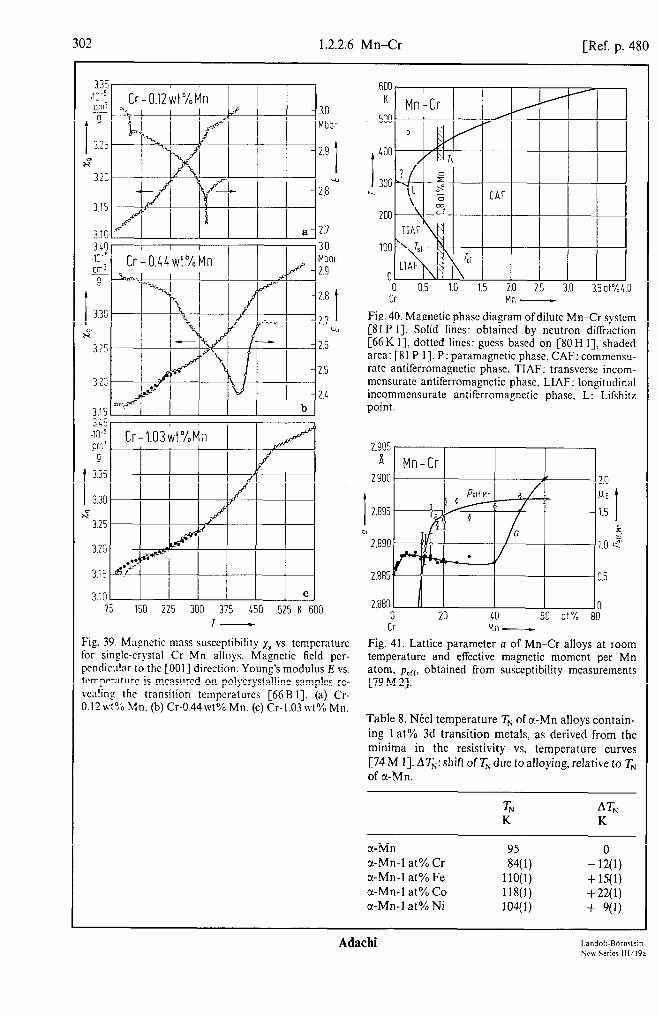
302 1.2.2.6 Mn-Cr [Ref. p. 480
3.s .13-" Ci3J - 0
i 3.3s
H" 3.25
Mbor 2.9
i --I 2.8
2.7 I b
2.6
2.5
2.4 3.20 cv .!
3.30
= 3.25
3.20
3.1 0 75 150 225 300 375 450 525 K 600
I-
Fig. 39. Magnetic mass susceptibility la vs. temperature for sin&crystal Cr-Mn alloys. Magnetic ticld pcr- pcndicular to the [OOI] direction. Young’s modulus E vs. tempernturc is measured on polycrystallinc samples rc- venting the transition temperatures [66 B I]. (a) Cr- O.l2wt% Mn. (b) Cr-0.44wt% Mn. (c) Cr-1.03wt% Mn.
600 K
500
400
300
200
100
0 0 0.5 1.0 1.5 2.0 2.5 3.0 3.5 ot%
A 4.0
Cr Mn -
Fig. 40. Magnetic phase diagram ofdilute Mn-Cr system [Sl P I]. Solid lines: obtained by neutron diffraction [66 K I], dotted lines: guess based on [80 H I], shaded arca: [8l P I]. P: paramagnctic phase, CAF: commensu- rate antiferromagnetic phase, TIAF: transverse incom- mcnsuratc antiferromagnetic phase, LIAF: longitudinal incommensurate antiferromagnetic phase, L: Lifshitz point.
Cr Mn-
Fig. 41. Lattice parameter a of Mn-Cr alloys at room temperature and effective magnetic moment per Mn atom, perr, obtained from susceptibility measurements [79 M 21.
Table 8. N&e1 temperature TN of a-Mn alloys contain- ing 1 at% 3d transition metals, as derived from the minima in the resistivity vs. temperature curves [74 M 11. AT,: shift of TN due to alloying, relative to TN of a-Mn.
TN AT, K K
u-Mn 95 0 cl-Mn-1 at% Cr 84(l) -12(l) cr-Mn-1 at% Fe 110(l) +15(l) u-Mn-1 at% Co 118(l) +22(l) a-Mn-I at% Ni 104(I) + 90)
Adachi Landolr-Rornrlein Ncu Serier lll.‘l9a

Ref. p. 4801 1.2.2.6 Mn-Cr 303
Oo_IO 60 at% 80 Cr Mn -
Fig. 42. Composition dependence ofNCe1 temperature TN and the average sublattice magnetic moment per atom, j& extrapolated to 0 K of Mn-Cr alloys [79 M 21. Open circles [79M 21, open squares [53 S 11, solid squares [58 K 21, solid circles [64 H 31.
80
K a 71
I 0.0032
Mn-Cr 1 Ps 0 0.0028
60 0.0024
50 0.0020 40 0.0016
I
I$
30 0.0012
20 0.0008
IO 0.0004
0 0 0 5 IO 15 20 25 at% 30
Cr Mn -
Fig. 43. Composition dependence of the Curie tempera- ture Tc, the average magnetic moments j?,,,r for the weak ferromagnetism and the spin reorientation temperature T,, of antiferromagnetism in Mn-Cr alloys [79 M 21.
I b
0 3 6 9 12 15 kOe 18 H-
Fig. 44. Magnetic moment per gram of Mn-Cr alloys at 4.2 K, as dependent on magnetic field strength [79 M 21.
Landolf-Biirnsrein New Series lll/l9a
Adachi
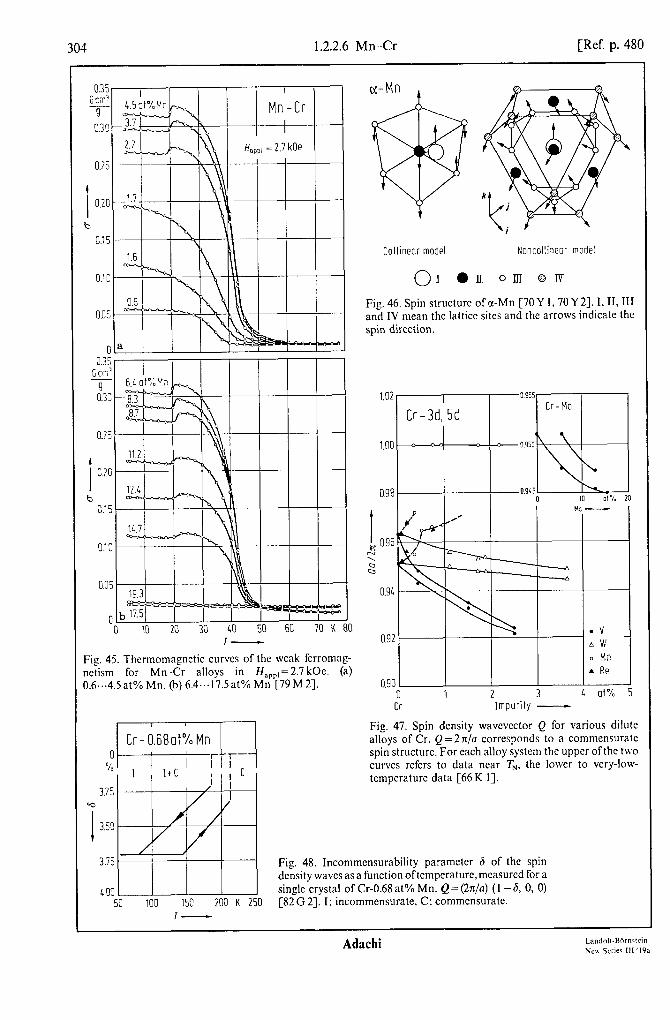
304 1.2.2.6 Mn-Cr [Ref. p. 480
0.35 Gem!
9 0.3’;
0.i C
I 0.2[
b 0.1:
0.i 0
Mn-Cr I
H op2, = 2.7 kOe
IO 20 30 ka 50 60 70 K 80 I-
Collinear model Noncollineor model
01 l II om @IT
Fig. 46. Spin structure of cr-Mn [7OY I,70 Y 21. I, II, III and IV mean the lattice sites and the arrows indicate the spin direction.
Fig. 45. Thermomagnctic curves of the weak ferromag- 0 Kn netism for Mn -0 alloys in H,,,,=2.7 kOe. (a) b Re D.6,..4.5at% Mn. (b) 6.4...17.5at% Mn [79M2]. 0.90
0 1 2 3 1 al% 5 CC Impurity -
53 53 100 100 150 150 200 200 K K 250 250
Fig. 47. Spin density wavcvcctor Q for various dilute alloys of Cr. Q = 2 n/a corresponds to a commensurate spin structure. For each alloy system the upper of the two curves refers to data near TN, the lower to very-low- tcmpcraturc data [66 K I].
Fig. 48. Incommensurability parameter 6 of the spin density waves as a function oftempcraturc,mcasurcd for a single crystal of Cr-0.68 at% Mn. Q=(2n/a) (I -6, 0, 0) t-82 G 2). I: incommensurate, C: commensurate.
Adachi
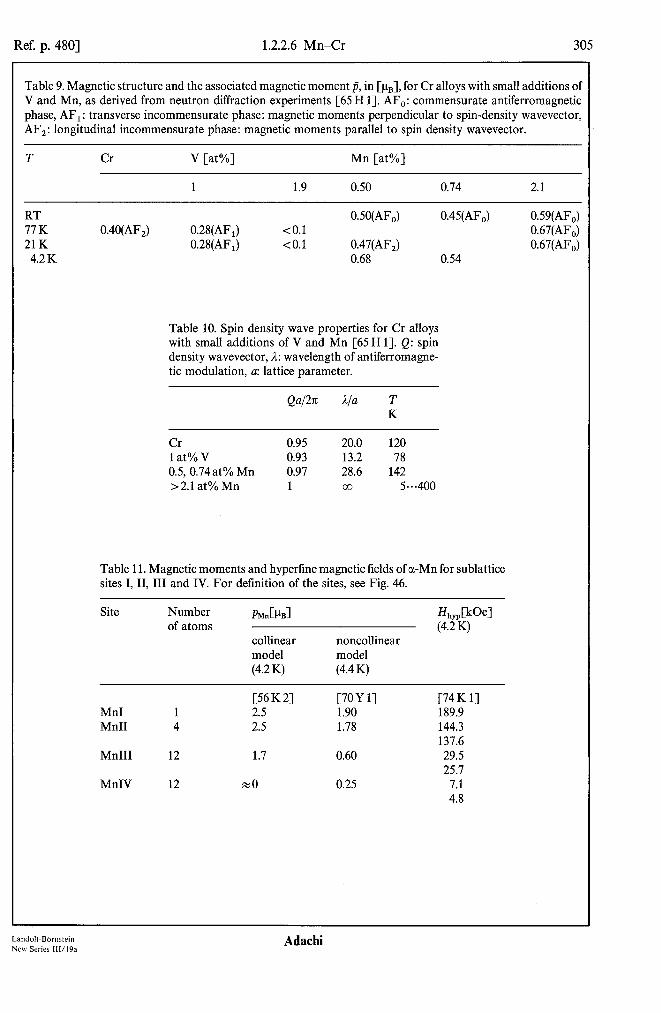
Ref. p. 4801 1.2.2.6 Mn-Cr 305
Table 9. Magnetic structure and the associated magnetic moment p, in [un], for Cr alloys with small additions of V and Mn, as derived from neutron diffraction experiments [65 H 11. AF,: commensurate antiferromagnetic phase, AF,: transverse incommensurate phase: magnetic moments perpendicular to spin-density wavevector, AF,: longitudinal incommensurate phase: magnetic moments parallel to spin density wavevector.
T Cr V [at%] Mn [at%]
1 1.9 0.50 0.74 2.1
RT 0.50(AF,) 0.45(AF,) 77K 0.40(AF,) 0.28(AF,) <O.l 21 K 0.28(AF,) <O.l 0.47(AF,) 4.2K 0.68 0.54
Table 10. Spin density wave properties for Cr alloys with small additions of V and Mn [65 H 11. Q: spin density wavevector, I: wavelength of antiferromagne- tic modulation, a: lattice parameter.
Qa/2K AJa T K
Cr 0.95 20.0 120 lat%V 0.93 13.2 78 0.5, 0.74 at% Mn 0.97 28.6 142 >2.1 at% Mn 1 co 5...400
Table 11. Magnetic moments and hypertine magnetic fields of a-Mn for sublattice sites I, II, III and IV. For definition of the sites, see Fig. 46.
Site Number of atoms
PMnClhI
collinear model (4.2 K)
noncollinear model (4.4 K)
%,,Wel (4.2 K)
[56K2] [70 Y l] [74 K 1-j MnI 1 2.5 1.90 189.9 MnII 4 2.5 1.78 144.3
137.6 MnIII 12 1.7 0.60 29.5
25.7 MnIV 12 WO 0.25 7.1
4.8
0.59(AF,) 0.67(AF,) 0.67(AF,)
Land&Bbmstein New Series lll/l9a
Adachi

Table 12. Experimental data on the commensurate-incommensurate spin density wave transitions for Cr-Mn alloys [82 G 21. ND: neutron diffraction, x: magnetic susceptibility, TE: thermal expansion, R: rcsistivity, HC: heat capacity, X: X-ray, mcasuremcnts.
Mn Experimental Hysteresis Transition at% technique width [K] width [K]
Center of hysteresis loop CK]
Remarks Ref.
0.12 ND, II 0.3 TE 0.43 TE 0.44 ND, z 0.45 TE, R, HC 0.5 R, HC 0.5 ND 0.5 X 0.6 TE 0.68 TE, ND 0.70 TE, R, HC 0.74 ND 0.9 TE 0.96 ND 1 TE 1.03 ND, 2: 2.1 ND
- 15 35 31 - 50
30 30 40 80 35 40 - 40
- 50 50
x 1 - 100
50 40
% 3 100 35 10
- 45
- 260 200 197 - 200 250 230 175 162 170 140 120 - 135
Incommensurate for all temperatures below TN Incommensurate for all temperatures below TN No resistivity anomalies observed at T=
Homogeneous Mn distribution No anomalies at T,
20 K between peaks Inhomogeneous Mn distribution Homogeneous Mn distribution
No anomalies for 80 < T < TN
Commensurate for all temperatures below TN
66Bl 78K 1 6783 66Bl 8262 77 M 6 75H4 74T1 78Kl 8262 8262 75H4 78K 1 66Kl 76H2 66Bl 75H4

Ref. p. 4801 1.2.2.6 Mn-Cr
-k2 do 0.8 0.6 OA 0.2 0
I II II I
d V- Cr, Mn-Cr 0.6 I I I 1
0 1 0 12 3 L 5 6 dO-3 7
62 -
1
Fig. 49. Square ofthe magnetic amplitude M, vs. square of the incommensurability parameter 6 of the spin density waves of Mn-Cr and V-Cr alloys at zero temperature. The modulus of the Jacobian elliptic function describing the spin density wave is designated by k [81 N 11. Polycrystalline samples: (I) 0.25 at% Mn, (2) 0.18 at% V, (3) 0.85at% V, (4) 4.13at% V; single crystals: (5) 1.5 at% V, (6) 2.3 at% V. Open circles: [Sl N 11, solid circles: [65Hl, 67K1, 66K1, 65Kl]. Solid line: estimated, dashed line: best fit [81 N I].
0 0 5 IO 15 20at%25 Cr Mn -
Fig. 50. High-field magnetic susceptibility xHF for Mn-Cr alloys at 4.2 K, measured at magnetic field strengths up to 18kOe [79M2].
r/r, -
Fig. 51. Temperature dependence of magnetic hyperfine fields measured on l1 ‘Cd probe nuclei in Cr-0.8 at% Mn. The NCel temperature is defined as the temperature where the concentration of sites with zero hyperfine field is 50% as determined from hyperfine field data. H,: maximum hyperfine field, I?, : hyperfine field averaged over half of an oscillation of the spin density wave, l!i: average hyperfine field in the commensurate-paramagnetic tran- sition region. Circles and triangles apply to different samples of about the same composition, their NCel temperatures varying between 456K and 471 K, see caption to Fig. 52. Crosses indicate averaged hyperfine fields [Sl P 11. Ki: commensurate-incommensurate tran- sition temperature.
1.i
Landolf-Biirnstein New Series 111/19a
Adachi
30s 1.2.2.6 Mn-Cr [Ref. p. 480
/ 1 kii Cr- 0,8at% Mn
1 I 1 I _1
0.85 0.93 0.95 1.00 1.05 1.10 1.15 I / r,, -
Fig. 52. Tempcraturc depcndcncc of magnetic hypcrfinc fields and of the concentration of sites, cp. with zero hypcrfinc field. for “‘Cd in the commcnsuratc- paramrqnetic transition region of Cr-0.8 at% Mn. Sample I: Tx=461(3)K.sample 2: ‘&=456(3)K,samplc 3: rs=471 (3)K [Sl P I]. H,: maximum hypcrtinc ticld, I?: average hypcrfinc field; i7 = (I- c,)H,, rcprcscntcd by crosses [Sl P I], See also Fig. 51.
Fig. 53. Line shape ofthc spin-echo spectrum for 55Mn in bee Mno.289%.7, 1 at 1.4K. All samples with a Mn content bctwcen about 5 and 60 at% Mn show similar lint shapes [73 T I].
70 kOe 60
I 50
c; z 40
z - E
=c 30
20
10
0 0 20 40 60 80 at% 100
Cr Mn - Mrl
Fig. 54. Magnetic hypcrfmc field as derived from spin- echo NMR spectra for “Mn in bee Mn-Cr alloys at I .4 K [73T I].
Adachi
Ref. p. 4801 1.2.2.6 Mn-Cr
a-Mn-Cr
100 110 120 130 140 150 160 190 200 MHz V-
Fig. 55. NMR line shapes of 55Mn at site I and site II of a-Mn-Cr alloys at 1.4 K [74 K 11. For site definition, see Fig. 46. Intensity scales are different for site I and site II.
I I I
Mn-Cr bee / I
IO" I I
c! 20 40 60 80 at% 100
Mn - Mn
Fig. 56. Nuclear spin-lattice relaxation time Ti of 55Mn in bee Mn-Cr alloys, multiplied with temperature T The value of T,T is constant in the temperature range from 4.2K to 1.4K [73T 11.
Cr- 0.45at%Mn Cr- 0.7at%Mn
I I\ I 206 210 K 21;li 178 K IE j2
T-
I
if
Fig. 57. Latent heat dQ/dt as function of temperature for two Mn-Cr alloys as observed on heating through the transition of the incommensurate to the commensurate spin density wave state [82 G 21.
Landolt-Biirnstein New Series 111/19a
Adachi
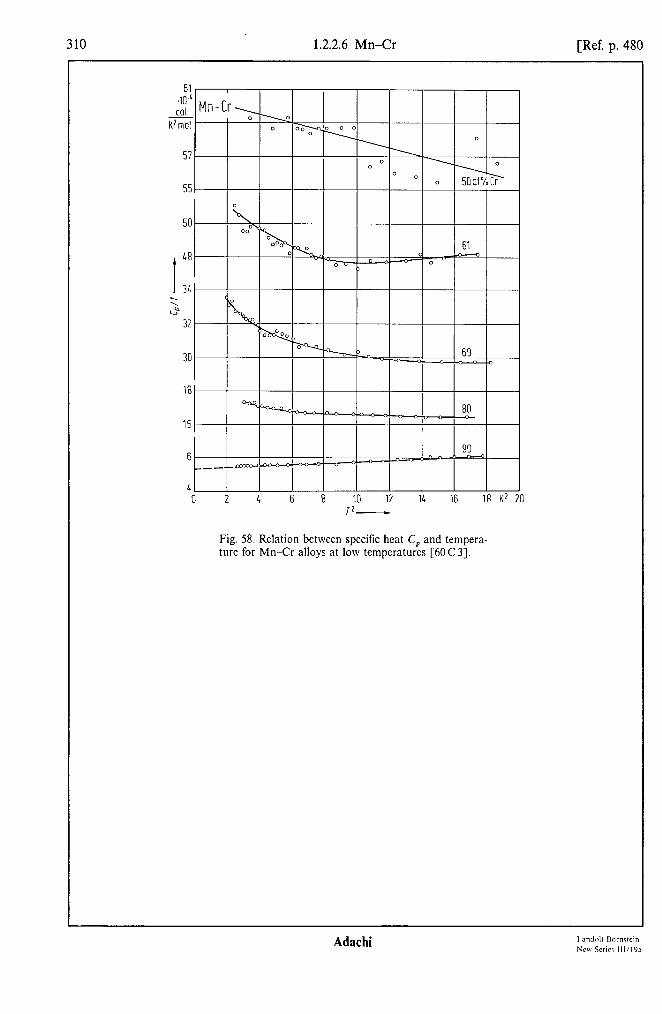
310 1.2.2.6 Mn-Cr [Ref. p. 480
16
6
L 0 2 L 6 8 10 12 16 16 18 K2 20
12-
Fig. 58. Relation between specific heat C, and tempera- ture for Mn-Cr alloys at low tempcraturcs [60 C 31.
Adachi
Ref. p. 4801 1.2.3 Alloys between Fe, Co, Ni and Ti, V, Cr, Mn 311
1.2.3 Alloys of Fe, Co or Ni and Ti, V, Cr or Mn
1.2.3.0 General remarks
(See also subsect. 1.2.2.0, p. 282)
Magnetic properties of the binary alloys of Fe, Co or Ni and Ti, V, Cr or Mn are represented, as well as magnetic properties of the respective pseudo-binary alloys in which one of the 3d transition metals is partially substituted by a third 3d metal. Surveys 3 and 5 give the subsection in which a particular alloy system is predominantly dealt with, while Surveys 4 and 6 provide a complete list of figures and tables containing data on the properties specified for the alloys under discussion.
Survey 3. The subsections devoted to the binary alloys of Fe, Co or Ni and Ti, V, Cr or Mn are listed, as well as information on atomic ordering and crystallographic phases considered.
dil: dilute alloy, diso: disordered alloy, (3: 1): Cu,Au-type superlattice, (1: 1): CuAu-type superlattice, (l/l): CsCl-type compound, (0): o-phase, (L): Laves phase.
Ti V Cr Mn
Fe 1.2.3.1 1.2.3.2 1.2.3.3 1.2.3.4 dil dil dil dil diso diso diso diso U/l), (L) (4 (4 ~1, y, c-Fe
co 1.2.3.5 1.2.3.6 1.2.3.7 1.2.3.8 dil dil dil
diso diso diso diso
Ni gTy’ yg$ (0)
dil’ ’ dil’ 1.2.3.11 1.2.3.12 dil dil
diso diso diso diso (l/l) (0) (3:1), (1:l)
For survey 4, see next page.
Survey 5. The subsections devoted to Mn-VCr and the pseudo-binary alloys of Fe, Co or Ni and Ti, V, Cr or Mn are represented.
Alloy Subsection
Mn-V-Cr 1.2.3.13 Fe-VCr 1.2.3.14 Fe-Cr-Mn 1.2.3.15 Co-V-Cr 1.2.3.16 Co-Cr-Mn 1.2.3.17 Fe-Co-Ti 1.2.3.18 Fe-Co-V 1.2.3.19 Fe-Co-Cr 1.2.3.20 Fe-Co-Mn 1.2.3.21 Fe-Ni-V 1.2.3.22 Fe-Ni-Cr 1.2.3.23 Fe-Ni-Mn 1.2.3.24 Co-Ni-Ti 1.2.3.25 Co-Ni-Mn 1.2.3.26
Landolt-Bbmstein New Series II1/19a
Adachi

312 1.2.3 Alloys between Fe, Co, Ni and Ti, V, Cr, Mn [Ref. p. 480
Survey 4. For each of the binary alloys of Fe, Co or Ni and Ti, V, Cr or Mn the figures and tables are listed in which data on the properties specified is provided. Reference is given not only to section 1.2.3 (Figs. 59. ..427 and Tables 13...88) but also to section 1.2.2 (Figs. 1...58 and Tables 1 . ..12). Numbers in roman and italic refer to figures and tables, respectively. For SC alloys, see Table 1, p. 288.
Alloy Phase diagram. lattice constants
Susceptibility, Magnetic paramagnctic transformation properties temperatures
Magnetization, average magnetic moment
Atomic magnetic moments, g-factor, spin structure
Fe-Ti
Fe-V ‘)
59, 60
1, 17 73
21,29
61...63, 65, 231, 234 13, 77 3, 74...82, 84
22...24, 29, 32 15, 23, 24, 32
Fe-Cr ‘) 100 101...108, 208
Fe-Mn ‘) 21 23, 30. .32, 75 15, 23, 32...34, 75 156, 157, 36, 158...163, 157, 164...166, 161 224, 360 227,363,400,404
Co-Ti 363 42 6,8, 15, 39, 42,86 15, 40, 42 15, 16, 41 184 185...189, 334 195, 332 188...195, 336
co-v 44, 45, 77 I, 7, 44 3, 198, 254 199, 200
CoCr
I, 44 197 21 206, 207 101, 102
208.,.210, 254
Co-Mn 21 219
50, 76 220...224, 361, 362
Ni-Ti
Ni-V
253 7 21, 132, 253, 254
Ni-Cr
83 246 1, 57 251, 252 21 256 208, 257...259,
263
Ni-Mn “) 269, 270, 310
61 51, 55, 63 222...224, 227, 270, 274, 275, 271...273 310,403
67,68 69
65, 66, 332 63...69, 167, 336 70
1, 7, 13, 15, 19 82...86, 109, 164
109...116, 131, 164
211, 261
51, 76 225...227, 361, 362 6,8, 39, 83 241, 214 7, 55 274 55 261, 274
6, 8, 39, 55 67.. .69, 86
7, 13...15, 17 72, 77, 80, 87...97 130, 132 15, 23.e.25, 32
20, 21, 87, 117...130, 132...134, 140, 141 15, 23, 32, 36, 38 163,165, 167...169, 363,368
15...17 90...92, 96
15, 16, 25, 26, 28 19, 21, 134...139, 145, 264, 266, 355 15,28,35...37 170, 171,355
44,46 1 200...202 46...48 47, 48, 81 20, 21, 132, 19,21,215,216, 212...215, 264, 266 217, 232 46, 47, 52, 53 47, 51, 53 226, 228, 229, 230, 231 232...234, 367 46, 47, 53, 54, 83 47, 53, 54, 83 249, 250 248, 250 55...57 57 132,249, 290 55,64 64 20, 21, 132, 249, 19, 21, 216, 262, 263, 265, 286, 264...266 290 55, 62...64 51, 64, 65 249, 276...284, 285, 287...289 286, 287, 290, 310, 409.410.425 55, 68, 69 67, 68, 70, 71
‘) Resistivity and temperature derivative of resistivity: Fig. 83. 2, Resistivity: Figs. 103, 112.
Adachi
Ref. p. 4801 1.2.3 Alloys between Fe, Co, Ni and Ti, V, Cr, Mn 313
High-field susceptibility
NMR, Mbssbauer effect
Spin waves, exchange
Magnetic Specific anisotropy, heat, magneto- thermal striction expansion
Alloy
339
142, 143
194, 339
234
267, 292
267, 292
66 291, 292
66
314, 341, 342 71, 72,332,345 I, 15, lg...20 77, 79
8, 93...97, 146, 173 15, 20, 27.e.29 97, 144.**149 150, 151
15, 28 38 93, 172...180, 237, 238, 295, 371 13, 20,42, 43 185, 196, 314, 341, 342 45 203.. .205 49 218
176, 179, 235.. ~243, 295
173, 176, 179, 299...301 235, 237, 293...298 67, 68, 71 72, 73
152, 153
38 181
217, 244
244
59
59 302...307, 416, 417
58 308...310
69 60, 73
98, 99
5
5, 10, 154, 155, 345
5, 33 163, 182, 183, 420,421
245, 332, 345, 422 46, 77, 79 245 46 245
46
245
46 268 58 255,268 58,60 260, 268
3, Resistivity and thermoelectric power: Fig. 163. 4, Resistivity: Table 69.
Fe-Ti
Fe-V ‘)
Fe-Cr 2,
Fe-Mn 3,
Co-Ti
co-v
Co-Cr
Co-Mn
Ni-Ti
Ni-V
Ni-Cr
Ni-Mn “)
Landolt-Bdmstein New Series IIl/19a
Adachi
314 1.2.3 Alloys between Fe, Co, Ni and Ti, V, Cr, Mn [Ref. p. 480
Survey 6. For the Mn-V-0 alloy system as well as the pseudo-binary alloys of Fe, Co or Ni and Ti, V, Cr or Mn the figures and tables are listed in which data on the properties specified is provided. References is given not only to subsect. 1.2.3 (Figs. 59...427 and Tables 13...88) but also to subsect. 1.2.2(Figs. 1...58 and Tables 1...12). Numbers in roman and italic refer to figures and tables, respectively.
Alloy Phase diagram. lattice constants
Susceptibility Magnetic paramagnetic transformation properties temperatures
Magnetization, average magnetic moment
Atomic magnetic moments, g-factor, spin structure
Mn-V-Cr
Fe-V-Cr ‘)
Fe-Cr-Mn Co-V-Cr
Co-Cr-Mn Fe-Co-Ti 2,
Fe-Co-V Fe-Co-Cr
Fe-Co-Mn
Fe-Ni-V
Fe-Ni-Cr
Fe-Ni-Mn
CoNi-Ti
311. 312 27, 313 312, 314, 315 315...317 74 74 74
36, 320 321 75 75
36, 162 14, 325 325 76 76
331, 332, 334 332...334 332, 334...338
77 77, 78 77, 78 80 81
346 347...349,358 349...352 355 82 82
359, 363, 360...362, 227, 361...365 363, 365...369, 355, 370 364 364, 366 373, 374 83 83 82,83 81...83
377 378 85 81
379,380 381, 382 227, 380, 38I, 383, 385...389 389,390 384, 388,389
83 83 83 83
394...399, 411 227, 398...404 396, 397, 412 405...411,413
83 88 83, 86, 87 87
Co-Ni-Mn 423 423,424
‘) Resistivity: Fig. 321. 2, Influence of hydrogen on magnetic properties: Table 78.
425,426
Adachi

Ref. p. 4801 1.2.3 Alloys between Fe, Co, Ni and Ti, V, Cr, Mn 315
High-field susceptibility
NMR, Miissbauer effect
318, 319
Spin waves, exchange
Magnetic Specific anisotropy, heat, magneto- thermal striction expansion
Alloy
Mn-V-Cr
Fe-V-Cr ‘)
322.. .329 Fe-Cr-Mn Co-V-Cr
339
77
330
340...343
78
352...354, 356
371, 372, 374...376
77
357
10, 332, 339, 344, 345 77, 79
346, 357, 358
84
391, 392
372,414,415
427
416...418
393
182, 419.. .421
88 10, 422 79
Co-Cr-Mn
Fe-Co-Ti 2,
Fe-Co-V Fe-Co-Cr
Fe-Co-Mn
Fe-Ni-V
Fe-Ni-Cr
Fe-Ni-Mn
Co-Ni-Ti
Co-Ni-Mn
Landolt-Bdmstein New Series 111/19a
Adachi

316 1.2.3.1 Fe-Ti [Ref. p. 480
Ti -
1700 10 20 30 40 50 60 70 8owt%90
“C
1600
600
500
400 0 10 20 30 40 50 60 70 80 90 ot% ’ Fe Ti -
Fig. 59. Phase diagram of Fe-Ti alloys [58h 11. Tc: [14L 11. Temperature, in c”C], and composition, in [at%Ti] and, in parentheses. in [wt%Ti], arc given for characteristic points of the phase diagram.
Adachi

Ref. p. 4801 1.2.3.1 Fe-Ti 317
0.45, 0.45 , I I
0.40 0.40
0.35 0.35
0.30 0.30
I
I 0.25 0.25
c 0.20 c 0.20
0.15 0.15
0.10
0 30 30 31 31 32 32 33 at% 34 33 at% 34
Ti - Ti -
Fig. 60. Fraction f of Fe atoms with one or more Fe neighbors on Ti sites as dependent on composition for Fe-Ti alloys [67 W 11.
Fig. 60. Fraction f of Fe atoms with one or more Fe neighbors on Ti sites as dependent on composition for Fe-Ti alloys [67 W 11.
225 m;’ - mol
150
t 125
%oo
25
0 2 4 6.D6 m/A IO H-l -
Fig. 62. Influence of hydrogenation on the magnetic molar susceptibility x,,, of Fe,,,Ti,,,. Curve A: before treatment with hydrogen, B: after one hydrogenation and dehydro- genation, C: after several hydrogenations and dehydro- genations [77 H 31.
Fig. 61. Magnetic molar susceptibility x,,, and its inverse value, xi ‘, as a function of temperature for Fe,,5Ti,,, [77H3].
-- Jc&
9 40
I 30
CT 20
IO
0
01 I I I I I 0 100 200 300 400 500 K 600
T-
Fig. 63. Reciprocal magnetic mass susceptibility, xi ‘, and spontaneous magnetization crS derived from measure- ments in magnetic fields up to 100 kOe vs. temperature for Fe,+,Ti,-, Laves phase compounds. For an analysis of the curves, see Table 13 [70 0 11, see also [67 M 11.
Landolt-Bornstein New Series IIl/19a
Adachi

318 1.2.3.1 Fe-Ti [Ref. p. 480
60 Gcmj
9
50
1c
c 2GC .lO ! cm! 9 16:
\
100 200 300 400 K 500 l-
100 Gcm3
9
I 60
b 40
20
0 160 .1w6
I
gly 9
x 80 e
w 40
0
2L 26 28 30 32 34 36 38ot%40
Fig. 65. Composition dependence of the magnetic mo- mcnt u of Fc-Ti alloys at 44 and 500 K, Curie and Ntel tempcraturcs, Tc and TN, rcspcctivcly, and peak value of the susceptibility, xrnBx, in the antiferromagnetic region [68 N 21.
Fig. 64. hgagnetic moment 0 and the susceptibility xs mcasurcd in a magnetic field of 9.6 kOe at various tcmperaturcs for Fe-Ti Laves phase compounds [68 N 23.
Adachi

Ref. p. 4801 1.2.3.1 Fe-Ti 319
15 Gcm3
I
9
5 5
Fig. 66. NCel temperature TN, Curie temperature T, and the spontaneous magnetic moment crs (&: average mag- netic moment per formula unit) at OK for Fe,+,Ti,-, alloys [710 31. Solid circles: TN defined as the temper- ature for the maximum in the x(T) curve, bars: TN derived from Mijssbauer experiments.
6 .I03 Ah
I
4
x 2
0
I
Feo.5 T' 0.5
15 30 45 60 75 Ad/K 90 NIT -
2.2: Jcrj
9
2.0[
1.7:
1.5c
I 1.2:
b l.OC
I
I
,
I
,
I
0.25
0
0.75
0.50
8 I F x=0.0133 T=$.2t
0 5 10 15 20 25 kOe 30 H-
Fig. 67. Magnetization curves at various temperatures for Laves phase compounds Fe,+,Ti,-, [710 31. (a) x= -0.0094, (b) x=0.0133.
Fig. 68. Magnetization per unit ofvolume, M, vs. the ratio H/T, i.e. the magnetic field divided by the measuring temperature, for Fe,,,Ti,,, samples hydrogenated in a hydrogen atmosphere of 130 bar at various temperatures and slowly cooled to room temperature [77 H 31.
Landolt-Bbmstein Adachi New Series lWl9a
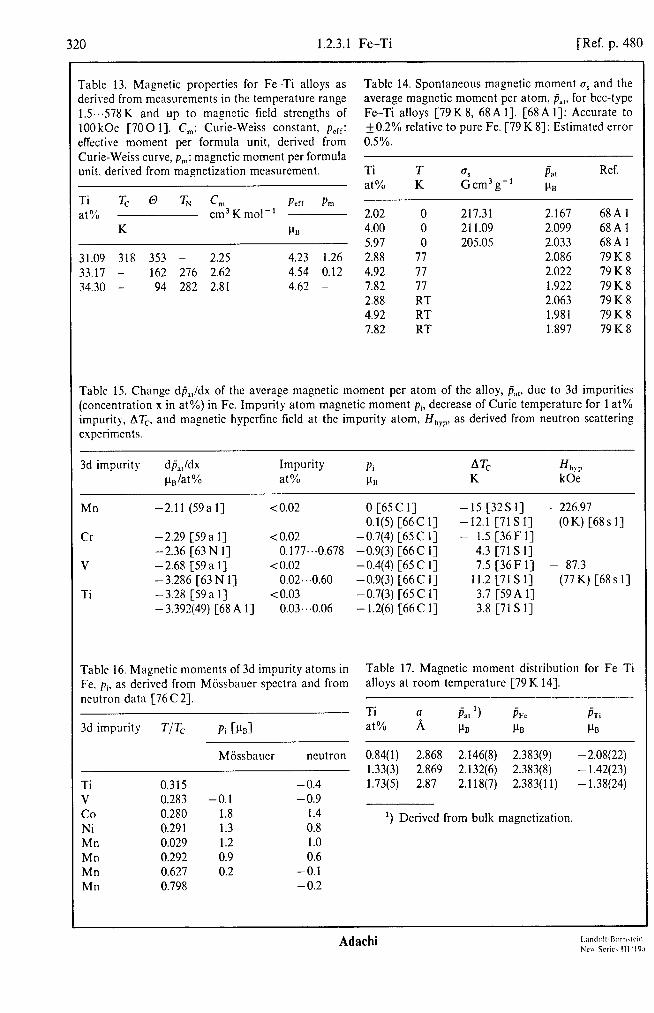
320 1.2.3.1 Fe-Ti [Ref. p. 480
Table 13. Magnetic properties for Fe-Ti alloys as derived from measurements in the temperature range 1.5...578K and up to magnetic field strengths of 1OOkOe [7001]. C,: Curie-Weiss constant, perr: effective moment per formula unit, derived from Curie-Weiss curve, pm: magnetic moment per formula unit. derived from magnetization measurement.
Ti Tc 0 TN C, Pcrr Pm at% cm3Kmol-’
K Pll
31.09 318 353 - 2.25 4.23 1.26 33.17 - 162 276 2.62 4.54 0.12 34.30 - 94 282 2.81 4.62 -
Table 14. Spontaneous magnetic moment es and the average magnetic moment per atom, Pa,, for bee-type Fe-Ti alloys [79K8, 68A 11. [68A 11: Accurate to f 0.2% relative to pure Fe. [79 K 81: Estimated error 0.5%.
Ti T a5 Pa, Ref. at % K Gcm3g-’ pn
2.02 0 4.00 0 5.97 0 2.88 77 4.92 77 7.82 77 2.88 RT 4.92 RT 7.82 RT
217.31 2.167 68Al 211.09 2.099 68Al 205.05 2.033 68A 1
2.086 79K8 2.022 79K8 1.922 79K8 2.063 79 K 8 1.981 79K8 1.897 79K8
Table 15. Change dP,,/dx of the average magnetic moment per atom of the alloy, Put, due to 3d impurities (concentration x in at%) in Fe. Impurity atom magnetic moment pi, decrease of Curie temperature for 1 at% impurity, AT,, and magnetic hyperfine field at the impurity atom, II,,,.,,, as derived from neutron scattering experiments.
3d impurity dP,,/dx un/at%
Impurity at%
Pi lh
AT, K
Hh\.p kde
Mn
Cr
v
Ti
-2.11 (59al] < 0.02 0 [65 C l] 0.1(5) [66 c 1)
-2.29 [59a l] < 0.02 -0.7(4) [65 C l] -2.36 [63 N l] 0.177...0.678 -0.9(3) [66C 1-j -2.68 [59a l] < 0.02 -0.4(4) [65 C l] - 3.286 [63 N l] 0.02.. .0.60 -0.9(3) [66 c l] -3.28 [59a I] <0.03 -0.7(3) [65 C 1-j - 3.392(49) [68 A l] 0.03...0.06 - 1.2(6) [66C 13
Table 16. Magnetic moments of 3d impurity atoms in Fe, pi, as derived from Miissbauer spectra and from neutron data [76 C 21.
3d impurity TITC Pi CPIJ
Mbssbauer neutron
Ti 0.315 -0.4 V 0.283 -0.1 -0.9 co 0.280 1.8 1.4 Ni 0.291 1.3 0.8 Mn 0.029 1.2 1.0 Mn 0.292 0.9 0.6 Mn 0.627 0.2 -0.1 Mn 0.798 -0.2
-15 [32S 1-J - 226.97 - 12.1 [71 s l] (OK) [68sl] - 1.5 [36F l]
4.3 [71 s l] 7.5 [36F l] - 87.3
11.2 [71Sl] (77 K) [68 s l] 3.7 [59A l] 3.8 [71 S l]
Table 17. Magnetic moment distribution for Fe-Ti alloys at room temperature [79 K 143.
Ti at%
hi PB
0.84(l) 2.868 2.146(8) 2.383(9) - 2.08(22) 1.33(3) 2.869 2.132(6) 2.383(8) - 1.42(23) 1.73(5) 2.87 2.118(7) 2.383(11) - 1.38(24)
‘) Derived from bulk magnetization.
Adachi

Ref. p. 4801 1.2.3.1 Fe-Ti 321
3.5 3 G&
9 pe Fe -Ti
3.0
t ::
bee . . RT . . 2 A
2.5 a
t
I$
2.0 Ia" 1
b 1.5
1.0 0
Irg
0.5 1
fi \ -1
0 2.5 5.0 at% 7.5
1.0: Fe Ti -
Ijcm3 Fig. 70. Room-temperature magnetic moments of bee
I
$75 Fe-Ti alloys. &: open triangles; &, pri: circles [79 K 81, squares [76 C 23, solid triangles [65 C 11.
b 0.50
0.25
0 0 2.5 5.0 z5 10.0 12.5 15.0 kOe 20.0 Table 18. Magnetic hyperfine fields for
H OPPl - “Fe in Fe-Ti alloys at room tempera-
Fig. 69. Magnetization curves at various temperatures for ture. See also [64 N 1, 70 B 11. CsCl-type FeTi compound. (a) Alloys vacuum-annealed for 72 h at 1000 “C, no information on the cooling rate ffhyp(57W Ref. [60N 11. Open and solid circles refer to two different samples. (b) Alloys annealed for 4 days at 900 “C, cooled FeTi x 100 kOe 67W2 to room temperature at a rate of 30 “C/h [73 A2]. Fe,Ti 5(3) kOe 62Kl
Table 19. Transition from ferromagnetism in Fe-rich to antiferromagnetism in Ti-rich Fe-Ti alloys [67 W 11. Isomer shift IS, relative to Fe at room temperature. Quadrupole shift dQ, Mijssbauer linewidth 6 and effective hyperfme field Heff for “Fe, TN: NCel temperature.
TN T ZS(RT) ‘) dQ(RV 6 H hyp, &'F4 K K mms-’ mms-’ mms-l kOe
Ti-rich: Fe 0.66%.34 275 RT -0.286(5) 0.404(5) 0.29
20.4 -0.17(l) 1) 0.40( 1) 2) 0.27...0.29 97 “) Fe-rich: Fe 0.69%31 298 247 4,
20.4 CO.25 4) 5)
‘) For Fe on 6h and 2a sites. ‘) For Fe on 2a site. 3, For Fe on 6h site. “) For excess Fe on Ti sites. ‘) Relative to a-Fe at 20K.
Landolt-Bbmsfein Adachi New Seriec 111/19a

322 1.2.3.1 Fe-Ti [Ref. p. 480
Table 20. Change of hypcrfine magnetic field of 57Fe due to the neighboring impurities in Fe-Mn, Fe-V and Fe-Ti alloys (bee phase) [64 W 11. The hyperfine field of “Fe is assumed to be
Hhyp. Fd) = x x NC, ’ N%, ’ H(n, m, ” Ill
with
H(n m) = H,,,,re(0) (1 + Kx) (I+ on + bm) ,
where n and m mean impurity numbers in the nearest neighbor atoms N and those in the second-nearest neighbor atoms N’, respectively, with frequency Nc, and N’c,. f&y,,. r=e (0) is the hypertine field of pure Fe; K, a and b are constants; IS is the isomer shift, in [cm s- ‘1, per nearest-neighbor impurity atom.
Impurity Mn V Ti
l -0.0685 -0.011
K 0.11 IS 0.0001
Fig. 71. Specific heat C, vs. tempcraturc for FcTi. Solid line: best fit to the data of the form C,IT=/?T’+C’/T \vith /?=0.035~10-4cal Ke4 mol-’ and C’=21.5 . 10m4cal K-’ mol-’ [6OS I].
-0.0765 -0.0655 -0.0645 -0.061
0.31 0.055 -0.0061 0.000 I
mJ molK2
6
t k 3
2
-0 25 50 75 100 125 150 K2 175 12 -
Fig. 72. Tempcraturc dcpcndcncc of the molar specific heat C, of Fc,,,Ti,,, and Fe,,,gTi,,,, alloys, plotted as C,/T vs. T2 [77 H 31.
Adachi
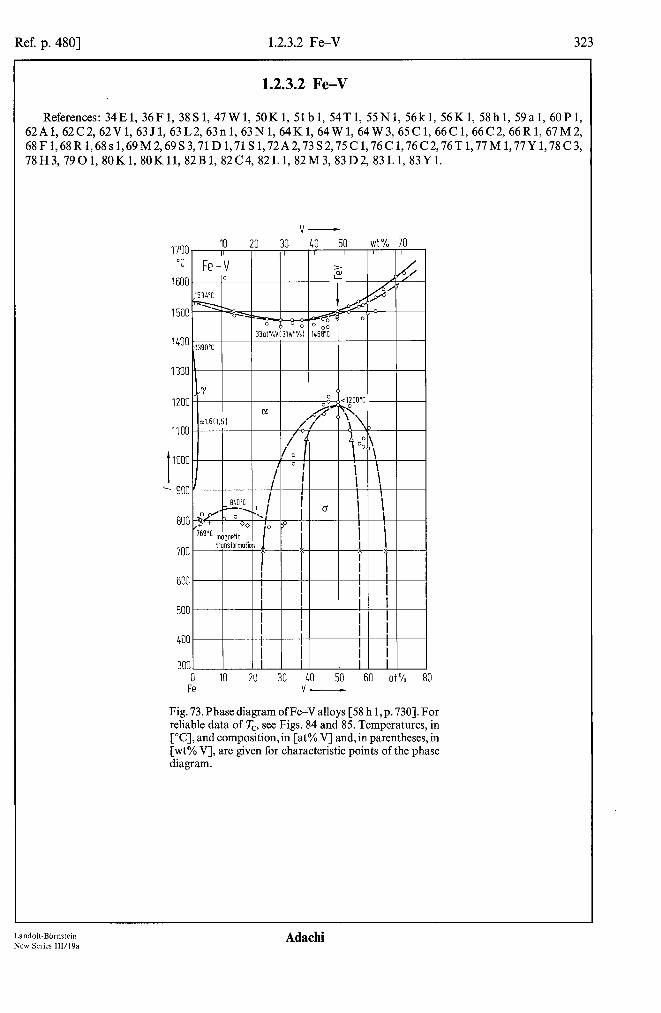
Ref. p. 4801 1.2.3.2 Fe-V 323
1.2.3.2 Fe-V
References: 34E1, 36F1, 38S1, 47W1, 50K1, Slbl, 54T1, SSNl, 56k1, 56K1, 58h1, 59a1, 6OP1, 62A1,62C2, 62V1, 63J1, 63L2, 63n1,63Nl, 64K1, 64W1, 64W3, 65C1, 66C1,66C2,66Rl, 67M2, ~~~~~~~~~~~~~~~~~~~~~~~~~~~~~~~~~~~~~~~~~~~~~~~~~~~~~~~~~~~~~~~~~~~~~~~~~~~~~~~~ 78H3,7901,80Kl, 80Kl1, 82B1, 82C4, 82L1, 82M3, 83D2, 83L1, 83Yl.
600
500
400
3001 I I II II II 0 IO 20 30 40 50 60 at% 80
Fe v-
Fig. 73. Phase diagram ofF*V alloys [58 h 1, p. 7301. For reliable data of T,, see Figs. 84 and 85. Temperatures, in rC], and composition, in [at% V] and, in parentheses, in [wt% V], are given for characteristic points of the phase diagram.
Landolt-Bbmstein Adachi New Series 111/19a
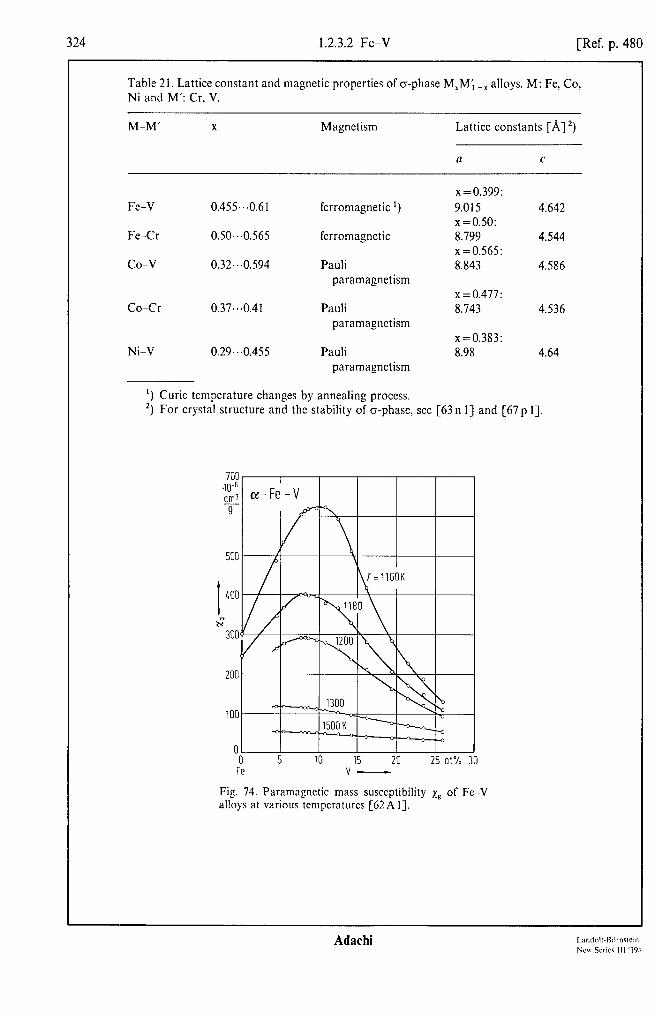
324 1.2.3.2 Fe-V [Ref. p. 480
Table 21. Lattice constant and magnetic properties of o-phase M,M; -I alloys. M: Fe, Co, Ni and M’: Cr, V.
M-M’ X Magnetism Lattice constants [A] 2,
a C
Fe-V 0.455...0.61
Fe-Cr 0.50...0.565
co-v 0.32...0.594
Co-Cr 0.37...0.41
Ni-V 0.29...0.455
ferromagnetic ‘)
ferromagnetic
Pauli paramagnetism
Pauli paramagnetism
Pauli
x =0.399: 9.015 4.642 x =o.so: 8.799 4.544 x=0.565: 8.843 4.586
x = 0.477: 8.743 4.536
x=0.383: 8.98 4.64
‘) Curie temperature changes by annealing process. 2, For crystal structure and the stability of o-phase, see [63 n l] and [67p 1 1,
I A-._ _1150 IOK ---=--.a.- ”
-x.... ^ ^ ^ 0
0 0 5 10 15 20 25 at% 30 Fe v-
Fig. 74. Paramagnctic mass susceptibility xB of Fe-V alloys at various temperatures [62A I].

Ref. p. 4801 1.2.3.2 Fe-V 325
s cm3
1000 1100 1200 1300 1400 K 1500 T-
Fig. 75. Inverse paramagnetic mass susceptibility, xi ’ vs. temperature for Fe-V alloys. Broken line: Fe [62A 11.
2.60 40-2 cm3K
9
‘;rpxi’; 0 5 10 15 20 25 at% 30 Fe v-
Fig. 76. Paramagnetic and ferromagnetic Curie tempera- tures, 0 and Tc, respectively, and the Curie constant per gram, C,, for Fe-V alloys. I: [38 S 11, 2: [34E 11, 3: [62Al].
Table 22. Effective magnetic moment per Fe atom, perr,re, in the paramag- netic state and paramagnetic Curie temperature 0 foro-phase Fe-V alloys [69 M 2-J.
V &ff,Fe 0 Heat treatment at% PB K
40 1.78 185(5) 43 1.42 140(5) 46 1.18 lOO(5) 49 0.90 WJ) 51 0.77 44(5) 53 0.65 W) 55 0.59 O(5) 89 1.82 240(5) 44.5 1.43 188(5) 46.2 1.09 165(5) 47.8 0.98 125(5) 52.8 0.72 18(5) 53.5 0.69 O(5)
quenched into water from 1000 “C
650 “C!, 350 h annealed
Landolf-BOrnstein New Series Ill/ I 9a
Adachi

326 1.2.3.2 Fe-V [Ref. p. 480
I-
i-
100 200 300 400 K ! I-
50 , F 6-k-v H,,,,=BkOe
36.2 at%V I 40
I 30
b 20
10
0
II 0 100 200 300 400 K 500
b I-
ig. 77a. b. Marqctic moment D in a magnetic ticld of kOe and the mvcrse magnetic susceptibility xi’ as zpcndcnt on tempcraturc for o-phase Fe--V alloys. ig. (a) [67 M 21, Fig. (b) [73 S 21.
IF
I li
?7 1C
5
5
2
20. .lO -5 cm
0
5
0
15.
I 12.
LIO. s d
1.l
5s
2.5
0
5
I 0 50 100 150 200 250 K 3
T-
Fig. 78. (a) Magnetic mass susceptibility zs and (b)inverse value ofX,-XO, whcrc 1, is the tempcraturc-independent part of x8. for o-phase Fe-V alloys [69 M 21.
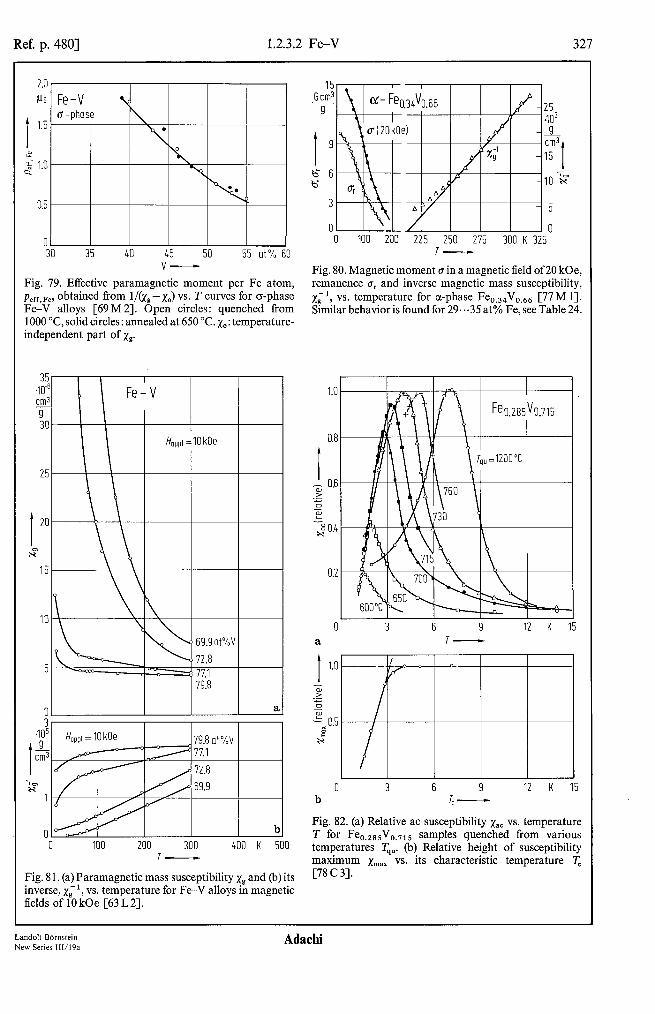
Ref. p. 4801 1.2.3.2 Fe-V 327
0 30 35 40 45 50 55 at% 60
v-
Fig. 79. Effective paramagnetic moment per Fe atom, PenFe, obtained from l/&,-x,) vs. T curves for o-phase Fe-V alloys [69M2]. Open circles: quenched from 1000 “C, solid circles: annealed at 650 “C. x0: temperature- independent part of xg.
25 -IO3 9 cm3 15
I
10 -2
5
II 0 100 200 225 250 275 300 K 325
7-
Fig. 80. Magnetic moment 0 in a magnetic field of20 kOe, remanence err and inverse magnetic mass susceptibility, x;‘, vs. temperature for a-phase Fe,,,,V,,,6 [77M 11. Similar behavior is found for 29...35 at% Fe, see Table 24.
35 .10-' cm: s 3c
25
I 20
G-7
15
IO
5
I I I I 405
I
9 i?
7-
Fig. 81. (a) Paramagnetic mass susceptibility xg and (b) its inverse, xi ‘, vs. temperature for Fe-V alloys m magnetic fields of 10 kOe [63 L2].
1.0
0.E
I 3 0.E .z 2 z 20.4
0.2
3 6 9 12 K 7-
--. I ^ ^ P
I I I
3 6 9 .- 12 K
r, -
J
15
Fig. 82. (a) Relative ac susceptibility xac vs. temperature T for Fe V 0.285 0.715 samples quenched from various temperatures T,,. (b) Relative height of susceptibility maximum xmalr vs. its characteristic temperature T, [78 C3].
Landolt-Bbmstein New Series 111/19a
Adachi
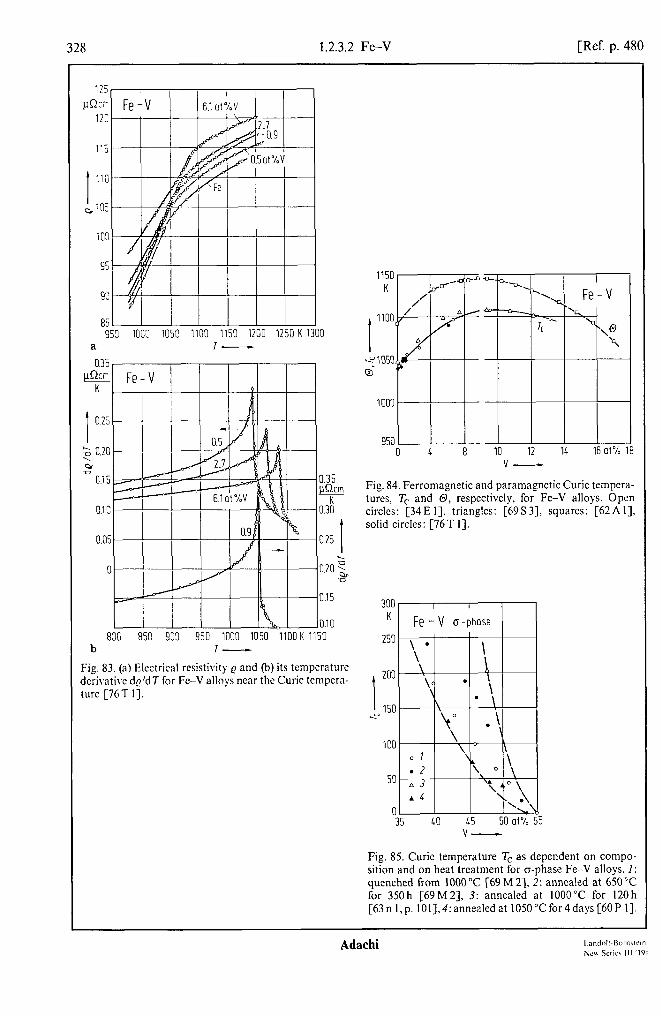
328 1.2.3.2 Fe-V [Ref. p. 480
125 jL!x
12G
115
I
110
,105
103
95
90
8;55 .d 1050 1100 1150 1200 1250 K 1 a I-
301
I 0.25
2 0.20 OI - 0.15 0.35
@g
010 0.3Ko
O.Oi 0.25 .!
0 0.20 y %
0.15
0.10 830 850 903 950 1000 1050 11OOK 1150
b I-
Fig. 83. (a) Electrical resistivity Q and (b) its temperature dcrivativc do/d7 for Fe-V alloys near the Curie tempcra- ture [76T I].
6 8 10 12 16 16 at% v-
Fig. 84. Ferromagnetic and paramagnetic Curie tempera- tures, Tc and 0, respectively, for Fe-V alloys. Open circles: [34 E I], triangles: [69 S 31, squares: [62A I], solid circles: [76T I].
300 I I K Fe-V G-phase
35 LO 45 50 at% v-
Fig. 85. Curie temperature T, as dependent on compo- sition and on heat treatment for a-phase Fe-V alloys. I: quenched from 1000°C [69 M 2],2: annealed at 650 ‘C for 350h [69M2], 3: annealed at 1000°C for 120h [63nl,p. 101],4:annealedat 1050°Cfor4days[60P I].

Ref. p. 4801 1.2.3.2 Fe-V 329
60 K
30
i 20 l-2
10
0 f
I
Fe-V u-phase
71 73 at% v-
Fig. 86. Characteristic temperature T, for the maximum in the x(T) curves as dependent on composition for a-phase Fe-V alloys quenched from 1200 “C [78 C 31.
Table 23. Ferromagnetic and paramagnetic Curie temperatures, Tc and 0, respectively, effective magnetic moment per atom, pefh and the average magnetic moment per atom, &,, as derived from the Curie constant and the spontaneous magnetization, respectively, for o-phase Fe-V and Fe-Cr alloys [68 R 1, 67 M 21.
Peff PB
@ J-4, K PB
T, K
Ref.
Fe V 56.1 43.9 0.205 95 0.866 68Rl Fe V 54.2 45.8 0.180 140 1.017 67M2 Fe V 55.5 44.5 0.222 165 1.139 ~160 67M2 Fe V 61.0 39,0 0.320 230 1.227 x210 67M2 Fe 56.5Cr43.5 0.125 60 0.967 47 68Rl Fe 55.1Cr44.9 0.096 53 0.788 29 68Rl Fe 53.4Cr46.6 0.070 33 0.729 15.5 68Rl Fe51.4Cr4,., 0.041 9 0.716 9 68Rl
Table 24. Ferromagnetic Curie temperature T,, extrapolated spontaneous magnetization crS at 0 K and the Curie constant C, for a-Fe-V alloys. N/N,: percentage of atoms carrying a magnetic moment and p: magnetic moment of the clusters as derived from C, and a, [77 M 11.
Fe [at %] 29 30 31 32 33 34
T, I31 25.4 74 119 151 o,(O K) [G cm3 g- ‘1 4.5 6.0 8.7 11.5 14.6 17.7 C, [cm3 K g-‘1 0.093 0.121 0.153 0.180 0.185 0.230 N/No WI 0.24 0.33 0.55 0.81 1.12 1.50 P bBl 18 17 15 13 12 11
Landolf-Bbmsfein New Series 111/19a
Adachi

330 1.2.3.2 Fe-V [Ref. p. 480
40 Gcm3 I ~ T=OK 9 Fe-V
..3
0 0 I
49 52 55 6001% 64 Fe -
Fig. 87. Spontaneous magnetic moment extrapolated to OK for o-phase Fe-V and Fe-0 alloys. I: [6OP 11, 2: [63 N I]. 3: [67 h4 21. 4: [66 R I]. corrcctcd for cc-phase impurity
2.5
Pa
2.0
I 1.5
1:
1.0
0.5
0 10 20 30 LO 50 60 70 at%
v-
-
-
-
-
-
- 80
Fig. 89. Average magnetic moment per atom, ji,,, for r-Fe-V alloys. as dcrtvcd from magnetization mcasurc- ments extrapolated to 0 K. Open ctrcles: [63 N I], solid :ircles: [36F I].
0.4 Gcm3
9
I
cl.295"0.705 tr-phase I I
I 0.2 b
10" 0 5 10 15 20 K 25
I-
Fig. 88. (a) Magnetic moment G vs. temperature in a magnetic field of 300e for u-phase Fe,,,g5V0.,05. Solid circles: cooled in a field of 30e, open circles: heating after zero-field cooling to 4.2 K, dashed line: ac susceptibility, in relative units, in a ficld of 0.1 Oe. (b) Isothermal remanence err vs. temperature for z-phase Fe ,,295V0.705 and Fe,,,,,V,,,,, samples cooled in zero field. At each temperature a field of 2000e was sub- sequcntly applied. The low-field ac susceptibility shows a sharp peak at T, [75C I]. Inset: magnetic isotherm at 5SK for u-phase Fe,,,,,V,,,,s for increasing and de- creasing magnetic field strength, respectively. The cx-phase samples were annealed at 1200°C for 4 days. then water quenched.
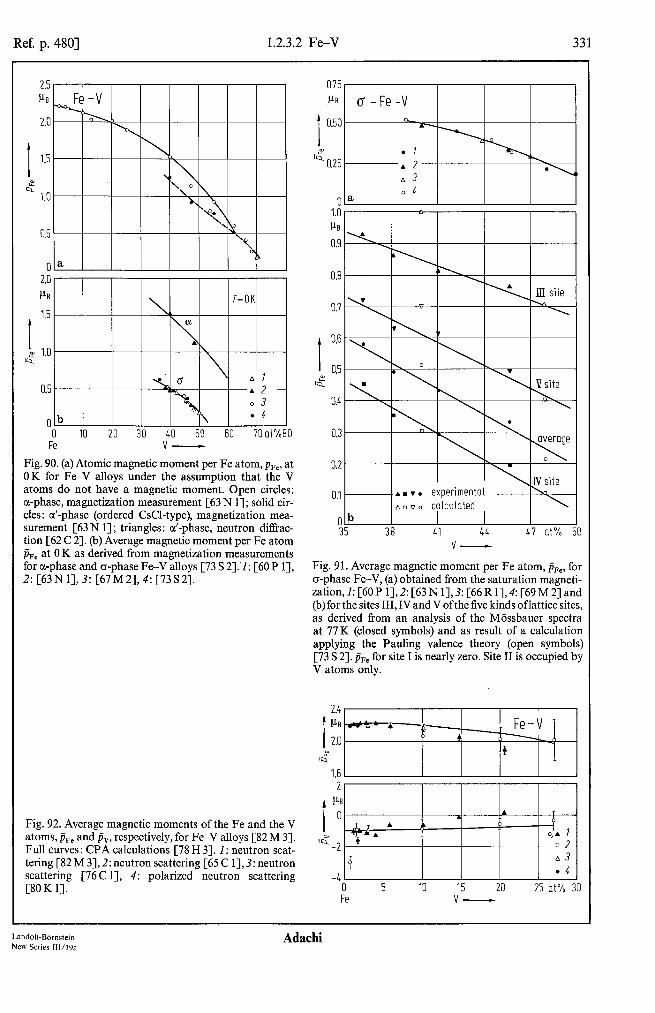
Ref. p. 4801 1.2.3.2 Fe-V 331
2.5 I-‘s
2.0
I 1.5
Y 4 1.0
0.5 ‘$
b 0”
0 10 20 30 40 50 60 70 at%80 0.3 Fe v-
Fig. 90. (a) Atomic magnetic moment per Fe atom, PFe, at OK for FeV alloys under the assumption that the V atoms do not have a magnetic moment. Open circles: a-phase, magnetization measurement [63 N 11; solid cir- cles: cl’-phase (ordered CsCl-type), magnetization mea- surement [63 N l] ; triangles: a/-phase, neutron ditfrac- tion [62 C 21. (b) Average magnetic moment per Fe atom jFe at 0 K as derived from magnetization measurements for a-phase and o-phase Fe-V alloys [73 S 21.1: [6OP 11, 2:[63N1],3:[67M2],4:[73S2].
Fig. 92. Average magnetic moments of the Fe and the V atoms, PFe and j!v, respectively, for Fe-V alloys [82 M 31. Full curves: CPA calculations [78 H 31.1: neutron scat- tering [82 M 3],2: neutron scattering [65 C 1],3: neutron scattering [76 C 11, 4: polarized neutron scattering [8OK 11.
I 0.6
0.5 1:
0.4
Am V. experimental no v. calculated
Olb 35 38 41 44 47 at% 50
v-
Fig. 91. Average magnetic moment per Fe atom, &, for o-phase Fe-V, (a) obtained from the saturation magneti- zation,I:[60P1],2:[63N1],3:[66R1],4:[69M2]and (b) for the sites III, IV and V ofthe five kinds oflattice sites, as derived from an analysis of the Mijssbauer spectra at 77K (closed symbols) and as result of a calculation applying the Pauling valence theory (open symbols) [73 S 21. jFe for site I is nearly zero. Site II is occupied by V atoms only.
2.4
I
PB -#He-- +- ! Fe-V - 2.0 I
IQ2 I
1.6 2 I I I I I I
I
PB 0
-41 -4
0 0 5 5 IO IO 15 15 20 20
l 4
25 25 at% at% 30 30 Fe v-
LandobB6mstein New Series III/I%
Adachi
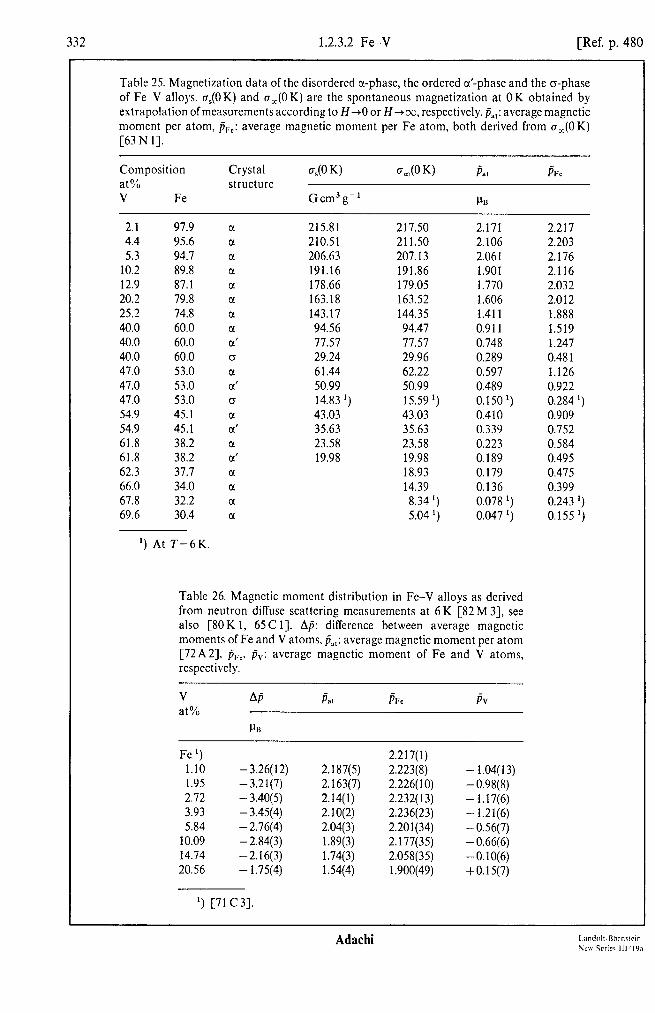
332 1.2.3.2 Fe-V [Ref. p. 480
Table 25. Magnetization data of the disordered cl-phase, the ordered cr’-phase and the o-phase of Fe-V alloys. a,(OK) and cr,(OK) are the spontaneous magnetization at OK obtained by extrapolation ofmeasurements according to H-0 or H+oo, respectively. &,: average magnetic moment per atom, pFc: average magnetic moment per Fe atom, both derived from a,(OK) [63 N 11.
Composition at% V Fe
Crystal structure
40 K) a,(0 K) A, PFC
Gcm”g-’ PB
2.1 97.9 4.4 95.6 5.3 94.7
10.2 89.8 12.9 87.1 20.2 79.8 25.2 74.8 40.0 60.0 40.0 60.0 40.0 60.0 47.0 53.0 47.0 53.0 47.0 53.0 54.9 45.1 54.9 45.1 61.8 38.2 61.8 38.2 62.3 37.7 66.0 34.0 67.8 32.2 69.6 30.4
215.81 210.51 206.63 191.16 178.66 163.18 143.17 94.56 77.57 29.24 61.44 so.99 14.83 ‘) 43.03 35.63 23.58 19.98
217.50 2.171 2.217 211.50 2.106 2.203 207.13 2.061 2.176 191.86 1.901 2.116 179.05 1.770 2.032 163.52 1.606 2.012 144.35 1.411 1.888 94.47 0.911 1.519 77.57 0.748 1.247 29.96 0.289 0.481 62.22 0.597 1.126 50.99 0.489 0.922 15.59 ‘) 0.150 ‘) 0.284 ‘) 43.03 0.410 0.909 35.63 0.339 0.752 23.58 0.223 0.584 19.98 0.189 0.495 18.93 0.179 0.475 14.39 0.136 0.399 8.34 ‘) 0.078 ‘) 0.243 ‘) 5.04 ‘) 0.047 ‘) 0.155 ‘)
‘) At T=6K
Table 26. Magnetic moment distribution in Fe-V alloys as derived from neutron diffuse scattering measurements at 6 K [82 M 31, see also [8OK 1, 65C 11. AD: difference between average magnetic moments of Fe and V atoms, pa,,: average magnetic moment per atom [72A2], fiFp, pv: average magnetic moment of Fe and V atoms, respectively.
V at%
AF Pa, PFC PV
PB
Fe ‘) 2.217(l) 1.10 -3.26(12) 2.187(5) 2.223(8) - 1.04( 13) 1.95 -3.21(7) 2.163(7) 2.226( 10) -0.98(8) 2.72 - 3.40(5) 2.14(l) 2.232( 13) - 1.17(6) 3.93 - 3.45(4) 2.10(2) 2.236(23) - 1.21(6) 5.84 - 2.76(4) 2.04(3) 2.201(34) - 0.56(7)
10.09 - 2.84(3) 1.89(3) 2.177(35) -0.66(6) 14.74 -2.16(3) 1.74(3) 2.058(35) -0.10(6) 20.56 - 1.75(4) 1.54(4) 1.900(49) + 0.15(7)
1) [71 c 33.
Adachi
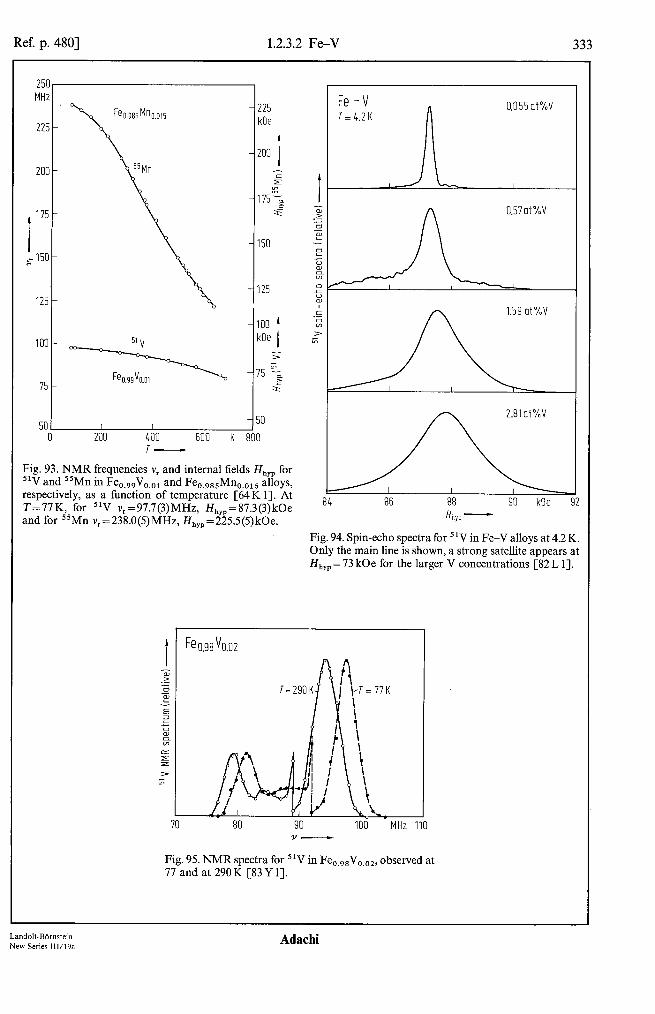
Ref. p. 4801 1.2.3.2 Fe-V 333
MHz
125 -
- 225 kOe
-200 1
-P r
-17s;e a
-150
- 125
-100 kOe I
7
-75 4 G
- 50 501 I I I
0 200 400 600 K 800 I-
Fig. 93. NMR frequencies Y, and internal fields Hhyp for 51V and 55Mn in Fe,,,,V,,,, and Fe,,,,,Mn,,,,, alloys, respectively, as a function of temperature [64K 11. At T=77 K, for 51V v,= 97.7(3)MHz, HhyP= 87,3(3)kOe and for 55Mn v,=238,0(5)MHz, H,,,=225,5(5)kOe.
_;A
: 86 90 kOe 88
Hhyp -
92
Fig. 94. Spin-echo spectra for ‘lV in Fe-V alloys at 4.2 K. Only the main line is shown, a strong satellite appears at Hhyp = 73 kOe for the larger V concentrations [82 L 11.
Fe 0.98V0.02
70 80 90 100 MHz 1 V-
Fig. 95. NMR spectra for 51V in Fe,,,sV,,,,, observed at 77 and at 290 K [83 Y 11.
Land&-Bdmsfein New Series llVl9a
Adachi

334 1.2.3.2 Fe-V [Ref. p. 480
Table 27. Hyperline magnetic field HhrF and full line width at half maximum, AH,,,. of the main NMR line for “V in Fe-V alloys at 4.2 K [82 L 11.
V at%
Hhrp
kOe
AHtw
0.055 87.3 0.25 0.102 87.3 0.3 0.22 87.4 0.4 0.57 87.4 0.8 1.59 87.6 1.7 2.89 87.9 2.4 8.7 ‘) 88.0 7.0
18.4 ‘) 85.0 11.0
‘) [7l D 11.
Table 28. Magnetic hyperline field Hhrp at Fe atoms and the magnetic moment pFe for various sites of the crystal structure for Fe-V and Fe-Cr o-phase alloys, as derived from Mijssbauer spectra at T= 77 K. jFc is the average Fe moment derived from magnetic satura- tion measurements [73 S 21.
X Site Hhs$‘Fe) PFe ~Fc
kOe PB p’n
h -xVx 0.457 I 0 0 0.33 III 61 0.76 IV 16 0.19 V 38 0.49
Fe, -xVx 0.411 I 0 0 0.43 III 86 0.81 IV 31 0.29 V 65
0.382 I 0 III 119 IV 47 V 86
0.362 I 0 III 135 IV 65 V 103
0.468 I 0 III 39 IV 15
0.61 0 0.49 0.86 0.35 0.63 0 0.58 0.93 0.45 0.72 0 0.14 0.25 0.10
Table 29. Paramagnetic susceptibility xr, Knight shift K for “V, NMR line width AH,,, at 7.545 MHz (measured between derivative maxima) and lattice parameter o for Fe-V alloys [63 L 21. For < 20 at% Fe, xp is independent of the measuring field up to H,,,, = 11 kOe.
Fe %P K (“V) AHh at % 10-6cm3g-1 % Oe
298 K 17K 298 K 298 K 298 K
V 5.63 2 5.45 7 5.30 9.9 5.05
15.5 4.30 20.2 4.20 22.9 4.35 27.2 5.75 27.7 6.00 30.1 7.60 30.4 8.35 31.0 10.20 32.2 11.30 34.0 18.30
0.567(6) 10.5(10) 3.029( 1) 0.567(6) 10.7(6) 0.584(6) 11.1(6)
5.15 0.586(6) 11.2(6) 3.004( 1) 4.55 0.596(6) 11.3(6) 4.60 0.593(6) 11.5(6) 2.970( 1) 6.09 0.584(10) 12.4(12)
23.00 0.536(10) 15.1(12)
76.00 0.481(16) 18.0(19) 2.947( 1)
Adachi I.andolr.Rnrnctcin War Series III ‘19a

Ref. p. 4801 1.2.3.2 Fe-V 335
0.5 PB
0
-0.5
t -1.0
6 -l.F:
-2s
-2:
-3s
II I I I
I I
I
-70 -100 I 0 I z ot% 3
kOe v-
Fig. 96. Magnetic hyperfine field H,, of the main line in -80 I
the NMR spectra for 2
‘IV in Fe-V alloys at 4.2K, solid -, Hh,&4.ZK1
*. -_ n -H circles: [SZL 11, open circles: [71 D 11, and average Z-90. magnetic moment ofa V atom, jiv, squares: [65 C 11, open triangle: [76 C 21, crosses: [77 Y 11, lozenges: [SO K 11, -100 solid triangles: [82 M 33. 0 5 IO 15 20 25 at%
Fe v-
Fig. 97. Room-temperature magnetic hyperfine field Hhyp as derived from Miissbauer spectra for 57Fe in Fe-V and Fe-Cr alloys [63 J 11.
Fe V,Cr -
Landolr-Bbmstein Adachi New Seriec IWl9a
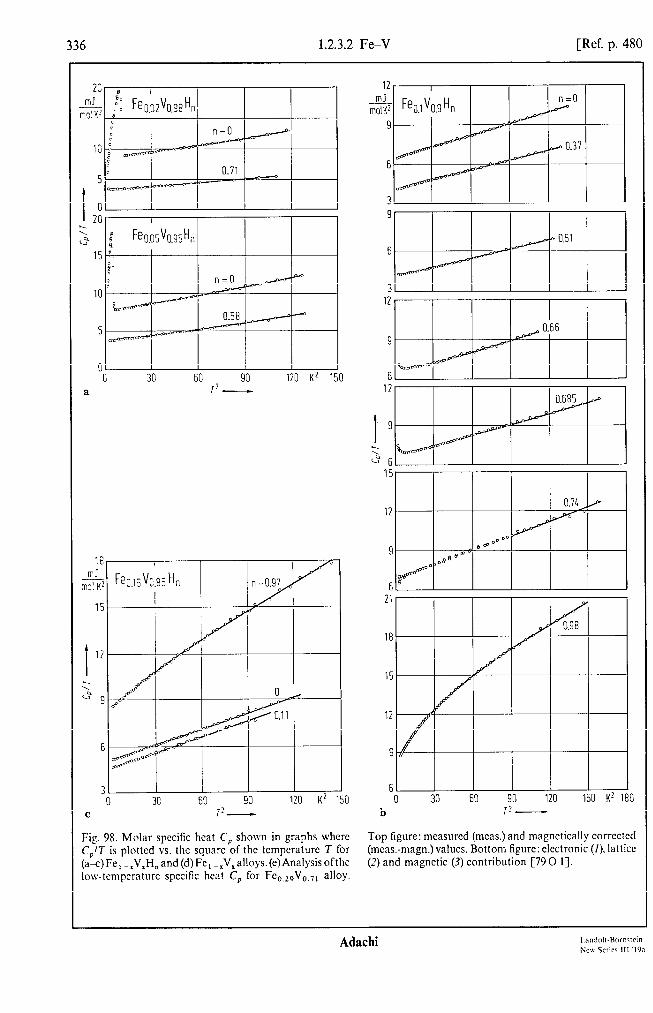
336 1.2.3.2 Fe-V [Ref. p. 480
20 mJ
mo!K!
0 30 60 90 120 K' 150 a
18 mJ
m;! K*
15
I 12
z 2 9
6
3 1 0 30 60 90 120 K2 150
C I*-
Fig. 9s. Molar specific heat C, shown in graphs where C&T is plotted vs. the square of the temperature T for (aec)Fe, -,V,H,and(d)Fc, -,V,alloys.(e)Analysisofthc low-temperature spccitic heat C, for Fc,,,,V,,,, alloy.
6
6 12
6
6 0 0 30 60 30 60 120
192O- 150 150 K2 180 K2 180
b b
Top figure: measured (mcas.) and magnetically corrected (mcas.-magn.)values. Bottom ligurc: electronic (I). lattice (2) and magnetic (3) contribution [79 0 I].
Top figure: measured (mcas.) and magnetically corrected (mcas.-magn.)values. Bottom ligurc: electronic (I). lattice (2) and magnetic (3) contribution [79 0 I].
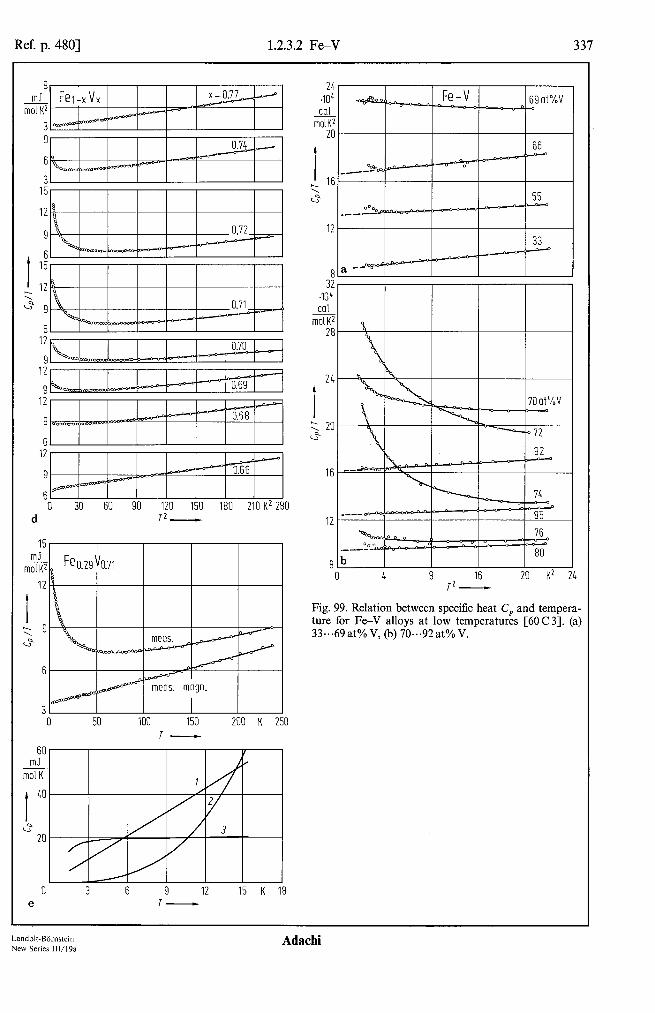
Ref. p. 4801 1.2.3.2 Fe-V 331
9 -!!L mol K*
3 9
6
3 15
12
9
I
Ii
: 12
c3" 9
6 12
9
12
9
6 0 30 60 90 120 150 180 210 K2 280
d T2-
Fe0.29 V0.71 ’ I I I
0 50 100 150 200 K 250
60 mJ
mol K
I
40
2 20
0 e
24 40"
c[1[ mol Ki
20
I =.
16
LY
12
3; 404 CO1
mol K2 28
2L
I ? 20 s
16
12
8
oo,, ” ” - Fe-V 69 at%V
0 8 16 T2-
70 at%V -
'72
.2L
76 ze
80
2c I K2
Fig. 99. Relation between specific heat C, and tempera- ture for Fe-V alloys at low temperatures [60 C 31. (a) 33,..69at%V, (b) 70...92at%V.
3 6 9 12 15 K 18 T-
Landolt-BOrnstein New Series 111/19a
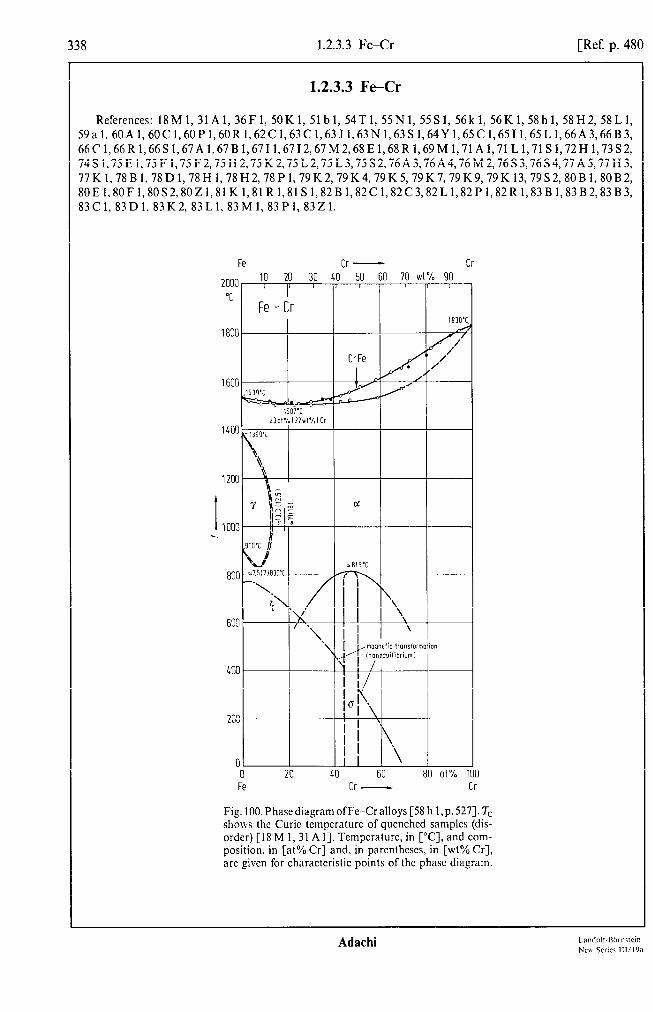
338 1.2.3.3 Fe-Cr [Ref. p. 480
Cr -
LOO
203
0
Fe-Cr 1 I I
20 LO 60 80 at% Fe Cr - Cr
Fig. lOO.PhasediagramofFe-Cralloys [58 h l,p.527]. Tc shows the Curie tempcraturc of qucnchcd samples (dis- order) [IS M 1, 31 A I]. Tempcraturc, in [“Cl, and com- position. in [at% Cr] and, in parcnthcscs, in [wt% Cr], arc given for characteristic points of the phase diagram.
Adachi

Ref. p. 4801 1.2.3.3 Fe-Cr 339
325 325 .10-f .10-f cm3 cm3 - - mol mol
275 275
I I 250 250
x' x' 225 225
200 200
175 175
150 0 5 IO 15 20 25 ot% 30 Cr Solute -
Fig. 101. Magnetic molar susceptibility x,,, at room temperature (and at 66 K for V) as dependent on compo- sition for alloys of Cr with V, Mn, Fe, Co [60 C 11.
270 w cm3 - mol
250
230
I
220
x' 210
200
190
180
170
160
150 0 50 100 150 200 250 K 300
Fig. 102. Magnetic molar susceptibility x,,, vs. temperature T for alloys of Cr with V, Fe, Co [SS L 11.
7” ’ pncrn Fe - Cr I I I I I I
0 50 100 150 200 250 300 K 350 T-
Fig. 103. Temperature dependence of the resistivity Q and the reciprocal of the magnetic mass susceptibility, xg. re = xp - xg.cr, for Fe-Cr alloys. xB,cr is the Cr suscepti- bility; ?g,Fe IS considered to be the contribution to the susceptibility of the alloys due to Fe [75H2]. See also Fig. 104.
Land&Bdmstein New Series 111/19a
Adachi

340 1.2.3.3 Fe-Cr [Ref. p. 480
7-
i
j-
I-
t < 3, 0 100 150 200 250 300 K :
T
Fig. 101. Inverse mass susceptibility contribution I,:,. originating from the Fc atoms in Fe-Cr alloys as a function of temperature T [65 I I].
40 .lO’ -5 CiX!
0 50 100 150 200 250 K : I-
2c w cm? T
16
I 12
SF” 8
50 100 150 200 250 K : I-
Fig. 105. Low-field (Hnppl= 1 kOe) paramagnetic mass susceptibility xg vs. temperature for Fe,,,,Cr,,,, and FC o.142Cro.~~~ alloys PO B 11.
3.91 .10-;
F
3.89
3.88
3.87 .~ 4.700
4.675 I -
I 4.650 I Ii
x” \
L.625 I
/ /
2,22at%Fe I I
5.85
5.80
I 5.65 230 240 250 260 270 280 290 300 K 310
I- Fig 106. Invcrsc mass susceptibility x; ’ vs. tcmpcraturc for o-phase Fe--Cr alloys. corrected for the influence of minor impurities of cr-phase (less than 0.1%) [68 R I].
Fig. 107. Magnetic mass susceptibility xs vs. temperature at the magnetic transitions in dilute Fe-0 alloys [82 B I].
Ada&i

Ref. p. 4801 1.2.3.3 Fe-Cr 341
250 K
200
Table 30. Effective magnetic mo- mm Peff and paramagnetic Curie temperatures 0 of Fe im- purities in Cr. Paramagnetic sus- ceptibility of the alloy x =xcr +Ax, where Ax is attributed to the impurity, Ax = C,/( T- 0) [66S 11.
Fe Peff 0 at% PB “C
Cr Fe -
Fig. 108. Paramagnetic Curie point 0 and effective Bohr magneton peff, obtained from the magnetic susceptibility, vs. composition for Fe-Cr alloys. The notations, (l) and (h), indicate data obtained from low- and high- temperature parts of the susceptibility, respectively [65 I 11. Dashed lines: calculated.
Table 31. Effective magnetic moment peff, Curie constants per unit of mass, C,, and paramagnetic Curie temperature 0 for FeCr alloys [8OB 11.
Fe 0 c, Peff at% K Gcm”Kg-’ PB
12 96 0.03565 3.1(2) 14.2 102 0.05349 4.0(2)
Table 32. Ferromagnetic and paramagnetic Curie temperatures, T, and 0, respectively, ofo-phase Fe-Cr and Fe-V alloys. Average magnetic moment per atom, pa,, derived from the spontaneous magnetization and effective magnetic moment per atom, peff, derived from the Curie constant [68 R 1, 67 M 21.
Cr V T, Pat 0 Peff
at % K PB K PB
43.5 - 47 0.125 60 0.967 44.9 - 29 0.096 53 0.788 46.6 - 15.5 0.070 33 0.729 48.6 - 9 0.041 9 0.716 - 43.9 0.205 95 0.866 - 45.8 0.180 140 1.017 - 44.5 x160 0.222 165 1.139 - 39.0 x210 0.320 230 1.227
-72 -29 -20 -3
27
Land&Bbmstein New Series HI/I%
Adachi

1.2.3.3 Fe-Cr [Ref. p. 480
0 10 20 30 40 50 60 70 at%80 Fe Solute -
1 OX I K,
I ‘
" Fe- Sn 1w o
c 1033 0 2.5 5.0 7.5 10.0 12.5 15.0 at% 20.0 Fe Solute -
liC3 .__ K --
l --- --s.yy; Fe- Si
9:: -
7X
0 5 10 15 20 25 30 35ot%40 Fe Solute -
Fig. 109. Ferromagnetic Curie tempcraturc as a function of composition for alloys of Fe with V, Cr and other clemcnts [36 F I].
Fi_r. 110. h4a_cnctic phase diagram for Fe-Cr alloys [83 B 21. Fcrroma_rnctic boundary: Solid circles: [83 B 23. open circles: [75 L 21. triangles (upward): [7.5 S 21. trian- gles (downward): [77A 51. Antiferromagnctic boundary: solid circles: [78 B I]. other symbols: data compiled in [78 B I]. Spin-glass alloys: characterized by tcmpcraturc ‘& ofsusceptibility peak [83 B I, 83 B 21. Complex magnc- tic properties in the hatched region [83 B 21. The broken cun~ rcprcscnts the spin-flip temperature T,,. I(L): trans- verse (longitudinal) incommensurate spin density wave state. C: commensurate spin density wave state.
Table 33. Magnetic transition temperatures and latent heats for Fe-0 alloys in the low Fe concentration part of the phase diagram [82B I]. For latent heats, see also [79 K 2, 76 S 31. I: incommensurate spin density wave, C: commensurate spin density wave, P: paramagnetic.
Fe at%
Transition TN K
Latent heat Jmol-’
Cr I-P 311 1.1 1) 1.20 I-P 292 1.3 2.22 I-P 254 1.2 2.22 C-I 248 0.4 3.35 C-P 252 12.6
‘) [75B I].
Table 34. Ferromagnetic Curie temperature for Fe-Cr alloys, determined by neutron critical scattering and by low-field magnetization measurements [83 B 21.
Fe at%
T, WI
critical scattering magnetization
25 148 145(3) 24 122 - 21.7 84 - 20.8 72 70(3) 19.9 55(5) 55(5) 19.5 45(5) 44(3)
350,
K I Fe,Crl-, I I I I I I I I I I LI I
J P
4
0.05 0.10 0.15" QO.20 0.25 C-
Adachi
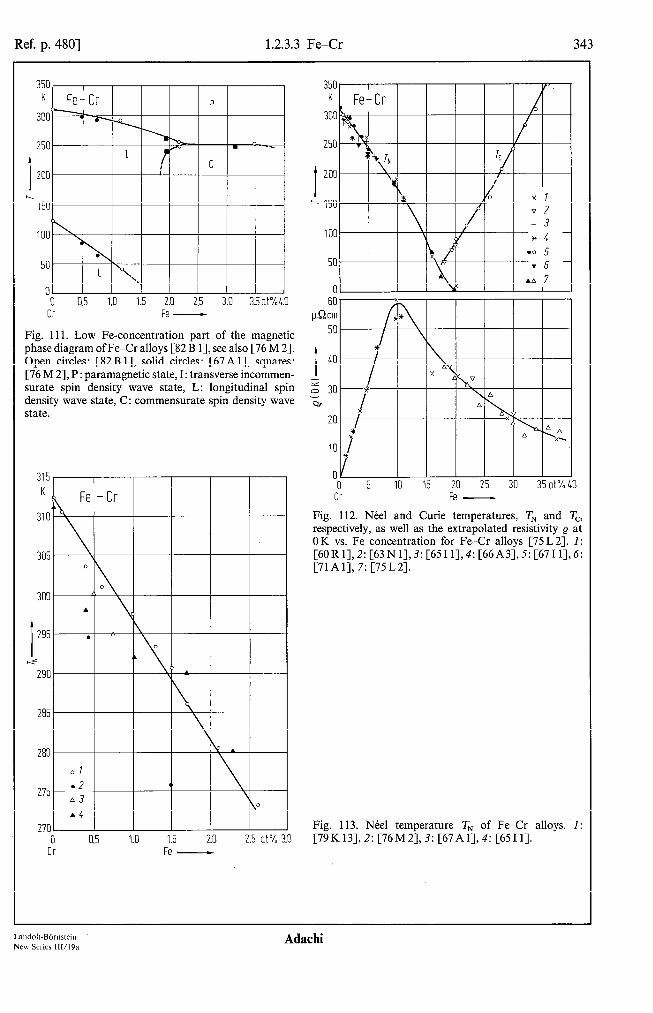
Ref. p. 4801 1.2.3.3 Fe-Cr 343
KIFe-Crl I I IPI I I 300
250
! 200
150
100
50 y\ \
0 0 0.5 1.0 1.5 2.0 2.5 3.0 3.5at%4.0
Cr Fe -
Fig. 111. Low Fe-concentration part of the magnetic phase diagram ofFe-Cr alloys [82 B 11, see also [76 M 21. Open circles: [82B 11, solid circles: [67Al], squares: [76 M 21, P : paramagnetic state, I: transverse incommen- surate spin density wave state, L: longitudinal spin density wave state, C: commensurate spin density wave
0 0.5 1.0 1.5 2.0 2.5 at% 3.0 Cr Fe -
KIFe-CrI I I I I A I P
I
k
I
200 I I d x I
02
60 p&cm
50
I 40
2 30 a.
20
10
0 0 5 IO 15 20 25 30 35 at% 40
Cr Fe -
Fig. 112. NCel and Curie temperatures, TN and Tc, respectively, as well as the extrapolated resistivity Q at OK vs. Fe concentration for Fe-Cr alloys f75 L2]. I: [60R1],2:[63N1],3:[6511],4:[66A3j,.5:[67Ii],6: [71Al], 7: [75L2].
Fig. 113. NCel temperature TN of Fe-Cr alloys. I: [79K13], 2: [76M2], 3: [67Al], 4: [6511].
Land&Bbmstein New Series 111/19a
Adachi
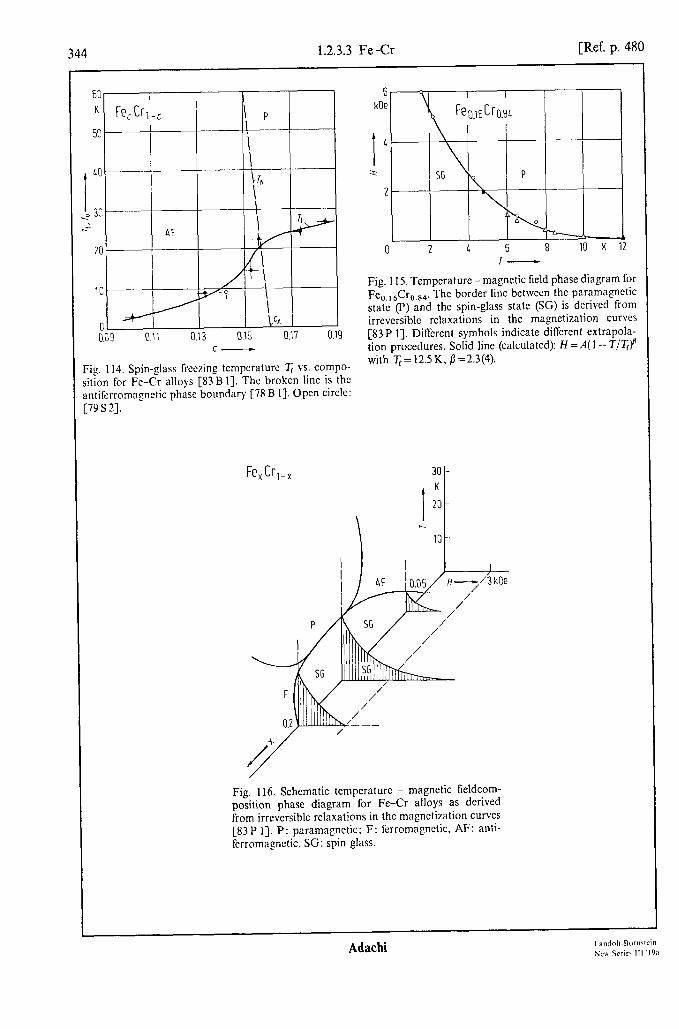
344 1.2.3.3 Fe-G [Ref. p. 480
C- C-
Gg. 114. Spin-glass freezing tcmpcraturc Tr vs. compo- Gg. 114. Spin-glass freezing tcmpcraturc Tr vs. compo- ition for Fe-Cr alloys [83 B 11. The broken lint is the ition for Fe-Cr alloys [83 B 11. The broken lint is the ntifcrromagnctic phase boundary [78 B I]. Open circle: ntifcrromagnctic phase boundary [78 B I]. Open circle: 79sq. 79sq.
t I 10 I I I ! I
6 kOe
0 2 6 8 10 K I-
12
Fig. 115. Temperature-magnetic field phase diagram for Fe o.16(=ro.84. The border line between the paramagnetic state (P) and the spin-glass state (SC) is derived from irrcvcrsiblc relaxations in the magnetization curves [83P I]. Different symbols indicate different extrapola- tion procedures. Solid line (calculated): H = A( 1 - T/T,)B with T,= 12SK, fi=2.3(4).
Fe, Cr,-,
Fig. 116. Schematic tempcraturc - magnetic tieldcom- position phase diagram for Fe-Cr alloys as derived from irrcversiblc relaxations in the magnetization curves [83P 13. P: paramagnctic; F: ferromagnetic, AF: anti- ferromagnetic, SC: spin glass.
Adachi

Ref. p. 4801 1.2.3.3 Fe-Q
I.! Gem -
9
I
IS
b 0.t
[ 4s
Gem 9
3s
t b 2s
IS
10: Gem:
9
1.5
I b 5s
2.5
2: Gem: s
IF:
I IO b
Cr- 9at%Fe 1 I I T =I.2 K
Cr-15at”/ Fe InI I r-onir
5 10 15 20 kOe
0.1251
O.025b
0.16 PB
0.12
t 1: 0.08
0.04
0 0 IO 20 30 40 kOe 50
H OPPl -
Fig. 118. Average magnetic moment per atom, &,vs. applied field H,,, for (a) Fe,,,&,,, and (,b) Fe 0,142Cr0,s58 alloys at various temperatures [SOB 11.
Fig. 117. Magnetization curves for various Fe-Cr alloys at different temperatures: (a) 4.7 at% Fe, (b) 6 at% Fe, (c) 9 at% Fe, (d) 15 at% Fe. The remanence found for two specimens is attributed to a small Fe contamination [65 I 11.
Landolt-Bdmstein New Series 111/19a
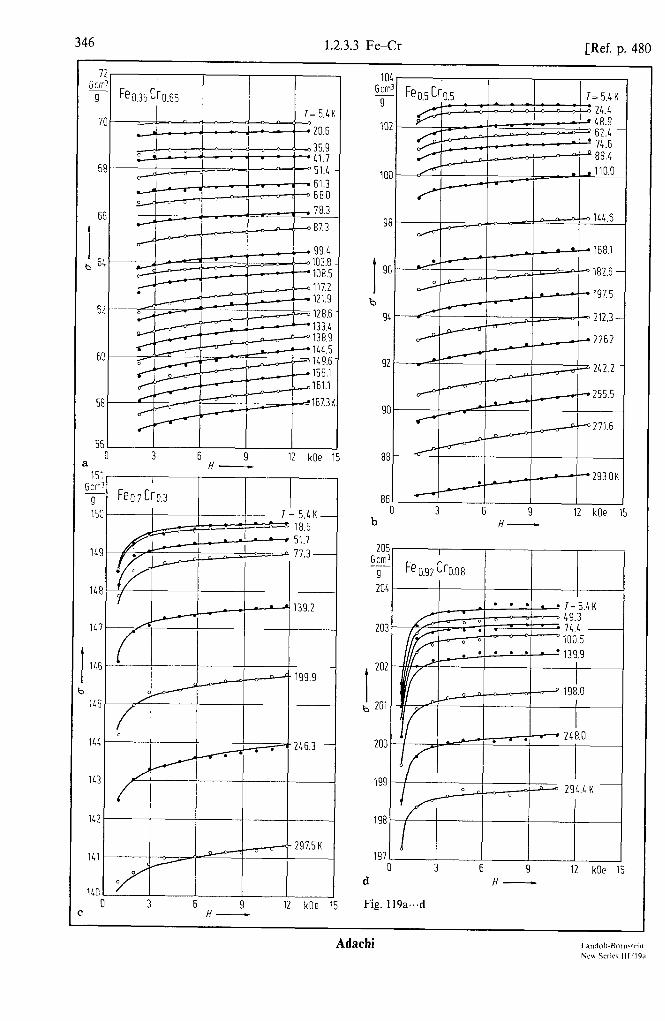
346 1.2.3.3 Fe-Cr [Ref. p. 480
7 Gem
9
71
2- ? I
h.35 Cr0.65
3 -!
6t
! - o-;‘& - 1 ” - ’ 335.9 si------ - - 1 - ! '11.7
3 4 51.4 d--e ; j _ _ _ . - a 061.3
6t
I b 6:
-a.--& 117.2
62
6:!
121.9 128.6 133.4 138.9 wt.5 149.6 155.1 161.1
58
55
3
I I I I I 0 3 6 9 12 kOe
151 Gem'
g 151
14:
1LE
117
145
145
14L
lL3
lL?
1Ll
110 I:
-- 199.9
I 3 6 9 12 kOe 15
101 Gem
9
10;
I
9E
b
94
90
86 I
b
- j 0 lU.6 4 --+-I I
168.1
182.6
197.5
212.3-
226.2
- - ‘293.0H . -----
3 6 9 12 kOe H-
205 I Gcm3 ,- n g teo.92 Lro.08
2041Ll
200
199
198
197 0 3 6 9 12 kOe 15
d H-
Fig. 119a...d

Ref. p. 4801 1.2.3.3 Fe-Cr 347
4
Fig. 119. Field dependence of the magnetic moment per unit of mass, c, for Fe-Cr alloys at various temperatures C76A41:(a)Fe,,,,Cr,.,,,(b)Fe,,,Cr,.,,(c)Fe,,,Cr,.,,(d) Feo.92%.08.
1.1 IT
0.1 3-
I 0.E I-
e ,
$ ox
,- 0.1
[ IS ia
0.t I-
I 0.t j-
F YI
x O! ;
0; !-
c II! 0 0.2 0.4 0.6 U.8 l.u
7/r, -
Fig. 121. Temperature dependence of the normalized saturation magnetization M, for Fe-Cr alloys. M,, is the magnetization extrapolated to T= 0. The measurements were carried out between 4.2K and 300K and either with (a) steady magnetic fields up to 40 kOe or (b) pulsed fields up to 150 kOe [83 R 11.
80
y FecCrl_, r-
60
I b” 40
20
I I
0 0 .OE 30
-
,’
---I 0.20 0.25 0.30 0.35 0.40 C-
Fig. 120. Extrapolated zero-field saturation magneti- zation of Fe-Cr alloys at various temperatures [75 L 23. T=4K: crosses: [63N 11, squares: [6511], triangles: [75L2]; T=77K and 300K: [75L2].
01
0
0 %a OB,,O, ~~ o
150 300 450 600 750 “C 900
Fig. 122. Magnetic moment vs. temperature for Fe-Cr alloys. Solid circles : annealed for 150 h at 500 “C, open circles: quenched in water from 1100 “C [64 Y 11.
Landolt-Bdmstein New Series HI/l%
Adachi
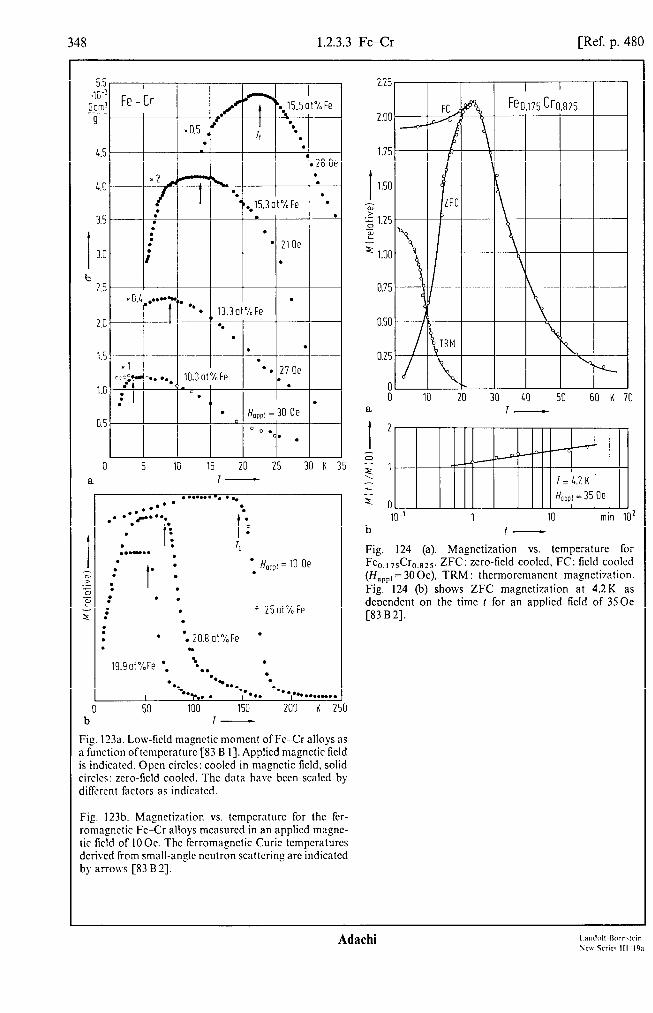
1.2.3.3 Fe-Cr [Ref. p. 480
3.5
I 3.0
b
0 5 10 15 20 25 30 K 35 a l-
. I: ..bon.. . 1, .
: I
. l l HOPl, = 10 Oe . .
. . . . :
. .
: . l 25ol%Fe .
: . . : 20.8 ol%Fe '
-I
l *5 -*.. . l - 0.. -0. I l . . , 00. l ,** . . . . m..
b0 50 100 150 200 K 2 l-
Fig. 123a. Low-field magnetic moment of Fe-Cr alloys as a function oftempcraturc [83 B I]. Applied magnetic field is indicated. Open circles: cooled in magnetic ticld, solid circles: zero-field cooled. The data have been scaled by different factors as indicated.
Fig. 123b. Magnetization vs. tcmpcraturc for the fcr- romqnctic Fe-Cr alloys mcasurcd in an applied magnc- tic field of IO Oe. The ferromagxtic Curie tcmpcraturcs dcrivcd from small-angle neutron scattering arc indicated by arrows [83 B 21.
2.25
0.25
0 IO 20 30 LO 50 60 K 70 a
I
2
;; f '
F I: lo-' 1 10 min 10'
b f-
Fig. 124 (a). Magnetization vs. temperature for Fe,,,,,Cr,,,,,. ZFC: zero-Iicld cooled, FC: field cooled (H npp, = 30 Oe), TRM : thcrmoremanent magnetization. Fig. 124 (b) shows ZFC magnetization at 4.2K as dependent on the time t for an applied field of 350e [83 B 21.
Adachi

Ref. p. 4801 1.2.3.3 Fe-Cr 349
0.1 Gem -
9
a.:
I b 0.;
0.l
a
I I I I I
// ///
0 50 100 Oe 1 H-
t b
0 0.4 0.8kOe
O 0.5 kOe 1
Fig. 125. Hysteresis loops for Fe-Cr alloys at 4.2K [83B2]. (a) 17.5at%Fe, zero-field cooled (ZFC) and field cooled (FC), (h) 17.5 at% Fe, ZFC for higher fields, (c) 25 at% Fe, ferromagnetic ZFC alloy.
!j!$ 56.5chFe 9 \
Fe - Cr b-phase I I
141 I I
12 H,,,1=8.5 kOe
I
I
54.1,
IO\-- '
h b 8 I I\ u I ’ \I I
0 IO 20 30 40 50 60 70 K 80
Fig. 126. Magnetic moment g per gram vs. temperature for o-phase Fe-Cr alloys in a magnetic field of 8.5 kOe [66Rl].
Landolt-BOrnstein New Series 111/19a
Ada&i
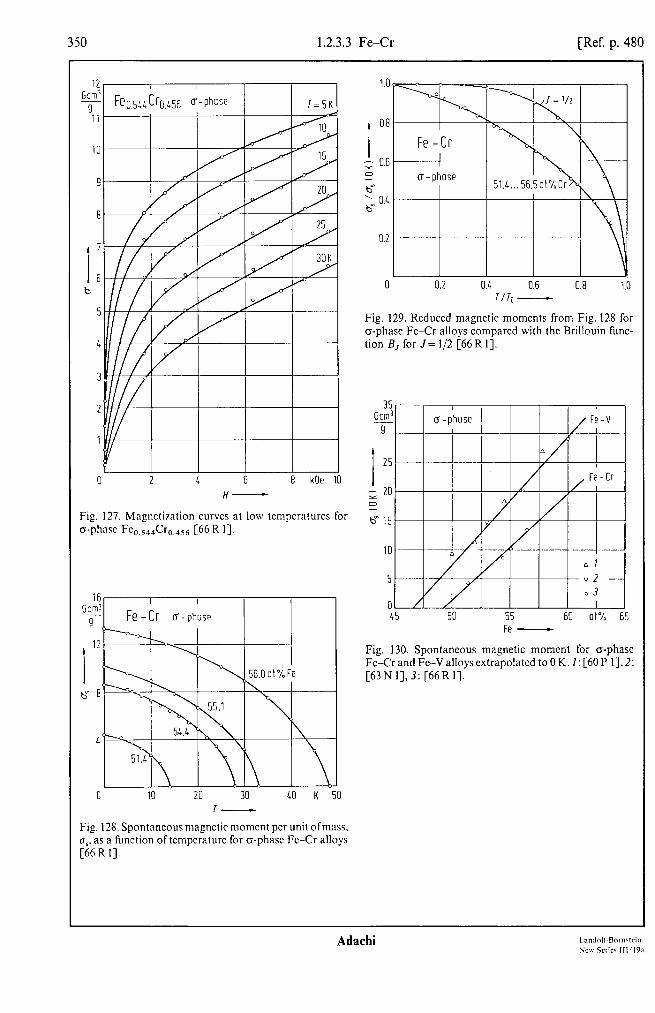
350 1.2.3.3 Fe-Cr [Ref. p. 480
12 G:i+
9 11
1C
F
I
i
E b
c
I Feo.5L4Cr0.456 U-Phase I=5K
2 4 6 8 kOe 10
H-
Fig. 127. Magnetization curves at low tempcraturcs for o-phase Fe,,,,,Cr,,,,, [66 R I].
0 10 20 30 40 K 50 I-
Fig. 128. Spontaneous magnetic moment per unit ofmass. (T,, as a function of temperature for o-phase FeCr alloys [66 R I].
I
0.8
; 0.6 z
Lo
$ 0.4
0.2
0 0.2 0.4 0.6 0.8 1 7/r, -
Fig. 129. Reduced magnetic moments from Fig. 128 for o-phase Fe-Cr alloys compared with the Brillouin func- tion B, for .I= l/2 [66 R I].
45 50 55 60 at% 65 Fe -
Fig. 130. Spontaneous magnetic moment for a-phase Fc-Cr and Fe-V alloys extrapolated to 0 K. I: [6OP I]. 2: [63N 1],3:[66Rl].
Adachi
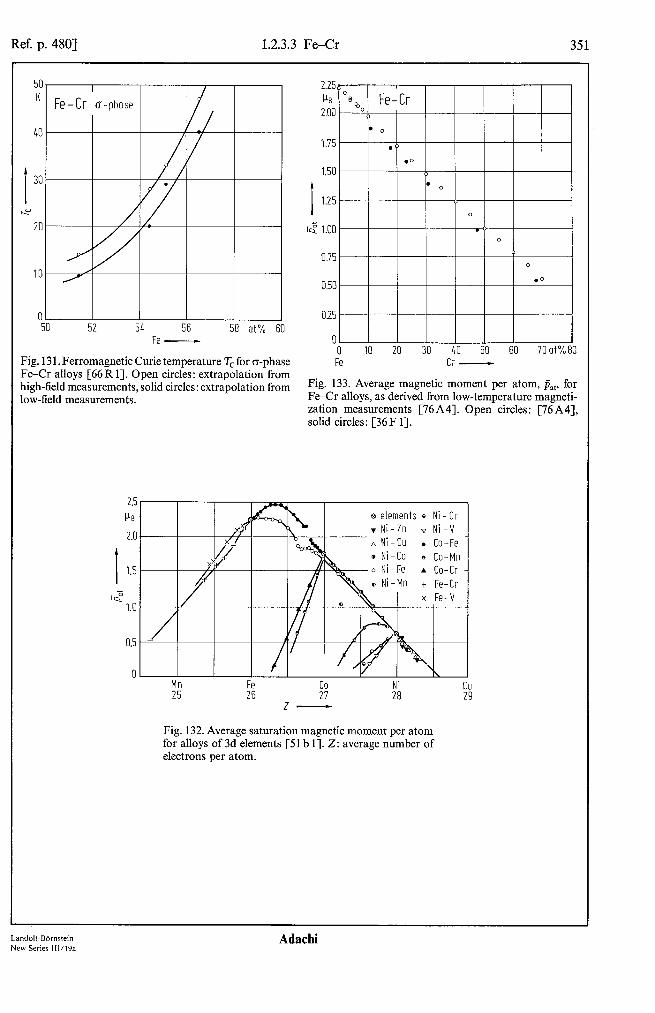
Ref. p. 4801 1.2.3.3 Fe-Cr 351
50 I
K Fe-Cr c-phase
01 50 52 5L 56 58 at% 60
Fe -
Fig. 13 1. Ferromagnetic Curie temperature Tc for o-phase Fe-Cr alloys [66 R 11. Open circles: extrapolation from high-field measurements, solid circles: extrapolation from low-field measurements.
2.25 2.256 PE
0 PE 8% Fe-Cr 2.00 2.00 O<, I
1.75 1.75
1.50 1.50
I I 1.25 1.25
19” 1.00 19" 1.00
0.75 0.75 I I I I I I I I I
0.50
0.25
0 0 0 IO 20 30 LO 50 60 IO 20 30 LO 50 60 70 at%80 70 at%80 Fe Cr -
Fig. 133. Average magnetic moment per atom, pat, for Fe-Cr alloys, as derived from low-temperature magneti- zation measurements [76A4]. Open circles: [76 A4], solid circles: [36 F 11.
0 Mn cu 25 :‘, 47 2”; 29
Fig. 132. Average saturation magnetic moment per atom for alloys of 3d elements [Sl b 11. Z: average number of electrons per atom.
Landolt-Bdmstein Adachi New Series 111/19a

352 1.2.3.3 Fe-Cr [Ref. p. 480
1.0
I p 0.5
3
Ps
2
1
I
0
-=I -1
-2
-3
-4
Fe-b 1
0 Fe
10 20 30 40 50 60 70 owo80 Cr -
-1.51 -1.5 Fig. 135. Magnetic moment distribution for Fe-Cr alloys
0 0 20 20 LO 60 60 80 al% 80 al% [SO K 11. Solid lines: coherent potential approximation Fe Cr - Cr (CAP)calculations [75 F 23.1: [80 K I], 2: [71 L I] and 3:
[55 S I] at room tempcraturc; 4: [76A 3) and 5: [66 C I]. Fig. 134. Average Fe and Cr atomic magnetic moments jcr and bFE: individual average magnetic moment of Cr obtained from neutron scattering experiments and the and Fe atoms, respectively; pO: diffuse magnetic moment average atomic moment j,, of Fe-Cr alloys at 4.2K seen in polarized neutron Bragg scattering measurements. [76 A3]. Solid curves represent calculated values based For Fe, p0 = -0.21 pH [63 S I]. upon the local environment model [80 S 23.
1.0
PB
0.8
I 0.6
x B 9
0.4
0.2
0 0 4 8 12 16 ot% 20
Cr Fe -
Fig. 136. Variation of the maximum ordered magnetic moment pmnr with composition for Fe-Cr alloys at 4.2 K, calculated from the results of neutron Bragg scattering experiments. The moments corresponding to the max- imum amplitude of both the incommensurate (I) and the commcnsuratc (C) spin density waves are shown [78 B I]. Circles: [78 B I], open triangles: [67A I], solid triangles: [6712].
Ada&i

Ref. p. 4801 1.2.3.3 Fe-Cr 353
0.6
PB Fe
bFe Cr-4.9at”/
7
I I
250 3 -ii-!
01 0 1 2 3 Itat% 5 Cr Fe -
Fig. 138. Maximum magneticmoment pmax ofincommen- surate (circles) and commensurate (triangles) spin density waves as derived from neutron diffraction in Cr-Fe single crystals. Square: (Cr-1.7at% Fe): sum of pmax for both states. Solid triangle: derived from powder diffraction [6712]. See also Fig. 137.
0 1 2 3 4 at% 5 Cr Fe -
Fig. 139. Spin density wavevector Q for Fe-Cr alloys al T=OK [6712]. a: lattice constant.
Fig. 137. Temperature dependence of the maximum spin density wave amplitude pmaX for (a) the transverse in- commensurate state ofCr-0.4 at% Fe derived from single- crystal neutron diffraction spectra, (b) the incommensu- rate (I) and the commensurate (C) antiferromagnetic state of Cr-1.7 at% Fe single crystal and for the commensurate antiferromagnetic state of(c) Cr-3.76 at% Fe and (d) Cr- 4.9 at% Fe [67 121.
Adachi New Series lll/l9a

354 1.2.3.3 Fe-Cr [Ref. p. 480
,g 0.03
0.02
0.01
0 I a
0 50 100 150 200 250 300 kOe 350 H op:' -
Fig. 140. Average magnetic moment per atom, p,,. vs. applied field H,,,, for various Fc-Cr alloys at 4.2K [8OB I]. (a) 1.0~..5.3at% Fc. (b) 12 and 14.2at% Fc.
Fig. 141. Magnetization curves in pulsed magnetic fields at 4.2K for Fe-Cr alloys with a minimum of o-phase precipitation [83 K 21. 300 kOe 1

Ref. p. 4801 1.2.3.3 Fe-Cr 355
Table 35. Average magnetic moment @rFe of the Fe atoms at 4.2 K in disordered, bee-type Cr-Fe alloys, as derived from magnetization measurements. The esti- mated error is fO.l pn [8OB 11.
Fe [at%] 2.4 5.3 12 14.2
PFe Ckll 1.4 1.5 1.8 1.8
Table 36. Magnetic moments pFe and per of, respectively, Fe and Cr atoms in Fe- Cr alloys, obtained from analysis of magnetic diffuse neutron scattering cross sections, and average magnetic moment per atom, j&,, derived from bulk magnetization measurements. All magnetic moments in [us].
Cr at%
PO--PFe PFe Per Pat Ref.
1.04 - 5.88(33) 2.424(3) -3.46(33) 2.153 80Kl 1.46 -4.30(18) 2.416(2) - 1.88(18) 2.143 80Kl 2 - 3.40 2.24 -1.16 2.174 ‘) 76A3
15 -3.15 2.31 -0.84 1.837 30 -2.60 2.25 -0.35 1.467 50 -2.10 2.05 - 0.05 0.995 73 - 1.80 1.80 -
I) [76A4].
Table 37. Room-temperature value of the g-factor measured at 35.6 GHz for Fe-Cr polycrystal- line alloys [6OA 11.
at% Cr 9
0.0 2.09
2.0 m5 cm: 9
t 1.5
2.5 2.08 ;- 1.0
4.8 2.08 8.0 2.08
12.5 2.07 0.5 20.0 2.08
0.475
Ffd l=CZK
i
0 Cr
76A3 76A3 76A3 76A3
Fe - Fig. 142. High-field magnetic susceptibility xHF for Fe-Cr alloys at T=4.2K [8OB2].
Landolt-B6mstein New Series 111/19a
Ada&i

356 1.2.3.3 Fe-Cr [Ref. p. 480
c 10 20 30 at% LO Cr Fe -
Fig. 143. High-field magnetic susceptibility xk,r (mcasurcd in pulsed mqnctic fields up to 360 kOe)at 4.2 K for Fc-Cr alloys with a minimum of the a-phase [83 C I], see also [82C3].
10, I I I I , 0
-et 1 -3.0
-90 d 0 5 10 15 20 25 at% 30 Fe Cr - .)
z
Fig. 145. Hyperfinc field H,,, for S3Cr and the Cr 2 magnetic moment pc, in Fe-C; alloys at I .2 K [82 L I]. 5 Solid circles: [82 L I]. open circles: [76A3], crosses: e [55S I], triangle: [7l L I], lozcngc: [80 K I]. is
r” Y .E =: 2
Fig. 144a. Spin-echo spectra for s3Cr in Fe-Cr alloys at A
1.2 K. showing the distribution in the magnetic hypcrtinc field H,,, at Cr sites [82C I].
0.25ot%Cr 0,25ot%Cr
60 63 66 69 72 kOe 75 a H W -
Fe-Cr
Fig. l44b. Spin-echo spectra for the main lint of “Fe in Fe-0 alloys at 4.2K. showing the distribution in the maznctic hypcrlinc field H,,, at Fc sites [83 L I]. 3
b 30 335 3LO 345 350 355 kOe 363
H WP -
Adachi
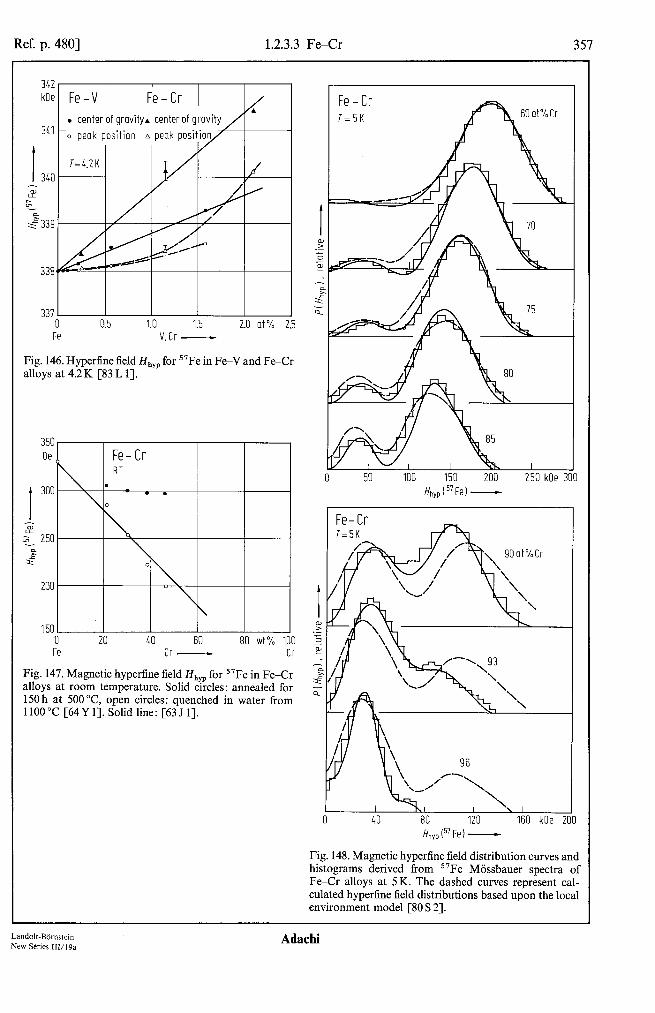
Ref. p. 4803 1.2.3.3 Fe-Cr 357
Fe
Fe-V Fe41 I, .
. center of gravity A center of gravity
-0 peak position A peak position
I I / T=CZK 1 I LA I/
I I I I
0.5 1.0 1.5 2.0 at% 2 V, Cr -
Fig. 146. Hyperfine field H,,, for 57Fe in Fe-V and Fe-Cr alloys at 4.2 K [83 L 11.
35c Oe
I
3oc
z z- 250
s a
200
150 20 LO 60 80 wt% 1 00
Fe Cr - Cr
Fig. 147. Magnetic hyperfine field HhyP for 57Fe in Fe-Cr alloys at room temperature. Solid circles: annealed for 150 h at 500 “C, open circles: quenched in water from 1100°C [64Y 11. Solid line: [63 J 11.
Fe-Cr T=5K R”“4 GOot%Cr
250 kOe 31 Hhyp ( 57 Fe) -
0 40 80 120 160 kOe 2[ ihyp (57 Fe) -
Fig. 148. Magnetic hyperfine field distribution curves and histograms derived from 57Fe Mijssbauer spectra of Fe-Cr alloys at 5K. The dashed curves represent cal- culated hyperfine field distributions based upon the local environment model [SOS 21.
Land&BBmstein New Series III/l%3
Adachi

1.2.3.3 Fe-Cr [Ref. p. 480
Fig. 149. Hypcrfinc field Hhyp for “Fc in Fc-Cr alloys at various temperatures. (a) [63 J I], (b) 1...3: [77 K 11. 4: [63 J I] and 5: [72 H I].
350 meVF t
4
0 20 40 60 80 al% 100 a Fe Cr - Cr 250
t
lo T=bOK 4. RT L.2 K 5a l=L.ZK
100 -
6
O- 0 10 20 30 40 50 600% Fe
I
Fig. 150. Spin wave stiffkss constants D, and D, for Fe-Cr alloys. Circles: D, and D, derived from loa- temperature magnetization curves according to the
0 b Fe
0.4 0.6 0.8 1.0 equation D=Do-D,T2 [76A4]. Triangles: D, x- Cr derived from neutron scattering experiments [65 L I].
Table 38. Results of various least-squares Iits of magnetization data for Fe-Cr alloys to a modified spin-wave equation D = D, -D, T*. Details of the different fits are given in [76 A 43. Average magnetic moment per atom, p,,, is calculated from a,(0 K). K,: first order anisotropy constant.
Cr QW Pa, DO D, K,(OW at% Gcm”g-’ pa meV A2 10-4meVA2K-2 105ergcmm3
2.0 217.72(l) 2.174 301(3) 5.12(37) 4.40( 14) 4 212.72(2) 2.121 297(S) 4.59(54) 4.88(7) 6 208.33(2) 2.074 296(6) 5.54(64) 4.27(5) 8 203.50(2) 2.023 282(6) 5.28(63) 4.08( 10)
10 198.36(3) 1.969 266(4) 4.45(47) 4.14(4) I2 193.24(2) 1.916 260(3) 4.59(30) 3.32(9) 15 185.69(2) 1.837 249( 3) 3.98(40) 3.55( 11) 20 173.34(l) 1.709 227(2) 3.88(19) 3.75(17) 25 161.38(3) 1.586 189(l) 1.61(16) 3.25(45) 30 149.81(3) 1.467 183(l) 2.42( 16) 1.54(54) 35 138.05(3) 1.347 163(l) 1.90(16) 1.80(52) 40 126.52(4) 1.230 147(l) 1.24(10) 2.04(77) 45 115.03(3) 1.114 128(l) 1.03(7) 1.60(69) 50 103.06(2) 0.995 113(l) 0.85(3) 2.40(35) 55 92.56(3) 0.890 97.9(5) 0.43(7) 1.30(21) 60 8 1.52(2) 0.781 83.1(3) -0.12(6) 1.12(18) 65 70.05(l) 0.669 67.1(2) - 1.38(6) 70 57.58(5) 0.548 45.7(l) -5.46(1 I)
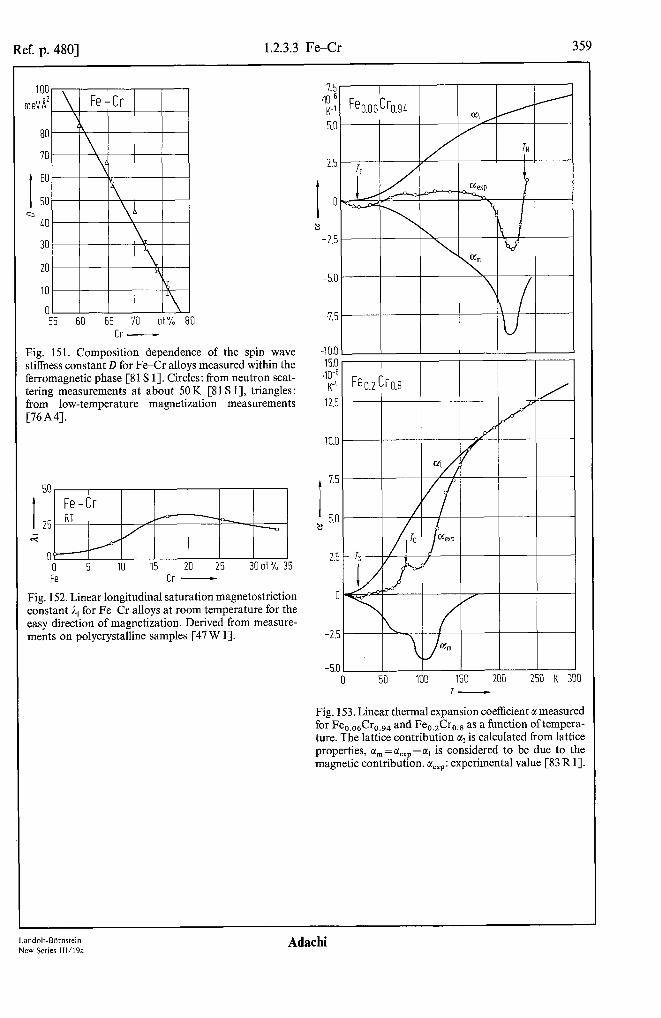
Ref. p. 4801 1.2.3.3 Fe-Cr 359
100 100 WA2 WA2
80 80
70 70
I I 60 50 60 50 Q Q
LO LO
30 30
20 20
IO IO
n n 55 60 65 70 at% 80
Cr -
Fig. 151. Composition dependence of the spin wave stiffness constant D for Fe-Cr alloys measured within the ferromagnetic phase [8 1 S 11. Circles: from neutron scat- tering measurements at about 50 K [Sl S I], triangles: from low-temperature magnetization measurements [76A4].
50
I 25 2
Fe Cr -
Fig. 152. Linear longitudinal saturation magnetostriction constant 1, for Fe-Cr alloys at room temperature for the easy direction of magnetization. Derived from measure- ments on polycrystalline samples [47 W 11.
2.5
I 0
8 -2.5
l-
,-
l-
-5s
-7.E
-1 OS 15.c a’
K-1
12.:
10s
I
7.F
~ 5s
2!
I
-2.!
-5.1
j-
l-
j-
I-
s-
I- O
I
50 100 150 200 250 K 300
Fig. 153. Linear thermal expansion coefficient c( measured for Fe,,,,Cr,,,, and Fe,,,Cr,,, as a function of tempera- ture. The lattice contribution c(, is calculated from lattice properties, tl, = tleXP - c+ is considered to be due to the magnetic contribution. e~,,r: experimental value [83 R 11.
Landolt-BOrnstein Ada&i New Series 111/19a

360 1.2.3.3 Fe-Q [Ref. p. 480
16 I
I 12 ; P
8c I 0 L 8 12 16 K' 21
0 8 12 16 K2
Fig. 154a..x. Specific heat C, for bee Fe-0 alloys at low temperatures [6OC 3-J. Squares: specific heat measure- ments in a magnetic field of 1 kOe.
Adachi

Ref. p. 4801 1.2.3.3 Fe-Cr
130
.lom3 Fe0.559 Cr0.441 J I I Kmol
110
I 100 90 2
80
70
60 , .I / /
50 b 1.0 1.5 2.0 2.5 3.0 3.5 4.0 4.5 K 5.0
T-
3 6 9 12 15 K* 18 T*-
Fig. 155. Molar specific heat C, of Fe,.,,,Cr,,,,,. (a) In the a-phase. Electronic specific heat constant: y=5.02 . 10m3 J Km2 mol-’ and Debye temperature: 0, =400 K. [58 H2]. The full line represents results for pure Fe [39K 11. (b) AtIer transformation of the sample to the o-phase by annealing at 700 “C [58 H 23. Solid and open circles refer to He and H, as exchange gases in the experiments, respectively. (c) Replot of the points of(b) from which an estimate of the electronic specific heat can be made: y=26.8~10-2JK-2mol-1[58H2].
Landolt-Biirnstein New Series IIl/l9a
Ada&i

362 1.2.3.4 Fe-Mn [Ref. p. 480
1.2.3.4 Fe-Mn
References: 32S1, 37M1, 5lb1, 57M1, 58A1, 58h1, 59a1, 62A1, 62S1, 62V1, 63J1, 64G1, 6451, ~~~~~~~~~~~~~~~~~~~~~~~~~~~~~~~~~~~~~~~~~~~~~~~~~~~~~~~~~~~~~~~~~~~~~~~~~~~~~~~~ ~~~~~~~~~~~~~~~~~~~~~~~~~~~~~~~~~~~~~~~~~~~~~~~~~~~~~~~~~~~~~~~~~~~~~~~~~~~ 81 V 1, 82 M 2, 83 M 1, 83Y 1.
FP Mn- Mn
1102 I , : 1100°C’
-he Y 1033 / 0
1 1 Brn I
I I
I I 727’C
535 -cc:, 1 %”
400 , ‘I I I \ I I
300 1 0 10 20 30 40 50 60 70 80 at% 100 Fe Mn - Mn
Fig. 156. Phase diagram of FeeMn alloys [SS h I]. In the low-tempcraturc phase boundary bctwccn a and y, the 550 c-phase appears with fee structure [58 h 1, p. 6651. K
Fig. 157. Part of the phase diagram for FeMn alloys. Beginning of e-y transformation on heating: solid circles [66U I]. dashed line [SS h I]. End of s-y transformation on heating: triangles [66 U I], thin solid line [58 h I]. Beginning of Y+E transformation on cooling: crosses
500
I L50
h 400
350
[66 U I]. dashed-dotted line [SS h I]. Open circles: TN [66 u I]. 0 10 20 30 40 50 at% 60
Fe Mn -
Adachi
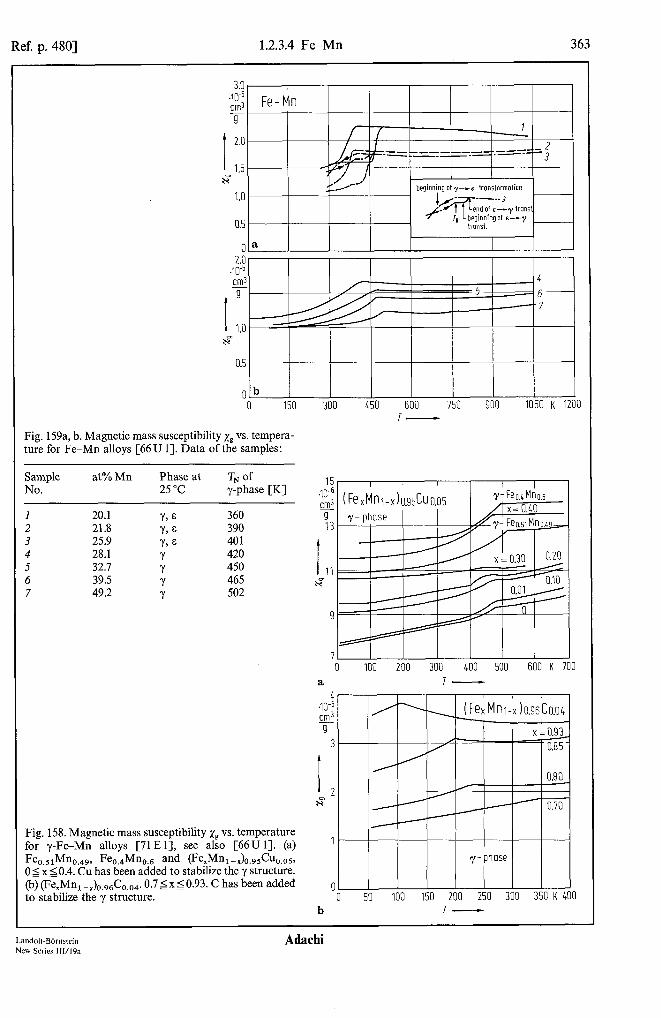
Ref. p. 4801 1.2.3.4 Fe-Mn 363
a.5
0
0 0 150 300 450 600 750 900 1050 K 1200
Fig. 159a, b. Magnetic mass susceptibility xp vs. tempera- ture for Fe-Mn alloys [66U 11. Data of the samples:
Sample No.
at% Mn Phase at 25 “C
TN of y-phase [K]
1 20.1 YT E 360 2 21.8 Y> E 390 3 25.9 Ya E 401 4 28.1 Y 420 5 32.7 Y 450 6 39.5 Y 465 7 49.2 Y 502
Fig. 158. Magnetic mass susceptibility xp vs. temperature for y-Fe-Mn alloys [71 E 11, see also [66U 11. (a) %.s~Mno,49, Fed%.~ and ~e,Mnl-,h.d-%o~~ 0 5 x 5 0.4. Cu has been added to stabilize the y structure. (b) (Fe,Mn,-,),,96C0,0,. 0.75x50.93. C has been added to stabilize the y structure.
7 0 100 200 300 400 500 600 K 700
a 7-
0 50 100 150 200 250 300 350 K 400 b T-
Land&BOrnstein New Series 111/19a
Adachi

364 1.2.3.4 Fe-Mn [Ref. p. 480
01 0 10 20 30 40 5Oot% 600 FE Mn -
Fig. 160. Masnctic mass susceptibility xs at 800K [66 U I] and electronic specific heat coefficient 7 [64G l] vs.composition ofFeMn alloys. For data ofthc samples. see caption to Fig. 159.
‘h
Lb!:,
8
I
3.6!0
3.6:s
3.610
3.635 -53 0 50 100 150 200 250 300 "C 350
I-
Fig. 161.Top:Magneticmasssusccptibility~,vs.tcmpcra- turc for y-phase Fc,,,,,Mn,,,,. Bottom: lattice const- ant o vs. temperature for y-phase Fe,,,,,Mn,,,,, [66U I].
L. I* I I
70 480 490 500 510 520 K 5: I
12.5 .m6 cm3 s.
1 a-Mn
2 Mb.qs Cro.oj - 3 /3-Mn-5ot%Si 4 a-Mn0.qFeo.ojCro.c
, 5 cx-Mn,,gjFeg.cS -
I 10.5
0
x 10.0
9.5
9.0
8.5
.
.
8.01 0 50 100 150 200 250 K 300
a 20
.m6 cm3 9 15
I -10
H
5
0 b
1 100 200 300 K LOO
Fig. 162a. Magnetic mass susceptibility zg vs. temperature for (1) a-Mn. (2) Mn,,,, Cr,,,,, u+o-phase. (3) B-Mn (with 5at% Si), (4) a-Mn,,,Fe,,,sCr,,,, and (5) ~-Mno.9sFco,os [62 S 11. Fig. 162b. Magnetic mass susceptibility za vs. temperature for hcp and fee alloys Fe,,,,,Mn,,,,, and Fe,,,,,Mn,,,,, [710 I].
Fig. 163. Temperature variations of some physical pro- perties ofy-Fc,,,Mn,,, [75 c I, p. 4003. x9: static suscepti- bility, l(S,>1*: square of sublattice magnetization. TEP: thermoelectric power, e: electrical reststtvity, C,: specific heat.

Ref. p. 4801 1.2.3.4 Fe-Mn 365
i 720
680 h"
640
600
Cr
560
520 liEP& 0 IO 20 30 at% 1 Fe V, Cr,Mn -
600
K 1 Fe-Mn 600 K 500 500
I I
400 400
~ 300 ~ 300
200 200
100 100
0
Ps 2.0
I
1.6
1: 1.2
0.8
", Fig. 164. Curie temperature Tc of Fe-V, FeeCr and Fe-Mn alloys (bee phase) [Sl b 1, p. 7221.
15c K
125
t
IOC
65 75
5c
25
0 I
a
500 K
- I
400
600
h' 200
100
0
b I
I 25 0 2.5 at% 5.0 Impurity
IO 20 30 4Oat%50 Mn -
o-O 0 0 0 Mn Fe - Fe
Fig. 165. NCel temperature TN and average magnetic moment per atom, &,, vs. composition of FeeMn alloys. ‘I;, represents the fee-fct transition temperature [68 S 11.
Table 39. Ntel temperature TN of a-Mn alloys contain- ing 1 at% 3d elements, as derived from the minima in the resistivity vs. temperature curves [74M 11. ATN: shift of TN due to alloying, relative to TN of a-Mn.
a-Mn 95 a-Mn-1 at% Cr 84(l) -L(l) a-Mn-1 at% Fe 110(l) 15(l) cl-Mn-1 at% Co 118(l) 23(l) a-Mn-1 at% Ni 104(l) 9(l)
Fig. 166a. Ntel temperature TN of a-Mn alloys as a function of impurity concentration [74K 11. Fe,: an- nealed at 620 “C, Fe,: heated to 900 “C and then annealed at 620°C. I: [73 W 1],2: [71 W 11.
Fig. 166b. NCel temperature TN of hcp and fee Fe-Mn alloys as derived from Mijssbauer experiments [710 11.
Landolt-Bbmstein New Series 111/19a
Adachi

366 1.2.3.4 Fe-Mn [Ref. p. 480
Fe li.Kn - I I I\\ I I
Fig. 167. Saturation magnetization M, for Fc- Ti and Fe-Mn alloys at OK. Broken lint shows M, for simple
I
dilution [59a I. p. 851. g 0.6
5
2 0.4
Fig 168. Relative average magnetic moment per atom as a function of temperature for (a) y-Fe,,,,Mn,,, and (b) y-Fe,,,Mn,,, alloys. The Brillouin curves for spin l/2 and I arc given by the solid lines. B,,, and B,, respectively. The magnetic moments have been derived from neutron diffraction spectra [7l E I].
I Y 0 OF 7 I$ 12
OL
0.2 / 4=115K 1
Ob jo,(OK)=0.60(5)p,
I I 0 0.2 0.4 0.6 0.8 1.0 1.2
T/I,, -
Fig. 169. Tempcraturc variation of the avcragc magnetic moment per atom. fi,,. as dcrivcd from neutron diffraction experiments for two y-FeMn alloys stabilized with 4at% C. The open circles and the dots refer to calculations based on peak and intcgratcd intcnsitics
Table 40. Average magnetic mo- ment per atom, L,, for y-Mn, - rFer stabilized with Sat% Cu, as derived from neu- tron diffraction experiments [71 E 11.
X Pa, Chl
293 K OK
0.0 1.78(20) 2.1 0.03 1.85(20) 2.15 0.1 1.81(20) 2.05 0.2 1.54(50) 1.78 0.3 1.10(50) 1.48
of the (I IO) reflection. respcctivcly [7l E I]. 0.4 1.23(20) 1.60
Adachi Landoh-Bornswin NW Scrier 111’19a

Ref. p. 4801 1.2.3.4 Fe-Mn 367
3 I PB Fe-Mn he+PO
2 (
I 1
9 0
1
-1 J’ X
-2 a Foe 2 4 Mn 6 - 8 IO at% 12
Fig. 170. Magnetic moment distribution at room temper- ature for Fe-Mn alloys [SO K 11. pMn and pre: individual average magnetic moments of Mn and Fe atoms, respec- tively. p,,: diffuse magnetic moment seen in polarkd neutron Bragg scattering measurements; for Fe: p,, = -0.21 pa [63 S 11. Solid lines: coherent potential approximation calculations [72 H 21. Crosses : [SO K 11; solid circles: [75 N2]; open circles: [78 RI]; solid triangles : [76 C 21; square : [66 C I] ; open triangles : [76 M 11.
s y-Fe-Mn type
direction of spins II <Ill)
,, 1’ ?I 0 4 0
C
-----.--
a/ 1’ ‘y?
a ’
y- Mn - type
b c/a<1
Fig. 171. Spin structure of Fe-Mn alloys. (a) y-Fe-Mn type [66U 11, (b) y-Mn type [57 M 11.
Table 41. Individual magnetic moments PFe and &, as derived from diffuse scattering cross sections of polarized neutrons, and average magnetic moment per atom, pa,, for a-Fe-Mn alloys at room temperature.
Mn PFe-&n Pat PFe PMn Ref. at %
PB
0.79 2.160 2.395(2) -0.82(23) 80Kl 1.85 2.138 2.397(2) - 0.23(9) 80Kl 3.15 1.39(11) 2.12(l) 2.16(l) 0.77(12) 78Rl 5.89 1.25(12) 2.05( 1) 2.124(12) 0.87(13) 78Rl 8.83 1.38(16) 2.00( 1) 2.12(15) 0.74(16) 78Rl
Land&BBmstein New Series lll/l9a
Ada&i

368 1.2.3.4 Fe-Mn [Ref. p. 480
Fe-Mn 7=17K
- 5ot%Mn --em- 3
-+- 1.5
210 220 230 210 250 MHz 260 -0 -
Fig. 172. Nuclear magnetic rcsonancc spectra for “Mn in Fe-hln alloys at 17 K [83 Y I].
IX- Mn-Fe l= 1.2 K
30 I I
19: 200 210 220 230 240 MHz a Y-
0.70 0 . 55 Mn in Ni,,,gMn,,O,
0.65 _ A A 55Mn in Feo.sssMno.015 o v "V in Feo,sBV0.02
0.60 0 0 100 200 300 K LOO
I-
Fig. 173. Temperature dependence of the main (open symbols) and satellite (solid symbols) reduced NMR frcquencics for “Mn and “V in Fc,,,,,Mn,,,,,. Fe V 0.98 0.02 and %.9&fno.ol alloys. Also given is the reduced magnetization a/cr(OK) of pure Fe and Ni C83Yl-J.
or-Mn-Fe I= L.2K
I 140 150 160 170 180 190 200 MHz210 b Y-
Adachi

Ref. p. 4801 1.2.3.4 Fe-Mn
:-">n siteIII 7= UK
- 20 30 40 50 60 70 MHz
Y-
T = 42 K
site IY
1 at% Fe r\ I I I
5 IO 15 20 25 30 MHz Y-----c
t I 180 I /
r sitelI
50 site Ill
40 I + P
P
= s *
30 fl l cc-Mn-Ru 0 a-Mn-Fe
20 I I a 5 III 15 20 25 at% 30
e Mn Fe,Ru -
Fig. 174. (a.. .d) Line shapes of NMR spin-echo spectra of 55Mn in a-Mn-Fe alloys at 4.2K on the four different crystallographic sites (I...IV) of Mn [74K 11. For their definition, see Fig. 46. See also Table Il. (e) Magnetic hyperfine field Hhyp of 55Mn at 4.2K for the crystallo- graphic sites I, II and III derived from sublattice NMR spectra for a-Mn-Fe and wMn-Ru alloys [74 K 11.
Landolt-BBmstein Adachi New Series 111/19a
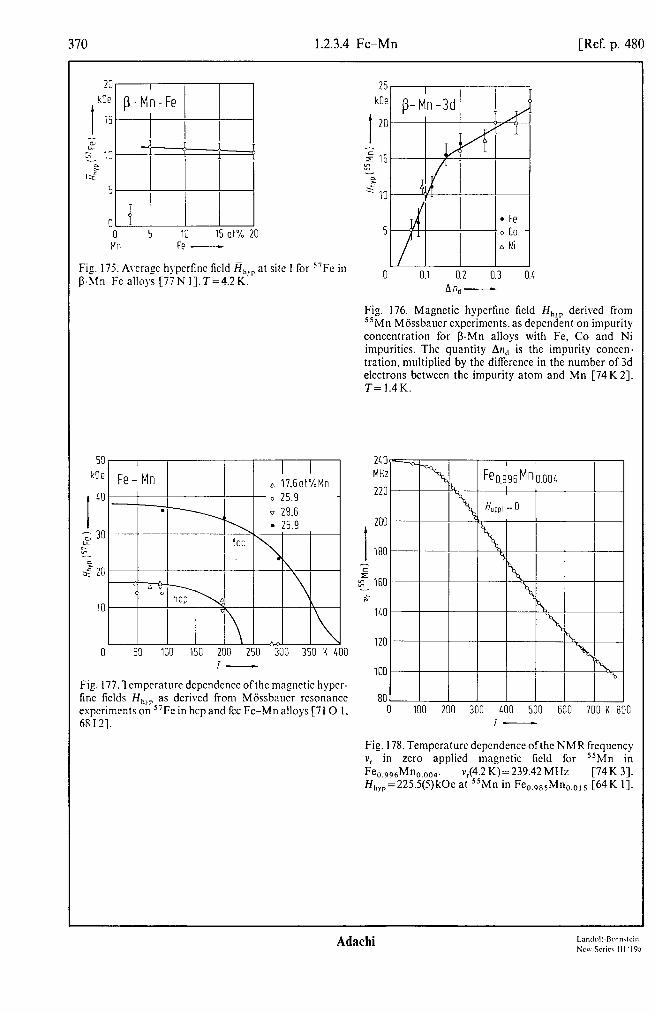
1.2.3.4 Fe-Mn [Ref. p. 480
p-Mn-Fe I
I I
&r Fe -
Fig. 175. Average hypcrfinc field f7,,, at P-hln-Fe alloys [77 N I]. T=4.2 K:
53 r
kCle
I
ul
a 30 f
2 20
10
240 MHz
220 -
200
- 1 180
- c 5 160
s lb0
0 1\ 120
50 100 150 200 250 300 350 K 400 I- 100
Fig. 177. Temperature depcndcncc ofthc magnetic hypcr- tine fields Hhjp as derived from Miissbaucr resonance 80 experiments on “Fe in hcp and fee Fe-Mn alloys [7lO I, 0 100 200 300 LOO 500 600 700 K I 68121. I-
site I for “Fc in
Fig. 176. Magnetic hypcrfinc field Hhgp derived from “Mn Miissbaucr expcrimcnts, as dependent on impurity concentration for b-Mn alloys with Fe, Co and Ni impurities. The quantity An, is the impurity concen- tration, multiplied by the difference in the number of 3d electrons between the impurity atom and Mn [74K2]. T= 1.4K.
390
Fig. 178. Temperature dependence ofthe NMR frequency v, in zero applied magnetic field for “Mn in Fe o.996Mno.oo4. vJ4.2 K)= 239.42 MHz [74 K 33. Hhyp=225.5(5)kOe at “Mn in Fe,.,,,Mn,,,,, [64K I].
Adachi
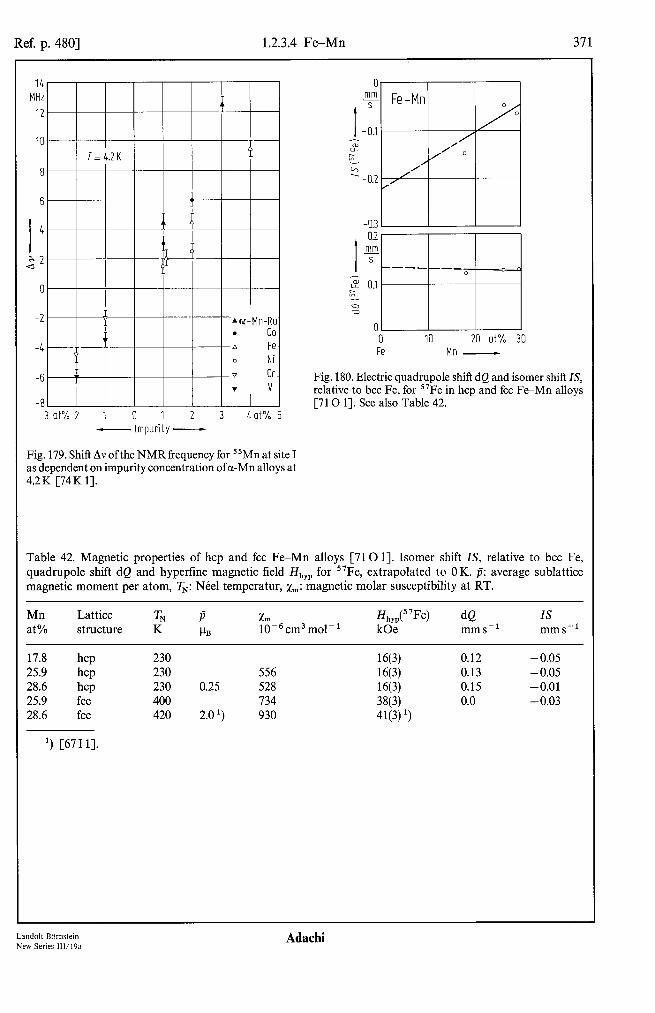
Ref. p. 4801 1.2.3.4 Fe-Mn 371
0
I
y Fe-Mn
-0.1 z /' /. c; ,/ 0 - 2 /
-0.2 ,’
-0.3 0.2 mm I - s
-----_ 0 2% 0.1
E3
c, Q
0 0 10 20 at% 30 Fe Mn -
Fig. 180. Electric quadrupole shift dQ and isomer shift IS, relative to bee Fe, for “Fe in hcp and fee Fe-Mn alloys [710 11. See also Table 42.
3 at% 2 1 0 1 2 3 4 at% 5 -Impurity-
Fig. 179. Shift Av ofthe NMRfrequency for 55Mn at site I as dependent on impurity concentration of a-Mn alloys at 4.2K [74K 11.
Table 42. Magnetic properties of hcp and fee Fe-Mn alloys [710 11. Isomer shift IS, relative to bee Fe, quadrupole shift dQ and hyperfine magnetic field H,,,,r for 57Fe, extrapolated to OK. p: average sublattice magnetic moment per atom, TN: NCel temperatur, x,. . magnetic molar susceptibility at RT.
Mn Lattice TN P Xm KJ5’W dQ IS at% structure K PB 1Om6 cm3 mol-l kOe mms-’ mms-’
17.8 hcp 230 1613) 0.12 - 0.05 25.9 hcp 230 556 16(3) 0.13 -0.05 28.6 hcp 230 0.25 528 16(3) 0.15 -0.01 25.9 fee 400 734 38(3) 0.0 -0.03 28.6 fee 420 2.0 ‘) 930 41(3) ‘1
‘) [6711].
Landolt-BOrnstein Adachi New Series 111/19a
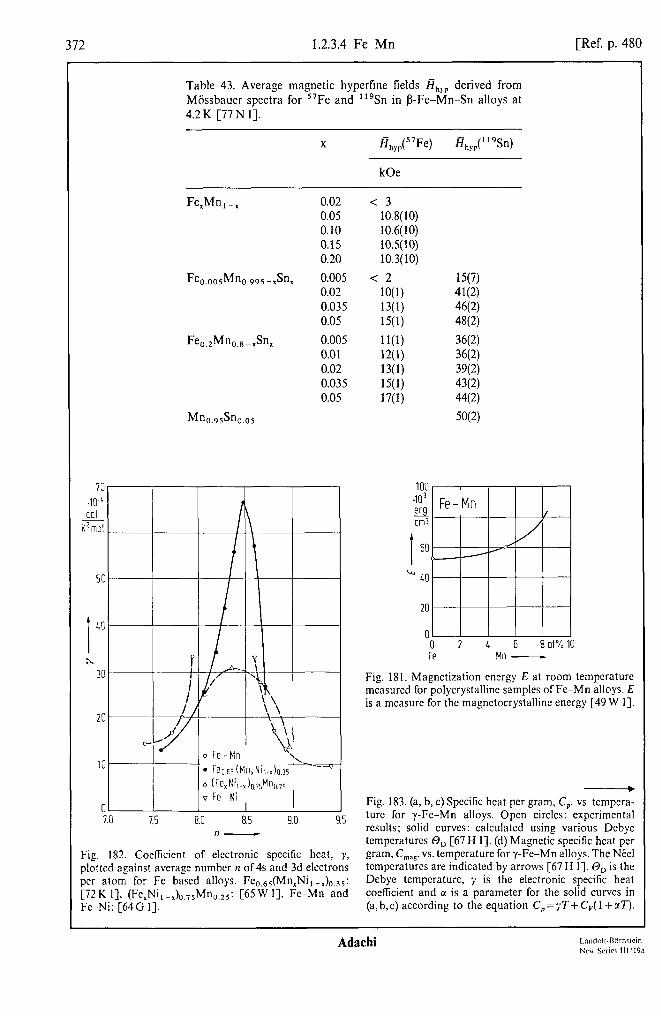
372 1.2.3.4 Fe-Mn [Ref. p. 480
70 .lil 6 cai
K'mz!
Table 43. Average magnetic hyperfine fields I?,,, derived from Miissbauer spectra for “Fe and “‘Sn in P-Fe-Mn-Sn alloys at 4.2 K [77 N 11.
X R,,,(57Fe) A,,,(’ ’ gSn)
kOe
Fe,Mn,-, 0.02 0.05 0.10 0.15 0.20
Fe 0.005Mn0.g95-xSnr 0.005 0.02 0.035 0.05
0.005 0.01 0.02 0.035 0.05
Fig. 182. Coefficient of electronic spccitic heat, y, plotted against average number n of 4s and 3d electrons per atom for Fe based alloys. FeO,ss(Mn,Ni,-X)o,Xs: [72K I]. (Fe,Ni,-,),,,,Mn,,z,: [65 W I]. Fe-Mn and Fe Ni: [64G I].
<3 10.8(10) 10.6(10) 10.5(10) 10.3(10)
<2 1W) 13(l) 15(l)
1 l(l) 12(l) 13(l) 15(l) 17(l)
15(7) 41(2) 46(2) 48(2)
36(2) 36(2) W2) 4W ‘W) 50(2)
100 .103
z
I 60
c, 40
0 0 2 4 6 8 at% Fe Mn -
Fig. 181. Magnetization energy E at room temperature measured for polycrystalline samples of Fe-Mn alloys. E is a measure for the magnetocrystallinc energy [49 W I].
Fig. 183. (a, b, c) Specific heat per gram, C,, vs. tempera- turc for y-Fe-Mn alloys. Open circles: experimental results; solid curves: calculated using various Debye temperatures 0, [67 H I]. (d) Magnetic specific heat per gram, Lag. vs. temperature for y-Fe-Mn alloys. The N&cl temperatures are indicated by arrows [67 H I]. 0, is the Debye temperature, y is the electronic specific heat cochicicnt and c( is a parameter for the solid curves in (a,b,c) according to the equation C,=yT+Cr(l +rT).
Adachi
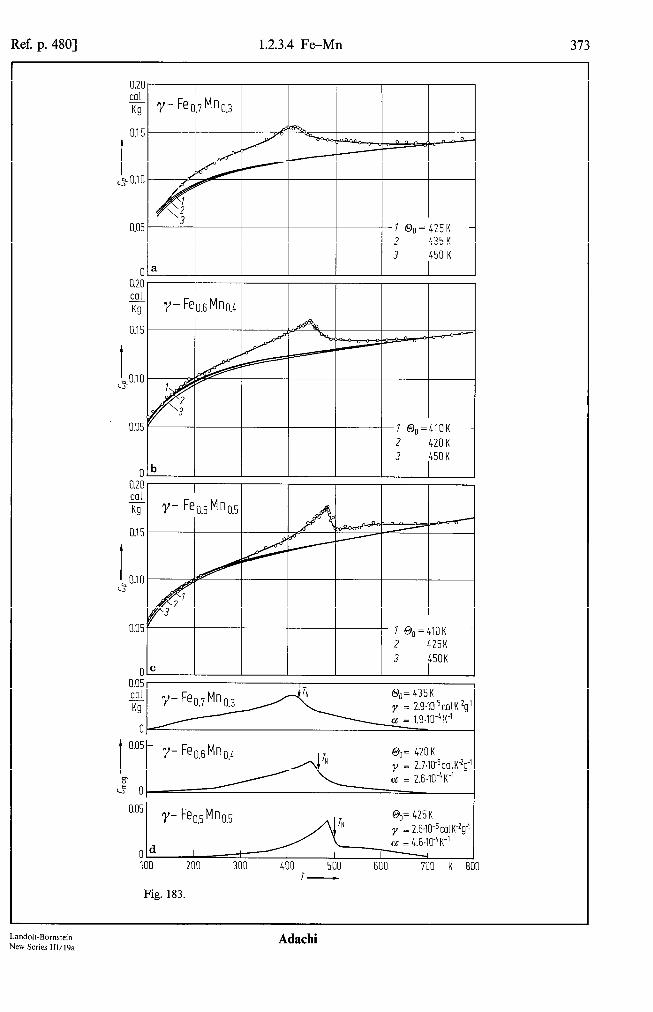
Ref. p. 4801 1.2.3.4 Fe-Mn 373
0.05 J , I I I ' I Oo=425K
7 /.?c, K L T4.A I\
3 450 K
0 -a 0.20 CO1 - Kg Y- b1.6 Mno.4
0.15
I *o.lo
0.05
0 0.20 1 I I I I I Cal
- Y-Fe;o.,Mn,,~ Kg
0.05 - Y- hl.5 Mno.5
Od 100 200 300 400 500 600 700 K 800
7w
Fig. 183.
Landolt-Bornstein New Series 111/19a
Adachi

314 1.2.3.5 Co-Ti [Ref. p. 480
1.2.3.5 Co-Ti
~~~~~~~~~~~~~~~~~~~~~~~~~~~~~~~~~~~~~~~~~~~~~~~~~~~~~~~~~~~~~~~~~~~~~~~~~~~~ 70N 1.70s 1, 73A2, 79B 1, 80G 1, 81 S2.
wn I ! ’ ’ : ! ’
co Ti -
Fig. 184. Phase diagram of Cog-Ti alloys [68 I I].
li
1.0 2.0 1.6 I 1.2 -!g
I Ia
0.4 0.8
0.2 0.4
0 0 4.0 80 oi
70
60
I 2.5 50 I * 2.0 40 -L 4
1.5 30
1.0 20
0.5 10
0 0 100 200 300 400 500 600 700 K 80: I--,
Fig. 185. Paramagnetic mass susceptibility xp and the Knight shift K of 5gCo as a function oftemperature T for CsCI-type Co,,,Ti,,, [8l S 21, see also [67 W 1, 68 W I]. See Fig. 196 for K vs. za.
Ada&i

Ref. p. 4801 1.2.3.5 Co-Ti 375
Fig. 186. Paramagnetic mass susceptibility xp vs. tempera- ture for CsCl-type Co-Ti alloys in a magnetic field of 6.65 kOe [69A 11. 0
I
Co - Ti I
50 100 150 200 250 K 300 7-
I
‘yz coO.666 Ti0.334
16 x;’ 10”
- 9
I I I s
I
01 I I 0 100 200 300 400 500 600 700 800 K 900’
7-
Fig. 187. Magnetic mass susceptibility xg vs. temperature T for cubic Laves phase, MgCu,-type, Co0.666Ti0.334. Ntel temperature TN=45 K. An analysis of the high- temperature behavior according to xs = x0 + C$( T- 0) gives the parameters: x”=6.99.W6cm3/g, C~=0.302~10-3cm3K/g,0=25K,p,,,=0.45~B[68N1].
8 8 Gcm3 rn--. Tim-.. 404
~“U./‘I “U.LY,/ 1 X,’ 1
LYk#--L I I I I I II I I I I I lcm3
I 4 b
2
7-
Fig. 188. Inverse of the magnetic mass susceptibility, xi’, and the magnetic moment per gram, a, measured in a magnetic field H,,,, =9.60 kOe for MgNi,-type co 0,71Ti0,29[66A1]. 7’,,=44K.
Landolt-BBmstein Ada&i New Series 111/19a

376 1.2.3.5 Co-Ti [Ref. p. 480
12.5 Gcm3
l"o.0
I
1.5
6 5.0
2.5
r
12.5 .lOL 9
Fi?
1.5 I
7, 5.0 =
2.5
0 10.0 Xl'
cm3 I 9
Tg 5.0
2.5
0 0 50 100 150 200 250 K 300
Fig. 189. Inverse of the magnetic mass susceptibility, ,Y; I, and the spontaneous magnetic moment per gram, or, for Cu,Au-type Co-Ti alloys. (a) 21.4at% Ti, @) 23.0 and 23.9at% Ti [69A2].
Table 44. Magnetic data of the hexagonal Laves phase compounds Co-Ti. x0 is a temperature- independent paramagnetic susceptibility [70N 11.
Ti at%
Structure d4K) T, xo Gcm3g-’ K 10-6cm3g-1
c, 10-4cm3Kg-’
28.0 MgNi, + Cu,Au 4.90 42 - - 29.0 MgNi, 8.50 44 12.71 16.24 30.0 MgNi, 6.20 38 13.83 9.77 30. I MgNi, 5.60 33 13.09 9.77 31.3 MgNi, 2.77 18 9.35 8.76 32.8 MgNi, + MgCu, 2.80 17 - -
Adachi
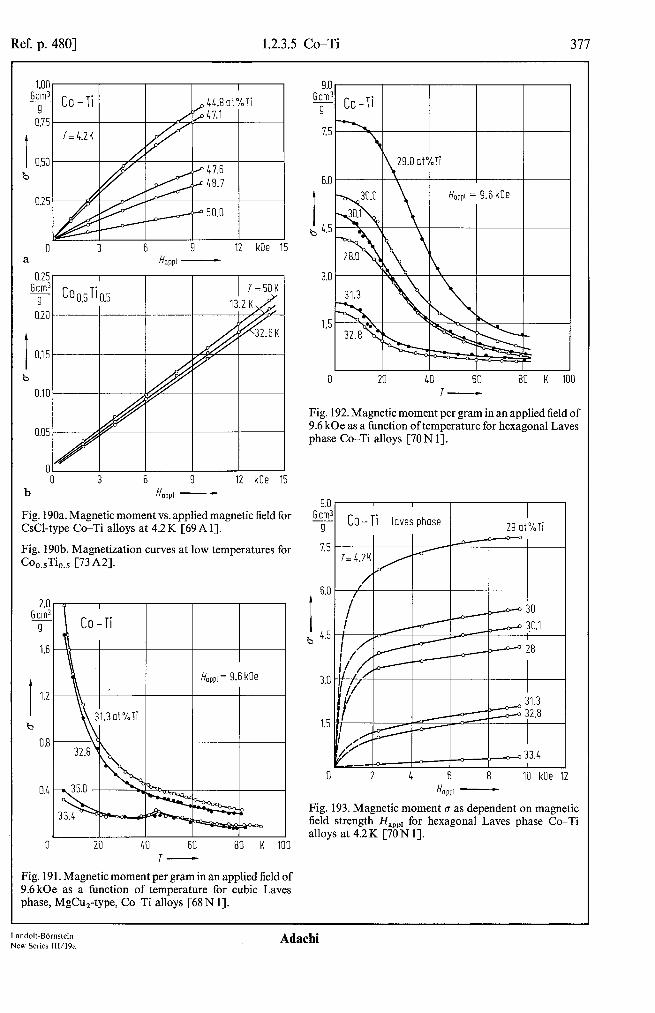
Ref. p. 4801 1.2.3.5 Co-Ti 311
0 3 6 9 12 kOe a Noppl -
0.20
I 035
b
0.10
I “0
I 3 6 9 12 kOe 15
b H WPl -
Fig. 190a. Magnetic moment vs. applied magnetic field for CsCl-type Co-Ti alloys at 4.2K [69A 11.
Fig. 190b. Magnetization curves at low temperatures for Co,.,Ti,,, [73 A2].
Hoppl= 9.6 kOe
b
0.8
I I I I I I 0 20 LO 60 80 K 100
9.0 r- Gem:
9
7.5
6.0
I b 4.5
20 40 60 T-
80 K 100
Fig. 192. Magnetic moment per gram in an applied field of 9.6 kOe as a function of temperature for hexagonal Laves phase Co-Ti alloys [70 N 11.
9.0 Gem:
9
1.5
6.0
I b 4.5
3.0
1.5
0
Co - Ti loves phase I I
I 29 ot%Ti
@’ c 0 33.4 I I- r I
2 4 6 8 IO kOe H OPPl -
Fig. 193. Magnetic moment u as dependent on magnetic field strength H,,,, for hexagonal Laves phase CoTi alloys at 4.2 K [70 N 11.
T-
Fig. 191. Magnetic moment per gram in an applied field of 9.6 kOe as a function of temperature for cubic Laves phase, MgCu,-type, CoTi alloys [68 N 11.
Landolt-BOrnstein New Series III/l9a

378 1.2.3.5 Co-Ti [Ref. p. 480
2s G:ir’
9
I 1.5
b 1.0
0.5
0 60 120 kOe 150
100 100 K K
80 80
60 60
I I 2 2
40 40
20
Fig. 194. High-field magnetization G vs. applied field H,,,, 28 29 30 31 32 at% 33 for Co,,Ti, 5 [79 B I]. Inset: reciprocal value ofthc high- Ti Iicld magnetic susceptibility, I,;~. Fig. 195. Spontaneous magnetization or at 4.2K and
Curie temperature Tc for hexagonal Laves face Co-Ti alloys [70 N I J.
I I I
U 0.3 0.6 0.9 1.2 cm3/g 1.5
Fig. 196. Knight shift K of 59Co vs. magnetic suscepti- bility xp, with the tempcraturc as an implicit parameter, for CsCI-type Co,,,Ti,,,. Magnetic hyperfine field per Co moment: H,,.,/pco = + 140 kOe/l,, when it is assumed that Ti does not contribute appreciably to xg [81 S 23. Set Fig. 185 for K vs. T and xn vs. ‘I:
Adachi

Ref. p. 4801 1.2.3.5 Co-Ti 379
Table 45. NMR and magnetic susceptibility properties for Co-Ti alloys [68 W 1, 67 W 11. v,, Av: frequency and width of NMR line, respectively, K: Knight shift of “Co, relative to K,Co(CN),.
T V, Av K K % Zcm3mol-’
kHz
Co, 1Ti4, 295 5462 11 2.30 10 77 5510 50 3.26 13
Co50Ti50 295 5459.5 7 2.26 10 77 5505 22 3.12 12.5
Co4gTi5 l 295 5458.5 6 2.24 10 77 5502 6 3.05 13
Co46Ti54 295 5458.5 6 2.24 77 5502 8 3.05
Table 46. Low-temperature specific heats for Co-3d transition metal alloys, fitted to the equation C,=yT+jT3+xT-’ in the temperature range 1...4K. crm is the low- temperature molar magnetic moment obtained by extrapolating 0, vs. l/H plots in the magnetic field range lO.e.30 kOe to H+co, [80 G 11.
X Y P x g’m pJ/mol K2 f.tJ/mol K4 u.Lrnmol-‘K Gcm3mol-’
Col-xMnx
Co, -J!rX
co1 -xv,
Co, -,Ti,
co
0.01 4527(2) 20.1(2) 4622(6) 0.02 4725(2) 20.0(2) 4506(7) 0.03 5192(2) 18.9(2) 4217(7) 0.05 6311(3) 16.7(3) 3758( 10) 0.07 7258(3) 15.4(2) 3403(8) 0.01 4404(2) 19.9(2) 4568(6) 0.02 4556(2) 19.5(2) 4185(8) 0.04 4815(3) 18.7(2) 3761(11) 0.06 5289(2) 18.5(2) 3265(8) 0.08 5917(3) 18.8(2) 2841(8) 0.10 6447(3) 18.6(2) 2366(8) 0.12 6990(2) 18.5(2) 1945(7) 0.01 4437(2) 19.0(2) 4474( 10) 0.02 4735(2) 19.8(2) 4271(7) 0.04 5250(3) 20.6(3) 3915(9) 0.06 6138(3) 10.2(3) 3459(9) 0.02 5101(2) 21.8(2) 4313(8) 0.04 5832(4) 22.7(3) 3895(12) 0.06 6540(5) 23.8(5) 3498(14)
4361(2) 20.2(2) 4833(7)
9250 9090 8770 8320 7780 9140 8770 8040 7460 6880 6180 5570 9120 8840 8460 7660 9110 8770 8260 9470
Land&BOrnstein Ada&i New Series 111/19a

380 1.2.3.6 Co-V [Ref. p. 480
1.2.3.6 Co-V
CO v- V 10 20 30 LO 5, "" I" vu WI IO
"C
1LOO
1300
1200
600
500
LOO
300
200
100 I I
1,5 2L.l 31.0 L5.6 66.3 93.0 0 pm 12151 I28.01 IL201 163.01 19201
0 10 20 30 LO 50 60 70 80 at% 1 co v-
Fig. 197. Phase diagram of Co-V alloys [SS h 1, p. 5171. Temperature, in [“Cl, and composition, in [at%V] and, in parentheses. in [wt% V], arc given for characteristic points of the phase diagram.
V
Adachi
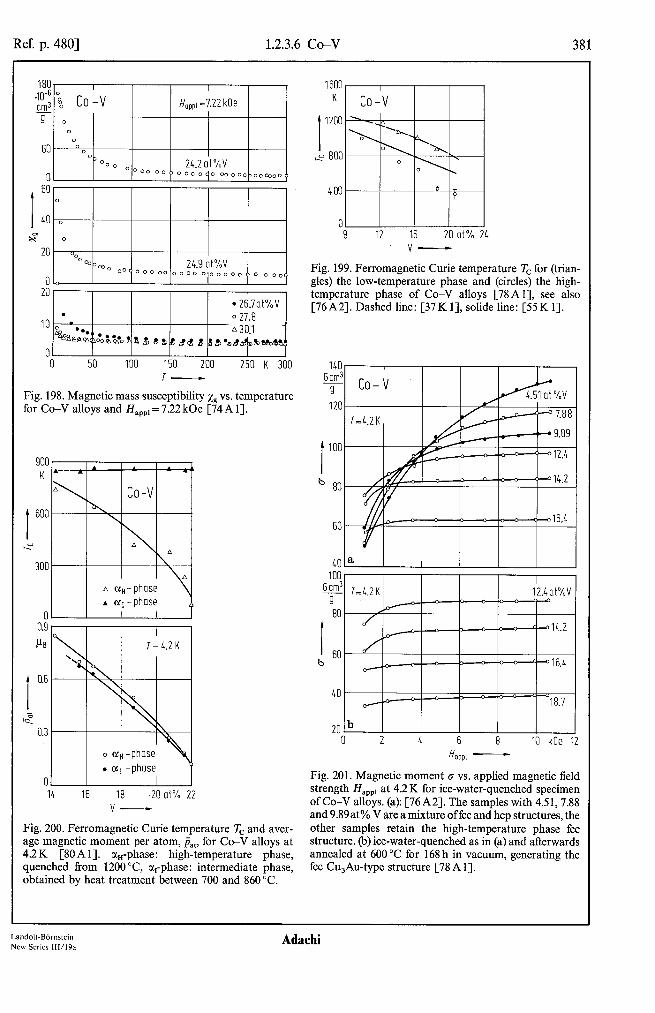
Ref. p. 4801 1.2.3.6 Co-V 381
*g$ co-v H,,,l=122 kOe
9 0 I I
0 0 50 100 150 200 250 K 300
T-
Fig. 198. Magnetic mass susceptibility xp vs. temperature for Co-V alloys and H,,,,=7.22 kOe [74A 11.
600
t
0.6
02 0.3
01 . I
14 16 18 20 at% 22 v-
Fig. 200. Ferromagnetic Curie temperature T, and aver- age magnetic moment per atom, pa,, for Co-V alloys at 4.2 K [SO A 11. au-phase: high-temperature phase, quenched from 1200 “C, a,-phase: intermediate phase, obtained by heat treatment between 700 and 860 “C.
12 16 20 at% 24 v-
Fig. 199. Ferromagnetic Curie temperature Tc for (trian- gles) the low-temperature phase and (circles) the high- temperature phase of Co-V alloys [78Al], see also [76A2]. Dashed line: [37K 11, solide line: [55K 11.
100 100 & &
9 9 80 80
I I 60 60 b b
40 40
20 20 0 0 2 2 4 4 6 6 8 8 IO IO kOe kOe 12 12
H WPl -
Fig. 201. Magnetic moment r~ vs. applied magnetic field strength I&,, at 4.2 K for ice-water-quenched specimen of Co-V alloys. (a): [76 A2]. The samples with 4.51,7.88 and 9.89at% V are a mixture offcc and hcp structures, the other samples retain the high-temperature phase fee structure. (b) ice-water-quenched as in (a) and afterwards annealed at 600 “C for 168 h in vacuum, generating the fee Cu,Au-type structure [78 A 11.
Landolt-Bdmstein New Series 111/19a
Adachi

382 1.2.3.6 Co-V [Ref. p. 480
1.6 I I-la co-v
I 1.2 * f o *
l=UK
,c 0.8 i
: 0.1 I
.
0 8 12 16 20 at% 2L
Fig. 202. Average magnetic moment per atom. j,,. for Co-V alloys at 4.2K. Open circles: low-temperature phase q, solid circles: high-temperature phase aH [78 A I], see also [76H 21.
v-
Table 47. Change of the average magnetic moment per atom, &,, in dilute Co-3d transition metal alloys. x: impurity concentration, pi: magnetic moment of impurity atom.
Impurity
Mn
Cr
v
dL,ldx p,/at%
-4.5 - 5.2(9) -6.4 -6.8(18) -6.8(13)
X
at%
<0.16 0.05
< 0.0585 0.05 0.05
Pi PB
-0.97(70)
0.45(70)
Ref.
57Cl 7OC2 57Cl 7OC2 57Cl 7OC2
Table 48. Magnetic moment distribution for Co-V alloys [82 C 23. &,: average magnetic moment per atom derived from magnetization measurements at T= 4.2 K and Harp, = 32 kOe, pc,,, PC,, pv: atomic magnetic moments derived from polarized- neutron diffuse scattering at T= 4.2 K and Harp, = 20 kOe.
V Phase Pat PC0 PC, F” at%
PB
10 fcc+20% hcp 1.21 1.38(l) -0.26(8) 15 fee 0.871 1.05(l) -0.1 l(3) 20 fee, ordered 0.237 0.28 ‘)
Cu,Au-type 1.3 *)
‘) For Co atoms on Co sites in ordered structure. ‘) For Co atoms on V sites in ordered structure.
Table 49. Analyses for Co-V alloys of the spin-echo NMR spectra of Fig. 203 for 5gCo with 3, 2 and 1 nearest neighbor (nn) of V atoms [8OK9].
Phase 5gCo-3nnV “Co-2nnV 5gCo-lnnV
LHZ Hhro kOe ~Hz
HW, kOe ;Hz
Hhw kOe
%I 137 136 157 155 176 174 a1 138 137 167 165 195 193 UL 142 141 170 168 203 201
Ada&i
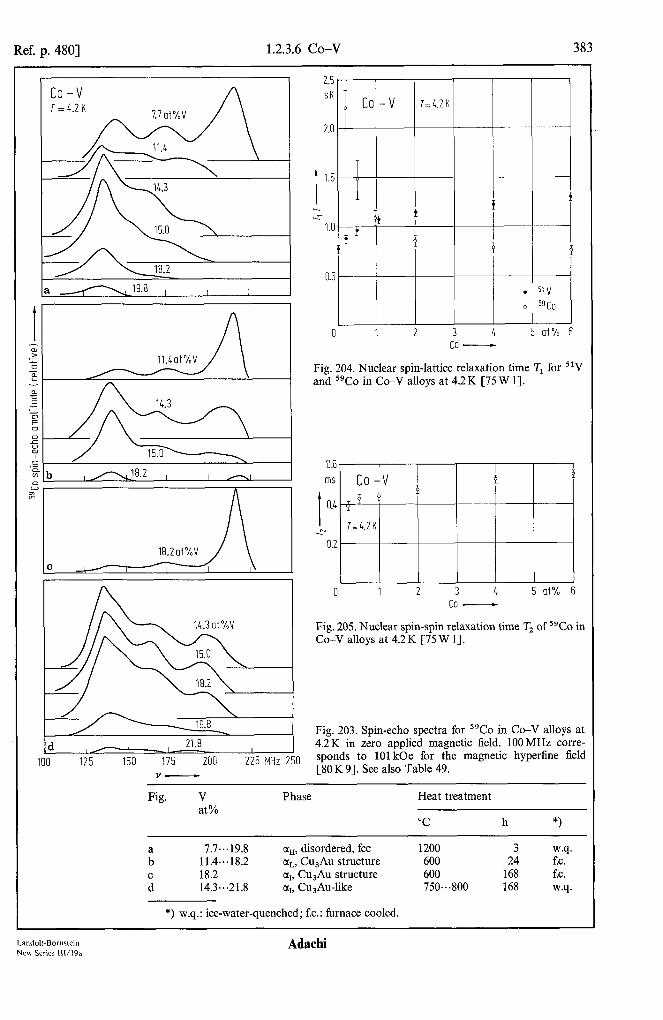
Ref. p. 4801 1.2.3.6 Co-V 383
a -19.8 , I I I
//I \ \ 15.0 \ I
1 I-: I I 125 150 175 200 225 MHz 250
Y-
2.5 SK
2.0
!
1.5
CT 1.0 I-
I co -v
$ f
rf +- f
0.5
ti 0 1
=L.ZK
L 5 at% 6
Fig. 204. Nuclear spin-lattice relaxation time TI for 51V and 5gCo in Co-V alloys at 4.2 K [75 W 11.
0.6
ms
I
04
e 0.2
Fig. 205. Nuclear spin-spin relaxation time T, of “Co in Co-V alloys at 4.2 K [75 W 11.
Fig. 203. Spin-echo spectra for 5gCo in Co-V alloys at 4.2K in zero applied magnetic field. 100MHz corre- sponds to 101 kOe for the magnetic hyperfine field [80 K 91. See also Table 49.
Fig. V Phase Heat treatment at%
“C h *I
t 11.4...18.2 7.7...19.8 c~u, CI~, Cu,Au disordered, structure fee 1200 600 24 3 w.q. EC.
i 18.2 14.3...21.8 CQ, cl,, Cu,Au Cu,Au-like structure 600 750...800 168 168 f.c. w.q.
*) w.q.: ice-water-quenched; EC.: furnace cooled.
Landok-Bdmrtein Ada&i New Series lll/l9a
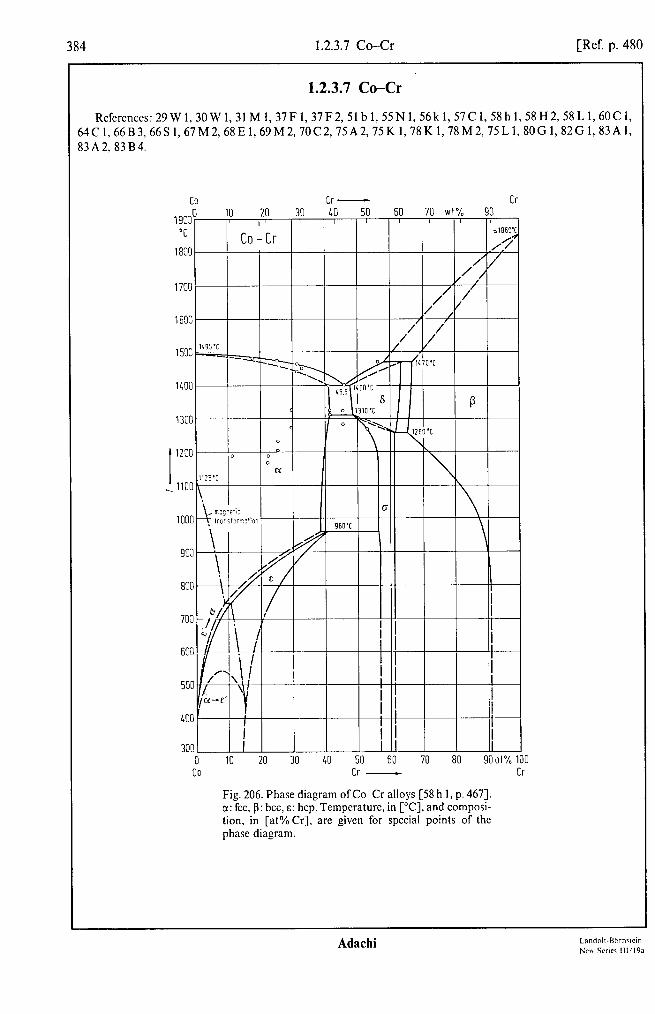
1.2.3.7 Co-G [Ref. p. 480
(
1900 “C
1800
1700
EO!
501
10 Cr - CC 0 lo 20 30 LO 50 60 70 wi% 90
0 10 20 30 40 50 60 70 80 90ot% 100 co Cr - Cr
Fig. 206. Phase diagram of Co-0 alloys [58 h 1, p. 4671. a: fee, B: bee, E: hcp. Temperature, in PC], and composi- tion, in [at% Cr], are given for special points of the phase diagram.
Adachi
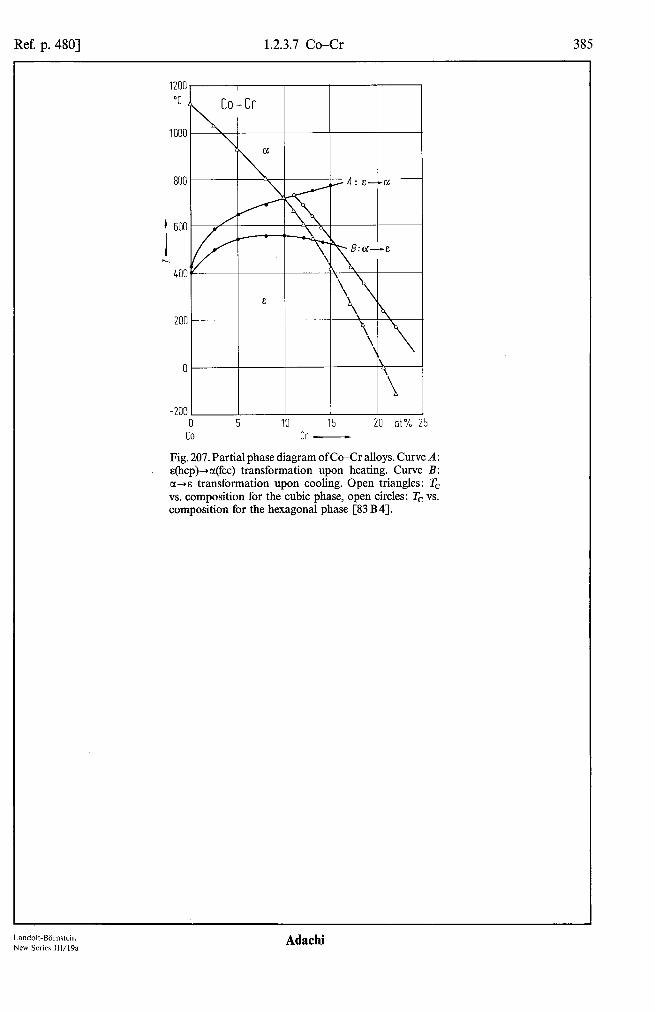
Ref. p. 4801 1.2.3.7 Co-Cr 385
800
! 600
400
200
0 \
‘1
-200 0 5 IO 15 20 at% 25
co Cr -
Fig. 207. Partial phase diagram ofCc&r alloys. Curve A: @p)+a(fcc) transformation upon heating. Curve B: ~-+a transformation upon cooling. Open triangles: Tc vs. composition for the cubic phase, open circles: Tc vs. composition for the hexagonal phase [83 B 43.
Landolt-BOrnstein New Series lll/l9a

386 1.2.3.7 Co-Cr [Ref. p. 480
6.5 ;
6.0 j I
5.5 . 9.3 ot% co
4.8’ I I I I
i
4.5
4.4
i-7 4.2
0,98ot%Fe 0.97ot%Co
3.1
3.2
2.8 co -
26 a I I I I I -200 -10: 0 100 200 300 400 500 600 700 800 “C 900
Fig. 208. (a) Magnetic mass susceptibility xn and (b) inverse magnetic mass suscepti- bility xi1 vs. temperature for Cr-3d tran- sition metal alloys. Inset: the anomaly temperature TN vs. Co concentration [66 B 31, see also [75 A23.
0 -20’. 43 0 100 200 300 400 500 600 700 800 K 900
Fig. 209a,..f. Inverse magnetic mass sus- ceptibility vs. temperature for Co-Cr al- loys with Cr-concentration just above the critical concentration for long-range mag- netic order. Open circles: cooled in the magnetic (measuring) field H,,,,, solid cir- cles: cooled in zero field, dashed line: Curie-Weiss-type behavior extrapolated [82 G I].
Adachi
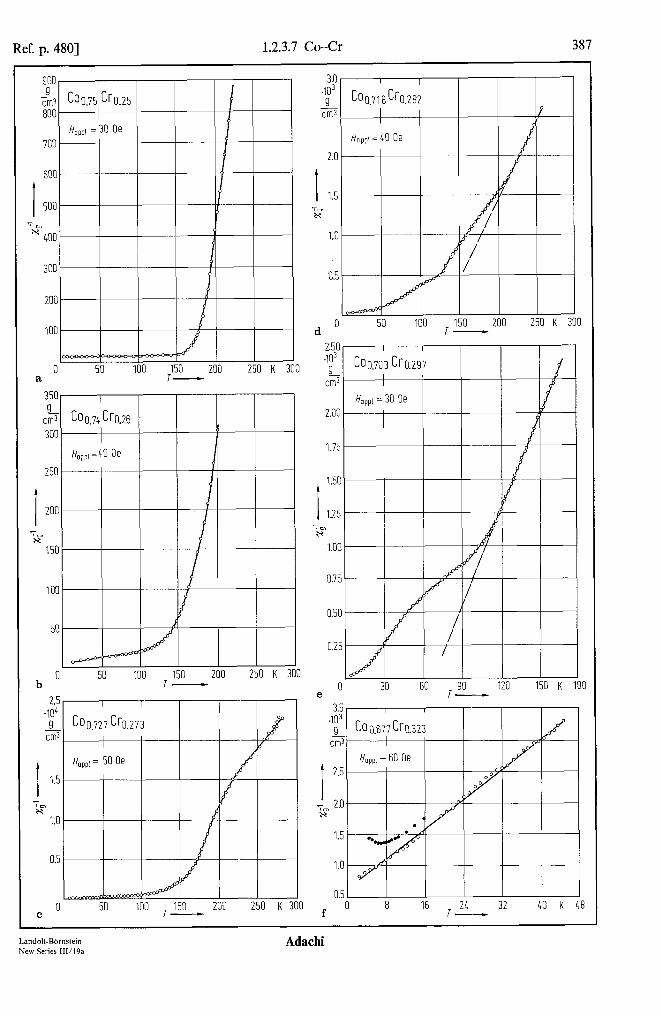
Ref. p. 4801 1.2.3.7 Co-Cr
300
201
101:
c a
50 100 150 200 250 K : T-
0 50 100 150 200 250 K 300 b
2.5 .lO" 9 cm3
210 K 3 00
- cm3 I P ,
HoppI = 40 Oe
do 2.50 .I03 9 cm3
50 100 150 200 250 K 300 T-
I I
Coo.703 Cr0.297 d I \ I I I d
1.50
i 1.25
2 1.00
0.25
0 e
30 60 ~ 90 120 150 K 180
I -g 3.5- 0.5 I
f 0 8 16 TL 32 40 K 48
Landolt-BBmstein Ada&i New Series 111/19a

388 1.2.3.7 Co-Cr [Ref. p. 480
10 w,"
I
T
coo.;5 cress
P-
---r-- ^,- - - - _
co0.s Cro.5 x"
0 50 100 150 200 250 K 300
Fig. 210. Paramagnctic mass susceptibility zp vs. tempera- turc for o-phase Co,,,sCr,,,, and Co,,,Cr,,, alloys [69 M 23.
I-
Table 50. High-temperature paramagnetic mass sus- ceptibility of the C&r alloys of Fig. 208b, expressed by the equation: x,=C$(T--O)+,y’+jT, where x0 is the background susceptibility of the host at OK and /I is the temperature variation of the susceptibility of unalloyed Cr above its TN (i.e. B =4.62. 10” cm3 g- 1 K-‘. P~~~,,-~: effective paramagnetic moment of the Co atoms in Cr [66 B 33, see also [75A 21.
co Pcff.Co 0 x0 at % PB K 10-6cm3g-’
2.79 1.7(3) 27(40) 3.14(10) 1.90 1.9(4) - 6(60) 3.08( 15) 0.97 2.1 S(60) - 17(100) 2.99(25)
a 1 0 2
225 250 .3
I . * v5 4
z 32i K
300
275
250
225 0 12 3 1, 5 6 ot% 7
Cr co -
Fig. 211. N&l tempcraturc TN for Co-Cr alloys [83 A I]. Top figure: (I) minima in resistivity vs. 7; (2) inflection points in bulk modulus B vs. 7; (3) inflection points in linear thermal expansion coefficient, (4) neutron diffrac- tion [78 K I], (5) neutron diffraction [68 E 11. Bottom ligurc: (I) inflection points in resistivity vs. 7; (2) minima in bulk modulus vs. 7; (3) minima in linear thermal expansion coefficient, (4) and (5) as in top figure.
Ada&i Landolr-Bornwin Nor Swim 111’19a
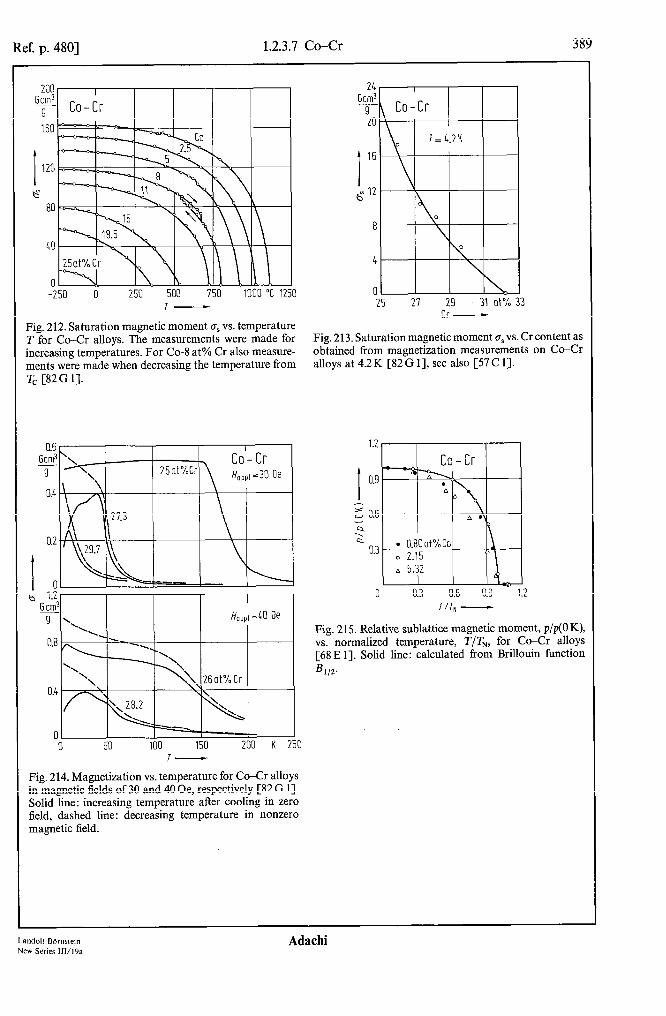
Ref. p. 4801 1.2.3.7 Co-Cr 389
2oi I y Co-Cr
160
I 120
13" 80
0-4 \I! \I\! I -250 0 250 500 750 1000 "C 1250
T-
Fig. 212. Saturation magnetic moment B, vs. temperature T for Cc&r alloys. The measurements were made for increasing temperatures. For Co-8 at% Cr also measure- ments were made when decreasing the temperature from T, [82G 1-J.
0.6 Gem'
9
0.4
0.2
I c b 1.2
@Jn 9
0.6
0.1
[
HappI A0 Oe
50 100 150 200 K 250
Fig. 214. Magnetization vs. temperature for Co-Cr alloys in magnetic fields of 30 and 40 Oe, respectively [82 G I]. Solid line: increasing temperature after cooling in zero field, dashed line: decreasing temperature in nonzero magnetic field.
I 16
g 12
8
Cr-
Fig. 213. Saturation magnetic moment gs vs. Cr content as obtained from magnetization measurements on Co-Cr alloys at 4.2 K [82 G I], see also [57 C 1 J.
1.2
I 0.9
y " 0.6
,4 Q
0.3
Fig. 215. Relative sublattice magnetic moment, p/p(O K), vs. normalized temperature, T/T,, for Co-Cr alloys [68 E 11. Solid line: calculated from Brillouin function Bl/z.
Landolt-Bbmstein Adachi New Series 111/19a
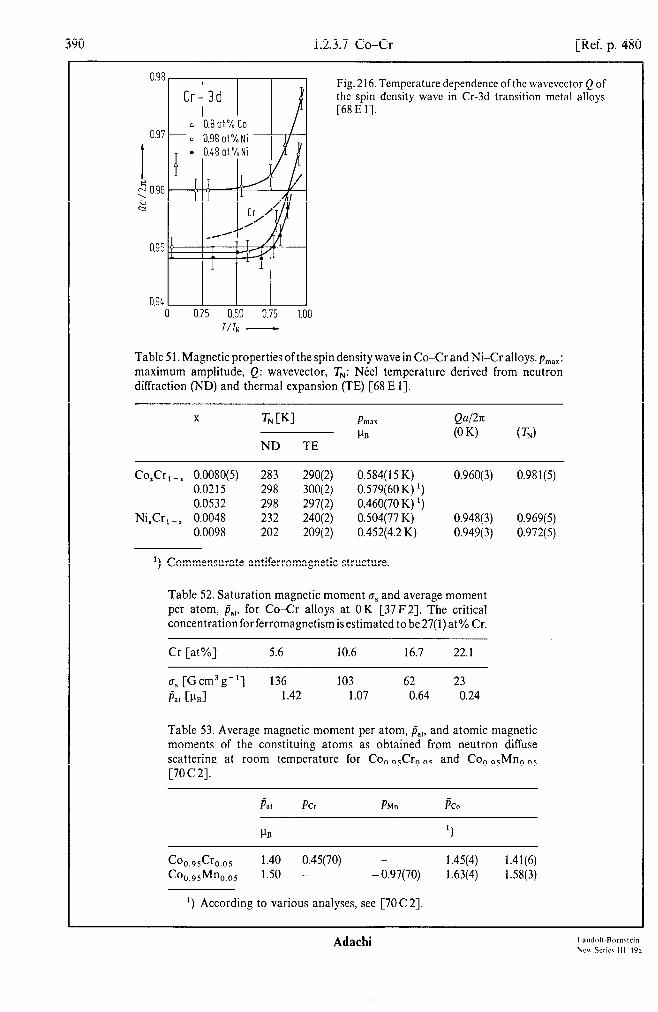
1.2.3.7 Co-Cr [Ref. p. 480
Fig. 216. Temperature dependcncc ofthc wavevector Q of the spin density wave in Cr-3d transition metal alloys [68 E I].
0 0.25 0.50 0.75 1.00 r/7, -
Table 51. Magnetic properties ofthe spin density wave in Co-Cr and Ni-Cr alloys. pmnr: maximum amplitude, Q: wavevector, 7”‘: Ntel temperature derived from neutron diffraction (ND) and thermal expansion (TE) [68 E 1-J.
X TN WI PllLlX Qd2~ PB (0 K) (TN)
ND TE
Co,Crt --r 0.0080(S) 283 290(2) 0.584( I5 K) 0.0215 298 300(2) 0.579(60 K) ‘) 0.0532 298 297(2) 0.460(70 K) ‘)
Ni,Cr r -I 0.0048 232 240(2) 0.504(77 K) 0.0098 202 209(2) 0.452(4.2 K)
‘) Commensurate antiferromagnetic structure.
0.960(3) 0.981(5)
0.948(3) 0.969(5) 0.949(3) 0.972(5)
Table 52. Saturation magnetic moment o, and average moment per atom, p,,, for Co-Cr alloys at 0 K [37 F 23. The critical concentration for ferromagnetism is estimated to be 27(l) at % Cr.
Cr [at%] 5.6 10.6 16.7 22.1
CT, [Gcm3g-‘1 136 103 62 23 PM cib1 1.42 1.07 0.64 0.24
Table 53. Average magnetic moment per atom, P,,, and atomic magnetic moments of the constituing atoms as obtained from neutron diffuse scattering at room temperature for Co,~,,Cr,~,, and Co,~,,Mn,~,, [7OC2].
Pa, Per PM”
PB
Coo.9sCro.05 1.40 0.45(70) co o.9sMno.os 1.50 - -0.97(70)
‘) According to various analyses, see [70 C 21.
PC”
7
1.45(4) 1.41(6) 1.63(4) 1.58(3)
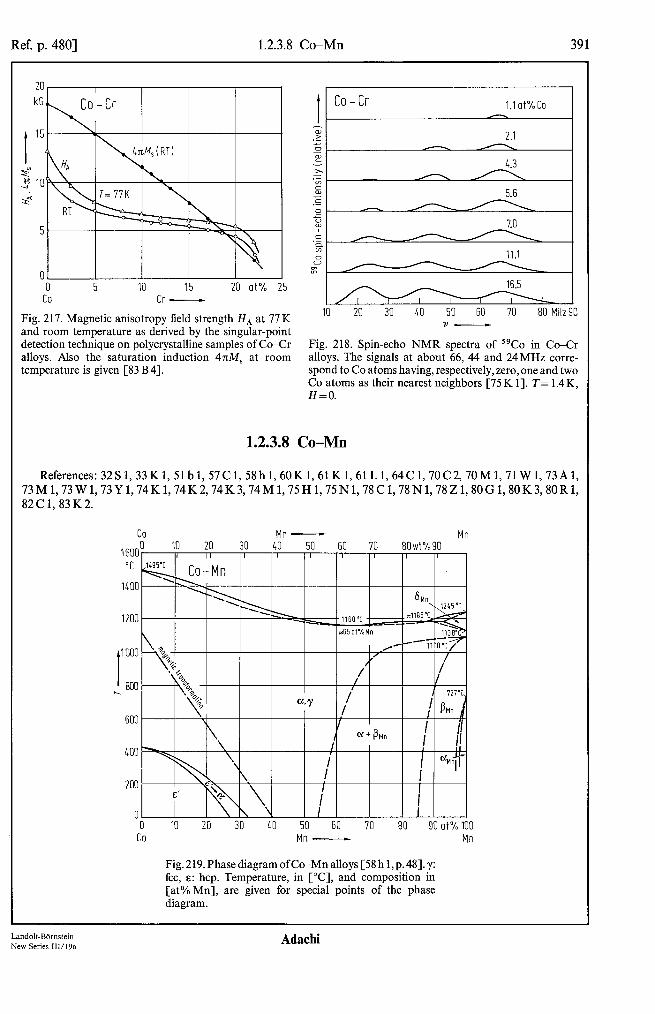
Ref. p. 4801 1.2.3.8 Co-Mn 391
LU
kG
0 5 10 15 20 at% 25 co Cr -
Fig. 217. Magnetic anisotropy field strength H, at 77 K and room temperature as derived by the singular-point detection technique on polycrystalline samples of Co-Cr alloys. Also the saturation induction 4nM, at room temperature is given [83 B4].
10 20 30 40 50 60 70 80 MHz90 V-
Fig. 218. Spin-echo NMR spectra of “Co in Co-Cr alloys. The signals at about 66, 44 and 24MHz corre- spond to Co atoms having, respectively, zero, one and two Co atoms as their nearest neighbors [75 K I]. T= 1.4 K, H=O.
1.2.3.8 Co-Mn
co Mn - Mn 1600~ 10 20 30 40 50 60 70 80WY/~90
I I I
\ I I ,111
I I II
400 -= \
:
I I
JJ-
I gMnl 1
01 \n ‘4 0 10 20 30 40 50 60 70 80 90 at% 100
co Mn - Mn
Fig. 219. Phase diagram ofCoMn alloys [SS h 1,~. 481. y: fee, E: hcp. Temperature, in PC], and composition in [at% Mn], are given for special points of the phase diagram.
Land&-Bbmstein New Series III/l9a
Adachi

392 1.2.3.8 Co-Mn [Ref. p. 480
I 50 100 150 200 250 300 350 K 4 0
a 30
.lOf
I
cm! T-
0 b
50 50 100 100 150 150 200 200 250 K 300 250 K 300 T-
Fig. 220. Magnetic mass susceptibility xs vs. temperature for CoMn alloys. (a) 35,..50at% Mn co) 60...85 at% Mn [75 H I]. Arrows indicate the temperature T, of the susceptibility maximum.
J I I/l /
0 100 200 300 400 500 600 700 K 800 I
Fig. 221. Inverse magnetic volume susceptibility, x; *, vs. temperature for Co-Mn alloys [60 K I].
800 \ ‘\
,A I
I
600 ---: i'-fw,N-Mn
400 -I-. I. \o
t. 1200
'\
1000 \ \
\,.Co-Mn
200
-600
-800 I 0 5 IO 15 20 25 30 at% LO co Mn -
Fig. 222. Paramagnetic Curie temperature 0 vs. Mn concentration of Co-Mn and Ni-Mn alloys. Circles: [60K I], triangles: [57 C I].
2.5
I 2.0
= a"
1.5
0 0 5 10 15 20 25 30 35ot%10
Mn-
Fig. 223. Effective paramagnetic moment per atom, pefr, for Co-Mn and Ni-Mn alloys. Circles: [60K 11, trian- gles: [57 C I].
Ada&i
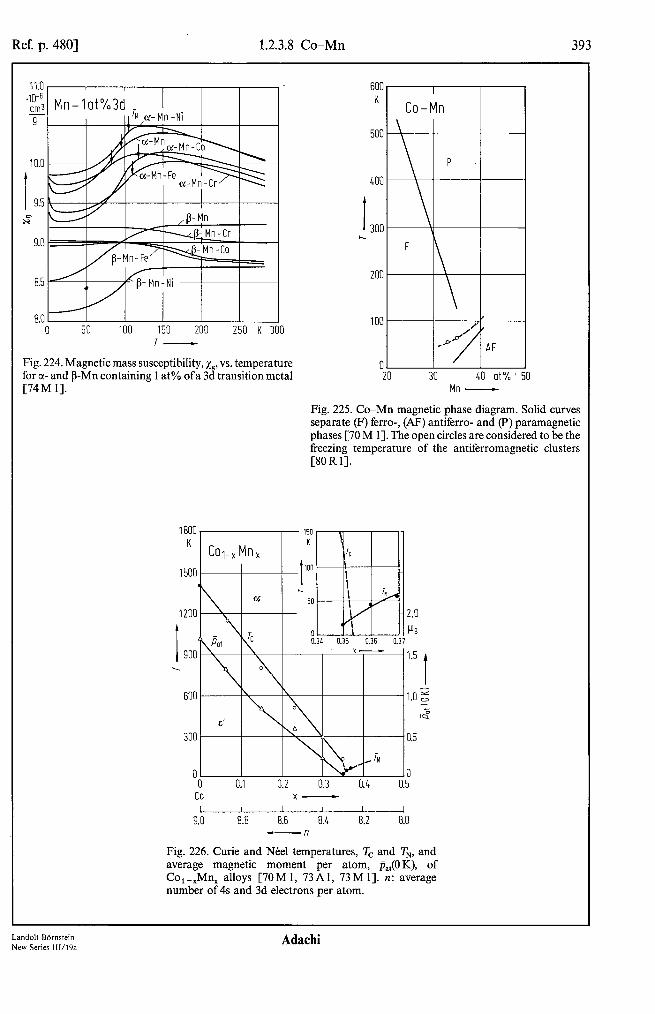
Ref. p. 4801 1.2.3.8 Co-Mn 393
11.0 .lO-" cm: s
1o.c
t 9.E:
x"
9.c
8.E
8.C 50 100 150 200 250 K 300
I-
600 K
500 500
400 400
I I 300 300 6. 6.
200 200
100 100
Fig. 224. Magnetic mass susceptibility, xs, vs. temperature 01 / / 1 for c1- and O-Mn containing 1 at% ofa 3d transition metal 20 30 40 ato/0 50 [74 M 11. Mn -
Fig. 225. Co-Mn magnetic phase diagram. Solid curves separate (F) ferro-, (AF) antiferro- and (P) paramagnetic phases [70 M 11. The open circles are considered to be the keezing temperature of the antiferromagnetic clusters [8ORl].
1800, I I 150 -1
K I Chx in, I K I ‘i+ I II
12001 I I i/r H2.0
i I I I I I
9.0 8.8 8.6 8.4 8.2 8.0
Fig. 226. Curie and NCel temperatures, Tc and TN, and average magnetic moment per atom, j&,(OK), of Co,-,Mn, alloys [70Ml, 73A1, 73MlJ n: average number of 4s and 3d electrons per atom.
Landolt-BOrnstein New Series 111/19a
Adachi

394 1.2.3.8 Co-Mn [Ref. p. 480
I
10
5 Cl
-10
-20
-30
a
60[ K
50[
V Cr Mn Fe Co Ni
I
4oc
~ 3oc
200
100
Y b
.56 3.58 3.60 3.62 1 3.6L u-
4OC G
2oc
I z O
-200
-4oc
Fig. 227a. Change of N&l temperature AT’ ofu-Mn as a consequence of alloying with 1 at% of a 3d transition element [74M I]. Solid circles: [74M 11; open circles: [73 W I], triangles: [71 W I].
Fig. 227b. Relationship between Ntel temperature and lattice parameter of Co--Mn alloys and other y-Fe type alloys [73A I].
G co ( 0.6UMn0.313 ( / / 40
I 20
P O
-40
-60 1 6 I I
G coo.627 Mno.373
-6 -8 -6 -4 -2 0 2 1, 6 kOe 8
Fig. 228. Hysteresis loops of the magnetization M of various Co-Mn samples at 4.2 K. Solid lines: cooled in a field of HZ,,,,,= + 5 kOe, dashed line: zero-field cooling [60 K I].

Ref. p. 4801 1.2.3.8 Co-Mn 395
IO
50 G
4
3
2
1
0 In-!--+ I- I 0 100 200 300 400 500 600 700 K 800
T-
Fig. 229. Magnetization M vs. temperature for Co-Mn alloys in various magnetic field strengths H, which was slowly cycled between k 8 kOe. For H =4 kOe, the open and the solid points represent the descending and ascend- ing field branches of the hysteresis loops, respectively [60K 11.
Table 54. Average magnetic moment per atom, &, of CeMn alloys, derived from magnetization values at H app, =40 kOe, and average magnetic moment of Co and Mn atoms, PC0 and P,,, respectively, derived from polarized neutron diffuse scattering [82 C 11, see also [70 c 21.
5.0 1.52 1.63 -0.53(12) 9.7 1.36 1.54 - 0.30(9)
14.7 1.18 1.44 -0.33(9) 19.8 0.88 1.18 -0.33(6) 24.4 0.58 0.80( 1) -0.11(4)
;P Co-Mn 1
0 1.5 c
0
I
PC0 0
1.0 c
19; 0 D
la" 0.5 I -PM”
0 I
1.8 , I I 1.8 Ps 7 I I 1.7 1.7
t t - 1.6 - 1.6 z z
lc;- lc;-
1.5 1.5
6 co Cr, Mn -
Fig. 232. Average magnetic moment per atom, p,,(O K), of Co-Mn and Co-Cr alloys [57C 11. For pure Co, jc0=1.715uB.
-0 IO 20 at% 30 co Mn -
Fig. 230. Average ferromagnetic moments for the Co and the Mn atoms, jc,, and jiMn, respectively, in Co-Mn alloys. Note that the Mn moments are negative. See also Table 54 [82 C 11, see also [78 N I].
Fig. 23 1. Antiferromagnetic structure of Co-Mn (fee). The spin direction is indicated by angles 0 and 4 [73 A 11.
Land&-Bdmstein New Series 111/19a
Adachi

396 1.2.3.8 Co-Mn [Ref. p. 480
161 Gcm3
9
15C
90
I b a'
60
100 200 300 kOe 4 H O??l -
1.75 1.75 3.5 3.5
PC! PC! AD-5 AD-5
1.50 1.50 cm3 cm3 -c -c
1.25 1.25 2.5 2.5
I I 1.00 1.00 2.0 2.0 I I
,c ,c 0.75 0.75 1.5 1.5 ,= ,=
0.50 0.50 1.0 1.0
0.25 0.25 0.5 0.5
0 0 0 0 0 0 10 10 20 20 30 30 40 40 50 50 at% at% 60 60 Co Co Mn Mn - -
Fig. 234. Avcragc magnetic moment per atom. j,,. as derived from magnetization measurements in pulsed magnetic fields up to 400 kOe and high-field susceptibility xHF for Co-Mn alloys at 4.2 K [83 K 23. see also [60 K I].
Fig. 233. Magnetization curves for Co-Mn alloys measu- red in pulsed magnetic fields at 4.2 K [83 K 21, see also [80 K 3).
Adachi

Ref. p. 4801 1.2.3.8 Co-Mn 391
a-Mn-M site I
3ot%Ru
Sat%Ru
I I 200 210 220 230 MHz 2
Y-
9at%Ru
I 20 30 40 50 60 MHz
v- 70
cz-Mn-M site II
3at% Ru
9at%Ru
Fig. 235. NMR line shapes for “Mn at crystallographic sites (I...III) for Mn in a-Mn-transition metal alloys.For definition of the lattice sites, see Fig. 46 [74 K 11.
Landolt-Bbmstein New Series 111/19a
Adachi
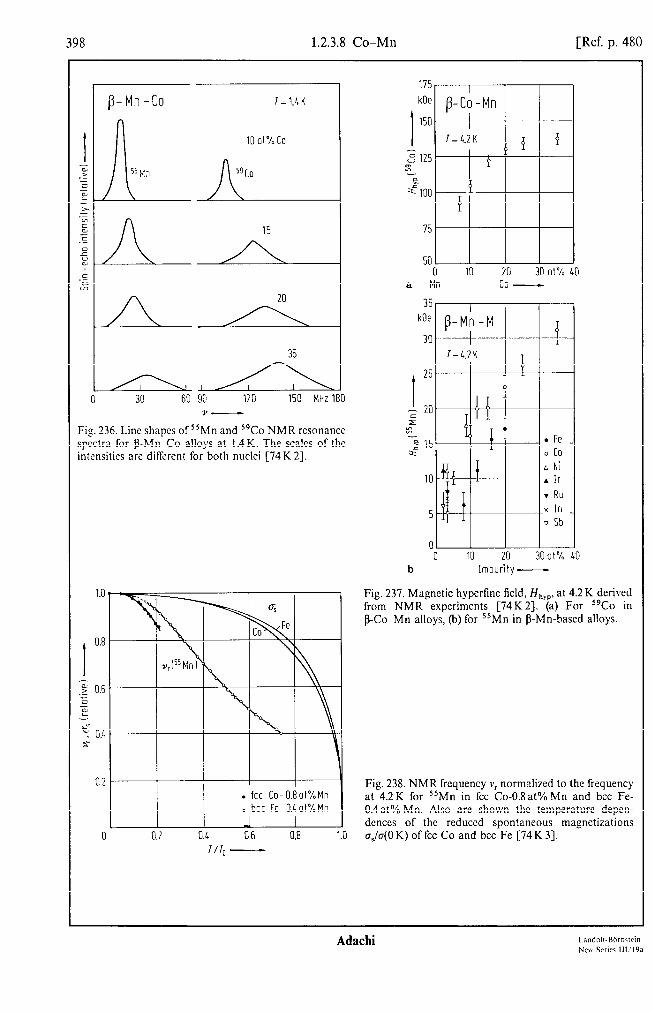
39s 1.2.3.8 Co-Mn [Ref. p. 480
/3-Mn-Co T=l.kK
A AL A
I
30 60 90 120 150 MHz 180 1' -
Fig. 236. Line shapes of “Mn and 59Co NMR rcsonancc spectra for fl-Mn--Co alloys at 1.4K. The scales of the intensities arc different for both nuclei [74 K 21.
1.0
I 0.8
2 0.6 z x - ‘;1 0.4 t
0.2
0 0.2
. fee Co-O.Eot%Mn 0 bee Fe-O.4 ot% Mn
0.4 0.6 0.8 7/r, -
175
kOe
I 150
3 125 22 I, > s" 100
75
50
P-Cb-Mn I
T=k2K -if p
YP
10 20 30 ot% 40 a Mn co -
35 kOe
3c T= L.2 K
0 10 20 300~% 10 b Impurity-
Fig, 237. Magnetic hypcrfinc field, Hhyp, at 4.2 K derived from NMR experiments [74K 23. (a) For s9Co in fi-Co--Mn alloys, (b) for “Mn in p-Mn-based alloys.
Fig. 238. NMR frequency v, normalized to the frequency at 4.2 K for 55Mn in fee Co-O.8 at% Mn and bee Fe- 0.4at% Mn. Also are shown the temperature depen- dcnccs of the reduced spontaneous magnetizations uJu(OK) of fee Co and bee Fe [74 K 33.

Ref. p. 4801 1.2.3.8 Co-Mn 399
320 330 X0 350 360 370 380 MHz J+
Fig. 239. Spin-echo NMR spectra for “Mn in Co-Mn alloys at 1.6 K [73 Y 11.
375.0 MHz I’ 372.5
t 370.0
c z 367.5 w x
365.0
362.5
360.0
357.5 5 10 15 kOe 20
H OPPl -
Fig. 241. Spin-echo NMR frequency for “Mn in co 0,95Mn,,,, at 1.6 K as dependent on an applied field. The straight line is drawn according to the relation: WAK,,, = - 1.05 MHz/kOe [73 Y 11.
-340 kOe
I -350 c 25 w
12-360
-370 0 2.5 5.0 7.5 at%lO.O
co Mn- -
Fig. 240. Mean hyperfine field Hhyp for 55Mn in Co-Mn alloys at 1.6 K [73 Y 11.
0 50 100 150 200 250 K T-
Fig. 242. Temperature dependence of the NMR tie- quency v, for 55Mn in fee Co-O.8 at% Mn in zero applied magnetic field. HhYP= - 358.3(5)kOe at 4.2K [74K 31. Hhyp = - 357.52(15)kOe for 52Mn in fee Co at 1OmK [78Z 11.
Adachi New Series lll/l9a

400 1.2.3.8 Co-Mn [Ref. p. 480
80 I PS p-Co-Mn P
70. I I
l=l.bK
60 60
I 50
2 LO CT
P 30
20
10
0 10 20 3Ool% LO Mn co -
Fig. 243. Transverse or spin-spin relaxation time T, of “Co in P-Co--Mn alloys at 1.4K [74K 21.
JO” erg cm?
5
I 1
LO 80 120 160 200 260 280 K 320 rw
Fig. 244. Hexagonal first order magnctocrystallinc ani- sotropy constant K, vs. tempcraturc for Co alloyed with small amounts of 3d transition elements. Measuring field strcncgth H,,,, =32kOe [64C I].
1.5 mJ
K2%
6.5
I 6.0
x 5.5
5.0
4.5
4.0 2 I 6 8 10 ot% 12
Impurity-
Fig. 245. Electronic specific heat coefficient 7 for Co alloyed with 3d transition elements [80G I].
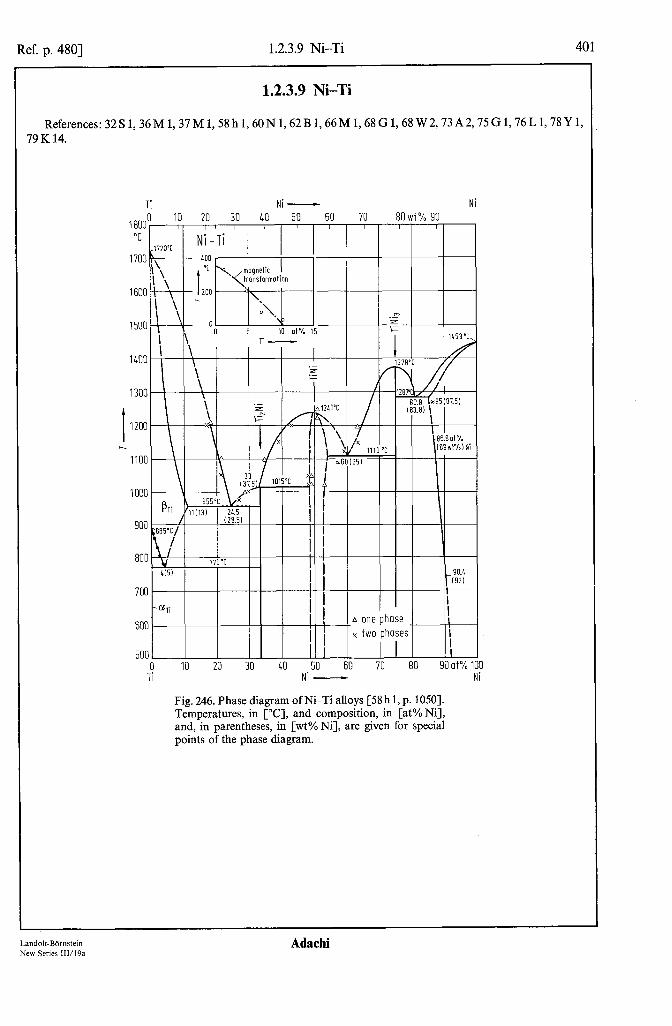
Ref. p. 4801 1.2.3.9 Ni-Ti
Ti Ni - Ni
1 800° IO 20 30 40 50 60 70 80 wt% 90 I 11 I , I I I I I
“C 1720°C
Ni -Ti
1600
I 500
1400
1300
1200
1100
1153'C
4
a7.5)
lot%
800
600
500 0 IO 20 30 40 50 60 70 80 90 at% 100
Ti Ni - Ni
Fig. 246. Phase diagram of Ni-Ti alloys [SS h 1, p. lOSO]. Temperatures, in PC], and composition, in [at% Nil, and, in parentheses, in [wt% Nil, are given for special points of the phase diagram.
Landolt-BOrnstein New Series 111/19a
Ada&i

402 1.2.3.9 Ni-Ti [Ref. p. 480
635 K
620
I 605
L-Y 590
560 0 0.5 1.0 1.5 ot % 2.0
Ti -
Fig. 247. Fcrromagnctic Curie tempcraturc Tc of NipTi alloys. derived from resistivity measurements [78 Y I]. Open circles: maximum in dc/dTand solid circles: “kink- point” technique.
Table 56. Mean magnetic mo- ment per atom. j,,. for Ni-Ti alloys, as derived from saturation magnetization measurements at 4.2 K in fields up to 30kOe [75 G 11.
Ni 0.616 ‘) 2 0.528 4.8 0.404 6.1 0.329 8 0.271
10 0.203 12 0.149 14 0.103
Table 55. Change of the average magnetic moment per atom: pat, and of the Curie temperature Tc of Ni-3d transition metal alloys. x: impurity concentration.
Impurity x at%
dL,ldx PB
dTc/dx K
Mn
Cr
V Ti
o... 5 f2.4 [32 S l] - 11.0(5) [37 M l] +2.8 [62V l]
o... 10 -4.4 [32 S l] -35 [37 M l] -6.0 [62V 1)
O...lO -5.2 [32S l] -55(3) [37 M l] 0...15 -4.0 [32 S l] -21 [37 M l]
Table 57. Magnetic moment distribution for Ni-Ti alloys. P,,: average magnetic moment per atom derived from magnetization measurements in a field of 13 kOe. PNi and pri: average magnetic moments of the Ni and Ti atoms, respectively, as derived from elastic diffuse scattering of polarized neutrons at room temperature [79 K 141. Magnetic moments in bB1.
Ti at%
3.87 7.72
1 Pat Ph’i hi
RT 4.2 K RT RT
3.537 0.383(5) 0.444(5) 0.402(7) - 0.08(2) 3.55 1 0.185(S) 0.267(6) 0.21(l) -0.09(4)
‘) [71 c43.
Adachi
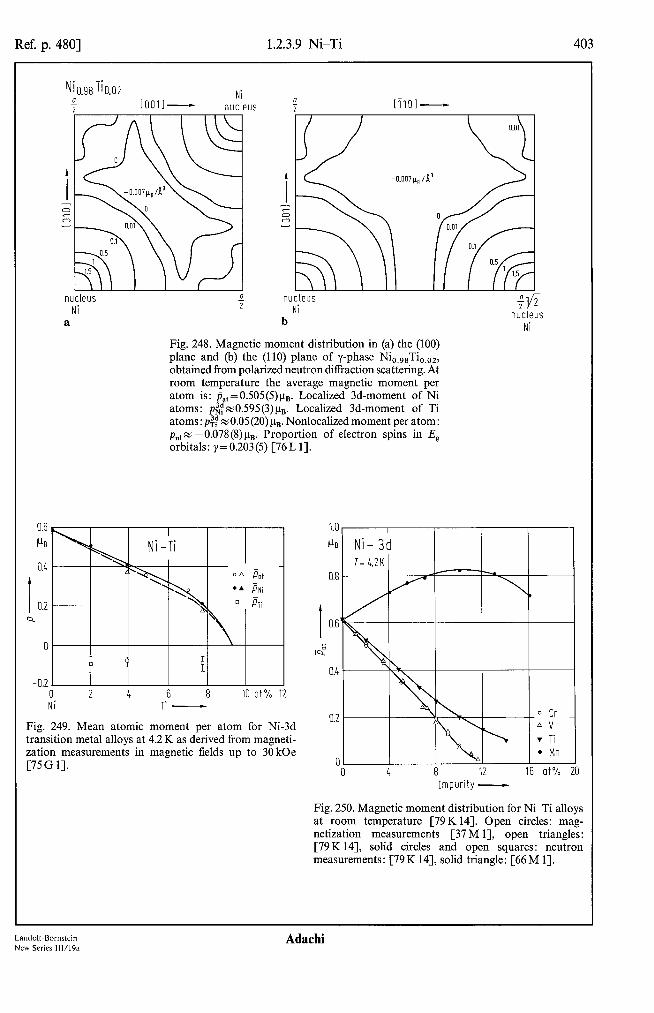
Ref. p. 4801 1.2.3.9 Ni-Ti 403
nucleus Ni
a
0 i
nucleus Ni
:fi
b nucleus
Ni
Fig. 248. Magnetic moment distribution in (a) the (100) plane and (b) the (110) plane of y-phase Ni,.,,Ti,,,,, obtained from polarized neutron diffraction scattering. At room temperature the average magnetic moment per atom is: &,=0.505(5)pr,. Localized 3d-moment of Ni atoms: pNi . 3d x 0 595 (3) un. Localized 3d-moment of Ti atoms : p:p z 0.05 (20) us. Nonlocalized moment per atom : Pnl - N -O.O78(8)un. Proportion of electron spins in E, orbitals: y = 0.203 (5) [76 L 11.
-0.2 0 2 4 6 8 10 at% 12 Ni Ti -
Fig. 249. Mean atomic moment per atom for Ni-3d transition metal alloys at 4.2 K as derived from magneti- zation measurements in magnetic fields up to 30 kOe [75 G 11.
0 4 8 12 Eat%0 Impurity -
Fig. 250. Magnetic moment distribution for Ni-Ti alloys at room temperature [79K 141. Open circles: mag- netization measurements [37 M 11, open triangles: [79K 141, solid circles and open squares: neutron measurements: [79 K 141, solid triangle: [66 M 11.
Landolt-Bbmstein Adachi New Series lWl9a

404 1.2.3.9 Ni-Ti [Ref. p. 480
Table 58. Electronic and lattice contributions, y and /?, respectively, to the molar specific heat of Ni-3d transition metal alloys in the temperature range 1...4 K [75 G 1).
X Y P
mJmol-’ Km2 mJ mol-’ Km4
Ni, -$rr
Ni, -IV,
Ni, -,Ti,
0.005 0.01 0.02 0.035 0.17 0.30 0.005 0.0115 0.02 0.035 0.0507 0.05 11 0.0685 0.073 0.08 0.09 0.094 0.10 0.11 0.116 0.15 0.18 0.02 0.048 0.067 0.08 0.10 0.12 0.14
Ni
7.287(2) 7.544(2) 7.989(2) 8.585(2) 7.389(2) 6.950(2) 7.203(2) 7.404(2) 7.641(2) 8.033( 1) 8.277(2) 8.288(2) 8.390(2) 8.405(2) 8.652(3) 8.996(2) 9.344(2) 9.967(8) 9.992(9) 8.065(13) 4.789( 1) 3.867( 1) 7.453(2) 7.853(2) 7.972(2) 7.975(2) 8.154(2) 8.183(2) 8.219(10) 7.034(3)
0.0202(2) 0.0204(2) 0.0207(3) 0.021 l(2) 0.0178(2) 0.0173(2) 0.0203(2) 0.0208(3) 0.0208(2) 0.02 12(2) 0.0247(2) 0.0242(2) 0.0270(3) 0.0268(3) 0.0254(3) 0.0230(3) 0.0179(2) 0.0053(5)
-0.0104(5) 0.0033(6) 0.0169(2) 0.0161(2) 0.0195(2) 0.0224(2) 0.0226(2) 0.0257(3) 0.0264(3) 0.0181(2) 0.0157(5) 0.0222(3)
Ada&i
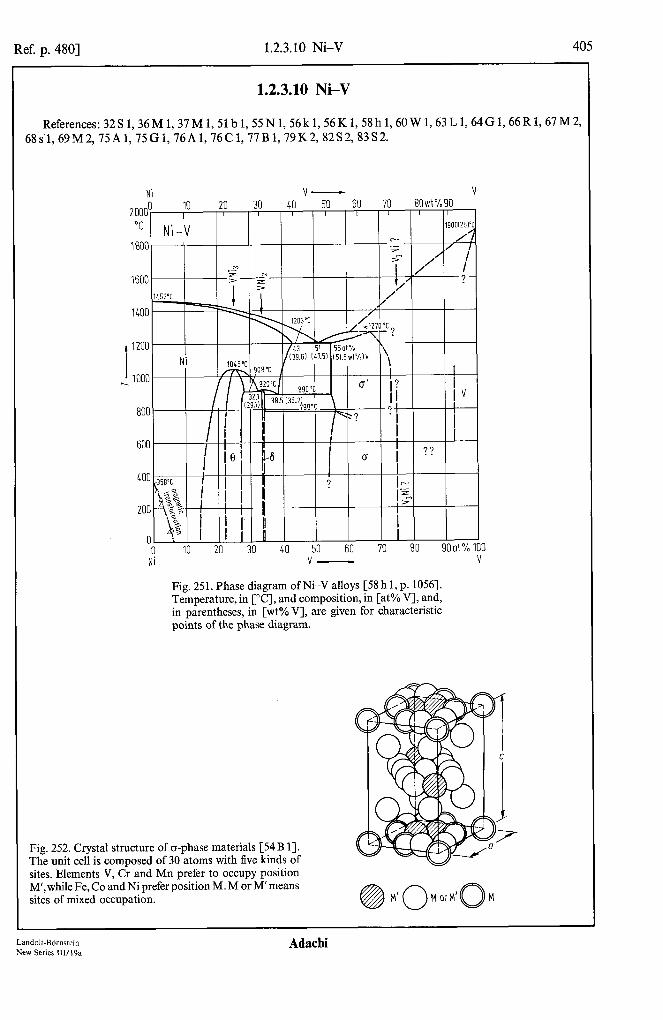
Ref. p. 4801 1.2.3.10 Ni-V 405
Ni v- V I.. 2ooo” I’! 20 30 40 50 60 70 80wt%90
I I I I I I I I
"' Ni-V 1900125)"1
1800 L--. /:
I .- - / I P /
’ I 1600
.g --._N 1 / =- z
+/ / ?- >
1453°C -J 1 / 1400
/’ x127OT
/-47n- ?
Ni j/UY.bl 141.31 151,5wt”/o/.)V \
I I
1
890 ‘C 6’
i.21 ’ \ 17 Iv
I
%:7 ?I
??
I I 1 I i 1
i/ I I
II
? 1 1
0 IO 20 30 40 50 60 70 80 90 at % Ni v-
100 V
Fig. 251. Phase diagram ofNi-V alloys [58 h 1, p. 10561. Temperature, in c”C], and composition, in [at% V], and, in parentheses, in [wt% V], are given for characteristic points of the phase diagram.
I C
I I- /
Fig. 252. Crystal structure of o-phase materials [54 B 11. The unit cell is composed of 30 atoms with five kinds of sites. Elements V, Cr and Mn prefer to occupy position M’,while Fe, Co and Ni prefer position M. M or M’means sites of mixed occupation.
Landolt-Biirnstein New Series 111/19a
Adachi
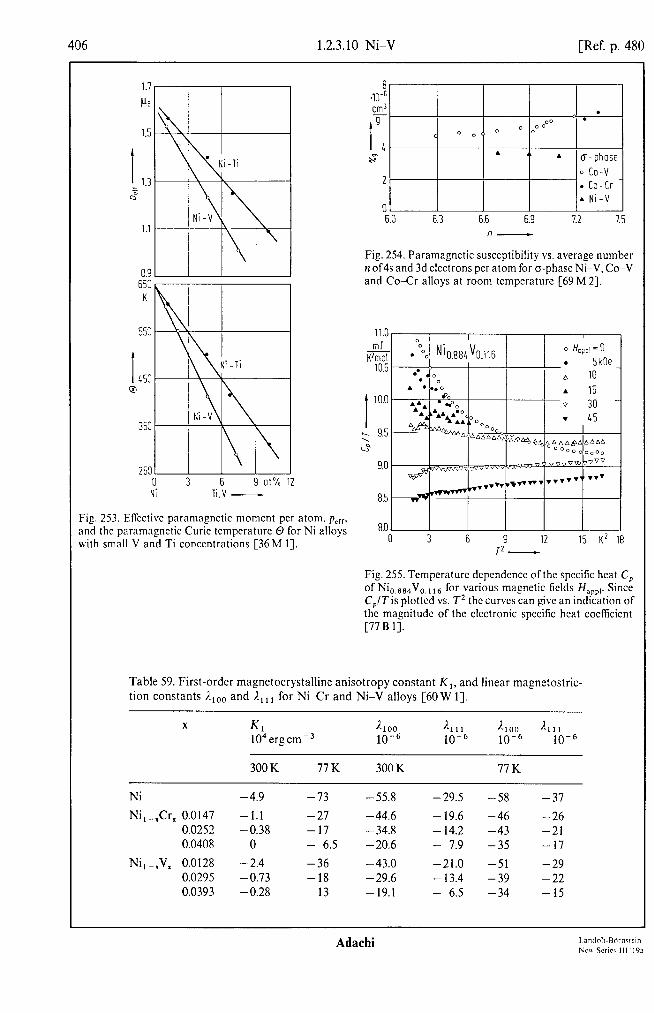
406 1.2.3.10 Ni-V [Ref. p. 480
H” . 1, . c-phase 0
2 2 0 co-v co-v . . Co-Cr Co-Cr A Ni-V A Ni-V
0 0 6.0 6.0 6.3 6.3 6.6 6.6 6.9 6.9 I.2 I.2 1.5 1.5
Fig. 254. Paramagnetic susceptibility vs. average number n of4s and 3d electrons ncr atom for o-chase NT-V. Co-V
I J
6% and Co-0 alloys at room tempcratuie [69 M 21.’ K
550 11.0 mJ
I
K2mol 10.5
153 Q
10.0
253
Ni 1i.V -
Fig. 253. Efkctive paramagnctic moment per atom. pcrr, and the paramngnctic Curie tcmpcraturc 0 for Ni alloys with small V and Ti concentrations [36 M I].
9.0
8.5
8.01 0 3 6 ,L+ 12 15 K2 18
Fig. 255. Tcmperaturc dcpcndencc ofthe specific heat C, of Ni ,,ssaV,,, t6 for various magnetic fields H,,,,. Since C,/T is plotted vs. T2 the curves can give an indication of the magnitude of the electronic specific heat coefficient [77 B 11.
Table 59. First-order magnetocrystalline anisotropy constant K,, and linear magnetostric- tion constants i.,,, and I., , I for Ni-Cr and Ni-V alloys [60 W 11.
X K, 1 6100 1 bill 3 ‘100 1 ‘1 11
104ergcmm3 10-6 10-6 10-6 10-6
300 K 77K 300 K 77K
Ni -4.9 -73 -55.8 -29.5 -58 -37
Ni, -&rx 0.0147 -1.1 -27 -44.6 - 19.6 -46 -26 0.0252 -0.38 -17 - 34.8 - 14.2 -43 -21 0.0408 0 - 6.5 -20.6 - 7.9 -35 -17
Ni,-,V, 0.0128 - 2.4 -36 -43.0 -21.0 -51 -29 0.0295 -0.73 -18 - 29.6 - 13.4 -39 -22 0.0393 -0.28 -13 - 19.1 - 6.5 -34 -15
Adachi

Ref. p. 4801 1.2.3.10 Ni-V 407
Table 60. Specific heat parameters for fee Ni-Mn and fee Ni-V alloys, according to the equation C, = A + y T. Also the Debye temperature On is given [64G 11.
X Heat treatment Magnetic field y rms dev. A @D low4 cal K
10-4calmol-1K-2 mol-‘K-r
Ni, -xMnx 0.20
0.25
0.25
0.25
0.25
0.25
0.25
0.25
0.25
0.30
0.40
0.60
0.75
Ni, -xV, 0.09
0.18
0.28
0.35
0.35
0.40
quenched from 11oo”c
quenched from 11oo”c
quenched from 11oo”c
quenched from 1100 “C
quenched from 1100 “C
quenched from 1000 “C and 2 h at 485°C
quenched from 1000 “C and 2 h at 485 “C
quenched from 1000 “C and 2 h at 485 “C
quenched from 1100 “C and 2.5 h at 535°C
quenched from 11oo”c
quenched from 1000 “C
quenched from 980 “C
quenched from 1000 “C
quenched from 1150°C
quenched from 1150°C
quenched from 1150°C
quenched from 1150°C
quenched from 1150°C
quenched from 1150°C
none
none
cooling to 1.4K
cooling and measurement
none
none
22.1 2.09 373
23.1 0.30 1.67 329
20.7 5.26 261
21.5 3.80 266
22.7 3.02 279
18.5 3.80 313
cooling to 1.4K 18.1 3.65 291
cooling and measurement
18.3 3.14 315
none 23.5
16.7
8.0
9.9
15.9
0.50 0.36
2.81
4.74
3.34
3.99
422
none
none
none
none
none
none
none
none
none
none
356
312
311
307
19.3 7.05 398
9.5 3.22 479
10.2 0.40 388
10.7 0.50 422
10.7 0.40 421
11.5 1.00 419
Landolt-Bbmstein New Series IIl/19a
Ada&i
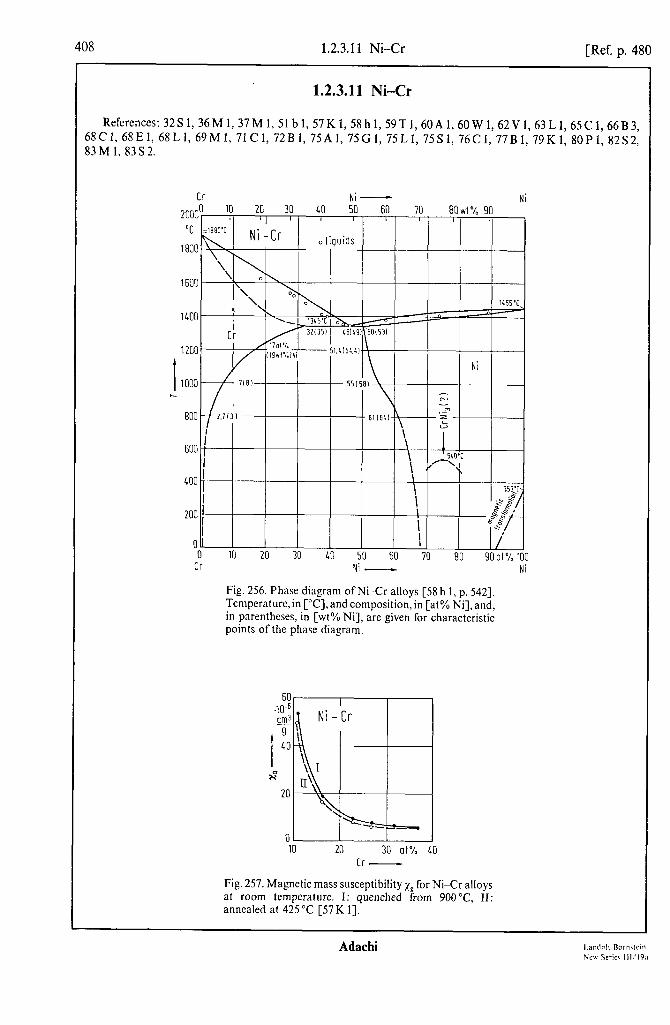
408 1.2.3.11 Ni-Cr [Ref. p. 480
1.2.3.11 Ni-Cr
cr Ni - Ni -. 2ooo0 10 / 20 / 30 40 50 60 70 80wt% 90
I 4 I I I I I “.- I’C Ni -Cr o liauids
1600
\
j 5CO’C
\ Y-Y,
\
I I
50 60 70 80 Cr Ni - Ni
Fig. 256. Phase diagram ofNi-Cr alloys [SS h 1, p. 5421. Temperature, in [“C], and composition, in [at% Nil, and, in parentheses, in [wt% Ni], are given for characteristic points of the phase diagram.
Fig. 257. Magnetic mass susceptibility xp for Ni-Cr alloys at room temperature. I: quenched from 900 “C, II: annealed at 425 “C [57 K 11.
Adachi

Ref. p. 4801 1.2.3.11 Ni-Cr 409
Table 61. Paramagnetic properties of Ni-Cr alloys derived from the susceptibility vs. temperature curves given in Fig. 259, according to the equation: xp = x0 + C$( T- 0) [72 B 11.
Cr [at%] 11.0 11.5 12.0 12.5 13.1 13.5 15.3 C, [10M4cm3 Kg-‘] 22.2 17.6 14.7 12.2 9.9 11.2 15.6 @ CKI 96 89 51 48 2.5 -21 - 248 x0 [10e6cm3 g-i] 4.09 3.92 4.70 4.37 4.85 4.74 4.44
44 I
.I!" Ni-Cr Y cm3
28
I 24
7 s20
16
00
Fig. 258. Inverse of the magnetic mass susceptibility, xi ‘, vs. temperature for Ni-Cr alloys. From the curves labelled a for 6 and 14 wt% Cr the curves labelled b are obtained by correcting for a temperature-independent paramagnet- ic susceptibility x0 of 2.07. 10m6 and 3.82. 10m6gcmm3, respectively [36 M 11.
For Fig. 260, see page 413.
Fig. 261. Magnetic phase diagram of dilute Ni-Cr (dashed lines) and Cc&r (solid line) alloys. T-IC and L-IC denote transverse and longitudinal spin density wave states, respectively. AF means commensurate antiferromagnetic state. Circles: [68 E l] and triangles: [66 B 31.
0 250 500 750 1000 K 12 50 T-
Fig. 259. Reciprocal mass susceptibility xi’ vs. tempera- ture for Ni-Cr alloys. For the drawn curves, see Table 6 1 [72B 11.
350 K
300
250
1
200
150
100
5c
C 0 1 2 3 4 5 at% Cr Co,Ni -
Landolt-Bdmstein New Series 111/19a
Adachi

410 1.2.3.11 Ni-Cr [Ref. p. 480
3[ Gem
9
2:
I
Ni - 5.6ot%Cr
169 Cy
0 3 6 9 12 kOe 15 a H-
6
V hli-91nt0/~~r I I I
1=1.56K
0 3 6 9 12 kOe 15 b H-
llat%Cr
1
0 5 10 15 20 25 kOe 30 C H-
0 4 8 12 ot% 16 Ni Cr -
Fig. 263. Average magnetic moment per atom. j,,. for Ni- Cr alloys as determined from the magnetization in magnetic ticlds up to 30 kOe [72B I], see also [71 C 1, 32 S 1, 62 V I]. Bottom figure: extrapolated zero-field magnetic mass susceptibility xB at 0 K [72 B I].
Fig. 262. Magnetic moment per gram, o, as dependent on temperature and field strength [62 V I] : (a) Ni-5.6 at% Cr and (b) Ni-9.1 at% Cr.(c) Magnetic moment per gram: G, at 4.2 K, as dependent on composition and field strength [72B I].
Adachi
Ref. p. 4801 1.2.3.11 Ni-Cr 411
Table 62. Saturation magnetic moment cs and average magnetic moment per atom, pat, for Ni-Cr alloys at various temperatures [59 T 1-j.
Cr at%
40 K) 0,(150K) Ed0 K) Gcm3g-’ Gcm3g-l uB
1.70 50.9 49.75 0.53 3.28 43.7 42.40 0.46 6.74 29.0 25.40 0.30 8.75 21.9 16.3 0.23
11.2 15 0.16
Table 64. Atomic magnetic moments as determined by polarized-neutron diffuse scattering measurements on Ni-Cr and Ni-V alloys [76 C l] and average magnetic moment per atom, P,, [72B 1, 71 C 1, 32s 11. T= 4.2 K, H = 57.3 kOe.
Cr V
at% PB
1 - 0.570 -0.20(6) - 0.562 5 - 0.375 -0.02(12) - 0.355
10 - 0.100 0.05(6) - 0.095 - 5 0.346 -0.065(48) 0.325
Table 63. Average magnetic moment per atom, j&,,, and Curie temperature Tc for NiXr alloys [72 B 11, see also [32S1,37M1,62Vl].T=4.2K.
Cr at%
Pat T, PB K
Ni 0.6155 2.6 0.4742 5.1 0.3487 7.7 0.2161 9.4 0.1268
10.5 0.0766 11.0 0.0548 11.5 0.0375 12.0 0.0221 12.5 0.0091
518 390 235 130 80 43 30 19 11
Table 65. g-factor of polycrystal- line NiCr alloys, measured at room temperature and 35.6 GHz [60A 11.
9
Ni 2.18 Ni-1.7 at% Cr 2.18 Ni-3.3 at% Cr 2.18 Ni-5.0 at% Cr 2.20
Impurity-
Fig. 264. Amplitude ofthe spin density wave,p,, ofCr with various small additions of other 3d elements, as derived from neutron diffraction measurements [68 E 11.
Landolt-BOrnstein New Series 111/19a
Adachi
412 1.2.3.11 Ni-Cr [Ref. p. 480
I
Ni - Cr 0 \\, I
I I . OAB at%Ni o Cl.98 of% Ni
I I I 0.2 0.4 0.6 0.8 1.0
r/T& -
Fig. 265. Tempcraturc dependence of the relative sublat- ticc magnetic moment p,lp,(O K)for Ni-Cr alloys [68 E I].
I
0.9E
< a97 s
0.9:
1 2 3 1 ot% 5 Impurity -
Fig. 266. Wavevector Q of the spin density waves in Cr with various small amounts ofothcr 3d elements [68 E I].
5 .w4 cm3 - mol
L
I 3
hk x
2
1
0
a Ni
12 d
3
F 10
I
8
$6
o Ni-Cu
20 60 60 80 ot% 100 b NI V. Cr. Cu -
Fig. 267. High-field magnetic susceptibility, xHF, at 4.2 K, (a)mcasured in magnetic fields up to 69 kOe for Ni-V and Ni-Cr alloys [75A I], and (b) measured in pulsed magnet- ic fields up to 300 kOe for Ni-Cr, Ni--V and Ni-Cu alloys [82S 21.

Ref. p. 4801 1.2.3.11 Ni-Cr 413
Table 66. High-field magnetic mass susceptibility xHF of Ni-Cr and Ni-Mn alloys at various temperatures and measured for field strengths up to 13 kOe [62 V 11.
Cr Mn XHF
10ms cm3 g-l at%
1.2...1.6K 2.5...3.2K 4.2 K 15K 20K 65K 77K 169K 300 K
0.9 - 2.8 2.8 0 0 0.7 1.4 5.6 - 0.5 0.5 2.0 0 0 1.5 2.0 4.0 9.1 - 0.9 8.0 7.0 5.0 5.2 9.2 7.0 2.6 1.5 2.1 - 12.5 5.8 0 0 6.2 7.5 - 5.6 18.0 0 0 0 3.7 4.0 - 11.3 20.0 4.0 25.0 4.0 140 150 140 12.0
3 .10-c
0
I -3
3 -6
-12 150 175 200 225 250 275 300 325 K 350
T-
Fig. 260. Linear thermal expansion coefficient tl= Al/l vs. temperature for Ni-Cr alloys. The arrows give the NCel temperature as determined by neutron diffraction. Mea- surements were made on single crystals [68 E I].
Fig. 268. Electronic specific heat coefficient y for Ni-3d transition metal alloys in the temperature range 1...4 K. The open and solid symbols reflect different analyses of the measuring results [75 G 11.
Landolt-Bbmsfein New Series lWl9a

1.2.3.12 Ni-Mn [Ref. p. 480
Mn Ni - Ni I 60 70 8owt% 90
60 I / I II I \i-. q&!
T 50 , I
I \
J CL!.!.
LOO ’ i i !ji ‘\: I
II! I
i
I I 1 I I \moonPlic 353’
301
200
100
0 0 10 20 30 10 50 60 70 80 90 ot%
Mn Ni -
Fig. 269. Phase diagram and crystal structures of Mn -Ni alloys [SS h 1, p. 9393. yNi: fee, yhrn: fee-fct (Mn side), Phln: B-Mn structure. czhln: a-Mn structure, MnNi,: fee Cu,Au- type. MnNi (L): fct CuAu-type. Tempcraturc, in [“Cl, and composition, in [at%Ni] and, in parcnthcscs, in [wt%Ni], arc given for characteristic points of the phase diagram.
100 Ni
Adachi
Ref. p. 4801 1.2.3.12 Ni-Mn 415
60 65 70 75 80 85 90 95at%100 Ni Mn - Mn
Fig. 270. Tetragonal transition temperature ‘I; and NCel temperature TN of y-phase Ni-Mn alloys. t, : c/a > 1, t, : c/a< 1 [71 U 11, see also [7OU 11.
I 350 L50 550 650 “C 750 T-
Fig. 271. Reciprocal value of the paramagnetic mass susceptibility, 1; ‘, vs. temperature for Ni-Mn alloys, 0...17.89at% Mn [36M 11. See also Fig. 272.
100 200 300 400 500 600 K 700
Fig. 272. Reciprocal value of the paramagnetic volume susceptibility, x; ‘, vs. temperature T for Ni-Mn alloys, 21.6...35.9at% Mn [60K 11. See also Fig. 271.
650 650 K K Ni-Ag 1
61 600
550 550
I I 51 500 Q Q .
L50 L50 \
Ni Impurity -
Fig. 273. Paramagnetic Curie temperature 0 for various Ni alloys [36 M 11.
Landolt-Bbrnstein New Series 111/19a
Ada&i
416 1.2.3.12 Ni-Mn [Ref. p. 480
N: Impurity -
Fig. 274. Curie temperature T, of Ni-based 3d transition metal alloys [32 S 1. 37 M I].
5 10 15 20 25 at% 30 Mn -
8 I
kG Ni-Mn 7
onn 6 I '\ / a\ ,
j eoled
\
3
2
1
0 0 5 10 15 20 25 30 35w1%10
a NI Mn -
14 I kG T=OK 13.
/ I ,'I I
0 5 10 15 20 25 3d 35";; b Ni Mn -
4 :Ii
Fig. 276a. Saturation magnetization 4nM, for Ni-Mn alloys at room tempcraturc as a hmction ofcomposition. Open circles: quenched from 9OO”C, closed circles: an- ncalcd at 430°C. After [31 K I], from [51 b I].
Fig. 276b. Composition depcndencc of the saturation magnetization for Ni-Mn alloys at OK after various annealing proccsscs [53P I]. Heat treatment A: 2 h at 800 “C, then water-quenched; B: one week at 420 “C, one week cooling; C: I6 h at 550°C 250 h at 490°C 260 h at 420°C and 260 h cooling.
Fig. 275. Curie temperature vs. Mn concentration in disordered NiLMn alloys. I: [3l K I], 2: [37M I], 3: [58 K I], 4: [78 T I].
Adachi Landoh-Aornclein Ke\r Sciirr 111’19a
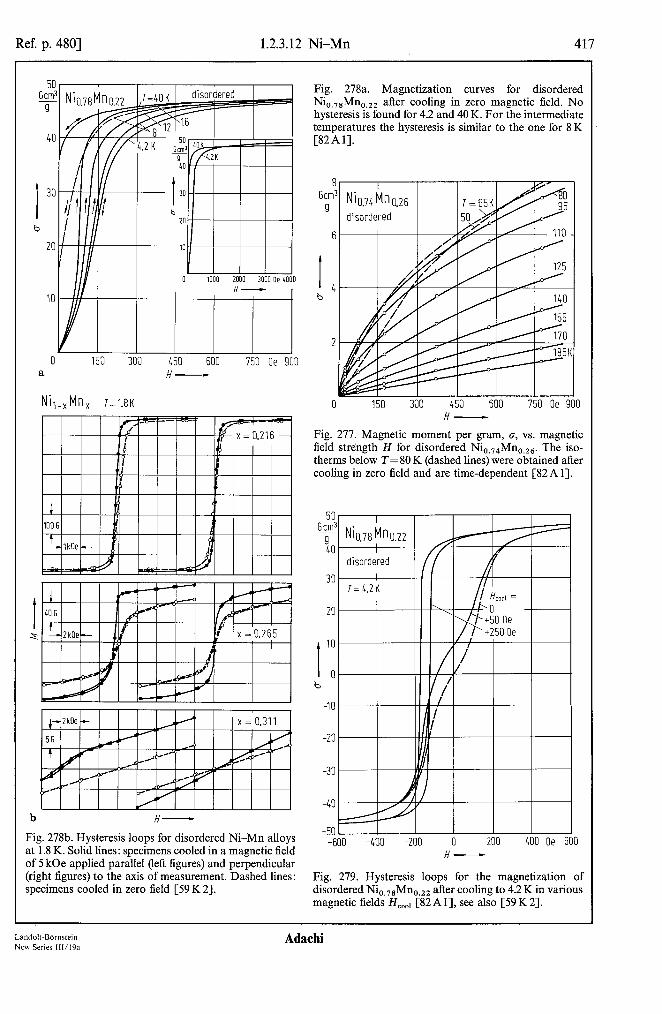
Ref. p. 4801 1.2.3.12 Ni-Mn 417
50 Gcm3
9
I 30
b
20
0 150 300 450 600 750 Oe 900 a H-
b H-
Fig. 278b. Hysteresis loops for disordered Ni-Mn alloys at 1.8 K. Solid lines: specimens cooled in a magnetic field of 5 kOe applied parallel (left figures) and perpendicular (right figures) to the axis of measurement. Dashed lines: specimens cooled in zero field [59 K 21.
Fig. 278a. Magnetization curves for disordered Ni o.7sMno.22 after cooling in zero magnetic field. No hysteresis is found for 4.2 and 40 K. For the intermediate temneratures the hvsteresis is similar to the one for 8 K [82kl]. -
I 4 b
0 150 300 450 600 750 Oe 900 H-
Fig. 277. Magnetic moment per gram, (r, vs. magnetic field strength H for disordered Ni,,,,Mn,,,,. The iso- therms below T= 80 K (dashed lines) were obtained after cooling in zero field and are time-dependent [82A 11.
b
-10
-40
-50 -600 -400 -200 0 200 400 Oe f
I ioo
H-
Fig. 279. Hysteresis loops for the magnetization of disordered Ni,,,,Mn,,,, after cooling to 4.2 K in various magnetic fields Hcoo, [82A I], see also [59 K 21.
Land&-Bbmstein Adachi New Series lll/l9a

418 1.2.3.12 Ni-Mn [Ref. p. 480
l( k[ c
1 , I I /I I \I I RT
OrUeiPd
t
7
I
E
F
I
3
2
1
0 I I I I I I I I I 16 18 20 22 21 26 28 30 OR32 E; b!n -
Fig. 280. Effect of fast-neutron irradiation of initially ordersd Ni Mn alloys at room tcmpcraturc (neutron energy in excess of 0.5 MeV) on the magnetization 4rr.U in a magnetic field of 20 kOc. Maximum tempcra- ture of the specimen during radiation is 50 “C [54A I]. The integrated neutron flux during irradiation is in- dicated. Dashed lint: 4n1W for thermally disordcrcd Ni Mn alloy (annealing tempcraturc 1000°C).
600
F I, = 275h Ni-26.6at%Mn
600 I
0 150 300 150 600 K 750
Fig. 281. Temperature variations of the saturation mag- netization of(a) Ni-24.6 at% Mn and (b) Ni-26.6 at% Mn alloys. The numbers in the figures indicate annealing time t, for (a) 427°C and (b) 445°C [SS H I].
100 100 200 200 300 300 100 100 500 500 600 K 700 600 K 700 I-
Fig. 282. Spontaneous magnetization 47cM, vs. tempcra- turc for various homogeneous states of order of Ni,Mn alloys. The long-range order parameter S gives the ratio of the integrated intcnsitics of a fundamental and a superlattice reflection observed by neutron diffraction. S=O and S= 1 mean complete disorder and complete order, rcspcctivcly [66P I], see also [6l M I] and [SS K I].
Adachi

Ref. p. 4801 1.2.3.12 Ni-Mn 419
Table 67. Magnetic properties of stoichiometric NiMn. Phln, pNi and Hhyp refer to 0 K. For spin arrangement in the antiferromagnetic phase, see Fig. 288.
Crystal Magnetism TN PMn PNi fby,i5 5Mn) structure K
PB kOe
fct AF 1073(40) 3.8(3) <0.6 CuAu-type I)
235 “) [68 K l] [68 K 11 [68 K l] [67 P 11
‘) a=3.74& c=3.52k “) Long-range order parameter S=O.9.
Table 68. Magnetic properties of stoichiometric Ni,Mn. j& PM,,, pNi and Hhyp refer to OK. Order-disorder transition temperature: 510 “C!.
Crystal structure
Magnetism T,
K
Pai PMn
PB PB
PNi ffhyp(5 ‘MN
kOe
ordered fee F 753 3.83 ‘) 0.47 ‘) 334.5 Cu,Au-type [48 K l] [63 P 21 [63 P 21 [67 P l]
disordered fee F 132 0.73 258.7 [58 K l] [58 K l] [67P l]
‘) Determined from an ordered sample having the long-range order parameter of 0.74.
Table 69. Electric and magnetic properties of Ni,Mn at room temperature after different heat treatments [54 T 1-J. The respective quenching temperature is indicated. Q: resistivity, M: magnetization, T,: Curie temperature, x0: initial susceptibility, 1,: saturation magnetostriction.
@O “C) Pfi
M(lOOOe) T, x0 G “C
4 10-6
disordered 73.8 530 “C 69.1 510°C 63.7 500 “C 60.8 480 “C 50.8 460 “C 44.4 400 “c! 28.1 360 “C 25.0 ordered 22.2
90 3 287 363 7 335 383 19 347 415 46 0.2 583 458 92 743 476 101 -0.8 745 488 87 745 486 87 - 1.0
Landolt-Bdmsfein Adachi New Series III/l9a

420 1.2.3.12 Ni-Mn [Ref. p. 480
1.0 Ps
0.9
0.8
il.7
I
0.6
0.5 12
0.4
0.3
0.2
0.1
0 0 Ni
Ni -in /' I
7
f .
- al A2
-• 3 -2-L
1 5 10 15 20 25 at%
Mn-
Fig. 283. Average magnetic moment per atom, j,,, as derived from magnetization mcasurcmcnts at low tempcr- ature for disordered Ni-Mn alloys, 1: [31 K I], 2: [32 S 11, 3: [53P I]. 4: [78T I].
1.0
P?
I 0.5 ,h
0
Ni-Mn v VJ Ni-Cr A c
27.0 27.5 28.0 28.5 n-
Fig. 2S6. Average magnetic moment per atom. &, for disordered Ni-M alloys as a function of the average number n of 3d and 4s electrons per atom, as derived from magnetization measurements at 4.2 K [S3 S 21.
1 1.5
2 1.0
0.5 I“‘-- 1
50 01
0 10 20 30 Klot% Mn NI -
Fig. 284. Avcragc ordered magnetic moment per atom. pal. for y-Mn-Ni alloys, as derived from neutron polarization analysis of diffuse neutron scattering. Extrapolation to pure antiferromagnetic y-Mn gives pbln = 2.4 un [8 I M I]. T=4.2 K.
I Ni-Mn
I DT
6”
61b i 0 5 10 15 20 at% Ni Mn -
1
Fig. 285. Magnetic moment distribution in Ni-Mn al- loys. (a) Room-temperature measurements. Derived from (solid circles) polarized neutron Bragg scattering [79K l] and (open circles) polarized neutron diffuse scattering [SO K I]. Open triangle: [66 M 11, squares: [74 C I], solid triangle: [55 S I] for ordered MnNi, alloy. (b) Mcasurcmcnts at 4.2 K. Solid circles: [79 K I], open circles: [74C I], squares: [SOK I]. See also [7ST I].
Adachi

Ref. p. 4801 1.2.3.12 Ni-Mn 421
2.5
Ps
2.0
I
1.5
4 1.0
0.5
0
Mn Ni -
Fig. 287. Composition dependence of the average magnet- ic moment per atom, pat, and of the Mn moment pr,,” for y-Mn-Ni alloys, derived from neutron Bragg scattering experiments at 4 K. The Ni moment is 0.1(l) pg. The solid curves are extrapolated to & = 2.4 pn for pure antifer- romagnetic y-Mn [81 M 1, 82M 11,
Fig. 289. Magnetic structure of y-Mn alloys derived from neutron diffraction spectra for c/a< 1 and cfa> 1 [71Ul].
NiMn ordered
0 Mn 0 Ni
Fig. 288. Spin structure of ordered NiMn [59K 11. The black and white circles denote Mn and Ni atoms, respectively. The moments are determined to be phln=4.0(1) and Pni=O.6un. The other possible spin structure is discussed in [59 K 11.
0.25 PB
0 100 200 300 kOe LOO H-
Fig. 290. Magnetization curves of disordered Ni-3d alloys at 4.2 K [83 S 21. The magnetization is expressed as an average magnetic moment per atom.
Table 70. g-factors derived from ferromagnetic re- sonance experiments for polycrystalline Ni-Mn al- loys. 24.59 GHz [55 S 21, 34.88 GHz [SS B 11.
X TWI 9
at% Mn 24.59 GHz 34.88 GHz
0 20 2.17 2.19 1.2 20 2.17 2.21
200 2.19 5.1 20 2.14 2.18
200 2.15 10.1 20 2.13 2.14
200 2.12 13.5 20 2.12 2.13
150 2.10 175 2.11
Landolf-Bbmstein New Series II1/19a
Adachi

1.2.3.12 Ni-Mn [Ref. p. 480
Ni Mn-
Fig. 291. High-field magnetic mass susceptibility ,y,,r> of Ni -Mn alloys at 4.2 K mcasurcd in pulsed magnetic ticlds up to 300 k0e [83 K 23. 0 0.5 1.0 1.5 2.0
x/x, -
Fig. 292. High-field magnetic susceptibility of disordered Ni ,-,Mn,.Ni,-,Cr,,Ni,-,V,andNi,-,Cu,alloys as a function of x/x,, where x, is the critical concentration for which the spontaneous magnetization of the alloy bccomcs zero. [83 S 21.
Table 71. Effective magnetic hyperfine field Hhyp,err for “Mn and magnetic moment data for the Mn-Ni alloys, T=0.3...4K [67P 11.
Alloy PM” ~h,,,,ff(55Mn) ~h,.,,cd55MnYphln Number of nearest neighbors of the Mn atoms
PB kOe kOe pi1 Mn Ni
y-Mn 2.4 57 1) 24(t) f4,18 5, - - MnNi ordered 4.0 2) 235 59(2) 14.2 7.8 0 MnNi, disordered 3.18 3, 259 g(7) 13 0.3
partly ordered 318 lOO(8) 11.5 fE.5 0.3 ordered 335 105(8) 10.3 Ill.7 0.3
Mn dilute in Ni 2.4 295 “) 123(5) 0 t12 0.6
‘1 Assuming H,,,,,,, to be negative in y-Mn [64H 11. *) [59K 11. 3, C55.5 I]. 4, [63C2]. ‘) 11 indicates moment parallel or antiparallel to host atom moment.
Adachi

Ref. p. 4801 1.2.3.12 Ni-Mn
250 260 270 280 290 MHz 300 300 310 320 330 340 MHz 350
260 270 280 MHz 290
T= 210K
l 0.5 at% Mn 02 a3
T= 4.2 K
l 0,5at%Mn
345 350 355 360 365 MHz 370 Y-
Fig. 293a, b. Line shapes of NMR spin-echo spectra of 55Mn in Ni-Mn alloys at various temperatures [81 Y 11.
Land&Bbrnstein New Series 111/19a
Ada&i

1.2.3.12 Ni-Mn [Ref. p. 480
325
225
201,
175 375 b!H:
353
I - 325 2
z 5
303
275
253
I I I I
NIo.9iMn0.03 I I I
b 100 200 300 LOO 500 K E
Fig. 293. Temperatures dependence of NMR frequency vr for “Mn in (a) Ni,,,,Mn,,,, and (b) Ni,,,,Mn,,,,. Solid line: main resonance frequency, dashed line: satellite 1, dashed-dotted line: satellite 2 [Sl Y I].
0.2 I I 0 100 200 300 100 500 600 K 700
T-
Fig. 295. NMR frequency v, of the main resonance. normalized to the frequency at 0 K, for “Mn in Mn-3d transition metal alloys. Also shown are the temperature depcndences of the reduced spontaneous magnetizations oJos(OK) of Ni and Fe [8l Y I].

Ref. p. 4801 1.2.3.12 Ni-Mn 425
Ni-Mn
0.4 - T= 1.4 K
1 Sat%Mn
0.2 - xl0 x500
0 I I I I
4- lOat%Mn
2- x10
0 I
4- 25at%Mn
125 150 175 200 225 250 275 300 325 350MHz375 Y-
Fig. 296. Spin-echo NMR spectra for 55Mn in Ni-Mn alloys at 1.4 K. The dashed curves show the line shape in an applied field of 15 kOe [78 K 11, see also [68 S4, 63 K2].
Landolt-Biirnstein New Series 111/19a
Adachi

426 1.2.3.12 Ni-Mn [Ref. p. 480
Ni 3.685 M” 0.315 T = 1.8 K
H: = 9.2 kF 5.7 2.1 0
1 I I I I I J
-?! -8 -4 0 4 8 kG 12 if,;-: -
Fig. 297a. hqaximum of the NMR spin-echo signal along a hysteresis cycle for “Mn in disordered Ni,,,Mn,,, cooled to 1.8 K in a freezing field of 12 kOe. set subscript Fig. 297b. The spectrum has a width of ~30 MHz and a maximum at about 200 MHz [83 S 11.
Fig. 297b. Masimum of the NMR spin-echo signal for “Mn in Ni,,,,,Mn 0,3,5 at 1.8K as a function of an applied field H,,,,. The samples were furnace-cooled from 900 to 50 “C in 2 h. Afterwards all but one sample wcrc heated to &. qucnchcd to room temperature and cooled to 1.8 K in a freezing field H, = 12 kOe. A positive value of H app, means H,,,,\IH,. H, is considered to be the uni- directional anisotropy field [83 Sl].
Ni 0.685 Mn 0.315 T = 1.8 K
slou:ly cooled
150 200 250 300 350 400 t4Hz L Y-
Fig. 298. NMR spin-echo spectra for “Mn in Ni o.6s5Mno.3~5 at 1.8 K and without applied magnetic field. The sample is cooled from room temperature to 1.8 K in a field H, = 12 kOc. (a) Slowly cooled from 900°C to room temperature, (b,c,d) quenched from TAQ = 600,700 and 900 “C, respectively, to room temper- ature. H, is considered to be the unidirectional ani- sotropy field [83 S I].
Adachi

Ref. p. 4801 1.2.3.12 Ni-Mn 427
200 I I I meV
Y-Mn0.73Ni0.27
150
I $100
rc:
50
9-
Fig. 299. Spin wave dispersion curve for y-Mn,,,,Ni,,,,, at room temperature [76 H 1 J.
0 5 10 15 20 at% 25 Ni Mn -
Fig. 300. Spin wave stitfness constant D for fee Ni-Mn alloys, at room temperature. Curve 1: inelastic neutron scattering on single crystals [77 H 11, curve 2: small-angle neutron scattering [75 M 11.
75 I
meV- Ni-Mn fee
0 n 5 IO 15 20 at% 25 ti Mn-
Fig. 301. Values of the effective exchange integrals J,,, for fee Ni-Mn alloys, derived from the spin wave stiffness constants shown in Fig. 300. Open circles and triangle: [77 H 11, solid circles: [75 M I].
Table 72. Values of the pair exchange integrals Jij for Ni-Mn alloys, as derived from the stiffness constants D of Fig. 300, taking into account the room-temperature experimentalmagneticmoments of Fig. 285a [77 H 11.
JNi-Ni JNi-Mn JM”-M~ Ref.
meV
50.7(2) 13.4(12) - 120.1(18) 77Hl 52(5) 44(5) - 285(30) 75Ml
Landolt-Bdmstein New Series 111/19a
Adachi
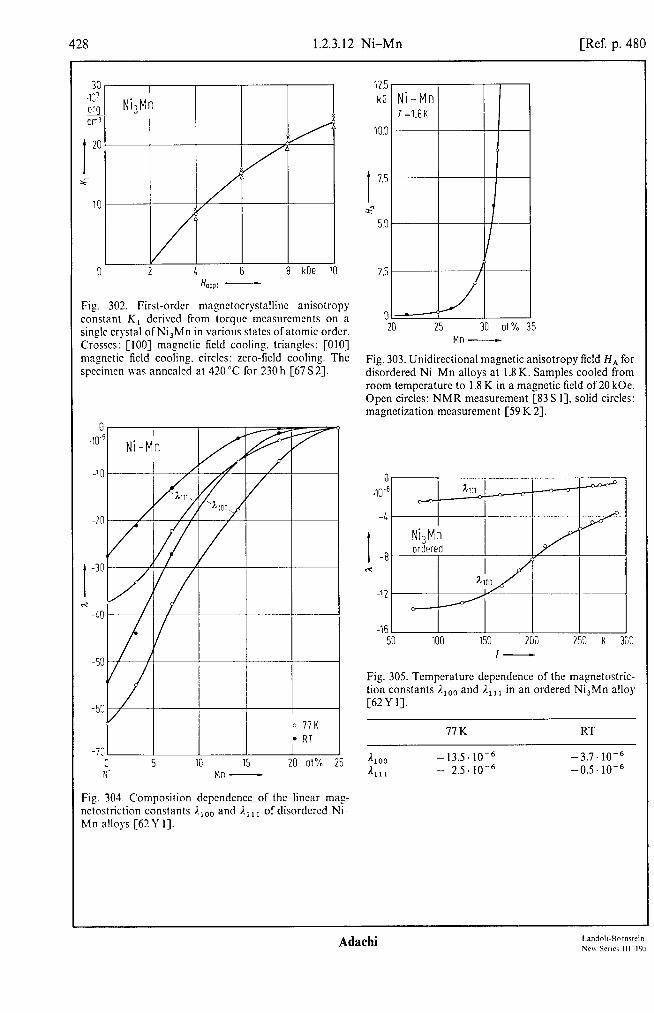
428 1.2.3.12 Ni-Mn [Ref. p. 480
30 .lO? Gt Cl+
I
20
<
10
Fig.
H on1 -
302. First-order magnctocrystallinc anisotropy constant K, derived from torque mcawrcmcnts on a single crystal of Ni,Mn in various states of atomic order. Crosses: [IOO] mag,netic field cooling, triangles: [OIO] magnetic field coolmg. circles: zero-field cooling. The specimen was annealed at 420 “C for 230 h [67 S 21.
12.5 kG
10.0
I
1.5
s 5.0
2.5 c
0 20 25 30 01 % 35
Mn-
Fig. 303. Unidirectional magnetic anisotropy field H, for disordered Ni-Mn alloys at 1.8 K. Samples cooled from room tempcraturc to 1.8 K in a magnetic field of 20 kOe. Open circles: NMR measurement [83 S I], solid circles: magnetization measurement [59 K 23.
0
.10-'
4
I -8 ci
-12
-16 , 100 150 200 250 K 300
Fig. 305. Temperature dependence of the magnetostric- tion constants I.,,, and 1, I, in an ordered Ni,Mn allo) [62Yl].
77K RT
i ‘100 -13.5.10-6 -3.7.10-6 I 11, - 2.5.10-6 -0.5'10-6
I I I I I G 5 10 15 20 ot% 25 I. Er Mn -
Fig. 304. Composition dcpcndcncc of the linear mag- netostriction constants I.,,, and I., , , of disordcrcd Ni- Mn alloys [62 Y I].
Adachi I.andoll-Rnrnrrcin Ncu Sericr III ‘198

Ref. p. 4801 1.2.3.12 Ni-Mn 429
20 I ;',o"'f Ni-Mn
-2 A quenched from L8O"C
I I 0 100 200 300 400 "C 500
7-
Fig. 306. Linear saturation magnetostriction A, vs. tem- perature T for Ni,Mn in various states of atomic order [54T 1 J.
-201 0 0.2 0.4 0.6 0.8 1.0 1.2
7/7, -
Fig. 307. Temperature dependence of the forced volume magnetostriction dw/dH for disordered Ni-Mn alloys, as derived from strain-gauge linear magnetostriction mea- surements [SOT 11.
25, I I I I I I I 1
( ( ( (
0 0.5 1.0 1.5 2.0 2.5 3.0 3.5 K LO T-
Fig. 308. Specific heat C, of Ni,Mn and NiMn [67P 11. A,...&: Ni,Mn disordered, (A,) annealed for 2h at 900 “C and then quenched to room temperature, (AZ) after annealing for 100 h at 465 “C, (A3) after a further anneal for 900 h at 400 “C, producing a high degree oflong-range order. NiMn, ordered.
Land&Bornstein Adachi New Series 111/19a
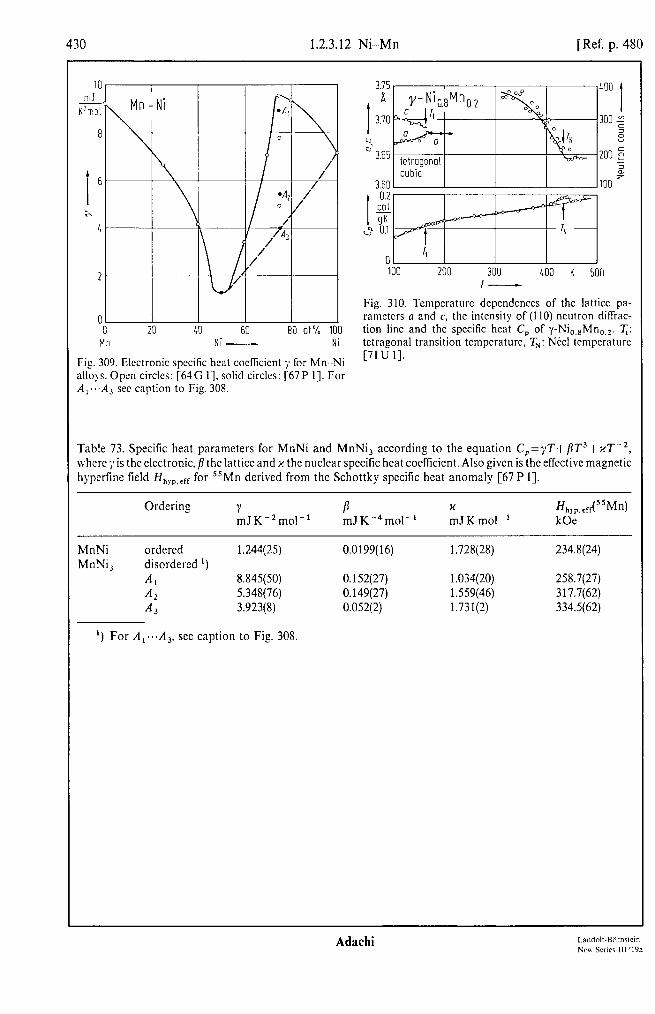
430 1.2.3.12 Ni-Mn [Ref. p. 480
10 mJ
K!V3!
8
I
6
x L
3.75 a
3.70
c? o 3.65
3.60
I
0.2 &I gK
2 0.1
0 2 100 200 300 LOO K 500
I-
Fig. 310. Tcmpcraturc dcpcndcnces of the lattice pa- 0 ramctcrs a and c, the intensity of (I 10) neutron diffrac- 0 20 10 60 80 at% 100 tion line and the spccilic heat C, of y-Ni,,,Mn,,2. 7;:
II 43 NI - Ni tetragonal transition tcmpcraturc, TN: N&l temperature
Fig. 309. Electronic spccitic heat cocffcient 7 for Mn Ni [71 u I].
alloys. Open circles: [64G I]. solid circles: [67P I]. For A,...A, see caption to Fig. 308.
Table 73. Specific heat parameters for MnNi and MnNi, according to the equation C,=yT+flT3+x7-*, where ;‘is the electronic, /I the lattice and x the nuclear specific heat coefficient. Also given is the effective magnetic hyperfme field Hh!p,clr for “Mn derived from the Schottky specific heat anomaly [67P 11.
Ordering Y P x ffh,.,.,rX5SW mJK-*mol-’
MnNi ordered 1.244(25) MnNi, disordered ‘)
A, 8.845(50) A2 5.348(76) A3 3.923(8)
‘) For A, . ..A.. see caption to Fig. 308.
mJK-4mol-’ mJKmol-’
0.0199(16) 1.728(28)
0.152(27) 1.034(20) 0.149(27) 1.559(46) 0.052(2) 1.731(2)
kOe
234.8(24)
258.7(27) 317.7(62) 334.5(62)
Adachi
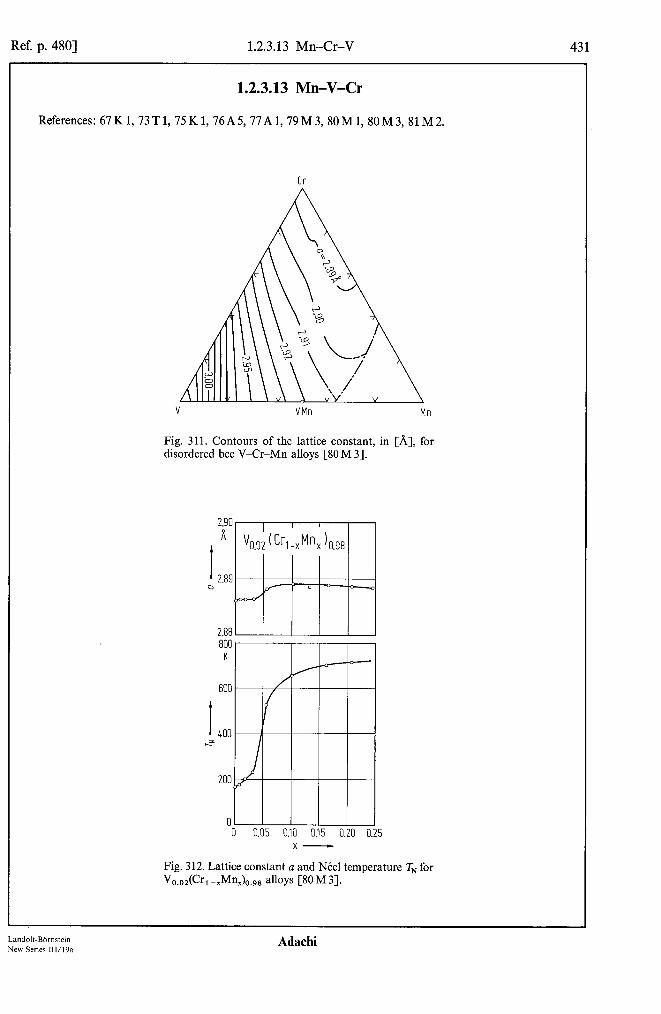
Ref. p. 4801 1.2.3.13 Mn-Cr-V 431
1.2.3.13 Mn-V-Cr
References: 67 K 1, 73 T 1, 75 K 1, 76 A 5, 77 A 1, 79 M 3, 80 M 1, 80 M 3, 81 M 2.
Al! -g
v
Cr
VMn Mn
Fig. 311. Contours of the lattice constant, in [A], for disordered bee V-Cr-Mn alloys [SO M 31.
0 0 0.05 0.10 0.15 0.20 0.25
x-
Fig. 312. Lattice constant a and NCel temperature V~.dCrl-Pn,h,9~ alloys WM31.
TN for
Landolt-BOrnstein New Series 111/19a
Adachi

432 1.2.3.13 Mn-0-V [Ref. p. 480
3[ 40' Hrnl
F3 2:
I
2[
sl:
1C
c
C 21
.10-l Hm -6
18
15
I
12
a? 9
6
I I I ( VII.25 Mn0.75)x Crl-x
?LrT-l-li
t I
I t 1 x zero
t t x = 0.6 0.9 0.8 0.7 0.5 1.0 3.0 2.5 2.0 1.5 1.0 1.25 x = 0.L 0.3 0.1 0.2 Cr 0.75 0.5 0.05 - - I t I
0 200 400 600 800 1000 K 1200 r-
Fig. 313. Magnetic mass susceptibility xs vs. temperature for (a) CIo.25Mno.75)~Crl --I and Co) (Vo.sMno.5Kr~ -I alloys. Vertical arrows indicate the N&cl temperature as determined from electrical resistivity measurements. while horizontal arrows indicate increasing or decreasing temperature [80 M 33. xp: 10-‘4Hm2kg-1;(10/4~)2~ 10-6cm3g-‘.
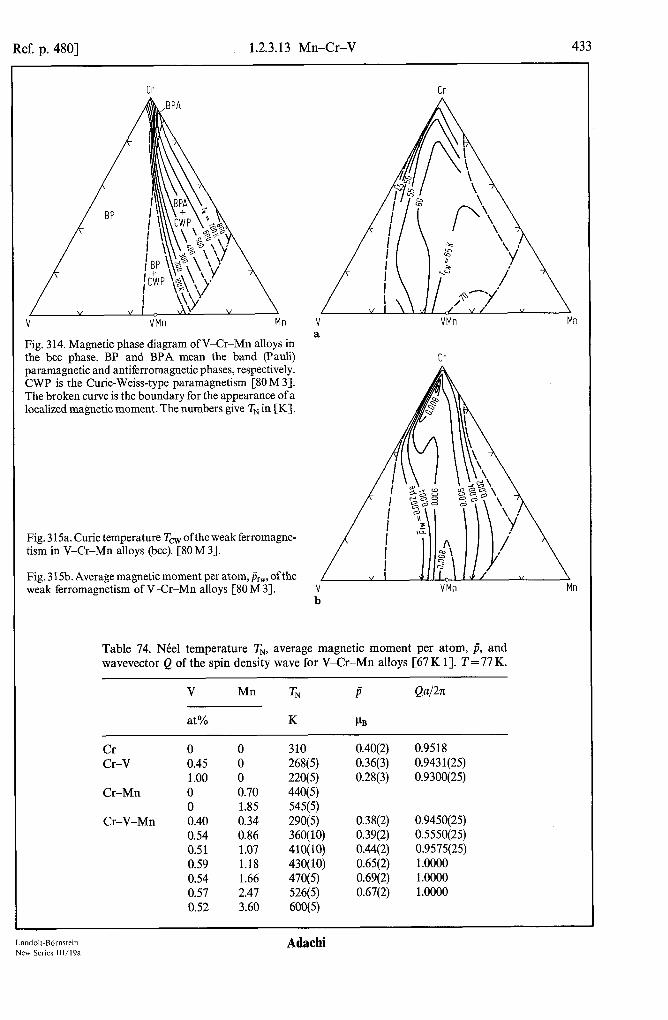
Ref. p. 4801 1.2.3.13 Mn-Cr-V
v VMn Mn
Fig. 314. Magnetic phase diagram of V-Cr-Mn alloys in the bee phase. BP and BPA mean the band (Pauli) paramagnetic and antiferromagnetic phases, respectively. CWP is the Curie-Weiss-type paramagnetism [SO M 33. The broken curve is the boundary for the appearance ofa localized magnetic moment. The numbers give TN in [K].
Fig. 315a. Curie temperature Tcw ofthe weak ferromagne- tism in V-Cr-Mn alloys (bee). [SO M 31.
Fig. 3 15b. Average magnetic moment per atom, &,, of the weak ferromagnetism of V-Cr-Mn alloys [SO M 31.
Cr
V VMn Mn a
Cr
VMn Mn
Table 74. NCel temperature TN, average magnetic moment per atom, p, and wavevector Q of the spin density wave for V-Cr-Mn alloys [67 K 11. T = 77 K.
at% K VB
Cr 0 0 310 0.40(2) 0.9518 Cr-V 0.45 0 268(5) 0.36(3) 0.9431(25)
1.00 0 220(5) 0.28(3) 0.9300(25) Cr-Mn 0 0.70 440(5)
0 1.85 545(5) Cr-V-Mn 0.40 0.34 290(5) 0.38(2) 0.9450(25)
0.54 0.86 360(10) 0.39(2) 0.5550(25) 0.51 1.07 410(10) 0.44(2) 0.9575(25) 0.59 1.18 430(10) 0.65(2) 1.0000 0.54 1.66 470(5) 0.69(2) 1.0000 0.57 2.47 526(5) 0.67(2) 1.0000 0.52 3.60 600(5)
Land&Bornctein Ada&i New Series 111/19a
434 1.2.3.13 Mn-Cr-V [Ref. p. 480
I 6
b
4
300 6
L f
-I LL k 900 1200 kA/ml!
H-
1.5 *lo-' Wbm
kg
I
5.0
b 2.5
0 'I.5
.lO-' Wbm
I
kg 5.0
b
2.5
II 0 20 40 60 80 K 100
Fig. 316. Magnetic moment 0 vs. magnetic licld strength H for (Vo,sMn,,),Cr, -I alloys at 4.2K [8OM 33.
Fig. 317. Magnetic moment u vs. temperature for (Vo.5Mno.5LCr, --I alloys in a magnetic field of H=215kA/m [80M3].
V 0.075 cr0.721 Mn0.2~3
Fig. 318. NMR spin-echo spectra of 55Mn and “V in antiferromagnetic V-Cr-Mn alloys at 1.4K and zero applied field [75 K I].
Adachi

Ref. p. 4801 1.2.3.14 Fe-V-Cr 435
70 kOe
60
Fig. 319. Hyperfine magnetic fields at 55Mn and ‘lV in V-Cr-Mn alloys as dependent on the number n of4s and 3d electrons per atom [75K 11. Solid line: 55Mn in Cr-Mn [73T 11, crosses: samples of Fig. 318, circles: %889Mno.lll; Vo.020Cro.881Mno.099 and V o.~31Cro.s75Mn o.094 [73 T 11. T= 1.4 K.
1.2.3.14 Fe-V-0
References: 77 A 3, 78 H 1.
75 40-f gJ 9
I
45
m
x 30
15
I---l 0 50 100 150 200 250 300 K 350
T-
Fig. 320. Magnetic Fe o,030V,,,,,Cr,,,,,
mass susceptibility xs of vs. temperature, measured at
H aPP, = 5.2 kOe. There is no field dependence found up to about 6 kOe [77A3].
101 0 50 100 150 200 250 K 300
T-
Fig. 321. Electrical resistivity Q ofFe,,,,V,Cr,.,,-, alloys vs. temperature. The arrows indicate the Ntel tempera- tures defined as the temperature for minimum de/dT [77A3].
Table 75. Susceptibility data fitted to the modified Curie-Weiss law xa=A+C,/(T-O) for Fe,,e3Cr,,97-xVx alloys [77A3].
V TN A c, 0 at% K 10F6 cm3 g-r 10-6Kcm3g-’ K
T>T, 0 250 3.34 692.0 - 16.9 0.5 162 3.20 695.4 - 14.8 1.0 108 3.16 693.3 - 14.3
T<T, 0 4.29 335.90 - 3.7 0.5 3.98 519.2 - 6.6 1.0 3.74 580.7 - 7.2
Landolt-Bbmstein New Series 111/19a
Adachi

436 1.2.3.15 Fe-Cr-Mn [Ref. p. 480
1.2.3.15 Fe-Cr-Mn
References: 62 S 1, 82 R I, 83 E 2.
Fig. 323. NMR spin-echo spectrum for “Mn in dis- ordered (Fe, -,Cr,),,,,Mn,,,, alloys at I .7 K [83 E 23.
MHz
Fig. 322. NMR spin-echo spectrum for “Fc in disordcrcd (Fc, -,Cr,)o,9sh4no,o, alloys at 1.7 K [83 E2].
Fig. 324. “Mn hyperfinc magnetic field. I?,,,. corrc- spending to the center ofgravity ofthc spectra ofFig. 323 and the Mn average magnetic moment. j$,,“, for dis- ordcrcd (Fe, -rCrr)0,99Mn0,0, alloys at I .7 K [83 E 21.
26f kOt
251
I 1 I
~hxCrxh.99Mno.ol r ’ I I = 1. 7K
0.05 0.10 0.15 0.20 0.25 1 x-
-1
P
-1
- 1)
31.
‘i,.
-0
3.3;
Ref. p. 4801 1.2.3.16 Co-V-Cr 437
1.2.3.16 Co-V-Cr
References: 77 A2, 77 M 5.
0 0.1 0.2 OY3 0.4 x-
Fig. 325. Effective magnetic moment, perr, for Co in CO~,~,(V,C~, -x)o,99 alloys, derived (open circles) from susceptibility vs. temperature measurements [77 A21 and (solid circles) from 5gCo NMR spectra [77 M 51.
0.05
, 2 , 0.06 30 40 50 60 70 MHz
Table 76. Magnetic properties of Co impurities de- rived from measurements of the Co contribution xi to the magnetic susceptibility of Co,,,,(Cr, -xVx),,99 alloys, xi =x0 + C,/( T- 0). perr: effective magnetic moment derived from the Curie constant C,, 0: paramagnetic Curie temperature, TN: Ntel tempera- ture; see also Fig. 14 [77 A2].
X X0 0 Peff T-4 10-6cm3g-1 K pa K
0 0.03 0.05 0.10 0.15 0.20 0.25 0.30
O.OO(5) O(5) 3.0(l) 300 0.05(S) 26(5) 2.8(l) 70 0.02(l) 25(5) 2.6(l) 25 O.OO( 1) 5(5) 2.4(l) - 0.15(5) lO(5) 2.2(l) - 0.08(5) 5(5) 1.5(l) - 0.29(8) ll(5) 0.8(2) - - - 0.0(l) -
I --L-,- ’ P-__~_qC00.01(VxCrl-x)0.99
4, T=l.2K
\
\
‘4
I 0 0.2 0.4 0.6 0.8 1.0 V x- Cr
Fig. 327. Knight shift K of 5gCo vs. V content in the paramagnetic state of Co,,,,(V,Cr, -&a9 at 1.2K [77 M 51.
Fig. 326. Spin-echo NMR spectra of “Co in the antifer- romagnetic state of (dashed line) Coo,o,(V,Cr, -x)o,gg and (solid line) Co,,,,(V,Cr, -x)o,g7 alloys [77 M 51.
LandobB6mstein New Series III/I%
Adachi
438 1.2.3.17 Co-Cr-Mn [Ref. p. 480
1.00 %
i 0.75
-
4
025
0
by(VxCh-x h-y Ll.ZK by(VxCh-x h-y Ll.ZK
I I T T --. --. - - _ _
l -- l -- x=0.25 x=0.25 -7 -7
' x=0.2 ' x=0.2
i 1-q i 1-q 1 1
Il.25 0.25 0.50 0.75 % 0.50 0.75 % 1.00 1.00
Fig. 328. Knight shift K of 59Co vs. Co content in the . .
pnramagnctic state of Co,(V,,,,Cr,,,,), -y and 0 P
CO~(V~.~C~~.~), -y alloys at 1.2 K [77 M 51. 0 0.2 0.4 0.6 0.8 1.0 V x- Cr
Y-
Fig. 329. Nuclear spin-lattice relaxation time T,, (ex- pressed as its product with tcmpcraturc 7’) of “V and ‘“Co in Co,,,,(V, -rCrX)0,99 alloys, measured at 77 K and 1.2 K, rcspcctivcly [77 M 5-J.
1.2.3.17 Co-Cr-Mn
Reference: 74 K 1.
a-Mn I =1.4 K
coQ.D192 Cr0.n3 b,gso6
J
I 190 200 MHz 210 Y-
Fig. 330. Spin-echo NMR spectra of “Mn at site I in cr-CoCrMn alloys at I .4 K [74 K I].
Adachi I nndoll.Rnrnrrrin Sea Scricr III 192

Ref. p. 4801 1.2.3.18 Fe-Co-Ti
1.2.3.18 Fe-Co-Ti
References: 6232, 67D1, 67D2, 68B1, 68G1, 68P2, 68S3, 7OS1, 73A2, 78B3, 78B4, 79B1, 79B2, 80B3, 81B2, 81H1, 83A2.
.I04 9 FexCol.,Ti cm3
Fig. 331. Inverse magnetic mass susceptibility, xi ‘, of Fe,Co,-,Ti alloys vs. temperature [73A2], see also [67 D 21.
For Fig. 332, see next page.
Fig. 333. Relative pressure derivative T,-%T&@ of the Curie temperature T, for stoichiometric (Fe, -,Co,)Ti, (solid circles: Co-rich, open circles: Fe-rich) and off- stoichiometric (Fe,,,Co,,,), --yTiy compounds [Sl B 21. 0 25 50 75 K 100
Land&B6mstein New Series III/l9a

1.2.3.18 Fe-Co-Ti [Ref. p. 480
2L
mJ K2mo!
20
16
I 12
X8
\I
10 G&
9
8
1
6 ;
4
2
Fig. 332a. Fcrro- and paramagnctic Curie tcmpcraturcs. Tc and 0, respectively, spontaneous magnetic moment at 0 K, a,(O), and the electronic specific heat coeflicicnt 7 of Fc, -,Co,Ti alloys [73 A2].
Fig. 332b. Curie temperatures T, of Fe, -,Co,Ti alloys [79B2].
Fig. 332~. Curie temperatures Tc of (Fe,,,Co,,,),-,Ti, alloys. Open circles: single phase, solid circles: second phase present [79 B 21.
0 0.2 G.4 0.6 0.8 1.0 a Fe6 x- Coli
EC- /
K Fe,.,Co,Ti
60
I 40 LF
i/i \
-0 0.2 0.4 0.6 0.8 1.0 b FeTi x- CoTi
60 K
10
I 0
20 ,-
0
,20
103 K
80
I 60
LY
40
0.4 0.5 0.6 0.7 c FeLo Y-
75 K
1 SC
L-’
25
0
1
1ooc Gem’ mol
z 5oc
0
l=OK
20 .m3
I
cm3 - mol
10
3s
0 -0 0 0.4 0.6 0.8 1.0 Coli x- Feli
Fig. 334. Curie temperature Tc. spontaneous magnetic moment at 0 K, D,(O), and the magnetic molar suscepti- bility x,, at 4.2 K in a magnetic field of lOkOe for Fe,Co, -,Ti alloys. Open circles: [78 B 31, solid circles: [73 A2].
Adachi
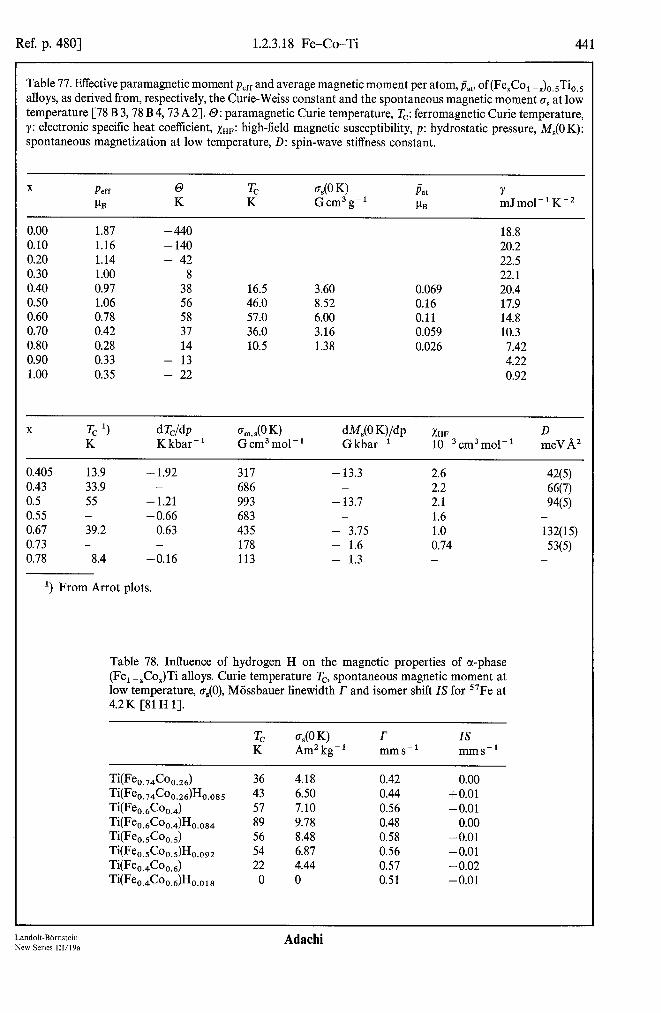
Ref. p. 4801 1.2.3.18 Fe-Co-Ti 441
Table 77. Effective paramagnetic moment peff and average magnetic moment per atom, pat, of (Fe,Co, -x)0,5Ti,,5 alloys, as derived from, respectively, the Curie-Weiss constant and the spontaneous magnetic moment 6, at low temperature [78 B 3,78 B 4,73 A 21. 0: paramagnetic Curie temperature, T,: ferromagnetic Curie temperature, y: electronic specific heat coefficient, ~nr: high-field magnetic susceptibility, p: hydrostatic pressure, M,(O K): spontaneous magnetization at low temperature, D: spin-wave stiffness constant.
X Peff 0 T, 40 K) Pat Y PB K K Gcm3 g-r PB mJmol-1K-2
0.00 1.87 -440 18.8 0.10 1.16 -140 20.2 0.20 1.14 - 42 22.5 0.30 1.00 8 22.1 0.40 0.97 38 16.5 3.60 0.069 20.4 0.50 1.06 56 46.0 8.52 0.16 17.9 0.60 0.78 58 57.0 6.00 0.11 14.8 0.70 0.42 37 36.0 3.16 0.059 10.3 0.80 0.28 14 10.5 1.38 0.026 7.42 0.90 0.33 - 13 4.22 1.00 0.35 - 22 0.92
X T, ‘) d T,ldp s,,sK’K) dW(O Wdp XHF D K K kbar-l Gcm3 mol-l G kbar-’ 1O-3 cm3 mol-’ meV A2
0.405 13.9 - 1.92 317 - 13.3 2.6 ‘Q(5) 0.43 33.9 - 686 - 2.2 66(7) 0.5 55 - 1.21 993 - 13.7 2.1 W) 0.55 - -0.66 683 - 1.6 - 0.67 39.2 -0.63 435 - 3.75 1.0 132(15) 0.73 - - 178 - 1.6 0.74 53(5) 0.78 8.4 -0.16 113 - 1.3 - -
‘) From Arrot plots.
Table 78. Influence of hydrogen H on the magnetic properties of a-phase (Fe, -,Co,)Ti alloys. Curie temperature T,, spontaneous magnetic moment at low temperature, o,(O), Mijssbauer linewidth r and isomer shift IS for “Fe at 4.2 K [Sl H 11.
T, 4 K) r IS K Am2 kg-’ mms-l mms-’
‘W’eo.74%.26) 36 4.18 0.42 0.00 Ti(Fe,.7,Co,.,,)H,.,,, 43 6.50 0.44 +0.01 TW%&od 57 7.10 0.56 -0.01 TWo.6Coo.4)Ho.os4 89 9.78 0.48 0.00 Wb.5Coo.5) 56 8.48 0.58 -0.01 TiFeo.5Coo.s)Ho.092 54 6.87 0.56 -0.01 Whdh6) 22 4.44 0.57 -0.02 Ti(%.4Coo.6)Ho.o18 0 0 0.51 -0.01
Landolt-Biirnsrein New Series lW19a
Adachi
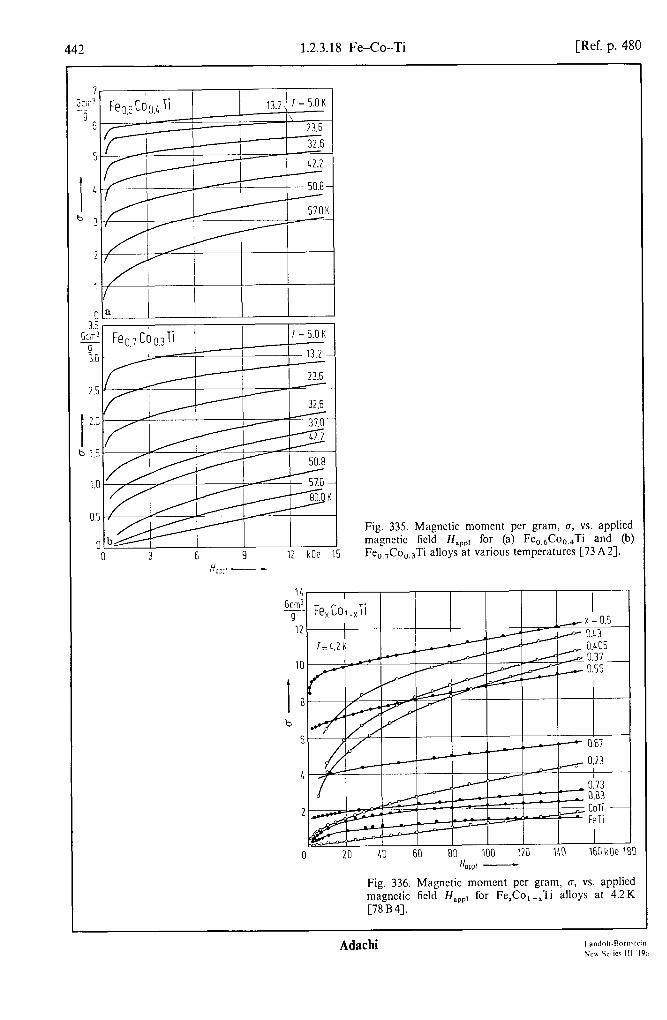
1.2.3.18 Fe-Co-Ti [Ref. p. 480
a
0 3 6 9 12 kOe 15
[78B4].
Fig. 335. Magnetic moment per gram, c, vs. applied magnetic ticld Hap,,, for (a) Fe,,,CoO,,Ti and (b) Fe,,,Co,,3Ti alloys at various temperatures [73 A2].
Ho;:! -
IL Gcm3 --
9 12
I ” b
6
H OPPl -
Fig. 336. Magnetic moment per gram, cr, vs. applied magnetic field H,,,, for F&o, -,Ti alloys at 4.2K
Adachi

Ref. p. 4801 1.2.3.18 Fe-Co-Ti 443
14 @
kg 12
IO IO
1 1 8 8
" "
b" 6 b" 6
4 4
2 2
0 8.2 8.3 8.4 8.5 8.6 8.7 8.8
I “3d - I
0.25 0.50 0.75 u-
I I I
0.52 0.50 0.48 -Y
Fig. 337. Spontaneous magnetic moment cr,(O) extra- polated to T= 0 and H = 0, as dependent on the number nad of 3d electrons per formula unit in stoichiometric (Fe1 -.$o,) Ti(n,, = 8 +x), and off-stoichiometric (Fe,,,Co,,,),-,Ti, @ad= 13-9~) compounds [81 B2].
16 /
@ Fe,Co,_,Ti cm3 mol I I I I
Al
0.2 0.4 0.6 0.8 1.0 CoTi X- FeTi
Fig. 339. High-field magnetic susceptibility xHF [79 B l] and the electronic specific heat coefficient y [73 A21 for Fe,Co, -,Ti alloys at 4.2 K.
I kbor /
0 k -10.0
I
-12.5 I
I .~(Fe,.,Co,)Ti
A ( Feo,sCoo.s),.yTi, -15.0
I, I I I
0 25 50 75 K 100
T, -
Fig. 338. Relative pressure derivative o;‘(O)&rJO)/ap of the spontaneous magnetic moment crs(0) at OK for stoichiometric (Fe1 -,Co,)Ti (solid circles: Co-rich, open circles : Fe-rich) and off-stoichiometric @e,.,Co,,,), -yTiy compounds [Sl B 21.
Fe,Co,-,Ti
H OPPl -
Fig. 340. Typical line profiles for the NMR of 5gCo in Fe,Co, -,Ti alloys at room temperature. Shown are the dispersion derivatives at a fixed frequency of 8 MHz. The zero for the Knight shift (y/271= 1.0103 kHz Oe-‘) is marked with an arrow [68 S 31.
Landolt-Bdmstein New Series III/l%
Adachi

444 1.2.3.18 Fe-Co-Ti [Ref. p. 480
Feli x- Coli
(7;’
9.15 6.C 6.1 6.2 6.3 6.L 6.5
Fig. 341. Miisshaucr effect isomer shift IS of Fc, -,Co,Ti alloys relative to pure Fe [68 B I]. set also [81 H I]. II: average number of 4s and 3d electrons per atom. Q =0.529 A. The error bar for n = 6.35 is also typical for smaller rr KlluCs.
I-
)-
1-
I-
I-
Fe;,zjCOo,pjTi 2
-- L . I ” -
I, 8 12 16 K’ 20 I?-
Fig. 344. Tempcraturc depcndcncc ofthc spccitic hcnt C, plotted as (I) C,/T vs. T’ and (2) (C,-A)/T vs. T’ for (Fe,-,Co,)Ti alloys. The quantity A is the magnetic cluster specific heat [62 S 21:
x 314 w 114
A[10-4calmol-‘K-‘] 11.4 10.0 1.5
3.5 %
I 3.0
0.5
C 6
Feli x- Co?
6.0 6.2 6.L 6.6 6.8 /7-
Fig. 342. Knight shift K for “Co in Fe, -,Co,Ti alloys at room temperature for (left scale) ;‘/2~ = 1.0054 kHz/Oe and (right scale) y/2rr = I .0103 kHz/Oe, respectively [68 B I]. II: avcragc number of 4s and 3d electrons per atom.
00 %
60
10 I CI
0 Feli
0 0.2 0.L 0.6 0.8 1.0
x- Co?
Fig. 343. Magnetic hypcrtinc field Hhyp for “Fe in Fc, -,Co,Ti alloys at 4.2K as determined from Mossbaucr spectra. The spectrum being analyzed under the assumption of the existence of a sextet plus a single lint. The zero hypcrfinc field is obtained for a fraction c of the Fc nuclei [Sl H I].
Adachi
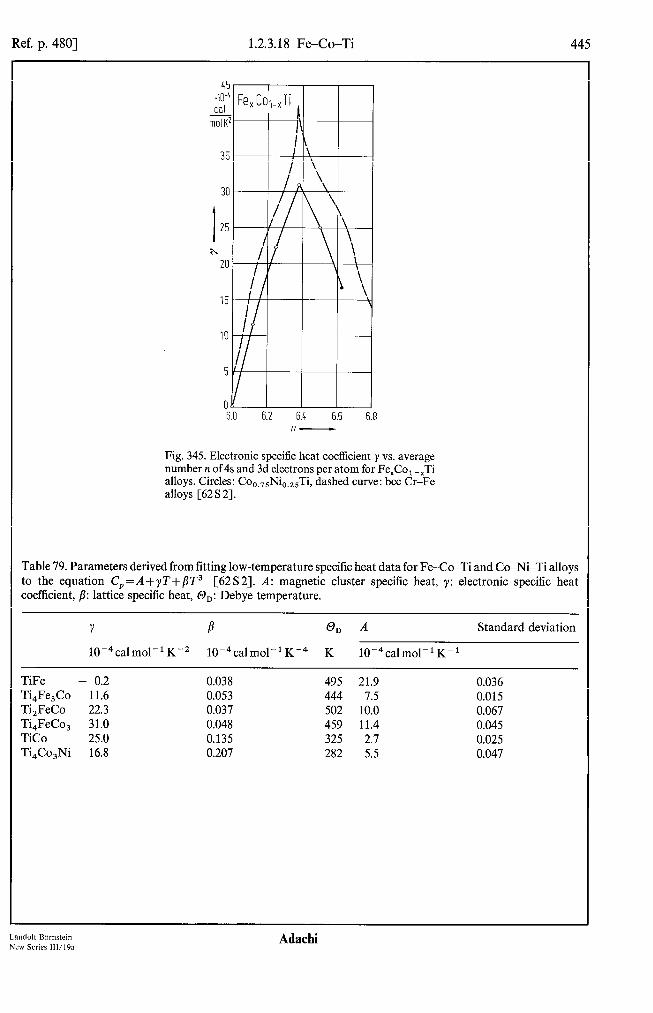
Ref. p. 4801 1.2.3.18 Fe-Co-Ti
6.0 6.2 6X 6.6 6.8 fl-
Fig. 345. Electronic specific heat coefficient y vs. average number n of4s and 3d electrons per atom for Fe,Co, -,Ti alloys. Circles: Co,,,,NiO,,l Ti, dashed curve: bee Cr-Fe alloys [62 S 21.
Table 79. Parameters derived from fitting low-temperature specific heat data for Fe-Co-Ti and Co-Ni-Ti alloys to the equation C,= A +yT+/X3 [62 S 21. A: magnetic cluster specific heat, y: electronic specific heat coefficient, fi: lattice specific heat, On: Debye temperature.
Y P On A Standard deviation
10-4calmol-’ K-’ 10-4calmol-’ Km4 K 10-4calmol-’ K-r
TiFe - 0.2 0.038 495 21.9 0.036 Ti,Fe,Co 11.6 0.053 444 7.5 0.015 Ti,FeCo 22.3 0.037 502 10.0 0.067 Ti,FeCo, 31.0 0.048 459 11.4 0.045 TiCo 25.0 0.135 325 2.7 0.025 Ti,Co,Ni 16.8 0.207 282 5.5 0.047
Land&-Bbmstein New Series lWl9a
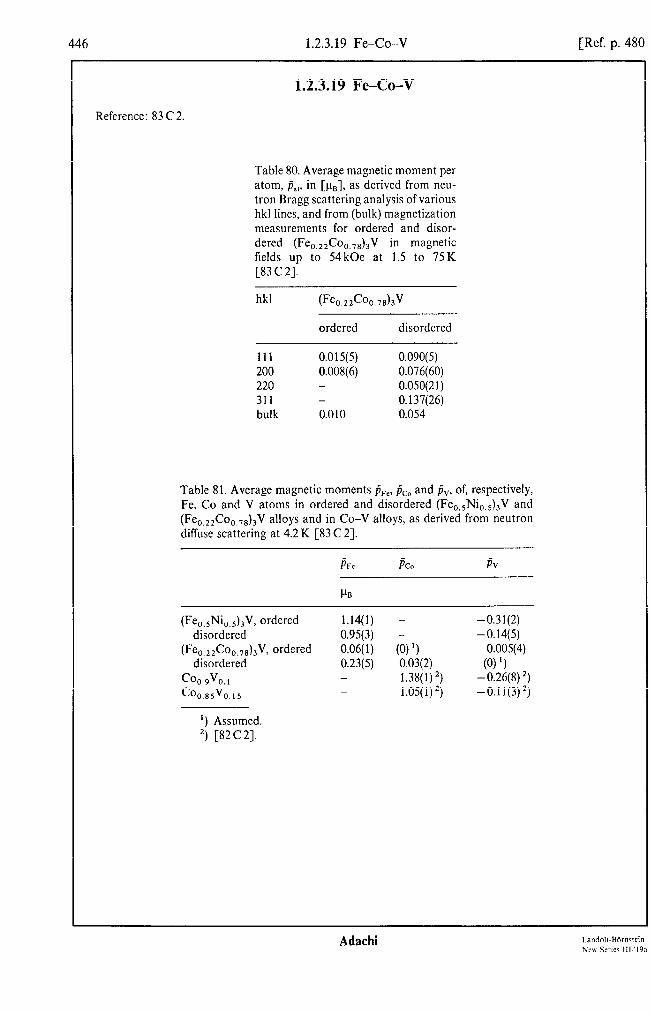
446 1.2.3.19 Fe-Co-V [Ref. p. 480
1.2.3.19 Fe-Co-V
Reference: 83 C 2.
Table 80. Average magnetic moment per atom, fixI. in [.tJ, as derived from neu- tron Bragg scattering analysis of various hkl lines, and from (bulk) magnetization measurements for ordered and disor- dered (Fe,,,,Co,,,,),V in magnetic fields up to 54kOe at 1.5 to 75K [83 C 21.
hkl
ordered disordered
111 0.015(5) 0.090(5) 200 0.008(6) 0.076(60) 220 - 0.050(21) 311 - 0.137(26) bulk 0.010 0.054
Table 81. Average magnetic moments &, PC0 and pv, of, respectively, Fe, Co and V atoms in ordered and disordered (Fe,,,Ni,,,),V and (Fe,,,,Co,,,,),V alloys and in Co-V alloys, as derived from neutron diffuse scattering at 4.2 K [83 C 23.
(Fe,,,Ni,,,),V, ordered disordered
(Feo.22Coo,,8)3V, ordered disordered
coo.9vo. 1 co v 0.85 0.15
1.14(l) - -0.31(2) 0.95(3) - -0.14(5) 0.06( 1) (0) ‘1 0.005(4) 0.23(5) 0.03(2) (0) ‘1 - 1.38( 1) ‘) -0.26(8) ‘) - 1.05( 1) 2) -0.11(3)2)
‘) Assumed. ‘) [82C2].
Adachi

Ref. p. 4803 1.2.3.20 Fe-Co-Cr 447
Cr
320
I z 300
280
260
Fe CO
Fig. 346. Phase diagram (dashed lines) [32 K l] and (solid lines) linear thermal expansion coefficient GL [34 M l] of Fe-Cc&r alloys.
900 K
800
7oc
I 601: e
501:
401
301
l-
I-
I-
I-
I-
I-
A.5 0.6 0.7 0.8 0.9 1 X----r
Fig. 348. Ferromagnetic Curie temperature Tc of Fe1 -xC40,s9%l~ as determined from magnetization measurements [70 S 31.
0.2 0.4 0.6 0.8 1.0 x-
Fig. 347. NCel temperature TN of Fe-Co-Cr alloys as derived from the minima ofthe resistivity vs. temperatures curves [79 F 21.
3.0, I I I I I Ps Ps
2.5 2.5 1500 1500 K K
I I 2.0 2.0 1 cm 1 cm ,z ,z 1.5 1.5 I I
hy hy
1.0 1.0 500 500
0.5 0.5
Cl 0 0 0 0 0 0.2 0.2 0.4 0.4 0.6 0.6 0.8 0.8 1.0 1.0
x- x-
Fig. 349. Composition dependence of the average mag- Fig. 349. Composition dependence of the average mag- netic moment per atom jja, and the Curie temperature Tc netic moment per atom jja, and the Curie temperature Tc for Fe1 -xCo,h.s9%~l for Fe1 -xCo,h.s9%~l and Fe,-$0, alloys [70F 11. and Fe,-$0, alloys [70F 11. The arrow below q,, max The arrow below q,, max indicates the composition giving indicates the composition giving the maximum volume magnetostriction. the maximum volume magnetostriction.
Landolt-Bornstein Adachi New Series llVl9a
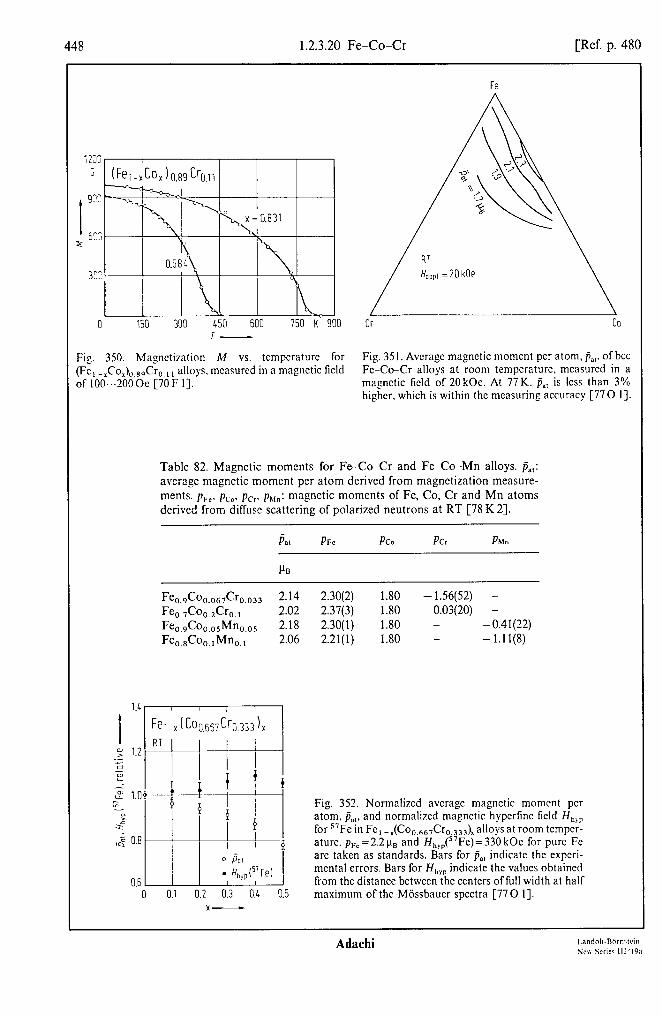
448 1.2.3.20 Fe-Co-0 [Ref. p. 480
1
1203
G (Fei-xW0.fi9Cr0.11 I
0 150 300 600 750
Fig. 3.50. Magnetization M vs. tcmperaturc for (Fe, -XC~,)O,ROCr,,, , alloys. mcasurcd in a magnetic ticld of 100~~~2000e [70 F 11.
0.E
Fig. 351. Average magnetic moment per atom, j,,, of bee Fc-Co-Cr alloys at room tempcraturc. mcasurcd in a magnetic field of 20 kOe. AI 77K. b,, is less than 3% higher, which is within the measuring accuracy [770 I].
Table 82. Magnetic moments for Fe-Co-0 and Fe-Co-Mn alloys. P,,: average magnetic moment per atom derived from magnetization measure- ments pFe. pco. per. phln: magnetic moments of Fe, Co, Cr and Mn atoms derived from diffuse scattering of polarized neutrons at RT [78 K 23.
&t PFc PC0 Per Phln
Feo.9Coo.067Cro.033 2.14 2.30(2) 1.80 - 1.56(52) - Feo,7%.2%.l 2.02 2.37(3) 1.80 0.03(20) - Feo.9Coo.oJJno.~~ 2.18 2.30( 1) 1.80 - -0.41(22) Feo..&oo.IMno.l 2.06 2.21(l) 1.80 - -1.11(8)
Fig. 352. Normalized avcragc magnetic moment per atom, j,,, and normalized magnetic hypcrfmc field H,,!,, for “Fe in Fc, -I(Co,,,,7Cr 0,333)r alloys at room tcmpcr- ature. pFe = 2.2 pa and H,,J’Fe)= 330 kOe for pure Fe arc taken as standards. Bars for @,, indicate the expcri- mental errors. Bars for Hhyp indicate the values obtained from the distance between the centers of full width at half
0 OS 0.2 0.3 04 0.5 maximum of the Miissbauer spectra [77 0 I]. x-

Ref. p. 4801 1.2.3.20 Fe-Co-Cr 449
Fe
I
Cr
Fig. 353. Magnetic hyperfine field H,,, at Fe sites as derived from Miissbauer spectra for 57Fe in bee Fe-Co- Cr alloys at room temperature [770 I].
2
Ps
1
I
0
4 -1
-2
-3
I 0 Fe,-J,Co&-x l Fe,.,Cr,
0 0.05 0.10 0.15 0.20 0.25 0.30 x-
Fig. 355. Magnetic moments ofCr and Mn atoms, per and pMn, respectively, as determined from polarized neutron scattering experiments on Fe-Co-Cr and Fe-Co-Mn alloys at RT [78 K 21. Fe, _ 3XCozXCrX, Fe, -&o,Mn, [78K2], Fe,-,Cr, [76A3], Fe,-,Mn, [75N2].
I 1 I
b-x ( COO.667 cro.333 )
T=77K I ’
I 0.1 0.2 0.3 0.4 0.5
x-
Fig. 354. Normalized hyperfine field Hhyp for 5gCo in Fe, .JCo,,,,,Cr,.,,,), alloys at 77 K. The hyperfine field for x = 0.1 is taken as standard. For the bars, see caption to Fig. 352 [770 11.
Feo.29Co0.62Cr0.09 fee
T= L.2 K
Fe o.375c”o.53cro.095 bee
T=b2K
200 300 kOe L Hhyp (57k) -
Fig. 356. Distribution function P(H,,,,J for the magnetic hyperfine field at 57Fe derived from Mossbauer spectra for Fe-Co-Cr alloys at 4.2 K [79 H 11.
Landolt-Bornstein New Series lll/l9a
Adachi

1.2.3.20 Fe-Co-Cr [Ref. p. 480
1
16 1
11 1
12 1
10 8
8
6
2
0950 0.55 0.60 0.65 0.70 0.75 0.80 0.85 0.90
5.0 10-3
35
2.0
0.5 1
9.0;
7.5
6.0
6.5
x-
Fig. 357. Spontaneous volume magnctostriction q(0) at T=O K. linear thermal expansion cocficicnt c( at 800 K and minimum thermal expansion cocficicnt amin for Fc, -rcor)0.89cr0.11 alloys c7os 31.
8.0 COI -
mol K
I 7.0 9
6.5
6.0 100 150 200 250 300 350 LOO 450°C 500
Fig. 358. Molar specific heat C, for Fe-Co-Cr alloys [79 H I]. Arrows indicate the Curie tcmpcraturc T,.
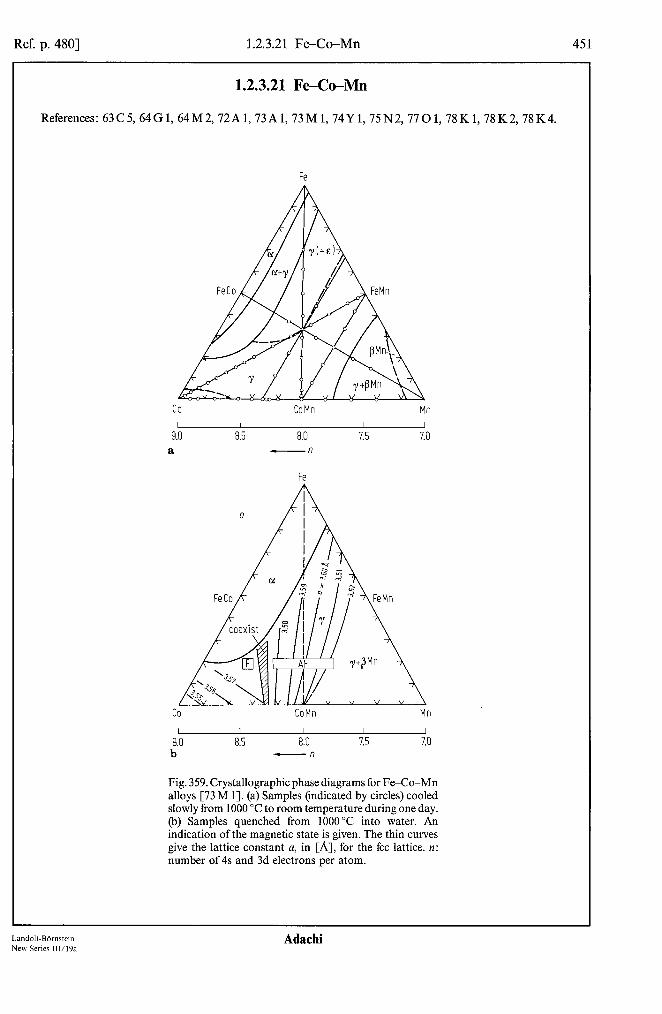
Ref. p. 4801 1.2.3.21 Fe-Co-Mn 451
1.2.3.21 Fe-Co-Mn
References: 63C5, 64G1, 64M2, 72A1, 73A1, 73M1, 74Y1, 75N2, 7701, 78K1, 78K2, 78K4.
co I
9.0 a
CoMn Mn I I I I
8.5 8.0 1.5 7.0 en
Fe
co CoMn Mn
9.0 b
8.5 8.0 1.5 7.0 -/T
Fig. 359. Crystallographic phase diagrams for Fe-Co-Mn alloys [73 M 11. (a) Samples (indicated by circles) cooled slowly from 1000 “C to room temperature during one day. @) Samples quenched from 1000°C into water. An indication of the magnetic state is given. The thin curves give the lattice constant a, in [A], for the fee lattice. n: number of 4s and 3d electrons per atom.
Landolf-BOrnstein New Series 111/19a
Adachi

1.2.3.21 Fe-Co-Mn [Ref. p. 480
IV
cm3 - 9
2.2
I_ - I
0.667 1
I -
0.70
s 0.80
0.90
FeMn
0.5 I 0 200 400 600 800 1000 K 1200
T-
Fig. 360. Magnetic mass susceptibility xe vs. tempcraturc in the antifcrromagnctic y-phase of (FcMn)$o,-, alloys. Vertical arrows indicate N&l tempcraturc TN and E+Y
transformation temperature, horizontal arrows indicate decreasing or increasing tempcraturc [73 M I].
2.1 , - c I I I I Fe I
A - lo lob’” Mn
- x = 0.5
N ‘-
1.2
0.8 I 0 200 LOO 600 800 1000 K 1200
Fig. 361. Magnetic mass susceptibility xg vs. tempcraturc for Fc,(CoMn), -I alloys. Vertical arrows indicate N&l tempcraturc TN, horizontal arrows indicate decreasing or increasing tempcraturc [73 M I]. II: number of4s and 3d electrons per atom.
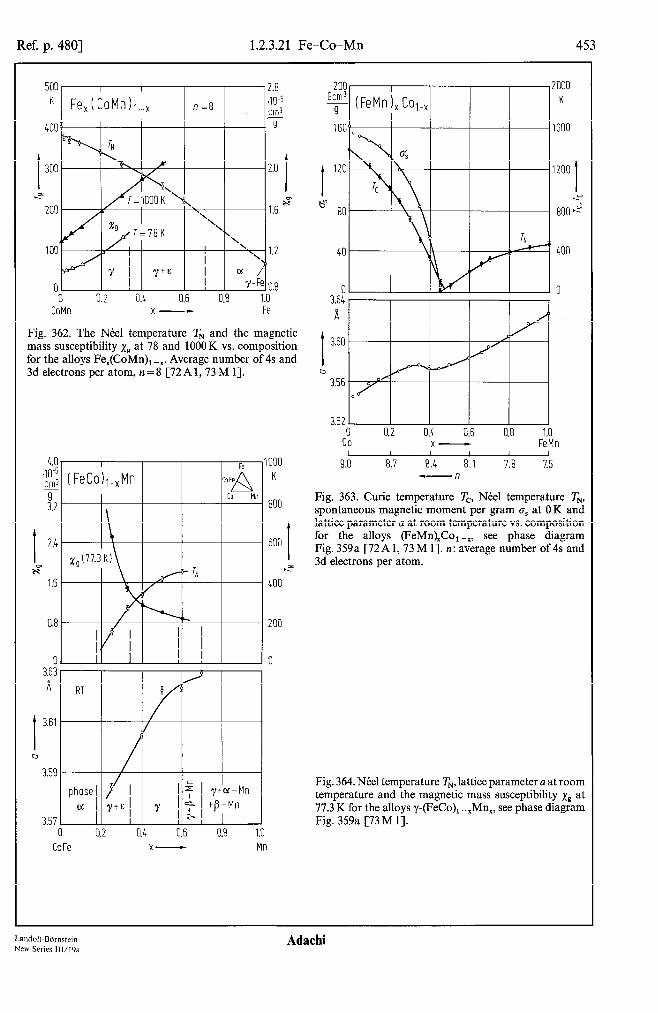
Ref. p. 4801 1.2.3.21 Fe-Co-Mn 453
K Fe,(CoMn)l-, 1 n=8 /
A 2.0
c-z I 200 1.6 x I t
100 1.2
0 0.8 -0 0.2 0.4 0.6 0.8 1.0
CoMn x- Fe
Fig. 362. The NCel temperature TN and the magnetic mass susceptibility xp at 78 and 1000 K vs. composition for the alloys Fe,(CoMn), -x. Average number of 4s and 3d electrons per atom, n = 8 [72 A 1,73 M 11.
4s .10-! cm 9 3.:
I 2.1
N” l.E
I 3.61
D
3.5:
I-
I-
3.57 -
1000 K
800
600 I
z
400
200
0
RT
phase CI I
0 0.2 0.4 0.6 0.8 1.0 co Fe x- Mn
3.64
H
I 3.60
0 3.56
3.52 0 0.2 0.4 0.6 0.8 1.0
co x- FeMn I I I , I I
9.0 8.7 8.4 8.1 7.8 7.5 -n
Fig. 363. Curie temperature Tc, NCel temperature TN, spontaneous magnetic moment per gram es at OK and lattice parameter a at room temperature vs. composition for the alloys (FeMn)xCo,-x, see phase diagram Fig. 359a [72A 1,73 M 1). n: average number of 4s and 3d electrons per atom.
Fig. 364. Ntel temperature TN, lattice parameter a at room temperature and the magnetic mass susceptibility xg at 77.3 K for the alloys y-(FeCo), -=Mn,, see phase diagram Fig. 359a [73 M 11.
Landolt-BBmstein Ada&i New Series 111/19a
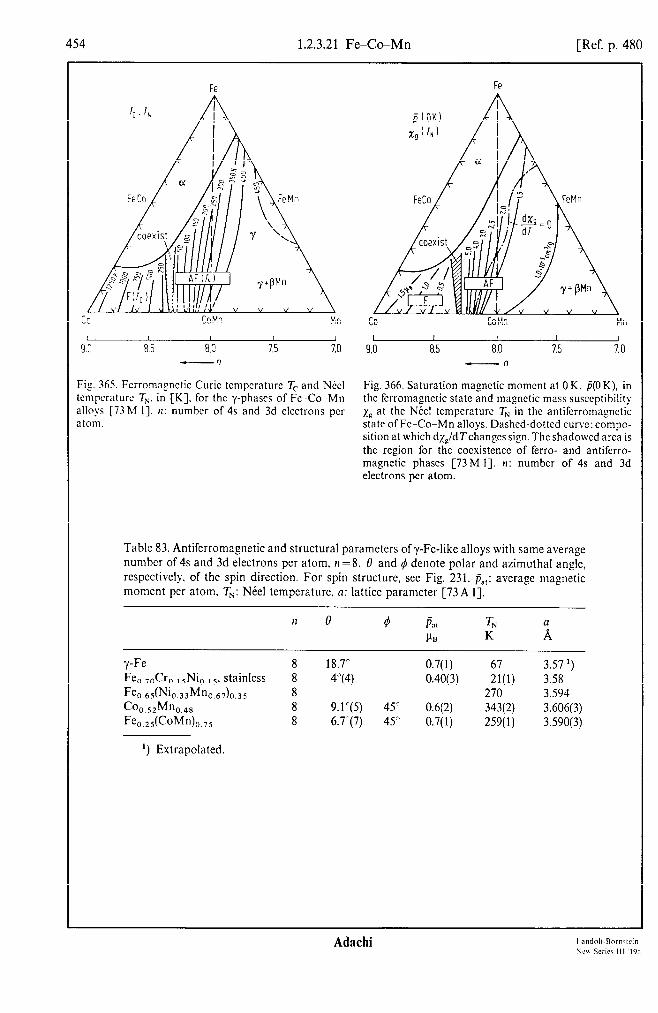
1.2.3.21 Fe-Co-Mn [Ref. p. 480
co CoMn Mn I I 1 I I
9.0 8.5 8.0 1.5 7.0 -/I
Fig. 365. Fcrromngnctic Curie tcmpcraturc T, and N&l Fig. 366. Saturation magnetic moment at 0 K. p(O K), in tcmperaturc T,, in [K]. for the y-phases of Fc Co-Mn alloys [73 M I]. )I: number of 4s and 3d electrons per
the ferroma_cnetic state and magnetic mass susceptibilit) xr at the Nccl tcmpcraturc TN in the antiferromagnetic
atom. state of Fe-Co-Mn alloys. Dashed-dotted curve: compo- sition at which d%JdTchangcs sign. The shadowed area is the region for the coexistence of ferro- and antiferro- magnetic phases [73M I]. n: number of 4s and 3d electrons per atom.
Table 83. Antiferromagnetic and structural parameters of y-Fe-like alloys with same average number of 4s and 3d electrons per atom, II = 8. 0 and 4 denote polar and azimuthal angle, respectively, of the spin direction. For spin structure, see Fig. 231. ii,,: average magnetic moment per atom, Th.: N&l temperature, n: lattice parameter [73A 11.
y-Fe 8 Fe 0.70Cr,.,sNi0.,s. stainless 8 F~o.~~(N~o.~~Mno.~~)o.~s 8 co o.s2Mno.4s 8 F~o.2s(CoWo.7s 8
18.7’ 0.7(l) 67 3.57 ‘) 4’(4) 0.40( 3) 21(l) 3.58
270 3.594 9.1”(5) 45’ 0.6(2) 343(2) 3.606(3) 6.7’(7) 45’ 0.7( 1) 259( 1) 3.590(3)
‘) Extrapolated.
Adachi

Ref. p. 4801 1.2.3.21 Fe-Co-Mn 455
0.5 d 0.4
I 0.3
k 0.2
0.1
0 100 200 300 400 K 500 T-
Fig. 367. Square of the average magnetic moment of the sublattice magnetization, p, vs. temperature for Fe,,,,(CoMn),,,, and Co,,,,Mn,,,,, as derived from neutron scattering intensities [73A 11. The magnetic hyperfine field determined from Miissbauer spectra is H,,,(57Fe)=30(10)kOe at 77.3 K.
1.5 I
IQ (Fel_,Co,),.,Mn, I 1.0 I” ” - ’ - ’ I
a A
I I t o.5-
-2.0 ill 0 0.1 0.2 0.3 0.4 0.5 0.6 0.7 0.8
x-
Fig. 369. Rate ofchange ofthe magnetic moment per atom with Mn concentration c, d&,/dc, for (Fer -$o,)r -,Mn, alloys [78 K 41. Circles: T=4.2 K, [78 K4], triangles: T=20"C C63C5-J.
241 241
240 240
I I
239 239
b 238 b 238
224
223
221 .I Fe y0.50t% Mn
35 kOe 40 H OPPl -
Fig. 368. High-field magnetization curves for Fe-Co-Mn alloys [78 K 41.
pB 1 (Fel-YCoY)~-rMnr I I I I I 3.0 1;' " ' - ' * I
T= 4.2 K
2.5
I
2.0
,,; 1.5
1.0
0.5
01 0 0.1 0.2 0.3 0.4 0.5 0.6 0.7 0.8
X- L I I I I I I I I
8.0 83 8.2 8.3 8.4 8.5 8.6 8.7 8.8 f?-
Fig. 370. Magnetic moment of Mn at 4.2K, &,, in Fe, -$o, alloys with small concentrations of Mn, open circles: [78 K4], solid circle: [74Y 11, square: [75N2]. Triangles: &,” at 20 “C [63 C 51.
Land&Bbmstein New Series II1/19a
Adachi
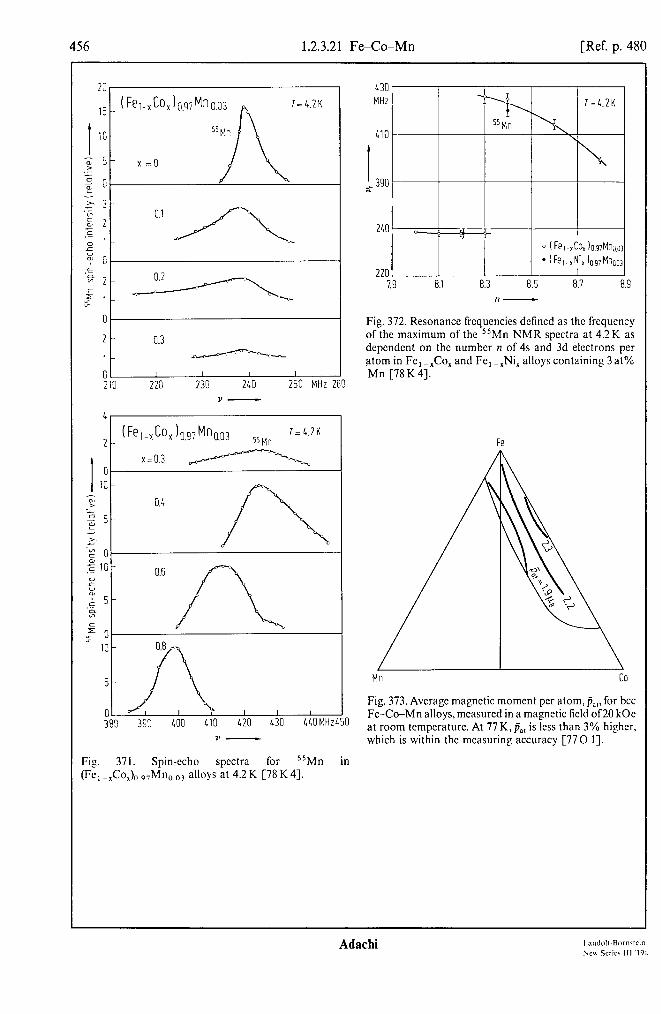
456 1.2.3.21 Fe-Co-Mn [Ref. p. 480
.E
=:2
g 6 l-
0
2- 0.3
l-
o I I I I 210 220 230 2LO 250 MHz 2'
Fig. 371. Spin-echo SpCCtKl for 55Mn in (Fe1 _,Co,), 9,Mn,,,3 alloys at 4.2 K [78 K 41.
130
MHz -p\
f\ l=L2K
55Mn 410 \
I & 3%
fl-
Fig. 372. Resonance frequencies defined as the frequency of the maximum of the 55Mn NMR spectra at 4.2K as dcpcndcnt on the number n of 4s and 3d electrons per atom in Fe, -.$o, and Fe, -,Ni, alloys containing 3 at% Mn [78K4].
Mn co
Fig. 373. Average magnetic moment per atom, ii,,, for bee Fe-Co-Mn alloys, measured in a magnetic field of20 kOe at room temperature. At 77 K, fi,, is less than 3% higher. which is within the measuring accuracy [770 I].
Adachi

Ref. p. 4801 1.2.3.21 Fe-Co-Mn
0 0.1 0.2 0.3 I
Fe
Fig. 374. Normalized average magnetic moment per atom, &, and normalized magnetic hyperfine field Hhyp for 57Fe in Fe,-,(Co,,,Mn,,,), alloys at room tempera- ~a co ture. pFe = 2.2 ur, and H,,,(57Fe)= 330 kOe for pure Fe are taken as standards. Bars for p,, indicate the experimental errors. Bars for Hhyp indicate the values obtained from the
Fig. 375. Magnetic hyperfine field Hhyp at Fe sites as derived from Miissbauer spectra for 57Fe in bee Fe-Co-
distance between the centers of full width at half max- Mn alloys at room temperature [77 0 11. imum of the Mijssbauer spectra [77 0 11.
1.2
I y 1.1
.- -2 F
. E
1.0
c 2 0.9
Fig. 376. Normalized hyperfine field, Hhyp, for “Co in Fe, -X(Co,,,Mn,,,)X alloys at 77 K. The hyperfine field for x = 0.075 is taken as standard. For the bars, see Fig. 374 [77 0 I].
Table 84. Electronic specific heat coefficient y and Debye temperature On for fee Fe-Co-Mn alloys quenched from 1100 “C [64 G 11.
Y rms deviation
@n
K
Mn o.43Feo.53Coo.04 14.3 428 Mn 15.9 0.60 405 Mn 19.9 0.40 399 Mn o.lloFe C 0.854 0.036 33.1 1.40 398
Landolt-Bbmstein New Series IIl/19a
Adachi

45s 1.2.3.22 Fe-Ni-V [Ref. p. 480
1.2.3.22 FeNi-V
References: 34 K 1, 51 b 1, 83 C 2.
I
Fe - Ni-V I I
0 20 LO 60 NI -
Fig. 377. Curie temperature T, of FeNi-V alloys in the Fig. 378. Magnetization 4xM for Fe-Ni-V alloys in a fccphasc[34Kl.51bI,p.l86]. magnetic field of 1OOe [Sl b 1).
I”
kG
0 0 20 60 80 ot% 100
NI -
Table 85. Average magnetic moment per atom, p,,, in [&J, as derived from neu- tron Bragg scattering analysis of various hkl lines and from (bulk) magnetization measurements for ordered and disor- dered (Fe,.,Ni,,,),V alloys in magnetic fields up to 54kOe at 1.5 to 75 K [83 C 21.
hkl
111 200 220 311 bulk
O%.sNiAV
ordered disordered
0.38(2) 0.33( 1) 0.42(2) 0.36(2) 0.32(4) 0.35(3) - 0.41(4) 0.35 0.32
Adachi
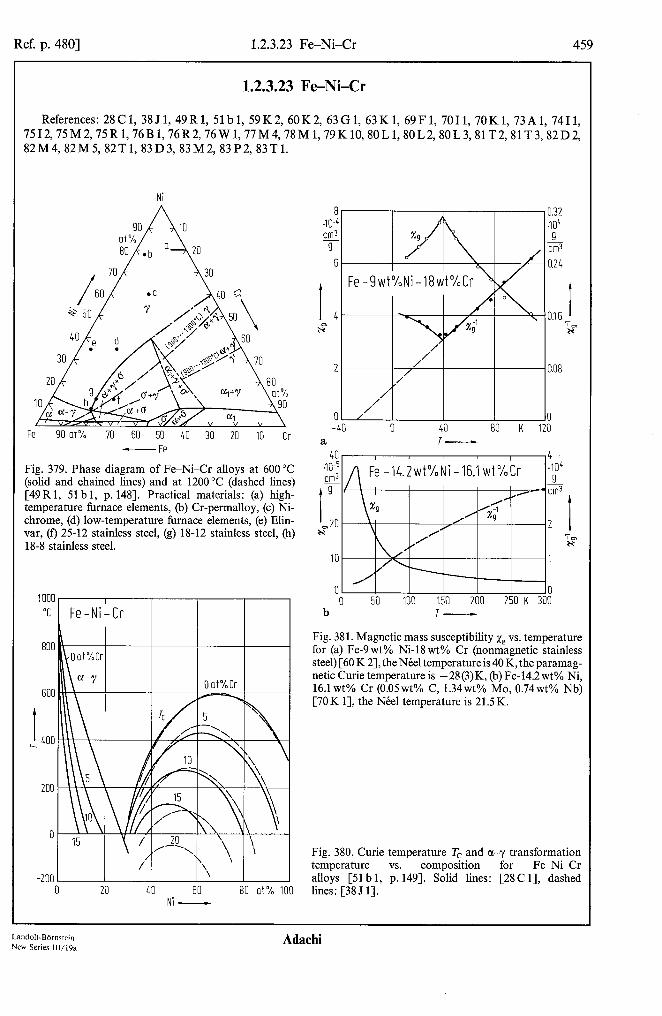
Ref. p. 4801 1.2.3.23 Fe-Ni-Cr 459
L
1.2.3.23 Fe-Ni-Cr
References: 28 C 1, 38 J 1, 49 R 1, 51 b 1, 59 K 2, 60K 2, 63 G 1, 63 K 1, 69 F 1, 70 I 1, 70K 1, 73 A 1, 7411, ~~~~~~~~~~~~~~~~~~~~~~~~~~~~~~~~~~~~~~~~~~~~~~~~~~~~~~~~~~~~~~~~~~~~~~~~~~~~ 82M4, 82M5,82Tl, 83D3, 83M2, 83P2, 83Tl.
Ni
Fe 90 ot% 70 60 50 40 30 20 IO Cr - Fe
Fig. 379. Phase diagram of Fe-Ni-Cr alloys at 600°C (solid and chained lines) and at 1200°C (dashed lines) [49Rl, 51 b 1, p. 1481. Practical materials: (a) high- temperature furnace elements, (h) Cr-permalloy, (c) Ni- chrome, (d) low-temperature furnace elements, (e) Elin- var, (f) 25-12 stainless steel, (g) 18-12 stainless steel, (h) 18-8 stainless steel.
60[
I ~ 40[
200
0
-200
I
Fe-Ni-Cr
20 40 60 80 at% 100 Ni -
E 40-l cm3 T
E
I 4 H”
2
a 0 40 80 K 1
1.32 IO4 s cm3
1.24
I.16 I
2”
1.08
b T-
Fig. 381. Magnetic mass susceptibility xg vs. temperature for (a) Fe-9wt% Ni-18 wt% Cr (nonmagnetic stainless steel) [60 K 21, the Ntel temperature is 40 K, the paramag- netic Curie temperature is -28(3)K, (b) Fe-14.2wt% Ni, 16.1 wt% Cr (O.O5wt% C, 1.34wt% MO, 0.74wt% Nb) [70 K 11, the Ntel temperature is 21.5 K.
Fig. 380. Curie temperature Tc and ol-y transformation temperature vs. composition for Fe-Ni-Cr alloys [Sl b 1, p. 1491. Solid lines: [28C 11, dashed lines: [38 J 11.
Land&-BOrnstein New Series 111/19a
Adachi

460 1.2.3.23 Fe-Ni-Cr [Ref. p. 480
0.35
0.33
0.25
I ;; 0.20
0 $
OS5
0.1 c
0.05
0
1 I
Fe -Ni-ZOwt%Cr
1
I ZOv:t%Ni
I I I I
0 10 20 30 LO K I----
Fig. 3S3. Magnetic phase diagram and dilfcrcntial cross section of critical neutron scattering for
y-Fc,Ni,,,-,Cr,,z. P. F. AF and SG arc the paramag- nctic. fcrromngnctic. antifcrromagnctic and spin glass phases. rcspcctivcly. and dg,‘dR rcprcscnts the diffcrcntial cross section for neutron scnttcring in rclativc units. Open circles and crosses: [82 ht 41. trinnglcs: [76 W I] and solid circles: [70 K I].
50 1 Fe-32wt%Ni-20wt%Cr 1 I
0 LO 80 120 163 K 21 7-
Fig. 382. Initial (ac) volume susceptibility z,. vs. tempera- ture for Fc-Ni-20 wt% Cr (fee austenite) alloys [76 W I]. (a) 16. I8 and 20 wt% Ni, (b) 20, 22 and 24wt% Ni, (c) 32wt% Ni.
-- _IdY
K Fe, Ni0,8-xCro.z I y-phase 300 I
250 .xTX\ A a, I\ ’
Y 200
Ii I I \n \I I w 150
100
50
0 0 0.1 0.2 0.3 0.1 0.5 0.6 0.7 0.8
x-

Ref. p. 4801 1.2.3.23 Fe-Ni-Cr 461
e 3uu
P 0
0 0.0 4 0.08 0.12 0.16 0.20 x-
Fig. 384. Ferromagnetic Curie temperature Tc derived from Mijssbauer spectra for stable disordered fee (Fe,,,Ni,,,),-,Cr, alloys, x5 0.15 [76B 11.
-150
-300 -900 -600 -300 0 300 600 Oe 900
a 30 G
20
1 IO
r: 0
-10
-20
-30 -12
b
H OQQl- 91 I I I I I
- 45 kQe 60
I -800 -400 0 400 800 Oe 1200 H OQQl-
-91 I H- I -21 -14 -7 0 7 14 kOe 21
H-
1.2 G
I 0.6
2 O
-0.6
-1.2 -600 -400 -200 0 200 400 Oe 600
C H OQQ’ -
250 I I I I
$ Fe-Ni- ZOwt%Cr 28wt%Ni
I 150
x
100
50
0 12 3 4 5 6 MA/ml H-
Fig. 385. Effect of Ni concentration in Fe-Ni-20 wt% Cr (fee austenite) alloys on the field dependence of the magnetization A4 at 10 K [76 W 11. See also [76 W l] for detailed magnetization curves in the temperature range 10...300K.
Fig. 386. Hysteresis loop ofthe magnetic moment measu- red for an [OOl] axis of a single crystal of fee Feo.70%15Cro.ls at 4.2K. When cooling through the NCel temperature, T,=21(1)K, to T=4.2K, no shill of the hysteresis loop is observed [70 I 11.
Fig. 387. Hysteresis loops ofmagnetization A4 vs. applied field %,I for samples of Fe,,&Ni,-,Cr&,,, alloys cooled from 60K to 4.2K in a magnetic field of 1 kOe [76R2].
Land&BCmstein Adachi New Series IIl/l9a

462 1.2.3.23 Fe-Ni-Cr [Ref. p. 480
x-
125? 0.1 / / 0.2 / 0.3 ,I 0.1 I / 0.5 I ,
\
0
- 5 10 15 at% 20
Cr -
X-
0.1 0.2 0.3 c ,
1 .--
p
1
I
-IL
I.6 1
0.5
.
5 10 15 at% 20 Cr -
Fig. 388. (a) Spontaneous magnetization M, of %I &Ji, -$rrh5 alloys at 4.2 K and &I) the Curie temperature Tc [76 R 23.
3.0 G cm?
9 2.5
I 2.0
zi 1.5 s
b 1.0
0.5
0 IO 0 20 LO 60 K 80
I-
Fig. 389. Magnetic moment 0 in an [OOI] direc- tion vs. tcmpcraturc T for a single crystal of fee FC ~.dJi0.L5C~0.15r with the applied magnetic field as a parameter. The arrow indicates the N&l temperature TX [7011-J.
Fig. 390. Magnetic structure of fee Fe,,,,,Ni,,,,Cr,,, derived from neutron scattering. The long-range antifer- romagnctic order is shown. The sublatticc magnetic moment, j,, =0.3(l)p, at 4.2 K is aligned along the [OOI] direction. The spin components pcrpcndicular to [OOI] have only a short-range correlation [75 12). see also [7OI I].

Ref. p. 4801 1.2.3.23 Fe-Ni-Cr 463
1.05 Y “hYP ~ UL E 0 z 200 I
z
i% iI I I 00
0.95 I 1 T T - 0.3
z ‘Z P 100
i \ \
2
OA
0.85 , I IS
- 0.5 ; 1.15
2 ?l
2 1.05
0 \
f - 0.6 mm s
-100 I I I I I lo.7 0 0.04 0.08 0.12 0.16 0.20
0.85 -2.5 -2.0 -1.5 -1.0 -0.5 0 0.5 mm/s
Fig. 392. Average magnetic hyperfine field n,,, and 1.5 isomer shift IS at 300K for 57Fe in the ferromagnetic
Source velocity - phase of stable disordered fee (Fe,,,Ni,,,), -.$I& alloys,
Fig. 391. Mijssbauer absorption spectra for 57Fe in x50.15. For x=0.1, the square represents IS in the paramagnetic phase [76 B 11.
Fe o,6sNio,ossCro,2 containing 1.2at% Mn, 1.7at% Si, 0.3at% Cu, 0.3at% C and traces of S, P and MO (304 stainless steel) in two temperature ranges. NCel tempera- ture T,=38(2)K, estimated hyperfine field H,,,(57Fe)=21 (8)kOe at 4.2K [63 G I].
Fig. 393. Unidirectional magnetocrystalline anisotropy constant K, of Fe,,,,(Ni,-,Cr,),,,, alloys at 4.2K, as caused by cooling the alloys in a magnetic field of 1 kOe from 60K to 4.2K [76R2].
Landolt-Bdmstein Adachi New Series IWl9a

464 1.2.3.24 Fe-Ni-Mn [Ref. p. 480
200 400 600 800 1000 K 1 2oc
Fig. 393. Invcrsc magnetic mass susceptibility. xi’, of Fe Ni I o,Ts-xMno,zs alloys vs. temperature [65 W I].
-600
-800 0 0.1 0.2 0.3 0.4 0.5 0.6 0.7 0.8
X-
Fig. 395. Paramagnetic Curic temperature 0 of Fc,Ni 0.75-rMn0.25 alloys [65 W I].
Fig. 396. Invcrsc magnetic mass susceptibility, 1; ‘, and the magnetic moment 0 vs. tempcraturc for %65(Nil -.Mnxh.ss alloys. (a) 02 x 50.23, H,,,, =8.6kOc, (b) x=0.3, H,,,,=lOkOc, (c) 0.35~~~0.5. H,,,,=lOkOc and (d) 0.52x60.9, H,,,,=8.6kOe C;r, only); for comparison la of FcMn is also shown [67 S I].

Ref. p. 4801 1.2.3.24 Fe-Ni-Mn 465
180, - , I I I -I 3.5 Gcm3
lgso .104 s cm3
140
2.5
i 100 I ’ 7,
80 x
60
40
20 , BI
I 1
0 , , 7 I I
CC9
.O
--i-
I 15
b IO
1 1 Hnnn\=lOkOe 1
= IO kOe
0 100 200 300 400 500 600 700 800 900 K 1000
Landolt-Bdrnstein New Series 111/19a

466 1.2.3.24 Fe-Ni-Mn [Ref. p. 480
7 GC;r’ -
9
5
I 4
b3
2
1
0
-22
h5 ( %.7~Mh.2~ ) 0.35 Gcm3 I I
' Ho;;! =lOkOe
9
18
16
--, 6.5 kOe / 1000 oh N- \ 11 1
h - 12
8
6
4 .lOP gly
9 1 2
0 40 80 120 160 K 200
T-
Fig. 397. Temperature dependence of the mngnctic mo- ment o of Fc,,,,(Ni,.,,Mn,,,,)~.,, in various applied matgetic liclds H,,,,. The dashed line for H,,,, = 1000 Oc indicates the field-cooling effect. The ac mngnctic mass susceptibility (short-dashed curve) is mcasurcd with a mnsimum field of I Oc at 200 Hz [83S 5]. XC also [Sl s33.
1.5 I I 5: 100 150 200 250 K 300
Fig. 399. hJa_rnctic mass susccptihility la vs. tcmpcraturc Fl ~~lod%~oM n0.J,)0,,.5 under hydrostatic prcssurc p
200
n
I
1000
;;; 800 .s
; 600 -u H" 400
200
0 40 80 120 160 200 260 280 K 32:
T-
Fig. 398. Tcmpcraturc dcpcndcncc of the ac magnetic mass susceptibility ,Y”~, in relative units. (a) Fe,Ni o.ss-xMno.,s: x =0.57 and 0.585. and (b) Fc,Ni,,,-,Mn,,,: x=0.4, 0.45 and 0.48. T,: transition tcmpcraturc from paramagnctic to spin-glass state. &: NCcl tempcraturc [Sl M 31.
1000 K L -. 1
800. /
600
I '1 c, 4
400 I F/e-M"
I I \ 1 /-Feo.s(Ni,.,Mn,)o.j
7.4 7.7 8.0 8.3 8.6 8.9 9.2 9.5 n-
Fig. 400. Magnetic phase diagram for Fe,,(Ni, -rMni)O,S alloys. The compositions arc indicated by the average number II of 4s and 3d electrons per atom [78 B 23. P: paramagnctic. F: fcrromagnctic. AF: antifcrromagnetic. The shaded area indicates coexistence of ferro- and antifcrromagnctism. Tc: Curie temperature, TV: Neel temperature.

Ref. p. 4801 1.2.3.24 Fe-Ni-Mn 467
K
500
400
1 300
200
100
0 500 K
400
I 300
h 200
100
0 20 30 40 50 60 70 80 at% 90
Fe -
Fig. 401. Magnetic phase diagrams for (a) Fe,Ni o.ss-xMno.ls and (b) Fe,Ni,,,-,Mn,,, alloys [81 M 31, see also [SO M 11. P : paramagnetic, F: fer- romagnetic, AF: antiferromagnetic, M : metamagnetic, SG: spin-glass. Tc: Curie temperature, TN: Neel temperature.
Fig. 403. Curie temperature Tc for Fe-Ni-Mn alloys of various compositions [75 M 11. Fe-Ni alloys: 1 [63 C 41, 2 [72M 11, 3 [69A3]. Ni-Mn alloys: 4 [31Kl], 5 [37M 11. Fe-Ni-Mn alloys: 3...20at% Mn [75M 1).
500 I I I I K Fe055 ( Nil-xMnxh.35
I l\ii 300 I I A
i p =‘lotm / I
I /’
5.0 K
kbor I 100
? 2.5 s
- dTN/dp ,=-
01 1-h -c r IO
0 0.2 0.4 0.6 0.8 1.0 x-
Fig. 402. Magnetic phase diagram for %.65Wl -xMnxh.ss alloys at atmospheric pressure and the variation with pressure of the Curie and the Ntel temperature, dTJdp and dT,ldp, respectively, as mea- sured for pressures up to 25 kbar [75D 11, see also [71 B 1, 71 N 11.
K
900
800
700
I
600
L-” 500
400
300
200
0 10 20 30 40 50 60 70 ot% 80 (Fe-Mn)-
Landolt-Bornstein New Series lWl9a
Adachi

465 1.2.3.24 Fe-Ni-Mn [Ref. p. 480
Table 86. Curie temperature T,, N&l temperature TN and their pressure derivatives T,.,/dp for Fe,,,,(Ni, -xMnx),,35 alloys [75 D 11.
x Mn Ni T, TN -G,ddp
wt% K K K kbar- 1
0.000 0 35 467 0.043 1.5 33.5 402 0.086 3.0 32 353 0.129 4.5 30.5 228 0.171 6 29 190 0.229 8 27 90 0.686 24 11 253 0.829 29 6 341 1.000 35 0 442
“is. 401. Curie and N&l tempcmturcs T, and TN. qxctivcly. vs. number n of4s and 3d clcctrons per atom n Fc, AN1 -,Mn,),,,,. :67 S I].
Fe Ni and FceMn alloys
4.4(l) 5.0( 1) 4.8( 1) 4.2(4) 3.7(3)
0.6(Z) 0.9( 1)
Ni at% //
40 35 30 25 20 15 10 5 0
Fig. 405. Saturation magnetization 4nh4,. in [kG], of slowly cooled Fe-Ni-Mn alloys [33 K 2, 5 1 b 1, p. 1823.
Adachi
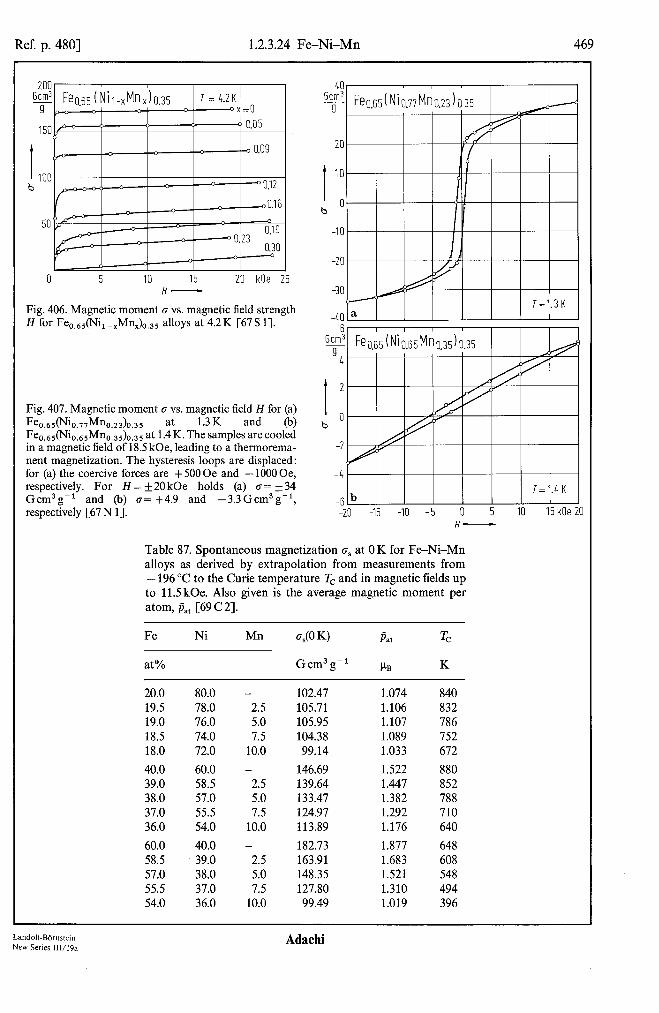
Ref. p. 4801 1.2.3.24 Fe-Ni-Mn 469
200 !&!f ko.65 (Nip,Mn,)0.35 T = 4.2K I
g,, 3 3x=0
15o&=P = 1 0.05 I
t 100 b
0 5 IO 15 20 kOe 25 H-
Fig. 406. Magnetic moment 0 vs. magnetic field strength H for Fe,,,,(Ni, -XMn,)o,ss alloys at 4.2 K [67 S 11.
Fig. 407. Magnetic moment cr vs. magnetic field H for (a) Fe,.,,~Ji,.,,Mn,.,3)~.3~ at 1.3 K and 64 Fe,,,,~i,,,,Mn,,,,)~,~~ at 1.4K. The samples are cooled in a magnetic field of 18.5 kOe, leading to a thermorema- nent magnetization. The hysteresis loops are displaced: for (a) the coercive forces are +500Oe and - lOOOOe, respectively. For H= $20 kOe holds (a) 6= & 34 Gcm3g-’ and (h) u=+4.9 and -3.3Gcm3gw1, respectively [67 N 11.
20
I
10
b"
-10
-401” I I 6
Gcm3 9
4
I 2
0 b
-2
-6 b T=l.l, K
I -20 -15 -10 -5 0 5 IO 15kOe 20
,,
Table 87. Spontaneous magnetization rr’s at 0 K for Fe-Ni-Mn alloys as derived by extrapolation from measurements from - 196 “C to the Curie temperature T, and in magnetic fields up to 11.5 kOe. Also given is the average magnetic moment per atom, Is,, [69 C 21.
Fe Ni Mn 40 W Pat T,
at% Gcm3g-’ ps K
20.0 80.0 - 102.47 1.074 840 19.5 78.0 2.5 105.71 1.106 832 19.0 76.0 5.0 105.95 1.107 786 18.5 74.0 7.5 104.38 1.089 752 18.0 72.0 10.0 99.14 1.033 672
40.0 60.0 - 146.69 1.522 880 39.0 58.5 2.5 139.64 1.447 852 38.0 57.0 5.0 133.47 1.382 788 37.0 55.5 7.5 124.97 1.292 710 36.0 54.0 10.0 113.89 1.176 640
60.0 40.0 - 182.73 1.877 648 58.5 39.0 2.5 163.91 1.683 608 57.0 38.0 5.0 148.35 1.521 548 55.5 37.0 7.5 127.80 1.310 494 54.0 36.0 10.0 99.49 1.019 396
Landolt-Bbmstein New Series III/l%
Ada&i

470 1.2.3.24 Fe-Ni-Mn [Ref. p. 480
62.5
I 533
b
375
12.5
0
I b
40 Gem’
9 35
30
25
20
15
10
5
0
i 25 b "t
20 b
li
10
5
0 0 53 I 150 200 250 300 K :
I-
20.0 Gem)
A.5
15.0
I
12.5
10.0 b
01 0 50 100 150 200 250 300 K 350
I-
Fig. 408. Magnetic moment u of Fe,,,,(Ni, -,Mn,)o,ss alloys in a ma!nctic field H= 8.9 kOc as a function of tcmpcraturc, wth the applied hydrostatic prcssurc p as a parameter [71 N I].
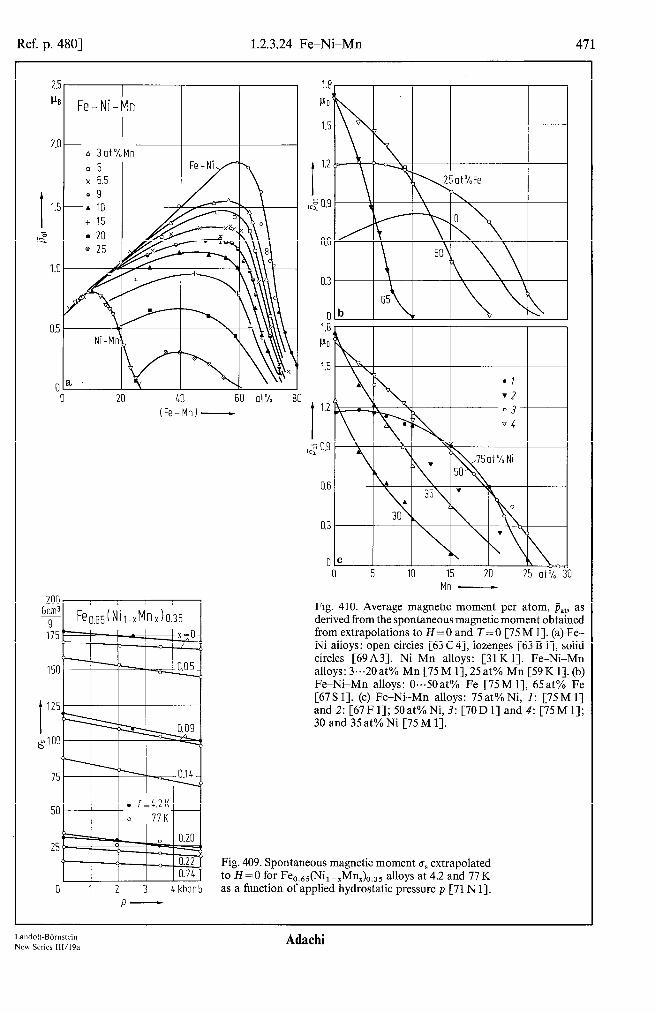
Ref. p. 4801 1.2.3.24 Fe-Ni-Mn 471
L.U I
" Fe-Ni-Mn I I
n 40 60 at% 80
(Fe-Mn)-
200 Gcm3
9 175
I
125
1.8
PB
1.5
0.6
0 0 5 10 15 20 25 at% 30
Mn -
Fig. 410. Average magnetic moment per atom, j&, as derived from the spontaneous magnetic moment obtained from extrapolations to H =0 and T=O [75 M I]. (a) Fe- Ni alloys: open circles [63 C 41, lozenges [63 B 11, solid circles [69A 31. Ni-Mn alloys: [31 K 11. Fe-Ni-Mn alloys: 3...20at% Mn [75 M 1],25 at% Mn [59K 11. (b) Fe-Ni-Mn alloys: 0...50at% Fe [75M 11, 65at% Fe [67S I]. (c) Fe-Ni-Mn alloys: 75at% Ni, 1: [75M l] and2:[67F1];50at%Ni,3:[70Dl]and4:[75Ml]; 30 and 35 at% Ni [75 M 11.
Fig. 409. Spontaneous magnetic moment (TV extrapolated to H=O for Fe,,,@-,Mn,),,,, alloys at 4.2 and 77K
0 12 3 4kbar5 as a function of applied hydrostatic pressure p [71 N I].
Landolf-BBmsrein New Series lW19a
Adachi

472 1.2.3.24 Fe-Ni-Mn [Ref. p. 480
-x
0.E
0.1
[
a
0. Fe5.t~ 0. Few (Ni,.,Mn,)o.~ (Ni,.,Mn,)o.35
2 2 8.1 8.1 8.6 8.6 8.8 8.8 fl- fl-
-X
- L
- 1. .6
-0 1.8
9.:
2,5 0.: 1 I 0.1 0.2 0
Pt ,, +-Y. . . ,
\
Fig. 41 I. (a) Effective magnetic moment pcrr as derived from the paramagnetic susceptibility and (a, b) avcragc magnetic moment per atom. p,,. at 0 K as derived from the spontaneous magnetization for Fc,,,,(Ni, -XMnl)o,,s al- loys. II: average number of4s and 3d clcctrons per atom. For comparison j,, is also shown for Fe-Ni alloys. (a) [67 S I]. (b) [67 N I]. Fc,,,,(Ni, -,Mn,)o,~s: [67 S I], Fc - Ni (fee): [64 C 2. 64 B I]. Fe -Ni (kc): [64 C 23.
Fig. 412. Proposed spin configuration of antiferro- magnetic Fc,.,,(Ni,.,Mn,.,),.,, [69N Il.
0.6 0.7 0.8 0.9 1.G X-
Fig. 413. Average sublattice magnetic moment per atom. p, ofantiferromagnetic Fe,,,,@, -IMnJ,3s at 77 K and extrapolated to 0 K [69 N I].
Adachi
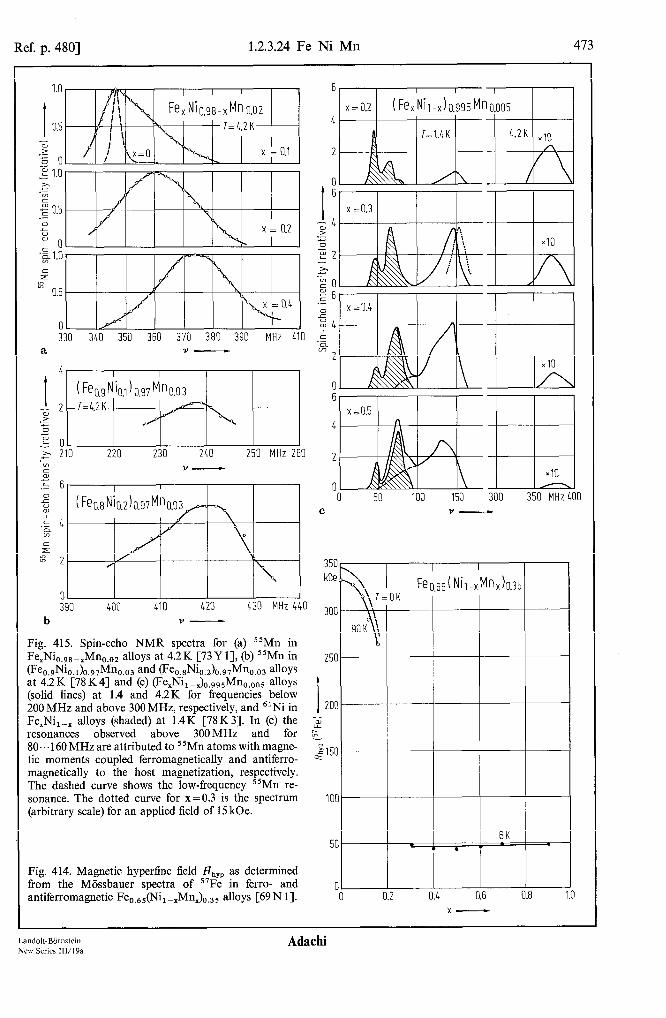
Ref. p. 4801 1.2.3.24 Fe-Ni-Mn 473
1.0
I 0.5 lu .> E 0
0 330 340 350 360 370 380 390 MHz 410
a Y-----r
4
I
I I ( Feo.9 Ni0.l ) 0.97 M"o.03
; 2 -T=CZK es .? ‘;
HB
EO h .= 210 220 230 240 250 MHz 260
Y-
390 400 410 420 43U MHz 4 b Y-
6 I I I
x=0.2 (FexNi,-,)0.995Mn0.005
6 4
2 EiE! x10 n .o 50 100 150 300 350 MHz400
c Y-
I I
Fe0.d Nil-xMnxh.35 I I
Fig. 415. Spin-echo NMR spectra for (a) 55Mn in Fe,Ni0.9s -xMn,,,, alloys at 4.2 K [73 Y 11, (b) 55Mn in (Fe,.9Ni,.l),.97Mn,.,, and ~e,.,Ni,.z)o.9,Mn,.,3 alloys
25C
at 4.2K [78 K4] and (c) (Fe,Ni,-3,,,,,Mn,,,os alloys (solid lines) at 1.4 and 4.2 K for frequencies below 200 MHz and above 300 MHz, respectively, and 61Ni in I 2oc
Fe,Ni,-, alloys (shaded) at 1.4K [78 K3]. In (c) the z resonances observed above 300MHz and for K 80.. ,160 MHz are attributed to ’ 5Mn atoms with magne- tic moments coupled ferromagnetically and antiferro-
&C
magnetically to the host magnetization, respectively. The dashed curve shows the low-frequency 55Mn re- sonance. The dotted curve for x=0.3 is the spectrum 101 (arbitrary scale) for an applied field of 15 kOe.
Fig. 414. Magnetic hyperfine field Hhyp as determined from the Miissbauer spectra of 57Fe in ferro- and 0 antiferromagnetic FeO,&Ii, -xMnx)0,35 alloys [69 N 11. 0
Landolf-Bornstein Adachi New Series 111/19a
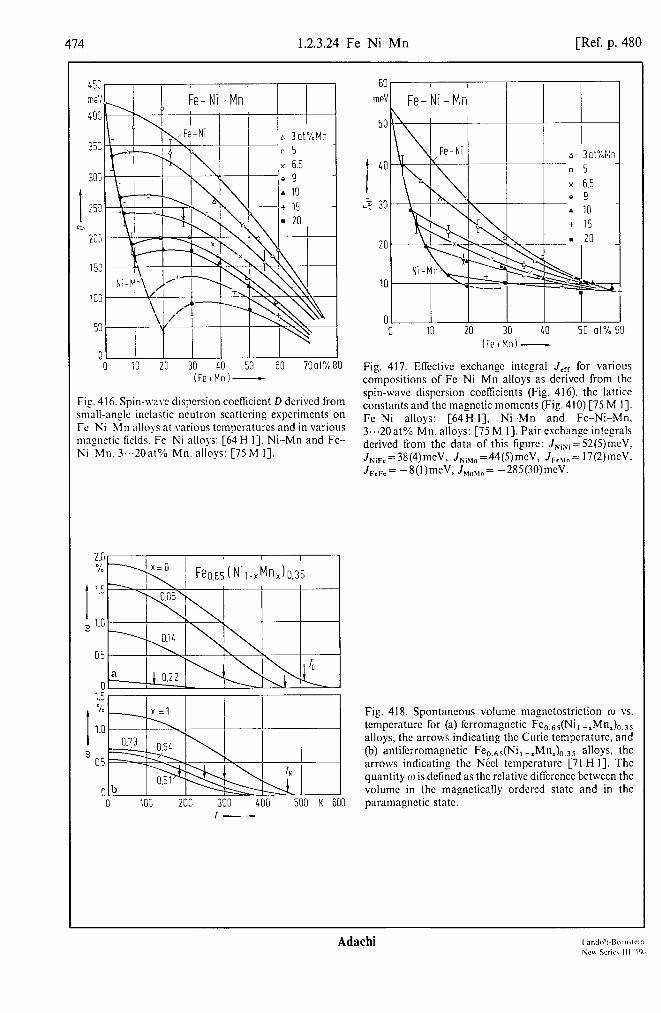
1.2.3.24 Fe-Ni-Mn [Ref. p. 480
80 0 10 20 30 10 50 60 7Oot% (FetMnl-
Fig. 416. Spin-wave dispersion cocflicicnt D dcrivcd from small-angle inelastic neutron scattering experiments on Fe Ni -Mn alloys at various tempcraturcs and in various magnetic liclds. Fe-Ni alloys: [64 H I]. Ni--Mn and Fc-- Nip hln, 3,..20at% Mn. alloys: [75 M I].
; 1.0 \ \ ------A o.li
0.5 \
a o- 'I
0.2 2
l.Sr I / I I I
0 1oc 200 300 400 500 K 600 I-
601 , I / I I I
-0 10 20 30 40 50 ot% 60 (FetMnl-
Fig. 417. Effective exchange integral J,,, for various compositions of Fc--Ni-Mn alloys as derived from the spin-wave dispersion coefficients (Fig. 416). the lattice constants and the magnetic moments (Fig. 410) [75 M I]. Fe Ni alloys: [64H I], Ni -Mn and Fe- NikMn. 3...20 at% Mn, alloys: [75 M I]. Pair exchange integrals dcrivcd from the data of this figure: JXi,,=52(5)meV, JNiFe=38(4)mcV, JNiSln=44(5)mcV, JFeUn= 17(2)mcV, JFcFc= -8(l)meV, JMnYn= -285(30)meV.
Fig. 418. Spontaneous volume magnctostriction cc) vs. tempcraturc for (a) fcrromagnctic Fc,,,,(Ni, -IMnl)oss alloys, the arrows indicating the Curie temperature, and (b) antifcrromagnetic Fe,,,,(Ni, -,MrQo,ss alloys. the arrows indicating the N&cl temperature [71 H I]. The quantity 01 is defmcd as the relative difkrcncc bctwcen the volume in the magnetically ordered state and in the paramagnctic state.

Ref. p. 4801 1.2.3.24 Fe-Ni-Mn 475
32 J molK 28
28
-300 400 500 600 700 800 900 1000 1100 K1200 T-
Fig. 419. Specific heat C, in the paramagnetic region of Feo.5(NLMn,h5 alloys [78 B2]. Dashed lines: calculated.
Table 88. Electronic specific heat coefficient y, Debye tempera- ture On derived from specific heat measurements (see Fig. 420), and paramagnetic Curie temperature 0 (derived from Fig. 395), for disordered fee Fe,,,,-,Ni,Mn,.,, alloys. II denotes the average number of 4s and 3d electrons per atom [65 W 11.
X n 0 Y @D K 10-4calmol-’ Km2 K
0.15 8.06 -600(100) 25 359 0.30 8.35 20 31 177 0.45 8.65 240 28 222 0.6 8.97 290 14 224
Landolt-Biirnstein New Series 111/19a

1.2.3.24 Fe-Ni-Mn [Ref. p. 480
57 0.1
33
27 0 1 8 12 16 K2 20
b r2-
Fig. 470. Low-tempcraturc specific heat C,. exprcsscd as the relation bctwccn C,IT and T', whcrc T is the temperature. for (a) Fe ~Ni Mn alloys containing 25at% Mn and (b) Fc,.,,(Ni,-,Mn,),,,, alloys. See also Table 86 [65 ‘A’ I].
x 30
20
01 I I I 7.0 7.5 8.0 8.5 9.0
J
9.5 n-
70 mL
& molK2
I
40
I I
\,‘y(NiFeliMn
Fig. 421. Electronic specific heat coefficient 7 of Fc,,,,(Ni, -xMnr)0.35 alloys [72 K I]. )I is the average number of4s and 3d electrons per atom. For comparison also the data for (NiFc),Mn [65 W I], Fc Mn and fee Fe Ni alloys [64G I] arc given.

Ref. p. 4801 1.2.3.25 Co-Ni-Ti, 1.2.3.26 Co-Ni-Mn 477
1.2.3.25 Co-Ni-Ti
References: 62 S 2, 67 D 2, 68 G 1, 68 P 2, 68 S 3, 68 W 1.
Fig. 422. Temperature dependence of the specific heat C, of CoTi and Co,,,,Ni o,zsTi alloys, plotted as (I) C,/T vs. T2 and (2) (C,- A)/T vs. T’. A is the magnetic cluster specific heat, being 2.7 and 5.5. 10-4calmol-’ K-’ for these alloys, respectively [62 S 21.
3c .10-G
JIJ molK
2E
I 22 ? e
IE
14
1.2.3.26
References: 54 K 1, 73 Y 1, 74A 2, 79 S 3.
Fig. 423. Magnetic phase diagram of (Co,,,Mn,,,), -,Ni, alloys as a function ofcomposition and average number n of 4s and 3d electrons per atom. T’,, 0 and TN are ferromagnetic Curie temperature, paramagnetic Curie temperature and Ntel temperature, respectively [74A2]. See also Fig. 424.
I 4 8 12 16 K* 20
12-
Co-Ni-Mn
800 K (Coo.5Mno.5)1-xNi,
600
0 0.2 0.4 0.6 0.8 1.0 CoMn x----r Ni
8.0 8.5 9.0 9.5 10.0 /J-
Landolt-Bbmstein New Series lWl9a
Ada&i
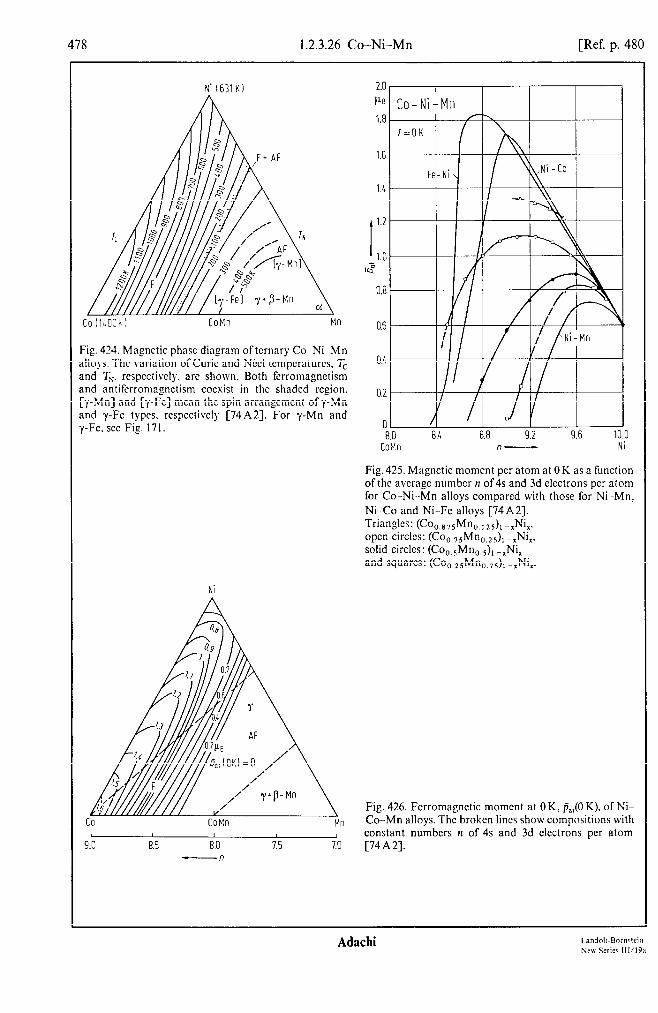
478 1.2.3.26 Co-Ni-Mn [Ref. p. 480
CoilL%h) CoMn Mn
Fig. 424. Magnetic phase diagram of ternary Co -Ni -Mn alloys. The variation of Curie and N&cl tcmpcraturcs. T, and TV. rcspcctivcly. arc shown. Both ferromagnctism and antiferromagnetism coexist in the shaded region. [y-Mn] and [y-Fe] mean the spin arrangcmcnt of y-Mn and y-Fe types. respectively [74A2]. For y-Mn and y-Fe. see Fig. 171.
8.0 CoMn
8.1 8.8 Y.2 Y.b /I- Ni
Fig. 425. Magnetic moment per atom at 0 K as a function of the averagc number PI of 4s and 3d electrons per atom for Co--Ni -Mn alloys compared with those for Ni-Mn, Ni-Co and Ni-Fc alloys [74A 21. Triang!es: (Co,.,,sMn,.,,,), -xNi,. open ctrclcs: (Co,,,,Mn,,,,), -
.’ . sohd crrclcs. (Co Mn 05 ) _ diNi” 0.51 I I and squares: (Co,,,,Mn,,,,), -xNi,.
Ni
CO COMll Mn I I I
9.0 8.5 8.0 1.5 7.0 -/i
2.0 PB
1.8
1.6
1.1
I
1.2
1.C 1:
0.E
Of
0.6
0.2
[:
I
Co-Ni-Mn I
Fig. 426. Ferromagnetic moment at 0 K, &,(O K), of Ni- Co-Mn alloys. The broken lines show compositions with constant numbers n of 4s and 3d electrons per atom [74A2].
Adachi I nndolr-Ihrnrtein Ncn Scrim 111,‘19n
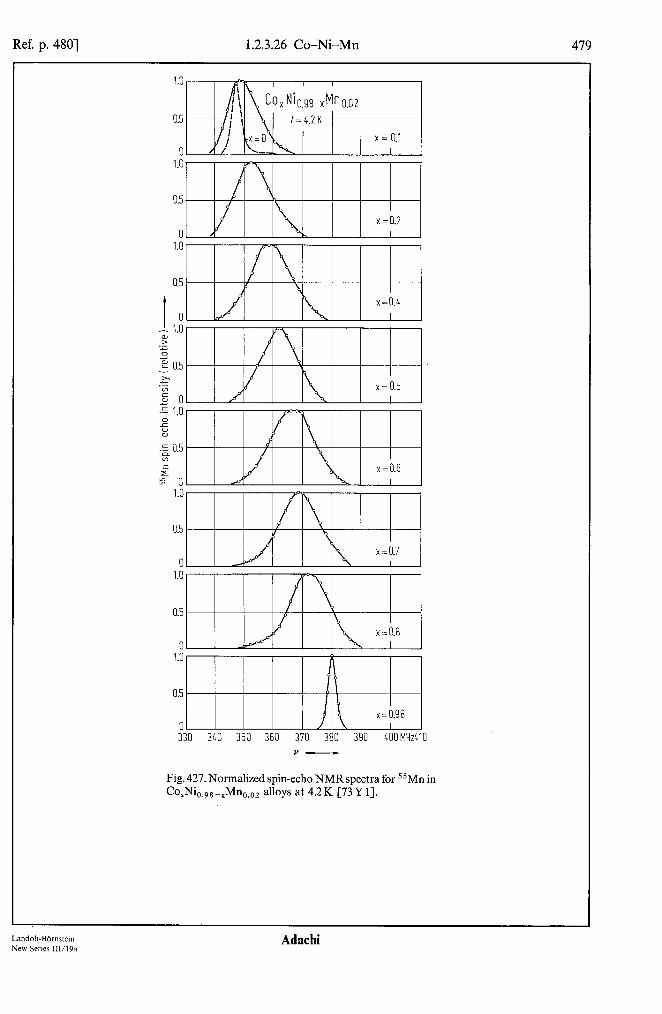
Ref. p. 4801 1.2.3.26 Co-Ni-Mn
1.0
0.5
0 1.0
0.5
0 1.0
0.5
1 0
1.0 a, .> 2 2 0.5 x .-r 2 @J 0 2 1.0 2 u A 0.5 ‘a In c
w =o 1.0
0.5
0 1.0
0.5
0 1.0
0.5
0 330 340 350 360 370 380 390 itOOMHz410
Y-
Fig. 427. Normalized spin-echo NMR spectra for 5 ‘Mn in Co,Ni,.,, -xMn,,,, alloys at 4.2 K [73 Y 11.
Landolt-Bbmstein Adachi New Series llVl9a
480 References for 1.2.2 and 1.2.3
Slbl 56k 1 5Sh 1 59al
63nl
63n2
67~1
67)~ 1
68~1
69s 1 75cl
75il
14Ll 18M 1 28Cl 29Wl 30 w 1 31Al 31Kl 31Ml 32Kl 32s 1 33Kl 33K2 34El 34K 1 34M 1 36Fl 36Ml 37Fl 37Kl 37Ml 3SJl 3SSl 39Kl 47Wl
4SKl 49R 1 50K 1 52Al 53P 1
1.2.3.27 References for 1.2.2 and 1.2.3
General references
Bozorth. R.M.: Ferromagnetism, New York: D. Van Nostrand 1951. Kasper, J.S.: Theory of Alloy Phase, American Society of Metals, 1956, p. 1163. Hansen. M., Anderko, K.: Constitution of Binary Alloys, New York: McGraw Hill Inc. 1958. Arrott. A.. Noakes. J.E.: Iron and Its Dilute Solid Solutions (Spencer, C.W., Werner, F.E., eds.). New
York: J. Wiley&Sons Ltd. 1959, p. 85. Nevitt. M.V.: Electronic Structure and Alloy Chemistry of the Transition Elements (Beck. P.A., ed.),
New York: Interscience 1963, p. 101. Nevitt, M.V.: Electronic Structure and Alloy Chemistry of the Transition Elements (Beck, P.A., ed.),
New York: Interscicncc 19’63, p. 146. Pearson. W.B.: Handbook of Lattice Spacings and Structure of Metals, Vol. 2, Oxford: Pergamon
Press 1967. Wallace, W.E., Craig, R.S.: Phase Stability in Metals and Alloys (Rudman, P.S., ed.), New York:
McGraw Hill Inc. 1967, p. 225. Shirley, D.A.: Hyperfine Structure and Nuclear Radiations, (Mathias, E., Shirley, D.E., eds.),
Amsterdam: North Holland Pub!. Co. 1968, p. 979. Shunk. F.A.: Constitution of Binary Alloys, 2nd Suppl., New York: McGraw Hill Inc. 1969, p. 512. Ishikawa. Y., Endoh. Y.: Handbook of Magnetic Materials, (Chikazumi, S., ed.), Tokyo: Asakura
Shoten 1975, (Jap). Ishikawa. Y.: Sci. Rept. Tohoku Univ., Ser. 1, 58 (1975) 151.
Special references
Lamort, J.: Ferrium 11 (1914) 256. Murakami. T.: Sci. Rept. Tohoku Imp. Univ. 7 (1918) 224, 264. Chevenard. P.: Rev. Metall. (Paris) 25 (1928) 14. Wever. F., Haschimoto, U.: Mitt. Kaiser Wilhelm-Inst. Eisenforsch. Diisseldorf 11 (1929) 293. Wever. F., Lange, H.: Mitt. Kaiser Wilhelm-Inst. Eisenforsch. Diisseldorf 12 (1930) 353. Adcock. F.: J. Iron Steel Inst. 124 (1931) 99. Kaya. S.. Kussmann, A.: Z. Phys. 72 (1931) 293. Matsunaga. Y.: Kinzoku-no-Kenkyu 8 (1931) 549 (Jpn.). Kiister. W.: Arch. Eisenhiittenw. 6 (1932) 113. Sadron. C.: Ann. Phys. 17 (1932) 371. Kiister. W., Schmidt. W.: Arch. Eisenhiittenw. 7 (1933-1934) 121. Kussmann. A., Scharnow, B., Stainhaus. W.: Heraeus Vacuumschmeltz, Abertis Hanau 1934, p. 310. Edlund. D.L.: Ph.D. Thesis. Massachusetts Inst. of Techn., Cambridge, Mass. 1934. Kuhlewein. H.: Z. Anorg. Allg. Chem. 218 (1934) 65. Masumoto, H.: Sci. Rept. Tohoku Imp. Univ. 23 (1934) 265. Fallot, M.: Ann. Phys. (Paris) 6 (1936) 305. Manders. C.: Ann. Phys. 5 (1936) 167. Farcas. T.: Ann. Phys. 8 (1937) 146. Ktister. W., Wagner, E.: Z. Metallkd. 29 (1937) 230. Marian. V.: Ann. Phys. 7 (1937) 459. Jackson, L.R.. Russell, H.W.: Instruments 11 (1938) 280. Sucksmith. W., Pearce. R.R.: Proc. R. Sot. London Ser. A 167 (1938) 189. Keesom. W.H.. Kurrelmcyer, B.: Physica 6 (1939) 633. Went. J.J.. in: New Developments in Ferromagnetic Materials (Snoek, J.L., ed.). Elsevier Publ. Comp.
Amsterdam 1947, p. 14. Kiister, W., Rauschcr, W.: Z. Metallkd. 39 (1948) 178. Rees. W.P., Burns. B.D., Cook, A.J.: J. Iron Steel Inst. (London) 162 (1949) 325. Kussmann. A.. Gratin v. Rittberg. G.: Ann. Physik (Leipzig) 7 (1950) 173. Adenstedt. H.K.. Pequignot. J.R., Raymer, J.M.: Am. Sot. Met. 44 (1952) 990. Piercy, G.R.. Morgan, E.R.: Can. J. Phys. 31 (1953) 529.

References for 1.2.2 and 1.2.3 481
53Sl 54Al 54Bl 54Gl 54Kl 54Tl 55Kl 55Nl 55Sl 5582 56Kl 56K2 56Tl 57Al 57Bl 57Cl 57Kl 57Ml 58Al 58Bl 58Hl 58H2 58Kl 58K2 58Ll 59Al 59Kl 59K2 59 K3 59Tl 60Al 6OCl 6OC2 60Kl 60K2 60Nl 6OPl 60Rl 6OSl 6OWl 61Kl 61Ll 61 M 1 62Al 62Bl 62Cl 62C2 62Dl 62Kl 62Sl 6232 6283 62Tl 62T2 62Vl 62V2 62Wl 62Yl
Shull, C.G., Wilkinson, M.K.: Rev. Mod. Phys. 25 (1953) 100. Aronin, L.R.: J. Appl. Phys. 25 (1954) 344. Bergman, G., Shoemaker, D.P.: Acta Crystallogr. 7 (1954) 857. Greenfield, P., Beck, P.A.: Trans. AIME 200 (1954) 253. Kiister, W., Rittner, H.: Z. Metallkd. 45 (1954) 639. Taoka, T., Ohtsuka, T.: J. Phys. Sot. Jpn. 9 (1954) 723. Kiister, W., Schmidt, H.: Z. Metallkd. 46 (1955) 195. Nevitt, M.V., Beck, P.A.: Trans. AIME 203 (1955) 669. Shull, C.G., Wilkinson, M.K.: Phys. Rev. 97 (1955) 304. Standley, K.J., Reich, K.H.: Proc. Phys. Sot. (London) Sect. B68 (1955) 713. Kasper, J.S., Waterstrat, R.M.: Acta Crystallogr. 9 (1956) 289. Kasper, J.S., Roberts, B.W.: Phys. Rev. 101 (1956) 537. Taoka, T.: J. Phys. Sot. Jpn. 11 (1956) 537. Abragams, SC., Gutman, L., Kasper, J.S.: Phys. Rev. 105 (1957) 130. Bacon, G.E.: Proc. R. Sot. London Ser. A241 (1957) 273. Crangle, J.: Philos. Mag. 2 (1957) 659. Kiister, W., Rocholl, P.: Z. Metallkd. 48 (1957) 485. Meneghetti, D., Sidhu, S.S.: Phys. Rev. 105 (1957) 130. Ahern, S.A., Martin, M.J.C., Sucksmith, W.: Proc. R. Sot. London Ser. A248 (1958) 145. Barlow, G.S., Standley, K.J.: Proc. Phys. Sot. (London) 71 (1958) 45. Hahn, R., Kneller, E.: Z. Metallkd. 49 (1958) 426. Hoare, F.E., Matthews, J.C.: Proc. Phys. Sot. (London) 71 (1958) 220. Kouvel, J.S., Graham, CD., Jr., Becker, J.J.: J. Appl. Phys. 29 (1958) 518. Kasper, J.S., Waterstrat, R.M.: Phys. Rev. 109 (1958) 1551. Lingelbach, R.: Z. Phys. Chem. (Neue Folge) 14 (1958) 7. Arrott, A., Noakes, J.E.: J. Appl. Phys. 30 (1959) 97s. Kasper, J.S., Kouvel, J.S.: J. Phys. Chem. Solids 11 (1959) 231. Kondorsky, E.I., Sedov, V.L.: Soviet Phys. JETP 35 ( 1959) 586. Kouvel, J.S., Graham, CD., Jr.: J. Phys. Chem. Solids 11 (1959) 220. Takano, Y., Chikazumi, S.: Kobayashi Rigaku Kenkyusho Hokoku 9 (1959) 12 (Jap). Asch, G.: Thesis Strasbourg 1960. Childs, B.G., Gardner, W.E., Penfold, J.: Philos. Mag. 5 (1960) 1267. Cheng, C.H., Wei, CT., Beck, P.A.: Phys. Rev. 120 (1960) 426. Kouvel, J.S.: J. Phys. Chem. Solids 16 (1960) 107. Kondorsky, E.I., Sedov, V.L.: J. Appl. Phys. 31 (1960) 331 S. Nevitt, M.V.: J. Appl. Phys. 31 (1960) 155. Parsons, D.: Nature 185 (1960) 840. Rajan, N.S., Waterstrat, R.M., Beck, P.A.: J. Appl. Phys. 31 (1960) 731. Schrbder, K., Cheng, C.H.: J. Appl. Phys. 31 (1960) 2154. Wakiyama, T., Chikazumi, S.: J. Phys. Sot. Jpn. 15 (1960) 1975. Koi, Y., Tsujimura, A., Hihara, T., Kushida, T.: J. Phys. Sot. Jpn. 16 (1961) 574. LaForce, R.C., Ravitz, S.R., Day, G.F.: Phys. Rev. Lett. 6 (1961) 226. Marcinkowski, M., Brown, N.: J. Appl. Phys. 32 (1961) 375. Arajs, S., Colvin, R.V., Chessin, H., Peck, J.M.: J. Appl. Phys. 33 (1962) 1353. Bueller, W.J., Wiley, R.C.: Trans. Quart. 55 (1962) 269. Cheng, C.H., Gupta, K.P., Van Reuth, EC., Beck, P.A.: Phys. Rev. 126 (1962) 2030. Chandross, R.J., Shoemaker, D.P.: J. Phys. Sot. Jpn. 17, Suppl. B-III (1962) 16. Dekhtyar, M.V.: Sov. Phys. Solid State 4 (1962) 441. Kocher, C.W., Brown, P.J.: J. Appl. Phys. 33 (1962) 1091. Sato, H., Arrott, A.: J. Phys. Sot. Jpn. 17, Suppl. B-I (1962) 147. Starke, E.A., Jr., Cheng, C.H., Beck, P.A.: Phys. Rev. 126 (1962) 1746. Shirane, G., Takei, W.J.: J. Phys. Sot. Jpn. 17, B-III (1962) 35. Taniguchi, S., Tebble, R.S., Williams, D.E.G.: Proc. R. Sot. London Ser. A265 (1962) 502. Taylor, M.A.: J. Less-Common Met. 4 (1962) 476. Van Elst, H.C., Lubach, B., Van Den Berg, G.J.: Physica 28 (1962) 1297. Van Ostenburg, D.O., Lam, D.J., Trapp, H.D., MacLeod, D.E.: Phys. Rev. 128 (1962) 1550. Wilkinson, M.K., Wollan, E.O., Koehler, W.C., Cable, J.W.: Phys. Rev. 127 (1962) 2080. Yamamoto, M., Nakamichi, T.: J. Phys. Sot. Jpn. 17 (1962) 588.
Landolt-Bbmsfein Adachi New Series 111/19a

482 References for 1.2.2 and 1.2.3
63B 1 63C 1 63C2 63C3 63C4 63C5 63D 1 63D2 63Gl 6351 63Kl 63K2 63L 1 63L2 63M 1 63Nl 63NZ 63 P 1 63P2 63s 1
64A 1
64B 1 64 B 2 64Cl
64C2 64G 1 64H 1 64 H 2
64H3 645 1 64Kl 64K2 64K3 64Ll 64 M 1 64 M 2 64 M 3 64N 1
64 W 1 64W2 64 W 3
64Y 1 6421 65B 1 65Cl 65Dl 6SHl 6511 65Kl 65 L 1 65M 1
Bando. Y.: J. Phys. Sot. Jpn. 19 (1963) 273. Collins, M.F., Forsyth. J.B.: Philos. Mag. 8 (1963) 401. Cameron. J.A., Lines. R.A.G., Turrell, B.G., Wilson, P.J.: Phys. Lett. 6 (1963) 167. Childs. B.G., Gardner. W.E., Penfold, J.: Philos. Mag. 8 (1963) 419. Crangle. G., Hallam. G.: Proc. R. Sot. London 272 (1963) 119. Chen. C.W.: Philos. Mag. 7 (1963) 1753; J. Appl. Phys. 34 (1963) 1374. Dekhtyar. M.V.: Sov. Phys. Solid State 5 (1963) 918. Doroschenko. A.V.: Fiz. Met. Metalloved. 15 (1963) 936 (Russ.). Gonser. U., Meechnn. C.J., Muir, A.H., Wiedersich, H.: J. Appl. Phys. 34 (1963) 2373. Johnson, C.E.. Ridout. MS.. Cranshaw, T.E.: Proc. Phys. Sot. (London) 81 (1963) 1079. Kouvel. J.S.. Kasper, J.S.: J. Phys. Chem. Solids 24 (1963) 529. Kdi, Y., Tsujimara. A.: J. Phys. Sot. Jpn. 18 (1963) 1347. Low. G.G.. Collins, M.F.: J. Appl. Phys. 34 (1963) 1195. Lam. D.J..Van Ostenburg. D.O., Nevitt, M.V.,Trapp, H.D., Pracht, D.W.: Phys. Rev. 131 (1963) 1428. Marcinkowsky, M.J.. Poliak, R.M.: Philos. Mag. 8 (1963) 1023. Nevitt, M.V., Aldrcd. A.T.: J. Appl. Phys. 34 (1963) 463. Nakamichi. T., Yamamoto, M.: J. Phys. Sot. Jpn. 18 (1963) 758. Piegger. E.. Craig. R.S.: J. Chem. Phys. 39 (1963) 137. Paoletti. A., Ricci. F.P.: J. Appl. Phys. 34 (1963) 1571. Shull. G.: Electronic Structure and Alloy Chemistry of Transition Elements (Beck, P.A., ed.),
Interscience. New York 1963, p. 69. Antonini. B.. Felchcr, G.P., Menzinger, F., Paoletti, A., Ricci, F.P., Passari, L.: J. Phys. (Paris) 25 (1964)
604. Bando. Y.: J. Phys. Sot. Jpn. 19 (1964) 237. Butterworth. J.: Proc. Phys. Sot. (London) 83 (1964) 71. Chikazumi. S., Wakiyama, T., Yosida. K.: Proc. Int. Conf. Magn., Nottingham. London: Inst. Phys.
and Phys. Sot. 1964, p. 756. Crangle. J., Hallam. C.: Proc. R. Sot. London Ser. A272 (1964) 237. Gupta. K.P., Cheng. C.H., Beck, P.A.: J. Phys. Chem. Solids 25 (1964) 73. Ho, J.C., Phillips. N.E.: Phys. Lett. 10 (1964) 34. Hatherly, M., Hirakawa, K., Lowde, R.D., Mallet, J.F., Stringfellow, M.F.: Proc. Phys. Sot. (London)
84 (1964) 55. Hamaguchi, Y., Kunitomi, N.: J. Phys. Sot. Jpn. 19 (1964) 1849. Jaccarino. V., Walker. L.R.. Wertheim, G.K.: Phys. Rev. Lett. 13 (1964) 752. Koi, Y., Tsujimura. A.. Hihara, T.: J. Phys. Sot. Jpn. 19 (1964) 1493. Komura. S., Kunitomi. N.: J. Phys. Sot. Jpn. 20 (1964) 103. Kume, K., Fujita. T.: J. Phys. Sot. Jpn. 19 (1964) 1245. Loshmanov, A.A.: Fiz. Met. Metalloved. 18 (1964) 178 (Russ.). Marcone. N.J., Coil. J.A.: Acta Metall. 12 (1964) 743. Masumoto, H.. Saito, H., Sugai, T.: Nippon Kinzoku Gakkaishi 28 (1964) 96 (Jap.). Masuda. Y., Okamura. K.: J. Phys. Sot. Jpn. 19 (1964) 1249. Nevitt, M.V., Kimball, C.W., Preston, R.S.: Proc. Int. Conf. Magn., Nottingham, London: Inst. Phys.
and Phys. Sot. 1964, p. 137. Wertheim, G.K., Jaccarino, V., Wernick, J.H., Buchanan, D.N.E.: Phys. Rev. Lett. 12 (1964) 24. West. G.W.: Philos. Mag. 9 (1964) 979. Wallace. W.E., Skrabek, E.A.: Proc. 3rd Rare Earth Conf. (Vorres, K.S., ed.), New York:
Gordon & Breech 1964, p. 43 1. Yamamoto. H.: Jpn. J. Appl. Phys. 3 (1964) 745. Zimmerman. J.E.. Arrott. A., Sate, H., Shinozaki, S.: J. Appl. Phys. 35 (1964) 942. Blanchard. A.. Tutovan. V.: CR. Acad. Sci. (Paris) 261 (1965) 2852. Collins, M.F., Low, G.G.: Proc. Phys. Sot. 86 (1965) 535. Drain, L.E., West, G.W.: Philos. Mag. 12 (1965) 1061. Hamnguchi. Y., Wollan. E.O., Kochler, W.C.: Phys. Rev. 138 (1965) A 737. Ishikawa, Y., Tournier. R., Fillipi, J.: J. Phys. Chem. Solids 26 (1965) 1727. Komura. S., Kunitomi. N.: J. Phys. Sot. Jpn. 20 (1965) 103. Lowde. R.D., Shimizu. M., Stringfcllow, M.W., Torric, B.H.: Phys. Rev. Lett. 14 (1965)698. Moller, H.B., Trego. A.R., Mackintosh. A.R.: Solid State Commun. 3 (1965) 137.
Adachi

References for 1.2.2 and 1.2.3 483
65Wl
66Al 66A2 66A3 66Bl 66B2 66B3 66Cl 66Gl 66Kl 66Ml 66Pl 66Rl 66Sl 66Ul 67Al 67Bl 67Dl 67D2 67Fl 67Hl 6711 6712 67Kl 67Ml 67M2 67Nl 67Pl 67P2 67Sl 6782 6733 67Wl 67W2 68Al 68A2 68Bl 68Cl 68C2 68El 68Fl 68Gl 6811 6812 68 K 1 68 L 1 68L2 68Nl 68N2 68Pl 68P2 68Rl 68Sl 68S2 6883 68S4 68Wl
Watanabe, H., Ehara, K., Fukuroi, T., Muto, Y., Yamamoto, H.: Sci. Rept. Res. Inst. Tohoku Univ. A 17 (1965) 300.
Aoki, Y., Nakamichi, T., Yamamoto, M.: J. Phys. Sot. Jpn. 21 (1966) 565. Algie, S.H., Hall, E.O.: Acta Crystallogr. 20 (1966) 142. Arajs, S., Durmyre, G.R.: J. Appl. Phys. 37 (1966) 1017. Bastow, T.J.: Proc. Phys. Sot. 88 (1966) 935. Barnes, R.G., Beaudry, B.J., Lecander, R.G.: J. Appl. Phys. 37 (1966) 1248. Booth, J.G.: J. Phys. Chem. Solids 27 (1966) 1639. Campbell, I.A.: Proc. Phys. Sot. 89 (1966) 71. Giegengack, H., Schott, H., Schulze, G.E.R., Ullrich, H.-J.: Phys. Status Solidi 14 (1966) K 189. Koehler, W.C., Moon, R.M., Trego, A.L., Mackintosh, A.R.: Phys. Rev. 151 (1966) 405. Mook, H.A.: Phys. Rev. 148 (1966) 495. Paoletti, A., Ricci, F.P., Passari, L.: J. Appl. Phys. 37 (1966) 3236. Read, D.A., Thomas, E.H.: IEEE Trans. Magn. MAG-2 (1966) 415. Suzuki, T.: J. Phys. Sot. Jpn. 21 (1966) 442. Umebayashi, H., Ishikawa, Y.: J. Phys. Sot. Jpn. 21 (1966) 1281. Arrott, A., Werner, S.A.: Phys. Rev. 153 (1967) 624. Bucher, E., Brinkman, W.F., Maita, J.P., Williams, H.J.: Phys. Rev. Lett. 18 (1967) 1125. Dalagalme, A.: Solid State Commun. 5 (1967) 769. DeSavage, B.F., Goff, J.F.: J. Appl. Phys. 38 (1967) 1337. Fadin, V.P., Nazhalov, A.I., Panin, V.E.: Izv. Vuzov Fizika 7 (1967) 45. Hashimoto, T., Ishikawa, Y.: J. Phys. Sot. Jpn. 23 (1967) 213. Ishikawa, Y., Endoh, Y.: J. Phys. Sot. Jpn. 23 (1967) 205. Ishikawa, Y., Hoshino, S., Endoh, Y.: J. Phys. Sot. Jpn. 22 (1967) 1221. Komura, S., Kunitomi, N., Hamaguchi, Y.: J. Phys. Sot. Jpn. 23 (1967) 171. Marei, S.A., Craig, R.S., Wallace, W.E., Tsuchida, T.: J. Less-Common Met. 13 (1967) 391. Mori, N., Mitsui, T.: J. Phys. Sot. Jpn. 22 (1967) 931. Nakamura, Y., Miyata, N.: J. Phys. Sot. Jpn. 23 (1967) 223. Proctor, W., Scurlock, R.G., Wray, E.M.: Proc. Phys. Sot. 90 (1967) 697. Paoletti, A., Ricci, F.P.: Phys. Lett. A24 (1967) 371. Shiga, M.: J. Phys. Sot. Jpn. 22 (1967) 539. Satoh, T., Yokoyama, Y., Nagashima, T.: J. Phys. Sot. Jpn. 22 (1967) 1296. Syono, Y., Ishikawa, Y.: Phys. Rev. Lett. 19 (1967) 747. West, G.W.: Philos. Mag. 15 (1967) 855. Wertheim, G.K., Wernick, J.H.: Acta Metall. 15 (1967) 297. Aldred, A.T.: J. Phys. C 1 (1968) 244. Abel, A.W., Craig, R.S.: J. Less-Common Met. 16 (1968) 77. Bennett, L.H., Swartzendruber, L.J., Watson, R.E.: Phys. Rev. 165 (1968) 500. Comly, J.B., Holden, T.M., Low, G.G.: J. Phys. Cl (1968) 458. Chikazumi, S., Mizoguchi, T., Yamaguchi, N., Beckwith, P.: J. Appl. Phys. 39 (1968) 939. Endoh, Y., Ishikawa, Y., Ohno, H.: J. Phys. Sot. Jpn. 24 (1968) 263. Feinstein, L.G., Shoemaker, D.P.: J. Phys. Chem. Solids 29 (1968) 184. Goff, J.F.: J. Appl. Phys. 39 (1968) 2208. Iannucci, A., Johnson, A.A., Hughes, E.J., Barton, P.W.: J. Appl. Phys. 39 (1968) 2222. Ishikawa, Y., Endoh, Y.: J. Appl. Phys. 39 (1968) 1318. KrCn, E., Nagy, E., Nagy, I., Pal, L., Szabo, P.: J. Phys. Chem. Solids 29 (1968) 101. Low, G.G.: J. Appl. Phys. 39 (1968) 1174. Low, G.G.: Adv. Phys. XVIII (1968) 371. Nakamichi, T., Aoki, Y., Yamamoto, M.: J. Phys. Sot. Jpn. 25 (1968) 77. Nakamichi, T.: J. Phys. Sot. Jpn. 25 (1968) 1189. Pal, L., KrCn, E., Kadar, G., Szabb, P., Tarnbczi, T.: J. Appl. Phys. 39 (1968) 538. Pickart, S.J., Nathans, R., Menzinger, F.: J. Appl. Phys. 39 (1968) 2221. Read, D.A., Thomas, E.H., Forsythe, J.B.: J. Phys. Chem. Solids 29 (1968) 1569. Smith, J.H.: J. Appl. Phys. 39 (1968) 675. Salamon, M.B., Feigl, F.J.: J. Phys. Chem. Solids 29 (1968) 1443. Swartzendruber, L.J., Bennett, L.H.: J. Appl. Phys. 39 (1968) 2215. Streever, R.L.: Phys. Rev. 173 (1968) 591. West, G.W.: J. Appll Phys. 39 (1968) 2213.
Land&Biirnstein New Series lll/l9a
Adachi

484 References for 1.2.2 and 1.2.3
65 W 2 69A1 69A2 69A3 69Cl 69C2 69E 1 69 F 1 6911 69 M 1 69 M 2 69Nl 69Sl 69S2 69S3 69V 1 69 W 1 70Bl 70B2 7OCl 7oc2 70Dl 70Fl 7011 7051 70K 1 70M 1 70N 1 7001 70s 1 7OS2 7os3 7ou 1 7OVl
7OYl 7OYZ 702 1 71Al 71 B 1 71Cl 71C2 71c3 71D1 71El 71Fl 71Hl 7111 71Ll 71Nl 7101 7102 7103 71Sl 71s2 71Tl 71Ul 71Vl
Wang. F.E.. DeSavagc. B.F., Buchler, W.J.: J. Appl. Phys. 39 (1968) 2166. Aoki. Y., Nakamichi, T., Yamamoto, M.: J. Phys. Sot. Jpn. 27 (1969) 257. Aoki. Y.: J. Phys. Sot. Jpn. 27 (1969) 258. Asano. H.: J. Phys. Sot. Jpn. 27 (1969) 542. Callings. E.W., Smith. R.D., Lecander, R.G.: J. Less-Common Met. 18 (1969) 251. Colling. D.A.: J. Appl. Phys. 40 (1969) 1379. Endoh. Y., Ishikawa. Y., Shinjo, T.: Phys. Lett. A29 (1969) 310. Fujimori, H.. Saito. H.: Nippon Kinzoku Gakkaishi 33 (1969) 375 (Jap.). Ikeda. K.. Nakamichi, T., Yamamoto, M.: J. Phys. Sot. Jpn. 27 (1969) 1361. Menden. G.T., Rao. K.V., Loo, H.Y.: Phys. Rev. Lett. 23 (1969) 475. Mori. N., Mitsui. T.: J. Phys. Sot. Jpn. 26 (1969) 1087. Nakamura. Y., Shiga. M., Takeda, Y.: J. Phys. Sot. Jpn. 27 (1969) 1470. Shiga. M.. Nakamura, Y.: J. Phys. Sot. Jpn. 26 (1969) 24. Saito, H., Fujimori. H., Saito, T.: Nippon Kinzoku Gakkaishi 33 (1969) 231 (Jap.). Sueda. N., Fujiwara. Y., Fujiwara, H.: J. Sci. Hiroshima Univ. Ser. A-II, 33 (1969) 267. Von Meetwall. E., Schreiber. D.S.: Phys. Lett. A28 (1969) 495. Wertheim, G.K., Wernick, J.H., Sherwood, R.C.: Solid State Commun. 7 (1969) 1399. Briickncr, W., Kleinstuck, K., Schulze, G.E.R.: Phys. Status Solidi A 1 (1970) K 1. Barnes. R.G.. Lunde, B.K.: J. Phys. Sot. Jpn. 28 (1970) 408. Cable, J.W., Child. H.R.: J. Phys. (Paris) 32 (1970) Cl-67. Cable, J.W., Hicks. T.J.: Phys. Rev. B2 (1970) 176. Doroshenko. A.V., Sidorov, S.K.: JETP 58 (1970) 124. Fujimori. H., Saito, H.: Trans. Jpn. Inst. Met. 11 (1970) 72. Ishikawa. Y., Endoh, Y., Takimoto, T.: J. Phys. Chcm. Solids 31 (1970) 1225. Johanson, G.J.. McGirr, M.B., Wheeler, D.A.: Phys. Rev. Bl (1970) 3208. Kohlhaas. R.. Raiblc, A.A., Rocker, W.: Z. Angew. Phys. 30 (1970) 254. Matsui. M.. Ido, T., Sato, K., Adachi, K.: J. Phys. Sot. Jpn. 28 (1970) 791. Nakamichi. T., Aoki. Y., Yamamoto, M.: J. Phys. Sot. Jpn. 28 (1970) 590. Okazaki. M.: C. R. Acad. Sci. Ser. B270 (1970) 254. Swartz. J.C.. Swartzendruber. L.J., Bennet, L.H.: Phys. Rev. B 1 (1970) 146. Satoh. T., Shimura. T.: J. Phys. Sot. Jpn. 29 (1970) 517. Saito, H., Fujimori, H., Saito, T.: Trans. Jpn. Inst. Met. 11 (1970) 68. Uchishiba. H., Hori, T., Nakagawa. Y.: J. Phys. Sot. Jpn. 28 (1970) 792. Volkenshtein. N.V., Zotov, T.D., Savchenkova, SF., Tsiovkin, Yu.N.: Fiz. Tverd. Tela 12 (1970) 1845
(Russ). Yamada. T., Kunitomi. N., Nakai. Y., Cox, D.E., Shiranc, G.: J. Phys. Sot. Jpn. 28 (1970) 615. Yamada. T.: J. Phys. Sot. Jpn. 28 (1970) 596. Zotov, T.D., Pronina. A.P.: Fiz. Tvcrd. Tela 12 (1970) 2184 (Russ). Arajs. S., Anderson E.E.: Physica 54 (1971) 617. Bartel, L.C., Edwards, L.R., Samara, G.A.: AIP Conf. Proc. 5 (1971) 482. Chiffey, R.. Hicks. T.J.: Phys. Lett. A34 (1971) 267. Chiu. C.H.. Jericho. M.H., March, R.H.: Can. J. Phys. 49 (1971) 3010. Crangle. J.. Goodman. G.M.: Proc. R. Sot. London Ser. A321 (1971) 477. Dean. R.H.. Furley, R.J., Seurlock. R.G.: J. Phys. Fl (1971) 78. Endoh, Y., Ishikawa. Y.: J. Phys. Sot. Jpn. 30 (1971) 1614. Filip. D.P.: Phys. Status Solidi A7 (1971) K 35. Hayase. M., Shiga. M., Nakamura, Y.: J. Phys. Sot. Jpn. 30 (1971) 729. Ikeda. K.. Nakamichi. T., Yamamoto, M.: J. Phys. Sot. Jpn. 30 (1971) 1504. Lander. G.H.. Heaton, L.: J. Phys. Chem. Solids 32 (1971) 427. Nakamura. Y., Hayase, M., Shiga, M., Miyamoto, Y., Kawai, N.: J. Phys. Sot. Jpn. 30 (1971) 720. Ohno. H.. Mekata. M.: J. Phys. Sot. Jpn. 31 (1971) 102. Ohno. H.: J. Phys. Sot. Jpn. 31 (1971) 92. Okazaki, M.: J. Phys. (Paris) 32 (1971) C l-874. Stoclinga. S.J.M.: J. Phys. (Paris) 32 (1971) C l-330. Shalaev, A.M.. Krulikovskaya, M.P.: Fiz. Met. Metalloved. 32 (1971) 193 (Russ). Tutovan. V., Chiriac. M.: J. Phys. (Paris) 32 (1971) C l-872. Uchishiba. H.: J. Phys. Sot. Jpn. 31 (1971) 436. Von Meerwall. E., Schrciber, D.S.: Phys. Rev. B3 (1971) 1.
References for 1.2.2 and 1.2.3 485
71Wl 72Al 72A2 72Bl 72Cl 72Hl 72H2 7211 72Kl 72Ml 73Al 73A2 7311 73Ml 73 s 1 7382 73Tl 73Wl 73Yl 74Al 74A2 74A3 74Cl 74Fl 7411 74Kl 74K2 74K3 74Ml 74Pl
74P2
74P3 74P4 74Sl 74Vl
74Yl 75Al 75A2 75Bl 75Cl 75C2 75c3
75Dl
75El 75Fl 75F2 75Gl 75Hl 75H2
75H3
75H4
Whittaker, K.C., Dziwornooh, P.A., Riggs, R.J.: J. Low Temp. Phys. 5 (1971) 461. Adachi, K., Sato, K., Matsui, M., Mitani, S.: IEEE Trans. Magn. MAG-8 (1972) 693. Aldred, A.T.: Int. J. Magn. 2 (1972) 223. Besnus, M.J., Gottehrer, Y., Munschy, G.: Phys. Status Solidi b 49 (1972) 597. Callings, E.W., Ho, J.C., Jaffee, R.I.: Phys. Rev. 5 (1972) 4435. Herbert, I.R., Clark, P.E., Wilson, G.V.H.: J. Phys. Chem. Solids 33 (1972) 979. Hasegawa, M., Kanamori, J.: J. Phys. Sot. Jpn. 33 (1972) 1607. Ikeda, K., Nakamichi, T., Yamamoto, M.: Phys. Status Solidi (a) 12 (1972) 595. Kawarazaki, S., Shiga, M., Nakamura, Y.: Phys. Status Solidi (b) 50 (1972) 359. Men’shikov, A.Z., Yurtchikov, E.E.: Izv. Akad. Nauk SSSR Ser. Fiz. 36 (1972) 1463. Adachi, K., Matsui, M., Mitani, S.: J. Phys. Sot. Jpn. 35 (1973) 426. Asada, Y., Nose, H.: J. Phys. Sot. Jpn. 35 (1973) 409. Ishikawa, Y., Endoh, Y., Ikeda, S.: J. Phys. Sot. Jpn. 35 (1973) 1616. Matsui, M., Sato, K., Adachi, K.: J. Phys. Sot. Jpn. 35 (1973) 419. Sumiyama, K., Shiga, M., Nakamura, Y.: J. Phys. Sot. Jpn. 35 (1973) 469. Sumitomo, Y., Moriya, T., Ino, H., Fujita, E.: J. Phys. Sot. Jpn. 35 (1973) 461. Takenaka, H., Asayama, K.: J. Phys. Sot. Jpn. 35 (1973) 740. Williams, W., Jr., Stanford, J.L.: Phys. Rev. B 7 (1973) 3244. Yasuoka, H., Hoshinouchi, S., Nakamura, Y.: J. Phys. Sot. Jpn. 34 (1973) 1192. Aoki, Y., Yamamoto, M.: Phys. Status. Solidi (a) 26 (1974) K 137. Adachi, K., Sato, K., Katata, A., Mori, M.: Proc. Int. Conf. Magn. Moscow, 1973, l(2) (1974) 256. Aoki, Y., Asami, K., Yamamoto, M.: Phys. Status Solidi (a) 23 (1974) K 167. Cable, J.W., Child, H.R.: Phys. Rev. B 10 (1974) 4607. Fukamichi, K., Saito, H.: Nippon Kinzoku Gakkaishi 38 (1974) 1083 (Jap). Ishikawa, Y., Kohgi, M., Noda, Y., Tajima, K.: Proc. Int. Conf. Magn., Moscow, 1973, 4 (1974) 567. Kohara, T., Asayama, K.: J. Phys. Sot. Jpn. 37 (1974) 393. Kohara, T., Asayama, K.: J. Phys. Sot. Jpn. 37 (1974) 401. Kawakami, M., Koi, Y.: J. Phys. Sot. Jpn. 37 (1974) 1257. Mekata, M., Nakahashi, Y., Yamamoto, T.: J. Phys. Sot. Jpn. 37 (1974) 1509. Panin, V.E., Lotkov, A.I., Kolubaev, A.V.: Tezisy Dokl-Vses. Konf. Kristallokhim. Intermet. Soedin.,
2nd 1974, p. 23 (Russ). Panin, V.E., Lotkov, AI., Gaidikova, L.I.: Tezisy Dokl.-Vses. Konf. Kristallokhim. Intermet. Soedin.,
2nd 1974, p. 24 (Russ). Pop, I., Iusan, V., Giurgiu, A.: Phys. Lett. A49 (1974) 439. Pop, I., Iusan, V., Giurgiu, A.: Stud. Univ. Babes-Balyai, Ser. Phys. 19 (1974) 68. Shinjo, T., Okada, K., Takada, T., Ishikawa, Y.: J. Phys. Sot. Jpn. 37 (1974) 877. Valiev, E.Z., Doroshenko, A.V., Sidorov, S.K., Nikulin, Yu.M., Teploukhov, S.G.: Fiz. Met.
Metalloved. 38 (1974) 993 (Russ.) Yamaguchi, H., Watanabe, H., Suzuki, Y., Saito, H.: J. Phys. Sot. Jpn. 36 (1974) 971. Acker, F., Huguenin, R.: Phys. Lett. A53 (1975) 167. Arajs, S., Anderson, E.E., Kelly, J.R., Rao, K.V.: AIP Conf. Proc. 1974, 24 (1975) 412. Benediktsson, G., Astrom, H.U., Rao, K.V.: J. Phys. F5 (1975) 1966. Claus, H.: Phys. Rev. Lett. 34 (1975) 26. Collings, E.W.: J. Less-Common Met. 39 (1975) 63. Chandra, G., Ray, J., Bansal, C.: Proc. Int. Conf. Low Temp. Phys., 14th, 3 (1975) 358 (Krusius, M.,
Vuorio, M., eds.), Amsterdam: North-Holland Publ. Co. Dubovka, G.T., Ponyatovskii, E.G., Georgieva, I.Ya., Antonov, V.E.: Phys. Status Solidi A32 (1975)
301. Edwards, L.R., Fritz, I.J.: AIP Conf. Proc. 1974, 24 (1975) 414. Fukamichi, K., Suzuki, Y., Saito, H.: Trans. Jpn. Inst. Met. 16 (1975) 133. Frollani, G., Menzinger, F., Sacchetti, F.: Phys. Rev. B 11 (1975) 2030. Gregory, I.P., Moody, D.E.: J. Phys. F5 (1975) 36. Hori, T.: J. Phys. Sot. Jpn. 38 (1975) 1780. Hedgcock, F.T., Strom-Olsen, J.O., Wilford, D.: Proc. Int. Conf. Low Temp. Phys., 14th, 3 (1975) 298
(Krusius, M., Vuorio, M., eds.), Amsterdam: North-Holland Publ. Co. Ho, J.C., Collings, E.W.: Proc. Int. Conf. Low Temp. Phys., 14th, 2 (1975) 273 (Krusius, M., Vuorio, M.,
eds.), Amsterdam: North-Holland Publ. Co. Hamaguchi, Y., Wollan, E.O., Koehler, W.C.: Phys. Rev. A138 (1975) 737.
Landolt-BOrnstein New Series 111/19a
Adachi

486 Refcrcnces for 1.2.2 and 1.2.3
7.511 75 12 7513 75K 1 75K2 75L I 75L2 75L3 75h? 1 75 hf 2
75N 1 75N2 75P 1 75Rl 75s 1 75s’ 75S3 75W 1 76Al 76A2 76A3 76A4 76A5 76Bl 76C 1 76C2 76G I 76Hl
76H2 76Ll 76MI
76hl2 76M3 76M4 76R 1 76R2 76Sl
76S2
76S3 76S4 76Tl 76W 1 77A 1 77A2 77A3 77A4 77A5 77B 1 77H 1 77H2
77H3 77H4
Ikeda. S.. Ishikawa. Y.: J. Phys. Sot. Jpn. 39 (1975) 332. Ishikawa. Y., Kohgi. M., Noda, Y.: J. Phys. Sot. Jpn. 39 (1975) 675. Ishikawa, Y.: Sci. Rept. Tohoku Univ., Ser. I, 58 (1975) 151. Kohara. T., Asayama. K.: J. Phys. Sot. Jpn. 39 (1975) 1263. Kirillova. M.M.. Nomerovannava. L.V.: Fiz. Met. Metalloved. 40 (1975) 983 (Russ). Lynch. D.W., Rosei. R.. Weaver. J.H.: Phys. Status Solidi A 27 (1975) 515. Loegcl. B.: J. Phys. F5 (1975) 497. Loegel. B.. Friedt. J.M., Poinsot, R.: J. Phys. F5 (1975) L 54. Men’shikov, A.Z.. Kazantsev, V.A., Kuz’min, N.N., Sidorov, SK.: J. Mag. Magn. Mater. 1 (1975) 91. Men’shikov, A.Z.. Kuz’min, N.N., Kazantsev, V.A., Sidorov, S.K., Kalinin, V.M.: Fiz. Met.
Metalloved. 40 (1975) 647 (Russ). Nagasawa. H., Senbn. M.: J. Phys. Sot. Japn. 39 (1975) 70. Nakai. Y., Kunitomi. N.: J. Phys. Sot. Jpn. 39 (1975) 1257. Patton. C.E., Vardeman. M., Baker, G.L.: Dig. Intermag. Conf. 1975, 31.4. Rode. V.E.. Deryabin, A.V., Pislar, I.G.: Fiz. Met. Mctalloved. 40 (1975) 1110 (Russ). Smith. T.F., Tainsh. R.J., Shelton, R.N., Gardner, W.E.: J. Phys. F5 (1975) L96. Shull. R.D., Beck. P.A.: AIP Conf. Proc. 1974, 24 (1975) 95. Stetsenko. P.N.. Surikov, V.V.: Fiz. Tverd. Tela (Leningrad) 17 (1975) 590 (Russ). Wada. S.. Asayama. K.: J. Phys. Sot. Jpn. 39 (1975) 352. Acker. F., Huguenin. R.: J. Phys. F6 (1976) L 147. Aoki. Y., Yamamoto, M.: Phys. Status Solidi A33 (1976) 625. Aldred. A.T., Rainford, B.D., Kouvel, J.S., Hicks, T.J.: Phys. Rev. B14 (1976) 228. Aldrcd. A.T.: Phys. Rev. B 14 (1976) 219. Adachi. K., Maki. S.: Toyoda Kenkyu Hokoku 29 (1976) 4 (Jap). Bansal. C.. Chandra. G.: Solid State Commun. 19 (1976) 107. Cable. J.W.. Medina. R.A.: Phys. Rev. B13 (1976) 4868. Child. H.R.. Cable. J.W.: Phys. Rev. B 13 (1976) 227. Goman’lov, V.I.. Mokhov, B.N., Mal’tscv, E.I.: Pis’ma Zh. Eksp. Teor. Fiz. 23 (1976) 97 (Russ). Hennion. B., Hutchings. M.T., Lowde, R.D., Stringfellow, M.W., Tocchetti, D.: Proc. Conf. Neutron
Scattering 2 (CONF-760601) 1976, p. 825 (ed. by Moon, R.M., NTIS, Springfield. Va.). Hausch. G., Shiga. M., Nakamura. Y.: J. Phys. Sot. Jpn. 40 (1976) 903. Livet. F., Radhakrishna, P.: Solid State Commun. 18 (1976) 331. Mezei. F.: Proc. Conf. Neutron Scattering 2 (CONF-760601) 1976, 670 (ed. by Moon, R.M.. NTIS,
Springfield. Va.). Mori. M.. Tsunoda. Y., Kunitomi, N.: Solid State Commun. 18 (1976) 1103. Mcn’shikov, A.Z., Kazantsev, V.A., Kuz’min, N.N.: Zh. Eksp. Teor. Fiz. 71 (1976) 648 (Russ). McCallum. R.W.. Johnston, D.C., Maple, M.B., Matthias, B.T.: Mater. Res. Bull. 11 (1976) 781. Rode. V.E.. Finkel’bcrg, S.A., Pankova. O.A.: Fiz. Met. Metalloved. 42 (1976) 895 (Russ). Rode. V.E., Deryabin, A.V., Damashke, G.: IEEE Trans. Magn. MAC-2 (1976) 404. Satoh. T.. Patton. C.E., Goldfarb, R.B.: AIP Conf. Proc., 1976, p. 34 (Mag. Magn. Mater., Jt. MMM -
Intermag Conf.. 1976) p. 361. Singer, V.V., Dovgopol, M.P., Dovgopol, S.P., Radovskii, I.Z., Gel’d, P.V., Zorin, A.I.: Izv. Vyssh.
Uchebn. Zaved.. Fiz. 19 (1976) 69 (Russ). Suzuki. T.: J. Phys. Sot. Jpn. 41 (1976) 1187. Shiga. M.. Nakamura. Y.: Phys. Status Solidi A 37 (1976) K 89. Teoh. W., Arajs. S., Abukay, D., Anderson, E.E.: J. Mag. Magn. Mater. 3 (1976) 260. Warncs. L.A.A.. King. H.W.: Cryogenics 16 (1976) 473, 659. Adachi. K.. Maki. S.: Physica B+C 86-88 (1977) 263. Akoh. H., Matsumura. M., Asayama. K., Tasaki, A.: J. Phys. Sot. Jpn. 43 (1977) 1857. Astrom. H.U., Gudmundsson, H., Hedman, L., Rao, K.V.: Physica B+C 86-88 (1977) 332. Aoki, Y., Gotoh. Y.: Phys. Status Solidi A42 (1977) 42. Aldred. A.T., Kouvel. J.S.: Physica B 86-88 (1977) 329. Bienias. J.A.. Moody, D.E.: Physica B +C 8&88 (1977) 541. Hcnnion. M.. Hennion. B., Kajzar. F.: Solid State Commun. 21 (1977) 231. Hausch. G., Torok. E.: Intern. Frict. Ultrason. Attenuation Solids. Proc. Int. Conf., 6th (1977) 731. (Ed.
by Hasiguti R.R., Mikoshiba. N., Tokyo: Univ. Tokyo Press). Hedgcock, F.T., Strom-Olsen. J.O., Wilford, D.F.: J. Phys. F7 (1977) 855. Hempelmann, R.. Wicke, E.: Ber. Bunsen Gesellsch. 81 (1977) 425.
Adachi
References for 1.2.2 and 1.2.3 487
77Kl Kuwano, H., Ono, K.: J. Phys. Sot. Jpn. 42 (1977) 72. 77Ml Mustaffa, A., Read, D.A.: J. Mag. Magn. Mater. 5 (1977) 349. 77M2 Mokhov, B.N., Goman’kov, V.I., Makarov, V.A., Sakharova, T.V., Nogin, N.I.: Zh. Eksp. Teor. Fiz. 72
(1977) 1833 (Russ). 77M3 77M4 77M5 77M6 77Nl 77N2
Mokhov, B.N., Goman’kov, V.I., Puzei, I.M.: Pis’ma Zh. Eksp. Teor. Fiz. 25 (1977) 299 (Russ). Men’shikov, A.Z., Teplykh, A.E.: Fiz. Met. Metalloved. 44 (1977) 1215 (Russ). Matsumura, M., Asayama, K.: J. Phys. Sot. Jpn. 43 (1977) 1861. Maystrenko, L.G., Polovov, V.M.: Fiz. Met. Metalloved. 43 (1977) 991. Nishihara, Y., Ogawa, S., Waki, S.: J. Phys. Sot. Jpn. 42 (1977) 845. Narayanasamy, A., Ericsson, T., Nagarajan, T., Muthukumarasamy, P.: Phys. Status Solidi A42
(1977) K 65. 7701 77Yl 78Al 78Bl 78B2 78B3 78B4 78Cl 78C2 78C3 78Dl 78Hl 78H2 78H3 78H4
Ohara, S., Komura, S., Takeda, T., Hihara, T., Komura, Y.: J. Phys. Sot. Jpn. 42 (1977) 1881. Yamashita, O., Yamaguchi, Y., Watanabe, M.: JAERI Report M (1977) 56. Aoki, Y., Fukamichi, K.: Phys. Status Solidi A50 (1978) 263. Burke, S.K., Rainford, B.D.: J. Phys. FS (1978) L239. Bendick, W., Ettwig, H.H., Pepperhoff, W.: J. Phys. F8 (1978) 2525. Beille, J., Bloch, D., Towfig, F.: Solid State Commun. 25 (1978) 57. Beille, J., Towfig, F.: J. Phys. FS (1978) 1999. Caporaletti, O., Graham, G.M.: J. Appl. Phys. 49 (1978) 1519. Campbell, LA., Allsop, A.L., Stone, N.L.: J. Phys. F8 (1978) L235. Claus, H.: Solid State Commun. 27 (1978) 423. Dubiel, S.M., Campbell, C.C.M., Obuszko, Z.: Solid State Commun. 26 (1978) 593. Hedman, L.E., Rao, K.V., Astrom, H.U.: J. Phys. Colloq. (Orsay, Fr.) 6, Vol. 2 (1978) 788. Holden, T.M., Fawcett, E.: J. Phys. F8 (1978) 2609. Hamada, N., Miwa, H.: Prog. Theor. Phys. 59 (1978) 1045. Hempelmann, R., Ohlendorf, D., Wicke, E.: Proc. Int. Symp. on Hydrides, Geilo, Norway, 1977
London: Pergamon Press 1978. 7811 78Kl
Il’ichev, V.Ya., Klimenko, I.N., Khats’ko, E.N.: Fiz. Nizk. Temp. (Kiev) 4 (1978) 370 (Russ). Kondorskii, E.I., Kostina, T.I., Galkin, Y.Yu.: Conf. Ser. - Inst. Phys. 39 (Transition Met., 1977) (1978)
611. 78K2 78K3 78K4 78Ml 78M2 78Nl 78N2 78Pl 78Rl 78R2 78R3 78Tl 78Yl 7821 79Al 79Bl 79B2 79Cl 79c2 79Fl
Komura, S., Takeda, T., Ohara, S., Nakai, Y., Kunitomi, N.: J. Phys. Sot. Jpn. 45 (1978) 1493. Kitaoka, Y., Ueno, K., Asayama, K.: J. Phys. Sot. Jpn. 44 (1978) 142. Kawakami, M.: J. Phys. Sot. Jpn. 44 (1978) 433. Men’shikov, A.Z., Sidorov, S.K., Teplykh, A.E.: Fiz. Met. Metalloved. 45 (1978) 949 (Russ). Mikke, K., Jankowska, J.: Transition Metals 1977 (Inst. Phys. Conf. Ser. 39), 1978, p. 595. Nakai, Y., Hozaki, K., Kunitomi, N.: J. Phys. Sot. Jpn. 45 (1978) 73. Nazimov, O.P., Bin, A.A.: Izv. Vyssh, Uchebn. Zaved., Tsvetn. Metall. 5 (1978) 112 (Russ). Pop, I., Giurgiu, A., Pop, E., Iusan, V.: Phys. Status Solidi (b) 88 (1978) K 181. Radhakrishna, P., Livet, F.: Solid State Commun. 25 (1978) 597. Rode, V.E., Finkel’berg, S.A., Skurikhin, A.V.: Fiz. Met. Metalloved. 45 (1978) 433 (Russ). Reno, R.C.: Hyperfine Interact. 4 (1978) 338. Tange, H., Tokunaga, T., Goto, M.: J. Phys. Sot. Jpn. 45 (1978) 105. Yao, Y., Arajs, S.: Phys. Status Solidi (b) 89 (1978) K 201. Zech, E., Hagn, E., Ernst, H.: Hyperf. Interact. 4 (1978) 342. Aoki, Y., Hashimoto, S.: Z. Metallkd. 70 (1979) 436. Beille, J., Bloch, D., Towfiq, F., Voiron, J.: J. Mag. Magn. Mater. 10 (1979) 265. Buis, N.: Thesis Amsterdam 1979. Cowlam, N., Bacon, G.E., Gillott, L., Harmer, G.R., Self, A.G.: J. Phys. F9 (1979) 1387. Chernykh, I.V., Demidenko, V.S., Litvintsev, V.V.: Izv. Vyssh. Uchebn. Zaved., Fiz. 22 (1979) 93 (Russ). Fedchenko, R.G., Onishchenko, T.N.: Metallofizika (Akad. Nauk Ukr. SSR, Inst. Metallofiz.) 75
(1979) 86 (Russ). 79F2 79Gl 79Hl 79Kl 79K2
Fukamichi, K.: Phys. Lett. A70 (1979) 235. Goldfarb, R.B., Patton, C.E.: J. Appl. Phys. 50 7358. Hausch, G., Torok, E., Mohri, T., Nakamura, Y.: J. Mag. Magn. Mater. 10 (1979) 157. Kajzar, F., Delapalme, A.: J. Mag. Magn. Mater. 14 (1979) 139. Kondorskii, EL, Kostina, T.I., Medvedchikov, V.P., Kuskova, Yu.A.: Fiz. Met. Metalloved. 48 (1979)
1158 (Russ).
Landolf-Bbrnstein New Series 111/19a
Adachi

488 Refcrcnces for 1.2.2 and 1.2.3
79K3 Khomcnko. O.A., Khil’kevich, I.F., Zvigintseva, G.E., Vaganova, L.A., Belenkova, M.M.: Fiz. Met.
79K4 79K5 79 K 6 79K7
Metallovet ;1979) 43 1 (Russ). Katano. S., M;. N.: J. Phys. Sot. Jpn. 46 (1979) 1265. Kajzar. F., Parette. G., Babic, B.: J. Appl. Phys. 50 (1979) 7519. Kuwano. H., 8no, K.: J. Phys. Colloq. 40 (1979) C 196. Kirillova. M.M.. Nomerovannaya, L.V.: Elektron Strukt. Perekhodnykh Met.. Ikh Splavov Intermet.
Soedin. Mater. Mezhdunar. Simp. ISESTM, 2nd 1977,1979, p. 57 (Russ). (ed. by Nemoshkalenko, V.V., Kiev, USSR: Izv. Naukova Dumka).
79 K 8 Kajzar. F., Parette. G.: Solid State Commun. 29 (1979) 323. 79K9 Kemeny. T., Fogarassy, B., Arajs. S., Moyer, C.A.: Phys. Rev. B 19 (1979) 2975. 79K 10 Klimenko. I.N., Romanov, V.P., Il’ichev, V.Ya.: Cryogenics 19 (1979) 209 (Russ). 79K I1 Kalinin. V.M.: Izv. Vyssh. Uchebn. Zaved., Fiz. 22 (1979) 79 (Russ). 79K 12 Kokotov, S.I.. Fadin. V.P.: Izv. Vyssh. Uchcbn. Zaved., Fiz. 22 (1979) 108 (Russ). 79K 13 Katano, S.. Mori. N.: J. Phys. Sot. Jpn. 46 (1979) 691. 79K 14 Kajzar, F., Parette. G.: Phys. Rev. B20 (1979) 2002. 79M 1 Makarov, V.A., Tret’yakov, B.N., Puzei, I.M., Kalinin, G.P., Tokmakova, V.A.: Fiz. Tverd. Tela
(Leningrad) 21 (1979) 901 (Russ). 79 M 2 Maki. S.. Adachi. K.: J. Phys. Sot. Jpn. 46 (1979) 1131. 79 M 3 Maki. S., Adachi. K.: Toyoda Kenkyu Hokoku 32 (1979) 12 (Jap). 7901 Ohlendorf. D.. Wicke. E.. Obermann, A.: J. Phys. Chem. Solids 40 (1979) 849. 79s1 Singer. V.V., Dovgopol, S.P., Radovskii, I.Z., Gel’d, P.V.: Izv. Vyssh. Uchebn. Zaved., Fiz. 22 (1979) 86
(Russ). 7932 Strom-Olsen. J.O., Wilford. D.F., Burke, S.K., Rainford, B.D.: J. Phys. F9 (1979) L95. 7933 Shiozaki. Y., Nakai. Y., Kunitomi, N.: J. Phys. Sot. Jpn. 46 (1979) 59. 80A 1 Aoki. Y., Hiroyoshi. H., Kawakami, M.: J. Mag. Magn. Mater 15-18 (1980) 1179. 80BI Babic. B., Kajzar. F., Parettc, G.: J. Mag. Magn. Mater. 15-18 (1980) 287. 80B2 Babic. B., Kajzar. F., Parette, G.: J. Phys. Chem. Solids 41 (1980) 1303. 80B3 Buis. N., Brommer. P.E., Disveld, P., Schalkwijk, MS., Franse, J.J.M.: J. Mag. Magn. Mater. 15(1980)
291. 8OC 1 Cywinski. R.. Hicks. T.J.: J. Phys. F 10 (1980) 693. 80El Endoh, Y., Mizuki. J., Ishikawa, Y.: J. Mag. Magn. Mater 15-18 (1980) 501. 80E2 Eibschutz, M.. Mahajan, S.. Jin, S., Brasen, D.: J. Mag. Magn. Mater. lS18 (1980) 1181. 80Fl Fincher. CR.. Jr., Shapiro, S.M., Palumbo, A.H., Parks, R.D.: Phys. Rev. Lett. 45 (1980) 474. 80G 1 Gregory, I.P., Moody, D.E.: J. Mag. Magn. Mater 15-18 (1980) 281. 80G2 Gnziev. R.A., Demidenko, V.S., Panin, V.E.: Fiz. Met. Metalloved. 50 (1980) 989 (Russ). 80H 1 Hornreich. R.M.: J. Mag. Ma&n. Mater 15-18 (1980) 387. 80K 1 Kajzar. F., Parette. G.: Phys. Rev. B 22 (1980) 5471. 80K2 Kuz’min. N.N., Men’shikov, A.Z.: Fiz. Met. Metalloved. 49 (1980) 433 (Russ). 80K3 Kunitomi, N., Nakai, Y., Sakakibara, T., Mollymoto, H., Date, M.: J. Phys. Sot. Jpn. 48 (1980) 1777. 80K4 Khimmatkulov, F., Singer, V.V.. Radovskii, I.Z., Gel’d, P.N., Mal’tsev, A.G.: Fiz. Met. Metalloved. 50
(1980) 666 (Russ). 80K5 Khimmatkulov, F., Singer, V.V., Radovskii, I.Z., Dovgopol, S.P., Gel’d, P.V.: Izv. Vyssh. Uchebn.
Zaved.. Fiz. 23 (1980) 118 (Russ). 80K6 Khimmatkulov, F., Singer, V.V., Radovskii, I.Z., Gel’d, P.V., Mal’tsev, A.G.: Izv. Akad. Nauk SSSR,
Met. No. 4 (1980) 49 (Russ). 80K7 80K8 80K9 80KlO 80K 11 8OL1
Katano. S., Mori. N., Nakayama, K.: J. Phys. Sot. Jpn. 48 (1980) 192. Kondorskii. EL, Kostina, T.I., Trubitsina, N.V.: Fiz. Met. Metalloved. 50 (1980) 205 (Russ). Kanakami. M., Aoki, Y.: J. Phys. F 10 (1980) 2067. Kokorin. V.V., Osipenko, I.A.: Fiz. Met. Metalloved. 50 (1980) 1174 (Russ). Kinnenr. R.W.N., Campbell, S.J., Chaplin. D.H., Wilson, G.V.H.: Phys. Status Solidi A58 (1980) 507. Larikov, L.N., Takzei, G.A., Sych, 1.1.: Dopov. Akad. Nauk Ukr. SSR, Ser. A: Fiz.-Mat. Tekh. Nauki
(10) 1980. p. 86 (Ukrain). 8OL2
8OL3
80Ml
Larikov, L.N., Takzei, G.A., Sych, 1.1.: Metallofizika (Akad. Nauk Ukr. SSR, Otd. Fiz.) 2 (1980) 30 (Russ).
Larikov, L.N., Sych, I.I., Takzei, G.A.: Metallofizika (Akad. Nauk Ukr. SSR.Otd.Fiz.) 2 (1980) 124 (Russ).
Men’shikov, A.Z., Kuzmin, N.N., Dorofeev, Yu.A., Kazantsev, V.A., Sidorov, S.K.: J. Mag. Magn. Mater. 20 (1980) 134.
Adachi

References for 1.2.2 and 1.2.3 489
80M 2 Men’shikov, A.Z., Teplykh, A.E.: Fiz. Met. Metalloved. 50 (1980) 995 (Russ). 80M 3 Maki, S., Adachi, K.: Trans. Jpn. Inst. Met. 22 (1980) 182. 8OPl Pecherskaya, V.I., Bol’shutkin, D.N., Il’ichev, V.Ya.: Fiz. Met. Metalloved. 50 (1980) 300 (Russ). 8ORl Rhiger, D.R., Mueller, D., Beck, P.A.: J. Mag. Magn. Mater. 15-18 (1980) 165. 8OSl Suprunenko, P.A., Gavrilenko, I.S., Markiv, V.Ya.: Izv. Vyssh. Uchebn. Zaved., Fiz. 23 (1980) 124
(Russ). 8OS2 Shiga, M., Nakamura, Y.: J. Phys. Sot. Jpn. 49 (1980) 528. 8OS3 Shcherbakov, A.S., Prekul, A.F., Volkenshtein, N.V.: Fiz. Tverd. Tela (Leningrad) 22 (1980) 2301
(Russ). 80Tl Tange, H., Goto, M.: J. Phys. Sot. Jpn. 49 (1980) 957. 80T2 Takeuchi, J., Sasakura, H., Masuda, Y.: J. Phys. Sot. Jpn. 49 (1980) 508. 8021 Zukrowski, J., Krop, K.: J. Phys. Colloq. (Orsay, Fr.) (C-l) (1980) 359. 81Bl Butylenko, A.K., Nevdacha, V.V.: Ukr. Fiz. Zh. (Russ. Ed.) 26 (1981) 1390 (Russ). 81B2 Buis, N., Disveld, P., Brommer, P.E., Franse, J.J.M.: J. Phys. Fll (1981) 217. 81Cl Chachkhiani, Z.B., Chechernikov, V.I., Martynova, L.F., Nedel’ko, V.I., Chachkhiani, L.G., Georgad-
ze, G.S.: Soobshch. Akad. Nauk Gruz. SSR 103 (1981) 49 (Russ). 81Gl Gribov, Yu.A., Fadin, V.P.: Izv. Vyssh. Uchebn. Zaved., Fiz. 24 (1981) 56 (Russ). 81 G2 Goldfarb, R.B., Patton, C.E.: Phys. Rev. B 24 (1981) 1360. 81 G 3 Geerken, B.M., Griessen, R., Van Dijk, C., Fawcett, E.: Conf. Ser. - Inst. Phys. 55 (Phys. Transition
Met.) (1981) 343. 81 G4 Gribov, Yu.A., Fadin, V.P.: Izv. Vyssh. Uchebn. Zaved., Fiz. 24 (1981) 9 (Russ). 81Hl Hilscher, G., Weisinger, G., Hempelmann, R.: J. Phys. F 11 (1981) 2161. 81Kl Kajzar, F., Parette, G., Babic, B.: J. Phys. Chem. Solids 42 (1981) 501. 81 K 2 Kondorskii, E.I., Kostina, T.I., Medvedchikov, V.P.: Vestn. Mosk. Univ., Ser. 3: Fiz., Astron. 22 (1981)
22 (Russ). 81 M 1 Moze, O., Hicks, T.J.: J. Phys. F 11 (1981) 1471. 81 M2 Maki, S., Adachi, K.: Trans. Jpn. Inst. Met. 22 (1981) 182. 81 M 3 Men’shikov, A.Z., Burlet, P., Chamberod, A., Tholence, J.L.: Solid State Commun. 39 (1981) 1093. 81Nl Nakai, Y., Iida, S.: J. Phys. Sot. Jpn. 50 (1981) 3637. 81Pl Peretto, P., Venegas, R., Rao, G.N.: Phys. Rev. B23 (1981) 6544. 81Rl Rode, V.E., Finkel’berg, S.A., Wurl, B., Lyalin, A.I.: Phys. Status Solidi A64 (1981) 603. 81Sl Shapiro, S.M., Fincher, C.R., Jr., Palumbo, A.C., Parks, R.D.: Phys. Rev. B24 (1981) 6661. 81S2 Shinogi, A., Endo, K., Yamada, N., Ohyama, T.: J. Phys. Sot. Jpn. 50 (1981) 731. 81S3 Shiga, M., Matsuda, T., Nakamura, Y.: J. Phys. Sot. Jpn. 51 (1981) 345. 81Tl Tutovan, V., Scutaru, V., Boghian, L.: An. Stiint. Univ. “Al. I. Cuza” Iasi, Sect. lb 27 (1981) 1. 81T2 Takzei, G.A., Sych, I.I., Men’shikov, A.Z.: Fiz. Met. Metalloved. 52 (1981) 1157 (Russ). 81T3 Takzei, G.A., Sych, I.I., Men’shikov, A.Z., Teplykh, A.E.: Fiz. Met. Metalloved. 52 (1981) 960 (Russ). 81Vl Vintakin, E.Z., Udovenko, W.A., Mikke, K., Jankowska, J.: Solid State Commun. 37 (1981) 295. 81Yl Yamagata, H.: J. Phys. Sot. Jpn. 50 (1981) 461. 82Al Aitken, R.G., Cheung, T.D., Kouvel, J.S., Hurdequint, H.: J. Mag. Magn. Mater. 30 (1982) L 1. 82A2 Antipov, S.D., Kondrashova, L.A., Stetsenko, P.N.: Vestn. Mosk. Univ., Ser. 3: Fiz., Astron. 23 (1982)
20 (Russ). 82Bl Benediktsson, G., Hedman, L., Aastroem, H.U., Rao, K.V.: J. Phys. F 12 (1982) 1439. 82Cl Cable, J.W.: Phys. Rev. B 25 (1982) 4670. 82C2 Cable, J.W.: J. Appl. Phys. 53 (1982) 2456. 82C3 Cey, T., Kunitomi, N.: J. Phys. Sot. Jpn. 51 (1982) 3073. 82C4 Crane, S., Carnegie, D.W., Jr., Claus, H.: J. Appl. Phys. 53 (1982) 2179. 82D1 De Camargo, P.C., Brotzen, F.R.: J. Mag. Magn. Mater. 27 (1982) 65. 82D2 Deryabin, A.V., Rimlyand, V.I., Metsik, M.S.: Metallofizika (Akad. Nauk Ukr. SSR, Otd. Fiz.) 4 (1982)
47 (Russ). 82Gl Gavoille, G., Durupt, S., Hubsch, J.: J. Phys. (Les. Ulis, Fr.) 43 (1982) 773. 82 G 2 Geerken, B.M., Grieesen, R., Benediktsson, G., Aastroem, H.U., Van Dijk, C.: J. Phys. F 12 (1982) 1603. 82Ll Luetgemeier, H., Dubiel, SM.: J. Mag. Magn. Mater. 28 (1982) 277. 82M 1 Moze, O., Hicks, T.J.: J. Phys. F 12 (1982) 1. 82 M 2 Mushailov, ES., Baksheev, N.V., Troinin, Yu.I., Turpanov, I.A.: Fiz. Met. Metalloved. 53 (1982) 202
(Russ). 82M 3 Mirebeau, I., Parette, G.: J. Appl. Phys. 53 (1982) 1960. 82 M 4 Men’shikov, A.Z., Takzei, G.A., Teplykh, A.E.: Fiz. Met. Metalloved. 54 (1982) 465 (Russ).
Landolt-Bdmstein Adschi New Series 111/19a
490 References for 1.2.2 and 1.2.3
82M5 82P 1 B2R 1 82s 1 B'S:! B2Tl 83A 1 83 A 2 83A3
83B 1 83B2 83 B 3 83B4 83Cl 83C2 83D 1 83D2 B3D3 83E 1 83E2 83G 1 83H1 83H2 8311 83K 1
83 K 2
B3K3
83K4 83L 1 83M 1 83M2 83N 1 83 P 1 83P2 83R 1 83s 1 B3S2 83S3 8334 8335 83Tl
83Vl 83Yl 83Zl
Mokhov, B.N.: Pis’ma Zh. Eksp. Teor. Fiz. 35 (1982) 216 (Russ). Palumbo. A.C., Parks, R.D., Yeshurun, Y.: J. Phys. Cl5 (1982) L837. Rode. V.E.. Lyalin, AI., Finkelberg, S.A.: J. Appl. Phys. 53 (1982) 8122. Shiga. M., Matsuda. T., Nakamura, Y.: J. Phys. Sot. Jpn. 51 (1982) 345. Sakakibara. T., Date. M., Okuda, K.: Proc. ICM Conference Kyoto 1982. Takzei. G.A.. Sych. 1.1.. Kostyshin, A.M.: Fiz. Met. Metalloved. 53 (1982) 1102 (Russ). Alberts. H.L., Lourcns. J.A.J.: J. Phys. F 13 (1983) 873. Albcrts. H.L., Lourens. J.A.J.: J. Msg. Magn. Mater. 31-34 (1983) 289. Antipov. S.D., Kondrashova. L.A., Stetsenko, P.N.: Vestn. Mosk. Univ., Ser. 3: Fiz., Astron. 24 (1983)
96 (Russ). Burke. S.K.. Rainford. B.D.: J. Phys. F13 (1983) 441. Burke. S.K.. Cywinski. R., Davis, J.R., Rainford, B.D.: J. Phys. F 13 (1983) 451. Burke. S.K.. Rainford. B.D.: J. Phys. F13 (1983) 471. Bolzoni. F., Leccabue, F., Panizzicri, R., Pareti, L.: J. Mag. Magn. Mater. 31-34 (1983) 845. Cep. T., Kunitomi. N.: J. Mag. Magn. Mater. 31-34 (1983) 621. Cable. J.W., Thompson. J.R., Sekula. ST.: J. Msg. Magn. Mater 40 (1983) 147. Dorofeev, Yu.A.. Men’shikov, A.Z.. Takzei. G.A.: Fiz. Met. Metalloved. 55 (1983) 948. Dubiel. S.M., Zinn. W.: J. Mag. Magn. Mater. 31-34 (1983) 530. Deryabin, A.V., Chirkov, Yu.A.: Fiz. Tverd. Tela (Leningrad) 25 (1983) 307 (Russ). Egorushkin. V.E., Kul’kov, S.N., Kul’kova, S.E.: Zh. Eksp. Teor. Fiz. 84 (1983) 599 (Russ). Enokiya, H., Kawakami. M., Tanaka. R., Hihara, T.: J. Phys. Sot. Jpn. 52 (1983) 1434. Gschneidner. K.A., Jr., Ikeda, K.: J. Mag. Magn. Mater. 31-34 (1983) 265. Hcnnion. B., Hennion, M., Hippcrt, F., Murani, A.P.: Phys. Rev. B28 (1983) 5365. Hurdequint. H.. Kouvcl, J.S., Monod, P.: J. Mag. Magn. Mater. 31-34 (1983) 1429. Iidn. S., Nakai. Y., Kunitomi, N.: J. Mag. Magn. Mater. 31-34 (1983) 129. Kondorskii. E.I.. Kostina, T.I., Trubitsina, N.V., L’vova, I.V.: Fiz. Met. Metalloved. 56 (1983) 396
(Russ). Kunitomi. N., Tsuge. S.: Proc. Int. Symp. High Field Magn., 1982, Osaka (1983) 87. (ed. by Date, M.,
Amsterdam: North Holland Publ. Co.). Kokorin. V.V., Osipenko. I.A., Chcrepov, S.V., Chernenko, V.A.: Fiz. Met. Metalloved. 55 (1983) 1225
(Russ). Kontani. M.. Masuda. Y.: J. Mag. Magn. Mater. 31-34 (1983) 287. Lutgemeier. H.. Bohn, H.G., Dubicl. SM.: J. Mag. Magn. Mater. 31-34 (1983) 547. Mori. N., Takahashi, M., Oomi. G.: J. Msg. Magn. Mater. 31-34 (1983) 135. Mokhov, B.N.: Zh. Eksp. Teor. Fiz. 84 (1983) 1403 (Russ). Nikanorova. LA.. Ilyushin, A.S.: Fiz. Met. Metalloved. 55 (1983) 1215 (Russ). Palumbo. A.C., Parks, R.D., Yeshurun, Y.: J. Mag. Magn. Mater. 36 (1983) 66. Pecherskay, V.I., Bol’shutkin, D.N.: Metallofizika (Akad. Nauk Ukr. SSR, Otd. Fiz.)S (1983) 34(Russ). Rode, V.E.. Finkelberg. S.A., Lyalin, A.I.: J. Msg. Magn. Mater. 31-34 (1983) 293. Schaf. J., Le Dang. K., Veillet, P.: J. Msg. Magn. Mater. 37 (1983) 297. Sakakibnra. T., Date, M.. Okuda, K.: J. Mag. Magn. Mater. 31-34 (1983) 63. Sumiyama, K.. Hashimoto, Y., Yoshitake, T., Nakamura, Y.: J. Mag. Magn. Mater. 31-34 (1983) 1495. Smits. J.W., Luitjens, S.B.. den Broeder, F.J.A., Dirks, A.G.: J. Mag. Magn. Mater 31-34 (1983) 920. Shiga. M.. Nakamura. Y.: J. Msg. Magn. Mater. 31-34 (1983) 1411. Takzei. G.A.. Sych. 1.1.. Kostyshin. A.M., Rafalovskii, V.A.: Metallofizika(Akad.Nauk Ukr. SSR, Otd.
Fiz.) 5 (1983) 113 (Russ). Vilar. R.. Cizcron. G.: Ser. Metall. 17 (1983) 127. Yamagata. H.. Matsumura. M.: J. Mag. Magn. Mater. 31-34 (1983) 65. Zukrowski. J., Krop. K.: Acta Phys. Pol. A63 (1983) 151.

Ref. p. 5171 1.3.1 4d, 5d: introduction 491
1.3 4d and 5d elements, alloys and compounds
1.3.1 Introduction to the paramagnetism of 4d and 5d transition metals
The 4d and 5d transition metals and their mutual alloys and compounds generally exhibit paramagnetism; the major part of their susceptibility arises from the spin paramagnetism of itinerant d electrons; paramagnetic susceptibilities xor,, and xspmorb, which arise, respectively, from the terms of the orbital angular momentum and the spin-orbit interaction, are known also to be important [Sl S 11. If the Stoner model is used to describe the system of itinerant electrons, the spin susceptibility at absolute zero, xspin, is given by
W;Wd Xspin = 1 - 2p;ZD(E,) ’ (1)
where uB is the magnetic moment of one electron, i.e. the Bohr magneton, Z is the effective interaction be- tween electrons and D(E,) is the electronic density of states at the Fermi energy E, at zero temperature. Cor- respondingly, the electronic specific heat coefficient y is given by y = (2n2/3)kiD(E,), where k, is Boltzmann’s constant. The factor F = (1 - 2&ZD(E,))- ‘, which denotes the degree of enhancement of the spin susceptibility over the noninteracting value because of the electron-electron interaction, is called the Stoner enhancement factor. At the time of Stoner, however, the nature of D(E,) was not definite, since his theory could not answer how the electron-electron interaction influences the density of states.
This point has been clarified by Landau in his theory of the Fermi liquid [56 L 11; he has shown that xspin can be exactly written in a form similar to eq. (1);
bin = I+ 2@(EF) = ~ l+Yy, ’ (2)
where y is the spin-antisymmetric part of the quasiparticle interaction function, Yy, = 2tpD(E,) is one of the so- called Landau parameters, and D(E,) is the exact density of states in which the effect of the electron-electron interaction is correctly included. Here F =(l + Y,)-l should be called the Landau (instead of Stoner) enhancement factor. One modification is needed if one considers the electron-phonon interaction, since this interaction does not substantially influence the magnetic susceptibility, while it influences the electronic specific heat. If one considers that the electron-phonon interaction can be treated as renormalization of the electronic self- energy, while the vertex correction due to the interaction can be neglected in view of contributing the order I/mlM, where m and M are, respectively, the electron and ion masses, the effects of the electron-electron and electron-phonon interactions on the electronic density of states can be factorized to a good approximation; the
’ observed electronic specific heat coefficient is thus given by
Yob = $ k;D(EF) (I+ a),
whereas the spin susceptibility retains the form of eq. (2). Here i is the electron-phonon interaction constant and the factor (1 + 1) denotes the effective mass enhancement due to that interaction. For the enhancement factor F one obtains from eqs. (2) and (3)
1 +‘ki (1 +&spin F=(l+Y,) =x yob . (4)
Pauli paramagnetism ranges from the weakly paramagnetic regime, Y,,-+co and F+O, to the strongly paramagnetic (or nearly ferromagnetic) regime, Y, + - 1 and F-co. It is known that, at ambient pressure, all 4d and 5d transition metals and their mutual alloys and compounds presently known are paramagnetic, i.e. Yy,> - 1. However, Y, is pressure-dependent, and hence it will be possible to find substances that become ferromagnetic at higher pressures, Y,, < - 1.
Landolt-Bornstein New Series 111/19a
Misawa, Kanematsu

492 1.3.1 4d, 5d: introduction [Ref. p. 517
To estimate the Stoner (Landau) enhancement factor F for 4d and 5d transition metals, one should single out lsrin from the observed susceptibility at 0 K. z (0 K). For that purpose one needs either to evaluate theoretical!) 3r to determine expcrimcntally xorh and x,p.orh. Such a procedure is not quite we!! defined except for Knight- shift experiments and causes ambiguity. Here we adopt, as a very crude estimate, 21 (OK) for zrpi,; the results for F calculated from the values of yoh. x (OK) and 3, on the basis of eq. (4) are listed in Table 1. It is concluded that, within the above-mentioned uncertainty, OS and Ru are in the weakly paramagnetic region, Pd is in the nearly ferromagnetic region and others are intermediate.
Table 1. Basic constants and susceptibility data for 4d and 5d transition metals. ~~(0 K) and x,(20 “C): observed magnetic susceptibility at 0 K and 20 “C, respectively 7: observed electronic specific heat coefficient i.: electron-phonon interaction constant F: Stoner (Landau) enhanccmcnt factor. Rcfcrencc to each value of I,,(20 ‘C) is found in the corresponding place in the column of references. See [82 V 1, 81 S I] for references to the values of 7 and i.
Crystal ~(0 K) ? I. F x,(20 -‘cl Ref.
structure 10-42 mJ molK’
10-45
Zr hcp 1.06 2.77 0.4 3.9 1.14 1.17 ‘) 1.18 55Kl 71Cl 41Sl 1.18 ‘) 1.21 1.21 6SVl 6lKl 62Tl 1.26 1.29 65S2 65Vl
Nb bee 2.27 7.80 0.9 4.0 2.02 2.04 2.05 6532 53Kl 76Hl 2.09 2.14 2.14 54Al 61Kl 71Kl
MO bee 0.82 1.83 0.4 4.6 0.65 0.67 0.72 61Kl 77Pl 71Kl 0.73 0.83 57Al 53Kl
Tc hcp 1.07 6.28 - - 1.07 1.23 SORl 7011 Ru hcp 0.39 2.8 0.4 1.4 0.34 0.41 0.43 61Kl 7011 31Gl Rh fee 0.95 4.64 - - 1.01 1.02 1.02 SlAl 5lHl 60Bl
1.06 61 K 1 Pd fee 7.0 9.36 0.7 9.3 5.25 5.29 5.31 51Hl 60Bl 63Ml
5.4 5.8 61Kl 70Tl
Hf hcp 0.71 2.21 0.3 3.1 0.68 0.70 0.70 61Kl 64Vl 65Vl 0.74 ‘) 0.75 71Cl 55Kl
Ta bee 1.54 6.15 0.7 3.1 1.50 1.52 1.54 53Kl 54Al 51Hl 1.54 1.62 6lKl 71Kl
w bee 0.52 0.90 0.25 5.3 0.52 0.53 0.53 75Al 6lKl 7lKl 0.54 0.59 57Al 53Kl
Re hcp 0.63 2.35 0.4 2.7 0.56 0.65 0.68 54Al 61Kl 71Kl 0.68 0.71 1) 52Wl 69Vl
OS hcp 0.09 2.35 0.4 0.4 0.10 0.10 ‘) 0.13 31Gl 73Gl 67Wl Ir fee 1.9s 3.19 0.3 5.9 0.23 0.27 60Bl 61Kl Pt fee 2.06 6.48 0.6 3.7 1.87 1.89 1.89 7811 51Hl 6lKl
1.91 2.0 2.05 60Bl 70Tl 74Wl
‘) Sin_cle-crystal specimens. (~“,,,(20 ‘C)+21,,,(20”C))/3 is listed.
Misaaa, Kancmatsu
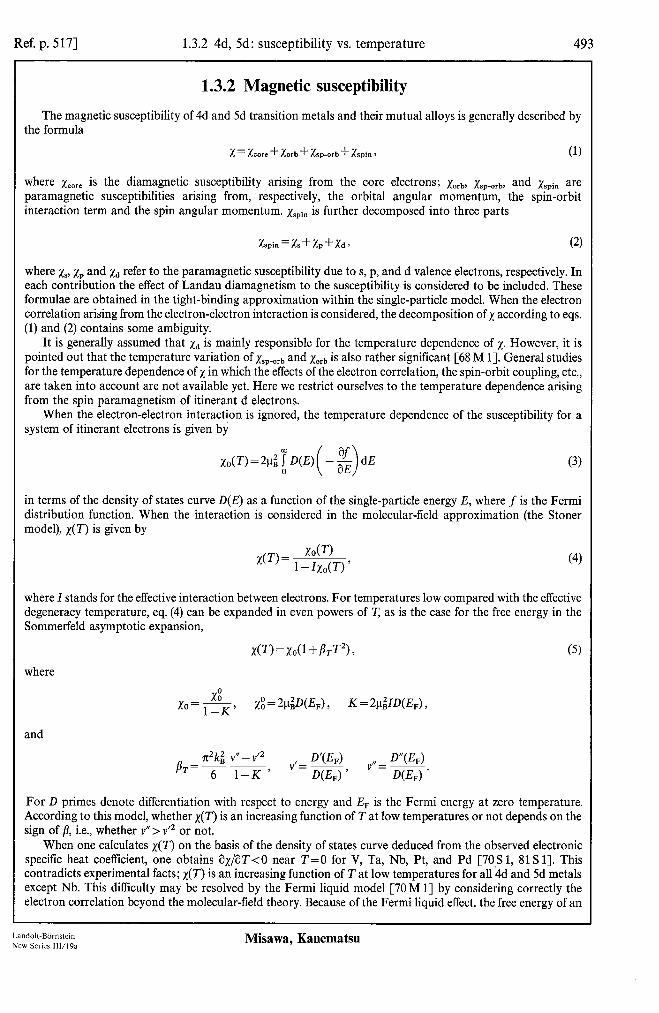
Ref. p. 5171 1.3.2 4d, 5d: susceptibility vs. temperature 493
1.3.2 Magnetic susceptibility
The magnetic susceptibility of 4d and 5d transition metals and their mutual alloys is generally described by the formula
x = kxe + Sorb + &-orb + &pin 9 (1)
where xcore is the diamagnetic susceptibility arising from the core electrons; xorb, xspmorb, and xspin are paramagnetic susceptibilities arising from, respectively, the orbital angular momentum, the spin-orbit interaction term and the spin angular momentum. xspin is further decomposed into three parts
Xspin=Xs+Xp+Xdf (2)
where xs, x,, and xd refer to the paramagnetic susceptibility due to s, p, and d valence electrons, respectively. In each contribution the effect of Landau diamagnetism to the susceptibility is considered to be included. These formulae are obtained in the tight-binding approximation within the single-particle model. When the electron correlation arising from the electron-electron interaction is considered, the decomposition of x according to eqs. (1) and (2) contains some ambiguity.
It is generally assumed that xd is mainly responsible for the temperature dependence of x. However, it is pointed out that the temperature variation of xspTorb and xorb is also rather significant [68 M 11. General studies for the temperature dependence of x in which the effects of the electron correlation, the spin-orbit coupling, etc., are taken into account are not available yet. Here we restrict ourselves to the temperature dependence arising from the spin paramagnetism of itinerant d electrons.
When the electron-electron interaction is ignored, the temperature dependence of the susceptibility for a system of itinerant electrons is given by
~,,(T)=2p; [D(E) -g dE ( >
in terms of the density of states curve D(E) as a function of the single-particle energy E, where f is the Fermi distribution function. When the interaction is considered in the molecular-field approximation (the Stoner model), X(T) is given by
x(T) = xoG’7 1 - ZxoU) ’ (4)
where I stands for the effective interaction between electrons. For temperatures low compared with the effective degeneracy temperature, eq. (4) can be expanded in even powers of T, as is the case for the free energy in the Sommerfeld asymptotic expansion,
x(T) = x0(1 +PJ2> 9 (5) where
x: xo= l-K’ x:=Q&%%), K = 2p;ZD(E,),
and
For D primes denote differentiation with respect to energy and E, is the Fermi energy at zero temperature. According to this model, whether x(T) is an increasing function of Tat low temperatures or not depends on the sign of fl, i.e., whether v/j > v” or not.
When one calculates x(T) on the basis of the density of states curve deduced from the observed electronic specific heat coefficient, one obtains &/aT<O near T=O for V, Ta, Nb, Pt, and Pd [7OS 1, 81 S 11. This contradicts experimental facts; x(T) is an increasing function of Tat low temperatures for all 4d and 5d metals except Nb. This difficulty may be resolved by the Fermi liquid model [70M l] by considering correctly the electron correlation beyond the molecular-field theory. Because of the Fermi liquid effect, the free energy of an
Land&BBmstein New Series 111/19a
Misawa, Kanematsu
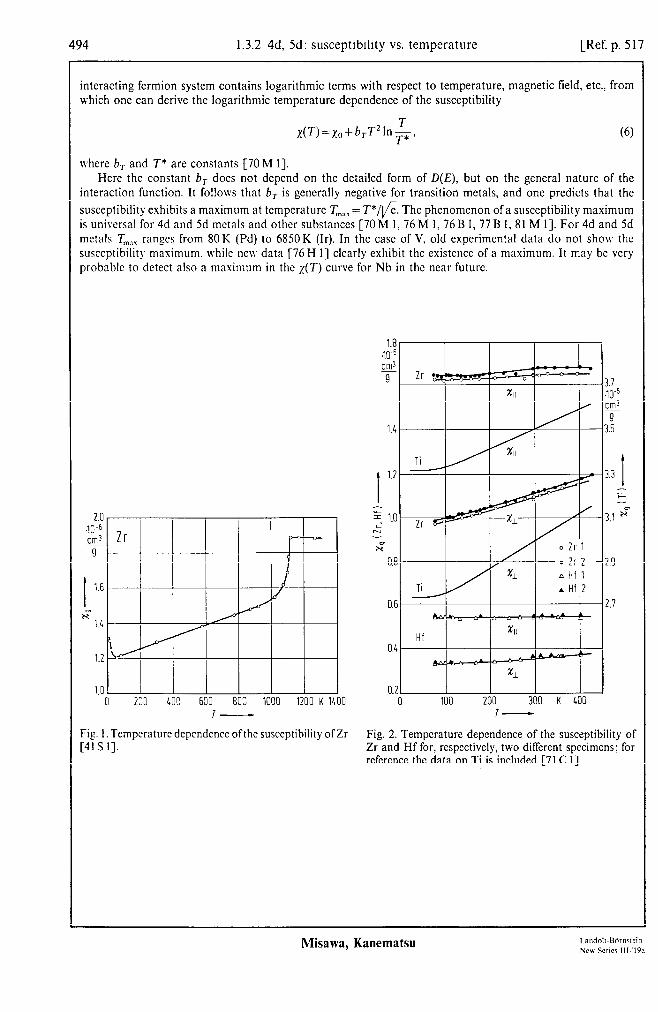
494 1.3.2 4d, 5d: susceptibility vs. temperature [Ref. p. 517
interacting fermion system contains logarithmic terms with respect to temperature, magnetic field, etc., from which one can derive the logarithmic temperature dependence of the susceptibility
where b, and T* are constants [70 M 11. Here the constant b, does not depend on the detailed form of D(E), but on the general nature of the
interaction function. It follows that b, is generally negative for transition metals, and one predicts that the susceptibility exhibits a maximum at temperature T,,, = T*fi. The phenomenon of a susceptibility maximum is universal for 4d and 5d metals and other substances [70 M I, 76 M 1, 76 B 1, 77 B 1, 81 M 11. For 4d and 5d metals T,,,, ranges from 80K (Pd) to 6850K (Ir). In the case of V, old experimental data do not show the susceptibility maximum. while new data [76 H l] clearly exhibit the existence of a maximum. It may be very probable to detect also a maximum in the x(T) curve for Nb in the near future.
1
I ?I
0 2G3 400 600 800 1000 1200 K 1100 I-
Fig. I. Temperature dependence ofthe susceptibility ofZr [41 s 1-J.
1.8 .10-f
3
Y
1.4
I
1.2
=‘ = 1.1 2
" x"
0.t
OS
0.1
0.;
3.7 .10-h cm! cil~
3.; 3.;
3.3 3.3 I I
;- ;-
3.1 3.1 s s
2.9 2.9
2.7 2.7
Hf
4-
0 100 200 300 K 4OU I-
Fig. 2. Temperature dependence of the susceptibility of Zr and Hf for, respectively, two different specimens; for rcfercncc the data on Ti is included [71 C I].
Misawa, Kanematsu
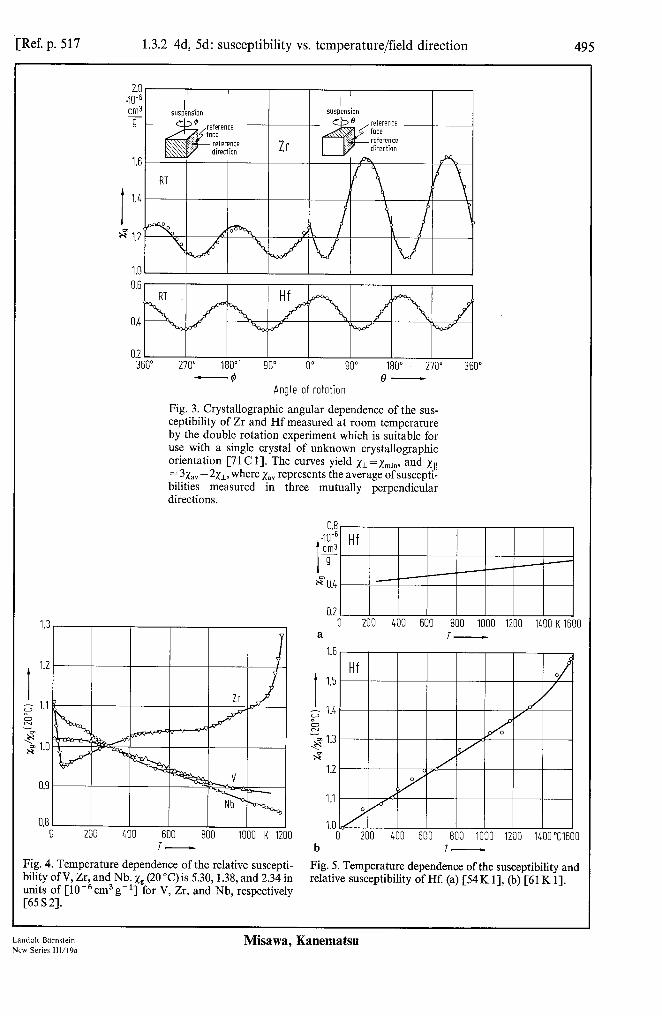
[Ref. p. 517 1.3.2 4d, 5d: susceptibility vs. temperature/field direction 495
1.6
0.2 360 270” 180” 90” 0” 90” 180” 270” 360”
-4 Q- Angle of rotation
Fig. 3. Crystallographic angular dependence of the sus- ceptibility of Zr and Hf measured at room temperature by the double rotation experiment which is suitable for use with a single crystal of unknown crystallographic orientation [71 C I]. The curves yield xI=xmin, and xl, = 3xav - 2x1, where xav represents the average of suscepti- bilities measured in three mutually perpendicular
0.8 0 200 400 600 800 1000 K 1200
7-
Fig. 4. Temperature dependence of the relative suscepti- bility of V, Zr, and Nb. xg (20 “C) is 5.30, 1.38, and 2.34 in units of [lO-‘j cm3 g-‘1 for V, Zr, and Nb, respectively [65 S 21.
0.8
I
w6 cm3 - 9
H” 0.4
0.2 0 200 400 600 800 1000 1200 1400 K 1600
a
1.6
1.0 0 200 400 600 800 1000 1200 1400”C1600
b 7-
Fig. 5. Temperature dependence of the susceptibility and relative susceptibility of Hf. (a) [54K 11, (b) [61 K 11.
Landolt-Bbrnstein New Series lll/l9a
Misawa, Kanematsu

496 1.3.2 4d, 5d: susceptibility vs. temperature [Ref. p. 517
2.29 .w Cm' 2.1
mol m6 @
2 21 9
I 2.26 2.2
E225 I 2.1 H 0
N 2.24 2.0
2.23 1.9
2.22 1.8
221 1.7 0 50 100 150 200 250 K 300 0 400 800 1200 1600 2000 K 2600
I- I-
Fig. 6. Temperature dependence of the susceptibility of Fig. 7. Temperature dependence of the susceptibility of Nb [76H I]. Nb. Solid line: [71 K 11; dots: [53 K 11.
240 .KP pJ mol
183 0 100 200 300 LOO 500 600 700 800 900 K 1000
T-
Fig. 8. Tempcraturc depcndcncc of the susceptibility of Nb. The numbers refer to listings in Table 2 [72 C I].
Table 2. Susceptibility data of Nb at room temperature for experiments listed in Fig. 8.
T .L Material Curve Ref. K 10-6cm3mol-’ in Fig. 8
2S9 211.8 Brand and Hilgcr; “spec. pure” I 33H 1 291 199.7 Siemens; pulverized Nb sheet 2 48Bl 291 204.4 pulverized sintered-block Nb 48Bl 300 203.5 Johnson Matthey and Co.; 99.9% Nb 3 53Kl 300 208.1 Fanstecl Corp.; 99.99% Nb 4 54Al 293 222.0 Johnson Matthey and Co. 5 6011 293 213.7 99.6% Nb; 700ppm of Fe 6 61Kl 293 204 Johnson Matthey and Co.; zone-refined Nb 6251 298 204.4 zone-refined Nb 6301 290 228 99.86% Nbf Ta; 1OOppm of Fe 7 65Vl 293 217.4 Johnson Matthey and Co.; 99.7% Nb 8 65S2 300 198.9 Materials Research Co.; MARZ-grade 99.98% 9 72Cl
Misawa, Kanematsu

Ref. p. 5171 1.3.2 4d, 5d: susceptibility vs. temperature 497
222.5 X-6 cm3 - mol
t 215.0 217.5
22 212.5
207.5
205.0 5 0
7-
Fig. 9. Temperature dependence of the susceptibility of Nb for various purities listed in Table 3 [72 C 11.
Table 3. List of experiments for Nb in Fig. 9 [72C 11.
Sample Experiment Temperature designation no. range [K]
LI-1 78...1056 MRC-1 I 78...412 MRC-1 2 78.‘.406 FS-1 78...412
MRC-2 78...423
‘) Materials Research Corporation.
Material
99.8% Nb, 325 mesh powder, Leico Industries, N.Y. first run on MRC ‘) VP-grade Nb second run on above specimen vacuum annealed Nb, originally beam-melted Nb
from Fansteel Corp. MRC MARZ-grade Nb
1.0
0.900 40-6 cm3 -
I 0.8996
H"
u 0.9 0.892
5 --in -5 0.888 ‘0.8 I 0.860
40-b cm3 -
x" 9
0.7 0.840 0 300 600 900 1200 1500 “C 1800 0 50 100 150 200 250 K 300
7- 7-
Fig. 10. Temperature dependence of the relative suscepti- Fig. 11. Temperature dependence of the susceptibility of bility of V, Nb, and Ta [61 K 11. Ta. (a) [78 K 11, (b) [54H 11.
Land&-BOrnstein New Series 111/19a
Misawa, Kanematsu
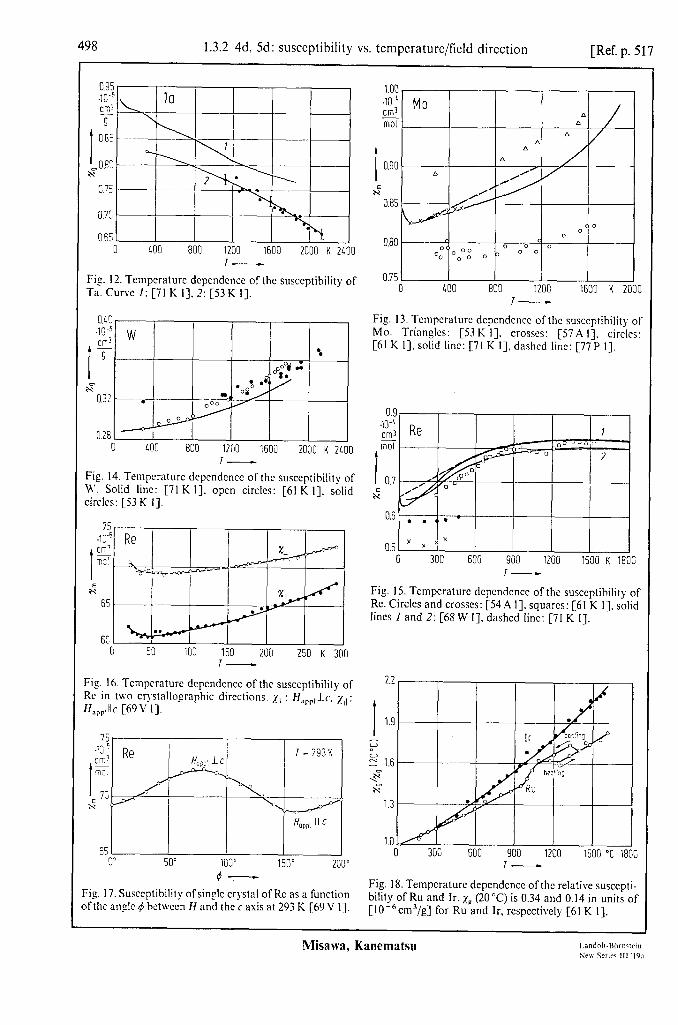
498 1.3.2 4d, 5d: susceptibility vs. tcmpcraturc/ficld direction [Ref. p. 517
0 400 800 1200 1600 2000 K 2LOO I-----
Fig. 12. Temperature depcndcnce of the susceptibility of l-a. Curve I: [71 K I]. 2: [53 K l-j.
1.00 1.00 w4 w4 cm3 cm3 - - mol mol
0.80 0.80
0.75 0.75 0 0 400 400 800 800 1200 1200 1600 1600 K K 2C 2C
l- l-
0.28 - _ 0 400 800 1200 1600 2000 K 2400
Fig. 14. Temperature dcpcndcncc of the susceptibility of N’. Solid line: [71 K I], open circles: [61 K I], solid circles: [53 K I].
0 50 100 150 200 250 K 300 7
Fig 16. Tcmpcraturc dcpcndcncc of the susceptibility of Re in two qstallographic directions. ,Y~: H,,,,lc, I,,: H,,,,llc [69V I].
15 1=293K
65 0” 50” 100” 150” 200”
Fig. 17. Susceptibility ofsir@ crystal of Rc as a function of the angle d, between H and the c axis at 293 K [69 V I],
Fig. 13. Tempcraturc dcpcndcncc of the susceptibility of MO. Triangles: [53 K I]. crosses: [57A I], circles: [6l K I], solid lint: [7l K I]. dashed line: [77P I].
0.9, I I I I I I
0.6 ’ . . . - 0.5 x y 7 *
0 300 600 900 1200 1500 K 1800 I-
Fig. 15. Tcmperaturc dcpcndcncc of the susceptibility of Rc. Circles and crosses: [54A I]. squares: [6l K I]. solid lines I and 2: [68 W I], dashed line: [7l K I].
I 1.9
u 0 E 1.6
-5 i-7
1.3
1.0 CA I I 0 300 600 900 1200 1500 “C 1800
T-
Fig. 18. Tempcraturc dependence ofthe relative suscepti- bility of Ru and Ir. ,Y~ (20 “C) is 0.34 and 0.14 in units of [IO-6cm3/g] for Ru and Ir, respectively [6l K I].
Misawa, Kanematsu

Ref. p. 5171 1.3.2 4d, 5d: susceptibility vs. temperature/field direction 499
15.0 .lOP cm3 Kl 125
I 10.0 .g 6.0
LO
0 0 50 100 150 200 250 K 300
T-
15.0 do-" cm3
I
a
10.0 x’
1.5
5.0 0” 30” 60” 90” 120” 150” 180”
HOpplllC J%,,llC Field direction
H0ppllIC
Fig. 20. Crystallographic angular dependence of the susceptibility of OS single crystal in the a plane at room temnerature I73 G 11.
Fig. 19. Temperature dependence of the susceptibility of - . . -
OS single crystal for two directions ofthe magnetic field at 0.13 10 kOe; xl1 : H,,,,l)c and x1: Ha&z [73 G 11. doe6 Jr
cm3
t- 9
a 0 o
0 o
go.,1 0 C’
o 0 0 0 o 0
0.10 Ooo
1.02
I 1.00
g 0.98
-cm -5 0.96 ST
0.9L
1 0 50 100 150 200 250 K : 300
T-
Fig. 23. Temperature dependence ofthe susceptibility ofIr [60 B 1-J.
0.92 0 50 100 150 200 250 300 K 350
.,& I- cm3
9 x”
5 0 50 100 150 200 250 K 300
TV ‘.
Fig. 21. Temperature dependence of the relative suscepti- bility of Rh. Solid circles: [81 A 11, open circles: [60 B 11.
1.6
0.8
T-
Fig. 22. Temperature dependence of the relative suscepti- bility of Rh. Circles: [61 K 11, xs(20”C)=1.03 . 10m6cm3/g; dashed line: [52H 11, ~$2O”C)=O.990 10m6cm3/g.
a T-
jO0 b T-
Fig. 24. Temperature dependence of (a) the susceptibility [68 F l] and (b) the relative susceptibility of Pd. (b) Open circles: [52H 11, solid circles: [21 F 11, triangles: [31 G 11.
Landolt-Bornstein New Series 111/19a
Misawa, Kanematsu
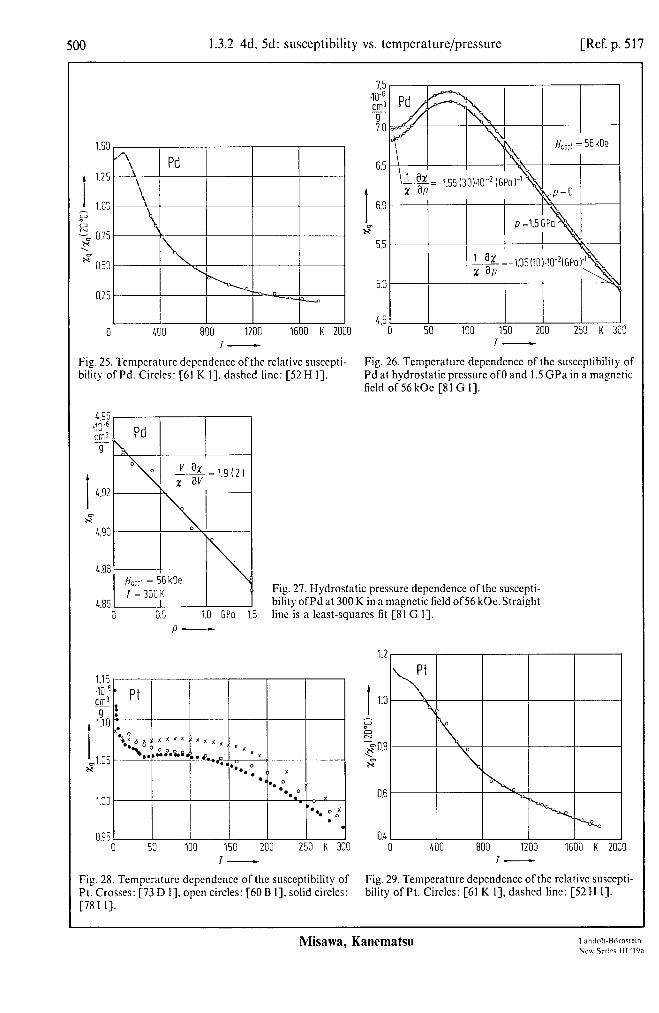
500 1.32 4d, 5d: susceptibility vs. temperature/pressure [Ref. p. 517
1.53
I 1.25
1.0X G b
Fo7j t-7
0.53
0.25
II 800 1200 1600 K 2000
Fi_p. 25. Temperature dcpcndcncc of the relative susccpti- bility of Pd. Circles: [61 K I]. dashed line: [52 H I].
6.5
I 6.0
SF 5.5
4.5 0 50 100 150 200 250 K 300
I-
Fig. 26. Temperature dependence of the susceptibility of Pd at hydrostatic pressure of0 and 1.5 GPa in a magnetic field of 56 kOe [8 1 G I].
0 !Ei!!TEl Ho:, = 56kOe
I =300K Fig. 27. Hydrostatic pressure dependence of the susccpti- bility ofPd at 300 K in a magnetic field of56 kOe. Straight
0 0.5 1.0 GPO 1.5 line is a least-squares tit [8l G I]. P-
1.15 .lO-” cm3
I 190
“1.05 n
1.03
0.95 0 50 100 150 200 250 K 300
I-
I 1.0
G k $$0.8
T-7
0.6
0.L 0 400 800 1200 1600 K 20
I-
Fig. 28. Temperature dependence of the susceptibility of Fig. 29. Temperature dependence of the relative suscepti- Pt. Crosses: [73 D I]. open circles: [60 B I], solid circles: bility of Pt. Circles: [6l K I], dashed line: [52H I]. [7SI I].
Misawa, Kanematsu
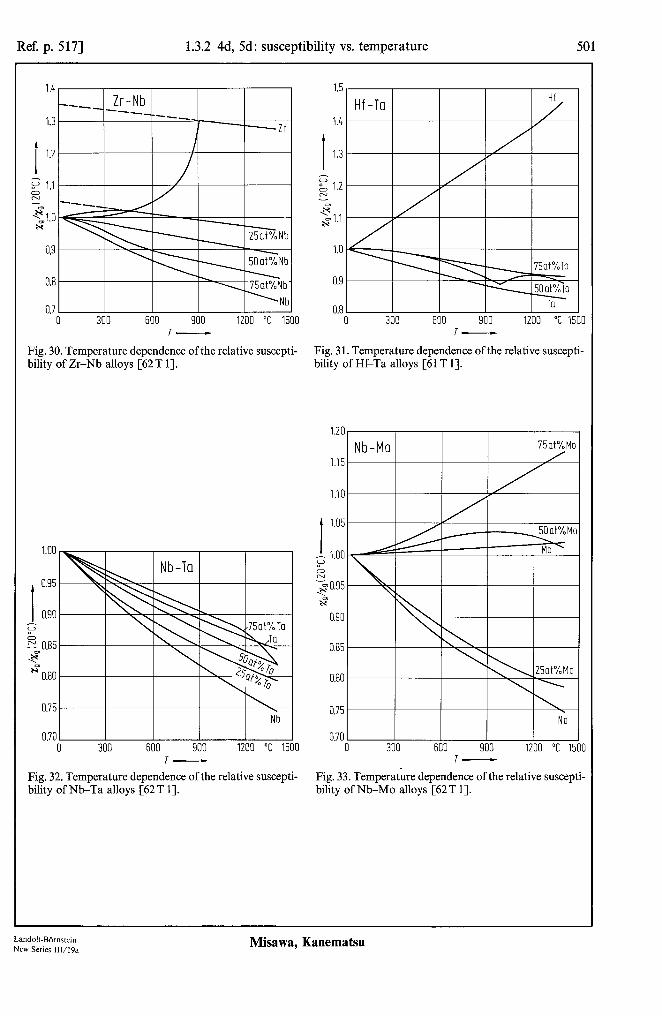
Ref. p. 5171 1.3.2 4d, 5d: susceptibility vs. temperature 501
0 300 600 900 1200 "C IE 7-
Fig. 30. Temperature dependence of the relative suscepti- Fig. 3 1. Temperature dependence of the relative suscepti- bility of Zr-Nb alloys [62 T 11. bility of Hf-Ta alloys [61 T 11.
1.00
I 0.95
0.90 u L E-0.85 -e
H 0.80
0.75
0.70 I I I I 0 300 600 900 1200 "C 151
T-
Fig. 32. Temperature dependence of the relative suscepti- Fig. 33. Temperature dependence of the relative suscepti- bility of NbTa alloys [62 T 11. bility of NbMo alloys [62 T 11.
,.- Hf -Ta Hf
1.4 /
I /I
g 1.2 N
$1.1
1.0
0.9
0.81 1 To
0 300 600 900 1200 "C IE 7-
1.20
Nb-Mo 75at%Mo
1.15 / /'
0 300 600 900 1200 "C 1500 7-
Landolt-BOrnstein New Series 111/19a
Misawa, Kanematsu

502 1.3.2 4ci, 5d susceptibility, vs. temperature [Ref. p. 517
1.0 .?j :
0.a
2: 0.7
06
C.5 .” 135
Nbc.db.la &km :.i
-II;-- & mol 0.9
I 0.i: s
0.7
0.E 0.9
.,@i gTj
I
m2' 0.8
k4 0.7
0.6
120
105 1 Q.
90
75
200 LOO 600 800 "C l[: I-
IO3 uQcm
100
I a0
97
96 3
Fig. 34.Tcmpcraturc dcpcndcncc ofthc susceptibility and the electrical rcsistivity ofNh Ru alloys. (a) Nb, soRu,,,,. 0~) h'h.szR~~,,,. (~1 Nb,.s,R~~,.,, [76D 11.
Pdl-xRhx
% 250 K : 100
0 300 600 900 1200 "C 1500 T-
Fig. 35. Tempcraturc dcpcndencc ofthe relative suscepti- bility of Ta-W and Ta-Re alloys [62 T I].
15.0 w cm3 -
192.5
10.0
I I.5 x"
5.0
2.5
0
I
Pd,-xRh,
50 50 100 100 150 150 200 200 250 K 3 250 K 3
Fig. 37. Temperature depcndcncc of the susceptibility of Pd, -,Rh, alloys [60 B I].
Fig. 36. Temperature dependence of the susceptibility of Pd, -,Rh, alloys [69 D I].
Misawa, Kanematsu
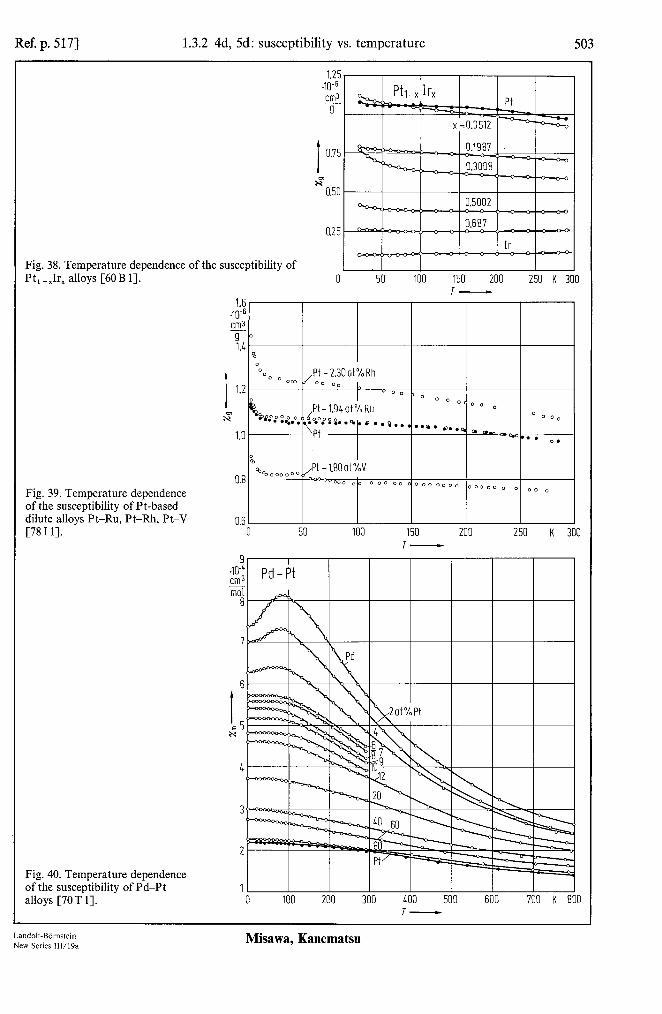
Ref. p. 5171 1.3.2 4d, 5d: susceptibility vs. temperature
Fig. 38. Temuerature deuendence of the susceptibility of Pt;-Jr, allois [60 B 11.’ 0 50 100 150 200 250 K 300
7- 1.6 I I I I I
Fig. 39. Temperature dependence of the susceptibility of Pt-based dilute alloys Pt-Ru, Pt-Rh, P&V [78 111.
Fig. 40. Temperature dependence of the susceptibility of Pd-Pt
I alloys [70 T 11.
a25
Ed x
1,
3
2
I I I I
0 100 200 300 400 500 600 700 K 800 7-
Landolt-Bbmstein New Series 111/19a
Misawa, Kanematsu

504 1.3.3 4d, 5d: susceptibility vs. composition [Ref. p. 517
1.3.3 Magnetic susceptibility as a function of composition
Table 4. Magnetic susceptibility for metals and alloys at 20°C. The values in parentheses are obtained by extrapolation from the high-temperature bee phase region [63 T 11.
%p (20 “Cl xg (20 “Cl 10e6 cm’ g+ 10m6cm3 g-’
Zr 121(163) Zr-25 at% Nb 163(169) Zr-50 at% Nb 176 Zr-75 at% Nb 192 Nb 214 Nb25at% MO 210 Nb-50 at% MO 154 Nb-75 at% MO 50 MO 83 Hf 68 Hf-50 at% Ta 130 Hf-75 at% Ta 204
65 JO-’ cm3 W-OS Rl
I
mo:
0 1 2 3 L at% 5 I'# OS -
Fig. 41. Concentration depcndcncc ofthc susceptibility of \h’-OS solid solutions at room tempcraturc [75A I].
1, -10 L cm3 ii5
3
I z 2
PI Rh - Rh
Fig. 43. Composition dependence of the susceptibility extrapolated to 0 K of Pt-Rh alloys [74 W I].
Ta 154 Ta-25at% W 131 Ta-50at% W 115 Ta-75 at% W 57 W 53 Nb-25 at % Ta 196 Nb-50at% Ta 179 Nb-75 at% Ta 162 Ta-12.5 at% Re 133 Ta-25 at % Re 100 Ta-37.5 at% Re 58
160 10-6 cm3 - mol 120
I E 80
H
n 1=300K P Tc-Ru o Tc-Rh o Ru-Rh
I 7.8 8.2 8.6
Fig. 42. Susceptibility of Tc-Ru, Tc-Rh, and Ru-Rh alloys at 300 K as a function of the number of valence electrons per atom, n [70 I I].
-0 2 L 6 8 10 at% 12 Pd w-
Fig. 44. Concentration dependence ofthe susceptibility of Pd-W alloys at 293 K. Curve I: after cold deformation by 90%, 2: after 1 h at 900°C [79 K I].
Misawa, Kanematsu
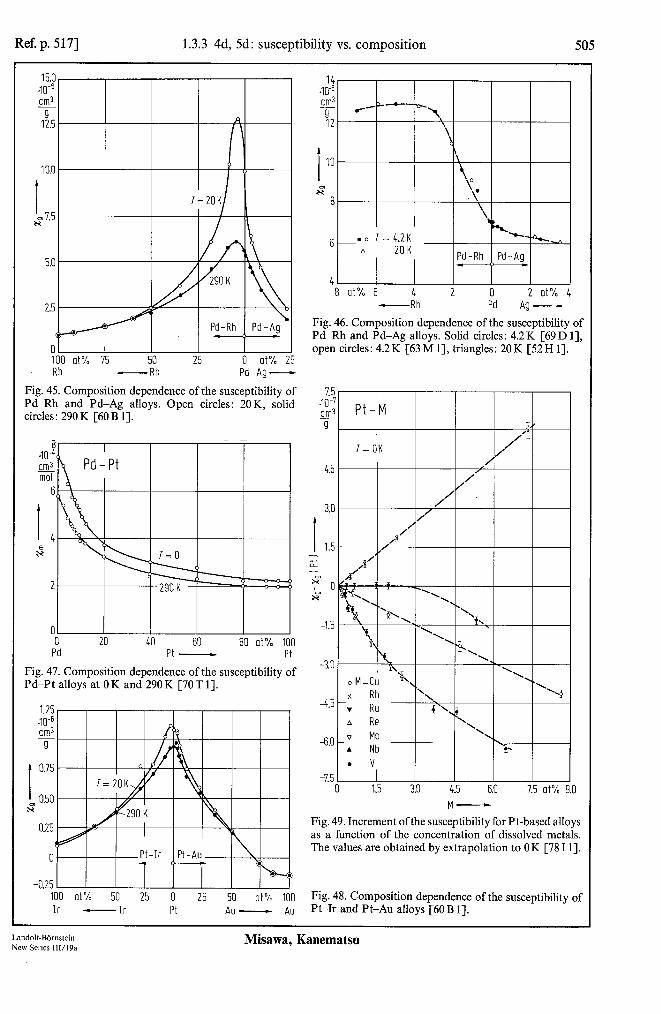
Ref. p. 5171 1.3.3 4d, 5d: susceptibility vs. composition
2.5
01 100 at% 75 50 25 0 at% 25 Rh -Rh Pd Ag-
Fig. 45. Composition dependence of the susceptibility of Pd-Kh and Pd-Ag alloys. Open circles: 20K, solid circles: 290 K [60 B 11.
8 -1o’4 & mol
6
I 4 g
01 I I I I 0 20 40 60 80 at% 100 Pd Pt - Pt
Fig. 47. Composition dependence of the susceptibility of Pd-Pt alloys at OK and 290 K [70T 11.
1.25, I I I
_... I I I -
// 1 1 7=20K&
n
s
0.25
r 0.50 I-
0 Pt-Ir Pi
-0.25 I 100 at% 50 25 0 25 50 at % 100 Ir -Ir Pt Au - Au
6
8 at% 6 4 2 0 2 at% 4 -Rh Pd Ag -
Fig. 46. Composition dependence of the susceptibility of Pd-Rh and Pd-Ag alloys. Solid circles: 4.2K [69D 11, open circles: 4.2 K [63 M 11, triangles: 20 K [52 H 11.
7.? .lOv gg 9
-3.0
-4.5
-6.0
-7.5
I\ Y ’ “4, oM=Cu
‘\
x Rh ‘\, ‘Y . Ru 4 ‘,I A Re ‘\
‘1 v MO . Nb “I- . v I I I I
1.5 3.0 k.5 6.0 7.5 at% !
Fig. 49. Increment ofthe susceptibility for Pt-based alloys as a function of the concentration of dissolved metals. The values are obtained by extrapolation to 0 K [78 I 11.
Fig. 48. Composition dependence of the susceptibility of Pt-Ir and Pt-Au alloys [60 B 11.
Landolt-Bbmstein New Series IIVl9a
Misawa, Kanematsu
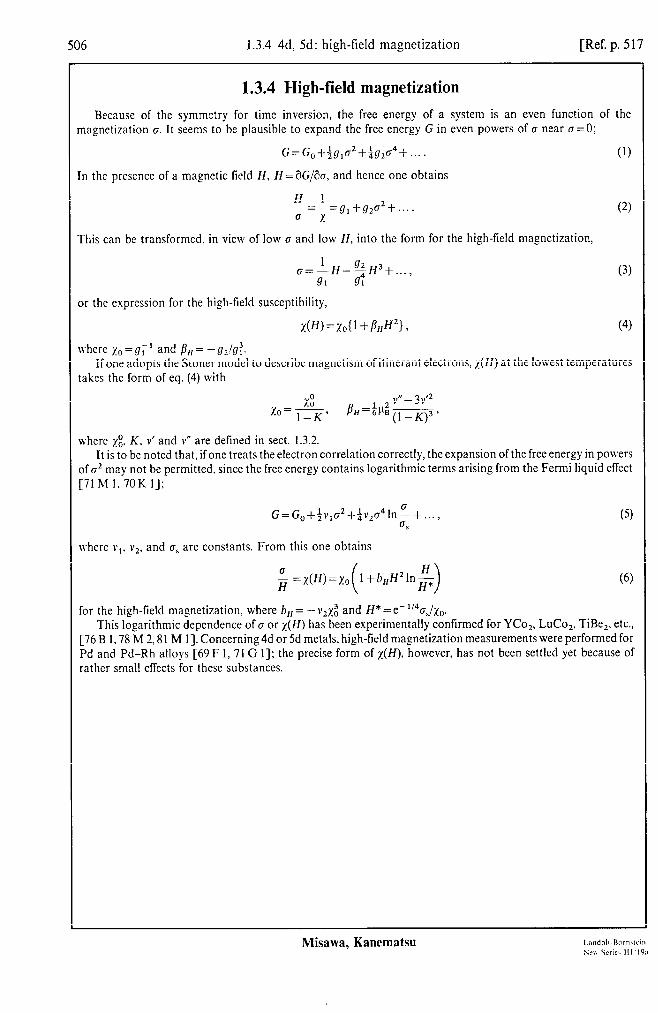
506 1.3.4 4d, 5d: high-field magnetization [Ref. p. 517
1.3.4 High-field magnetization
Because of the symmetry for time inversion, the free energy of a system is an even function of the nagnetization 0. It seems to be plausible to expand the free energy G in even powers of 0 near g=O;
G=Go+~g,a2+$g2a4+... . (1)
[n the presence of a magnetic field H, H=aG/&, and hence one obtains
H 1 -=- 0 x
=g, +g,u2+ . . . .
rhis can be transformed. in view of low cr and low H, into the form for the high-field magnetization,
cr=LH-cH3+..., 91 s:
3r the expression for the high-field susceptibility,
T.(W=XO{~ +Bdf21 > (4)
where x0 = g; ’ and PI,= -g2/g:. If one adopts the Stoner model to describe magnetism of itinerant electrons, x(H) at the lowest temperatures
takes the form of eq. (4) with
xz x0= I-K'
, 2 ,,s _ 3,o Pff=ab (l -K)3 )
where &‘. K. V’ and 1~” are defined in sect. 1.3.2. It is to be noted that, if one treats the electron correlation correctly, the expansion of the free energy in powers
of CT~ may not be permitted. since the free energy contains logarithmic terms arising from the Fermi liquid effect [71 M I, 70 K 11;
G=Go+~,l,~2+~~~~41n~+..., (5) s
where I’,. \v2, and os are constants. From this one obtains
i =x(H)=xo l+b,,H’lng >
(6)
for the high-field magnetization, where b,, = - v,xi and H* = e- 1/4a,/~o. This logarithmic dependence of 0 or x(H) has been experimentally confirmed for YCo,, LuCo,, TiBe,, etc.,
[76 B I,78 M 2,81 M 11. Concerning 4d or 5d metals, high-field magnetization measurements were performed for Pd and Pd-Rh alloys [69 F 1, 71 G I]; the precise form of x(H), however, has not been settled yet because of rather small effects for these substances.
Misawa, Kanematsu

[Ref. p. 517 1.3.4 4d, 5d: high-field magnetization 507
1 0.09
b
0.06
0 30 60 90 kOe 120 0 60 K 120 H OPP’ - T-
Fig. 50. Magnetization of Tc, (a) as a function of applied field at 4.5 K, (b) as a function of temperature at 48 and 1OOkOe [8ORl].
0.07
Ps
0.06
3 Gcm3
9
0 50 100 150 200 250 300 350kOe, 400 0
’ I
H OPPl -
Re r=1.52K
I I I I
42 44 46 48 kOe ! H OPPl -
Fig. 51. Magnetic field dependence of the differential susceptibility of Re at 1.52K; the field is applied to the [lOiO] direction [78 M 11.
30 60 90 120 150 180 kOe i H - OPPl
Fig. 52. Magnetic field dependence of the magnetization per atom of Pd and Pd-2at% Rh at 4K; dashed line
Fig. 53. Magnetic field dependence of the magnetization ofP4,.&hm at 4.2 K [69 F 11.
denotes a straight line with the tangent of the curve at H app,=O [71 G 11.
Land&Bbrnstein New Series 111/19a
Misawa, Kanematsu
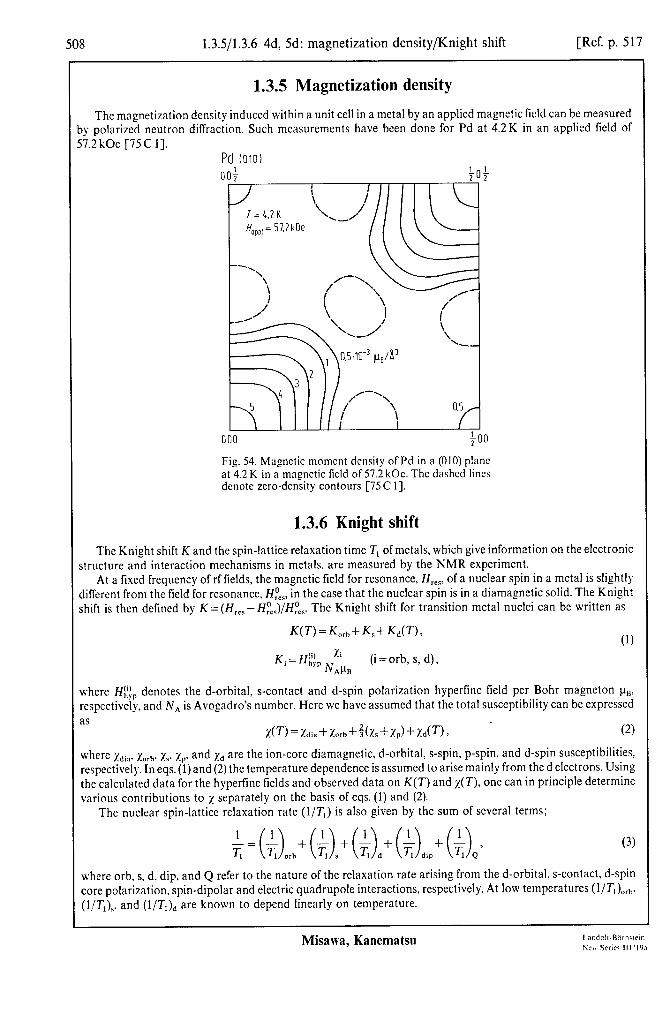
508 1.3.5/1.3.6 4d, 5d: magnetization density/Knight shift [Ref. p. 517
1.3.5 Magnetization density
The magnetization density induced within a unit cell in a metal by an applied magnetic field can be measured 3)’ polarized neutron diffraction. Such measurements have been done for Pd at 4.2K in an applied field of 57.2 kOe [75 C 11.
Pd 00;
Fig. 54. Magnetic moment density of Pd in a (010) plant at 4.2 K in a maenctic field of 57.2 kOc. The dashed lines denote zero-den&y contours [75 C I].
1.3.6 Knight shift
The Knight shift K and the spin-lattice relaxation time T, of metals, which give information on the electronic structure and interaction mechanisms in metals, are measured by the NMR experiment.
At a fixed frequency of rf fields, the magnetic field for resonance, H,,,, of a nuclear spin in a metal is slightly different from the field for resonance. HR<, in the case that the nuclear spin is in a diamagnetic solid. The Knight shift is then defined by K = (H,,,-H~JH~~,. The Knight shift for transition metal nuclei can be written as
KU-)=Kx,+K,+fW’-), (1)
K, = fp, xi ’ h’p NAP,,
(i = orb, s, d) ,
where I-I&, denotes the d-orbital, s-contact and d-spin polarization hypertine field per Bohr magneton pa. respectively, and N, is Avogadro’s number. Here we have assumed that the total susceptibility can be expressed as
%(T)=)[dia+X”rh+S(%s+Xp)+rYd(T)r . (2)
where xdiu. I,,~,,. 1,. xp. and xd are the ion-core diamagnetic, d-orbital, s-spin, p-spin, and d-spin susceptibilities, respectively. In eqs. (1) and (2) the temperature dependence is assumed to arise mainly from the d electrons. Using the calculated data for the hyperfine fields and observed data on K(T) and x(T), one can in principle determine various contributions to x separately on the basis of eqs. (1) and (2).
The nuclear spin-lattice relaxation rate (l/T,) is also given by the sum of several terms;
(3)
where orb, s, d. dip, and Q refer to the nature of the relaxation rate arising from the d-orbital, s-contact, d-spin core polarization, spin-dipolar and electric quadrupole interactions, respectively. At low temperatures (l/T,),,,. (l/T,),. and (l/T,), are known to depend linearly on temperature.
Misawa, Kanematsu

Ref. p. 5171 1.3.6 4d, 5d: Knight shift, relaxation time 509
0 50 100 150 200 250 K 300 T-
Fig. 55. Temperature dependence of the change of re- sonance frequency, v,,, - v,,, in Nb single crystal, where va = 305 kHz is the resonance frequency at 293 K. Magnetic field (34.6 kOe) is applied to [loo] direction; the different symbols refer to three different sequences of measure- ments [76 H I].
0 300 600 900 1200 1500 K 1800 T-
Fig. 57. Temperature dependence of (TIT)-’ of Nb. Triangles: 20 MHz, circles: 12 MHz [79 S 11, solid line: NBS data. TI : longitudinal relaxation time.
0.89 0.89 % %
0.86 0.86
I I 0.83 0.83 ~ ~
0.80 0.80
0.77 0.77 0 0 300 300 600 600 900 900 1200 1200 1500 1500 K K 1800 1800
Fig. 56. Temperature dependence of the Knight shift of Nb. Open circles: [79 S 11, solid circles: NBS data.
0.700 0.700 % %
0.675 0.675
t t 0.650 0.650 ~ ~
0.625 0.625
0.600 0.600 200 200
a a 400 400 600 600 800 800 1000 1000 K K Ii Ii
I- I- 00
-0.25
-1.25 0 0 50 50 100 100 150 150 200 200 250 250 K K 300 300
b b T- T-
Fig. 58. Temperature dependence of the Knight shift of Fig. 58. Temperature dependence of the Knight shift of MO, (a) at a field of 78.141 kOe [77P 11, (b) at a field of MO, (a) at a field of 78.141 kOe [77P 11, (b) at a field of 70.335 kOe, relative to the Knight shift at room temper- 70.335 kOe, relative to the Knight shift at room temper- ature [77 K 11. ature [77 K 11.
Land&-Bbmstein New Series IIl/l9a
Misawa, Kanematsu
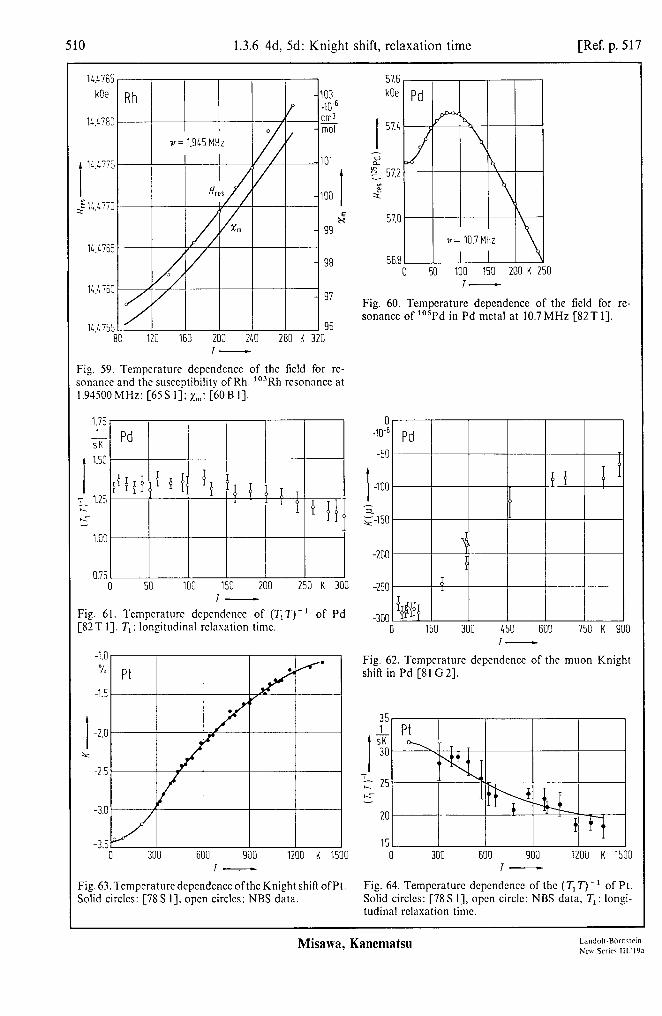
1.3.6 4d, 5d: Knight shift, relaxation time [Ref. p. 517
cm3 - mol
$:.177i; 100 t
x" 99
14.4765
98
li.1755 96 80 120 160 200 240 280 K 320
I-
Fig. 59. Tempcraturc depcndcncc of the licld for rc- sonancc and the susccutibilitv of Rh. to3Rh rcsonancc at I .91500 hlHz: [65 S I j; x,,,: [bO B I]
0.75 0 0 50 50 100 100 150 150 200 200 250 K 3 250 K 3
1.75
&- Pd
I 1.53
Fig. 61. [82 T 1-J.
%
-1.5
I -2.c
k
-2.5
-3s
Temperature dcpcndcncc of (T,T)- * of Pd Tr : longitudinal rclasation time.
526 kOe
57.0
56.8 0 50 100 150 200 K 250
I-
Fig. 60. Temperature dependence of the field for re- sonance of tosPd in Pd metal at 10.7 MHz [82T I].
0 au6
-50
I -100
2 ,450
-200
-250
-300 0 150 300 450 600 750 K 900
Fig. 62. Tempcraturc depcndencc of the muon Knight shift in Pd [8l G 21.
25
0 300 600 900 1200 K 1500 0 300 600 900 1200 K 1500 T- I-
Fig. 63. Temperature dependence ofthc Knight shift ofPt. Fig. 64. Tempcraturc dcpcndence of the (T,T)-’ of Pt. Solid circles: [78 S I], open circles: NBS data. Solid circles: [78 S I], open circle: NBS data. 7, : longi-
tudinal relaxation time.
Misawa, Kanematsu

[Ref. p. 517 1.3.6 4d, 5d: Knight shift, relaxation time 511
% m 0 I- -
n Nb3Pt;A15) Nb-PI
.., _, I .I
-3 P',D
-4 0 50 100 150 200 250 K 300
0 0 Pt
40 60 80 at% 100 Rh- Rh
Fig. 66. Composition dependence of (TIT) -I of lo3Rh in Pt-Rh alloys [74W 11. T= 1...4K; T,: longitudinal re- laxation time.
Fig. 65. Temperature dependence of the Knight shift of lg5Pt in Nb,Pt (A15), Nbo,GzPt,,3,(a) and pure Pt [77K2].
Table 5. NMR and susceptibility data for Pt, -XRh,, Zr, and MO. x,,,: extrapolated to OK; K, (TIT)-‘: T= l...4K.
Xm K (TIT)-l 10m4cm3 mol-’ % s -1K-’
Ref.
K (RN K Pt) PIT)-’ (RN
Pt Pto.,,Rhom Pto.goRho.lo Pto.soRho.,o Pt o.6oRho.40 Pto.,oRho.,o Pto.zoRho.so Pt o.loRho.9, %o,Rho.,, Rh
2.05(2) 2.56(2) 3.46(3) 3.24(3) 2.52(2) 1.58(l) 1.14(l) 0.98(l) 0.96(l) 1.00(l)
- 3.4(2) - 3.0(2) - 1.8(2) -0.44(10) +0.22(10) +0.27(3) +0.71(3) +0.51(3) + 0.43 ‘)
-3.54 -3.6(2) i.l(l) -4.5(2) 0.84(7) -5.1(2) 0.67(4) 74Wl
-3.1(2) 0.39(3) -2.1(2) 0.26(3) - 1.3(2) 0.19(2) -0.64(10) - -1.18(10) -
- 0.11’)
Zr 1.20 K (Zr) 0.33 0.033 75Hl
MO 1.033 K (MO) 0.60 - 77Pl
‘) C71Nl-J. “) [66Nl].
Land&-Bdrnstein New Series 111/19a
Misawa, Kanematsu
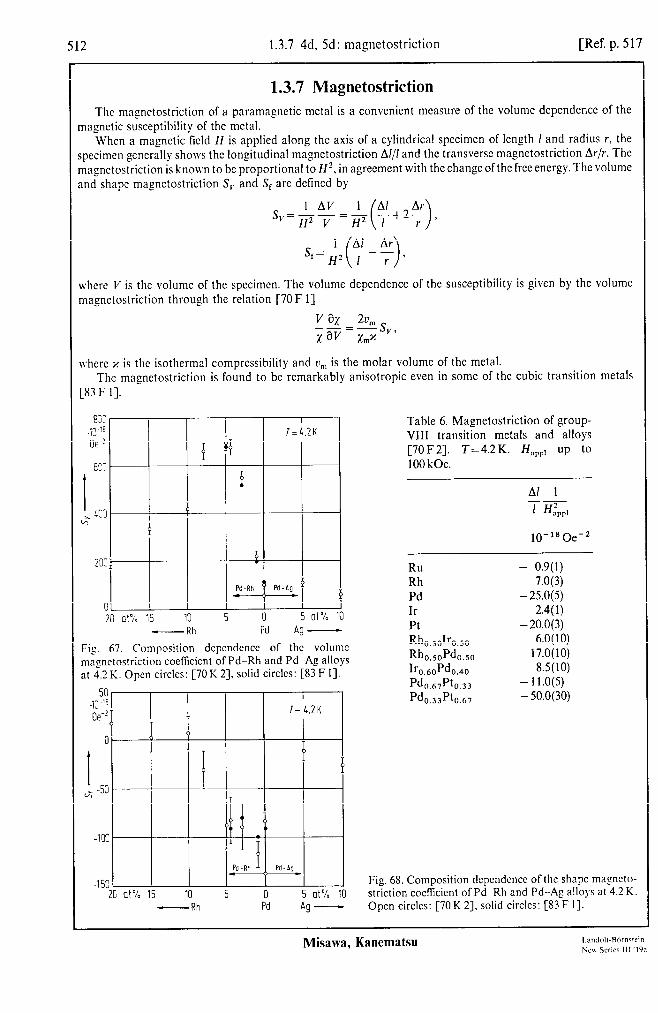
512 1.3.7 4d, Scl: magnetostriction [Ref. p. 517
1.3.7 Magnetostriction The magnetostriction of a paramagnetic metal is a convenient measure of the volume dependence of the
nasnetic susceptibility of the metal. When a magnetic field H is applied along the axis of a cylindrical specimen of length I and radius r, the
pecimen generally shows the longitudinal magnctostriction A/// and the transverse magnetostriction Ar/r. The nagnetostriction is known to be proportional to HZ, in agreement with the change ofthc free energy. The volume md shape magnetostriction S,. and S, are defined by
vherc 1’ is the volume of the specimen. The volume dependence of the susceptibility is given by the volume nasnetostriction through the relation [70 F l]
v ax 2v, s Xav=X,x "3
ahere x is the isothermal compressibility and D, is the molar volume of the metal. The magnetostriction is found to be remarkably anisotropic even in some of the cubic transition metals
183 F 11.
8s; I .,3 ‘5 1=4.2K Oe-?
~ 403 >
P
-2o] 1 i 12.R.:/h.Agj
20 ot4b 15 10 5 0 5 at % 10 -Rh Pd Ag -
Fi_r. 67. Composition dcpcndcncc of the volume magnetostriction coeflicicnt of Pd-Rh and Pd-Ag alloys at 4.2 K. Open circles: [70 K 21. solid circles: [83 F I].
50 .,o -!O I
oe-2 l= 4.2K
1 0 0
I 4 P
c;; -53
0 " ' , 0 o -100
l-p, Pd.0 Pd-Ag
-1% 20 at% 15 10 5 0 5 at% 10
-Rh Pd Ag-
Table 6. Magnetostriction of group- VIII transition metals and alloys [70F2]. T=4.2K. H,,,, up to 100 kOe.
Al 1
=gl
lo-l8 Oe-’
RU Rh Pd Ir Pt Rho.soIro.so Rh o.soPdoso If o.d’do.~o W,.d’hm W,.d%cv
- 0.9(l) 7.0(3)
- 25.0(5) 2.4( 1)
- 20.0(3) 6.0(10)
17.0(10) 8.5(10)
- 11.0(5) - 50.0(30)
Fig. 68. Composition dcpcndcncc of the shape magncto- striction cocficicnt of Pd -Rh and Pd- Ag alloys at 4.2 K. Open circles: [70 K 21. solid circles: [83 F I].
Misawa, Kanematsu
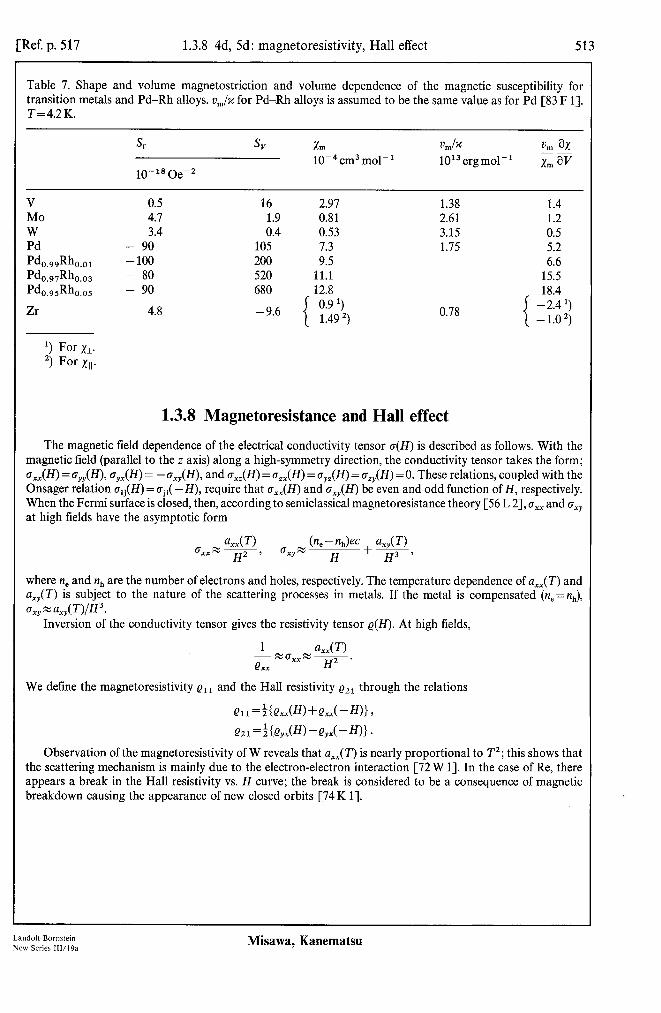
[Ref. p. 517 1.3.8 4d, 5d: magnetoresistivity, Hall effect 513
Table 7. Shape and volume magnetostriction and volume dependence of the magnetic susceptibility for transition metals and Pd-Rh alloys. u& for Pd-Rh alloys is assumed to be the same value as for Pd [83 F 11. T=4.2K.
Sf
10-l* OeC2
Xm 10m4cm3 mol-’
VI& lOi ergmol-’
0, ait -- xrn av
V MO W Pd PhwRho.o, WmRho.o, Pdo.,,Rhm, Zr
‘) For x1. “1 For XII.
0.5 16 2.97 1.38 1.4 4.7 1.9 0.81 2.61 1.2 3.4 0.4 0.53 3.15 0.5
- 90 105 7.3 1.75 5.2 - 100 200 9.5 6.6 - 80 520 11.1 15.5 - 90 680 12.8 18.4
4.8 -9.6 1
0.9 ‘) -2.4 ') 1.49 2) 0.78
1 - 1.0 2)
1.3.8 Magnetoresistance and Hall effect
The magnetic field dependence of the electrical conductivity tensor o(H) is described as follows. With the magnetic field (parallel to the z axis) along a high-symmetry direction, the conductivity tensor takes the form; c,.,(H) = a,,(H), o,,(H) = -o,,(H), and o,,(H) = a,,(H) = a,,(H) = a,,(H) = 0. These relations, coupled with the Onsager relation eij(H) = crji( -H), require that a,,(H) and a,,(H) be even and odd function of H, respectively. When the Fermi surface is closed, then, according to semiclassical magnetoresistance theory [56 L 21, (T,, and (T,+, at high fields have the asymptotic form
ax,(T) ~xx yjp
~xy N h - n&c + a,,(T) - H H3 '
where n, and n,, are the number of electrons and holes, respectively. The temperature dependence of a,,(T) and u,,,(T) is subject to the nature of the scattering processes in metals. If the metal is compensated (n,=n,), gxy = ~x,UYH3.
Inversion of the conductivity tensor gives the resistivity tensor Q(H). At high fields,
1 uxx( T> - xo’,,w ~ e xx H2 '
We define the magnetoresistivity e1 I and the Hall resistivity ezl through the relations
e~~=&~,(H>+exx(-H)l,
e21 =ik?,,W)-e,x(-WI.
Observation of the magnetoresistivity of W reveals that u,,(T) is nearly proportional to T2; this shows that the scattering mechanism is mainly due to the electron-electron interaction [72 W 1-J. In the case of Re, there appears a break in the Hall resistivity vs. H curve; the break is considered to be a consequence of magnetic breakdown causing the appearance of new closed orbits [74 K 11.
Landolt-Bornstein New Series lll/l9a
Misawa, Kanematsu

514 1.3.8 4d, 5d: magnetoresistivity, Hall effect [Ref. p. 517
10 -,
6-9 E Ilk 2 c 6 E 105 2 kOe 4.10s fHcp:l -
Fig. 69. Magnetic field dcpcndence of the Hall rcsistivity of hJo for two samples; both axes are multiplied by the residual rcsistancc ratio r = R2031R,,, to produce a Koh- ler plot (r = 5050 in thcsc samples) [76 F I].
Fig. 70. Change in the magnctorcsistivity, A?,, =Q, ,(HApp,)--~, r(0). for two samples ofMo as a function of applied field; both axes arc multiplied by the residual reststance ratto r= Rz9, lR,, to product a Kohler plot (r = 5050). Circles: [76 F I]. solid lint: [62 F I].
22.5 do8 Re
Rem _
17.5
I i 3
I 12.5
2 108
/q .
7.5
2.5
0 IO 20 30 40 50 60 70 kOe 80 a H up:1 -
IO2 e
6
I
2
I 10 8
z=6
s L ‘
2
2
IO- 6
4 40'2
L-km - Oe
3
I c;
2
0 0
0 il
2 L 6 E 105 2 kOe 4.
f-Hopp~ -
For Fig. 71, see p. 515.
0” 30" 60" b @-
Fig. 72. (a) Magnetic field dependence ofthc Hall resistiv- ity of Re. Curve I: Hvpp, along [lOiO] direction; 2: H,,,, along [I 1201 direction; 3: angle between H,,,, and the c axis is 45”; 4: Hllc [74K I]. (b) Hall constants of Re as a function of the angle 4 between H,,,, and the c axis: Curves I and 2 refer to field strengths below and above the break point (about 20 kOe) in (a). respectively [74K I].
Misawa, Kanematsu

Ref. p. 5171 1.3.9 4d, 5d: electronic specific heat 515
Fig. 71. H&, ,/err of W as a function of T2 for various values of the magnetic field [72 W 11.
25 .I06
(is
I
23
22 Z
F21 ,B s"
20
19
18
1 1
6 18.6 17 I I
0 5 IO 15 20 25 30 35 K* T2-
1.3.9 Magnetic field dependence of the electronic specific heat coefficient
The magnetic field dependence of the electronic specific heat coefficient, y(H), is related, according to thermodynamics, to the temperature dependence of the magnetic susceptibility x(T). Since XH = - aF/aH and y= -aZF/3T2, where F(T, H) is the free energy of the system, one can obtain a thermodynamic relation:
where y is defined as the specific heat divided by temperature. If it is assumed that x(T) behaves like x(O) + j3T2 at low temperatures, where /I is a constant, then, for H-0,
one should expect y(H) = y(O) + fiH2 f rom eq. (1). As far as x(T) depends quadratically on T, the same holds for the dependence of y(H) on H; one has
at T2 = H2 =O. By analysing the observed data on y(H) at low H and x(T) at low T one may examine the applicability of relation (2). Such a comparison has been made so far for LuCo,, Pd, and TiBe,; the results show that eq. (2) does not hold [82 B 1,83 M 11. This implies that the assumption that X(T) behaves like x(0)+flT2, or, equivalently, y(H) behaves like y(O) + j?H2, is not valid. This difficulty may be avoided in the Fermi liquid model by considering that the temperature dependence of x follows a T2 In T law because of the Fermi liquid effect [83 M 11.
For 4d and 5d transition metals y(H) has been measured only for Pd; in accordance with the above statements, the observed y(H) does not follow a simple HZ law [Sl H 1, 83 M 11.
Fig. 73. Magnetic field dependence of the electronic specific heat coefficient of Pd [81 H 11.
9.50 mJ
molK2 9.25
I 9.00 x
8.50 0 30 60 90 120 kOe 150
H VP1 -
Landolt-Bbmstein New Series 111/19a
Misawa, Kanematsn

516 1.3.10 4d, 5d: plastic deformation [Ref. p. 517
1.3.10 Effect of plastic deformation on the susceptibility
The plastic deformation alters substantially the magnetic properties of paramagnetic materials and may either increase (e.g. for V, Nb) or decrease the susceptibility (e.g. for AI, Cu). Concerning 4d and 5d transition metals, the effect of the plastic deformation on the susceptibility has been measured for Zr, MO, Pd, W, etc.: [76D2. 80Dl. 8OSl].
When a cylindrical spccimcn oflength /is plastically dcformcd by A/along the axis, the susceptibility becomes a function of the degree of plastic deformation ~=Al/l; the susceptibility depends also on the direction of deformation relative to the direction of an applied magnetic field. The plastic deformation increases the dislocation density p through which the susceptibility changes [80 D 11.
E-
Fig. 74. Relative variation ofthc susceptibility ofpolycry- stnllinc Zr as a fimction of the degree of deformation at room tcmpcraturc: the direction of the deformation is (solid circles) pnrallcl to the magnetic field. and (open circles) pcrpcndicular to the mngnctic licld [SOS I].
0.6 10’ 10” 10’ 108 log lOlo cm-2 10”
Fi_r. 7% x,(r)/~~ of MO as a function of dislocation density, ! at room tcmpcraturc, whcrc x,(w) is the susceptlhllity estrapolatcd to H= ~j in the zF vs. l/H curve and ,$ is the susceptibility of the undcformcd single crystal: [SOD I].
0 0.5 1
1.0 1.5 2.0 2.5 kOe 3.0 H ODD1 -
t 1.6
-m ,x 51.3
1.0 0 1 2 3 6 5 6 7 kOe 8
H or4 -
Fig. 76. Susceptibility ratio of deformed and single crystal spccimcns for Pd and W as a function ofmagnetic field for various values of the degree of deformation. E, at room temperature [76 D 21.
Misawa, Kanematsu

References for 1.3
21 F 1 31Gl 33Hl 41 s 1 48Bl 51Hl 52Hl 52Wl 53Kl 54Al 54Hl
55Kl 56Ll 56L2
57Al 60Bl 6011 61 K 1 62Fl 62Jl 62Tl 63M 1 630 1 65Sl 6582 65Vl 66Nl 67Wl 68Fl 68Ml 68Vl
68Wl 69Dl 69Fl 69Vl
70Fl 70F2 7011 70Kl 70K2 70Ml 7OSl 70Tl 71Cl 71 G 1 71Kl 71Ml 71Nl 72Cl 72Wl 73Dl
1.3.11 References for 1.3
Fo&x, G.: Ann. Phys. Paris 16 (1921) 174. Guthrie, A.N., Bourland, L.T.: Phys. Rev. 37 (1931) 303. de Haas, W.J., van Alphen, P.M.: Koninkl. Ned. Akad. Wetenschap. Proc. Ser. A36 (1933) 263. Squire, CF., Kaufmann, A.R.: J. Chem. Phys. 9 (1941) 673. Brauer, G.: Z. Anorg. Chem. 256 (1948) 10. Hoare, F.E., Walling, J.C.: Proc. Phys. Sot. (London) Sect. B64 (1951) 337. Hoare, F.E., Matthews, J.C.: Proc. R. Sot. London Ser. A212 (1952) 137. Wucher, J., Perakis, N.: C.R. Acad. Sci. 235 (1952) 419. Kriessman, C.J.: Rev. Mod. Phys. 25 (1953) 122. Asmussen, R.W., Soling, H.: Acta Chem. Stand. 8 (1954) 563. Hoare, F.E., Kouvelites, J.S., Matthews, J.C., Preston, J.: Proc. Phys. Sot. (London) Sect. B 67 (1954)
728. Kriessman, C.J., McGuire, T.R.: Phys. Rev. 98 (1955) 936. Landau, L.D.: Zh. Eksp. Teor. Fiz. 30 (1956) 1058; Sov. Phys. JETP (English Transl.) 3 (1957) 920. Lifshitz, I.M., Azbel, M.I., Kaganov, M.I.: Zh. Eksp. Teor. Fiz. 31(1956) 63; Sov. Phys. JETP (English
Transl.) 4 (1957) 41. Asmussen, R.W., Potts-Jensen, J.: Acta Chem. Stand. 11 (1957) 1271. Budworth, D.W., Hoare, F.E., Preston, J.: Proc. R. Sot. London Ser. A257 (1960) 250. van Itterbeek, A., Peelaers, W., Steffens, F.: Appl. Sci. Res. B8 (1960) 177. Kojima, H., Tebble, R.S., Williams, D.E.G.: Proc. R. Sot. London Ser. A260 (1961) 237. Fawcett, E.: Phys. Rev. 128 (1962) 154. Jones, D.W., McQuillan, A.D.: J. Phys. Chem. Solids 23 (1962) 1441. Taniguchi, S., Tebble, R.S., Williams, D.E.G.: Proc. R. Sot. London Ser. A265 (1962) 502. Manuel, A.J., St. Quinton, J.M.P.: Proc. R. Sot. London Ser. A273 (1963) 412. van Ostenburg, D.O., Lam, D.J., Shimizu, M., Katsuki, A.: J. Phys. Sot. Jpn. 18 (1963) 1744. Seitchik, J.A., Jaccarino, V., Wernick, J.H.: Phys. Rev. Al38 (1965) 148. Suzuki, H., Miyahara, S.: J. Phys. Sot. Jpn. 20 (1965) 2102. Volkenshtein, N.V., Galoshina, E.V.: Phys. Met. Metallogr. USSR (English Transl.) 20 (1965) No. 3,48. Narath, A., Fromhold, A.T., Jr., Jones, E.D.: Phys. Rev. 144 (1966) 428. Weiss, W.D., Kohlhaas, R.: Z. Angew. Phys. 23 (1967) 175. Foner, S., Doclo, R., McNiff, E.J., Jr.: J. Appl. Phys. 39 (1968) 551. Mori, N.: J. Phys. Sot. Jpn. 25 (1968) 72. Volkenshtein, N.V., Galoshina, E.V., Shchegolikhina, N.I.: Phys. Met. Metallogr. USSR (English
Transl.) 25 (1968) No. 1, 166. Wunsch, K.M., Weiss, W.D., Kohlhaas, R.: Z. Naturforsch. 23a (1968) 1402. Doclo, R., Foner, S., Narath, A.: J. Appl. Phys. 40 (1969) 1206. Foner, S., McNiff, E.J., Jr.: Phys. Lett. A29 (1969) 28. Volkenshtein, N.V., Galoshina, E.V., Shchegolikhina, N.I.: Sov. Phys. JETP (English Transl.) 29 (1969)
79. Fawcett, E.: Phys. Rev. B2 (1970) 1604. Fawcett, E.: Phys. Rev. B 2 (1970) 3887. Isaacs, L.L., Lam, D.J.: J. Phys. Chem. Solids 31 (1970) 2581. Kanno, S.: Prog. Theor. Phys. 44 (1970) 813. Keller, R., Ortelli, J., Peter, M.: Phys. Lett. A31 (1970) 376. Misawa, S.: Phys. Lett. A32 (1970) 153. Shimizu, M.: Proc. 3rd IMR Symp. on Electronic Density of States, NBS Special Publ. 323 (1970) 685. Treutmann, W.: Z. Angew. Phys. 30 (1970) 5. Collings, E.W., Ho, J.C.: Phys. Rev. B4 (1971) 349. Gersdorf, R., Muller, F.A.: J. Phys. Paris Suppl. C 1, 32 (1971) 995. Kohlhaas, R., Wunsch, K.M.: Z. Angew. Phys. 32 (1971) 158. Misawa, S.: Phys. Rev. Lett. 26 (1971) 1632. Narath, A., Weaver, H.T.: Phys. Rev. B3 (1971) 616. Collings, E.W., Smith, R.D.: J. Less-Common Met. 27 (1972) 389. Wagner, D.K.: Phys. Rev. B5 (1972) 336. van Dam, J.E.: Thesis, University of Leiden 1973.
Land&-Bdmstein New Series III/l%
Misawa, Kanematsu

518 References for 1.3
13G 1
74K 1
14 w 1 75Al
EC 1 75H 1 76B 1 76Dl 76 D 2
76F 1 76H I 76M 1 77B 1 77K 1 77K2 77P 1 7811 7SK 1 7SM 1 7s M 2 7ss 1 79K 1
79s 1 SOD1 SOR 1 SOS 1
SlAl SlGl SlG2
81 H 1
SlMl SlSl S2B1 82Tl 82Vl
S3Fl S3M 1
Galoshina. E.V., Gorina, N.B., Polyakova, V.P., Savitskii, E.M., Shchcgolikhina, NJ., Volkenshtein. N.V.: Phys. Status Solidi (b) 58 (1973) K45.
Kondorskii. E.I.. Galkina, OS., Cheremushkina, A.V., Usarov, U.T., Chuprikov, G.E.: Soviet Phys. JETP (English Transl.) 39 (1974) 1094.
Weaver. H.T., Quinn, R.K.: Phys. Rev. BlO (1974) 1816. Alekseyeva. L.I.. Budagovskiy, S.S., Bykov, V.N., Kondakhchan, LG., Povarova, K.P., Podolyan, N.I.,
Savitskiy, Ye.M.: Phys. Met. Metallogr. USSR (English Transl.) 40 (1975) No. 5, 87. Cable. J.W., Wollan. E.O., Felcher, G.P., Brun, T.O., Hornfeldt, S.P.: Phys. Rev. Lett. 34 (1975) 278. Hioki. T., Kontani. M., Masuda. Y.: J. Phys. Sot. Jpn. 39 (1975) 958. Burzo. E., Lazar. D.P.: Solid State Commun. 18 (1976) 381. Das. B.K., Stern. E.A., Lieberman, D.S.: Acta Metall. 24 (1976) 37. Deryagin. A.I., Pavlov, V.A., Vlasov, K.V., Shishmintsev, V.F.: Phys. Met. Metallogr.USSR (English
Transl.) 41 (1976) No. 5, 183. Fletcher, R.: Phys. Rev. B 14 (1976) 4329. Hechtfischer, D.: Z. Phys. B 23 (1976) 255. Misawa. S., Kanematsu, K.: J. Phys. F6 (1976) 2119. Barnea. G.: J. Phys. F 7 (1977) 315. Karcher. R., Kiibler, U., Liiders, K., Sziics, Z.: Phys. Status Solidi (b) 84 (1977) 189. Khan, H.R., Liiders, K., Raub, Ch.J., Sziics, Z.: Phys. Status Solidi (b) 84 (1977) K 33. Ploumbidis. D.: Z. Phys. B28 (1977) 61. Inoue. N., Sugawara, T.: J. Phys. Sot. Jpn. 44 (1978) 440. Kobler. U., Schober. T.: J. Less-Common Met. 60 (1978) 101. Martins. J.M.V., Missell, F.P., Percira, J.R.: Phys. Rev. B 17 (1978) 4633. Misawa. S.: J. Phys. F8 (1978) L263. Shaham. M., El-Hanany, U., Zamir, D.: Phys. Rev. B17 (1978) 3513. Klyuyeva. LB., Kuranov, A.A., Chemerinskaya, L.S., Babanova, Ye.N., Bashkatov, A.N., Syutkin,
P.N., Sidorenko, F.A., Gel’d, P.V.: Phys. Met. Metallogr. USSR (English Transl.) 47 (1979) No. 4, 46.
Shaham, M.: Phys. Rev. B20 (1979) 878. Deryagin. A.I., Nasyrov, R.Sh.: Phys. Met. Metallogr. USSR (English Transl.) 49 (1980) No. 6, 64. Radhakrishna. P., Brown, P.J.: J. Phys. F 10 (1980) 489. Savin. V.I., Markin, V.Ya.. Deryavko, I.I., Yakutovich, M.V.: Phys. Met. Metallogr. USSR (English
Transl.) 49 (19SO) No. 2, 170. Abart, J.? Voitlander. J.: Solid State Commun. 40 (1981) 277. Gerhardt. W., Razavi. F., Schilling. J.S., Hiiser, D., Mydosh, J.A.: Phys. Rev. B24 (1981) 6744. Gygax, F.N., Hintermann, A., Riiegg. W., Schenck, A., Studer, W.: Solid State Commun. 38 (1981)
1245. Hsiang. T.Y., Reister, J.W., Weinstock, H., Crabtree, G.W., Vuillemin, J.J.: Phys. Rev. Lett. 47 (1981)
523. Misawa, S.: J. Mag. Magn. Mater. 23 (1981) 312. Shimizu. M.: Rep. Prog. Phys. 44 (1981) 329. Beal-Monod. M.T.: Physica 109, 1lOB (1982) 1837. Takigawa, M.? Yasuoka. H.: J. Phys. Sot. Jpn. 51 (1982) 787. Vonsovsky, S.V., Izyumov, Yu.A., Kurmaev, E.Z.: Superconductivity in Transition Metals, Berlin.
Heidelberg. New York: Springer 1982, ch. 4. Fawcett. E.. Pluzhnikov, V.: Physica 119B (1983) 161. Misawa, S.: J. Mag. Magn. Mater. 31-34 (1983) 361.
Misawa, Kanematsu
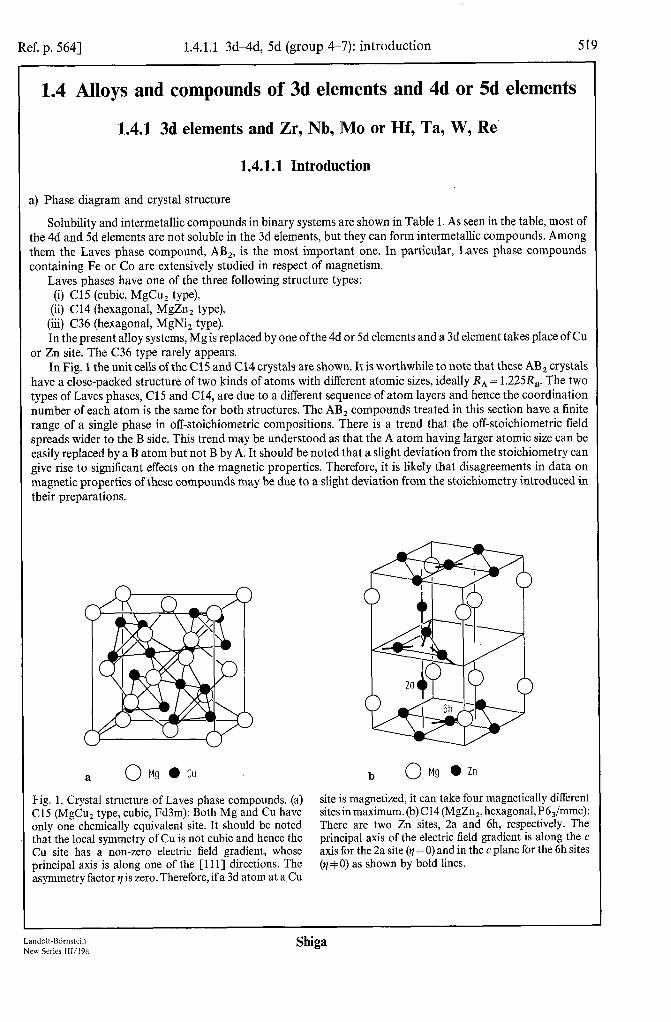
Ref. p. 5641 1.4.1.1 3dAd, 5d (group 4-7): introduction 519
1.4 Alloys and compounds of 3d elements and 4d or 5d elements
1.4.1 3d elements and Zr, Nb, MO or Hf, Ta, W, Re
1.4.1.1 Introduction
a) Phase diagram and crystal structure
Solubility and intermetallic compounds in binary systems are shown in Table 1. As seen in the table, most of the 4d and 5d elements are not soluble in the 3d elements, but they can form intermetallic compounds. Among them the Laves phase compound, AB2, is the most important one. In particular, Laves phase compounds containing Fe or Co are extensively studied in respect of magnetism.
Laves phases have one of the three following structure types: (i) Cl5 (cubic, MgCu, type),
(ii) Cl4 (hexagonal, MgZn, type), (iii) C36 (hexagonal, MgNiz type). In the present alloy systems, Mg is replaced by one of the 4d or 5d elements and a 3d element takes place of Cu
or Zn site. The C36 type rarely appears. In Fig. 1 the unit cells of the Cl5 and Cl4 crystals are shown. It is worthwhile to note that these AB, crystals
have a close-packed structure of two kinds of atoms with different atomic sizes, ideally R, = 1.225Rn. The two types of Laves phases, Cl5 and C14, are due to a different sequence of atom layers and hence the coordination number of each atom is the same for both structures. The AB, compounds treated in this section have a finite range of a single phase in off-stoichiometric compositions. There is a trend that the off-stoichiometric field spreads wider to the B side. This trend may be understood as that the A atom having larger atomic size can be easily replaced by a B atom but not B by A. It should be noted that a slight deviation from the stoichiometry can give rise to significant effects on the magnetic properties. Therefore, it is likely that disagreements in data on magnetic properties of these compounds may be due to a slight deviation from the stoichiometry introduced in their preparations.
a 0 Mg . Cu Fig. 1. Crystal structure of Laves phase compounds. (a) Cl 5 &IgCu, type, cubic, Fd3m): Both Mg and Cu have only one chemically equivalent site. It should be noted that the local symmetry of Cu is not cubic and hence the Cu site has a non-zero electric field gradient, whose principal axis is along one of the [l 1 l] directions. The asymmetry factor q is zero. Therefore, ifa 3d atom at a Cu
b 0 Mg 0 Zn
site is magnetized, it can take four magnetically different sites in maximum.(b) Cl4 (MgZn,, hexagonal, P6Jmmc): There are two Zn sites, 2a and 6h, respectively. The principal axis of the electric field gradient is along the c axis for the 2a site (q = 0) and in the c plane for the 6h sites (tt $0) as shown by bold lines.
Land&-Bdmstein New Series 111/19a
Shiga

Table 1. Equilibrium phases and solubility limits of binary alloys between 3cl and 4d or 5d elements. See [58 h I] if not otherwise noted. For intermetallic compounds, the crystal structure is given in parentheses.
Zr Hf Nb Ta MO W Re
Ti Solid solution ‘) Solid solution ‘) Solid solution Solid solution Solid solution Not soluble ‘) Not soluble ‘) Low-temperature phase r (hcp) Martensitic transformation @-+a) on Ti-rich side Ti in W IOat% T&b4 High-temperature phase p (bee)
V V,Zr(C15) V,Hf(Cl5)*) Solid Miscibility gap ? 7 V in Re 3at% Zr in V 3at% solution V in Ta 36at% Re in V 65at%
Ta in V lOat% ‘) VRe, ‘)
Cr Not soluble Not soluble Ta in Cr l.Sat% Miscibility gap Cr in Re 5at%
Cr,Zr Eii ( >
Cr,Hf z:i ‘? ( 1
Cr in Ta 9at% CrinW5at% Re in Cr 35 at% Cr,Ta(C15, C14) WinCr2at% Cr,Re,o-phase ‘)
Mn Not soluble’) Mn,Hf(C14) 7 Mn,Ta(C14) a-phase ? Mn,,Re16’) Mn,Zr(C14) o-phase
Fe Not soluble Not soluble ‘) Fe,Nb(C14) Fe,Ta(C14) MO in Fe 4at% Fe,W(C14) Re in Fe 11 at% Fe,Zr(ClS) F+WD8s) hW2 Fe,Re,
Fe,Hf(C14+ClS) Fe,W@8,) o-phase
co Not soluble Co,Hf Co,Nb(C 15) Co,Ta’) COWDO,,) Co,WDO ,cJ Solid solution CoZr(CsCI) Co,Hf(ClS) Co,Mo,W,) Co7Wlm-3,) Co I *Zr,, Co,Zr CoHf(CsC1) CoZr,(CuAl,) CoHf,(Ti,Ni) ‘) Co,Zr(ClS) ‘)
Ni Ni,Zr(AuBe,) Ni,Hf Ni,Nb Ni,Ta(TiCu,) MO in Ni 13at% W in Ni 12at% Ni in Re 45 at% Ni,Zr,, Ni,,Zr, Ni,Hfi, Ni,Hf, NiNb Ni,Ta, Ni,Mo Ni,W Re in Ni 5 at% ‘) Ni 1 *Zr,, NiZr Ni,,Hf, Ni,Mo NiZr,(CuAl,)‘) Ni 1 ,Hf,,, NiHf
NiHf,(AlCu,) ‘)
‘) [65e 11. ‘) [69s 11.

Ref. p. 5641 1.4.1.2 Ti, V-4d, 5d (group 4-6) 521
b) Magnetic properties
Most of the alloys and the intermetallic compounds are Pauli paramagnetic except for some of the Fe alloys and intermetallic compounds which show ferro- or antiferromagnetism. However, they usually show a temperature-dependent susceptibility. In some cases, this looks like a Curie-Weiss law. This behavior may be ascribed to a high density of states of the d band at the Fermi level. For these cases, we use a term “nonmagnetic”, meaning a magnetic state in which no local-moment alignment, including ferro- and antiferromagnetism, takes place at the lowest temperature.
c) Arrangement of substances
Binary alloys and compounds are arranged in the order of increasing atomic number of the 3d element in these substances. In each of the following subsections on Ti and V, Cr, Mn, Fe, Co and Ni alloys the sequence of the 4d and 5d elements is: Zr, Hf, Nb, Ta, MO, W, Re.
Ternary alloys are, in principle, placed after the binary alloys of their constituents. For example, the ternary alloy Fe-Co-Zr appears in the subsection on Co alloys after Co-Zr binary alloys. Exceptions are V-Fe-Zr and Cr-Co-Zr ternary alloys, which are found in the subsections on V and Cr alloys, respectively.
1.4.1.2 Ti and V alloys and compounds
No alloys and intermetallic compounds other than nonmagnetic ones have been found so far. Most of them become a superconductor at low temperatures. Fairly extensive studies including magnetic properties have been done because of the interest in superconductors, in particular, for Laves phase compounds of V,M (M = Zr, Hf, etc.).
Survey
Alloy Composition Property Fig. Table
Ti, -xNb, Ti, -XM~, V, -xNbx VI -xMox V,Zr, V,Hf, V,Ta V, - ,Al,Zr V, -,Fe,Zr V, -,Fe,Hf V,Zr 1 - ,Hf,
V, -,ZrNb, V,Zr, -XNb, V, - ,Nb,Hf
V,Hf, - xTax
01x11.0 -- O~x~1.0 OSxS1.0 -- 04x<l.O --
x=0.15 x=0.3 x=0.3 OSxS1.0 --
o<x10.1 -- osxjo.1 06x50.25
O~x~1.0
XII&) xnka Y(X), T,(x) X”(X), K(x) h&'J xm7 xs3 T,, K, e2qQ x&T) x;'(T) x~'(T) x CO, K(T) &Q, T,(x), Y(X) x&O L,(T) a, T, x,,,, e2qQ x(T) K(T) L,(T)
2 3 4, 5 6
2 7 8 8 9, 10 11 12 12
3 13 14 15
Landolt-Bdmstein New Series 111/19a
Shiga
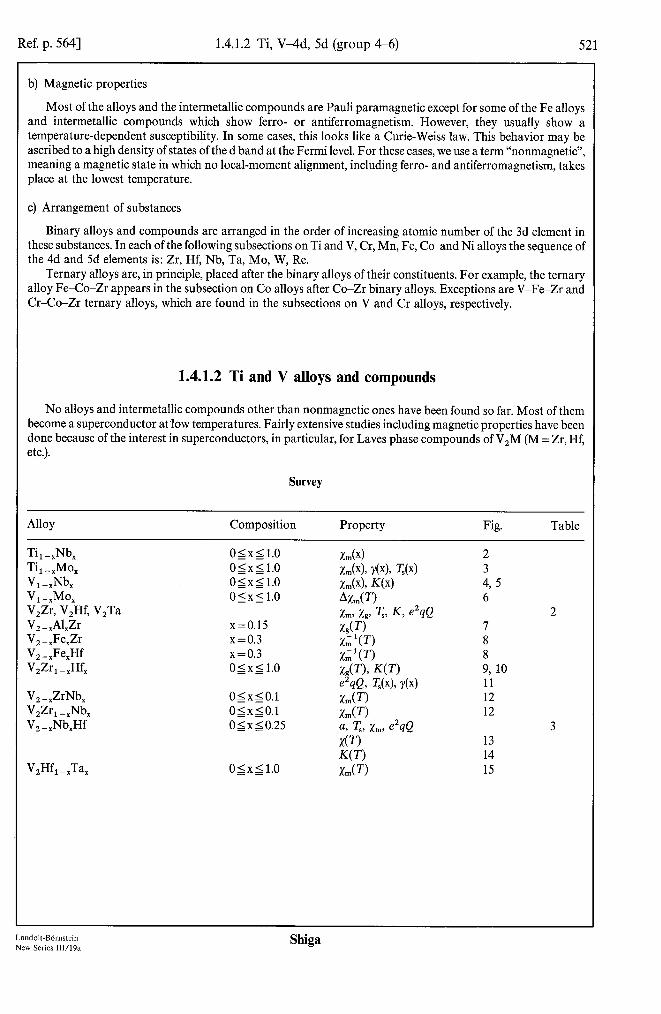
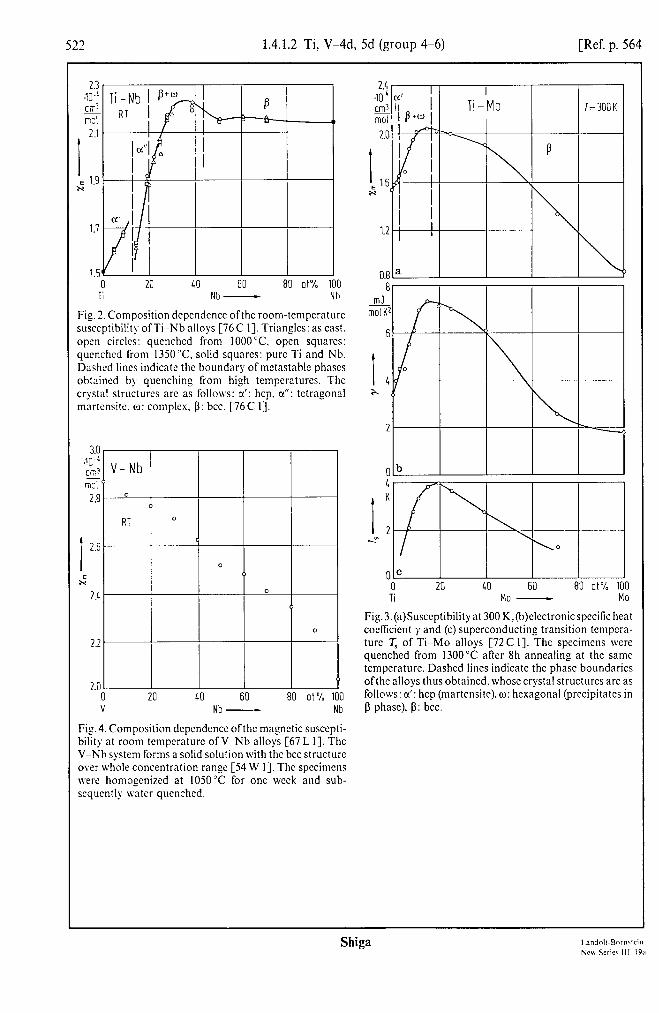
522 1.4.1.2 Ti, V-4d, 5d (group 4-6) [Ref. p. 564
2.3 JO-' cm3 - Kl3! 2.1
I E 1.9
N
1.7
1.5 0 20 LO 60 80 at%
Ti Nb - Nb
Fig. 2. Composition depcndcnce ofthc room-tcmpcraturc susceptibility ofTi -Nb alloys [76C I]. Triangles: as cast, open circles: quenched from 1000°C. open squares: quenched from 135O’C. solid squares: pure Ti and Nb. Dashed lines indicate the boundary of mctastablc phases obtained by quenching from high temperatures. The crystal structures arc as follows: c(‘: hcp, u”: tetragonal mnrtcnsite. (I): comples, p: bee. [76C I].
3.0 .lO-' CiT?
rn3 2.8
I
2.E
,: 26
2.2
2.c 20 40 60 80 at %
Nb - Nb
Fig. 4. Composition dcpcndcncc ofthc magnetic susccpti- bility at room tempcraturc of V-Nb alloys [67 L I]. The V-Nb system forms a solid solution with the bee structure over whole concentration range [54 W I]. The specimens were homogenized at 1050°C for one week and sub- scqucntly water quenched.
2A wL &p mol 2.0
I E 1.6 x
0.81"
-0 20 40 60 80 at% 100 Ti MD - MO
Fig3.(a)Susccptibilityat 300K,(b)clectronicspccific heat cocllicicnt y and (c)superconducting transition tempera- ture T, of Ti-Mo alloys [72C I]. The specimens were quenched from 1300°C after 8h annealing at the same temperature. Dashed lines indicate the phase boundaries ofthc alloys thus obtained,whosc crystal structures are as follows: a’: hcp (martensitc), o: hexagonal (precipitates in p phase), p: bee.
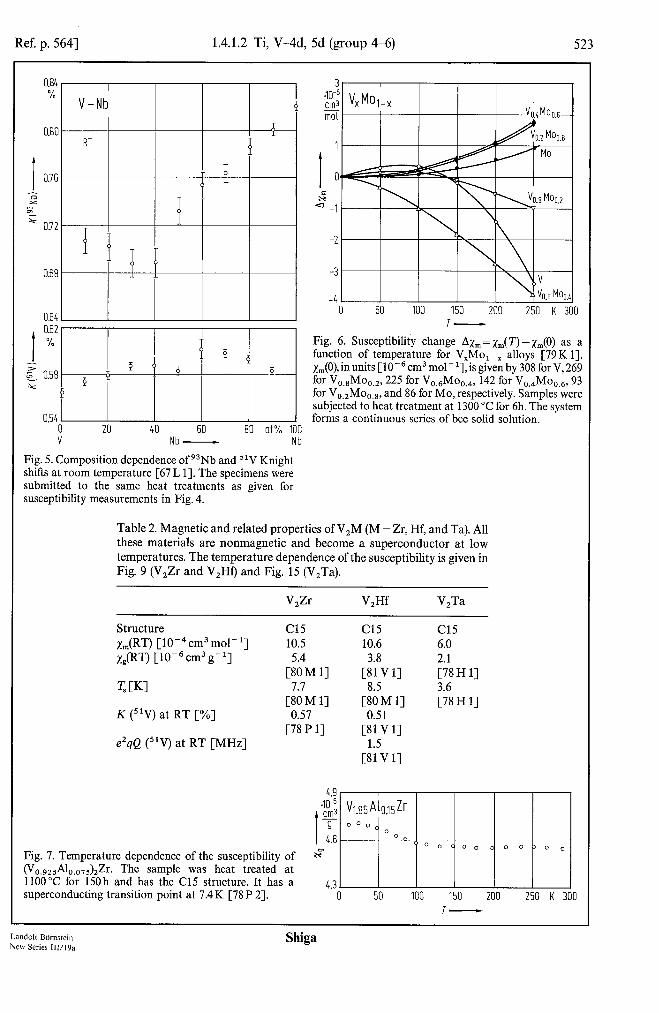
Ref. p. 5641 1.4.1.2 Ti, VAd, 5d (group 4-6) 523
0.64 1
k P
0.54 0 20 40 60 80 at% 100
0 50 100 150 200 250 K 300 7-
Fig. 6. Susceptibility change Ax,,, = x,( 7’) - ~~(0) as a function of temperature for V,Mo, --x alloys [79 K 11. ~JO),inunits [10e6 cm3 mol-‘],is given by 308 for V,269 for Vo.sMoo,z, 225 for V,,,Mo,,,, 142 for V,,,Mo,,,, 93 for Vo.2Moo,s, and 86 for MO, respectively. Samples were subjected to heat treatment at 1300 “C for 6h. The system forms a continuous series of bee solid solution.
v Nb - Nb
Fig. 5. Composition dependence of g3Nb and ‘lV Knight shifts at room temperature [67 L 11. The specimens were submitted to the same heat treatments as given for susceptibility measurements in Fig. 4.
Table 2. Magnetic and related properties of V,M (M = Zr, Hf, and Ta). All these materials are nonmagnetic and become a superconductor at low temperatures. The temperature dependence of the susceptibility is given in Fig. 9 (V,Zr and V,Hf) and Fig. 15 (V,Ta).
V,Zr V,Hf V,Ta
Structure x,JRT) [10-4cm3mol-1] xJRT) [10m6 cm3 g-‘1
T, CKI
K (“V) at RT [%]
eZqQ (‘lV) at RT [MHz]
Cl5 10.5
[k?M I]
$M 11 0.57
[78P 11
4.9 .lO-"
I
& 9 4.6
Fig. 7. Temperature dependence of the susceptibility of s (VO,g,,Al,,,,,),Zr. The sample was heat treated at 1100 “C for 150 h and has the Cl5 structure. It has a i.34 superconducting transition point at 7.4 K [78 P 21. 0 50 100 150 200 250 K 300
Cl5 Cl5 10.6 6.0
,,‘;“, 1, 2.1 [78 H 11 8.5 3.6
[80 M l] [78 H l] 0.51
[81Vl] 1.5
[Sl V 11
Land&Bbmstein New Series III/I%
Shiga
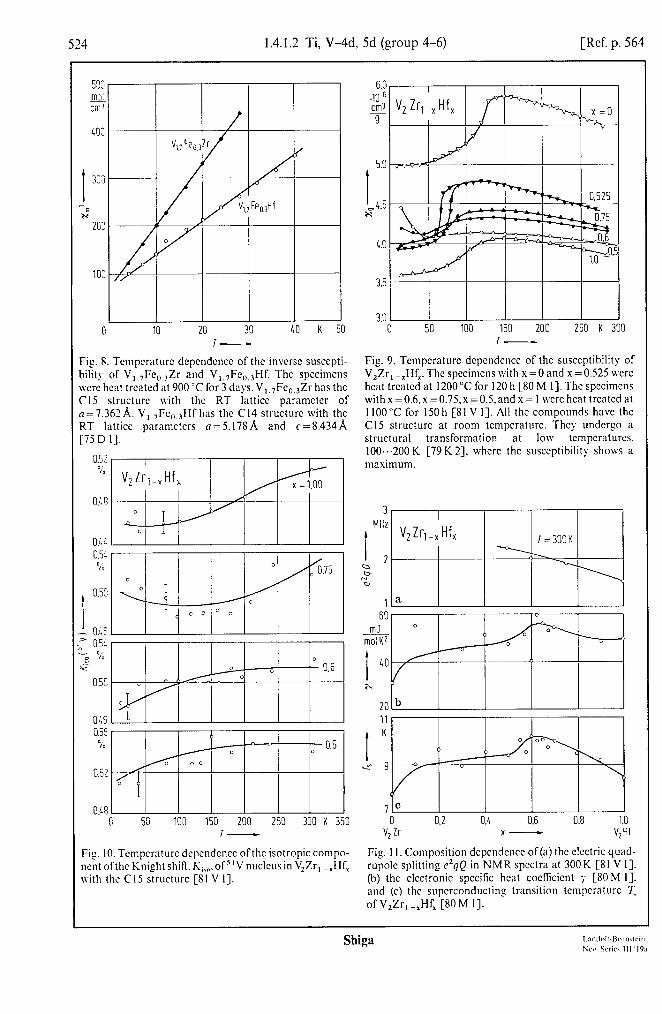
524 1.4.1.2 Ti, V-4d, 5d (group 4-6) [Ref. p. 564
I 0 10 20 30 40 K 50
I-
Fig. 8. Temperature depcndcncc of the invcrsc susccpti- bility of V,.,Fe, ,Zr and V,.,Fe,,,Hf. The spccimcns were heat treated at 900 ‘C for 3 days. V,,,Fc,,,Zr has the Cl5 structure with the RT lattice paramctcr of n=7.362A. V,,,Fc,,,Hfhns the Cl4 structure with the RT lattice parameters 0=517SA and c=S434A [75 D I].
0.52 /
“” VzZrl_,Hf,
0.48 / 0
p 0.u o
I=- ; 0.55
-j 7; o k c’ - 0 0.6
0.53 i
0.46 0.5c \ “/b - 0.5 0 o
o Cl0 0527-4 0
0.48 0 53 100 150 200 250 300 K 350
T-
Fig IO. Tcmpcmturc dcpcndcncc ofthc isotropic compo- nent ofthe Knight shift, K,,,.of”V nuclcus in VzZr, -,Hf, with the Cl5 structure [SI V I].
I-
I-
5s
I ?7
4.5
4.C
3.E
7r
I-
I-
.J_ J- o 50 100 150 200 250 K 300
Fig. 9. Tcmpcraturc dcpcndcncc of the susceptibility of V,Zr, -,Hf,. The specimens with x=0 and x =0.525 were heat trcatcd at 1200°C for 120 h [SO M 11. The specimens with x = 0.6. x = 0.75, x = 0.5, and x = I were heat treated at 1100 “C for 150 h [Sl V I]. All the compounds have the Cl5 structure at room tempcraturc. They undergo a structural transformation at IOW temperatures. l00...200K [79K 23. whcrc the susceptibility shows a maximum.
3 I
I
MHz V2Zr,_,Hf, 2
D D
“a,
1 a 60
mJ o molK2
I 40 y
x /
20 b 11 K
T=300K
\
V,lr x- V,Hf
Fig. 1 I. Composition dcpcndcncc of(a) the electric quad- rupolc splitting eZqQ in NMR spectra at 300K [St V I]. (b) the electronic spccitic heat cocficicnt 7 [SOM I]. and (c) the superconducting transition tcmpcraturc 7, of V,Zr, -,Hf, [SO M I].
Shiga
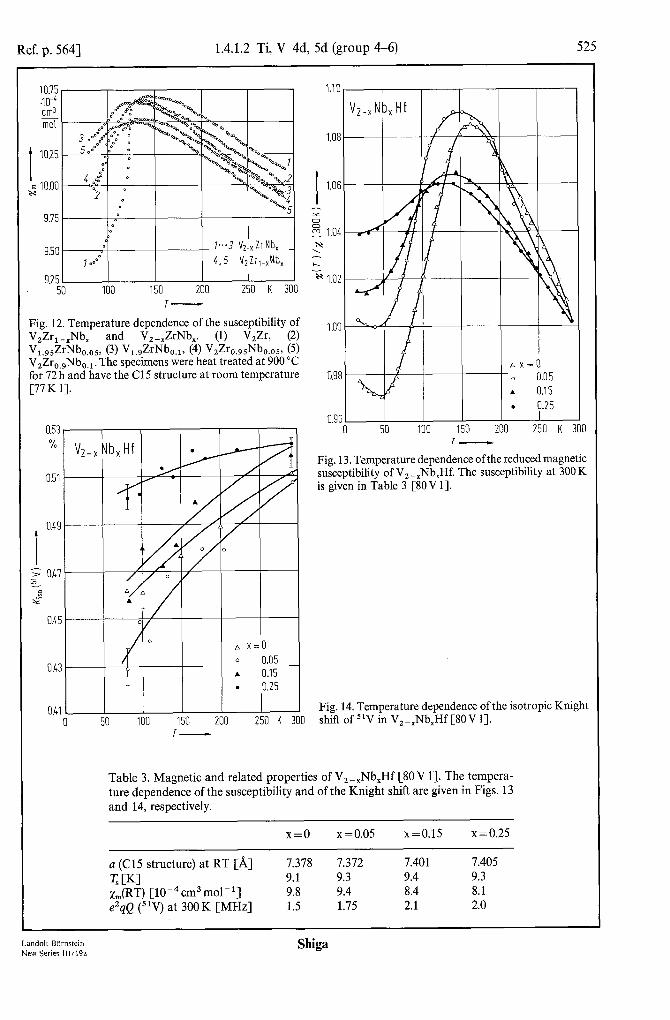
Ref. p. 5641 1.4.1.2 Ti, VAd, 5d (group 4-6) 525
.-..- m4 cm3 - mol
9.25 I 50
I I I 100 150 200 250 K 300
T-
Fig. 12. Temperature dependence of the susceptibility of V,Zr, -,Nb, and V,-,ZrNb,. (1) V,Zr, (2) V1.95ZrNb0.05~ (3) Vl.9ZrNbo,l, (4) V2Zro.&bo.o~9 (5) VzZr,,,Nb,,,. The specimens were heat treated at 900°C for 72 h and have the C 15 structure at room temperature [77 K 11.
0.53 %
0.51
I
0.49
2 Ok7 k
R s
0.45
0.43
Ul 0
/ I 0
0 T n x=0
I I I I I I 50 100 150 200 250 K 300
1.08
1 1.06
:: E 1.04 x
1 6.
-s 1.02
I.00
0 50 100 150 200 250 K : T-
Fig. 13. Temperature dependence ofthe reduced magnetic susceptibility of V2 -,Nb,Hf. The susceptibility at 300 K is given in Table 3 [8OV 11.
Fig. 14. Temperature dependence of the isotropic Knight shift of 51V in V, -,Nb,Hf [SO V 11.
T-
Table 3. Magnetic and related properties of V,-,Nb,Hf [SO V 11. The tempera- ture dependence of the susceptibility and of the Knight shift are given in Figs. 13 and 14, respectively.
x=0 x = 0.05 x=0.15 x = 0.25
a (Cl5 structure) at RT [A] 7.378 7.372 7.401 7.405 T, CKI 9.1 9.3 9.4 9.3 x,,,(RT) [10-4cm3mol-1] 9.8 9.4 8.4 8.1 e2qQ (“‘V) at 300K [MHz] 1.5 1.75 2.1 2.0
Land&Bbmstein New Series lW19a
Shiga
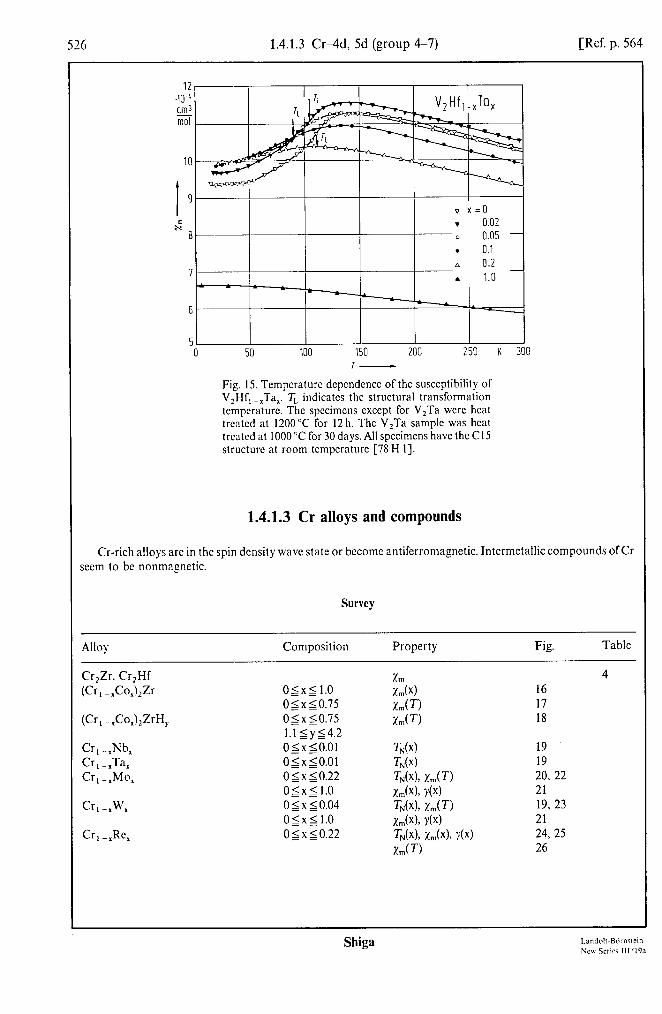
526 1.4.1.3 Cr-4d, 5d (group 4-7) [Ref. p. 564
X-L cm3 mol
51 I I I I I 0 50 100 150 200 250 K 300
Fig. 15. Tempcraturc dcpcndencc of the susceptibility of V,Hf, -XTa,. TL indicates the structural transformation tcmpcraturc. The spccimcns except for V,Ta were heat treated at 1200°C for 12 h. The V,Ta sample was heat trcatcd at 1000 “C for 30 days. All specimens have the C 15 structure at room tcmpcraturc [78 H 11.
1.4.1.3 Cr alloys and compounds
Cr-rich alloys are in the spin density wave state or become antifcrromagnctic. Intermetallic compounds of Cr seem to be nonmagnetic.
Survey
Alloy Composition Property Fig. Table
Cr2Zr. Cr,Hf &Jr, -,Co,W
(Cr, -$oJ2ZrHy
Cr, -xNb, Cr, -,Ta, Cr, -,Mo,
Cr, -IW,
Cr, -,Re,
O~x~1.0 01x10.75 -- O~x~O.75 l.lsyg4.2 0~x~0.01 0~x~0.01 o<x10.22 -- Olxll.0 -- osx 10.04 -- O~x~1.0 O~x50.22
TN(X) 19 TN(X) 19 TN(x), urn 20, 22 Ln(X)~ Y(X) 21 TN(X), L(T) 19, 23 xm> Y(X) 21 TN(X)> x,(x)~ Y(X) 24,25 xm(T) 26
4 16 17 18
Shiga
Ref. p. 5641 1.4.1.3 CrAd, 5d (group 4-7) 527
Table 4. Magnetic properties of Cr,Zr and Cr,Hf. The temperature dependence of the susceptibility of Cr,Zr is given in Fig. 17. It depends on heat treatments [83 H 11.
Cr,Zr Cr,Hf
Structure Cl5 Cl4 Magnetism Pauli paramagnetism x,,, (300K) [10-4cm3mol-‘] 9.2 4.0 Ref. [83 H 11 [68A l]
0 0.2 0.L 0.6 0.8 1.0 Cl- X- co
Fig. 16. Composition dependence of the susceptibility of (Cr, -.$o,),Zr and their hydrides at 273 K [83 H 11. Solid circles: (Cr, -xCo,)zZr with the Cl5 structure, solid triangles: (Cr, -$o,),Zr with the Cl4 structure, open circles: hydrides with the Cl5 structure, open triangles: hydrides with the Cl4 structure.
‘i$ (Cr,-,Co, J2 Zr
mfjq&&
I 15
s
IO
0 50 100 150 200 250 K 3
Fig. 17. Temperature dependence of the susceptibility of (Cr, -$o,),Zr [83 H 11.
PO I 55
IO
I I I I
0 50 100 150 200 250 K 300
Fig. 18. Temperature dependence of the susceptibility of (Cr, -,Co,),ZrH, hydrides [83 H I].
Landolf-BBmstein New Series 111/19a
Shiga

52s 1.4.1.3 Cr-4d, 5d (group 4-7) [Ref. p. 564
320 K
1 2 3 5 at% 6 Cr Nb.Ta.W -
Fig. 19. Variation of the N&l tcmpcraturc TX in Cr-Nb [76 F I]. Cr-Ta [76 F I] and Cr-W, squares: [76 F I], crosser: [66 K I].
I.1 1 1=300K
0.8 0
I 0 Cr-Mo l Cr-W
\
20 LO 60 80 at% 1
-7 n
-2
rl
\
oo[
/ mJ lolK2
I b
I
Cr Mo.W w Mo.W
Fig. 9-l Concentration dcpcndcncc ofthc susceptibility at 300 K and the clcctronic specific hcnt cocflicicnt y of Cr- hlo and Cr-W alloys [70 B I].
25C
I
2oc
SF 15c
lO[
5[
[
MO -
Fig. 20. Variation of the N&l temperature TX in Cr-MO alloys. Solid circles: [66H I], triangles: [68A2], open circles: [70 B l] and squares: [SOS I].
I 1.80 s
1.75
1.70
1.65 1 I I I I 0 150 300 L50 600 K 753
I-
Fig. 22. Temperature dependence of the susceptibility of CrMo alloys. The arrows indicate the N&l temperature [70 B l-j.
Shiga
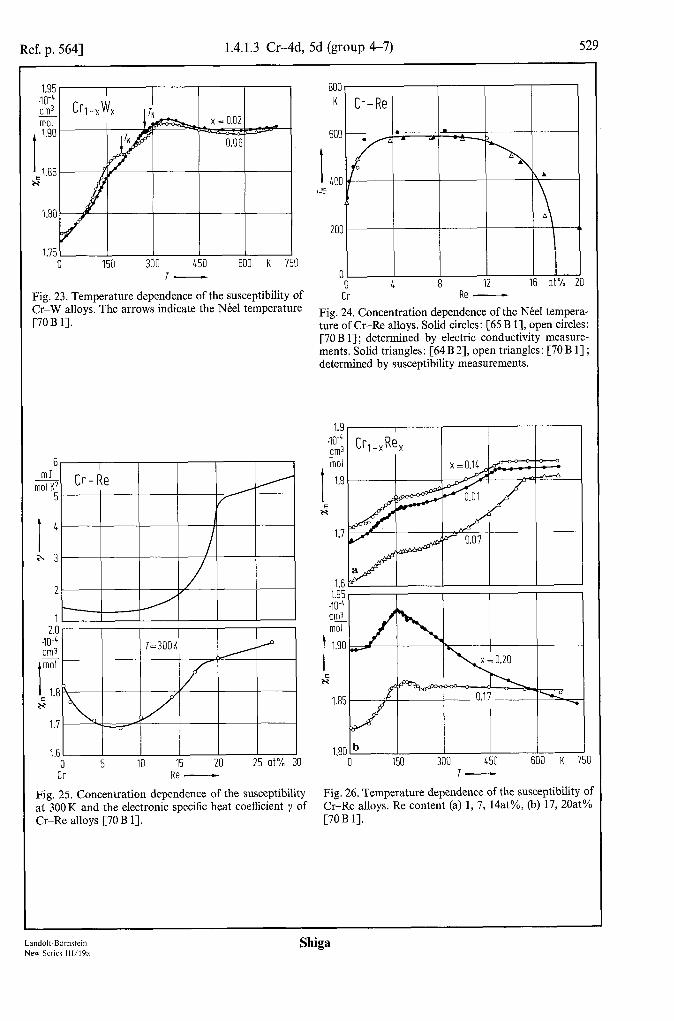
Ref. p. 5641 1.4.1.3 Crvld, 5d (group 4-7)
1.95 .lOP cm3 mol
I
1.90
H" 1.85
1.8C
II I I I I I 0 150 300 450 600 K 750
T-
Fig. 23. Temperature dependence of the susceptibility of Cr-W alloys. The arrows indicate the NCel temperature [70B 11.
” I
& Cr-Re 5
I 4
a 3
:: 2.0 I I I I I I I
w cm3
I
mol
1.8 ;
1.7
1.6 0 5 IO 15 20 25 at% 30
Cr Re -
Fig. 25. Concentration dependence of the susceptibility at 300K and the electronic specific heat coefficient y of Cr-Re alloys [70 B 11.
600
I 400 h'
200
01 I I I I I 0 0 4 4 8 8 12 12 16 16 ot ot% 10
Cr Cr Re Re - -
800, I I I I
Fig. 24. Concentration dependence of the Neel tempera- ture of Cr-Re alloys. Solid circles: [65 B I], open circles: [70 B 11; determined by electric conductivity measure- ments. Solid triangles: [64 B 21, open triangles: [70 B l] ; determined by susceptibility measurements.
1.9 a4 cm3 - mol
I
1.8
CG
1.7
1.6 1.95 .m4 cm3 mol
I 1.90
2;
1.85
1.80 0 150 300 450 600 K
T-
Fig. 26. Temperature dependence of the susceptibility of Cr-Re alloys. Re content (a) 1, 7, 14at%, (b) 17, 20at% [70 B 11.
Landolt-Bbmstein New Series lWl9a
Shiga
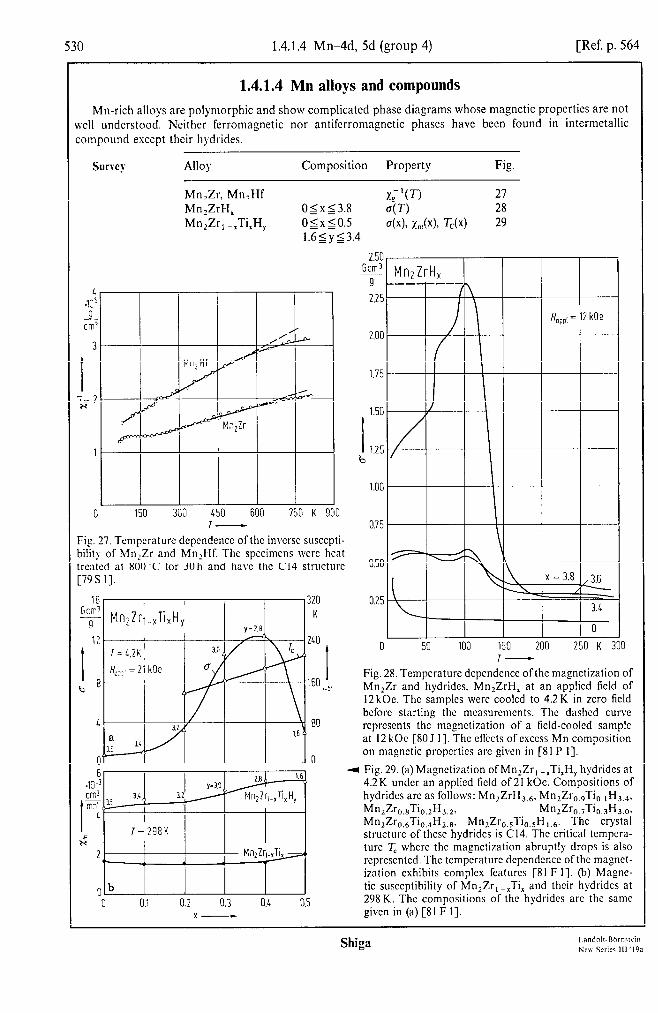
530 1.4.1.4 Mn-4d, 5d (group 4) [Ref. p. 564
1.4.1.4 Mn alloys and compounds
Mn-rich alloys are polymorphic and show complicated phase diagrams whose magnetic properties are not ,vell understood. Neither ferromagnetic nor antiferromagnetic phases have been found in intermetallic compound except their hydrides.
Surq Allo> Composition Property Fig.
r
MnzZr. MnzHf MnzZrH, Mn?Zr, -,Ti,H,
x, ‘U-) 21 OIx53.8 4T) 28 -- O~x~O.5 4~)~ L,(x)~ T,(X) 29
0 150 300 450 600 750 K 900 I-
Fig. 27. Temperature dependence of the inverse susccpti- bility of h4n2Zr and Mn,Hf. The specimens wcrc heat treated at 8OO’C for 30 h and have the Cl4 structure [79S I].
320 320 K K
210 210
160 160
80 80
0 0
2.50 Gcm3
9
2.25
1.5c
I 1.25 b
l.OC
50 100 150 200 250 K 300 I-
Fig. 28. Temperature depcndcnce ofthc magnetization of Mn,Zr and hydrides, Mn,ZrH, at an applied field of 12 kOe. The samples were cooled to 4.2 K in zero field before starting the mcasurcmcnts. The dashed curve rcprcscnts the magnetization of a t’icld-cooled sample at 12 kOc [SO J I]. The effects of cxccss Mn composition on magnetic propcrtics arc given in [8l P I].
Fig. 29. (a) Magnetization ofMnzZr, -,Ti,H, hydrides at 4.2K under an applied field of 21 kOc. Compositions of hydrides arc as follows: Mn,ZrH,,,, Mn,Zr,,,Ti,,,H,,,, Mn.Jr~.~Tid~.~, Mn2Zro.7’%.&~.~~ Mn2Zro,6Tid2.~. Mn2Zr0,sTi,,,H,,,. The crystal structure of these hydrides is Cl4. The critical tempcra- turc T, whcrc the magnetization abruptly drops is also rcprcscntcd. The tcmpcraturc dependence of the magnet- ization exhibits complex features [Sl F I]. (b) Magne- tic susceptibility of Mn,Zr, -,Ti, and their hydrides at
0 0.1 0.2 0.3 0.5 298 K. The compositions of the hydrides arc the same x- given in (a) [Sl F I].

Ref. p. 5641 1.4.1.5 Fe-4d, 5d (group 4-6)
1.4.1.5 Fe alloys and compounds The solubility limit of 4d and 5d elements in Fe is very small. Therefore, interests in magnetism of Fe-rich
single-phase alloys are reduced to the effects of impurities on ferromagnetism of bee Fe, which are treated in sect. 1.1. On the other hand, the solubility of Fe in 4d and 5d transition metals is also low. The magnetic properties of Fe impurities in 4d and 5d metals and alloys are studied in relation to the Kondo effect, which are described in Landolt-Bbrnstein, NS, vol. III/lSa [82 f 11.
Laves phase Fe,Zr and Fe,Hf are the only ferromagnetic binary stoichiometric compounds treated in this section. In particular Fe,Zr and related alloys are most extensively studied. Distinct magneto-volume effects are observed in these materials. For instance, the Fe,Zr,,,Nb,,, alloy exhibits an Invar-like thermal expansion curve.
The Fe,Hf, -XTa, system has an interesting magnetic phase diagram. At x=0.2, ferromagnetic to antiferromagnetic and antiferromagnetic to paramagnetic transitions take place with increasing temperature and metamagnetic properties are observed in the antiferromagnetic region.
The (Fe, -$oJzZr system exhibits spin-glass characteristics above x=0.5.
Survey
Alloy
Fe,Zr
FeZr, Fe, - XZrX Fe,Hf
Fe, -,Hf, FeHf,H, Fe,Nb, Fe,Ta, Fe,W Fe, - xTax
Fe, -XNb, Fe,Mo, --x FexWl --x 0% -xA4)2Zr Fel.4A10&H, Fe,Zr, -,Ti,
0% -.VJ2Zr
(Fe1 -xV,)2ZrHy
(Fe1 -xGJ2Zr
Composition Property Fig. Table
a, g,, pFe, L 0, G, 5 d’TcldP, daldH> xHF, Y H hyp, Is> e2qQ e(T) 30
x=2, x=3 IS, e2qQ 6 0.26lx10.36 -- 4x), T,(x) 31
a, 0, T,, Hhyp, e2qQ 7 e(T) 30
0.28Ix10.36 -- 44 T,(x) 32 y=o, y=3 a, 0, T,, IS, e2qQ 8
a, c, x,,,, IS, e2qQ 9
0.325Ix<O.336 -- 4T)> GO 33 0.352Ix10.361 -- O), 4H) 34 x=0.52 x,(T), x;‘(T) 35 0.5O~x~O.53 TN(x)> H,,,(X) 36 0.48Ix10.50 -- TN(x), ffhypk) 36 o<x10.14 -- :;;; ;;x; w 37 OIx10.025 --
ih> k&i H,,,(X) 38, 39
01x10.6 -- 40 x=0, x=2.0 4T), xi ‘U-1 41 01x~l.O -- a@)> C(X), T,(x), PFe 42
4x), XIII(X) O~x~O.4 M(T) 43 x = 0.45, x = 0.5, x=1.0 G1(T) 44 O<x<l.O -- 44 44 45
T,(x)> T,(x) 46 PFetx) 47
0.042 5 x 5 0.33 a(T) 48 0.33Ix<O.75 -- x,(T)> x,‘(T) 49 01xSl.O -- a(x), 44 45
T,(x), T,(x) 46 PFetX) 47
x=O.8,y=O,y=4.6 x&T), x,l(T) 50 O~x<l.O -- 44, c(x), T,(x) 51
m, x,(x) 0.05~x~0.15 a(T) 52 0.2~~~0.75 xg(Th x,‘(T) 53 continued
Landolt-Bbmstein New Series 111/19a
Shiga
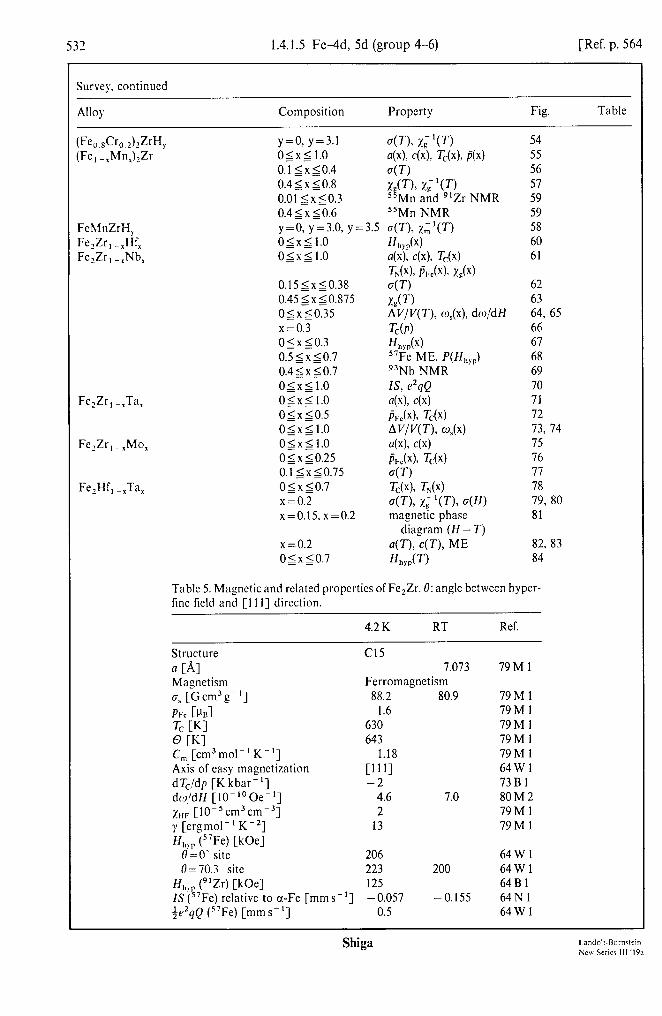
53’ 1.4.1.5 Fe-4d, 5d (group 4-6) [Ref. p. 564
Survey. continued
Allo} Composition Property Fig. Table
(Feo.8Cro.2hZrH, y=o, y=3.1 a-), x, ‘(T) 54 (Fe, -,Mn,W 05x5 -- 1.0 44, C(X)> T,(x), P(x) 55
0.1 jxjo.4 C’-) 56 0.4~x~O.S x u-h x, V) 51 0.01 ~x~O.3 “Mn and “Zr NMR 59 0.4 5 x IO.6 “Mn NMR 59 --
FchlnZrH, y=o, y=3.0, y=3.5 a(T), x,‘(T) 58 Fe,Zr, -,Hf, ogx~1.0 H,,,(x) 60 Fe,Zr, -XNb, ogxg 1.0 44. C(X)> T,(x) 61
G(x)3 PFCW z,(x) 0.15~x~O.38 a(T) 62 0.45 5 x 5 0.875 x&T) 63 O~x~O.35 AV/V(T), o,(x), dw/dH 64, 65 x=0.3 T,(P) 66 O~x~O.3 H,,,(x) 67 0.5~x10.7 “Fe ME, P(Hhyp) 68 0.4 5 x 5 0.7 g3Nb NMR 69 05x2 1.0 -- 1% e2rlQ 70
Fe,Zr , - ,Ta, O~x~1.0 44, 44 71 O~x~O.5 h(x). T,(x) 72 O~x~l.0 A I//W’-), w,(x) 73, 74
Fe,Zr , _ XMo, OSx~l.0 44, 4x) 75 OsxsO.25 B&X T,(x) 76 0.1 ~x~O.75 a(T) 71
Fe?Hf, -,Ta, ocx10.7 -- W4 TN(x) 78 x=0.2 a(T), x; ‘6‘7, a(H) 79, 80 x = 0.15, x = 0.2 magnetic phase 81
diagram (H-T) x=0.2 a(T), c(T), ME 82, 83 01x20.7 -- H,,.,(T) 84
Table 5. Magnetic and related propcrtics of Fe,Zr. 0: angle between hyper- lint held and [I 1 l] direction.
4.2 K RT Ref.
Structure 0 CA1 Magnetism a, [Gcm3g-‘1 PFe CPnl T, WI @ WI C, [cm3mol-’ K-l] Axis of easy magnetization dTc/dp [K kbar-‘1 dtoldH [lO-‘“Oe-‘] l,,r [10-5cm3cm-3] y [ergmol-’ Km2 Hhr,, (“Fe) [kOe:
Cl5 7.073 79M 1
Ferromagnetism 88.2 80.9 79Ml
1.6 79Ml 630 79Ml 643 79M 1
1.18 79M 1 Cllll 64Wl -2 73Bl
4.6 7.0 80M2 2 79Ml
13 79Ml
O=O- site 206 64Wl 0 = 70.3 site 223 200 64Wl
Hh?p (“Zr) IWe 125 64 B 1 1s (57Fe) relative to U-Fe [mm s-‘1 -0.057 -0.155 64N 1 &e2qQ (57Fe) [mm s-‘1 0.5 64Wl
Shiga
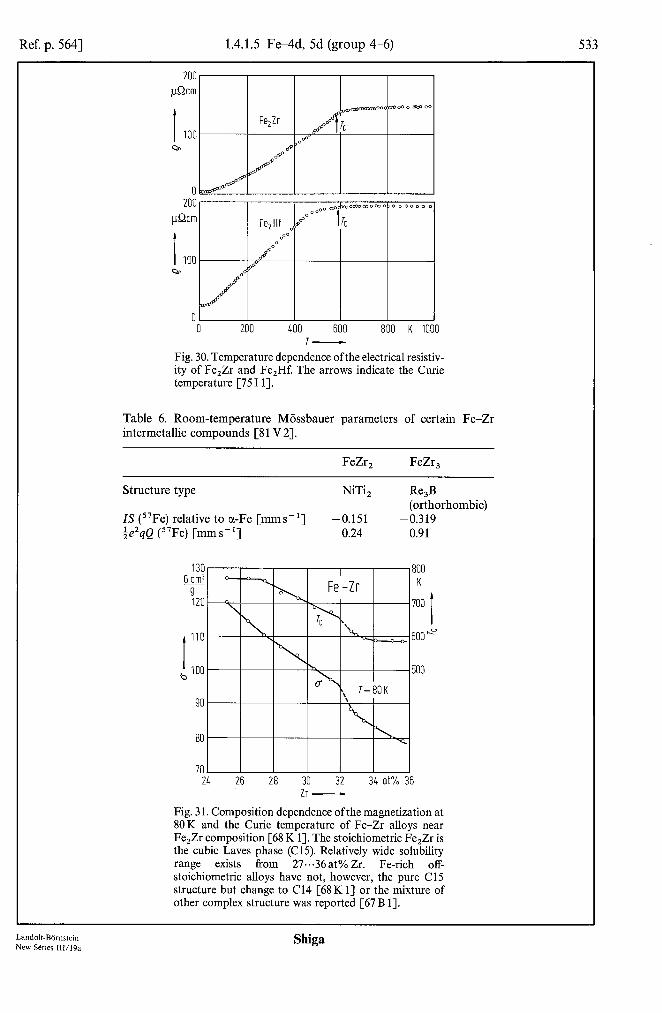
Ref. p. 5641 1.4.1.5 Fe-4d, 5d (group 4-6) 533
200 @cm
t 100 ar
01 I I I I I 0 200 400 600 800 K 1000
T-
Fig. 30. Temperature dependence ofthe electrical resistiv- ity of Fe,Zr and Fe,Hf. The arrows indicate the Curie temperature [75 I 11.
Table 6. Room-temperature Miissbauer parameters of certain Fe-Zr intermetallic compounds [Sl V2].
FeZr, FeZr,
Structure type NiTi,
IS (57Fe) relative to a-Fe [mms-‘1 -0.151 $?qQ (57Fe) [mms-‘1 0.24
Re,B (orthorhombic)
-0.319 0.91
130 !i&
9 120
I 110
~ 100
90
80
70 i 26 28 30 32 3L at% :
Zr -
00 K
00
t
ooe
00
Fig. 31. Composition dependence of the magnetization at 80K and the Curie temperature of Fe-Zr alloys near Fe,Zr composition [68 K 11. The stoichiometric Fe,Zr is the cubic Laves phase (C15). Relatively wide solubility range exists Tom 27...36at% Zr. Fe-rich off- stoichiometric alloys have not, however, the pure Cl5 structure but change to Cl4 [68K 1] or the mixture of other complex structure was reported [67 B 11.
Land&Bdmstein New Series 111/19a
Shiga

534 1.4.1.5 Fe-4d, 5d (group 4-6) [Ref. p. 564
Table 7. Magnetic and related properties of Fe,Hf. 0: angle between hypcr- tine field and [I 1 I] direction.
Ref.
Structure Mixture of Cl4 and Cl5
n at RT [A] Magnetism u @OK) [Gcm3geLJ T, WI Axis of easy magnetization Hhrp (“Fe) at 300 K [kOe]
O=O site 0 = 70.3’ site
Hhyp ( 181 Ta on Hf site) at RT [kOe]
&?qQ (57Fe) at RT [mm s-l]
(fraction depends on heat treatment) 7.028 (Cl 5)
Ferromagnetic 52.8
591 [ill] (C15)
176 184 130 (C15) 85 (C14)
- 0.41
100, I I I ,680
70Nl
70Nl
76L1
76Ll
76Ll
76Ll
660
600
580 26 28 30 32 34 at% 36
Hf -
Fig. 32. Composition depcndcnce ofthc magnetization at 80 K and 300 K under an applied field of 9.6 kOe and the Curie temperature in Lavcs phase Fc-Hf alloys. The specimens were heat treated at 1000°C for 48 h. In the composition range between 32 and 34 at% HT, alloys have the Cl5 structure with a faint Cl4 type. Outside of this range. the structure is purely of the Cl4 type [70N I].
Table 8. Magnetic and related properties of FeHf, and FeHf,H, hydride [79 B 11.
Structure type a at RT [A] Magnetism 0 at 4.2 K under 9 kOe [G cm3 g- ‘1
T, WI IS (57Fe) relative to u-Fe at RT [mms-‘1 fe2qQ (“Fe) at RT [mm s- ‘1
FeHf,
Ti,Ni 12.04 Paramagnetic
-0.12 0.47
FeHf,H,
Ti,Ni 12.87 Ferromagnetic 10.8 73 0.285
Shiga
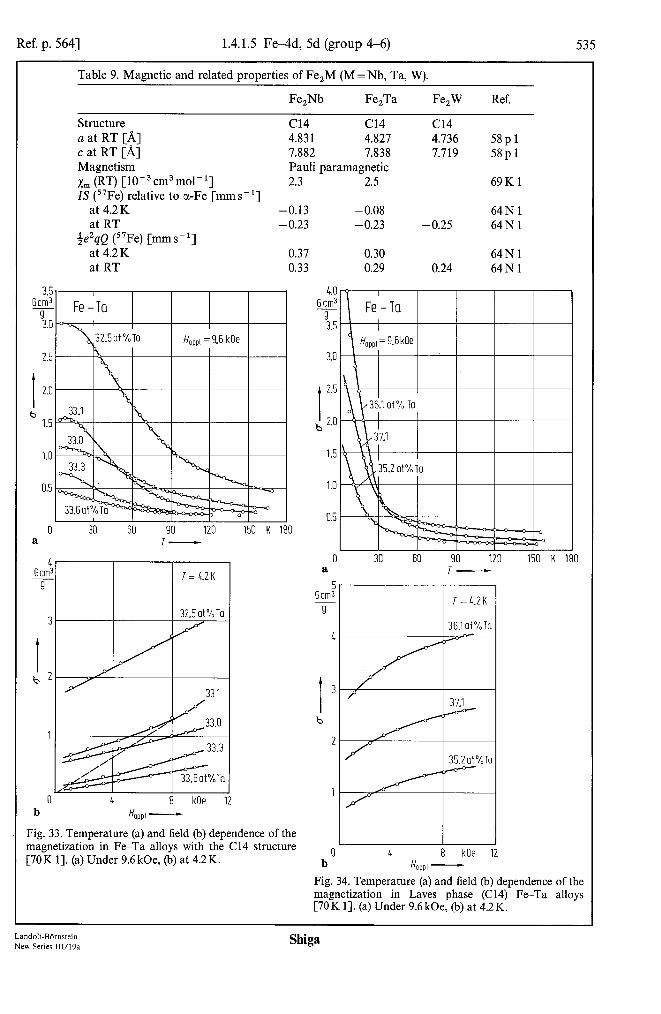
Ref. p. 5641 1.4.1.5 FewId, 5d (group 4-6) 535
Table 9. Magnetic and related properties of Fe,M (M = Nb, Ta, W).
Fe,Nb Fe,Ta Fe,W Ref.
Structure Cl4 Cl4 Cl4 a at RT [A] 4.831 4.827 4.736 c at RT [A]
58~1 7.882 7.838 7.719 58~1
Magnetism Pauli paramagnetic x,,, (RT) [10m3 cm3 mol-l] 2.3 2.5 69Kl IS (57Fe) relative to a-Fe [mm s- ‘1
at 4.2 K -0.13 -0.08 64Nl at RT - 0.23 -0.23 - 0.25 64Nl
+e’qQ (57Fe) [mms-‘1 at 4.2K 0.37 0.30 64Nl at RT 0.33 0.29 0.24 64Nl
a
Gcr s
I b
b
,I -
3-
2-
l-
L 0
~ ! T = C2 K
4 8 kOe H UPPI -
150 K 180
0 a
Fig. 33. Temperature (a) and field (b) dependence of the magnetization in Fe-Ta alloys with the Cl4 structure [70K 11. (a) Under 9.6 kOe, (h) at 4.2 K.
30 30 60 60 90 90 120 120 150 150 K K 180 180 T- T-
0 8 kOe b H OPPl -
Fig. 34. Temperature (a) and field (h) dependence of the magnetization in Laves phase (C14) Fe-Ta alloys [70 K 11. (a) Under 9.6 kOe, (h) at 4.2 K.
Landolt-Bbmstein New Series 111/19a
Shiga
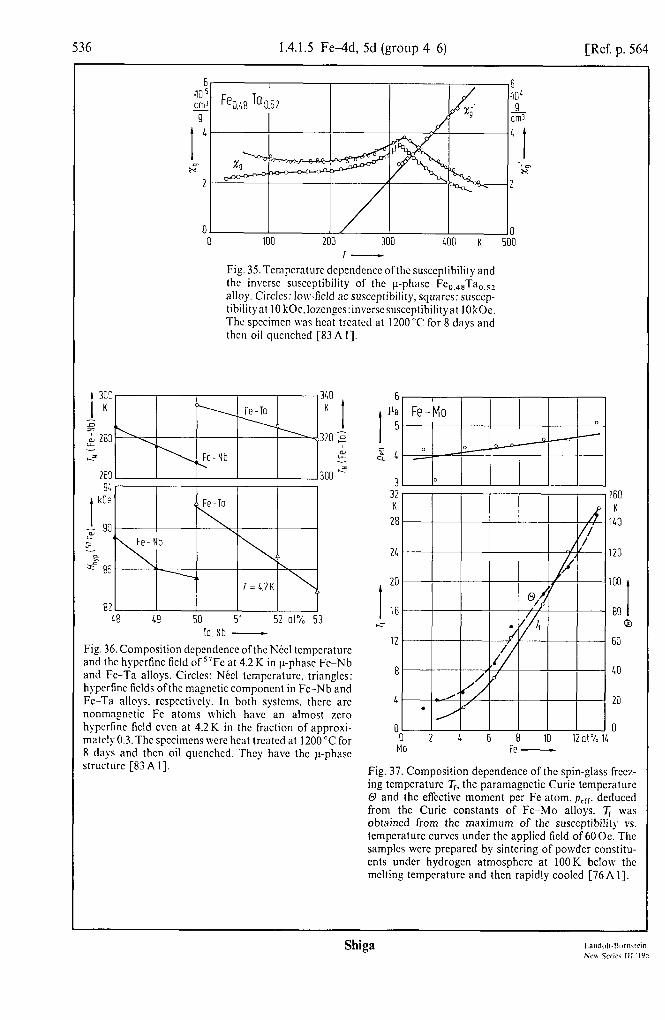
536 1.4.1.5 FeAd, 5d (group 4-6) [Ref. p. 564
E .lO.’ cm: T
I
L
rz” 2
Fig. 35. Tcmpcraturc dcpcndcncc ofthc susceptibility and the inverse susceptibility of the p-phase Fe,,,,Ta,,,, alloy. Circles: low-field ac susccptibilitp, squares: susccp- tibilityat 10 kOc,lozcnges:invcrsesusccptibilityat IOkOe. The spccimcn was hcnt trcntcd at 1200 “C for 8 days and then oil quenched [83A I].
82 68 50 51 52 at% 53
To.Nb -
Fig. 36. Composition dependence ofthc NCcl temperature and the hypcrfinc field of “Fe at 4.2 K in p-phase Fe-Nb and Fe-Ta alloys. Circles: N&l tempcraturc, triangles: hypcrtinc fields ofthc magncticcomponcnt in Fc-Nb and Fe-Ta alloys, rcspcctivcly. In both systems. there arc nonmagnetic Fe atoms which hnvc an almost zero hypcrfinc field even at 4.2K in the fraction of approxi- mately 0.3. The spccimcns were heat trcatcd at 1200 “C for 8 days and then oil quenched. They have the p-phase structure [83A I].
6
I
vs 5
g 1,
3: 160 K K 28 1LO
2L 120
I
20 100
16 80 I r-L 0
12 60
8 40
4 20
0 0 0 2 16 8 10 12ol% 11, MO Fe -
Fig. 37. Composition dependence of the spin-glass freez- ing tcmpcraturc T,, the paramagnctic Curie temperature 0 and the effcctivc moment per Fe atom. perr, deduced from the Curie constants of Fe-MO alloys. T, was obtained from the maximum of the susceptibility vs. temperature curves under the applied field of 60 Oe. The samples wcrc prcparcd by sintering of powder constitu- ents under hydrogen atmosphcrc at IOOK below the melting temperature and then rapidly cooled [76A I].

Ref. p. 5641 1.4.1.5 FeAd, 5d (group 4-6) 537
5 5 Cn \A/ 1
0 5 IO 15 20 25 30 K 35
Fig. 38. Temperature dependence of the susceptibility of Fe-W alloys under 0.1 kOe. The arrows indicate heating and cooling, respectively. The specimens were heat treated at 2280 “C for 3 h [SO K 11.
j-
l-
j-
I
a f
I I
(Fe,-,Alx)2Zr I
0.2 0.4 0.6 0.8 1.0 x- , 41
700- K
600
200 -
100 -
O- 0
b Fe
0 0.5 1.0 1.5 2.0 2.5 ot% 3.0 W Fe -
Fig. 39. Composition dependence of the spin-glass freez- ing temperature Tr of Fe-W alloys deduced from the maximum of I-- T curves (see Fig. 38). The specimens were heat treated at 2280°C for 3 h [8OK 11.
0.2 0.4 0.6 0.8 1.0 0
u.2 0.4 0.6 0.8 1.0 x- Al c Fe x- Al
350 kOe
250
50
Fig. 40. Composition dependence of the magnetic pro- perties of (Fe,-.$,),Zr alloys. Dashed lines indicate phase boundaries. (a) Magnetization per formula unit at 4.2 K, extrapolated to H,,,r = 0, at 30 kOe [77 M 11, at 70 kOe [Sl G 11. (b) Curie temperature. Open circles: [Sl G 11, solid circles: [77 M 11. (c) Mean hyperfine field I?,,, at 4.2K obtained by 57Fe Miissbauer effect [81 G 11.
Landolt-Bornstein New Series 111/19a
Shiga
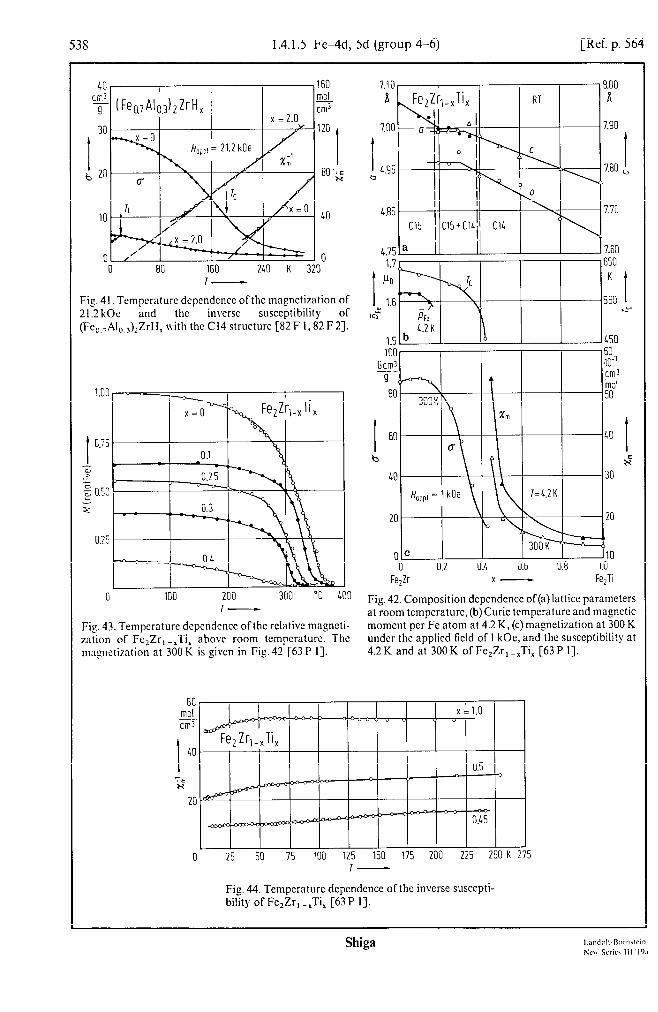
53s 1.4.1.5 FeAd, 5d (group 4-6) [Ref. p. 564
40 I
‘$ (FeQ7A10,3)2ZrH, 160 gol- cm3
, 0 80 160 2LO K 320'
Fig. 41. Temperature dcpcndcncc of the magctization of 21.2kOe and the inverse susceptibility of (Fc,,,~AI, ,),ZrH, with the Cl4 structure [S2 F I, 82 F 23.
0 100 200 300 "C 400 T-
Fig. 43. Temperature dependence ofthc relative magncti- zation of FczZr,-,Ti, above room tempcraturc. The magnetization at 300 K is given in Fig. 42 [63P I].
60 mol cm3
I 40
YE x 20
7nnLY - A!! 17.90
I k.85
I \I
Cl5 ' C15+ClJ
7.70
I I Cl4
1.75 a 17.60 1.7r I I I I 1650
1.6 \I I I
1.5lb .- 1 lb 1450 1001 I I I I 163-
9 (
80T t
LIIIJ - mol
300K\ 50
I 60 I
b x' 40
Fe,Zr x- Fe,5
Fig. 42. Composition dependence of(a)latt parameters at room tcmpcraturc, (b)Curic temperature and magnetic moment per Fe atom at 4.2 K, (c)magnetization at 300 K under the applied field of 1 kOe, and the susceptibility at 4.2 K and at 300 K of Fc,Zr, -,Ti, [63P 11.
25 50 75 100 125 150 175 200 225 250 K 275
Fig. 44. Temperature dependence of the inverse susccpti. bility of Fe,Zr, -,Ti, [63P I].
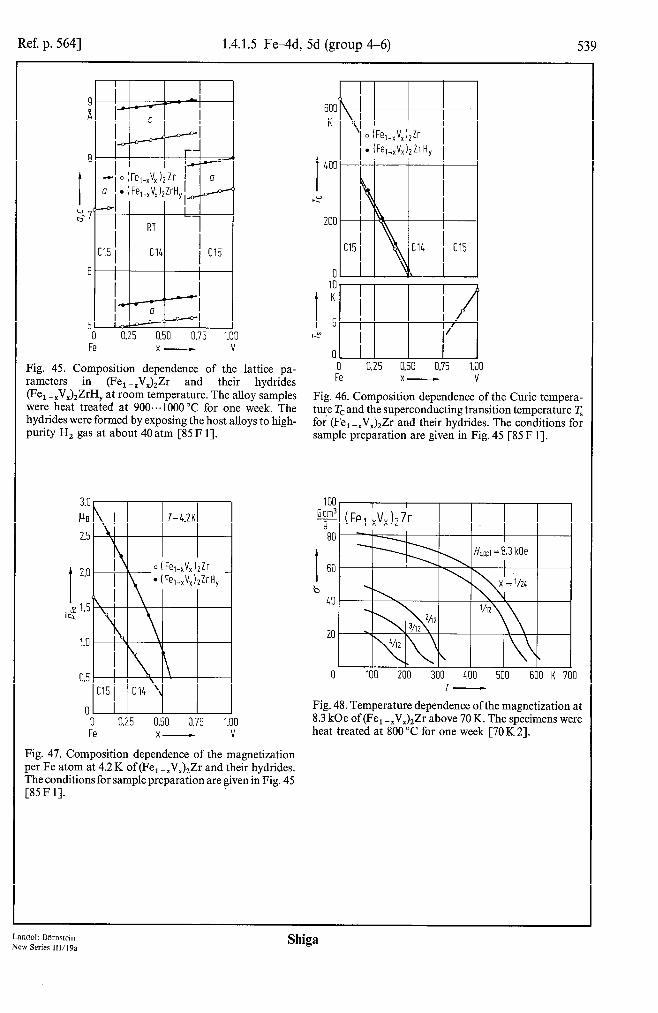
Ref. p. 5641 1.4.1.5 Fe-4d, 5d (group 4-6) 539
8
I g- 7
6
5 0 0.25 0.50 0.75 1
Fe x- .oo v
Fig. 45. Composition dependence of the lattice pa- rameters in (Fe,-XV,),Zr and their hydrides (Fe1 -XVX)2ZrH, at room temperature. The alloy samples were heat treated at 900...1000 “C for one week. The hydrides were formed by exposing the host alloys to high- purity H, gas at about 40 atm [85 F 11.
2.J ‘Y o ( Fe,.,V,)2Zr I
1.5
1.0
0.5
0 0 0.25 0.50 0.75 1.00 Fe x- V
Fig. 47. Composition dependence of the magnetization per Fe atom at 4.2 K of (Fe1 -XV,),Zr and their hydrides. The conditions for sample preparation are given in Fig. 45 [85 F 11.
600 K
i
0 0.25 0.50 0.75 1.00 Fe x- V
Fig. 46. Composition dependence of the Curie tempera- ture Tc and the superconducting transition temperature T, for (Fe, -XVX)sZr and their hydrides. The conditions for sample preparation are given in Fig. 45 [85 F I].
100 I I
y (Fej_xVx)2Zr 80 -k;
60
b 40
0 100 200 300 400 500 600 K 700 I-
Fig. 48. Temperature dependence of the magnetization at 8.3 kOe of (Fe, -XV,),Zr above 70 K. The specimens were heat treated at 800 “C for one week [70 K 21.
Land&Bbmstein New Series 111/19a
Shiga

540 1.4.1.5 Fe-4d, 5d (group 4-6) [Ref. p. 564
4.5 .10-f
3 T
3.5
3.C
I 2.F
x" 2s
1.E
1.1
0.i
[ 500 K t
I-
6
Fig. 49. Tempcraturc dependence ofthc susceptibility and the inverse susceptibility of(Fc, -IV,)2Zr. The spccimcns were heat trcntcd at 800°C for one week [70K 21.
2.51 1 I / , I 125
cm3
1.5 15 I 7, x
* 1.0 10
0.5 5
0 0 0 M 100 150 200 250 K 300
I-
Fig. 50. Temperature dcpcndence of the susceptibility of (Fc, 2V,,)zZr and its hydride. The sample was prepared by the same method as in Fig. 45 [8S F 11.
I .., ,
I I I 18.175 u
I I ./ I I I 8.125
0.2 0.4 0.6 0.8 1.0 Fe,Zr x- Cr, Zr
Fig. 51. Composition dcpcndcnce ofvarious properties of (Fc, -,Cr,)2Zr and their hydrides. (a) Lattice parameters at room temperature [70 K 21. (b) Curie temperature. Solid circle: [79 M I]. open circles: [70K 23. open squares: [8OJ I], solid squares: hydrides [8OJ I]. (c) Magnetic moment per formula unit, solid circle: [79 M I] at 4.2 K and H-0, open circles: [70 K 23 at H = 8.3 kOe. extrapolated to T=O, open and solid squares: [SO J I] at 4.2 K cxtrapolatcd to l/H,,,, = 0, and the susceptibility at 290K. triangles: [70K 23. open and solid lozenges: [80 J I].

Ref. p. 5641 1.4.1.5 FeAd, 5d (group 4-6) 541
80 Gcm3
9
t
60
b 4o
20
0 4
100 200 300 400 500 K 600 I-
Fig. 52. Temperature dependence of the magnetization at 8.3 kOe of (Fe1 -$&),Zr [70 K 21.
I I I 4.! JO- cm' 9
3.F
3.1
I 2.5
x” 2s
1.5
1.0
0.5
0
Fig. 53. Temperature dependence ofthe susceptibility and the inverse susceptibility of (Fe,-.Cr,),Zr with the Cl4 structure [70 K 21.
I b
Fig. 54. Temperature dependence of the magnetization 0 12kOe and the inverse susceptibility of
~edh.J2ZrH, W J 11.
Landolt-Bbmstein New Series llVl9a
Shiga
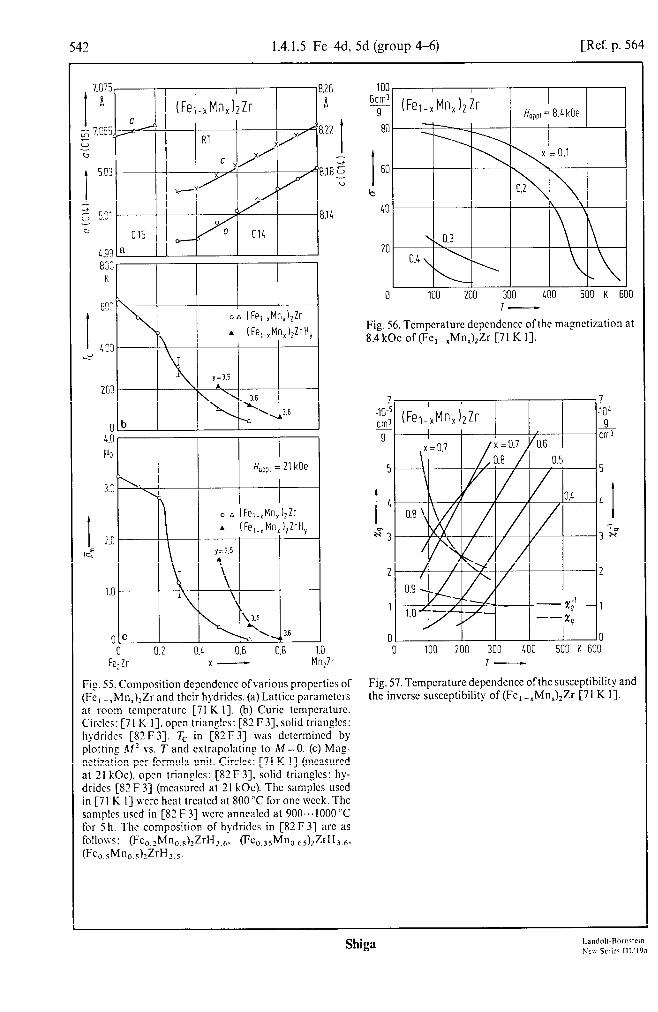
542 1.4.1.5 Fe-4d, 5d (group 4-6) [Ref. p. 564
83Zr I I I I I
Kl I I I I I 6;;
/ of (Fe,.,Mn,),Zr
>
403
\
A (Fe,.,Mn,),ZrH,
e
ObJ --f 4.0 Ps
3.0
I 2.0 16
1.0
0 I ( 0
Fe,Zr
II I o A (Fe,.,Mn,),Zr A (Fe,., Mn, ),ZrH,
I \
\ 3.6 z
-T*. ‘Y 3.6
0.2 0.4 0.6 0.8 1.0 _ x- Mn,fr
Fig. 55. Composition depcndcncc ofvarious propcrtics of (Fc, _,hln,&Zr and their hydrides. (a) Lattice parameters at room tcmpcrature [71 K I], (b) Curie tcmpcrature. Circles: [71 K I]. open trinnglcs: [82 F 31, solid triangles: hydrides [82 F 33. Tc in [82 F3] was dctcrmincd by plottin: Al’ vs. T and estrapolating to M=O. (c) Mag- ncti7ntion per formula unit. Circles: [7l K I] (mcasurcd at 21 kOc). open trian_clcs: [82F3]. solid triangles: hy- drides [Q F 33 (mcasurcd at 21 kOc). The samples used in [7l K I] were heat trcatcd at 800°C for one week. The samples used in [8:! F 31 lvcrc annealed at 900...1000 “C for 5 h. The composition of hydrides in [82 F 31 arc as follow: (Fc,,?Mn,,,)2ZrI-I,,,. ~c,,,,Mn,,,s)~Zrl~I~,~, 0% sh~n,,s)JrH3.s.
I 60 \. \
b
40
1 I
0 100 200 300 400 500 K I
Fig. 56. Tempcraturc depcndcncc ofthc magnetization at 8.4 kOe of (Fe, -rMnr)2Zr [7l K I].
7 40 f cm3 9
5
I
4
g3
i (Fe,-xMn,)2Zr -,-;k 5
4 I
7.7 3x
2
1
II I I I I 0 100 200 300 400 500 K 60:
T-
Fig. 57. Temperature dependence ofthc susceptibility and the inverse susceptibility of (Fe, -xMn,),Zr [71 K I].
Shiga

Ref. p. 5641 1.4.1.5 FewId, 5d (group 4-6)
55Mn in (Fe,-,Mn, ),Zr
120 160 200 MHz
55Mnin(Fe1-,Mn,)2Zr I error
I
40 80 120 160 MHz 200 Y-----r
Fig. 58. Temperature dependence of the magnetization and the inverse susceptibility of (Fe,,,Mn,.,),Zr and its hydrides at 21 kOe [82 F 11.
l- I I n n
I 40 50 60 70 80 MHz 90
c Y-
Fig. 59. Zero-field NMR spin-echo spectra of (Fe, -xMn,),Zr [Sl Y 11. (a) 55Mn spin-echo spectra for x 5 0.3 at 15 K, (b) 55Mn spin-echo spectra for 0.4 5 x 50.6 at 1.5 K, (c) 91Zr spin-echo spectra for xs 0.3 at 15K.
Landolt-Bbmsrein New Series 111/19a
Shiga
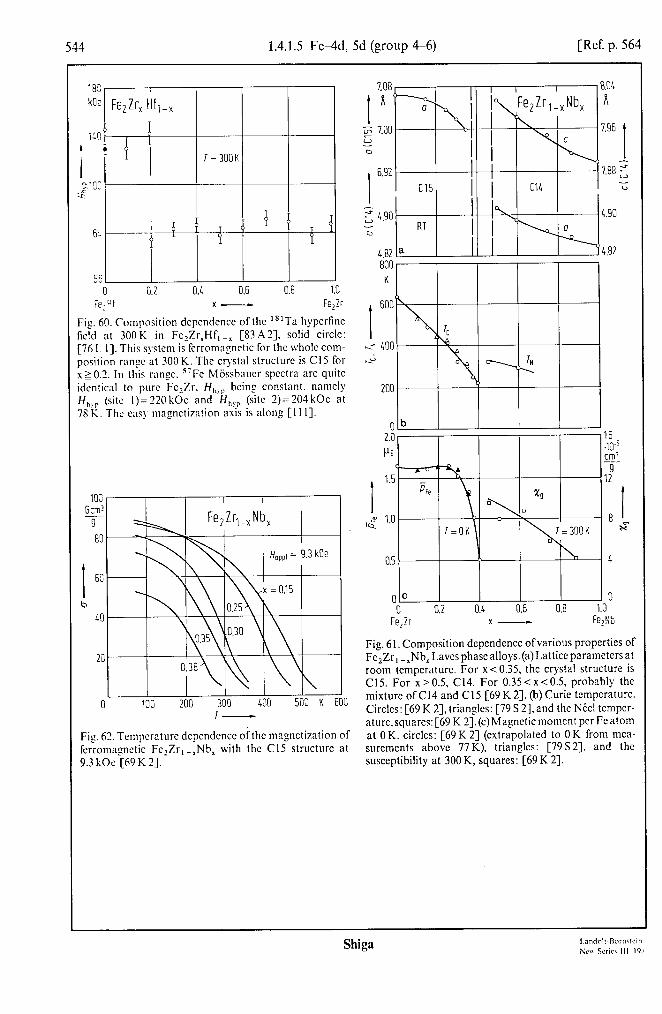
544 1.4.1.5 Fe-4d, 5d (group 4-6) [Ref. p. 564
0 0.2 0.4 0.6 0.8 1.0 Fe,Hf x- Fe,Zr
Fig. 60. Composition dcpcndencc of the “‘Ta hypcrfinc field at 300K in FczZr,Hf, -I [83A2], solid circle: [76 L I]. This system is ferromagnetic for the whole com- position ransc at 300 K. The crystal structure is Cl5 for st 0.2. In this range. “Fc h4iissbaucr spectra arc quite - idcntlcal to pure Fc,Zr. H,,,, being constant, namcl) H (‘1‘ l)=22OkOc and Hh!p (site 2)=204kOc at 7;:. 4),: easy mngncti7ntion axis is along [I I I].
I I I I Fe@-, Nb,
1 6?
b 40
I I I 0 100 200 300 400 500 K 600
T-
Fig. 62. Temperature dcpcndencc oithc magnetization of fcrromn_rnctic Fe&-,Nb, with the Cl5 structure at 9.3 kOc [69 K 21.
7.08, I I ,8.01
OC n 0.4 0.6 0.8
x- Fe,Elb
Fig. 61. Composition dependence ofvarious properties of Fe,Zr,_,Nb,Lavcsphascalloys.(a)Latticeparametcrsat room tempcraturc. For ~~0.35, the crystal structure is Cl5. For x>O.5, C14. For 0.35<x<O.5, probably the mixture of Cl4 and Cl 5 [69 K 21. (b) Curie temperature. Circles: [69 K 23, triangles: [79 S 21, and the N&cl tempcr- aturc,squarcs:[69K 2].(c)Magncticmomcnt per Featom at OK, circles: [69K 21 (extrapolated to OK from mca- surcmcnts above 77 K), triangles: [79S2], and the susceptibility at 300 K, squares: [69 K 21.
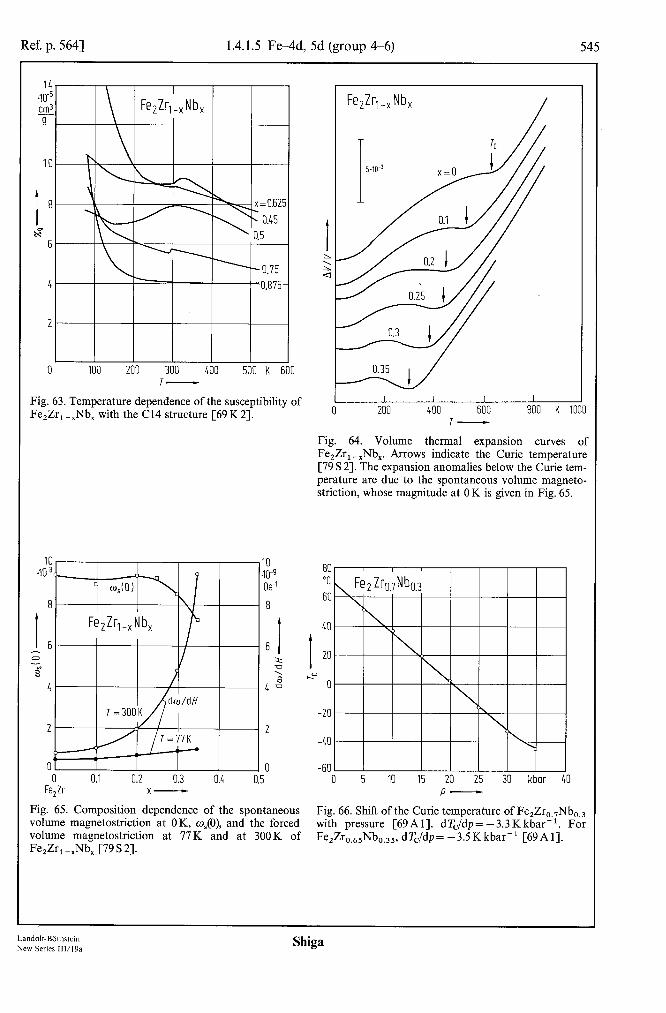
Ref. p. 5641 1.4.1.5 Fe-4d, 5d (group 4-6) 545
100 200 300 400 500 K 600 7-
Fig. 63. Temperature dependence of the susceptibility of Fe,Zr, -,Nb, with the Cl4 structure [69 K 21.
2
0 0 0.1 0.2 0.3 0.4
IO 10-g OF’
8
t
2
0
0 I I I I
200 LOO 600 800 K 1000 7-
Fig. 64. Volume thermal expansion curves of Fe,Zr, -,Nb,. Arrows indicate the Curie temperature [79 S 21. The expansion anomalies below the Curie tem- perature are due to the spontaneous volume magneto- striction, whose magnitude at 0 K is given in Fig. 65.
Fe,Zr,-, Nb,
801 I I I I I I
-601 I I I I I I I I 0 5 IO 15 20 25 30 kbar 40
P- Fe,Zr x-
Fig. 65. Composition dependence of the spontaneous Fig. 66. Shift of the Curie temperature of Fe,Zr,,,Nb,,, volume magnetostriction at OK, w,(O), and the forced with pressure [69Al]. dTJdp= -3.3Kkbar-‘. For volume magnetostriction at 77 K and at 300K of Fe2-W.65Nbo.35~ dTc/dp=-3.5Kkbar-’ [69Al]. Fe,Zr, -,Nb, [79 S 21.
Landolt-Bornctein New Series 111/19a
Shiga
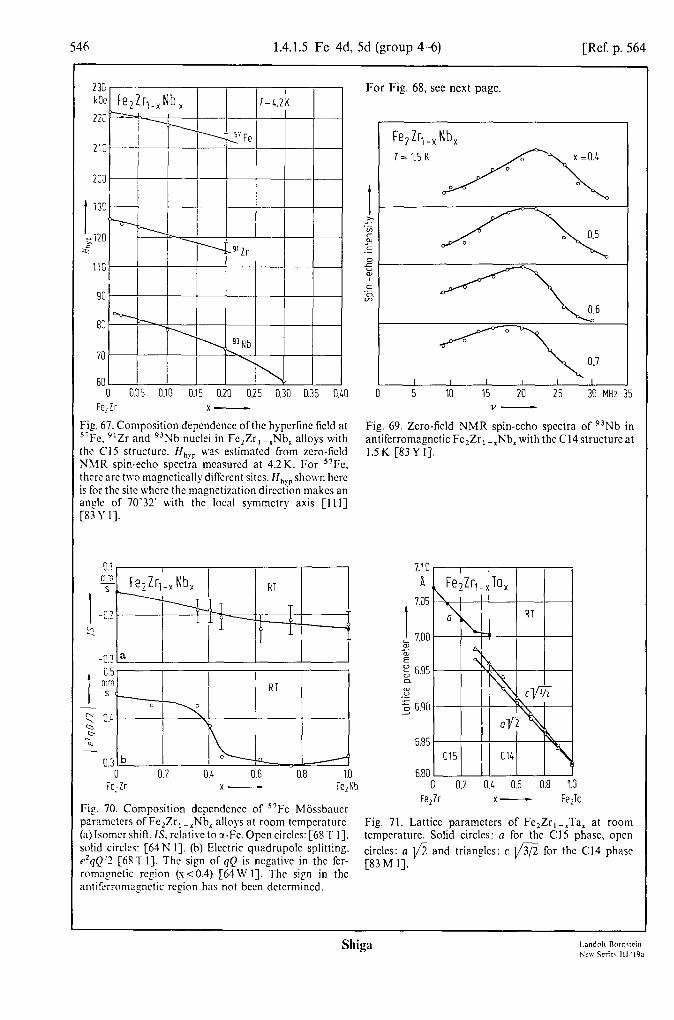
1.4.1.5 Fe-4d, 5d (group 4-6) [Ref. p. 564
239 kOe Fe,Zr,-,Nb x I= 4.2;
I
I 130
,120 s”
110
90
83
70
60 0 0.05 030 a.15 0.20 0.25 0.30 0.35 0.40
Fe,Zr x-
Fig. 67. Composition depcndencc ofthc hypcrlinc field at “Fe. “Zr and g3Nb nuclei in FezZr, -,Nb, alloys with hc Cl5 structure. W,,, ~‘as estimated from zero-field \IhlR spin-echo spectia measured at 4.2K. For “Fe, .hcrc arc two magnetically diffcrcnt sites. Hhyp shown here s for the site where the maenetization direction makes an mgle of 70-32’ with the local symmetry axis [I 1 I] :s3\i 1-J.
p c,
-0.3 a 0.5
m I -, s < AT
0 - 0 Y 0.4 CY \ e %J -
0.3 b 0 0.2 0.4 0.6 0.8 1.0
Fe, Zr x- Fe,Nb
Fig. 70. Composition dependence of 57Fe Miissbaucr parameters of Fe,Zr, -,Nb, alloys at room tcmpcrature. :a) Isomer shift. IS. relative to a-Fc. Open circles: [68 T I].
For Fig. 68, see next page.
Fe+-,-, Nb, l= 1.5 K
To.7 I I I I I I 5 IO 15 20 25 30 MHz
Ir-
Fig. 69. Zero-field NMR spin-echo spectra of g3Nb in antifcrromagnctic Fe,Zr, -,Nb, with the C14 structure at ISK [83Y I].
0 0.2 0.4 0.6 0.8 1.0 Fe,Zr x- &To
Fig. 71. Lattice parameters of Fe,Zr,-,Ta, at room temperature. Solid circles: a for the Cl5 phase. open
jolid circles: [64 N I]. (I-J) Eicctric quadrupolc splitting. v2qQ’2 [68T I]. The sign of qQ is ncgativc in the fcr-
circles: a fi and triangles: c 1/3/2 for the Cl4 phase
romngnctic region (x ~0.4) [64W 11. The si!n in the [83 M I].
lntifcrromagnetic region has not been dctcrmmed.
Shiga

Ref. p. 5641 1.4.1.5 FewId, 5d (group 4-6) 547
mm/s
Fig. 68. 57Fe Miissbauer spectra of antiferromagnetic Fe,Zr, -,Nb, alloys with the Cl4 structure at 4.2 K and hyperfine field distribution curves, P(Hhyp) [SON 11.
1.5
C 0 0 0.25 0.50
Fe,Zr x-
Fig. 12. Composition dependence of the spontaneous magnetization per Fe atom at 4.2K and the Curie temperature of Fe,Zr, -,Ta, [83 M 11.
Fig. 73. Volume thermal expansion of Fe,Zr,-,Ta,. Arrows indicate the Curie or the Ntel temperature. Expansion anomalies below T, are due to the sponta- neous volume magnetostriction o, [83 M 11. w
I-
O
I 0 50 100 kOe 150
I I I
200 400 600 K I r-
Landolt-Bdrnstein New Series 111/19a
Shiga

548 1.4.1.5 FeAd, 5d (group 4-6) [Ref. p. 564
I G; u D
Fe,!r x- FezTo I s
Fif. 74. Composition dcpcndcncc of the spontaneous 2 volume magnetostriction q at 0 K [83 M I]. 0
63: K
50:
I
4OC
,303
EC
103
0
1.6
I 1.2 ,g
0 OS 0.2 0.3 Fe:Zr x-
Fig. 76. Composition dcpcndcncc of the Curie tcmpcra- ture and the magnetic moment per Fe atom of fcr- romngnctic Fe2Zr, -=Mo, with the Cl5 structure at IO kOc cstrapolatcd IO T=O [74 I I].
H ( 1 Fe2Zr,-XMoX 1
7.08 8.1 1
s L
7.06 7.9 z
7.OL 7.7
I II I OW” I I
0 0.2 0.4 0.6 0.8 1.0 Fe,Zr x- k,KO
Fig. 75. Composition dependence of the lattice param- etcrs of Fe,Zr, -.Mo, at room temperature [74 I l]
&ppl = 10 kOe
I 60
b 40
&pg-qJ
Ob 0 100 200 300 400 500 K 600
I-
Fig. 77. Tcmpcraturc dcpcndcncc of the ma_rnctization of Fc,Zr, -xMo, at IO kOc with (a) the Cl 5 structure and (b) the Cl4 structure [741 I].

Ref. p. 5641 1.4.1.5 FeAd, 5d (group 4-6) 549
0 0 0.25 0.50 0.75 1.00
Fe,Hf x- FezTa
Fig. 78. Magnetic phase diagram ofFe,Hf, -xTa, with the Cl4 structure. For x=0.15 and 0.2 ferromagnetic-anti- ferromagnetic+paramagnetic transitions take place with increasing temperature [83N 11. T,: ferro- to antifer- romagnetic transition temperature.
Gcm3 9 Y
cm3
I 40 1.6 I 30 1.2 b Ts
20 0.8
IO 0.4
0 0 0 100 200 300 400 500 K 600
T-
Fig. 79. Temperature dependence ofthe magnetization at H appl= 5 kOe and the inverse susceptibility of Fe,Hf,,,Ta,,, [83 N 11. T,: ferro- to antiferromagnetic transition temperature.
60 Gcm3
9 50
I 40
b 3o
IO 20 30 40 50 60 kOe 70
H VP1 - Fig. 80. Magnetization curves of Fe,Hf,.,Ta,,, (C14) at various temperatures. The antiferromagnetic to ferro- magnetic transition takes place above 150 K [83 N 11.
150 kOe
125
25
Fig. 81. Magnetic phase diagram (T-H diagram) of Fe,Hfe.sTa,., and Fe,Hfe,s,Ta,.,, [83 N 11.
0 100 150 200 250 300 350 K 400
T-
Land&Bbmstein New Series 111/19a
Shiga
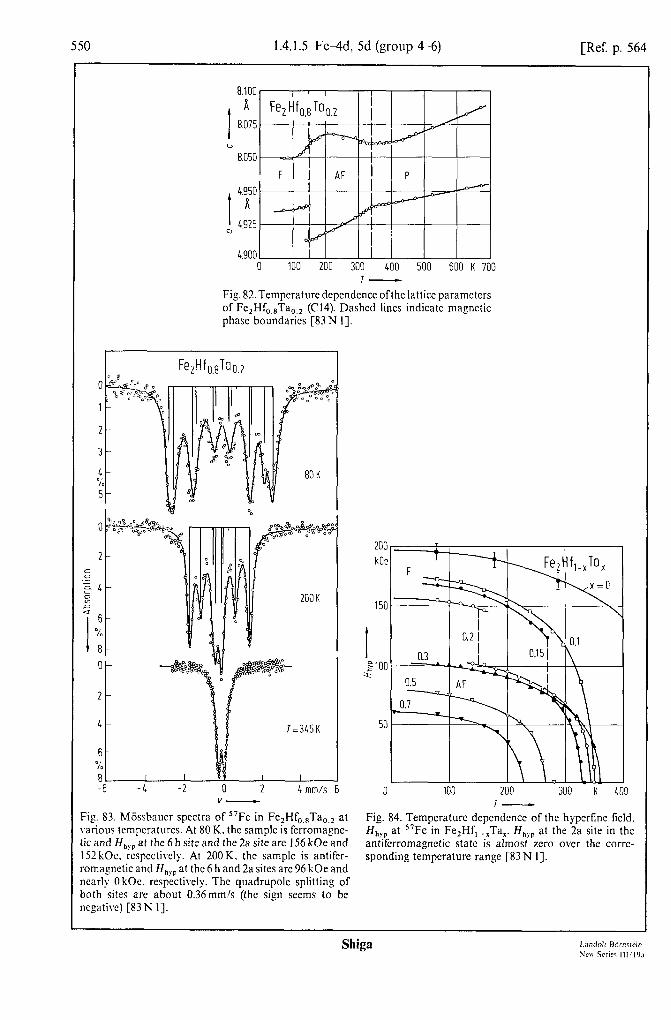
550 1.4.1.5 Fe-4d, 5d (group 4-6) [Ref. p. 564
8.075
c, 8.050
4.900 I I I 0 100 200 300 400 500 600 K 700
Fig. 82. Tempcraturc dependence ofthc lattice parameters of FezHfO,,Ta,,, (Cl4). Dashed lines indicate magnetic phase boundaries [83 N I].
0
2
6 % 8 -6 -4 -2 0 2 4 mm/s 6
V-
Fig. 83. Mdssbauer spectra of “Fe in Fc,Hf,,,Ta,,, at b’arious temperatures. At 80 K. the sample is fcrromagne- !ic and Hh!p at the 6 h site and the 2a site are I56 kOe and 157 kOc. respectively. At 200 K, the sample is antifcr- romagnetic and H,,, at the 6 h and 2a sites are 96 kOe and nearly OkOe. respectively. The quadrupole splitting of both sites are about 0.36mm!s (the sign seems to be wgative) [83 N 11.
0 1DU 200 300 K 4;O T-
Fig. 84. Tempcraturc depcndencc of the hypcrfinc held. Hhyp at “Fe in Fe,Hf,-,Ta,. Hhrp at the 2a site in the antifcrromagnetic state is almost zero over the corrc- sponding tempcraturc range [83 N I].
Shiga

Ref. 5641 p. 1.4.1.6 Co, NiAd, 5d (group 4-6) 551
1.4.1.6 Co and Ni alloys and compounds Many types of intermetallic compounds are found but magnetic properties are scarcely known. Supposedly,
most of them will be nonmagnetic. Among them, Laves phase compounds of Co are fairly well studied. Only off- stoichiometric Co 2 + ,Zr is weakly ferromagnetic.
Survey
Alloy Composition Property Fig. Tab.
Co, -xZrx 0.23 Ix -- IO.34 44 8.5 0.25$xiO.31 Tcc4 &i(x) 85 0.25, 0.263 4n x, ‘UT 86 0.283 2 x 5 0.337 xg(T) 87
(Fe1 -xCox)2Zr OIx10.7 a, c’, XHF, T,, 0, peff 10 -- Y> K,yp, dT,ldp> as do/dH
04x<l.O 88 --
44, T,(x), 44 01X10.5 -- C) 89, 91 0.6~~~1.0 x,(T) 90 0.5~~~0.8 W) 92 01x10.8 AK0 94 -- 05x60.4 d4WG XHFtX) 95 x=0.5 dH)> A~P’W) 96 01x11.0 &/T vs. T= 97 -- o<x<o.7 ME, PW,,,) 98 -- 0~~~0.8 0.015x 5 1.0
FFec;o$~hyp’“’ 99 100, 101
01x10.2 ‘lZr NMR 102 -- 0% -xCox)2+,Zrl -,, 0.5~~~0.8 o(H) 92
y=o.o3 x=0.6 4~1, T,(Y), 4~) 93
-0.05jy~O.15 Co,Hf, a, pco, T,, xg 11
0) 104 Co, -,Hf, 0.29l~x~O.341 4x), x,( T> 103 (Fe1 JW2Hf osxs 1.0 -- PFe -CO(~), R,,,(x) 105 Co,Ta, a, xg 11 Co, -xTa, 0.275x50.36 44 106
0.255 2 x IO.398 -- X&% 47 106 Co,Nb, a, xgT PC~ 11 Co, -xM~, 05x60.6 phase diagram, T,(x) 107
OIx10.03 -- &4 108 co1 -xwx 01x10.8 -- phase diagram, T,(x) 107
o<x<o.o4 108 -- m Ni,Zr, Xm Y, @D 12
x,(T) 109 x,(T) G%6OK) 110
Ni, -xM~, o<x<o.o5 &4 T,(x) 111 -- 0.18~~~1.0 xg(T) 112 O~x~O.1 -- W 113
Ni, -xW, OIx10.06 -- PM T,(x) 111
Landolt-Biirnstein New Series 111/19a
Shiga

552 1.4.1.6 CoP4d, 5d (group 4-6) [Ref. p. 564
7.oc H
I
6.95
6.90
I
Co-Zr L “, B
6.85
!I.!
~~~~
22 2L 26 28 30 32 at% 34 Zr -
Fig. 85. Composition dcpcndencc ofvarious propertics of cubic Lavcs phase Co Zr alloys. (a) Lattice parameter at room temperature [Sl F 21. (b) Curie temperature. Open circles: [81 F 21. solid circles: [72A I]. (c) Spontaneous magnetic moment per Co atom at 4.2K. Open circles: [S I F 21. solid circles: [72A I]. The samples in [S I F 21 were heat treated at l250...13OO”C for 5 h and then quenched
35, / , 4 I
01 / 0 50 100 150 200 250 K :
1.5 loc 9 :m3
!.5
!.O I yg
1.5
1.0
3.5
3 I
7.1c 8
I- 1 Fe,-, C0,)J.r
\
,- c Rl
7.OE
I 7.0: 0
6.9t
601
I &= 4OI
L?
201
I! I- 3
l= L2K
I 121
Gem 9
I
El
b”
41
C
0 0.2 0.4 0.6 0.8 1.0 Fe, lr x- CqZr
Fig. 88. Composition dependence ofvarious properties of cubic Laves phase (Fe I -,CoJ2Zr. (a) Lattice parameter at room tcmpcrature [79 M l],(b) Curie temperature Tc and the spin-glass freezing temperature T, [79 M I]. Dashed line indicates the Curie temperature of as-cast samples [82 W I]. (c)Spontaneous magnetization at 4.2 K [79 M I. 79 M 21. The samples used in [79 M I, 79 M 23 were heat treated at 1100°C for 48 h. See also Table IO.
Fis. 86. Temperature dcpcndencc ofthc magnetization at 21.1 kOc and the inverse susceptibility for ZrCo, with x=2.8 (26.3atX Zr) and x=3.0 (25.0at% Zr) [8l F2].

Ref. p. 5641 1.4.1.6 CoAd, 5d (group 4-6) 553
0.8
Fig. 87. Temperature dependence of the magnetic susceptibility for the 28.3...33.7 at% Co-Zr alloys [72A 11.
Table 10. Magnetic and related properties of (Fe, -.$oJzZr [79 M 1, 80 M 21.
x=0.0
a at RT [A] 7.074 CT at 4.2K [Gcm3g-‘1 88.2 xHF at 4.2K [10-6cm3g-‘] 3 Tc WI 630 @ L-K1 643 Peff CPBI 3.07 y [ergmol-’ Km21 13.0 Hhyp (57Fe), mean 212
at 4.2K [kOe] Axis of easy Cl111
magnetization dTc/dp [K kbar-‘1 - 22) co, at OK [10m3] 10 dw/dH at 4.2K [lo-” Oe-‘1 4.6
‘) Spin-glass freezing temperature. ‘) [73 B 11. 3, [69A 11.
x=0.2 x=0.3 x=0.4 x=0.5 x=0.6 x=0.7
7.052 7.037 7.026 7.015 7.005 6.993 78.6 68.8 52.9 3 8 50
504 422 275 50 ‘) 25 ‘) 12 ‘) 527 433 316
3.09 3.14 3.1 3.11 17.2 23.6 40.4
192 174 146 94 72 43
cw cw cw
- 6.6 3) 9.3 6.1 4.2 4.5 9.2 78
Landolt-BBmstein New Series 111/19a
Shiga

554 1.4.1.6 CoAd, 5d (group 4-6) [Ref. p. 564
0 LOO 600 K I T-
Fig. 89. Tempcraturc dependence of the magnetization of (Tel -$oJzZr at H,,,, = 9.96 kOe [79 M 21.
0 20 10 60 K 80 T-
2.0 a4 @ 9 1.5
I -1.0 H
0.5
c 0 50 100 150 200 K 250
T-
Fig 90. Temperature dependence of the susceptibility of (Fc, -$o,),Zr at 8.2 kOe [79 M I].
CC;;;3 x = 0.5 9 +/C-.--
_---
LO /’
/-
/ 35
30 1=4.2K
- (Fe,.,C0,)~2r _
-- (bCox~d-~.~7
1-1 I I I I 0.6 1 b
20
0 10 20 30 40 50 kOe 60 H WI -
Fig. 91. Temperature dependence of the magnetization of Fig. 92. Magnetization curves of(Fe, -$o,),Zr (full lines) mictomagnctic (Fc,,,Co,,,)2Zr (annealed sample) and (Fc, -rCox)2,03Zr,,97 (broken 1incs)at 4.2 K [79 M 1). [79 h4 I]. Curve I: cooled at zero field and measured at 0.3 kOe; 2: cooled and measured at 0.3 kOe; 3: after cooled at zero field. applied 10 kOe at 4.2 K and mcasurcd at 0.3 kOe; 4 and 5: zero-held cooled. mcasurcd at 1.3 kOe and IO kOe, respectively.
Shiga

Ref. p. 5641 1.4.1.6 CoAd, 5d (group 4-6) 555
Fig. 94. Thermal expansion curves of (Fe,-$o,),Zr. Arrows indicate the Curie temperature. Dashed curves are the estimated thermal expansion due to unharmonic lattice vibrations. The difference between solid and dashed curves corresponds to the spontaneous volume magnetostriction [80 M 21.
102r------ H
7.00
t 6.98 0
6.96
6.94
tL I Gc;
I I I I I Gcm3
9 9 t t 60 60
b b 40 40
Y- Fig. 93. Composition dependence ofvarious properties of (Fe,,,Co,,,),+,Zr, -y [79 M 11. (a) Lattice parameter at room temperature, (b) Curie temperature, (c) magnet- ization at 4.2 K under H,,,, = 30 kOe.
0 0 - 0.08 - 0.08 -0.04 -0.04 0 0 0.04 0.04 0.08 0.08 0.12 0.12 0.16 0.16
Y- Fig. 93. Composition dependence ofvarious properties of (Fe,,,Co,,,),+,Zr, -y [79 M 11. (a) Lattice parameter at room temperature, (b) Curie temperature, (c) magnet- ization at 4.2 K under H,,,, = 30 kOe.
600 K
I
400
2 200
0 ^^
Fig. 95. Composition dependence of the forced volume magnetostriction, dm/dH, at 4.2 K, 77 K and 290 K of (Fe, -$o,),Zr [SO M 23. Solid circles indicate the high- field susceptibility xHF at 4.2 K [SO M 21.
14, .lO-3 (I%-,Co,)2Zr
I 1 I I Tc I /
I 8
7 a
6
0 150 300 450 600 750 K 900 I-
80 .1o-l’c OF’
70
60
I I I I i
- OAV dw/dH I . XHF
:0 IO-5 cm3
ss” 3
30
I
I
/’ T=290K/
/ 77K/
25
20 I
x
15
10
5
0 0 0.1 0.2 0.3 0.4 0.5
F+Zr x-
Landolt-Bdmstein New Series 11~1%
Shiga
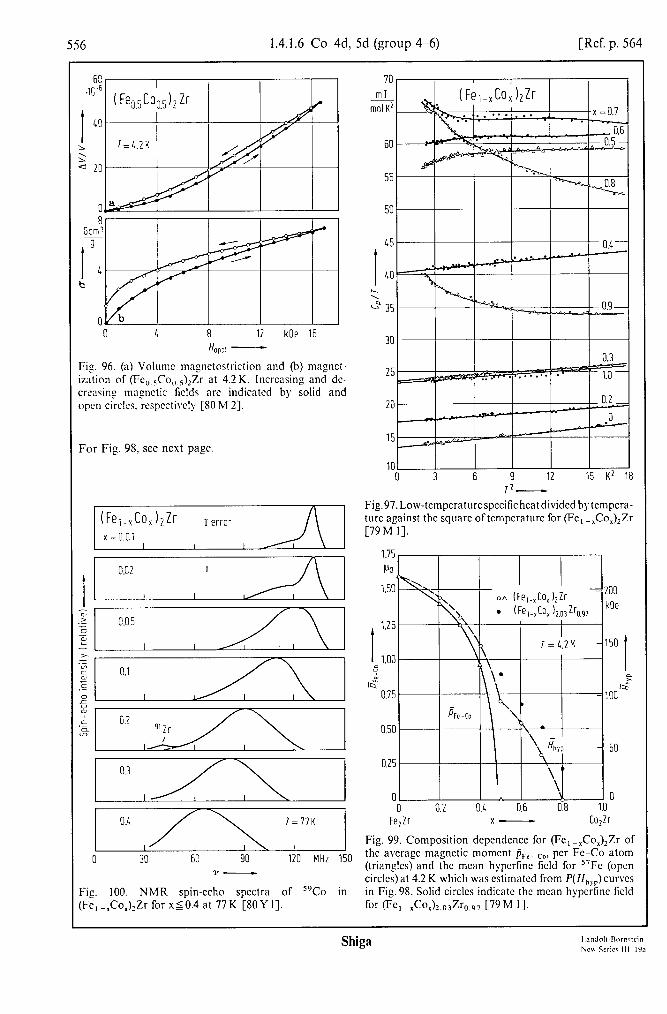
556 1.4.1.6 Co-4d, 5d (group 4-6) [Ref. p. 564
0 8 12 kOe 16 H OPP! -
Fig. 96. (a) Volume mnyctostriclion and (b) magncl- i7ation of (Fe, Jo,,)& at 4.2 K. Increasing and dc- crcasins mnsnctic fxlds arc indicated by solid and open circles. respcctivcly [8O M 21.
For Fig. 9S, see next pag
(FeiwxCox)2Zr I error x = 0.01
I I I
0.3
I
0.i
I 0 30 60 90 120 MHz 150
1' -
-ig. 100. NMR spin-echo spectra of “Co in Fe,_,Co,),Zr for x50.4 at 77K [8OY I].
70 ml
mol K2
60
20
15
101 I I I I I 0 3 6 L.- 12 15 K2 18
Fig.97. Low-temperature specific heat divided by tempera- ture against the square of tcmpcraturc for (Fc, -xCo,),Zr [79 M I].
0.50
0.25
0
200 kOe
0.2 OX 0.6 0.8 1.0 Fe,Zr x- Co,Zr
Fig. 99. Composition dcpcndence for (Fc, -Jo,),Zr of the avcragc magnetic moment &c-c0, per Fe-Co atom (triangles) and the mean hypcrfine field for “Fc (open circles) at 4.2 K which was estimated from P(H,,,)curvcs in Fig. 98. Solid circles indicate the mean hypcrfinc field for (Fe, -xCo,hZro.97 [79 M 11.
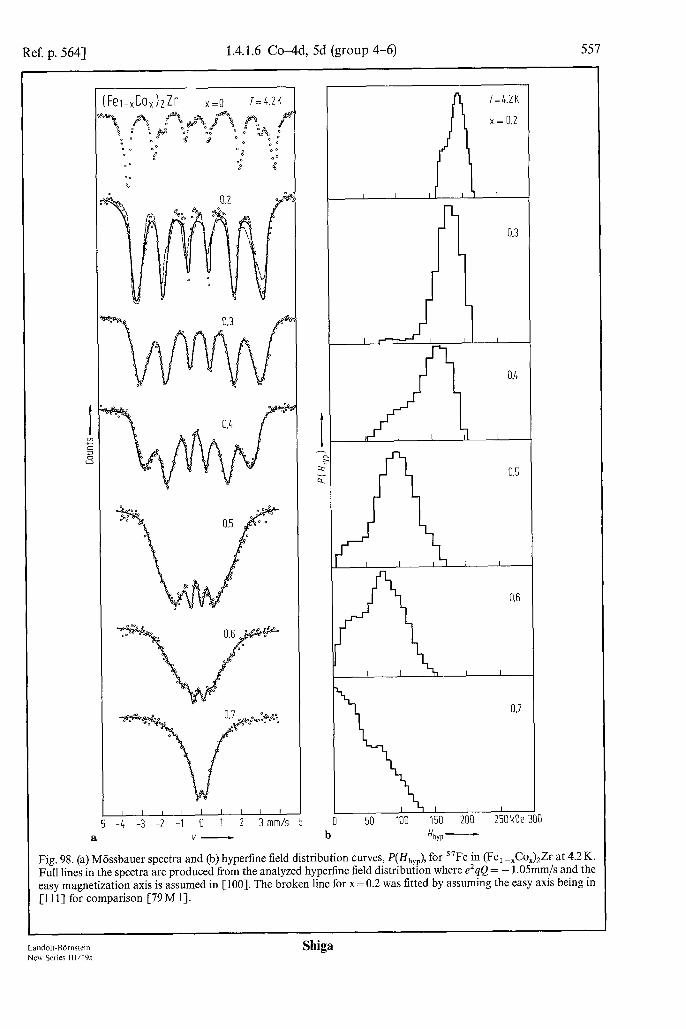
Ref. p. 5641 1.4.1.6 CoAd, 5d (group 4-6) 557
I I I I I I I I t -5 -4 -3 -2 -1 0 1 2 3 mm/s 5
a V-
0.7
I I I 50 100 150 200 250 kOe
bp - 0
b
T=4.2K
x = 0.2
;i
0.6
I I I I
Fig. 98. (a) M&batter spectra and (b) hyperfine field distribution curves, P(Hhyp), for 57Fe in (Fe, -,Co,),Zr at 4.2 K. Full lines in the spectra are produced from the analyzed hyperfine field distribution where e2qQ = - l.O5mm/s and the easy magnetization axis is assumed in [loo]. The broken line for x=0.2 was fitted by assuming the easy axis being in [l 111 for comparison [79 M 11.
Landolt-B6mstein Shiga New Series 111/19a

558 1.4.1.6 Co-4d, 5d (group 4-6) [Ref. p. 564
1.0 v=lOMHz 2
lrIzzJ 1
0 7 8 9 10 11 kOe 13
6 1.0 H -0 - WP’
L
2
0 El 0 50 100 MHz 150
a H,-,! - b Y- r
Fig. 101. NMR spin-echo spectra of 5gCo in (Fe, -$o,),Zr for x>= 0.5 at 4.2K [8OY I]. (a) At IOMHz. (b) In zero field.
1 Fig. 102. NMR spin-echo spectra of ‘lZr in (Fe, -$o,),Zr for x 5 0.2 at 4.2 K [81 W 11. The positions ofthe lines due to diffcrcnt Fe, Co neighborhoods of”Zr
0 are indicated by vertical bars, labeled with the respective 20 2L 28 32 36 40 LL 48 MHz 52 number of Fe and Co atom in the neighborhood.
Y-
I.andol!-Rorncrein Ncu- Series 111/19a

Ref. p. 5641 1.4.1.6 CoAd, 5d (group 4-6) 559
Table 11. Magnetic and related properties of certain intermetallic compounds of Co-Hf, Co-Ta, and Co-Nb [82 B 11. For the compounds not showing magnetic ordering, the Pauli susceptibility is given instead of PC0 and Tc
Compound Structure a “) A
Tc PC~ K PB
XP . 10m6 cm3 g-l
Co,Hf Co,Hf C%,Hf, Co,Hf
Co,Ta Co,Ta Co,Nb Co,Nb
Cl5 Cl5 Th6M%3 hexagonal
Cl5 Cu,Au Cl5 Cl5
6.896 6.833
11.502 5.477 ‘) 8.070 “) 6.761 6.788 6.773 6.717
- 7.8 40 0.12
499 0.66 600 1.14
- 12 - 10 - 7
0.17
‘) a, in hexagonal plane. ‘) c, along hexagonal axis. 3, RT.
7.0
I
8,
6.9 D
6.8 27 28 29 30 31 32 33 34 at% 35
a Hf -
8 Oogo*Q 0 0 “&“*O #*cl, go@ 0 .O 0.
O*“@w 32.8
@New @.O& @ +
po*Q 4 34.1 at% Hf
0 50 100 150 200 250 K 300 b T-
Fig. 103. (a)Lattice parameter at room temperatureand (b) temperature dependence of the susceptibility of cubic Laves phase Co-Hf alloys [73A 11. The samples were annealed at 1000 “C for 6 days and then water quenched.
Landolt-BOrnstein New Series lll/l9a
Shiga
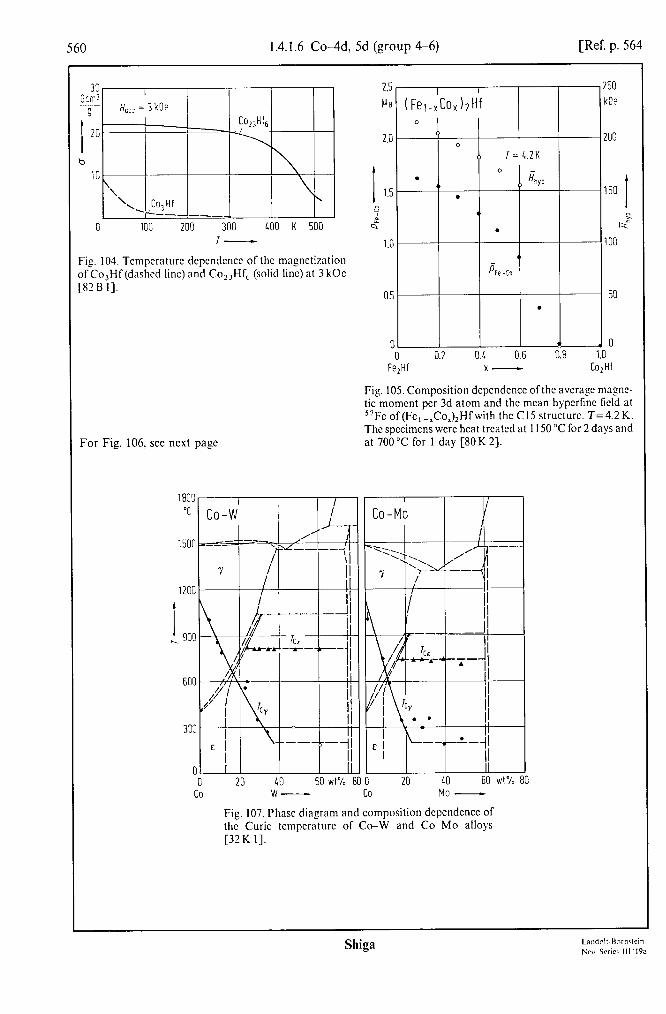
560 1.4.1.6 Co-4d, 5d (group 4-6) [Ref. p. 564
I __ 9 H,;,,= 3 kOe
I . 20
b
10
\ ‘\ Co,Hf
\
.’ ---___ 0 100 200 300 100 K 500
I-
Fig. 103. Tcmpcraturc dcpcndcncc of the magnetization af Co,Hf (dashed line) and Coz,Hf, (solid lint) at 3 kOc [SZ B I-J.
For Fig. 106, see next page
0 20 40 60 wt% t co w-
2.5 PB
2.0
I 1.5 ”
I%
1.0
0.5
[
FI
I I I I 250 250
( Fe,mxCox 12Hf ( Fe,mxCox 12Hf kOe kOe
0 0
0 0 200 200 0 0
0 0 I= 4.2K I= 4.2K 0 0
. . 0 0 ,) ,)
HhYP HhYP 150 150 . .
I I ,I ,I
z z . . IX IX
100 100 4, 4,
4, -co 4, -co
50 50 . .
.O .O 0.2 0.2 0.4 0.4 0.6 0.6 0.8 0.8 1.0 1.0
?,Hf x- Co,Hf
Fig. 105. Composition dependence ofthc avcragc ma_ene- tic moment per 3d atom and the mean hypcrfine ficld at “Fc of (Fc, -$o,),Hf with the Cl5 structure. T=4.2 K. The specimens were heat treated at I I50 “C for 2 days and at 700°C for I day [80 K 21.
0 20 LO 60 wt% 80 co MO -
Fig. 107. Phase diagram and composition dcpcndcncc of the Curie temperature of Co-W and CO-MO alloys [32 K I].
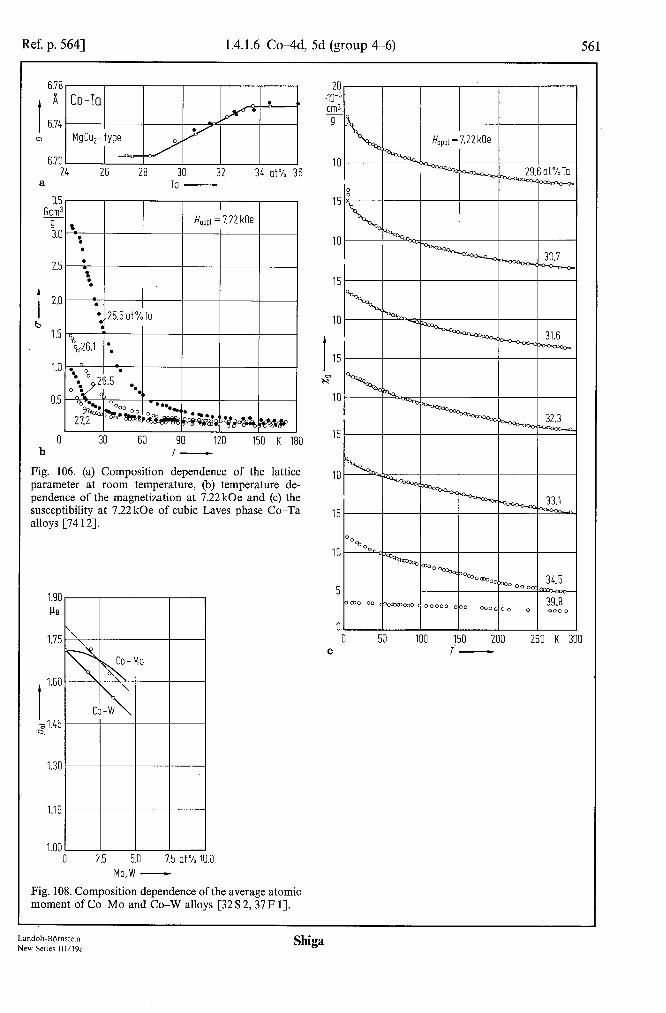
Ref. p. 5641 1.4.1.6 CoAd, 5d (group 4-6) 561
6.78
I
A
6.74 b
6.70 24 26 28 30 32 34 at% 36
a
3.c gclj
9 3.c
2.E
1 2s
b 1.5
1.0
0.5
0 b
Ta -
30 60 90 120 150 K 180 T-
Fig. 106. (a) Composition dependence of the lattice parameter at room temperature, (b) temperature de- pendence of the magnetization at 7.22 kOe and (c) the susceutibilitv at 7.22 kOe of cubic Laves phase Co-Ta alloys [74 I i].
t
1.60
,$.45
0 2.5 5.0 7.5 at% 10.0 Ma,W -
Fig. 108. Composition dependence of the average atomic moment of CO-MO and Co-W alloys [32 S 2,37 F 11.
IO
I 15
H"
IO
15
IO
15
IO
5
50 250 K 300
Landolt-Bdmvein New Series lWl9a
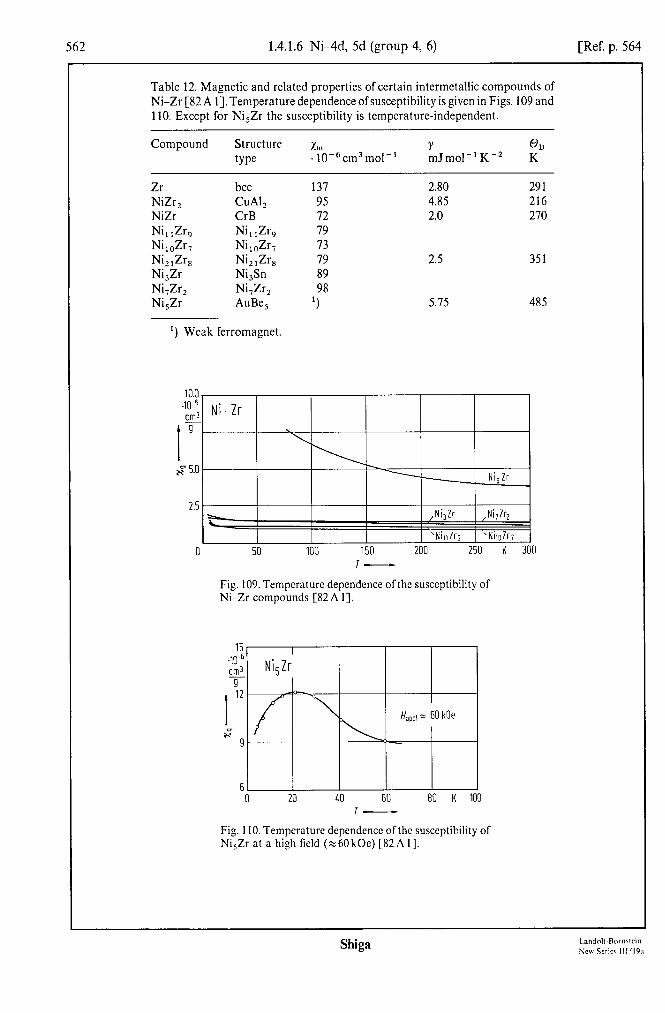
562 1.4.1.6 Nihld, 5d (group 4, 6) [Ref. p. 564
Table 12. Magnetic and related properties of certain intermetallic compounds of Ni-Zr [82 A 11. Temperature dependence of susceptibility is given in Figs. 109 and 110. Except for Ni,Zr the susceptibility is temperature-independent.
Compound Structure xrn type . 10e6 cm3 mol- ’
Zr bee 131 NiZrz CuAlz 95 NiZr CrB 72 Ni, ,Zr, Ni, ,Zr, 79 Ni,,Zr, Ni,,Zr, 13 Ni,,Zr, Ni,,Zr, 19 Ni,Zr Ni,Sn 89 NiiZr, Ni,Zr, Ni ,Zr AuBe, 1p8
‘) Weak ferromagnet.
Y @D mJmol-’ K-* K
2.80 291 4.85 216 2.0 270
2.5 351
5.75 485
10.0 4-6
3
I
Y
x” 5.0
2.5
0 50 100 150 200 250 K 300 T-
Fig. 109. Tempcraturc dependence ofthc susceptibility of Ni -Zr compounds [82A I].
15 .10-6 cm3 - 9
I 12
w’ H9
6 0 20 40 60 80 K 100
Fig. I IO. Tempcraturc dependence ofthc susceptibility of Ni,Zr at a high field (z60kOe) [82A I].
Shiga

Ref. p. 5641 1.4.1.6 NiAd, 5d (group 4, 6) 563
lz
0.6 ""600 k K 0
0.4 400
f Ni-W
0.2 200
Ni Mo.W - Ni Mo,W -
Fig. 111. Composition dependence of the average atomic moment and the Curie temperature of Ni-Mo and Ni-W alloys [32 S 1, 37 M 11.
I I I I I I c
1.0 e----Mo
0.5 I 0 300 600 900 1200 "C 1500
T-
Fig. 112. Temperature dependence of the susceptibility of Ni-Mo alloys with 18...lOOwt% MO for heating process. Arrows indicate phase boundary temperatures. T,: a-phase (fee) occurs. TP (x860 “C), TY (z91O”C) and T6 (c 1350 “C) correspond to the peritectic temperatures of, respectively, the P-phase (Ni,Mo), y-phase (Ni,Mo) and g-phase (NiMo). Ta (z 1350 “C) is the eutectic tempera- ture .between aLphase -and g-phase: For alloys with less than 60 wt% MO. Axp, which is shown in the figure, has been added in order to avoid crossing curves [38 G 11.
600 meVW2
Ni MO -
Fig. 113. Composition dependence of the spin-wave stifiess constant D at 4.2 K of Ni-Mo alloys [78 H 21.
Land&BOrnstein New Series 111/19a
Shiga

561 Rcfcrcnces for 1.4.1
5Sh I 5Spl
65el 69~1 8’fl
32K 1 37Sl 37F 1 37hl 1 38G I 54 11’ 1 63 P 1 64B 1 64 B 2 64N 1 64 W 1 65B I 66H 1 66K 1 67B I 67L 1 68A I 65 A 2 6SK 1 68-I-l 69Al 69K 1 69 K 2 70Bl 70K 1 70K2 7ON 1 71Kl 72Al 72Cl 73Al 73B 1 741 I 7412 75D I
7511 76A I 76Cl 76F1 76L 1 77K 1
1.4.1.7 References for 1.4.1
General references
Hansen. M.: Constitution of Binary Alloys, New York: McGraw-Hi!! Inc. 1958. Pearson, W.B.: A Handbook of Lattice Spacings and Structures of Metals and Alloys, London:
Pergnmon Press 1958. Elliott. R.P.: Constitution of Binary Alloys, 1st. supp!., New York: McGraw-Hill Inc. 1965. Shunk. F.A.: Constitution of Binary Alloys, 2nd. suppl., New York: McGraw-Hill Inc. 1969. Fischer. K.H., in: Landolt-Biirnstein. New Series (Hellwege, K.H., Olsen, J.L.. eds.), Berlin: Heidelberg.
New York: Springer, vol. 1% (1982) 289.
Special references
Koster. W., Tonn. W.: Z. Metallkd. 24 (1932) 296. Sadron. C.: Ann. Phys. Ser. 10, 17 (1932) 371. Farcns. T.: Ann. Phys. Ser. 11, 8 (1937) 146. Marinn. V.: Ann. Phys. Ser. 11, 7 (1937) 459. Grube. G.. Winklcr. 0.: Z. Elcctrochcm. 44 (1938) 423. Wilhelm, H.A.. Carlson. O.N.. Dickinson. J.M.: Trans. AIME 200 (1954) 915. Piqger, E.. Craig. R.S.: J. Chcm. Phys. 39 (1963) 137. Betsuyaku. H.. Komura. S., Betsuyaku, Y.: J. Phys. Sot. Jpn. 19 (1964) 1262. Booth. J.G.: Phys. Status Solidi 7 (1964) K 157. Nevitt. M.V., Kimball. C.W., Preston. R.S.: Proc. ICM, Nottingham 1964, p. 137. Werthcim. G.K.. Jaccarino, V., Wernick, J.H.: Phys. Rev. A 135 (1964) 151. Bu!yfcnko. A.K.. Gridncv, V.N.: Fiz. Met. Mctallovcd. 19 (1965) 205. Helmgcr. F.: Phys. Kondcns. Mater. 5 (1966) 285. Koehler. W.C.. Moon, R.M.. Trcgo. A.L., Mackintosh, A.R.: Phys. Rev. 151 (1966) 405. Bruckner. W.. Kleinstuck. K., Schulzc. G.E.R.: Phys. Status Solidi 23 (1967) 475. Lam. D.J.. Spokas. J.J., Van Ostenburg. D.O.: Phys. Rev. 156 (1967) 735. Abel, A.W., Craig. R.S.: J. Less-Common Met. 16 (1968) 77. Arajs, S.: J. App!. Phys. 39 (1968) 673. Kai. K.. Nakamichi. T., Yamamoto, M.: J. Phys. Sot. Jpn. 25 (1968) 1192. Tanaka, M.. Ito. N., Tokoro, T., Kanematsu, K.: J. Phys. Sot. Jpn. 25 (1968) 1541. Alfieri. G.T., Banks. E., Kanematsu, K.: J. Appl. Phys. 40 (1969) 1322. Kai, K.: Dr. Thesis. Tohoku Univ. 1969. Kancmntsu. K.: J. Phys. Sot. Jpn. 27 (1969) 849. Bender, D.. Muller. J.: Phys. Kondens Mater. 10 (1970) 342. Kai. K.. Nakamichi. T., Yamamoto, M.: J. Phys. Sot. Jpn. 29 (1970) 1094. Kanemntsu, K.. Fujita. Y.: J. Phys. Sot. Jpn. 29 (1970) 864. Nakamichi. T., Kai, K.. Aoki. Y., Ikedn, K., Yamamoto, M.: J. Phys. Sot. Jpn. 29 (1970) 794. Kancmatsu. K.: J. Phys. Sot. Jpn. 31 (1971) 1355. Aoki. Y., Nakamichi. T., Yamamoto, M.: Phys. Status Solidi (b) 53 (1972) K 137. Callings, E.W., Ho, J.C., Jaffee, R.I.: Phys. Rev. B5 (1972) 4435. Aoki. Y., Nakamichi, T., Yamamoto, M.: Phys. Status Solidi 56 (1973) K 17. Brouha. M.. Buschow, K.H.J.: J. App!. Phys. 44 (1973) 1813. Itoh. K.. Fujita. Y., Kanematsu, K.: J. Phys. Sot. Jpn. 36 (1974) 1024. Itoh. H., Aoki. Y.. Nakamichi, T., Yamamoto, M.: Z. Metallkd. 65 (1974) 149. DufTcr, P.. Sankar. S.G.. Rao. V.U.S.. Bergner, R.L., Obcrmyer, R.: Phys. Status Solidi (a) 31 (1975)
655. Ikeda. K., Nakamichi. T.: J. Phys. Sot. Jpn. 39 (1975) 963. Amamou. A., Caudron. R.. Costa. P., Friedt. J.M., Gautier, F., Loege!, B.: J. Phys. F6 (1976) 2371. Callings, E.W.. Smith. R.D.: J. Less-Common Met. 48 (1976) 187. Fukamichi. K.. Saito. H.: J. Jpn. Inst. Metals (in Japanese) 40 (1976) 22. Livi, F.P., Rogers, J.D.. Viccaro, P.J.: Phys. Status Solidi (a) 37 (1976) 133. Kimura. Y.: Phys. Status Solidi (a) 43 (1977) K 141.

References for 1.4.1 565
77Ml 78Hl 78H2 78Pl 78P2 79Bl 79Kl 79K2
79Ml 79M2 79Sl 7982 8OJl 80Kl 80K2 80Ml 80M2 80Nl 8OSl 8OVl
8OYl 81Fl 81F2 81Gl 81Pl 81Vl
81V2 81Wl 81Yl 82Al
82Bl 82Fl 82F2 82F3 82Wl 83Al 83A2
83Hl 83Ml 83Nl 83Yl 85Fl
Muraoka, Y., Shiga, M., Nakamura, Y.: Phys.‘ Status Solidi (a) 42 (1977) 369. Hafstrom, J.W., Knapp, G.S., Aldred, A.T.: Phys. Rev. B 17 (1978) 2892. Hennion, M., Hennion, B.: J. Phys. F8 (1978) 287. Pop, I., Coldea, M., Rao, V.U.S.: Phys. Status Solidi (a) 49 (1978) 207. Pan, Y.M., Bulakh, I.Ye., Shevchenko, A.D., Latysheva, V.I.: Fiz. Met. Metalloved. 46 (1978) 741. Buschow, K.H.J., van Diepen, A.M.: Solid State Commun. 31 (1979) 469. Khan, H.R., Kobler, U., Luders, K., Raub, Ch.J., Szucs, Z.: Phys. Status Solidi (b) 94 (1979) K27. Kozhanov, V.N.,Romanov,Ye.I?, Verkhovskiy, S.V., Stepanov, A.P.: Fiz. Met. Metalloved 48 (1979)
1249. Muraoka, Y., Shiga, M., Nakamura, Y.: J. Phys. F9 (1979) 1889. Muraoka, Y.: Thesis submitted to Kyoto Univ. 1979. Shavishvili, T.M., Meskhishvili, A.I., Andriadze, T.D.: Fiz. Met. Metalloved. 47 (1979) 880. Shiga, M., Nakamura, Y.: J. Phys. Sot. Jpn. 47 (1979) 1446. Jacob, I., Davidov, D., Shaltiel, D.: J. Mag. Magn. Mater. 20 (1980) 226. Krischel, D., Thomas, L.K.: J. Phys. F 10 (1980) 115. van der Kraan, A.M., Gubbens, P.C.M., Buschow, K.H.J.: J. de Phys. 41 (1980) C 1-189. Marchenko, V.A., Polovov, V.M.: Zh. Eksp. Teor. Fiz. 78 (1980) 1062 [Sov. Phys. JETP 51(1980) 535-J. Muraoka, Y., Shiga, M., Nakamura, Y.: J. Phys. F 10 (1980) 127. Nakamura, Y., Shiga, M.: J. Mag. Magn. Mater. 15-18 (1980) 629. Strom-Olsen, J.O., Wilford, D.F.: J. Phys. F 10 (1980) 1467. Verkhovskiy, S.V., Kozhanov, V.N., Stepanov, A.P., Romanow, Ye.P., Galoshina, E.V.: Fiz. Met.
Metalloved. 49 (1980) 1234 [Phys. Met. Metallogr. (USSR) 49, No. 6 (1981) 941. Yamada, Y., Ohmae, H.: J. Phys. Sot. Jpn. 48 (1980) 1513. Fujii, H., Pourarian, F., Sinha. V.K., Wallace, W.E.: J. Phys. Chem. 85 (1981) 3112. Fujii, H., Pourarian, F., Wallace, W.E.: J. Mag. Magn. Mater. 24 (1981) 93. Grossinger, R., Hilscher, G., Wiesinger, G.: J. Mag. Magn. Mater. 23 (1981) 47. Pourarian, F., Fujii, H., Wallace, W.E., Sinha, V.K., Smith, H.K.: J. Phys. Chem. 85 (1981) 3105. Verkhovskiy, S.V., Kozhanov, V.N., Stepanov, A.P., Shevchenko, A.D., Pan, V.M., Bulakh, Lye.: Fiz.
Met. Metalloved. 49 (1981) 553 [Phys. Met. Metallogr. (USSR) 49 No. 3 (1981) 911. Vincze, I., van der Woude, F., Scott, M.G.: Solid State Commun. 37 (1981) 567. Wiesinger, G., Oppelt, A., Buschow, K.H.J.: J. Mag. Magn. Mater. 22 (1981) 227. Yamada, Y., Ohira, K.: J. Phys. Sot. Jpn. 50 (1981) 3569. Amamou, A., Kuentzler, R., Dossmann, Y., Forey, P., Glimois, J.L., Feron, J.L.: J. Phys. F 12 (1982)
2509. Buschow, K.H.J.: J. Appl. Phys. 53 (1982) 7713. Fujii, H., Pourarian, F., Wallace, W.E.: J. Less-Common Met. 88 (1982) 187. Fujii, H., Pourarian, F., Wallace, W.E.: J. Mag. Magn. Mater. 27 (1982) 215. Fujii, H, Sinha, V.K., Pourarian, F., Wallace, W.E.: J. Less-Common Met. 85 (1982) 43. Wiesinger, G., Hilscher, G.: J. Phys. F 12 (1982) 497. Ahmed, MS., Hallam, G.C., Read, D.A.: J. Mag. Magn. Mater. 37 (1983) 101. Akselrod, Z.Z., Budzynski, M., Khazratov, T., Komissarova, B.A., Kryukova, L.N., Reiman, S.I.,
Ryasny, G.K., Sorokin, A.A.: Hyperfine Inter. 14 (1983) 7. Hirosawa, S., Pourarian, F., Sinha, V.K., Wallace, W.E.: J. Mag. Magn. Mater. 38 (1983) 159. Muraoka, Y., Shiga, M., Nakamura, Y.: Phys. Status Solidi (a) 78 (1983) 717. Nishihara, Y., Yamaguchi, Y.: J. Phys. Sot. Jpn. 52 (1983) 3630. Yamada, Y., Ohira, K.: J. Phys. Sot. Jpn. 52 (1983) 3646. Fujii, H., Okamoto, T., Wallace, W.E., Pourarian, F., Morisaki, T.: J. Mag. Magn. Mater. 46 (1985)
245.
Landolt-Bbrnstein New Series 111/19a
Shiga
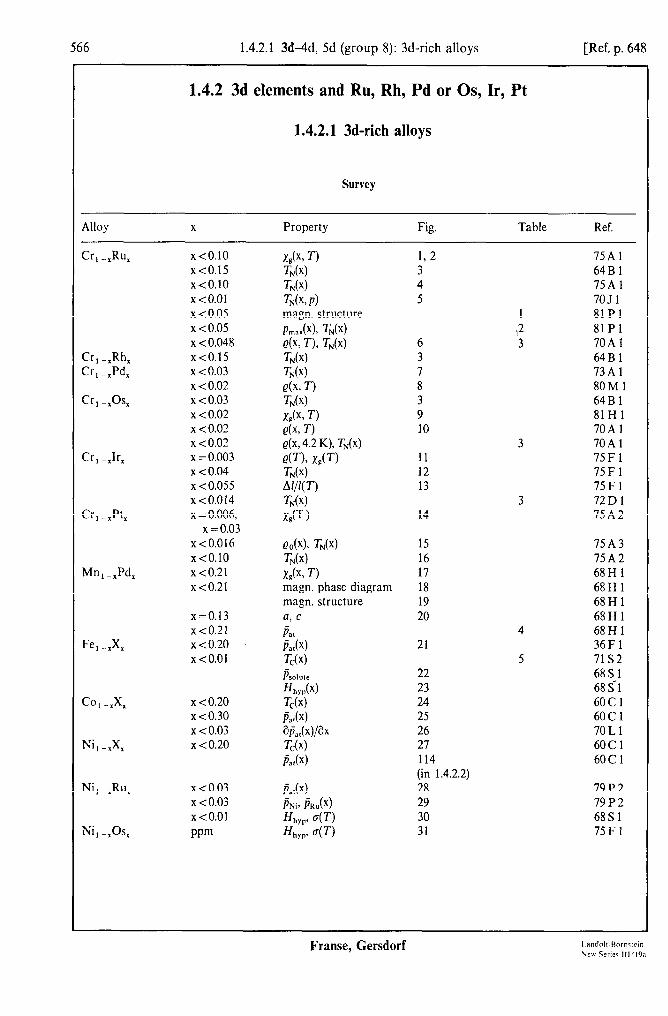
1.4.2.1 3d-4d, 5d (group 8): 3d-rich alloys [Ref. p. 648
1.4.2 3d elements and Ru, Rh, Pd or OS, Ir, Pt
1.4.2.1 3d-rich alloys
Survey
Alloy X Property Fig Table Ref.
Cr, -,Ru,
Cr, -,Rh, Cr, -,Pd,
Cr, -%os,
Cr, -Jrr
Crl -,Pt,
Mn, -xPd,
Fe, -A
co, -A
Nil -A
Ni, -,Ru,
Ni, -IOs,
x<O.lO x<o.15 x<O.lO x <O.Ol x < 0.05 x < 0.05 x < 0.048 x<o.15 x <0.03 x < 0.02 x < 0.03 x < 0.02 x < 0.02 x < 0.02 x = 0.003 x < 0.04 x <0.055 x<o.o14 x = 0.006,
x =0.03 x<O.O16 x<O.lO x <0.21 x<o.21
x=0.13 x<o.21 x <0.20 x<O.Ol
x <0.20 x <0.30 x < 0.03 x < 0.20
x < 0.03 x < 0.03 x<O.Ol PPm
x& T) 1, 2 75Al TN(X) 3 64Bl TN(X) 4 75A1 TNk PI 5 7051 magn. structure 1 81 Pl ~maxC4 TN(X) l-2 81Pl ek T), TN(x) 6 3 70A1 TN(x) 3 64B1 TN(x) 7 73Al e(x> 7-j 8 80M 1 TN(X) 3 64Bl x&x, 7-1 9 81Hl eh T) 10 70A 1 ek 4.2 W, TN(x) 3 70Al e(T), x,(T) 11 75Fl TN(x) 12 75Fl WT) 13 75Fl T,(x) 72D 1 X&T 1 14 75A2
edx), TN(x) 15 75A3 TN(X) 16 75A2 x&x, T) 17 68Hl magn. phase diagram 18 68Hl magn. structure 19 68Hl a, c 20 68Hl P.1 4 68H1 L(x) 21 36Fl T,(x) 5 71 s2 PSOl”lC 22 68s 1 &y,,(x) 23 68 s-l T,(x) 24 6OCl Pa,(x) 25 6OCl aiz,(x)/ax 26 70 L 1 T,(x) 27 6OCl iat 114 6OCl
(in 1.4.2.2) Ba,(x) 28 79P2 PNi? ~dX) 29 79P2 H,,gpr 47-1 30 68Sl H,,y,v 47 31 75Fl
Frame, Gersdorf I andnlr-Bornrrcin Nea Ccrie% 111’19a
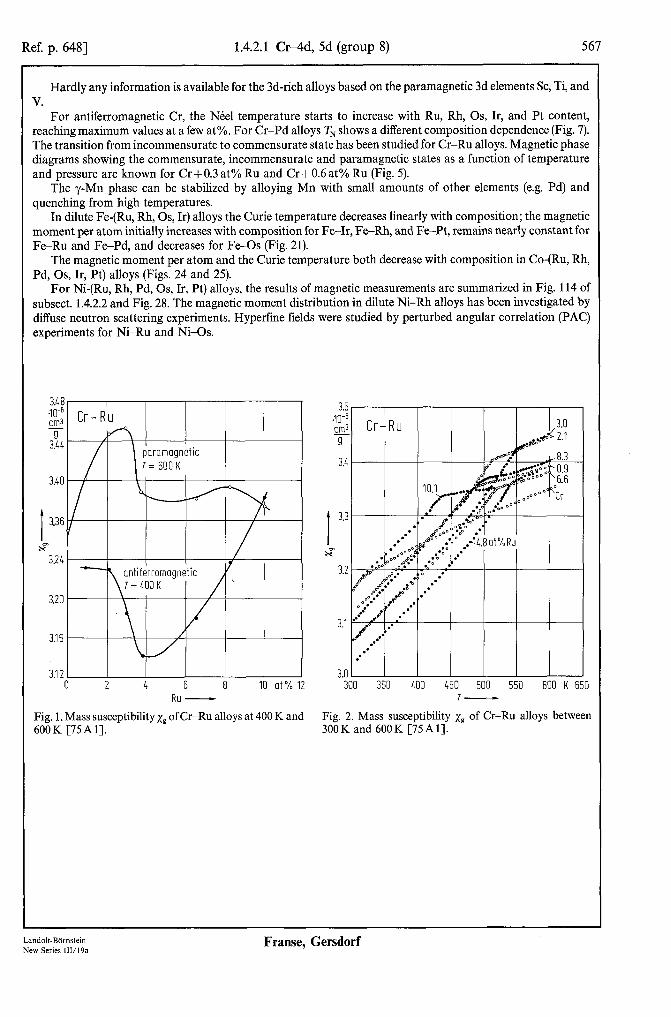
Ref. p. 6481 1.4.2.1 CrAd, 5d (group 8) 567
Hardly any information is available for the 3d-rich alloys based on the paramagnetic 3d elements SC, Ti, and v.
For antiferromagnetic Cr, the Neel temperature starts to increase with Ru, Rh, OS, Ir, and Pt content, reaching maximum values at a few at%. For Cr-Pd alloys TN shows a different composition dependence (Fig. 7). The transition from incommensurate to commensurate state has been studied for Cr-Ru alloys. Magnetic phase diagrams showing the commensurate, incommensurate and paramagnetic states as a function of temperature and pressure are known for Cr + 0.3 at% Ru and Cr + 0.6 at% Ru (Fig. 5).
The y-Mn phase can be stabilized by alloying Mn with small amounts of other elements (e.g. Pd) and quenching from high temperatures.
In dilute Fe-(Ru, Rh, OS, Ir) alloys the Curie temperature decreases linearly with composition; the magnetic moment per atom initially increases with composition for Fe-Ir, Fe-Rh, and Fe-Pt, remains nearly constant for Fe-Ru and Fe-Pd, and decreases for Fe-OS (Fig. 21).
The magnetic moment per atom and the Curie temperature both decrease with composition in Co-(Ru, Rh, Pd, OS, Ir, Pt) alloys (Figs. 24 and 25).
For Ni-(Ru, Rh, Pd, OS, Ir, Pt) alloys, the results of magnetic measurements are summarized in Fig. 114 of subsect. 1.4.2.2 and Fig. 28. The magnetic moment distribution in dilute Ni-Rh alloys has been investigated by diffuse neutron scattering experiments. Hyperfine fields were studied by perturbed angular correlation (PAC) experiments for Ni-Ru and Ni-0s.
0 2 4 6 8 IO at% 12 Ru -
Fig. 1. Mass susceptibility xp ofCr-Ru alloys at 400 K and 600K [75Al].
I
3.3
x"
3.2
3.0 300 350 400 450 500 550 600 K 650
Fig. 2. Mass susceptibility xp of Cr-Ru alloys between 300 K and 600 K [75A 11.
Landolt-Bdmstein New Series 111/19a
Frame, Gersdorf

568 1.4.2.1 Cr-4d, 5d (group 8) [Ref. p. 648
“C
30:
I 15:: 2
0
-152 6 12 18 IIt% x -
Fig. 3. NCel temperature TN ofthc bee alloys ofCrwith Ru. Rh. and OS [64 B I].
K
1 ioi
35:
30:
--. corn. pore.
WY ‘-.,.
‘7-b / worn. \I‘
2531 I I/ I I I 0 3 6 9 12 kbor 15
600 K
550
500
I F 156
LOO
350
300
Fig. 4. N&cl temperature TN of Cr-Ru alloys as derived from susceptibility measurements (circles) [75A I] and from resistivity measurements (triaqles) [73 D I], see also [7OA I].
Fig. 5. Magnetic phase diagram ofCr-Ru alloys, showing the commensurate (corn.) incommensurate (incorn.) and paramagnetic (para.) phases in the T-p plane [70 J I].
P-
Table 1. Antiferromagnetic phases above 4K as a function of temperature and Ru concentration for Cr-Ru alloys as derived from neutron diffraction [81 P 11.
K
0.3 longitudinal 114 transversal 250 commensurate 380 incommensurate incommensurate
1.5 commensurate 480 5.0 commensurate 514
Franse, Gersdorf

Ref. p. 6481 1.4.2.1 Cr-4d, 5d (group 8) 569
Table 2. Maximum magnetic moment pmar and Neel temperature for Cr-Ru [Sl P 11, see also [66 K 11 and Fig. 23 in sect. 1.1.
at% Ru P max TN PB K
[SIP11 [70 J l] [75A l] 0.3 0.57(6) 380 376 z350 1.5 0.69(7) 480 - 480 5.0 0.60(6) 514 - 550
Table 3. Ntel temperature and the residual electrical resistivity of Cr-Ru, Cr-0s [7OA l] and Cr-Ir [72 D l] alloys.
at % TN Q (4.2 K) K pi2 cm
Ru 0.9 507 3.14 2.1 530 8.39 3.0
4.8 OS 0.3
0.6 1.1 2.0
Ir 0 0.3 0.5 0.8
1.1 1.4
565 11.48
558 19.89 359 0.81
465 1.88 533 2.65 566 5.26
312 301 477 512
534 547
60 @km
50
t
40
30 cm
20
IO
0 200 400 600 800 1000 K 1200 T-
Fig. resistivity Q alloys 6. Electrical of Cr-Ru between K 4 and 1050 K [7OA 11.
350.
K Cr-Pd
o susceptibility
1 2 3 at% 4 Pd -
Fig. 7. NCel temperature TN of Cr-Pd alloys as derived from susceptibility measurements (circles) and from resist- ivity measurements (crosses) [73A 11, see also [SO M 11.
Fig. 8. Electrical resistivity Q vs. temperature of Cr-Pd alloys [80 M 11. The insert shows the residual resistivity Q,,, determined at 4.2 K, vs. x. 0 100 200 300 400 500 600 K 700
T-
Landolt-Bbmstein New Series IIl/l9a
Franse, Gersdorf
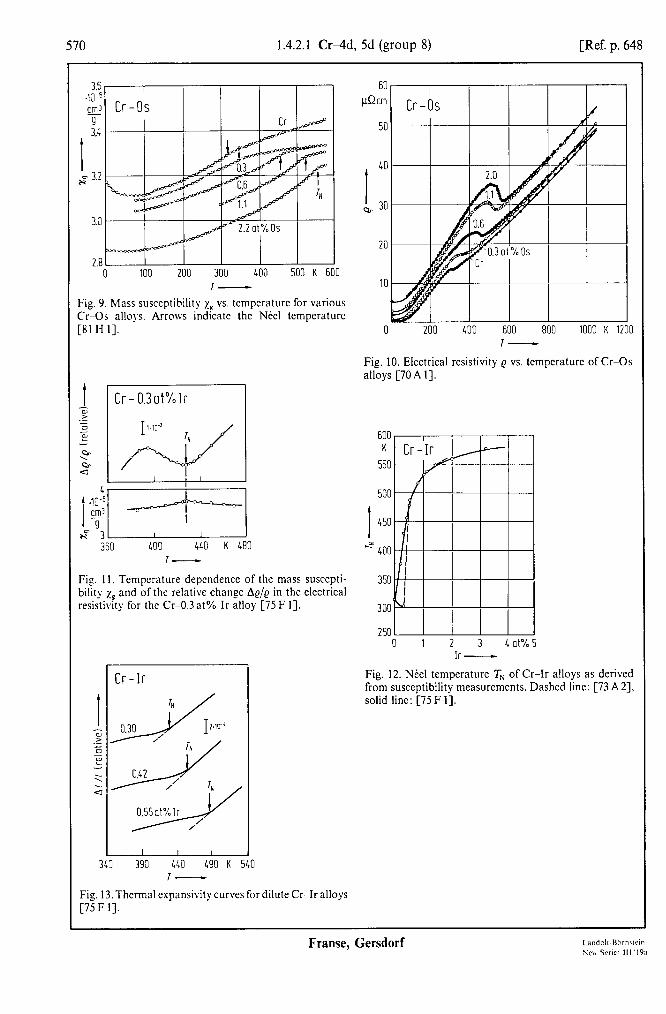
570 1.4.2.1 CrvId, 5d (group 8) [Ref. p. 648
3.4
I g 3.2
2.sl I I I I I I 0 100 200 300 400 500 K 600
I-
Fig. 9. Mass susceptibility xp vs. temperature for various Cr--0s alloys. Arrows indtcate the N&l temperature [Sl H I].
60 p&m
50
0 200 400 600 BOO 1000 K 12 T-
Fig. 10. Electrical resistivity e vs. temperature of Cr-0s alloys [7OA 11.
x” -31 360 400 440 K 480
T-
Fig. 11. Temperature depcndencc of the mass suscepti- bility,%, and of the relative change Ae/e in the electrical resistivity for the Cr-0.3 at% Ir alloy [75 F I].
I I I I 340 393 440 490 K !
I-
Fig. 13. Thermal expansivity curves for dilute Cr-Ir alloys [75 F I].
0 1 2 3 4 at% 5 Ir-
Fig. 12. N&cl temperature Tn of Cr-Ir alloys as derived from susceptibility measurements. Dashed line: [73 A23, solid line: [75 F I].
Frame, Gersdorf
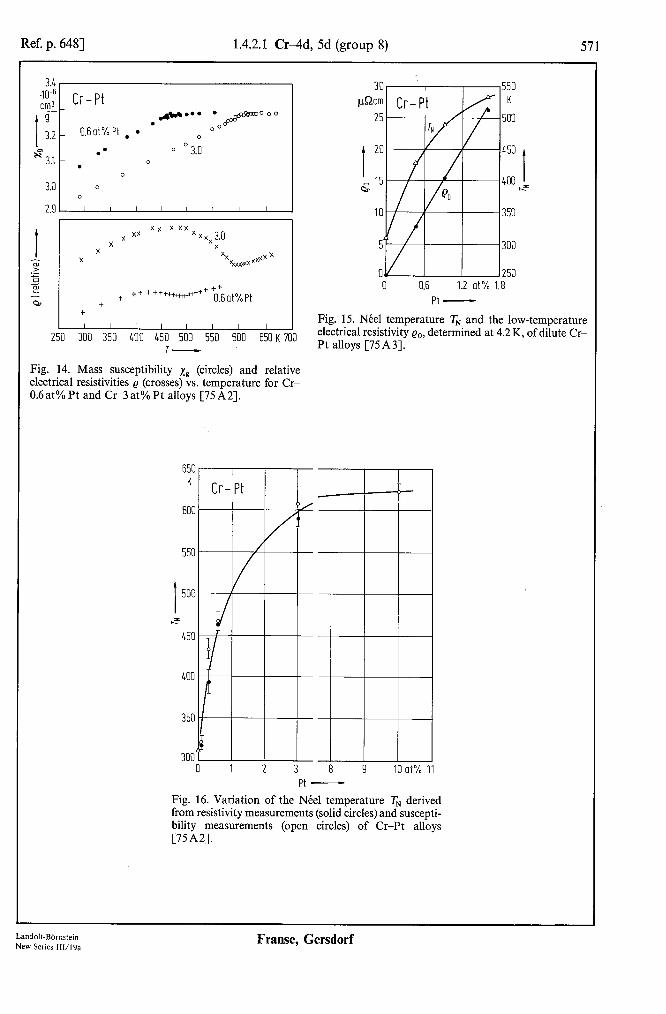
Ref. p. 6481 1.4.2.1 CrAd, 5d (group 8)
3.4 .1W6 cm3 -
I
9
3.2
s3.1
Cr-Pt . e***
0.6at% Pt . l
:08@-o 0
.- o o 3.0 0
.
I I I I I I I I
300 350 400 450 500 550 600 650 K 700
+ ++ + +++++w#++++ f0:6atyoPt
7-
Fig. 14. Mass susceptibility xg (circles) and relative electrical resistivities Q (crosses) vs. temperature for Cr- 0.6 at% Pt and Cr-3 at% Pt alloys [75 A2].
650 K
600 600
550 550
t
t 500 500
hz hz
450 450
400 400
350 350
30,ku 300 U 1 2 3 8 9 IO at% 11
30 p&cm
25
550 K
500
250 0 0.6 1.2 at% 1.8
Pt -
Fig. 15. NCel temperature TN and the low-temperature electrical resistivity Q,,, determined at 4.2 K, of dilute Cr- Pt alloys [75 A 31.
Pt -
Fig. 16. Variation of the Ntel temperature TN derived from resistivity measurements (solid circles) and suscepti- bility measurements (open circles) of Cr-Pt alloys [75A2].
Landolt-Bbmstein New Series IW19a
Franse, Gersdorf
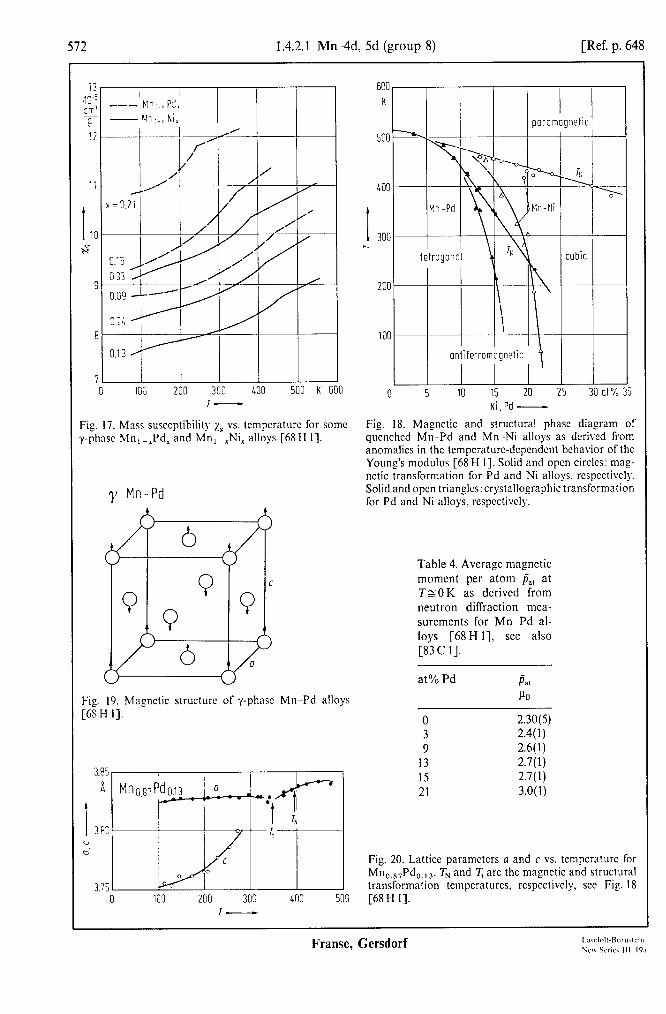
572 1.4.2.1 Mn--4d, 5d (group 8) [Ref. p. 648
- Mn.., Ni,
I A’
1
f’ /
/’ /
A’ x = 0.21
/’
/’
/
/’
I I I
1DG 200 300 LOO 500 K E I-
Fig. 17. Mass susceptibility lE vs. tcmpcraturc for some y-phase Mn, -,Pd, and Mn, _,Ni, alloys [68 H I].
y-Mn-Pd
Fig. 19. Magnetic structure of y-phase MnPd alloys [68 H I].
3.85
A Mno.87Pd013 0 I
i 3.8:: u d
600 K
I I (
! 300 I I \.!‘,\4 I
tetrogonol 4
200
100
’ “\I
I \
1 / oniiterromynetic , 4
0 5 10 15 20 2: Ni, Pd -
j 30 ot% 35
Fig. 18. Magnetic and structural phase diagram of qucnchcd Mn Pd and Mn Ni alloys as derived from anomalies in the temperature-dcpcndcnt behavior of the Young’s modulus [68 H I]. Solid and open circles: mag- nctic transformation for Pd and Ni alloys, rcspcctivcly. Solid and open trianglcs:crystallographic transformation for Pd and Ni alloys, rcspcctivcly.
Table 4. Average magnetic moment per atom Is,, at TzO K as derived from neutron diffraction mea- surements for Mn-Pd al- loys [68H I], see also [83 C I].
at% Pd
0 2.30(5) 3 2.4( 1) 9 2.6(l)
13 2.7(l) 1.5 2.7(l) 21 3.0( 1)
Fig. 20. Lattice parameters n and c vs. temperature for Mn o.mPdo.,x. TN and 7; arc the magnetic and structural transformation tempcraturcs, respectively, xc Fig. 18 [68 H I].

Ref. p. 6481 1.4.2.1 F&d, 5d (group 8) 573
Fig. 21. Average magnetic moment per atom &, in iron-rich Fe-(@, Rh, Pd, OS, Ir, Pt) alloys as a fimction
2.6
PB
2.4
1.8
I 1.6
lc?
IA
of solute concentration [36 F 11. 0 IO 20at"/ bl
Table 5. Influence of Ru, Rh, Pd, OS, Ir and Pt im- purities on the Curie tem- perature of Fe [71 S 21, see also [71 S 11. c: solute concentration.
AT,lc K/at %
Ru -16 Rh -2 Pd -3 OS -11 Ir -4 Pt 0
Fig. 22. Localized moments for 3d, 4d, and 5d solutes in Fe, as derived from neutron scattering (solid circles: [65 C 31, squares: [66 C 11) and from conduction-electron and core polarization (open circles) [68 S I].
X-
3
pB Fe-3d 2- 0
f 0 I
l- o lo
I
0 I fe
-1 - i, Ii
t
-2 I I I I I I V Cr Mn Fe Co Ni 1
I LI I
I, I
I I I I I w Re OS Ir Pt
Land&-Bbmstein New Series 111/19a
Franse, Gersdorf
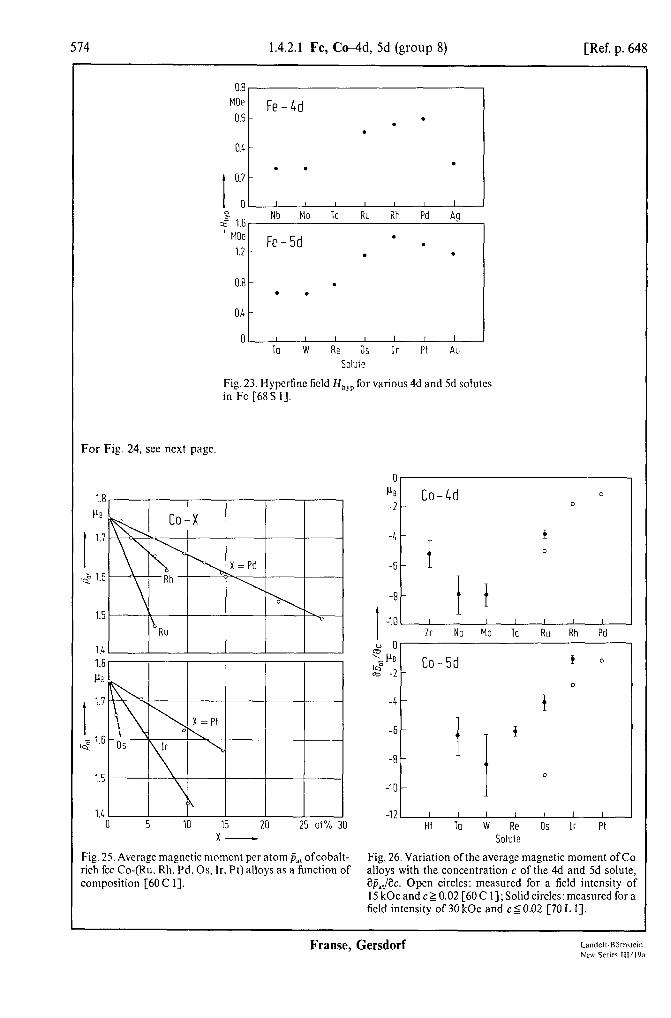
574 1.4.2.1 Fe, Chid, 5d (group 8) [Ref. p. 648
0.8 MOe
0.6 . . .
Fe-4d
I I I I I I I Nb MO Tc Ru Rh Pd Aa E
s' 1.6 ' MOe
1.2
0.8
04
0
Fe-5d . . . .
. . .
I I I I I I I
To W Re OS Ir Pt Au Solute
Fig. 23. Hypcrfinc field H,,, for various 4d and 5d solutes in Fe [68’S I].
For Fig. 24, see next page
1.8
P'e
I 1.7
,z 1.6
1.5
1.1 1.8
Ps
1 1.7
,$ 1.6
1.5
1 30
Fig. 25. Average magnetic moment per atom j,, ofcobalt- rich fee Co-(Ru. Rh. Pd. OS, Ir, Pt) alloys as a function of composition [60 C I].
Y cls Co-4d -2
-4
-6
0
0
I
0
0
-12 I I I I I I I I Ht To W Re OS Ir Pt
Solute
Fig. 26. Variation of the average magnetic moment of Co alloys with the concentration c of the 4d and 5d solute, $,,/ac. Open circles: measured for a field intensity of 15 kOe and c? 0.02 [60 C I]; Solid circles: measured for a field intensity of 30 kOe and c 5 0.02 [70 L I].
Frame, Gersdorf
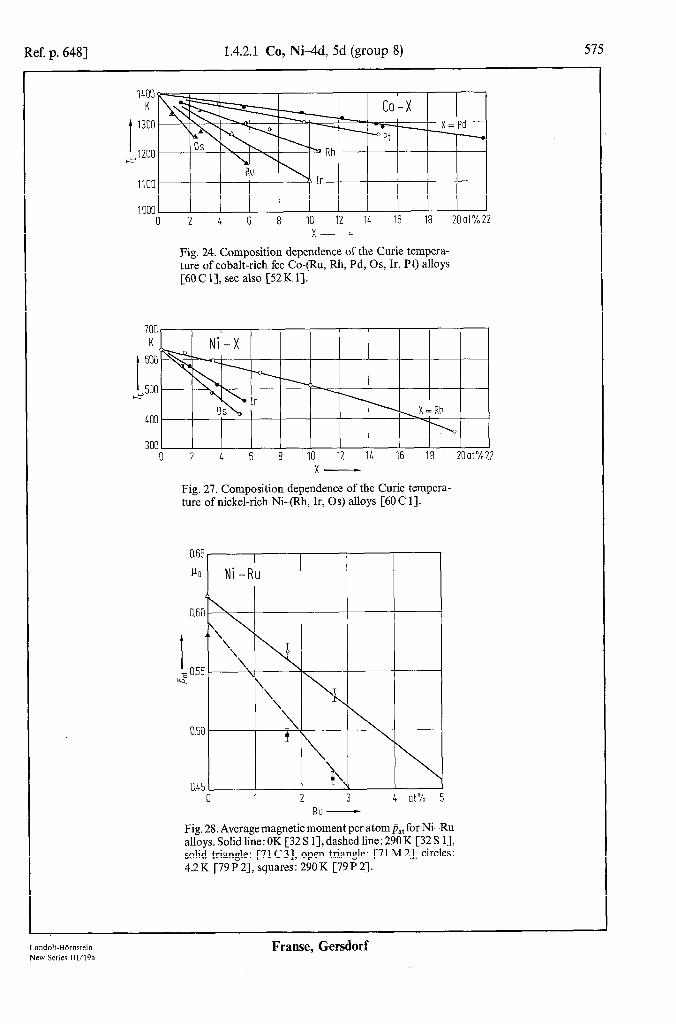
Ref. p. 6481 1.4.2.1 Co, Ni-4d, 5d (group 8) 575
1400 K
I 1300
hy 1200
1100
1000 0 2 4 6 8 IO 12 14 16 18 20at%22
x- Fig. 24. Composition dependence of the Curie tempera- ture of cobalt-rich fee Co-(Ru, Rh, Pd, OS, Ir, Pt) alloys [60 C 11, see also [52 K 11.
1
5 18 20at%22 x-
Fig. 27. Composition dependence of the Curie tempera- ture of nickel-rich Ni-(Rh, Ir, OS) alloys [60 C 11.
I 1.g 0.55
0.50
0.45 0 1 2 3 4 at% 5
Ru -
Fig. 28. Average magnetic moment per atom j?,, for Ni-Ru alloys. Solid line: OK [32 S 11, dashed line: 290 K [32 S 11, solid triangle: [71 C 31, open triangle: [71 M 21, circles: 4.2K [79P2], squares: 290K [79P2].
Landolt-Bbmstein Franse, Gersdorf New Series lll/l9a
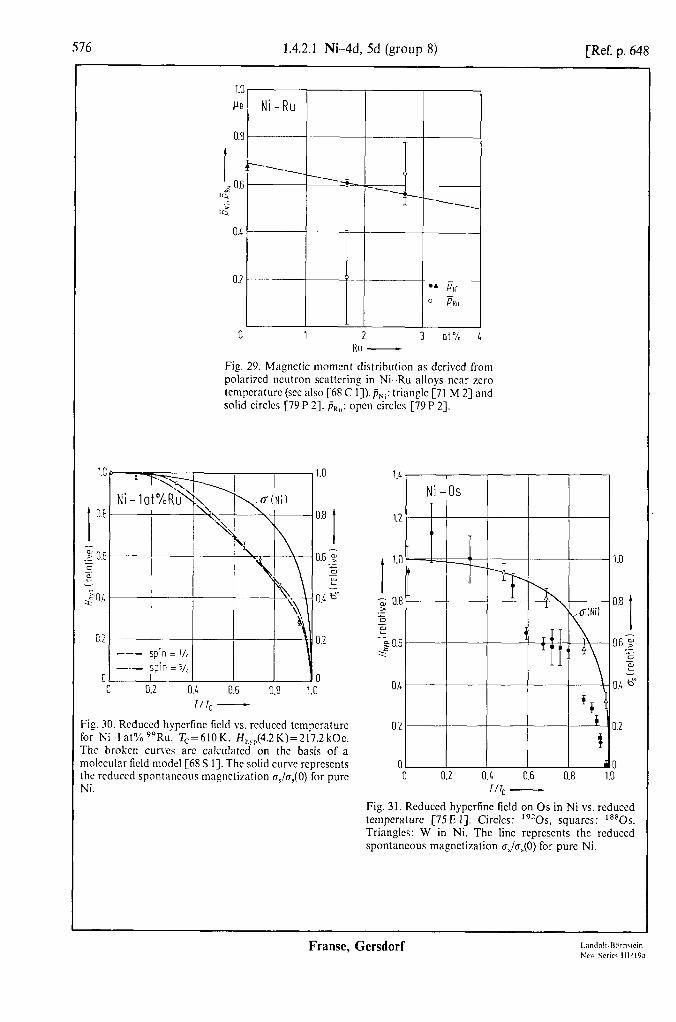
576 1.4.2.1 Ni-4d, 5d (group 8) [Ref. p. 648
0 1 2 3 at% 4 Ru -
Fig. 29. Magnetic moment distribution as dcrivcd from polarized neutron scattering in Ni -Ru alloys near zero tcmpcraturc (xc also [68 C I]). ijNi: triangle [71 M 21 and solid circles [79 P 21. Is,,,: open circles [79P 21.
--- win = l/2
3.2
0 -.- spin = 5/z
0 I
0 0.2 0.4 0.6 0.8 1.0 r/r, -
Fig. 30. Rcduccd hypcrfinc field vs. rcduccd temperature br Ni 1 atXQ9Ru. 7”=6lOK. H,,,(4.2K)=217.2kOc. The broken cunrs arc calculated’ on the basis of a noleculnr field model [68 S I]. The solid curve represents the rcduccd spontaneous magnetization cr,l~,(O) for pure Ni.
1.0 1.4 , 1.4 I I 1 Ni-0s 1
I
I 1.0 I 1.0 1.0
-2 0.8 0.8 .> E; u --& 0.6 0.6 3 s'
11 @.I L - 0.4 0.4 G-
-2 0.8 .> E; u --& 0.6 s'
0.4
0.2
i
0 PO 0 0.2 0.4 0.6 0.8 1.0
0.2 * IO.2
i
0 PO 0 0.2 0.4 0.6 0.8 1.0
r/r, - Fig. 3 I. Reduced hypcrfinc field on OS in Ni vs. reduced tempcraturc [75 E 11. Circles: lg20s, squares: ‘**OS. Triangles: W in Ni. The line represents the reduced spontaneous magnetization I&, for pure Ni.
Frame, Gersdorf

Ref. p. 6481 1.4.2.2 3d-4d, 5d (group 8): concentrated alloys and compounds 577
1.4.2.2 Concentrated alloys and intermetallic compounds
1.4.2.2.0 Introduction
Detailed phase diagrams for the binary constitutional alloys T-M, in which T is a 3d transition element and M a group-VIII 4d or 5d element, are available for most of the systems. The T-M alloys show a wide variety of ordered structures at room temperature. In many cases the experimentally determined magnetic parameters strongly depend on the state of atomic ordering. For the system T-Pt this is indicated in Table 1. The different types of magnetic order and the magnetic parameters of the ordered T-Pt compounds are summarized in Table 2.
Table 1. Crystallographic structure and type ofmagnetic order in atomically ordered (0) and disordered (d) T-Pt compounds [Sl K2]. T: 3d transition elements Ti...Ni; P: paramagnetic, F: ferromagnetic, AF: antiferromagnetic.
T
Ti V Cr Mn Fe co Ni
T,Pt o Al5 Al5 Al5 Cu,Au Cu,Au - Cu,Au P P P AF F F
d - - - fee fee - fee AF F F
TPt o AuCd AuCd CuAuI CUAUI CuAuI CuAuI CuAuI CuAuI P P AF AF F F P
d - - fee fee fee fee fee P P?F F F F
TPt, o Cu,Au TiAl, Cu,Au Cu,Au Cu,Au Cu,Au Cu,Au - P F F F F AF F
d - fee fee fee fee fee - P P P? F F
Table 2. Magnetic moment per atom and magnetic ordering temperature of some ordered T-Pt compounds T: 3d transition elements V...Ni; P: paramagnetic, F: ferromagnetic, AF: antiferromagnetic, FI: ferrimagnetic; T,: temperature at which a transition between two different types of magnetic order occurs. These quantities strongly depend on the atomic state of ordering; data from various authors generally disagree. The values given in this table have therefore qualitative significance only.
T
V Cr Mn Fe co Ni
T,Pt P P AF, T,=485K F, Tc=400K F PM,, = 3.0 PB ‘) PFe = 2.7 PB “)
T,=365K PPt = o.5 kB 3,
TPt P AF AF, T,=975K FI, Tc=670K F, T,=750K P kr=2.24 PB ‘1 hh=4.3 PB ‘) P~c~2.8 VB ‘) ~~0~1.6~1~
T,=715K pp,= -0.25 pB PP1= o.25 PB
TPt, FI, T,=200...240K FI, T,=481 K F, Tc=395K AF, T,=170K F, Tc=290K P”=l pB4) PO = 2.33 PB ‘) PM” = 3.60 PB “) PFe = 3.3 PB PcO=~.~~FB
PPt = - o.3 PB “) pPt= -0.27 FB ') pPt=0.17 pB 2, Ppt = 0.26 PB
‘) At 300K. “) At 77K. “) At 4.2K. 4, At 1.7K.
Landolr-Bbrmtein Franse, Gersdorf New Series IWl9a
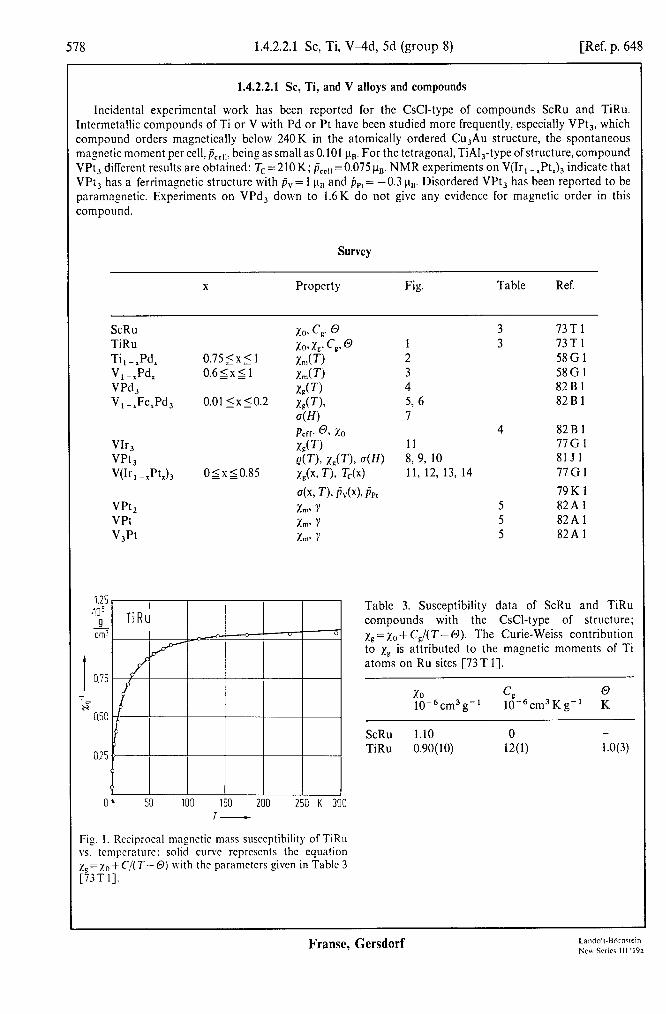
578 1.4.2.2.1 SC, Ti, VAd, 5d (group 8) [Ref. p. 648
1.4.2.2.1 SC, Ti, and V alloys and compounds
Incidental experimental work has been reported for the CsCI-type of compounds ScRu and TiRu. Intermetallic compounds of Ti or V with Pd or Pt have been studied more frequently, especially VPt,, which compound orders magnetically below 240K in the atomically ordered Cu,Au structure, the spontaneous magnetic moment per cell, Pee,,, being as small as 0.101 pu, For the tetragonal, TiAl,-type of structure, compound VPt, different results are obtained: T,=210K; FCC,,= O.O75n,. NMR experiments on V(Ir, -XPtx)3 indicate that VPt, has a ferrimagnetic structure with pv= 1 un and pp, = -0.3 un. Disordered VPt, has been reported to be paramagnetic. Experiments on VPd, down to 1.6K do not give any evidence for magnetic order in this compound.
Survey
X Property Fig Table Ref.
ScRu TiRu Ti 1-3’4 V, -3’4 VPd, V, -,Fe,Pd,
VIr, vpt, W, -PtJ3
x0. c,. 0 x0, Xp, c,, @
0.75 Ix I 1 - - L(T) 0.65~5 1 L(T)
zr(T) 0.01 sxso.2 X,(T),
a(H) Pi.‘@ %o x,(T) e(T)> z,(T), 4W
OIx-<O.85 -- x& T). T,(x) dx, T), ii&), PP, Xm Y Xm Y Xm. Y
VPt, VPt v,pt
1.25 .lO" A!-. cm!
0’ 53 100 150 200 250 K 300
Fig. I. Reciprocal magnetic mass susceptibility of TiRu vs. tcmpcrature: solid curve represents the equation zS = lo + C/( T- 0) with the paramctcrs given in Table 3 [73T I].
3 1 3 2 3 4 5, 6 7
4 11 8, 9, 10 11, 12, 13, 14
73Tl 73Tl 58Gl 58G1 82Bl 82Bl
82Bl 77Gl 8151 77Gl 79Kl
5 82Al 5 82Al 5 82Al
Table 3. Susceptibility data of ScRu and TiRu compounds with the CsCl-type of structure; )I~ = ,yo+ C&T- 0). The Curie-Weiss contribution to xF is attributed to the magnetic moments of Ti atoms on Ru sites [73T 11.
X0 c, 0
10-6cm3g-1 10-6cm3Kg-’ K
ScRu 1.10 0 - TiRu 0.90( 10) 12(l) 1.0(3)
Fransc, Gersdorf
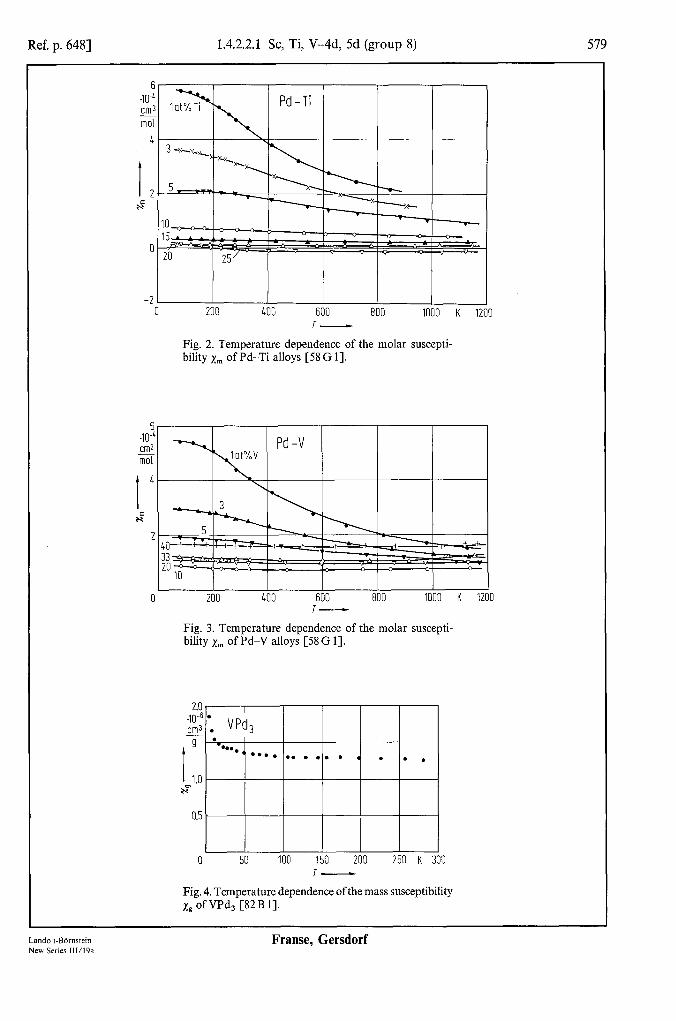
Ref. p. 6481 1.4.2.2.1 SC, Ti, V--4d, 5d (group 8)
f 40' cm’ Kl
4
t 2 x'
I I I I I I
200 400 600 800 1000 K 1200 T-
Fig. 2. Temperature dependence of the molar suscepti- bility x,,, of Pd-Ti alloys [58 G 11.
.I$ cm3 - mol
I 4
N’
2
0 200 400 600 800 1000 K 1200 T-
Fig. 3. Temperature dependence of the molar suscepti- bility x,,, of Pd-V alloys [58 G 11.
2.0 .I@ l
I
cm3 l VPd, -
I
g l =... l ’ 0.. l . . . . . . . .
1.0
H”
0.5
0 50 100 150 200 2
T
'51
l .
3 K: T-
Fig. 4. Temperature dependence of the mass susceptibility xp of VPd3 [82 B I].
Landolt-BOrnstein Frame, Gersdorf New Series 111/19a
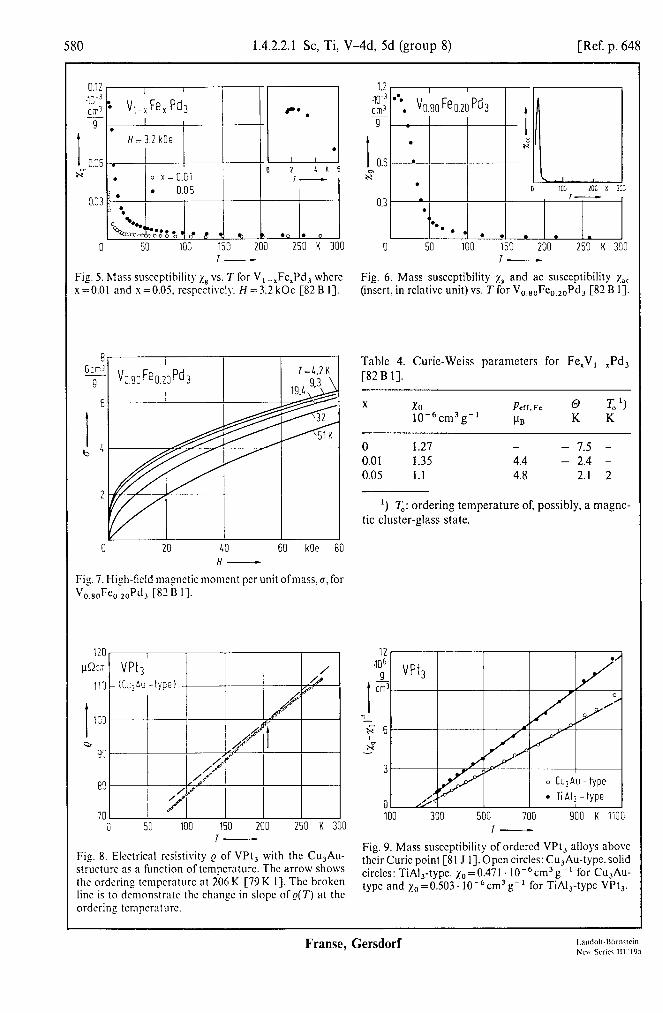
580 1.4.2.2.1 SC, Ti, V-4d, 5d (group 8) [Ref. p. 648
0.12 . I .1rj-'
I .
cm3 l V,-,Fe, Pd3 -
a I . I 0.05 . H = 3.2 kOe
w= . 0 x = 0.01
I-
Fig. 5. h&s susceptibility zL: vs. T for V, -,Fc,Pd, whcrc s=O.Ol and s=O.O5. respcctivcly. H=3.2 kOc [82 B I].
I b'
I
V0.83Fe0.20Pd3 T=4.2K
0 20 LO 60 kOe 80 H-
Fig. 7. High-field magnetic moment per unit ofmass. U, for V 0.8OFeO.20 Pd, [82 B I].
701 0 53 100 150 200 250 K :
r
Fig. 8. Electrical resistivity Q of VPt, with the Cu,Au- structurt‘ as a function of temperature. The arrow shows the ordering tcmpcraturc at 206 K [79 K I]. The broken lint is IO dcmnnstratc the change in slope of e( T) at the ordering tempcrnture.
0 50 100 150 200 250 K 300 T-
Fig. 6. Mass susceptibility zr: and ac susceptibility zuc (insert, in relative unit) vs. T for V,,,,Fe,,,,Pd, [82 B I].
Table 4. Curie-Weiss parameters for Fe,V, -xPd, [82 B I].
X X0 !&ff.Fe @ T, ‘1
10-6cm3g-’ pa K K
0 1.27 - -7.5 - 0.01 1.35 4.4 - 2.4 - 0.05 1.1 4.8 2.1 2
‘) To: ordering temperature of, possibly, a magne- tic cluster-glass state.
.‘“g” VP&
I ii?
i
01 A9 100 300 500 700 900 K 1100
I-
Fig. 9. Mass susceptibility of ordcrcd VPt, alloys above their Curie point [8l J 1). Open circles: Cu,Au-type. solid circles: TiAl,-type. ,~~=0.471 . 10-6cm3g-1 for Cu,Au- type and 1,=0.503. 10-6cm3g-’ for TN,-type VPt,.
Frame, Gersdorf

Ref. p. 6481 1.4.2.2.1 SC, Ti, V-4d, 5d (group 8) 581
i0 kOe 180 a
0.90 J&
9
I
0.87
- 0.84 2 0.67
6
0.64 - 2-c --
0.61 0 0.1 0.2 0.3 0.4 0.5(kOei‘*0.6
b luuH-* -
Fig. 10. Magnetic moment per unit of mass, 0, of two ordered VPt, samples at 4.2 K in the high-field domain 0 < H < 150 kOe. Open circles: Cu,Au-type, solid circles: TN,-type; (a) magnetization curve against field, cor- rected for demagnetization; (b) approach to satura- tion: cr-~nrH against He2 [Sl J i], see also [8OB l] and [82 J 11. High-field susceptibility xHF = dg/dH, H>50kOe: XHF=0.9. 10-6cm3g-’ for Cu,Au-type and xHF=l.O. 10v6 cm3 g-’ for T&-type VPt,.
0.6 , I I I ,240
h V(Ir,_,Pt,)3 I I IL I lK
I 0.4 160
15 0.3 120 I *
0.2 80
0.1 40
0 0 0.4 0.5 0.6 0.7 0.8 0.9 1.0
X-
Fig. 12. Variation of the Curie temperature T, and magnetic moment per V atom, jjv, with concentration x for V(Ir, -xPtx)3 alloys [77 G 11.
01 I- I I I
100 200 300 400 500 K 600 T-
Fig. 11. Variation of the reciprocal magnetic mass sus- ceptibility xs (x=0.50,0.55,0.69, and 0.85) and magnetic mass susceptibility (x = 0 and 0.40) with temperature for V(Ir, -.Pt,), alloys [77 G 11.
Landolt-Bbmsrein New Series 111/19a
Frame, Gersdorf

582 1.4.2.2.2 Cr-4d, 5d (group 8) [Ref. p. 648
3 Gem:
9
I
2
b
0 50 100 150 i T-
! '00 K 250
Fig. 13. Variation of the spontaneous magnetic moment per unit mass, U, with temperature for V(Ir, -rPtr)3 alloys [77 G 11.
Table 5. Experimental values for the coefficient 7 of the electronic term in the specific heat, and for the susceptibility xrn of various V-Pt compounds [82A 11.
Compound y Xm mJ mol-’ K-’ 10m6 cm3 mol- ’
V 9.9 286 v,pt 7.19 220...250 VPt 3.38 148 vpt, 2.00 118 vpt, 3.24 ordered Pt 6.6 237
Fig. 14. Estimated average magnetic moment ofV atoms, j,., and of Pt atoms. j&,. together with the observed spontaneous magnetic moment per formula unit, j, as a function of x in V(Ir, -XPtr)3 [79 K I].
1.4.2.2.2 Cr alloys and compounds
Thermomagnetic measurements have been performed on concentrated Cr-M alloys (M: group VIII 4d or 5d element) over the whole composition range (Figs. 15 and 17). The susceptibility at room temperature strongly depends on the heat treatment as is indicated for Cr-Pd in Fig. 18.
Cr-Pd and Cr-Pt have been studied in more detail. The fee Cr-Pd alloys in the composition range 25...35 at% Cr show mictomagnetic behavior (Fig. 21).
Neutron diffraction measurements reveal that the magnetic structure of ordered CrPt, is ferrimagnetic with two sublattices: the Cr atoms occupy one sublattice, the Pt atoms the other one, see Table 6. An antiferromagnetic structure in which Cr spins are antiferromagnetic within each layer was detected in the ordered CrPt compound (CuAuI-structure) at room temperature (Fig. 24). For the disordered systems superparamagnetic behavior is suggested [73 B 23.
Franse, Gersdorf
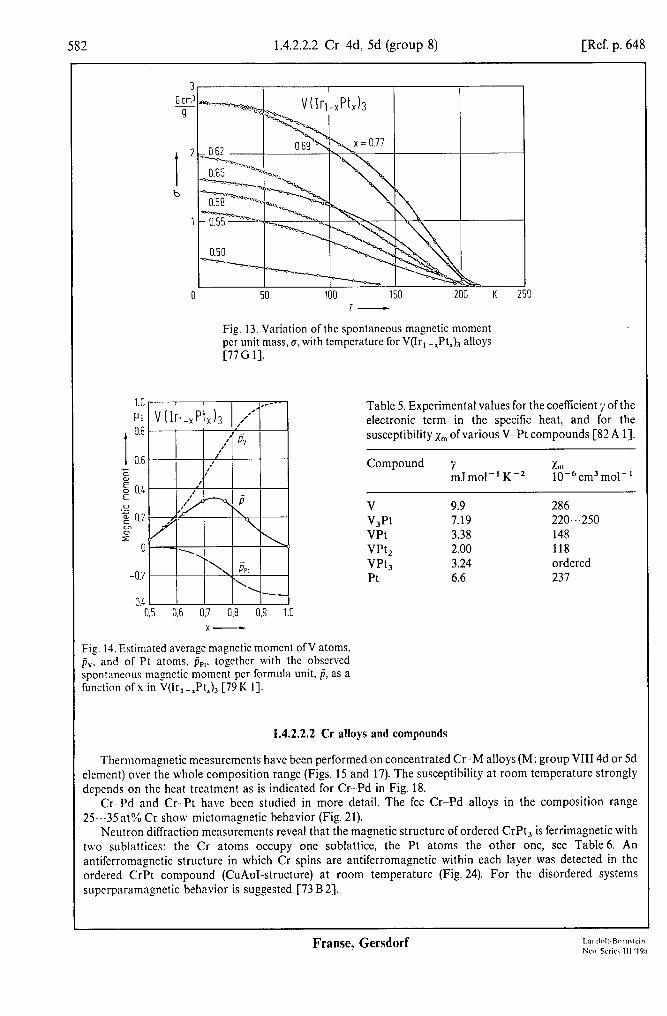

Ref. p. 6481 1.4.2.2.2 Cr-4d, 5d (group 8) 583
Survey
X Property Fig. Table Ref.
Cr, -.Ru, O<x<l xg(x, T) 15, 16 68Kl Cr, -xRh, O<x<l X&G T) 15, 16 68Kl Cr, -,Pd, O<x<l x,(x), T,(x) 17 68Kl
0.4<x<l XIII(X) 18 58Gl 0.77<x<l xmk T) 19 58Gl 0.65 <x < 0.75 6 T, w, PcrW, T 20, 21 6 71Cl
Cr, -,Os, O<x<l X&G T> 15, 16 68K 1 Cr, -Jrx O<x<l x,(x), T,(x) 17 68Kl Cr, -xPt, O<x<l x,(xX T,(x) 17 68Kl
0.4<x<O.86 Tc(x)> P,,(x) 22 73Bl 0.6<x<O.82 T,(x), E&x)> Pdx) 7 7762
CrPt ordered x,(T) 23 73Bl %.3%7 Pat 8 62Pl CrPt Pat, 4 c 24 8 73B2 CrPt, o(H, 20K) 25 73B2 CrPt, Pat 8 63Pl CrPt, magnon dispersion 26 83Wl Cr, -,Mn,Pt, O<x<l T,, P,,(x) 27 79Wl
magnon dispersion 28 81Wl W&ndt3 magnon dispersion 26 83Wl
.g Rh-Cr I I I
Or 0 Rh
20 40 60 80 at% lODo Cr - Cr
33
Cr f t
29
“”
I 1
Ru E RuCr, Cr /
I 1 OS E
I OsCr3
Fig. 15. Mass susceptibility xp as a function of compo- sition in the systems Cr-Ru, Cr-Os, and Cr-Rh [68 K 11.
z.. 30 H w'
m3 -6
27
26
I , Cr-10.5at%Ru 2 -phase
8’ 1 -phase _ 3,7 2
w6
1 ( 13.2
Fig. 16. X-Tcurves of Cr-rich two-phase alloys with weak ferromagnetic properties (upper curves) and one-phase antiferromagnetic alloys (lower curves) [68 K 11.
Land&BOrnstein New Series 111/19a
Frame, Gersdorf
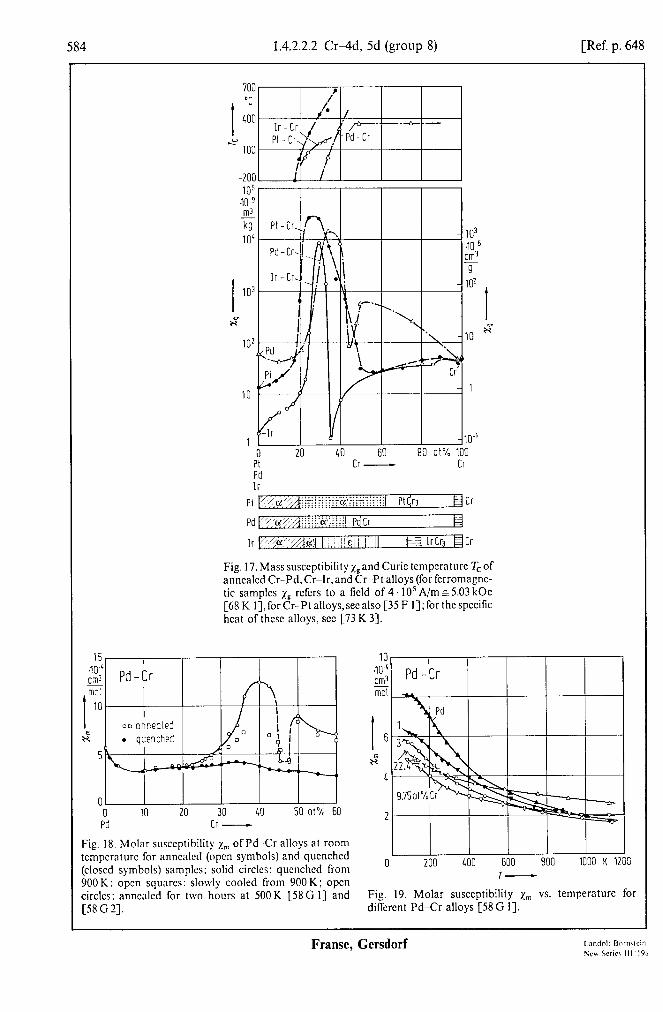
584 1.4.2.2.2 Cr-4d, 5d (group 8) [Ref. p. 648
-2001 il / I 105 I I I I I I
Pi Pd
Cr - Cr
pd k’&‘,,h : : : : : ., I . .,/ :::::-.o::;:ff PdCr El
Ir “//ckT”/ I& /,+,A ( lijl: 111 t-1 IrCg HCr
Fig. 17. Mass susceptibility xE and Curie tempcraturc T, of annealed Cr--Pd,CrrIr,and Cr-Pt alloys (for fcrromagnc- tic samples ,ys rcfcrs to a ticld of 4 10’ A/m & 5.03 kOe [68 K I], for Cr-Pt alloys, set also [35 F I]; for the specific heat of thcsc alloys, SW [73 K 33.
0 0 10 20 30 10 50 ot% 60 Pd Cr -
10 do-' cm3 iia
Fig. IS. Molar susceptibility xrn of Pd Cr alloys at room temperature for anncalcd (open symbols) and qucnchcd (closed symbols) samples: solid circles: quenched from ’ 200 LOO 600 800 1000 K 1200
900K: open squares: slowly cooled from 900K; open I-
circles: anncalcd for two hours at 500K [SC I] and Fig. 19. Molar susceptibility xrn vs. temperature for [58 G 21. different Pd-Cr alloys [58 G I].
Frame, Gersdorf

Ref. p. 6481 1.4.2.2.2 Cr-Ad, 5d (group 8)
b IO I 20
b
0 5 IO kOe 15 15
H WP’ -
Fig. 20. Magnetic moment per unit of mass, 0, vs. applied field at 4.2K for quenched Pd,,,, Cr,,,,. Open circles: IO
cooled in a magnetic field of 12.56 kOe; solid circles: cooled to 4.2 K in zero field [71 C 11, see also [70 K 11.
5 0 100 200 K 300
T-
Fig. 21. Magnetic moment per unit of mass, cr, vs. temperature for quenched Pd,,,,Cr,,,, at H appl= 12.64 kOe; open circles: field-cooled state, solid circles: cooled in zero field [71 C 11.
Table 6. Magnetic properties of Cr-Pd alloys; the thermomagnetic remanence otr was measured at 4.2 K after cooling in an applied field of 12.64 kOe; Tr is the freezing temperature for mictomagnetism; or is the magnetic moment at Tf [71 C 11.
Quenched from 1200 “C Annealed at 400 “C
PC, T Cf % T Bf ctr
at% Pd pa K 10-2Gcm3g-1 lo-‘Gcm3g-’ K 10-2Gcm3g-1 10-2Gcm3g-1
75 0.48 36 11.2 3.5 32 11.7 3.5 72.6 0.61 42 17 7.5 34 80 35 71 1.23 50 26.5 12.4 30 850 620 67 1.25 70 24.8 11.2 14 910 550 65 1.27 76 19.5 9.2 10 950 130
1200 1.2 K Ps
1000 1.0
I 800 t 0.8
ct- 600 ,a” 0.6
400 0.4
200 0.2
0 0 0 IO 20 30 4Oot% 50 0 IO 20 30 4Oot%50
a Cr - b Cr -
Fig. 22. Variation with composition ofthe Curie tempera- ture Tc (a) and the mean magnetic moment (h) at 20 K for annealed Pt-Cr samples [73 B 11.
Landolt-Bdmstein New Series 111/19a
Frame, Gersdorf

586 1.4.2.2.2 Cr--4d, 5d (group 8) [Ref. p. 648
Table 7. Summary of heat treatments, atomic long-range order parameter S, lattice parameter a and magnetic data of Cr-Pt alloys [77 G 21. (I): slow cooling, (II): quenching. per determined from saturation magnetization at 77K; T=annealing temperature.
at% Pt T Time s Pcrr,cr Per T, “C 1 FB p’n K
82 900 2 weeks (I) 0 3.892 3.20 78 1400 1 hour (II) 0.24(5) 3.889 2.45 0.33 320
900 2 weeks (I) 0.80(3) 3.885 3.45 1.70 355
75 1450 1 hour (II) 0.33(5) 3.877 2.25 1.25 473 420 1 day (1) 0.67(5) 1.55 800 1 day (1) 0.80( 1) 1.85
1100 2 weeks (I) 0.90( 1) 3.875 3.60 2.25 500
70 1450 1 hour (II) 0.30(6) 0’) 1070 2 weeks (I) 0.92(3) 3.866 2.76 1.68 675
65 1070 2 weeks (I) 0.98(2) 3.857 2.32 1.12 860
60 1100 2 weeks (I) 0.97(3) 3.845 1.75 0.60 990
‘) The magnetization increases linearly for magnetic fields up to 80 kOe.
3 .105 CrPt CTTi?
----_
I 9
T-7 1
0 300 600 900 1200 “C 1500 I-
Fig. 23. Temperature dependence of the mass susccpti- 0 Pt 0 Cr
bility of an ordered CrPt sample. Open circles: on hentmg: solid circles: on cooling [73 B 1-j.
Fig. 24. Spin structure of CrPt (CuAuI-type of structure) [63P I].
Table 8. Magnetic moment distribution in Cr-Pt alloys near the 1: 1, 1: 2 and 1 : 3 composition, from neutron diffraction experiments at 300 K.
FCr PPI Ref. CL0 CLB
Cro.Pb7 2.56(10) - 0.47 62Pl CrPt, 2.33(10) -0.27(5) 63 P 1 CrPt 2.24(15) small 63 P 1
Frame, Gersdorf I.andd-Bornwin Ncn Scrie\ III ‘19~3
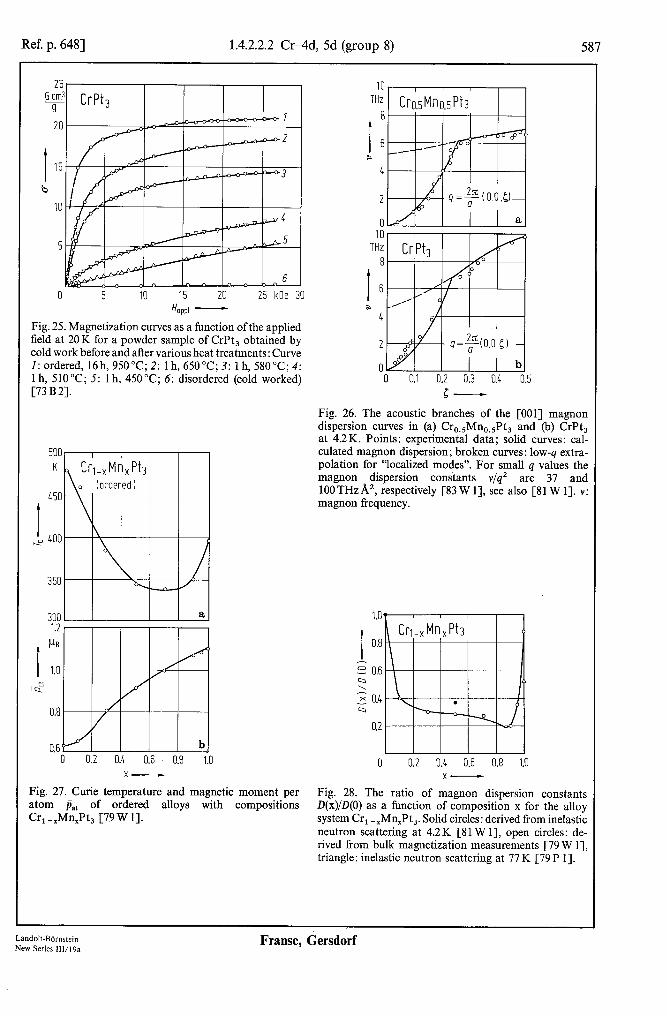
Ref. p. 6481 1.4.2.2.2 CrAd, 5d (group 8) 587
$1 CrPI,
0 5 IO 15 20 25 kOe 30 H OPPl -
Fig. 25. Magnetization curves as a function of the applied field at 20 K for a powder sample of CrPt, obtained by cold work before and after various heat treatments: Curve I: ordered, 16h, 950°C; 2: 1 h, 650°C; 3: 1 h, 580°C; 4: 1 h, 510°C; 5: 1 h, 450°C; 6: disordered (cold worked) [73 B2].
0.6 0 0.2 0.4 0.6 0.8 1.0
Fig. 27. Curie temperature and magnetic moment per atom P,, of ordered alloys with compositions
- Cr, -,Mn,Pt, [79 W I].
IO IO THz THz
8 8
I I 6 6 P P
4 4
2 2
0 0 IO
THz 8
I 6
a 4
5- Fig. 26. The acoustic branches of the [OOl] magnon dispersion curves in (a) Cr,,,Mn,,,Pt, and (b) CrPt, at 4.2K. Points: experimental data; solid curves: cal- culated magnon dispersion; broken curves: low-q extra- polation for “localized modes”. For small q values the magnon dispersion constants v/q2 are 37 and 100THz A’, respectively [83 W 11, see also [81 W 11. v: magnon frequency.
0.8
0 0.2 0.4 0.6 0.8 x-
Fig. 28. The ratio of magnon dispersion constants D(x)/D(O) as a function of composition x for the alloy system Cr, -,Mn,Pt,. Solid circles: derived from inelastic neutron scattering at 4.2K [Sl W 11, open circles: de- rived from bulk magnetization measurements [79 W 11, triangle: inelastic neutron scattering at 77 K [79P I].
1
Landott-BOrnstein New Series 111/19a
Franse, Gersdorf

588 1.4.2.2.3 Mn-4d, 5d (group 8) [Ref. p. 648
1.4.2.2.3 Mn alloys and compounds
Survey
x Property Fig Table Ref.
Mn, -XRh, MnRh Mn,Rh MnPd,
MnPd, Mn, -XPd,
MnPd
Mn, -rIrr
Mn 0.R31r0.17 Mn, -,Pt, MnPt,
MnPt, MnPt,
MnPt, MnPt
MnPt,. MnPt, Mn,Pt Mn,Pt Mn, -,Pt, Mn,Pt L -%Rh,
0.35 <x <0.45
disordered 0.69 <x <0.80
0.1 <x<o.2 0.12<x<O.26
0.05 < x < 0.35
0.6 < x < 0.9
0.1O<x<O.28 O<x<l
4-h e(T) &u-). e(T) magn. structure & = - 0.2 p1,; PM” = 4.0 PI, TN= 170K magn. correlations magn. structure &4(x). PhhW z,(T), TN> magn. structure TN(X), i%,n(x) magn. structure TN(X), A&) magn. phase diagram e, M. II,(T) M,(x), T,(x) P,,,(77 K) = 3.60(9) CLB P,,(77 K) = 0.17(4) ve magn. dispersion magnetization
distribution Pa T, xp(T), L
magn. structure magn. structure, phase
diagram magn. structure I$-) ma&n. phase diagram
29, 30 31 32
7421 63Kl 66K2 62Cl
33
34, 35
36 37
38 39 40
9
10
11
79Rl 69K 1
68P1
71Yl 74Y2
74Yl 74Yl 50Al 62Pl
41 79Pl 42 69Al
27 34, 35
43
10 79Wl 68 P 1
68K2
32 66K2 44 63Yl 45 66K2
Different types of antiferromagnetic order have been observed in the ordered Mn-M compounds. Susceptibility and resistivity versus temperature curves for the ordered compound MnRh show a large temperature hysteresis. indicating a gradual transition from the high-temperature CsCl-type structure to the low-temperature CuAuI-type structure (Fig. 31). Tetragonal MnRh is a strong antiferromagnet with a Ntel temperature well above 200 K. Neutron diffraction experiments on Mn,Rh reveal a triangular antiferromagnetic structure below T,=850(10)K with a value for the magnetic moment per Mn atom of 3.6(4)~, (Fig. 32).
The face-centered tetragonal form of Mn can be stabilized by addition of small amounts of other elements. Neutron cross sections of 5,10, and 16 at% Pd in antiferromagnetic y-Mn have been measured at 4.2 K. In MnPd (CuAuI-type structure) an antiferromagnetic structure with j&,,” = 44(4)p,, and T,=810(lO)K has been established by neutron diffraction. The possible magnetic structures arc given in Fig. 35. Above 870K the tetragonal structure of MnPd transforms into a CsCI-type of structure. In the stoichiometric MnPd, compound a one-dimensional. long-period superlattice based on the Cu,Au-type of order with periodic antiphase domains has been observed. The magnetic moments in antiferromagnctic MnPd, change their direction with composition, being parallel to the c axis below 25at% Mn and perpendicular above (Fig. 33).
A neutron diffraction study in disordered Mn-Ir alloys with face-centered cubic and face-centered tetragonal lattices reveals an increase in TN with increasing Ir content in the composition range l0...30at% Ir. By ordering in the Cu,Au-type of structure, TN is further increased. The magnetic transition is not associated with the
Frame, Gersdorf

Ref. p. 6481 1.4.2.2.3 Mn-4d, 5d (group 8) 589
crystallographic transition fee-fct, but occurs at higher temperatures. A magnetic phase diagram of Mn-Ir is shown in Fig. 38; the magnetic structure is given in Fig. 37. Fig. 36 represents the lattice parameter together with the average magnetic moment and the Ntel temperature as a function of composition.
In the Mn-Pt system ferromagnetic order has been reported for ordered MnPt, and antiferromagnetic order for ordered MnPt and Mn,Pt. The results of magnetization studies on Mn-Pt alloys near the MnPt, composition are shown in Fig. 40. Values for the magnetic moments in MnPt, at 77K are: &=3.60(9)uB, &, =0.17(4) us [62 C 11; a slightly different value for j&t of 0.26(3) uB is reported in [69 A 11. Ordered MnPt is antiferromagnetic with &,,, = 4.3(2) uLg and TN = 970( 10) K; its possible magnetic structures are given by Fig. 43a. Between 600 K and 800 K a transition from structure II to structure III occurs for the stoichiometric compound. In antiferromagnetic Mn,Pt two different magnetic structures are found; the possible magnetic structures for this compound are shown in Fig. 43b. The values for the magnetic moment at 77 K and for the NCel temperature of the stoichiometric compound are: & = 3.0(3) pa and TN = 475(10) K; the transition between the two structures D and F occurs at 365(10)K. A magnetic phase diagram of the whole Mn-Pt system is given in Fig. 43~.
150 200 250 300 350 400 450 500 K ! T-
Fig. 29. Temperature dependence of the magnetic mo- ment per unit of mass of Mn-Rh samples with different composition, at increasing and decreasing temperature, indicated by arrows for 42 at% Rh. The curves reflect the P(CsCl-type)-+y(CuAuI-type)martensitic transformation [74Zl].
Fig. 31. Mass susceptibility xe (and its reciprocal) and electrical resistivity Q of equiatomic MnRh during a complete temperature cycle between 4.2K and 700K, indicated by arrows. In the ordered high-temperature cubic phase, the susceptibility is of a Curie-Weiss type. The susceptibility and resistivity of the low-temperature tetragonal (CuAuI-type) phase suggest that MnRh in its tetragonal form is a strong antiferromagnet [63 K 11.
I( .10-l
Qcm c
I
E
"4
l- I
I-
I
1.6 1.8 2.0 2.2W3K“ 2.6 l/T-
Fig. 30. Dependences of the electrical resistivity Q and magnetic moment (r ofMn,,&h,,,, on the reciprocal of the temperature. The steep increase in resistivity is due to the scattering of the electrons by superparamagnetic clusters [74 Z 11.
.?04 s cm3
3 I
2 3
pQcm 100 I
0 b 0 100 200 300 400 500 600 K 700
Landolt-BBmstein New Series 111/19a
Frame, Gersdorf
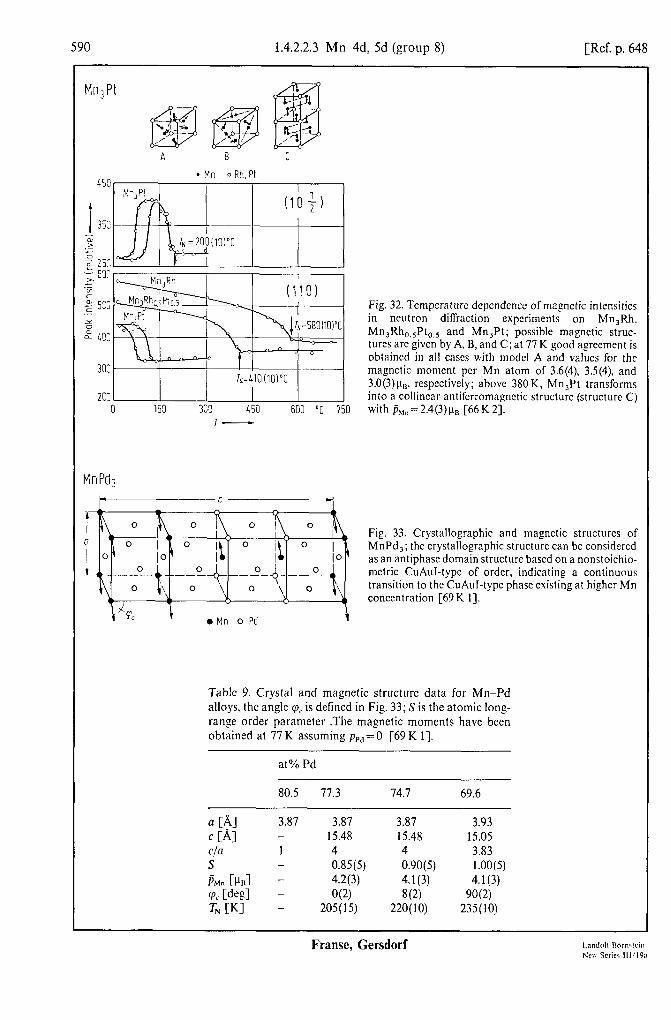
590 1.4.2.2.3 Mn-4d, 5d (group 8) [Ref. p. 648
Mn,Pt
l Mn oRh.PI
b t -1 r,=Llo(lo)"c I
*OS II 0 153 300 150 600 “C 750
7-
MnPd3
Fig. 32. Temperature dependence of magnetic intensities in neutron diffraction experiments on Mn,Rh. M~3~hJ%., and Mn,Pt; possible magnetic struc- tures arc given by A, B, and C; at 77 K good agreement is obtained in all casts with model A and values for the magnetic moment per Mn atom of 3.6(4), 3.5(4). and 3.0(3)u,,. respectively; above 380 K, Mn,Pt transforms into a collinear antifcrromagnctic structure (structure C) with jhln = 2.4(3)u, [66 K 23.
Fig. 33. Crystallographic and magnetic structures of MnPd,; the crystallographic structure can be considered as an antiphase domain structure based on a nonstoichio- metric CuAuI-type of order, indicating a continuous transition to the CuAuI-type phase existing at higher Mn concentration [69 K I].
Table 9. Crystal and magnetic structure data for Mn-Pd alloys, the angle cp, is defined in Fig. 33; S is the atomic long- range order parameter .The magnetic moments have been obtained at 77 K assuming pPd=O [69 K 11.
at% Pd
80.5 77.3 74.7 69.6
fl [Al 3.87 3.87 3.87 3.93 c [Al - 15.48 15.48 15.05 CIA 1 4 3.83 S -
:.85(5) 0.90(5) 1.00(5)
PM” IM - 4.2(3) 4.1(3) 4.1(3) cpc Cd4 - O(2) 8(2) 90(2) Th' WI - 205(15) 220(10) 235(10)
Frame, Gersdorf

Ref. p. 6481 1.4.2.2.3 Mn-Ltd, 5d (group 8) 591
0 100 200 300 NO 500 600 700 "C 801 T-
Fig. 34. Temperature dependence of the magnetic mass susceptibility ofequiatomic MnPd and MnPt; the hyster- esis, depicted by arrows, occurring in MnPd at high temperatures indicates a first order transition between a low-temperature CuAuI-type of structure and a high- temperature CsCl-type of structure [68 P 11.
MnPt
pa” II IO011 P -0 Pd.Pt - B I f --- _
fY / I / - - F --- / / &II ~1001 P#“II Ill01 ppd Pt II [IO01 PPd,PtII LIT01
l Mn 0 Pd,Pt
Fig. 35. Allowed magnetic structures of equiatomic MnX (CuAuI-type of structure) from neutron diffraction ex- periments. The Mn and X atoms are represented by open and solid circles, respectively; X=Pd, Pt; for MnPd the structure is either B or C; for MnPt structure A is found below T, and structure B between T, and TN, see Table 10 [68P 11.
Table 10. Crystal and magnetic structural data at room temperature for Pd-Mn and Pt-Mn alloys; values of the transition temperature T, between different magnetic structures, and the Ntel point TN [68 P 11, see also [66 K 31. For type of magnetic structure, see Fig. 35. The magnetic moments of Mn are room-temperature values, with vanishing pPd and ppt.
Specimen at% Type FMn T, TN Mn 1 ti PB “C “C
Mn Mn
13:;3;:l.lo 1.04
MnPt Mn 1.04pt0.96
Mn 1.13Pt0.87 Mno.d’4.20 Mno.d%.12 MnPd Mnl.ddo.97
45.3 3.97 3.73 B 48.0 3.99 3.67 B 50.3 4.00 3.67 A 52.3 3.99 3.67 A 56.4 3.97 3.71 A 40.1 4.05 3.64 B 44.0 4.06 3.61 B 50.0 4.07 3.58 B 51.6 4.07 3.59 B
4.2(2) 4.2(2) <-268 4.3(2) E440 4.2(2) a510 3.9(2) 4.2(2) 4.4(3) 4.4(4) 4.3(2)
630(20) 680(10) 700(10) 610(20) 420(20) 340(10) 560(20) 540(10) 490(10)
Landolt-BBmstein Franse, Gersdorf
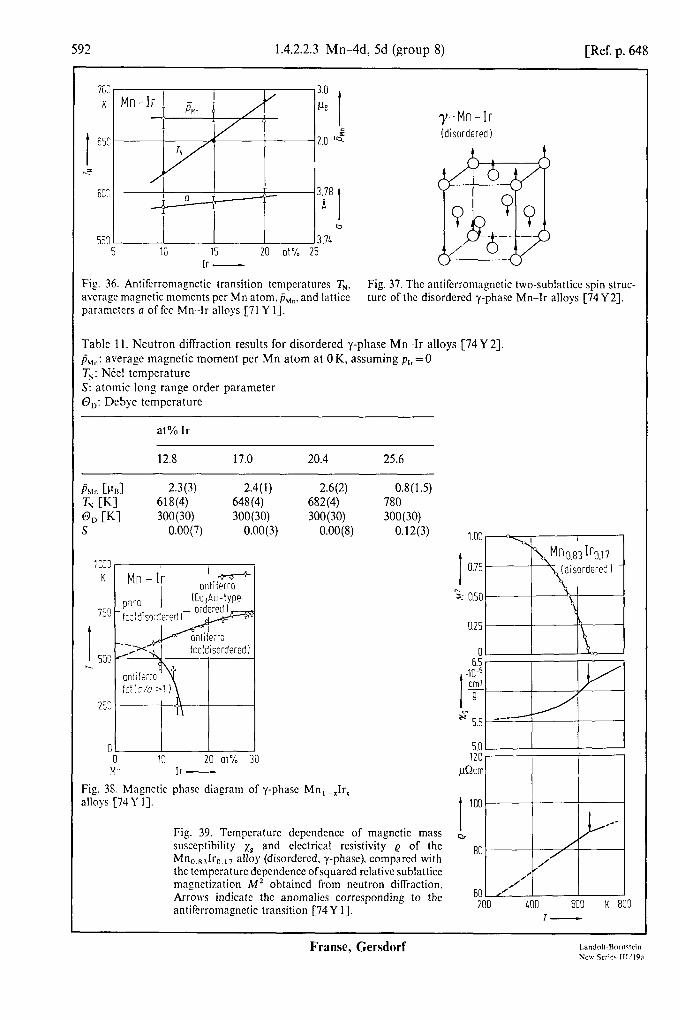
592 1.4.2.2.3 Mn4d, 5d (group 8) [Ref. p. 648
e /
63:
a :
3.78 I 8
D 553 3.7L
5 10 15 20 at% 25 Ir -
Fig. 36. Antifcrromagnctic transition tcmpcraturcs TN. avcra_rc magnetic moments per Mn atom. j&,., and lattice parameters n of fee Mn -1r alloys [71 Y I].
y-Mn-lr (disordered 1
Fig. 37. The antifcrromagnctic two-sublattice spin struc- ture of the disordered y-phase Mn-Ir alloys [74 Y 21.
Table 11. Neutron diffraction results for disordered y-phase Mn-Ir alloys [74Y 21. A,“: average magnetic moment per Mn atom at 0 K, assuming pIr=O Th: N&e! temperature S: atomic long range order parameter 0,: Dehye temperature
at% Ir
12.8 17.0 20.4 25.6
I%!” CPnl 2.3(3) 2.4( 1) Ts ILKI 618(4) 648(4) 0, WI 300(30) 300(30) S O.OO(7) O.OO(3)
1 lCtl1 K Mn-1: ' ++ ontiferro
ontifeiro’ ‘” fct lc/a >I )
252
w
I
0 0 10 20 at%
F11 Ir -
d
I
30
2.6(2) 0.8(1.5) 682(4) 780 300(30) 300(30)
0.00(S) 0.12(3) 1.00
I 0.75
% 0.50
0.25
Fig. 38. Magnetic phase diagram of y-phase Mn, -Jrx alloys [74Y I].
Fig. 39. Tempcraturc depcndencc of magnetic mass a- susceptibility )I~ and electrical resistivity e of the Mn,,,,Ir,,,, alloy (disordcrcd, y-phase). compared with
80
the tcmpcraturc dependence ofsquarcd relative sublatticc magnetization MZ obtained from neutron diffraction. Arrows indicate the anomalies corresponding to the antifcrromagnctic transition [74Y 11.
6y,
Frame, Cersdorf Landolt-Rorn?lcin . - . . ̂

Ref. p. 6481 1.4.2.2.3 MnvId, 5d (group 8) 593
600 600 “C “C
400 400
I I * 200 * 200
0 0
-200 -200 8000 8000
G G
6000 6000
t t 2s 4000 2s 4000 # #
2000 2000
0 0 10 10 20 20 30 30 at% at% 40 40
Mn-
Fig. 40. Saturation magnetization M, and Curie tempera- ture Tc of Pt-Mn alloys near the 3: 1 composition [50 A 11.
16 THz
20 THz
16
I 12
?
8
Fig. 41. Magnon dispersion relation of MnPt, in the three principal symmetry directions at a temperature of 80 K: (a): [loo]; (b): [llO] and (c): [ill]. The data are compared with the dispersion relation of FePd, at 4.2 K (solid curves) as measured by [77 S 11. Horizontal error bars refer to constant-E-type scanqvertical error bars refer to constant-Q-type scans [79P 11.
Landolt-Bornstein New Series 111/19a
Franse, Gersdorf

594 1.4.2.2.3 Mnwld, 5d (group 8) [Ref. p. 648
a
Pi0 f.i d L11 2.2.2
Pt 0.t.t b
Mn 0.0.0 f.o.0 ‘
o.+.o e
Fig. 42. Sections of the magnetization distribution in MnPt, obtained by Fourier inversion of the polarized neutron diffraction data. Contours arc exprcsscd in [pn/A3]. Wavevector of momentum transfer: Q =4n(sinO)/%. (a) l/4 of the section on a basal plane including all reflections out to (sinO)/i.=0.75&‘, (b) l/4 ofthc section parallel to a basal plane through the center of the cell, including all rcflcctions out to (sin 0),/L =0.75 A - I, (c)same as (a), including all rcflcctions out to (sin0)/1.=0.85 A-‘, (d) same as (b), including all rcflcctions out to (sinO)j%=O.fGA-‘, (c) same as (c), integrated over a volume &Y3, where 26 is the edge of the cubic volume ccntcrcd at the point over which the avcragc is taken. 6=a/lO, and (f) same as (d), intcgratcd over a volume 8fi3 with S=a,/lO. In sections (a) to (d), the zero contour lines (dotted lines) enclose regions of ncgativc magnetic density, which rcachcs the lcvcl -0.025 pR/A3 at the center of the Pt site [69A I].
Frame, Cersdorf Landoh-R6rnwin Nex Scrin 111’19n
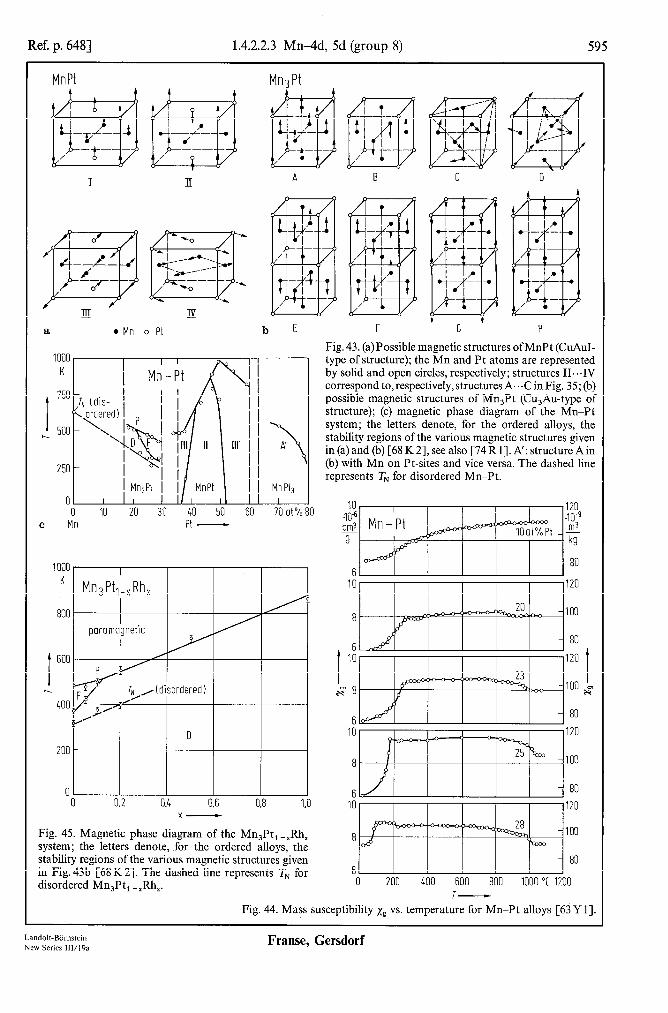
Ref. p. 6481 1.4.2.2.3 Mn-4d, 5d (group 8) 595
MnPt
a l Mn oPt
c Mn Pt -
Mn3Pt
b E
\ A’
MnP& I
70 at%
I h
)OOD 01 0 0.2 0.4 0.6 0.8 1.0
x-
Fig. 45. Magnetic phase diagram of the Mn,Pt,-Jh, system; the letters denote, for the ordered alloys, the stability regions of the various magnetic structures given in Fig. 43b [68 K 21. The dashed line represents TN for disordered Mn,Pt, -,Rh,.
F G H
Fig. 43. (a) Possible magnetic structures ofMnPt (CuAuI- type of structure); the Mn and Pt atoms are represented by solid and open circles, respectively; structures II. ..IV correspond to, respectively, structures A. .C in Fig. 35; (b) possible magnetic structures of Mn,Pt (Cu,Au-type of structure); (c) magnetic phase diagram of the Mn-Pt system; the letters denote, for the ordered alloys, the stability regions of the various magnetic structures given in (a) and (b) [68 K 21, see also [74 R 11. A’: structure A in (b) with Mn on Pt-sites and vice versa. The dashed line represents TN for disordered Mn-Pt.
IO 40-f cm3 9
6
120 .1o-g m3 kg
80
IO 120
8 100
1:
80
I 120 H" 8 100
I .=g
I! 120 80
8 100
6 80
IO 120
8 100
80 6 0 200 400 600 800 1000 "C 1200
i- Fig. 44. Mass susceptibility xp vs. temperature for Mn-Pt alloys [63 Y 11.
Landolt-BOrnstein New Series 111/19a
Frame, Gersdorf

596 1.4.2.2.4 Fe-4d, 5d (group 8) [Ref. p. 648
1.4.2.2.4 Fe alloys and compounds
The FeRu and FeeOs systems, having the hcp phase boundary in the Fe-rich region, allow the study of the magnetic properties of Fe in the hcp phase. For both systems the internal magnetic field has been studied in the antifcrromagnetic state by means of MGssbaucr experiments (Fig. 48).
Fe--Rh alloys near the equiatomic composition have the CsCI-type of structure. At low temperatures the alloys are antiferromagnctic with magnetic moments of 3.3 p,, antiparallel on neighboring iron atoms. Above 320 K the magnetic structure transforms into a ferromagnetic state with magnetic moments of 3.17l.1,~ and 0.97 pu on the Fe and Rh sites. respectively. The magnetic moment distribution for the nonstoichiometric Fe-rich compounds is shonn in Fig. 5 1. The antiferromagnctic-ferromagnetic and ferromagnetic-paramagnetic transition temperatures have been studied as a function of pressure for equiatomic FeRh and Fe,,,,,Rh,,,,,.
The phase dia_eram of the Fc-Pd system reveals two ordcrcd structures: FePd (CuAuI-type) and FePd,; both order ferromagnetically. For FePd the iron and palladium magnetic moments amount to 2.85 pa and 0.35 l.~a, respectively [65 C 11. Different results for the atomic magnetic moments have been reported for ordered FePd,. At 300K: &=2.37(13)p,,. &=0.51(4)p,) [62P I]; in reference [65C 11: ~re=3.10~lj. &,=0.42p11. The iron- rich FeePd alloys show excellent magnetic properties after an appropriate heat treatment and cold-drawing (Fig. 64). Fe-Pd alloys around 30at% Pd, whcrc the transition from the fee to the bee structure occurs, show typical Invar properties: anomalies in the thermal expansion below T, (Fig. 65) and large forced magnetostrictions.
Fe&r alloys have been investi_pated in magnetization experiments in the composition range 30,..70at% Fe. In the Fe-Pt system several types ofmagnetic order have been observed. The Curie temperature as a function
of composition is given in Fig. 72. In Fig. 77 the basic types of magnetic structures for this system are shown. In the composition range 24...36 at% Fe, a change in the type of antiferromagnetic order occurs from parallel iron moments in the (110) planes to parallel moments in the (100) or (010) planes. A value of 3.3 pa has been reported for the magnetic moment per iron atom in FePt, [63 B I]. Above 32at% Fe ferromagnetism becomes predominant. The saturation magnetization for ordered and disordered alloys is shown in Fig. 78. The magnetic ordering temperatures of the ordered and disordered FePt, phase depends on composition as indicated in Fig. 75 and Table 15. In the pseudobinary scrics of Fc(Pd,Pt 1 -X)3 a transition from a ferromagnetic state as in FePd, to an antiferromagnetic state as in FePt, occurs near x=0.5. In the intermediate region an additional magnetic transition from a high-temperature ferromagnetic to a low-temperature canted-ferrimagnetic structure is found (Figs. 93 and 94). The ordered equiatomic FePt alloy (CuAuI-type of structure) is hard to magnetize. A value for the mean atomic magnetic moment of 0.77 pn has been reported. By disordering FePt the bulk magnetization increases considerably. From these observations ferrimagnetic order was concluded for the ordered compound. Neutron diffraction studies. however, point to Fe magnetic moments at 300 K of 2.8( 1) p,,. parallel to the c axis. whereas Pt moments could not bc determined [73 K 51. In [74 M 23 the hypothetical values pFc = 2.75 pr, and ijp, = -0.25 11,~ arc mcntioncd for the ordered FePt compound. The Fc-Pt alloys near the 25 at% Pt composi- tion show invar characteristics as well in the Cu,Au-type ordered state as in the disordered state. At low tempera- ture these alloys undergo a martcnsitic transformation. The results of magnetic moment and Curie tempera- ture studies on ordcrcd and disordcrcd alloys with 20,..30at% Pt arc given in Figs. 85, 86. Anomalies in the thermal expansion arc of a similar type as those in Fe-Ni invar alloys (Fig. 87).
Survey
X Property Fig. Ref.
Fe, -.A
Fe, -,Rh,
FeRh
Fe, -,Rh, FcRh
0.1 <x<l 0.15<x<o.40 0.7<x<l 0.6<x<l 0.1 <x <0.5 0.49<x<o.51
0.495<x<o.51
Llw. 4w TM. H,,,(x) L(X) L(X) ILW. Pr;c. Pdx) C/T(T”) 4w H,,(T) AM T) magn. phase diagr. magn. phase diagr.
46, 47 69Fl 48 710 1 49 70V 1, 76V 1 49 7OV1,76Vl 50, 51 64S1 52 69Tl 54 53 70Ml 55 56, 57 76V2 58 74Dl
Frame, Gersdorf I nndolt-hrnrrein Kcu Serier III ‘19.1

Ref. p. 6481 1.4.2.2.4 FeAd, 5d (group 8)
Survey, continued
X Property Fig. Table Ref.
Fe, -,Pd,
FePd,
Fe, -xPd, FePd, Fe, - .Pd,
Fe o.mPdo.3~ Fe, -,Pd,
Fe, -xOs, Fe, -.Jrx Fe, -xPt,
FePt, Fe,Pt FePt Fe, -,Pt, Fe,Pt
Fe, -,Pt,
Fe,Pt Fe, -xPt,
Fe, -,Pt, WP4 -JU
O<x<l
0.50 <x < 0.97
0.50 <x < 0.75 0.18<x<O.53
0.315<x<O.376 0.30 <x < 0.45 0.75<x<l 0.29<x<o.35 0.15, 0.20 0.3<x<l O<x<l
0.7<x<O.8 x=0.737 0.61 <x<O.73 0.64<x<O.76 0.65<x<O.76 0.25<x<o.90 0.1 <x<o.9 0.68<x<O.75 0.64<x<O.77 0.62<x<O.75 ordered ordered x = 0.28, x = 0.25 ordered
0.25<x<O.335 0.25 < x < 0.32 0.29<x<o.35 x=0.28 0.24 <x < 0.21 0.20 <x < 0.32 0.22 <x < 0.32
0.28<x<O.34 0.28 <x < 0.34
0.26<x<O.33 x = 0.47, x = 0.5
x = 0.47 x=0.585, x=0.625 0.4<x<o.7 O<x<l
T,(x) L(x) pFe=2.73(13)pB iipd = o.5 1 c4) PB
~cell = 4.26(8) FB
PFFeM PPdc4 spin wave dispersion f&,,(x) K(x), f4(4, W%,x WV, W(T) XHF(X) magnetostriction K,(x) TAP) TN> K,,,(x) xm(xb a,(T) T,(x) Pat(x) TN(x), @(4 x,(T) a(H, T, x) TN(x) H,,,(T), TN(x), T,(x) magn. structure Pa,(x) MW, 4 Hh,,(x), TN(x), T,(x)
T,(P) a(T) I%+ =2.8(l) PB
Pat7 xg pol. neutron diff. FFe = 2.03 t2) PB
PP, = OW3 PB
T,(P), a,b> Pa,(x), A~/VT), 4~) T,(P) MO us i%,(x) T,(x)> T,(x) T, (annealing time) XHF(X~ T>
&IFtXa T>
a(H) K,(x) a(T) magn. structure hysteresis hysteresis, anisotropy T,(x)> TN(x) as(x)a xHFtX)
59 60
61, 62 63 64 65 66 67 68 69 48 70, 71 72 60 73 74 75 76
77 78 79
80 81
82, 83 69 84
85 86, 87 88 89 90 91 92 93 94 95 96 97 98
36F1 59c2
62Pl
12, 13 65Cl 77Sl 77R2 81W2 83Tl 83Yl 83Ml 80Kl 68Wl 710 1 70M2 50Kl 59c2 59Cl 59Cl 63B 1 63B 1
14 69Pl 74M2 74M2 78V2
15 69Vl 16 74Nl
75Ml 73K5
17 73Sl 7411
18 75A4 78Nl 68Wl 81H3
19 81S2 83Sl 83Sl 82H2 83Yl 83Y2 83Y2 82Yl 69K2 69K2 73K4 7782 81T2 81T2
Landolt-Btxnstein New Series 111/19a
Frame, Gersdorf
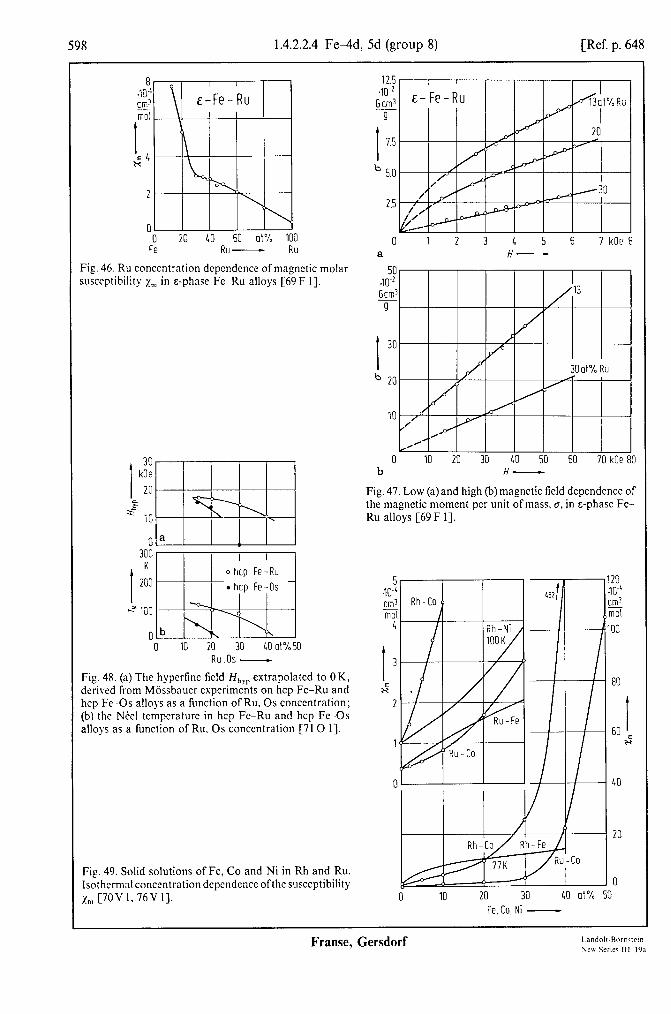
598 1.4.2.2.4 Fe-4d, 5d (group 8) [Ref. p. 648
.10.! cm! Ei
I El* u
8 8 .10.’ cm! x
I El* u
2 2
0 0 F”, F”, 20 20 40 40 60 60 at% at% 100 100
Ru- Ru- RU RU
Fig. 46. Ru concentration dcpcndcncc of magnetic molar ;usccptibility zrn in E-phase Fe Ru alloys [69 F I].
I 30
kOe 20
F r z 10
Ru .Os -
Fig. 48. (a) The hyperfine field H,,, extrapolated to 0 K, derived from Miissbauer expcrimcnts on hcp Fe-Ru and hcp Fe -0s alloys as a function of Ru. OS concentration; (b) the N&l tempcraturc in hcp Fe-Ru and hcp Fe -0s alloys as a function of Ru, OS concentration [71 0 I].
Fig. 49. Solid solutions of Fe, Co and Ni in Rh and Ru. Isothermal concentration dependence ofthc susceptibility lrn [7OVl,76Vl].
12.5 w2
!ic& 9
I 1.5
b 5.0
25
0 1 2 3 4 5 6 7 kOe 8 a H-
50 m2 JCJJG
9
I 30
b 20
10 / / Hpl ,/ .’
0 10 20 30 40 50 60 70 kOe 80 b H-
Fig. 47. Low (a)and high (b) magnetic field dependence of the magnetic moment per unit of mass, o, in E-phase Fe- Ru alloys [69 F 11.
5 m cm3 iii3
4
20 30 40 at% 50
Fe, Co. NI -
Frame, Gersdorf
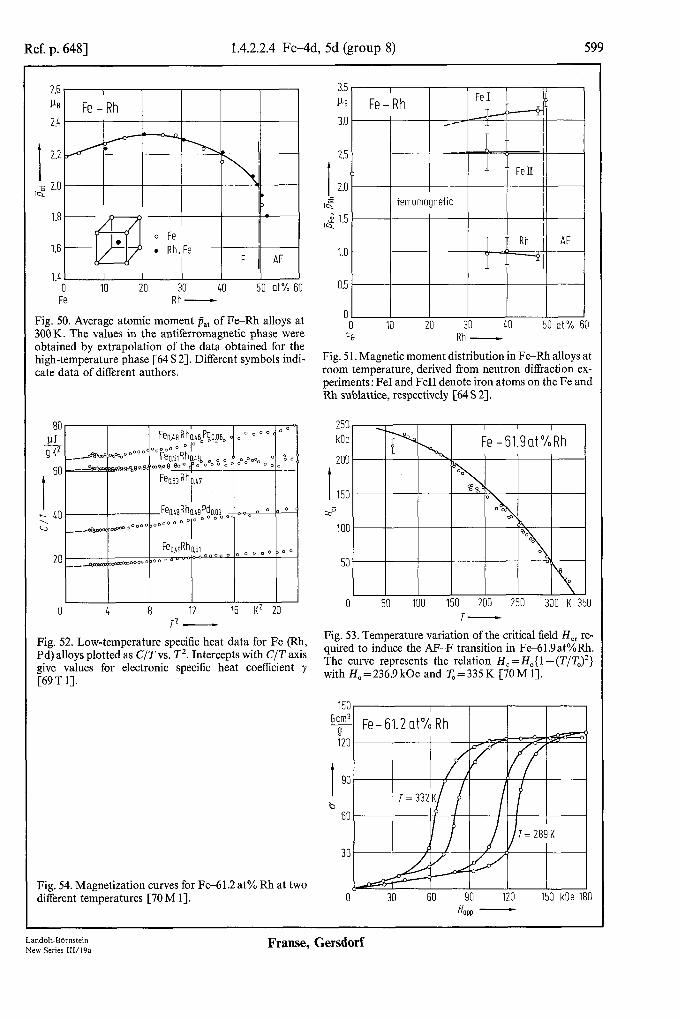
Ref. p. 6481 1.4.2.2.4 FeAd, 5d (group 8) 599
2.6 3.5
I-lB PB
2.4 3.0
I 2.2 2.5
,z 2.0 I 2.0
I$ 1.8 9 IQ 1.5
1.6 1.0
1.4 0 IO 20 30 40 50 at% 60 0.5 Fe Rh -
Fig. 50. Average atomic moment & of Fe-Rh alloys at 0
300K. The values in the antiferromagnetic phase were 0 IO 20 30 40 50 at% 60
Fe Rh - obtained by extrapolation of the data obtained for the high-temperature phase r64 S 21. Different symbols indi- Fig. 51. Magnetic moment distribution in Fe-Rh alloys at
room temperature, derived from neutron dilfraction ex- cate data of different authors. periments- Fe1 and Fe11 denote iron Rh sublattice, respectively [64 S 21.
atoms on the Fe and
60
t
I I I I I
0 4 8 12 16 K2 20 12 -
250 kOe
200
t 150
2
100
0 50 100 150 200 250 300 K 350 T-
Fig. 52. Low-temperature specific heat data for Fe (Rh, Fig. 53. Temperature variation of the critical field H,, re-
Pd) alloys plotted as C/T vs. T'. Intercepts with C/T axis quired to induce the AI-F transition in Fe-61.9at%Rh.
give values for electronic specific heat coefficient y The curve represents the relation H, = Ho{ 1 -(T/T,,)*}
[69 T 11. with H, = 236.9 kOe and To = 335 K [70 M 11.
150 Gem”
9 120
t 90
b 60
Fig. 54. Magnetization curves for Fe-61.2 at% Rh at two different temperatures [70 M 11. 0 30 60 90 120 150 kOe 180
H OPPl -
Landolt-Bbmstein New Series 111/19a
Franse, Gersdorf
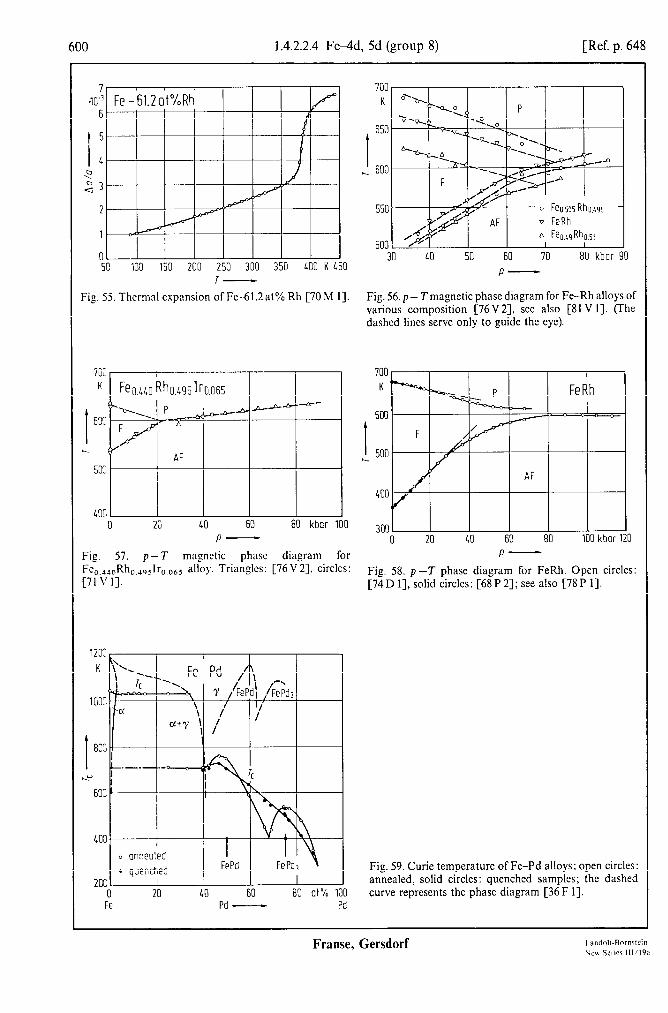
600 1.4.2.2.4 FewId, 5d (group 8) [Ref. p. 648
.,& 6
1
0 50 100 150 200 250 300 350 LOO K 450
T-
30 40 50 60 70 80 kbor
P-
Fig. 55. Thermal expansion of Fe-.61.2at% Rh [70M I]. Fig. 56. p - T magnetic phase diagram for Fe-Rh alloys of various composition [76V2], see also [81 V I]. (The dashed lines serve only to guide the eye).
7lx 7lx I K K F’Jo.uo Rho.ux lro.o65
633
5OC 5OC
4OG 4OG I 0 0 20 20 40 40 60 60 80 80 kbor 100 kbor 100
P-
700, I I I I I I K
600
3OOY 0 20 40 60 80 100 kbar 120
Fig. 57. p-T magnetic phase diagram for P- Rh, .,nslr,,,,, alloy. Triangles: [76 V 21, circles: Fig. 58. p--T phase diagram for FeRh. Open circles:
[74 D I], solid circles: [68P 23; see also [78P 11.
403 I o annealed ’ i
l quenched FePd I’\ FePd3
2oc I I 0 20 40 60 80 at% 100 Fe Pd - Pd
Fig. 59. Curie temperature of Fe-Pd alloys; open circles: annealed, solid circles: quenched samples; the dashed curve represents the phase diagram [36 F 11.
Frame, Gersdorf

Ref. p. 6481 1.4.2.2.4 Fe&d, 5d (group 8) 601
Table 12. Atomic magnetic moments in Pd-Fe alloys from neutron diffraction [65 C 11. The values listed for pa, refer to zero temperature.
3 0.234(7) 2.9(3) 2.92(15) 3.07(H) 0.15(l) 7 0.457(14) 3.0(2) 2.76(11) 3.02(11) 0.26(2)
25 LOO(3) 2.9(2) 2.64(15) 2.98(15) 0.34(5) 50 1.60(5) 3.0(l) 2.49(11) 2.85(8) 0.35(S)
‘) From large-angle magnetic diffuse scattering data, assuming no Pd contribution and the metallic Fe form factor.
Table 13. Summary of atomic magnetic moments for Pd-Fe and Pd-Co alloys [65 C 11.
Alloy tjFe, Co
PB
DPd
Pdo.deo.03 3.07 0.15 Pdo.93Feo.07 3.02 0.26 Pd,Fe 2.98 0.34 Pd,Fe ‘) 3.10 0.42 PdFe 2.85 0.35 Pd,Co 1.97 0.48 PdCo 1.97 0.35
I) Ordered.
- ‘.
-i-..\ Fe-Pd b
'L \ ‘f.
\ \ ( \ FePd
1.6
0.6
0.4
0.: 2
\ 0
0 IO 20 30 40 50 60 70 80 90 at%100 Fe Pd, Pt - Pd
Pt
Fig. 60. Magnetic moment per atom, j,,, in Fe-Pd and Fe-Pt alloys (open circles and triangles [36F 11; solid circles [59 C 21; solid triangles [SS G 11).
Land&BBmstein New Series 111/19a
Franse, Gersdorf
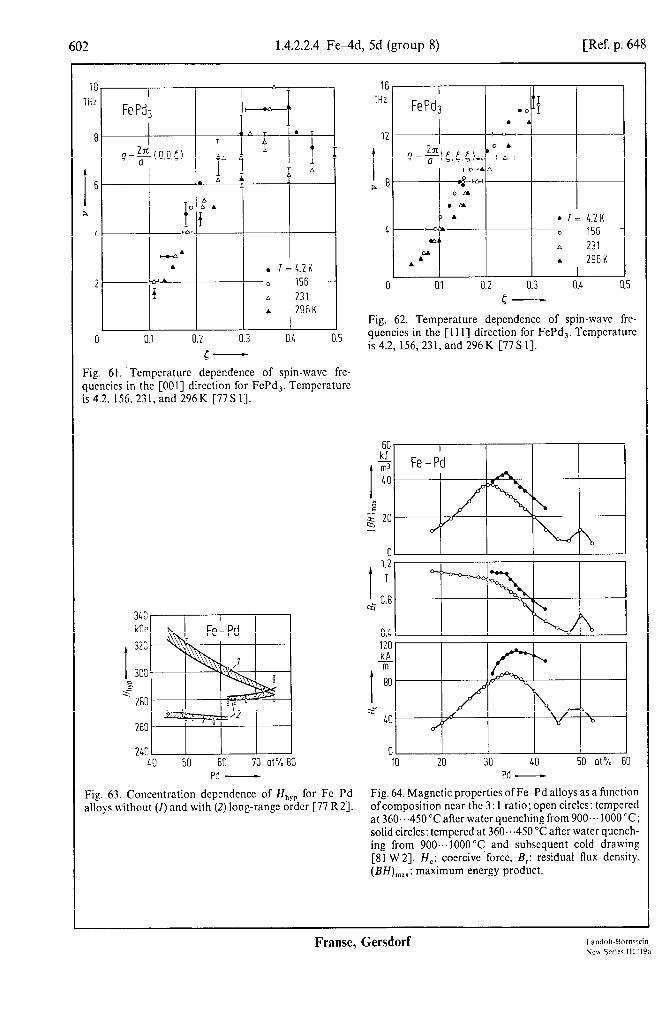
602 1.4.2.2.4 Fe-4d, 5d (group 8) [Ref. p. 648
10 I Ttiz
FePd3
8
2 . r=l.ZK
- 0 156 A 231 . 296K
0 0.1 0.2 0.3 0.4 0.5
b-
Fig. 61. Temperature dependence of spin-wave fre- quencies in the [OOI] direction for FcPd,. Temperature is 4.2, 156. 231, and 296 K [77 S I].
340 kOe
I 320 303 !2 c
x 280
260
210 40 50 60 70 ot% 80
Pd -
Fig. 63. Concentration dependence of HhVp for Fc--Pd alloys without (I) and with (2) long-range order [77 R2].
16 I THZ FePd3 .O
I . .
Fig. 62. Temperature dependence of spin-wave fre- qucncics in the [I 1 I] direction for FcPd,. Temperature is 4.2, 156, 231, and 296 K [77 S I].
I 1.2 T
6 0.8
0.1 120 kA
-iii
I 80
" x 40
120 kA
-iii
I 80
" x 40
0 10 10 20 20 30 30 40 40 50 50 at% 60 at% 60
Pd -
Fig. 64. Magnetic properties of Fe-Pd alloys as a function ofcomposition near the 3: I ratio; open circles: tempered at 360...45O”C after water quenching from 900... 1000 “C; solid circles: tempered at 360...450 “C after water quench- ing from 900.. .lOOO”C and subsequent cold drawing [81 W 21. H,: coercive’forcc, B,: residual flux density, (BH),,,: maximum energy product.
Frame, Gersdorf

Ref. p. 6481 1.4.2.2.4 Fe-4d, 5d (group 8) 603
11 10: G
7
c I-
8
7
I 6
x 5
4
3
2
1
0 100 200 300 400 500 600 7OO"CEOO
r-
Fig. 65. Thermal expansion and magnetization vs. tem- perature curves for a 31 at% Pd-Fe alloy, subject to cold-drawing and quenching, respectively; solid circles: 75% cold-drawing after annealing at 1200 “C for 170 h; open circles: water-quenched after annealing at 1200 “C for 170h [83Tl].
180 w6
150
I
fct I fee Fe -PC'
120
1
90
Iti 60
30
0
-3q
'
1
I I I I I
33 36 39 42 at% 45 Pd -
E 40: &lJ 9
I
4
L3 <
2
1
0
.I[ C
7
t L x'
6- 1-4 m3
:-
4-
3-
Fe-id I
H= 4OkOe 110011
A 31.5 at% Pd - . 31.9
0 34.2 . 37.6
Fe-Pt I I I I
l-
Ob I I I I 200 300 400 500 600 K 71
I-
Fig. 66. Temperature variation of the high-field mass susceptibility xHF for (a) Fe-Pd and (b) Fe-Pt invar alloys [83Y 11.
Fig. 67. Composition dependence of the mean mag- netostriction constant A = 2/5& + 3151, r 1 at 4.2 K and 301 K, and the forced magnetostriction aw/aH at 4.2 K for Fe-Pd alloys. The dashed line indicates the phase bound- ary of fee and fct structures at 4.2 K [83 M 11.
Landolt-Bbmsfein New Series II1/19a
Franse, Gersdorf

604 1.4.2.2.4 Fe--4d, 5d (group 8) [Ref. p. 648
1, 1 / / I .lO" erg cm!
. Pd - Ni o Pd - Fe A Pd -Co A Pd -Co
-2 !%a 0 10 20 at% 30
-2 - 0 10 20 at% 30
Fe.Co,Ni -
Fig. 68. Plots of mn_enctocrystallinc anisotropy constant Ki at 4.2 K as a function of x for Pd-(Fe, Co. Ni) alloy ;ystems [80 K I].
10.0 40.‘ . cm3 . Fe-Ir - *A
0
mol .
I
. 0 . 0
E 5.0 0 H &
A 2.5 n
0
,I <I
0 0 25 50 75 at% 100
Fe Ir - Ir
Fig. 70. Composition dcpcndenccs of the molar susccpti- bility z, and the electronic spccilic hcnt cocflicicnt 7 for Fe Ir alloys. T=4.2 K: solid circles [70M 21. open circles [66 G I]: T = 300 K : solid triangles [70 M 21. open triangles [66 G I].
0 K
kbar
1 -2
5 -3
;;;r-l$
-5 I . x=0.250
Fe:.,Pt, - l o Fe.!.,Pd,
-6 1 I
300 350 600 150 500 550 600 653 K 70: I-
Fig. 69. Pressure derivative of the Curie tempcraturc as a function of T, for Fe,-,Pt, alloys (solid circles) and Fe, -xPd, alloys (open circles) [68 W 11.
9 9 Gcmj Gcmj mol mol
I I 8 8
d d
7 7 I o 0
= 10 kOe I
6 0 50 100 150 200 K 253
T- Fig. 71. Tcmpcraturc dcpcndencc of the ma_enetic moment U, of Fe-Ir alloys in an applied held of IO kOe
60> 200 K 253 T-
Fig. 71. Tcmpcraturc dcpcndencc of the ma_enetic moment U, of Fe-Ir alloys in an applied held of IO kOe [70 M 23. “’
600
200
i > cs onneoled
O quenched I 01 I
0 20 LO 60 80 ot"/ 0 19c Fe Pt - Pt
Fig. 72. Curie temperature of Fe-Pt alloys; open circles: qucnchcd. crosses: annealed samples [SO K I]; solid circles: [.59 C 21.
Frame, Gersdorf

Ref. p. 6481 1.4.2.2.4 FewId, 5d (group 8) 605
70 18 18 20 20 22 22 24 24 26 28 26 28 30 at% 32 30 at% 32
300 I I r K Pt- FEY (annealed) I/ Tc I
I 130
z 110
90
Fig. 73. Variation of 0 (a) and TN (b) with composition for annealed Pt-Fe alloys [59 C 11.
Pt - Fe (ordered)
I b
6nI
0 100 200 300 K 400 T-
15 40"
t
s Cl%
IO
-5
5
0 200 400 600 K 800 T-
Fig. 74. Mass susceptibility xp of annealed Fe,,,,,Pt,,,,, alloy [59 C 11.
I b
1 I
@f 29 at%Fe T=141 K
I I / P 1103 I I/d A
b
0 5 IO I5 kOe 20 0 5 IO kOe 15 H WI - Hoppi -
Fig. 75. Magnetization curves at different temperatures for ordered Pt-Fe alloys, containing 26.7 and 29 (nominal) and 32.7 and 34.3 (analyzed) at% Fe. The numbers denote the temperatures in [K]. Curves drawn with open circles are for a region where magnetization increases with decreasing temperature; when solid circles are used there is a decrease of magnetization with decrease of temperature [63 B 11.
Landolf-Biirnstein New Series 111/19a
Franse, Gersdorf

606 1.4.2.2.4 Fe-4d, 5d (group 8) [Ref. p. 648
28 30 32 311 ot% 36
Table 14. “Fe hyperfine field Hhyp at 4.3 K and mag- netic ordering temperatures of various ordered Pt-Fe alloys [69 P 11. A: antiferromagnetic; F: ferromagnetic.
at% Fe Hhyp (4.3 K) T Order kOe K
24.0 305 212 A 24.5 305 170(l) A 26.7 297 171(l) A 30.0 288 145(l) A 34.5 310 255(2) F
Fe -
Fig. 76. Variaton bvith composition of the N&cl tempcra- tures of ordered Pd-Fe alloys, determined from the tcmperaturc depcndencc of the neutron diffraction inten- sities ofthc 400. g;O reflections. rcspcctivcly [63 B I]. In a limited range of composition two magnetic structures with diErent N&cl tempcraturcs coexist at low tempcrnturcs.
Table 15. 57Fe hyperfine field of ordered and disordered Pt-Fe alloys and values for TF; and T, [69V 11.
at% Fe Antiferromagnetic structure Ferromagnetic structure
Hhjp (77 K) kOe
TN K
H,,yp (77 K) kOe
T, K
23.1(l) 280(5) 170(2) 330(5) 368(2) 28.0( 1) 275(5) 155(2) 330(5) 400(2) 33.1(l) 260(5) 131(2) 330(5) 458(2) 36.0( 1) - - 285(5) ‘) 270(2) ‘)
330(5) 2, 513(2) 2,
‘) Ordered. 2, Disordered.
Fig. 77. The basic types ofmngnctic structures in ordered Fe -Pt compounds: solid circles indicate Fe, open circles Pt atoms [74 M 21.
FePt3 I
0
a
01 0 0
% / 0
i
W%l
’ 0
@
&’ A ? 0 -- -
/ 0
FePt 1 1
Fe?Pt
l Fe 0 Pt
Franse, Gersdorf

Ref. p. 6481 1.4.2.2.4 FeAd, 5d (group 8) 607
2.5 I l-b Pt-Fe /'
550 550, K K P, I I Feb,Pt, I I I
500 500
I I 450 450
hy KJo hy KJo
350 350
300 300
250 250 0 0 IO IO 20 20 30 30 40 40 50 50 60 60 70 70 kbor: kbor:
P- P-
2.0
t
1.5
1:
0.5
ov Y 1 0 20 40 60 80 ot% 100
Pt Fe - Fe
Fig. 78. Concentration dependence of the mean atomic magnetic moment of Pt-Fe alloys in the disordered (open circles) and ordered (solid circles, triangles) states [74 M 21. Solid curve: theoretical.
Fig. 80. Tc of disordered Fe, -xPt, alloys as a function of pressure: I: x=0.62, 2: 0.64, 3: 0.69, 4: 0.728, 5: 0.75 [74N 11.
Table 16. Curie temperature and its pressure deriva- tive for disordered Pt-Fe alloys [74N 11.
at% Fe Tc K
- dTcldp Kkbar-’
-I/T,. i3TJap 10m3 kbar-’
25.0 375(2) 1.6(l) 4.3(3) 27.2 405 (2) 1.7(l) 4.1(3) 31.0 457(2) 2.2( 1) 4.9(3) 36.0 510(2) 2.8(l) 5.5(2) 38.0 529(2) 3.0(l) 5.6(2)
60
x45 I
I 120
2 90 2 I
30 60
15 30
0
30.6ot% Fe I I
30 60 90 120 kOe 1 0 30 60 90 120kOe150 0 30 60 90 120 kOe 150 a N- b H- c H-
Fig. 79. Magnetization curves ofsingle crystals ofordered Pt-Fe alloys at 77K: (a) 25.2at% Fe; solid circles: H~~[llO];opencircles:H~~[001];solidtrianglesH~~[111]; open triangles: HI/[lOO]; (b) 28.0at% Fe; solid circles: HII[lOO]; open circles: HI/[lIO]; triangles: HII[lll];(c) 30.6at% Fe; 1: HII[lOO]; 2: Hjl[112]; 3: HII[llO]; 4: Hll[lll] [78V2].
Landolt-Bbrnstein New Series 111/19a
Franse, Gersdorf
608 1.4.2.2.4 Fe-4d, 5d (group 8) [Ref. p. 648
Table 17. Magnetic moment and mass susceptibility of Fe-Pt compounds at 4.2 K [73 S 11.
Fe,Pt Fe 0.72pt0.28
ordered ordered disordered
a, [Gcm3g-‘1 133.7
Pa, bnl 2.17 xE [10w6cm3g-‘1 16.4
126.8 125.6 2.15 2.13 8.6 12.6
, F_ePt(dis ”
I
Fig. 81. Temperature dcpcndencc of the magnetic mo- ment per unit of mass measured in an applied magnetic lisld of 6kOc for ordered FePt, disordcrcd FcPt, and ordered Fc,Pt [75 M I].
0 100 200 300 LOO 500 600 700 K 3 T-
Fig. 87. Fractional volume change AV/Vagainst tempcra- ture for the Fe,,,2 Pto,2R alloy. The open and solid circles indicate the results for the ordered and disordcrcd states, respectively [78 N I].
Table 18. Curie temperature, its pressure derivative, and the relative pressure dependence of the magnetic moment near 0 K for disordered Fe-Pt alloys [75 A 43.
at% Pt T, - d Wdp - I/a,. aa,lap K K kbar-’ 10e2 kbar-’
26.0 390 4.0(l) - 27.0 414 3.8(l) 0.83(7) 27.8 445 3.4(l) 27.9 448 3.2(2) 0.43(3) 28.4 462 - 0.33(3) 31.3 544 2.2(l) 0.19(3) 31.4 543 - 0.16(3) 32.0 554 2.1(2) - 33.5 583 1.9(2) 0.16(3)
‘8 I 40-2
0
5; 1.1 - 77 3
Cl ordered
1.0 b . disordered P 21 26 28 30 32 at% 3L
PI -
Fig. 83. (a) Concentration dcpcndcnce of the magnetic moment per atom at 4.2K, and (b) concentration de- pendence ofthe spontaneous volume magnetostriction at OK, o,(O), for Fe-Pt alloys. The open and solid circles indicate the results for the ordered and disordered states, respectively. The full lines show the results estimated from the number of Fe atom pairs [78 N 1).
Franse, Gersdorf
Ref. p. 6481 1.4.2.2.4 Fe&d, 5d (group 8) 609
1.00 I 0.75
XT .z
L$ 0.50
s
0.25
0
FeO.72 Pt 0.28 1
(disprdered) T=4.2K
5 IO 15 20 kbor J 25
P-
Fig. 84. Pressure dependence of the magnetization at 4.2 K and room temperature for a disordered Fec,,,Pt,,,,, invar alloy [Sl H 31.
a 20 22 24 26 28 3 10 at% 32 201 Pt - Pt -
2.4
Ps
2.3
t 2.2
12 2.1
2.0
1.9 b ;
. disordered, I I I
Table 19. Magnetovolume coupling constant, XC, defined as ccs=xCM2, for ordered Fe-Pt alloys [Sl S2].
at% Pt 24 25 26 27
XC [10-gG-2] 10.8 8.4 7.7 6.8
7oc K
601:
501
I-
l-
I-
l-
l-
I-
I Fe - Pt
+
24 26 28 30 Pt -
32 at%
101
Fig. 86. Curie temperature Tc and martensitic transition temperature TM for Fe-Pt alloys as a function of Pt content near the FePt, composition; open symbols: ordered alloys; solid symbols: disordered alloys. Differ- ent symbols refer to the results of different authors.
22 24 26 20 30 ot% 32 Pi -
Fig. 85. (a) Phase boundary of Fe-Pt allloys with 20...30at% Pt at 4.2 K, estimated from magnetization measurements; the hatched region indicates a two-phase region; (b) concentration dependence of the magnetic I moment for Fe-Pt alloys; open circles: ordered solid circles: disordered alloys [83 S 1-j.
$
z2
Fig. 87. Fractional volume change AVIV vs. temperature for FeP t alloys around the y - CI phase boundary; arrows indicate the Curie temperature Tc and the martensitic transition temperature TM, as well as increasing and decreasing temperature [83 S 11, see also [83 0 1] and I I ,lh , I I I C83Y3-J. 0 100 200 300 400 500 600 700 K 800
T-
Landolt-Bornstein Franse, Gersdorf New Series 111/19a
610 1.4.2.2.4 Fe&d, 5d (group 8) [Ref. p. 648
i-
I-
j-
I- !G 2 253 303 353 400 450 500 550 K 600
7-
1.0
1 I rr, 0.5
:
0
0
3.735 A
3.730
3.725
b 1 u 0 , 0 ( J 200 I 0.25”E 0” s
auenched 10 102 103 1OC min 10’
Anneoling time -
Fig. 88.Ordcr paramctcr S, Curie tcmpcrature T,, lattice constant II, half-value width of supcrlatticc line W(IO0) and half-value width of fundamental line W(l 1 I), plotted against annealing time at 873 K for Fc,Pt alloy [82 H 21.
Fig. 89. Temperature variation of the high-ftcld mass susceptibility xrrr for Fe opt invar alloys [83 Y I].
PI -
Fig. 90. High-field mass susceptibility xur of Fe-Pt disordered alloys at 4.2 K (open circles) and 77 K (solid circles) vs. concentration [83 Y 21.
Frame, Gersdorf
Ref. p. 6481 1.4.2.2.4 Fe-4d, 5d (group 8) 611
125.5 @
9 125.0
124.5
124.0
123.5
I 123.0 1 111.5 1 111.5
b Gcm3 b Gcm3
1191.0 1191.0
110.5 110.5
110.0 110.0
109.5 109.5
109.0 109.0 0 5 IO 15 T :
B eff -
Fig. 91. Magnetization curves of two disordered Fe-Pt alloys at 4.2 K and 77 K [83 Y 21.
I -1 b
15
Fe Pd 1.5 Pt1.s IO I \
II 'A 25kOeJ /
/I \ ‘,
5 ----- ‘, \.
\ --..
----.A ‘\ ’
---. ,---‘?2.5 kOe ‘+;\ I 7
I I I I I I I
0 50 100 150 200 250 K 300
Fig. 93. Magnetic moment per unit of mass, CT, vs. temperature curves at different fields for FePd,,,Pt,,, and FeP4.5%5; the maximum at about 140K in the FeP4.8b curve corresponds with a change from simple ferromagnetism at high temperatures to a low- temperature ferrimagnetic state with canted Fe moments, see also Fig. 94 [69 K 2-J.
erg cm3
I 2.5
-2.5
Fe- Pt (disordered)
-7.51 25.0 27.5 30.0 32.5 at% 35.0
Pt -
Fig. 92. Value of the magnetocrystalline anisotropy constant K, measured at 4.2 K by extrapolating to zero field for disordered Fe-Pt alloys as a function of Pt concentration [82Y 11, see also [8OY 11.
FePd1.s Pt1.4
Fig. 94. Low-temperature canted-ferrimagnetic structure of FePd,,,Pt,,, [69 K 2-j.
Land&-Bdmstein New Series lWl9a
Franse, Gersdorf
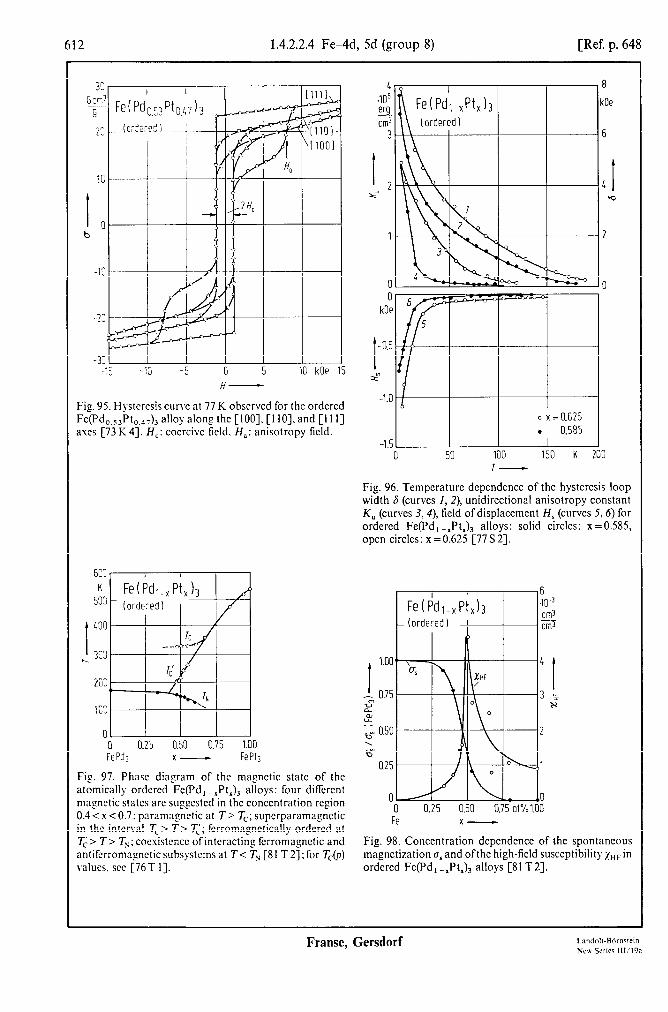
612 1.4.2.2.4 Fe-4d, 5d (group 8) [Ref. p. 648
:c
I C b
H-
Fig. 95. Hystcrcsis curve at 77 K observed for the ordered W’do.,J’t ,,J,)j alloy along the [ IOO], [ 1 IO], and [ 11 I] axes [73 K 43. H,: coercive field. H,: anisotropy field.
0.25 0.50 0.75 1.00 FePd3 x- FePl3
Fig. 97. Phase diagram of the magnetic state of the atomically ordered Fe(Pd, -xPt,), alloys: four diffcrcnt magnetic states arc suggested in the concentration region 0.4 < x < 0.7: paramagnctic at T > T,; supcrparamagnctic in the intenal T,> T> T& ferromagnetically ordered at TG> T> T,: cocsistcncc ofintcracting fcrromagnctic and antifcrromagncticsubsystcms at T< TN [8l TZ];for T,(p) values. see [76 T I].
0 kOe
-1.5 0 50 100 150 K 200
I-
Fig. 96. Tempcraturc dcpcndencc of the hysteresis loop width S (curves 1,2), unidirectional anisotropy constant K, (curves 3,4), field of displacement H, (curves 5,6) for ordered Fe(Pd, -rPtr)3 alloys: solid circles: x=0.585, open circles: x = 0.625 [77 S 21.
- 6 0.50 \ d
025
0
1 1
3 - x’
2
1
0 -0 0.25 0.50 0.7501%1.00 Fe x-
Fig. 98. Concentration depcndcncc of the spontaneous magnetization gS and ofthc high-field susceptibility zHF in ordered Fe(Pd, -.Pt,), alloys [8l T2].
Frame, Gersdorf
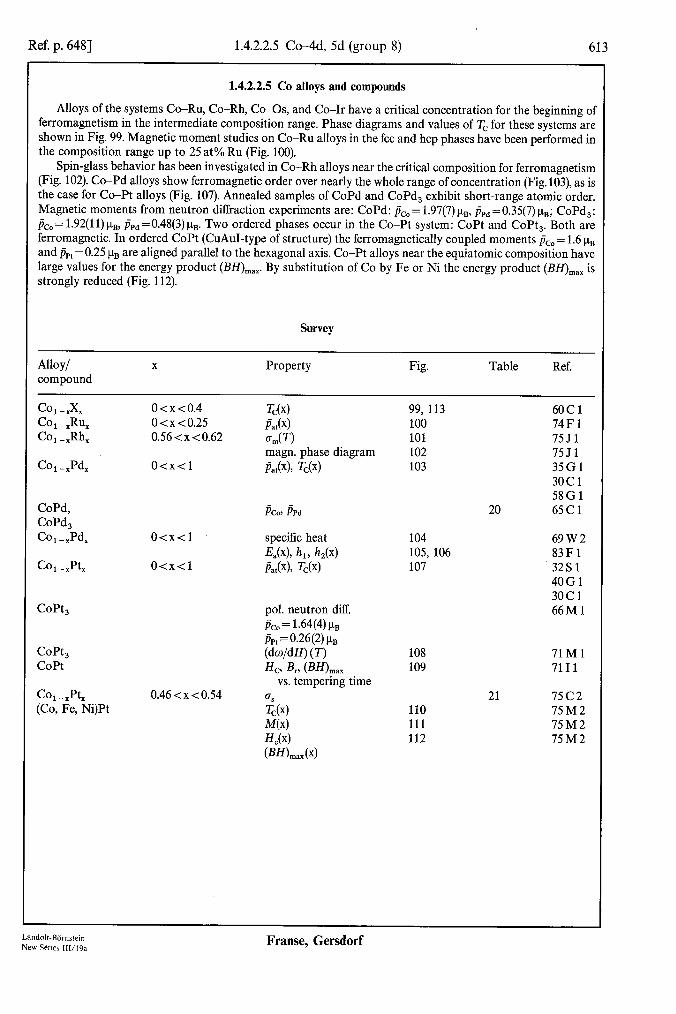
Ref. p. 6481 1.4.2.2.5 Co-4d, 5d (group 8) 613
1.4.2.2.5 Co alloys and compounds
Alloys of the systems Co-Ru, Co-Rh, CO-OS, and Co-Ir have a critical concentration for the beginning of ferromagnetism in the intermediate composition range. Phase diagrams and values of T, for these systems are shown in Fig. 99. Magnetic moment studies on Co-Ru alloys in the fee and hcp phases have been performed in the composition range up to 25 at% Ru (Fig. 100).
Spin-glass behavior has been investigated in Co-Rh alloys near the critical composition for ferromagnetism (Fig. 102). Co-Pd alloys show ferromagnetic order over nearly the whole range of concentration (Fig. 103), as is the case for CoPt alloys (Fig. 107). Annealed samples of CoPd and CoPd, exhibit short-range atomic order. Magnetic moments from neutron diffraction experiments are: CoPd: &, = 1.97(7) uBLg, j& =0.35(7) un; CoPd,: PC,= 1.92(11) un, &=0.48(3) un. Two ordered phases occur in the Co-Pt system: CoPt and CoPt,. Both are ferromagnetic. In ordered CoPt (CuAuI-type of structure) the ferromagnetically coupled moments PC,= 1.6 un and ppl = 0.25 uB are aligned parallel to the hexagonal axis. Co-Pt alloys near the equiatomic composition have large values for the energy product (BH),,,. By substitution of Co by Fe or Ni the energy product (BE&,,, is strongly reduced (Fig. 112).
Survey
Alloy/ compound
X Property Fig. Table Ref.
co,-xxx Co, -XRu, Co, -XRh,
Co, -XPd,
CoPd, CoPd, Co,-,Pd,
co, -XPt,
CoPt,
CoPt, CoPt
co, -XPt, (Co, Fe, Ni)Pt
o<x<o.4 o<x<o.25 0.56<x<O.62
O<x<l
O<x<l
O<x<l
0.46 <x < 0.54
T,(x) I?&) G(T) magn. phase diagram Pat(x), T,(x)
- - PCo, PPd
specific heat J%?(x), hl, Mx) tZt(x), T,(x)
pol. neutron diff. L=~W~)IJL, FP, = 0.2f@) PB
GWdH) CT>
Ho 43 won,, vs. tempering time
0s T,(x) M(x) K(x) WfLx@)
99, 113 6OCl 100 74Fl 101 75Jl 102 75Jl 103 35Gl
3OCl 58Gl
20 65Cl
104 69W2 105, 106 83Fl 107 32Sl
40Gl 3OCl 66Ml
108 71 M 1 109 7111
21 75C2 110 75M2 111 75M2 112 75M2
Landolt-BOrnstein New Series lWl9a
Frame, Gersdorf

614 1.4.2.2.5 Co4d, 5d (group 8) [Ref. p. 648
\ ‘CC \
0 0 20 40 co Ru -
-0 20 at% OS -
Fig. 99. Phnsc diagram and Curie tcmpcraturc as a function ofcomposition for Co-rich Co-(Ru. Rh, Pd, OS. Ir, Pt) alloys: the r phase is faceccntercd cubic. the E phase hexagonal; the hrokcn lines show the variation ofthc Curie point T, for the rcspcctivc phases [60 C I]. 30-
w3 I I I
cm3 2.0 R, mol Pa CO,,,F%.z - Ru 1.5 a, 1
0 10 20 ot% 30 Ru -
__ Co-Rh -=.I-=y-- --__ ---- CL
‘\Ik \
E
0 co
20 40 0 Rh - co
=--- -. -Co-Ir --‘,-- -3. ci
\
0 20 at% 40
.
20 40 Pd -
Co-Pt \
a
\ ‘1. ka
\ \
\ E
0 20 ot% 40 Ir- Pt -
100 200 K 300
Fig. 100. Magnetic moment per atom fi,, for the alloys Fig. 101. Magnetic moment per mol D,,, divided by H vs. CO,,,F~,,~-RLI and Co-Ru as a function of Ru con- tcmpcrature curves for Co,,,,Rh,,,,. The aged sample centration [74 F I]. has an anomalously large magnetic moment. yet T,. the
temocraturc of the maximum, remains unchanged [75j il.
Frame, Gersdorf I.andolt-Bornitein Sew Serier III ‘193

Ref. p. 6481 1.4.2.2.5 Co-4d, 5d (group 8) 615
25 25 K K
20 20
I I 15 15
k k IO IO
5 5
0 0 Ri Ri 5 5 IO IO 15 15 co 20 - 25 co 20 - 25 30 30 at% at% LO LO
Fig. 102. Magnetic phase diagram of RI-Co alloys near Fig. 102. Magnetic phase diagram of RI-Co alloys near
1600 K
1200
,800 I
ml
0 0 20 $0 60 80 at% II
2.4
I-le 1.6 I ,: 0.8
0
CO Pd -
L 30 ?d
the critical Co concentration for ferromagnetism; P, G, and F designate the paramagnetic, the magnetic glass and
Fig. 103. Magnetic moment per atom jat and Curie
the ferromagnetic regions, respectively [75 J 11. temperature for Co-Pd alloys as a function of compo- sition. Solid circles: [35 G 11; triangles: [30 C 11; crosses and open circles: [S8 G 11.
Table 20. Atomic magnetic moments in Pd,Co and PdCo [65 C 11.
Alloy Pat PC. ‘) fkc, - DPd PC, PPd
PB
Pd,Co 0.84(2) 1.9(2) 1.45(12) 1.92(11) 0.48(3) PdCo 1.16(3) 2.0(l) 1.63(10) 1.97(7) 0.35(7)
‘) From the large-angle scattering data assuming no Pd contri- bution and the metallic Co form factor.
.o 25 50 75 at%100 co Pd - Pd
Fig. 104. The variation of the electronic specific heat coefficient y with composition for Co-Pd alloys [69W2].
0 405 T
I
erg 5 i -2
E
4 I Pd co - co:
Fig. 105. Plots of the magnetic anisotropy energy AS, [ 11 l] and AS, [ 1 lo] at 4.2 K as a function ofcomposition for Pd-Co alloys [83 F 11.
I 0 20 40 60 80 at% 1
Land&-BOrnstein New Series 111/19a
Franse, Gersdorf

1.4.2.2.5 Co4d, 5d (group 8) [Ref. p. 648
! 2
c 0 CT
-2
-4 0 20 40 60 80 at% 100 Pd co - co
Fig. 106. Plots ofthe magnetostriction constants h, and h, as a function of composition for Pd-Co alloys [83 F I].
61 I I I I w/ I
-21 I I I I I 0 53 100 150 200 250 K 300
T-
Fig. 105. Temperature variation of the forced volume magnetostriction dw/dH of CrPt,, MnPt,, and CoPt, [7l M I].
Table 21. Saturation magnetic moment per unit mass extrapolated to OK for three Co-Pt alloys, ordered and disordered [75 C 21.
Allo) us [Gcm3g-‘1
disordered ordered
co 0.S4PLJ.46 53.5 37.8 CoPt 46.6 32.1 co 0.46pt0.54 45.0 29.3
1600 K
co Pt - Pt
Fig. 107. Magnetic moment per atom & and Curie temperature for Co-Pt alloys as a function of compo- sition. x : [32S I]; solid circles: [40G I]; open circles and + : [30 C I]. For neutron diffraction results for CePt alloys, see also [64 L I].
2000 d
n
t 8000
43 4000
n II
MGOe
8 x P
2 4
Tempering time -
Fig. 109. Coercive field H,, residual flux density B, and maximum energy product (BH),,, of polycrystalline specimens of CoPt as functions of tempering time at the following temperatures: curve I: 6OO”C, 2: 7OO”C, 3: 3.5 min 700 “C+600 “C; 4: 5 min 700 “C +6OO”C [7112].
Frame, Gersdorf

Ref. p. 6481 1.4.2.2.5 Co4d, 5d (group 8) 617
Fig. 110. Variation of Curie temperature for ordered and disordered alloys of the (Fe, Co, Ni>Pt system as a function of composition; solid circles: disordered; open circles: ordered [75 M 21; for the specific heat of Co-P& see [SO R 11.
Fig. 111. Variation with composition of the magnetization M measured in fields up to 20 kOe for ordered and disordered alloys of the (Fe, Co, Ni>Pt system as a function of composition; solid circles: disordered; open circles: ordered [75M2].
Fig. 112. Variation of coercive field H, and maximum energy product (BH),,, for the (Fe, Co, Ni>Pt system as a function of composition [75 M 21, see also [7112].
600, “C
I I I I I Fe,,Pt
0 ordered . disordered
n 0
CoPt
I
0.25 0.5 0 0.25 0.5 0 0.25 0.50 x- FePt x- NiPt x- copt
““Y ““Y
G G
600 600
I I = 100 = 100
I
Ni,-2xCoZxPt ,
0 0.25 0.5 0 0.25 0.5 0 0.25 0.50 CoPt x- FePt x- NiPt x - CoPt
F kOc
i
IL 0
I I
Co,-2xFe2x Pt Fel-2,Ni2xPt 0
MGOe
2
0 0.25 0.50
CoPt x - FePt XW NiPt x- copt
Landolt-BBmstein New Series 111/19a
Frame, Gersdorf

618 1.4.2.2.6 Ni4d, 5d (group 8) [Ref. p. 648
1.4.2.2.6 Ni alloys and compounds
Survey
X Property Fig. Table Ref.
Ni, -XRu, o<x<o.12 Pnt(x) 114 o<x<o.o5 Wx) 115
Ni, -IRh, o<x<o.3 L T,(x) 113,114 o<x<o.35 DNi9 PRh(X) 116 0.35<x<o.49 4H, 4 117 0.35<x<l x,(x) 118
0.37 <x < 1 o<x<o.3
x=0.35 Ni ,-&A o<x<o.7
T,(P)> T,(x) 119, 120 4(x) 121 K,(x) 122 4H, T) 123 L(x) 114
O<x<l O<x<l O<x<l O<x<l x = 0.4 O<x<l O<x<l O<x<l o<x<o.91
Ni I -Ah o<x<o.o5 Ni, -JrX O<x<l
O<x<O.O6 Ni, -,Pt, o<x<o.4
0.4 < x < 0.7 O<x<l 0.55 <x <0.63 x=0.524 O<x<O.6 O<x<O.6 0.4O<x<O.58 o<x<o.5 o<x<o.5 x = 0.59, x = 0.60 O<x<O.6 0.5 <x <OS7 0.5 <x <0.57 0.5 <x <0.57 0.55<x<O.63 0.55<x<O.63 o<x<o.5
T,(x) 124 hi3 BldX) 125 H,,,(x) 126 Hi,,,(x) 127 UP, T) 128 K,(T) 129 K,(x) 130 h,> b(x) 131 kWdH) U-J 132 TM. D,,(x) 113,114 Xm, Y(X) 133 T,, Pa,(x) 113,114 Pa,(x) 114 %,(X) 134 Xm Y(X) 135 g(H) 136 M, 7-j 137 L cl(x) 138, 139 !jNi, PP,? dx) 140, 141 m 142 H,,,(x) 126, 143 Hi,&) 144 6”) 145 Tc@) 119 O), L,(P)> T,(P) u(V, xoC’)> T,(V 146 4x)> xo(xX T,(x) 147 Wf) 148 (WI) (T) 149 AM4 150
22 22
6OCl 80Al 6OCl 78Cl 75M3 68B1 75M3 79K3 81K3 8201 79Al 32S1, 37Ml 72Fl 78Cl 72Fl 73Gl 78P2 75F2 78Tl 78Tl 73T2 6OCl 70Bl 6OCl 6OCl 73G2 74B2 74s3 74B1 69F2 8OPl 79Al 72Fl 73Gl 78Vl 79K3 74A2 74A2 74A2 76Kl 77Fl 81Kl
Results of magnetic moment and Curie temperature studies of Ni-Ru, -Rh, -Pd, and Ni-Os, -Ir, -Pt alloys have been collected in Figs. 113 and 114. The onset of ferromagnetism in binary nickel alloys has extensively been investigated. in particular for Ni-Pt and Ni-Pd alloys. Important parameters for the onset of ferromagnetism are the local environment of nickel atoms and the polarization clouds around local magnetic moments.
The magnetic anisotropy is strongly reduced in single crystals of nickel with a few at% Ru, Rh, Pt (Fig. 115). In the Ni-Rh system the critical concentration for ferromagnetism is around 35at% Rh. The magnetic
moment per atom has been studied in diffuse neutron scattering experiments (Fig. 116).
Franse, Gersdorf
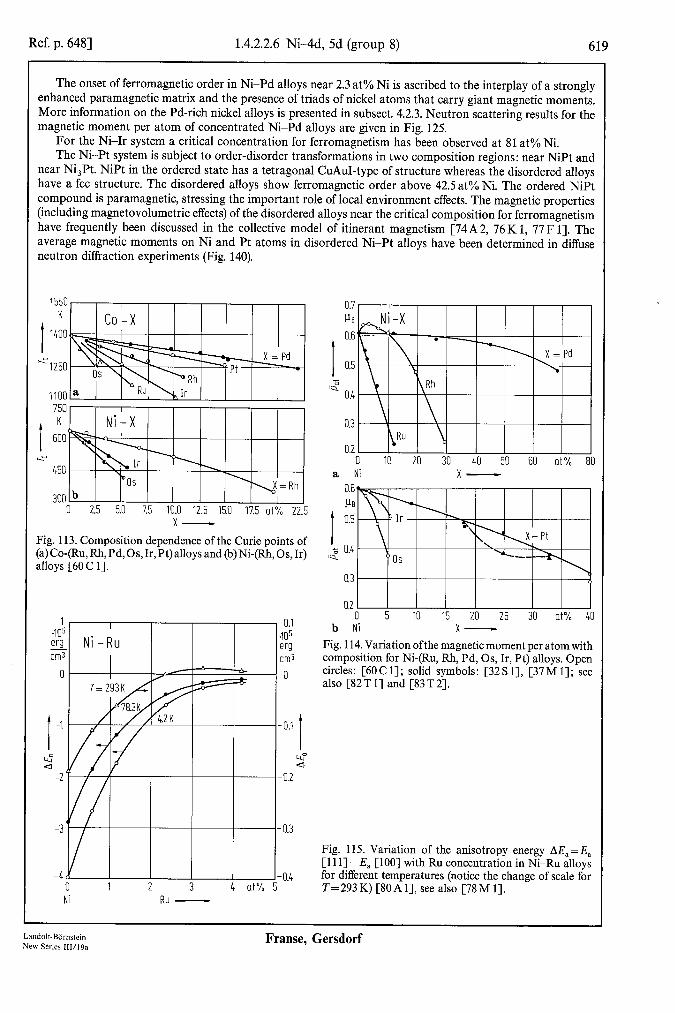
Ref. p. 6481 1.4.2.2.6 Ni4d, 5d (group 8) 619
The onset of ferromagnetic order in Ni-Pd alloys near 2.3 at% Ni is ascribed to the interplay of a strongly enhanced paramagnetic matrix and the presence of triads of nickel atoms that carry giant magnetic moments. More information on the Pd-rich nickel alloys is presented in subsect. 4.2.3. Neutron scattering results for the magnetic moment per atom of concentrated Ni-Pd alloys are given in Fig. 125.
For the Ni-Ir system a critical concentration for ferromagnetism has been observed at 81 at% Ni. The Ni-Pt system is subject to order-disorder transformations in two composition regions: near NiPt and
near Ni,Pt. NiPt in the ordered state has a tetragonal CuAuI-type of structure whereas the disordered alloys have a fee structure. The disordered alloys show ferromagnetic order above 42.5 at% Ni. The ordered NiPt compound is paramagnetic, stressing the important role of local environment effects. The magnetic properties (including magnetovolumetric effects) of the disordered alloys near the critical composition for ferromagnetism have frequently been discussed in the collective model of itinerant magnetism [74A2, 76K 1, 77 F 11. The average magnetic moments on Ni and Pt atoms in disordered Ni-Pt alloys have been determined in diffuse neutron diffraction experiments (Fig. 140).
1550 K
I 1400
~1250
1100 750
1 600 K
hu 450
300 0 2.5 5.0 7.5 10.0 12.5 15.0 17.5 at% 22.5
0.7 Pe
t
0.6
0.5
la" ox
0.2 0 IO 20 30 40 50 60 at% 80
a Ni 0.6 !JB
A nr
1
x-
I
U.3
Fig. 113. Composition dependence of the Curie points of (a)Co-@,Rh,Pd,Os,Ir,Pt)alloysand (b)Ni-(Rh,Os,Ir) ,z Ok alloys [60 C 11.
0.3
02 i
“, 0
g Ni-Ru I
0 1 2 3 4 at% Ni Ru -
.I e c
5 IO 15 20 25 30 at% 40 u. I
05 rg ;;;3 0
b Ni x-
Fig. 114. Variation ofthe magnetic moment per atom with composition for Ni-(Ru, Rh, Pd, OS, Ir, Pt) alloys. Open circles: [6OC 11; solid symbols: [32 S 11, [37M 11; see also [82T I] and [83 T 21.
0.1
I
0.2
0.3
0.4
Fig. 115. Variation of the anisotropy energy AE, =E, [l 1 l] -E, [ 1001 with Ru concentration in Ni-Ru alloys for different temperatures (notice the change of scale for T=293 K) [80A 11, see also [78 M 11.
Landolt-Bbmstein New Series 111/19a
Frame, Gersdorf

620 1.4.2.2.6 Ni-4d, 5d (group 8) [Ref. p. 648
2.oi
lk
1.75
l.SC
I 1.25
Is" 1.00
0.75
0.T
025
0 ,
Kh -
Fig. 116. Average moments at Ni and Rh sites in Ni-Rh alloys vs. concentration. The solid lint rcprcscnts 2.0~” F,?. where j,, is the fraction of Rh atoms surrounded by I2 nearest-neighbor Ni atoms [7S C I]. see also [77C 21.
0 Ni
40 60 80 at% 100 Rh - Rh
?g. I IS. Mass susceptibility of Ni-Rh alloys at 4.2 K olid circles: [75 M 33, open circles: [68 B I].
12 Gcml
g
8
t 6 b
10 20 30 LO 50 60 kOc H-
Fig. 117. Magnetization curves at 4.2 K for Ni-Rh alloys [75 M 33.
0 200 400 600 K 800
Fig. 119. Plots of ATc/Ap as a function of Tc for Ni-(Rh. Pd, Pt) alloy systems [79 K 33, set also [75 K I]. For the composition dependence of Tc, set Figs. I I3 and 124. Open and closed triangles represent data from different authors.
Frame, Gersdorf
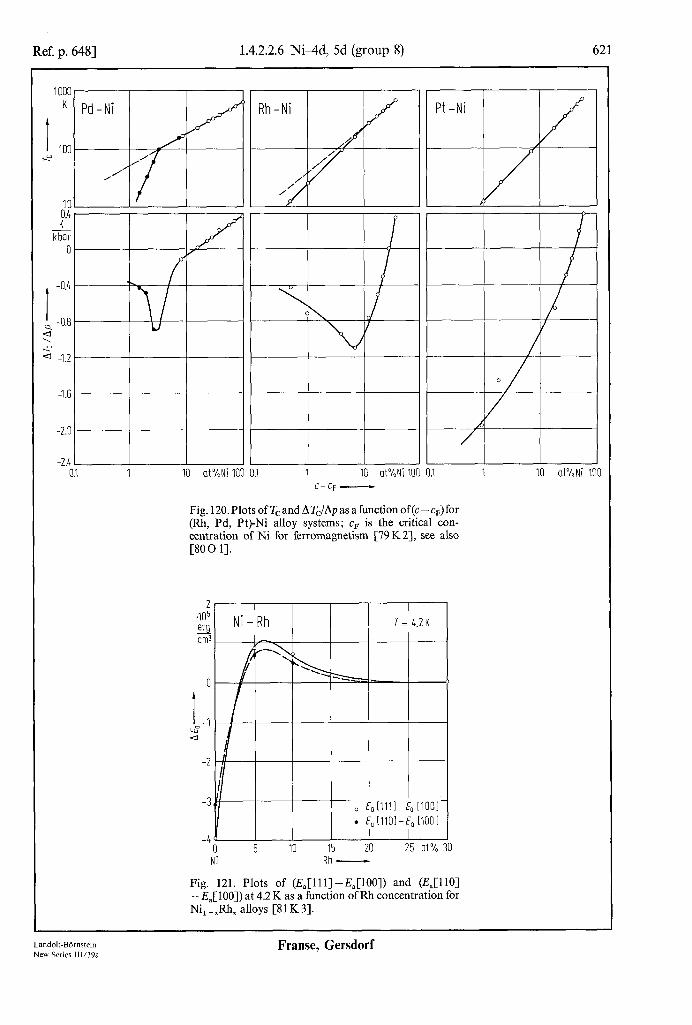
Ref. p. 6481 1.4.2.2.6 Ni-4d, 5d (group 8) 621
1000
K Pd-Ni Rh -Ni I I
Isp II n
Pt -’
0 0
t t -0.4 -0.4
2 2 -0.8 -0.8 \ \
2 2 -1.2 -1.2
-1.6 -1.6
-2.0 -2.0
-2.4 0.l 1 IO IO ot%Ni 100 ot%Ni 100
Fig. 120. Plots of Tc and ATJAp as a function of(c - cF) for (Rh, Pd, Pt>Ni alloy systems; cF is the critical con- centration of Ni for ferromagnetism [79 K 21, see also [SO0 11.
2 ,105 !!I cm3
I
Ni - Rh I
T = 4.2 K
I 1 . E,~1101-E, [IO01
0 5 IO 15 20 25 at% 30 Ni Rh -
Fig. 121. Plots of (E,[lll]-E,[lOO]) and (E,[llO] - E,[ 1001) at 4.2 K as a function of FCh concentration for Ni, -,Rh, alloys [S 1 K 31.
Landolt-Bbmstein New Series 111/19a
Frame, Gersdorf
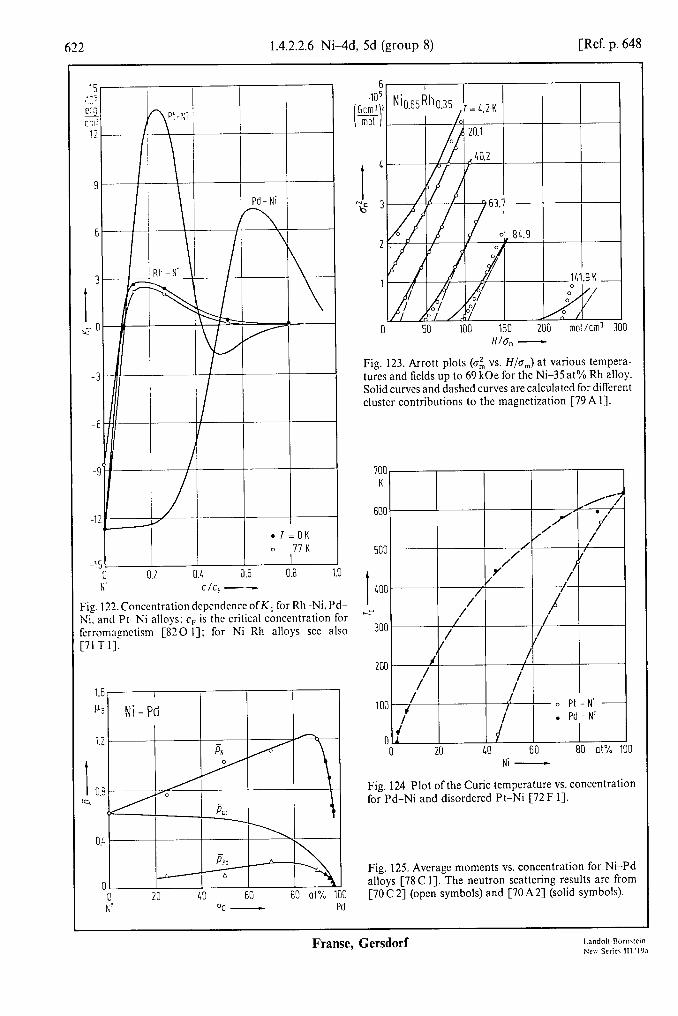
622 1.4.2.2.6 Ni-4d, 5d (group 8) [Ref. p. 648
15 .lG' e:g cm? 12
.T=OK 17 K
0.2 0.1 0.6 0.8 1.0 K’ c/c, -
Fig. 122. Concentration dcpcndcncc ofK, for Rh-Ni, Pdm Ni. and Pt-Ni alloys: cr is the critical concentration for ferromngnctism [820 I]; for Ni-Rh alloys see also [7l T I].
1.2
i 0.E IQ
LO 60 80 at% 100 Pd - Pd
6, / I I I I I
0 50 100 150 200 mol/cm 300
Fig. 123. Arrott plots (q$ vs. H/g,) at various tempera- turcs and fields up to 69 kOe for the Ni-35 at% Rh alloy. Solid curvc~ and dashed curves are calculated for different cluster contributions to the magnetization [79A 11.
700, / , I I I
0 0 20 40 60 80 at% 100
Ni -
Fig. 124. Plot of the Curie temperature vs. concentration for Pd-Ni and disordered Pt-Ni [72 F 11.
Fig. 125. Average moments vs. concentration for Ni-Pd alloys [78 C 11. The neutron scattering results are from [70 C 21 (open symbols) and [70 A23 (solid symbols).
Franse, Gersdorf

Ref. p. 6481 1.4.2.2.6 NiAd, 5d (group 8) 623
200 kDe
150 0
NI -
Fig. 126. Saturation hyperfine fields at 57Fe sites as a function of Ni concentration in Pt-Ni and Pd-Ni alloys near zero temperature [72 F 11.
100
50
I 0
F x
Fig. 127. Average magnetic hyperfine fields at Ni sites (solid symbols) and Pd sites (open symbols) in the Ni-Pd alloy system. Different solid and open symbols represent data from different authors. The following equations have been used to calculate the curves [73 G 11:
H&,Ni)= -76 kOe+ 125Cj-p,i)kOe/u,,
H,,,(Pd)=-180kOe+80~-~~,i)kOe/p,,
where fi denotes the average magnetic moment of the sample per Ni atom, i.e. p=P,J(l-c) with c the Pd concentration. jNi is the average Ni magnetic moment. See Fig. 125 for concentration dependence of & and pm.
-50
-100
-150
-200
-250 0 Ni
25 50 75 ot% 100 Pd - Pd
3.0 .I04 9 cm3
I 2.0
2 1.5 x
1.0
0 2.5 5.0 7.5~102G2cm6/g2 12.'
a 0"2-
5.oc 404
9 a
I
2.50
p 1.25
-1.25
-2.50 5
b
30 93 G2cmg
0 5 2.0 2.5 105 K2 3.5
T2-
Fig. 128. (a) Dependence H/cr=f(cr’) for the alloy Ni,,,Pd,.4 at different temperatures: (I) 420, (2) 436, (3) 450,(4)460,(5)472,(6)480,(~490,(8)500,(9)510,(10)524, (II) 540, (12) 556, (13) 570, (14) 590, and (15) 616K. 01) Initial ordinate A( T’) (open circles) and the slope B( Tz) (solid circles) of the dependences H/o = A + Ba2 for the alloy Ni,,,Pd,,,, [78P 21.
Landolt-Bornstein New Series 111/19a
Franse, Gersdorf
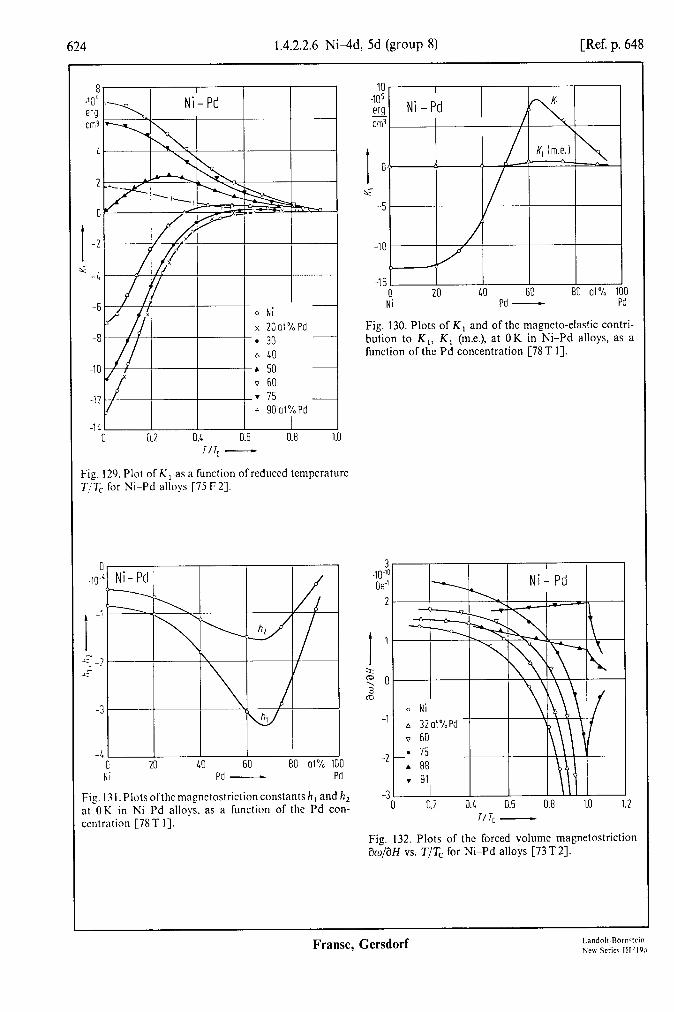
1.4.2.2.6 Nilld, 5d (group 8) [Ref. p. 648
I
\li - Pd
0.2 0.1 0.6 0.8 1.0 r/r, -
Fig. 129. Plot of K 1 as a function of reduced tempcraturc T& for NikPd alloys [75 F 21.
I -1
r" -2 -CT
-3
-4 0 20 60 80 at% 1 Hi Pd - Pd
Fig. 13l.Plots ofthcmagnctostrictionconstantsh, and h, at OK in NiLPd alloys, as a function of the Pd con- centration [7S T I].
10 405 erg cm3
I 0
s;c -5
l- -1c
-15 I
0 20 LO 60 El0 at % Ni Pd -
100 Pd
Fig. 130. Plots of K, and of the magneto-elastic contri- bution to K,, K, (m.e.), at OK in Ni-Pd alloys, as a function of the Pd concentration [78 T I].
0 0.2 0.1 0.6 0.8 1.0 1.2 r/r, -
Fig. 132. Plots of the forced volume magnetostriction ho/aH vs. T/T, for Ni-Pd alloys [73T2].
Frame, Gersdorf

Ref. p. 6481 1.4.2.2.6 Ni-4d, 5d (group 8) 625
12 mJ
molK2 L II I ,.. _.
9
I 8
x 7
Ir 40-6 cm3 9
I 60
ol
x 40
20
0 t 30 35 40 45 50 55 at%
Ni -
Fig. 134. Extrapolated zero-field mass susceptibility for ordered and disordered Pt-Ni alloys [73 G 21, see also [72Gl].
Ir -
Fig. 133. Molar susceptibility x,,, and electronic specific heat coefficinet y in Ni-Ir alloys as a function of the Ir concentration [70 B I].
I I I/ I \I
40-c rm3 I II I I
250
200
550
100
50
02
PY 20 40 60 80 at% 100
NI - Ni
Fig. 135. Electronic specific heat coefficient y (a) and high- field molar susceptibility x,,, (b) ofdisordered Pt-Ni alloys near zero temperature [74 B 21. Different symbols repre- sent data of different authors.
Land&Bdrnstein New Series III/l9a
Franse, Gersdorf

626 1.4.2.2.6 Ni-4d, 5d (group 8) [Ref. p. 648
I I I
20
I I
I 9
0.a y 8CI 4 I 1 I 1 I
1=77K ,51.8ot%PI /,
/
60 /
P / 57.1 P I
6 I
Jb A x &IF I
“0 ‘10 20 30 40 50 .103 a/cm3 H/rJ -
‘is. 136. ,s* vs. H/G of disordcrcd Ni-Pt alloys at 4.2 K I) and 77K (b). The curves arc labcllcd with the Pt zntent [74S 31.
i 40 k
20 1717 -
0 10 20 30 40 .103g/cm1 60
~0 20 40 3l 80 at% 100 Ni PI - Pt
Fig. 138. Experimental total moment per atom p,, and spin moment per atom deduced from j(sp)=2~?,,/9, in disordered Ni-Pt alloys, as a fimction of the Pt con- ccntration. The initial linear parts extrapolate to P,,=O.293 pn. and .&,(sp)=O.355 pr, [69 F2]. For g. see Fig. 139.
2.3
Ni - Pt disordered
2.2 ” 0 c 0 0
I 2.1 o”.
ol 0 l
2.0 0
1.9 - 0 1=293K . 77K t’ 1K
1.8 I I 0 10 20 30 4Oot% Ni PI -
50
Fig. 139. Experimental g factors for Ni-Pt alloys [69 F 23.
Fig. 137. Arrott plots for the disordered Ni0,476Pt0,J2J alloy at various temperatures from 4.2K to 226.7K: [74Bl],seealso[76B2]and[78Bl].
Frame, Gersdorf Landnlt-Rornriein Nea- Seriu III ‘192

Ref. p. 6481 1.4.2.2.6 Ni+Id, 5d (group 8) 627
, Ni- Pt
Fig. 140. Average individual moments near 4K for disordered Ni-Pt alloys [8OP 11, see also [79P 31.
2.0
I 1.5
2 1.0
0.5
0
- 0.5 40 44 48 52 56 at% I
Ni -
Fig. 142. Variation of the squared spontaneous magnetic moment per mole, oS, (from Arrott plot analysis) vs. composition for disordered Pt-Ni alloys at 4.2 K [79A 11.
0 0 IO 20 30 LO 50 at% 60 Ni Pt -
Fig. 141. Comparison of Ni-Pt average moments &, near 4 K from neutron scattering (solid circles) and magnetiz- ation (open circles) measurements [8OP I].
I - 1’ ; 1
L L\ ’ \
P !I I
I
,,:
40 60 80 at% 100 Pt NI - Ni
Fig. 143. Hyperfine fields at 61Ni sites as a function of composition for the Pt-Ni system [72 F 11.
Landolt-Biirnstein New Series 111/19a
Franse, Gersdorf
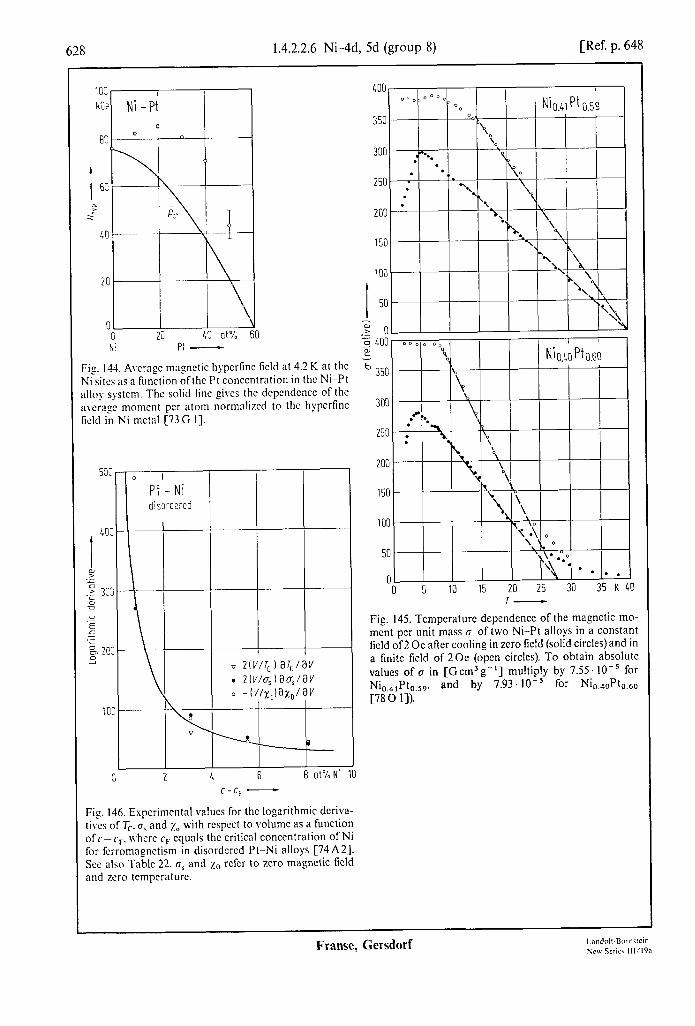
628 1.4.2.2.6 Ni-4d, 5d (group 8) [Ref. p. 648
lO! I kO? Ni -Pi
Fig. 144. Average magnetic hypcrtinc ticld at 4.2 K at the Ni sites as a function ofthc Pt concentration in the Ni-Pt alloy system. The solid line gives the dependence of the avcra:c moment per atom normnlizcd to the hypcrfinc field in Ni metal [73 G I].
0 I
Pt -Ni disordered
I I c 2 1, 6 8 ot%Ni 1u
c-q -
Fig. 146. Experimental values for the logarithmic dcriva- tives of 7,. B, and x0 with respect to volume as a ftmction oft-cr. where cr equals the critical concentration of Ni for ferromagnctism in disordcrcd PttNi alloys [74A2]. See also Table 22. o, and lo refer to zero magnetic ticld and zero tempcraturc.
ml
350
300
250
200
150
100
I 50
u .? 0 z LOO a
350
250
0 0 5 10 15 20 25 30 35
Fig. 145. Temperature dependence of the magnetic mo- mcnt per unit mass ~7 of two Ni-Pt alloys in a constant field of2 Oe after cooling in zero field (solid circles) and in a finite field of 20~ (open circles). To obtain absolute values of CJ in [Gcm3g-‘1 multiply by 7.55. IO-’ for Ni 0.41pt0.59, and by 7.93. 10e5 for Ni0.40Pt,,,, [78 0 1-J).
Franse, Gersdorf

Ref. p. 6481 1.4.2.2.6 NiAd, 5d (group 8) 629
Table 22. Pressure dependence of the magnetic parameters of disordered Pt-Ni alloys [74A 21. For a graphical representation of the concentration dependence of the logarithmic derivatives of T,, 6, and x0 with respect to volume, see Fig. 146. B, and x0 refer to zero magnetic field and zero temperature.
at% Ni
42.9 45.2 47.6 50.2
dddp - 165(l) -11 - 8.6 - 8.1 [Gcm3mol-l kbar-‘1 d Vdp [K kbar-I] lo5 &to/+ [cm” mol- ’ kbar - ‘1 V da, os dV V dTc -- T, dV V 4x0 xo dV
- 1.5
420
135
150
-490
- 0.7
23 7.4 4.2
44 24 18
29
-84 -43 -39
10-6 $V$ 11
[G2 cm6 mol-‘1
1O-4 T,V$ [K’, 8.0
10-4 v dX0 - x: dV 2.5
[mol cm - 3]
For Fig. 147, see next page.
.IO~,"~ Pt - Ni
6
I
4
.A 2
-4ld I I I I I 0 5 IO 15 20 25 kOe 30
H OPPl -
Fig. 148. Linear magnetostriction 1 of disordered Pt-Ni alloys as function of the applied field. The curves are labelled with the Ni concentration; T=4.2 K [76 K 11.
15 15 18
8.6
- 1.3 - 1.1 - 1.6
.lO-* pt _ Ni $l.Lat%Ni
100
r
disordered
80
t
1 60 ;:
a 40
20
0
-20 4 6 8 IO K 12
T-
Fig. 149. Low-temperature thermal expansion of dis- ordered Pt-Ni alloys as a function of temperature. The curves are labelled with the Ni concentration; the critical concentration for ferromagnetism is about 42.5 at% Ni [77 F 11, see also [77 K 11.
Landolt-Bdmstein New Series III/I%
Franse, Gersdorf
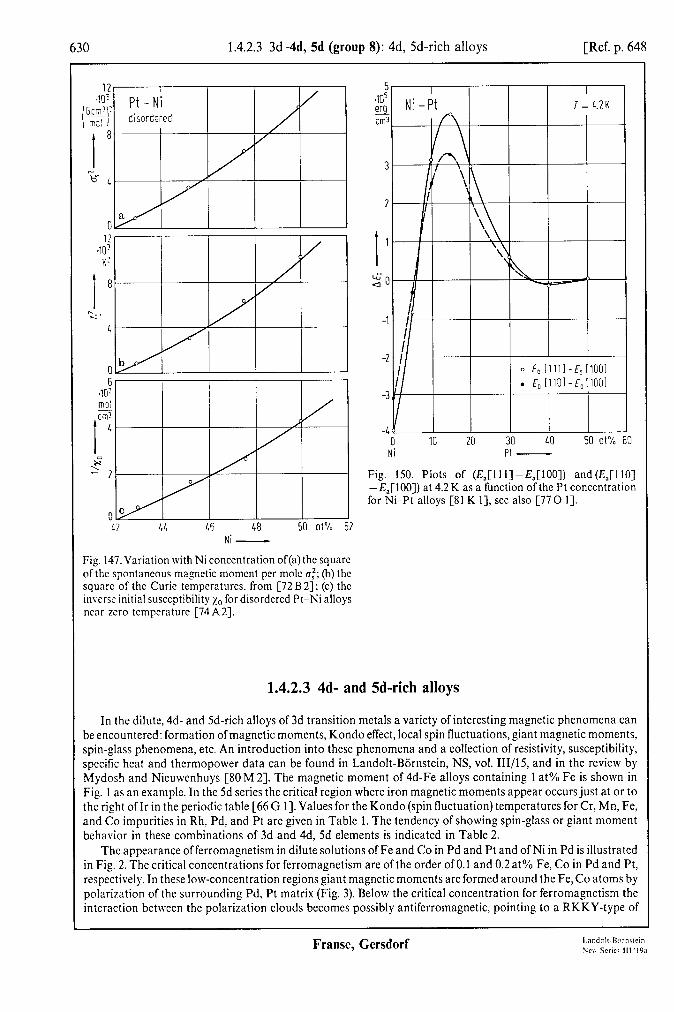
630 1.4.2.3 3dAd, 5d (group 8): 4d, Sd-rich alloys [Ref. p. 648
0 Ni
30 LO Pt -
Fig 150. Plots of (E,[lll]-EJlOO]) and(E,[l IO] -E,[lOO]) at 4.2 K as a function of the Pt concentration for Ni-Pt alloys [Sl K 11, see also [77 0 I].
NI -
Fig. 147. Variation with Ni concentration of(a) the square ofthe spontaneous magnetic moment per molt u$(b)thc square of the Curie tempcraturcs. from [72 B 21; (c) the inverse initial susceptibility x0 for disordered PttNi alloys near zero temperature [74 A2].
1.4.2.3 4d- and Sd-rich alloys
In the dilute. 4d- and Sd-rich alloys of 3d transition metals a variety of interesting magnetic phenomena can be encountered: formation of magnetic moments, Kondo effect, local spin fluctuations, giant magnetic moments. spin-glass phenomena, etc. An introduction into these phenomena and a collection of resistivity, susceptibility, specific heat and thermopower data can be found in Landolt-Bornstein, NS, vol. III/IS, and in the review by Mydosh and Nieuwenhuys [SO M 21. The magnetic moment of 4d-Fe alloys containing 1 at% Fe is shown in Fig. 1 as an example. In the 5d series the critical region where iron magnetic moments appear occurs just at or to the right of Ir in the periodic table [66 G 11. Values for the Kondo (spin fluctuation) temperatures for Cr, Mn, Fe, and Co impurities in Rh, Pd. and Pt are given in Table 1. The tendency of showing spin-glass or giant moment behavior in these combinations of 3d and 4d, 5d elements is indicated in Table 2.
The appearance of ferromagnetism in dilute solutions of Fe and Co in Pd and Pt and of Ni in Pd is illustrated in Fig. 2. The critical concentrations for ferromagnetism are of the order of 0.1 and 0.2 at% Fe, Co in Pd and Pt, respectively. In these low-concentration regions giant magnetic moments are formed around the Fe, Co atoms by polarization of the surrounding Pd, Pt matrix (Fig. 3). Below the critical concentration for ferromagnetism the interaction between the polarization clouds becomes possibly antifcrromagnetic, pointing to a RKKY-type of
Franse, Gersdorf

Ref. p. 6481 1.4.2.3 3d-4d, 5d (group 8): 4d, Sd-rich alloys 631
interaction [71 C2]. In dilute solutions of Mn in Pd a more complex situation is encountered. Besides the ferromagnetic interaction between the Mn moments by means of the polarized Pd matrix a direct antiferromagnetic interaction between neighboring Mn moments occurs. These two competing interactions give rise to spin-glass behavior in the composition range 2...10 at% Mn (see Fig. 4). By adding small amounts of Fe to Pd the transition from ferromagnetic to spin-glass behavior can be shifted to higher Mn concentrations (see Fig. 5). The critical concentration for ferromagnetism in dilute Pd-Ni alloys is around 2.3 at% Ni and is believed to be connected with a percolation among interacting magnetic clusters, nucleated by triads of Ni atoms [Sl C 11.
Survey
Alloy X Property Fig. Table Ref.
Cr, -,Pt,
Mn, -,Rh, Mn, -,Pd,
Mn, -XPt, Fe, -XRu, Fe, -,Rh, Fe, -,Pd,
Fe, -XOs, Fe, -Jrr
x=0.98 x>o.995 x = 0.982 x > 0.99 x=0.82 x>O.82 x=0.992, x =0.995 x>O.965 x=0.98 x > 0.994 x > 0.9755 x > 0.92 x = 0.902, x = 0.96 x > 0.90 x>O.89 x > 0.90 x > 0.995 x=0.99 x = 0.99 x = 0.99 x > 0.90 x > 0.999 x>O.985 x=0.985 x>o.50 x > 0.99 x>O.84 x > 0.99 x>O.84 x > 0.90 x = 0.9984 x = 0.9975 x=0.983 x=0.985 x = 0.99 x = 0.99 x > 0.50 x>O.85 x = 0.99
x&T) e(x, T ) X&O TK@) 49 T,(x) xg(T) X&G T) x&T) X&G T> 09 XHF, E&T HI
xLFCO
Pso,u,e(B)
PM”(X)
Tc(x)> T,(x)
Aa, AC(T) X&G T) Paat, 0, T,(x) Daat> 0, T,(x) Pm 0, T,(x) L(x) 4ff) 4H) @f, T> tjFe> PPd
44
4x, T>
T,(x), @(x)
T,(x)
T,(P)
AC(H)
T,, 9, M, K,, K,
T,, g, M, K,, K,
spin waves L,(T) xg(T), $7 4x, T) C/W PFe, @cx)
6 7 8 9 10 11 12 13 14 15 16 17 18 19 4 20 21
3 22 23 24
25 26 27 28 29 30
31 32 33 34 35 36
70Nl 75Sl 7812 72Sl 79Cl 79Cl 70Nl 69Nl 7111 72Cl
3 7532 7721 79Ml 79Sl 82Hl 81Bl 77Tl
4 62C2 4 62C2 4 62C2
80M2 71C2 70M3 70M3
5 65Cl 71C2 6OC2 71C2 6OC2 74Ml 75Nl
6 74B3 6 74B3
82Ll 66Gl 66Gl 66Gl 66Gl 66Gl
continued
Landolt-BOrnstein New Series Il1/19a
Franse, Gersdorf

632 1.4.2.3 3d-4d, 5d (group 8): 4d, Sd-rich alloys [Ref. p. 648
Survey, continued
Alloy X Property Fig. Table Ref.
Fe, -,Pt, x>O.85 x > 0.83 x =0.955
Co, -,Pd, x>o.90 x>O.98 x = 0.9976 o<x<o.97
co, -,pt, x > 0.90 x>o.991 x > 0.80 x=0.961 x>o.995
Ni, -,Pd, x > 0.97 x > 0.97 x>O.85 x > 0.965 x>O.88 x=0.95
P,,(x) 3 L(x), T,(x) 37 T,, gt M> K,, K, Pa,(x) 3 T,(x) 38 C,(H) 39 Hh,, T,(P) 29 P&4 3 0, c,, ii&) T,, os, Em PC, T,, gt M, K,, K, C"(H) 40 T,(P) 29 x,(x, T) 41 4x> 4 42 C”(X) 43 x, Tc. CA Y(X) 44 Tc, OS> fk PNi
T,, g. M> K,> K,
80M2 7901
6 74B3 80M2 72Nl 70B2
7 62Nl 74Ml 80M2
8 72Tl 9 65C2 6 74B3
73Nl 74Ml 81 Cl 81Cl 68C2 74M3
9 65C2 6 74B3
Table 1. Isolated-impurity Kondo (spin fluctuation) temperatures for Cr, Mn, Fe, and Co impurities in Rh, Pd, Pt [SO M 23.
Cr Mn Fe co
Rh - IOK 50K lOOOK Pd 1OOK 1OmK 20 mK 0.1 K Pt 200 K 0.1 K 0.3K 1K
Table 2. Spin-glass and giant moment combinations of transition metals [80M 21. SG and GM represent favorable combinations for spin-glass or giant-mo- ment behavior, respectively; XT means that a too high Kondo temperature limits the appearance of both the spin-glass or giant-moment states.
Rh Pd Pt
Cr Mn
XT SG XT SG+GM XT SG
Fe co
XT XT GM GM GM SG
Franse, Gersdorf

Ref. p. 6481 1.4.2.3 3d-4d, 5d (group 8): 4d, Sd-rich alloys 633
IO
1 8
I& 6
4 2r
5 6 7 8 9 IO 11 Nb MO Re RU Rh Pd 4
Fig. 1. Magnetic moment per Fe atom in 4d metals and alloys containing 1 at% Fe [62 C 21. The crystallographic structure as well as the number per atom of 4d and 5s electrons are indicated.
0 2 L 6 8 at% IO Pd,Pt C0.k -
Fig. 3. Magnetic moment per solute atom as a function of concentration in alloys of Pd, Pt with Fe, Co [80 M 21; other references: Pd-Fe: [68 M 11, [67M 11; Pt-Fe: [74S2], [67Ml], C65Tl-J; Pd-Co: [61Bl]; Pt-Co: [75 S 33, [65 T I]. M: Mijssbauer experiment.
0 1 2 3 L at% 5 Pd Co, Fe,Ni -
Fig. 2. Curie temperature as a function of concentration for Pd, Pt alloys with Fe, Co, Ni [62 B l] ; other references: Pd-Fe: [70K2], [69K3], [69Cl], [68M 11, [68B2], [67Tl]; Pt-Fe: [75K2], [70K2]; Pd-Co: [76Ml], [71 L l], [69 W I], [68 A 11, [61 B 11; Pt-Co: [76 RI].
0 2 6 8 at% IO Pd Mn -
Fig. 4. Suggested phase diagram for the Pd-Mn system, showing the transition temperature as kmction of Mn concentration; F: predominantly ferromagnetic; M: mixed ordering; SG: spin-glass [82H 11, see also the references:[67S1],[69R1],[69W1],[70N2],[72Bl], [73 B 31, [75C 11, [75 Z 11, [79 G l] for the effect of pressure, and [Sl H 21.
Landolt-Bbmstein New Series lWl9a
Frame, Gersdorf
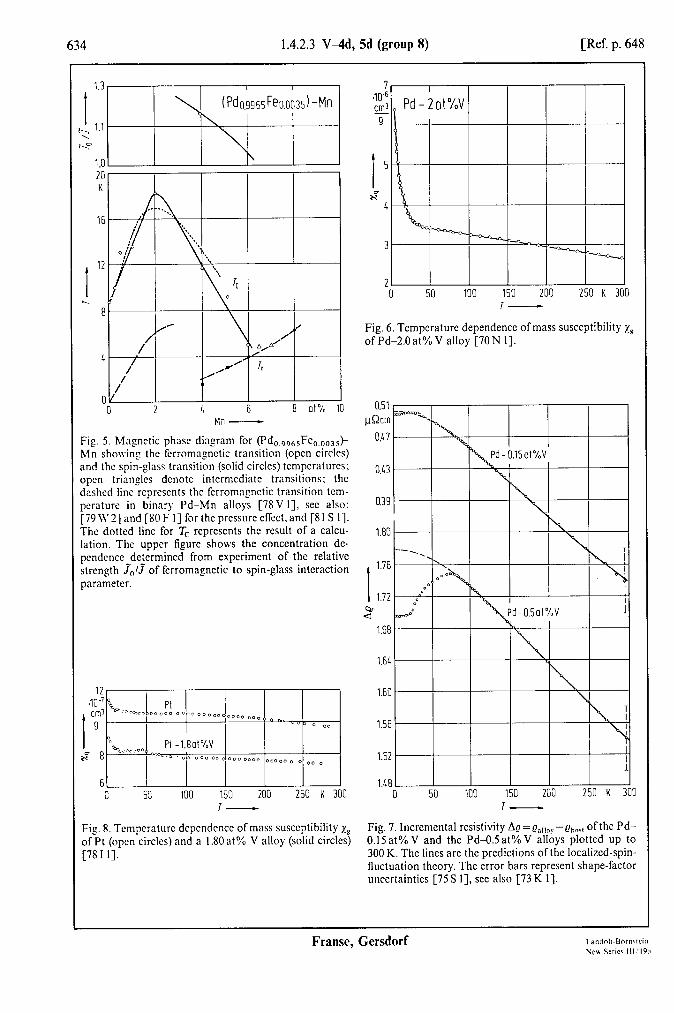
634 1.4.2.3 V-4d, 5d (group 8) [Ref. p. 648
2 6 8 at% 10 Mi; -
Fig. 5. Magnetic phnsc diagram for (Pd,,,,,,Fc,,,,,,~ Mn showing the ferromngnctic transition (open circles) and the spin-glass transition (solid circles) tcmpcraturcs: open triangles dcnotc intermediate transitions; the .inshcd line rcprcscnts the fcrromngnctic transition tcm- pcmturc in binary Pd-Mn alloys [78V I], set also: [79 \\‘2] and [80 F I] for the prcssurc effect. and [S I S I]. The dotted line for Tc represents the result of a calcu- lation. The upper figure shows the concentration de- pendence determined from experiment of the relative strength J’,ll of ferromagnetic to spin-glass interaction parameter.
12 40-7 cm’
I- 9
k 8
6 0 50 100 150 200 250 K 300
I-
Fig. 8. Tempcraturc dcpcndence of mass susceptibility xn of Pt (open circles) and a 1.80 at% V alloy (solid circles) [78I I].
7 7 40'6 40'6 cm3 cm3 T T
I I
5 5
x" x" 1, 1,
3 3
-0 50 100 150 200 250 K 300 T-
Fig. 6. Temperature dependcncc of mass susceptibility xg of Pd-2.0 at% V alloy [70 N I].
nsi,
047
0.u
0.39
1.80
I 1.76 1.12
d"
1.68
1.6L
1.60
0 50 100 150 200 250 K : T-
Fig. 7. Incremental resistivity AQ = ealloy--ehos, of the Pd- O.lSat%V and the Pd-O.5at%V alloys plotted up to 300 K. The lines arc the predictions of the localized-spin- fluctuation theory. The error bars represent shape-factor unccrtaintics [75 S I], see also [73 K I].
Franse, Gersdorf
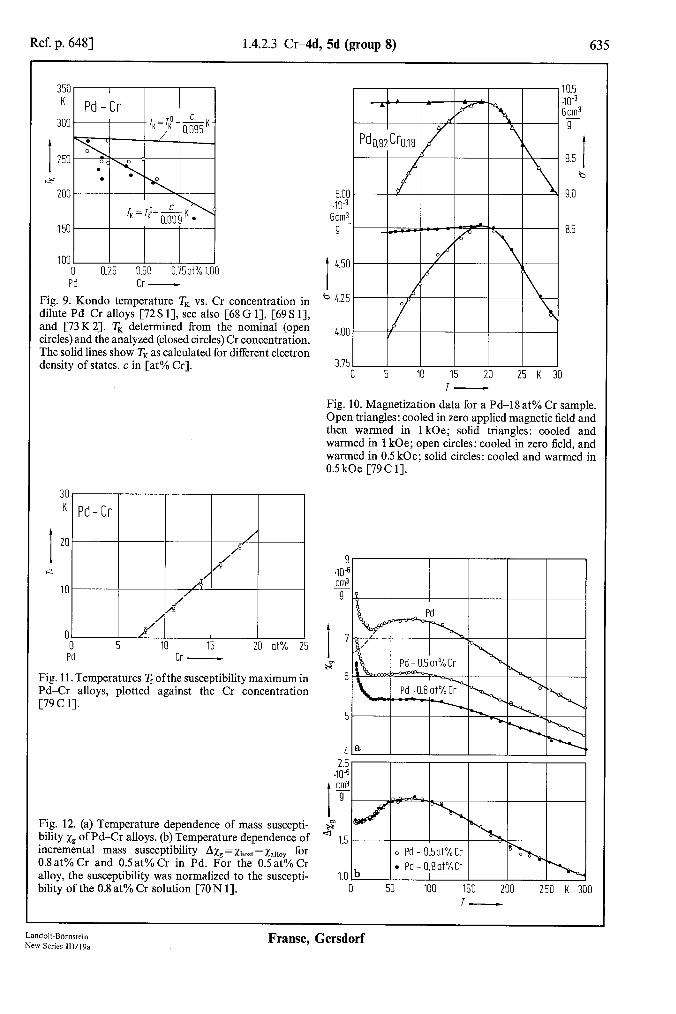
Ref. p. 6481 1.4.2.3 Cr-4d, 5d (group 8) 635
100 0 Pd
0.50 0.75d% 1.00 Cr -
Fig. 9. Kondo temperature Tx vs. Cr concentration in dilute Pd-Cr alloys [72 S 11, see also [68 G 11, [69 S 11, and [73K2]. Tx determined from the nominal (open circles) and the analyzed (closed circles) Cr concentration. The solid lines show Tx as calculated for different electron density of states. c in [at% Cr].
30 K
I
20
t-z
IO
0 0
Pd
Pd-Cr
/ 2
P’ A
/ /
,d IO 15 20 at%
Cr -
Fig. 11. Temperatures T, ofthe susceptibility maximum in Pd-Cr alloys, plotted against the Cr concentration [79 c 11.
5.00 .lO" Gcm3
9
b 4.25
5 IO 15 20 25 K :
0.5 10" icm3 - 9
9.5 I b
9.0
8.5
Fig. 12. (a) Temperature dependence of mass suscepti- bility xg of Pd-Cr alloys. (b) Temperature dependence of incremental mass susceptibility Axp = xhos, - xallo,, for 0.8 at% Cr and 0.5 at% Cr in Pd. For the 0.5 at% Cr alloy, the susceptibility was normalized to the suscepti- bility of the 0.8 at% Cr solution [70 N 11.
T-
Fig. 10. Magnetization data for a Pd-18 at% Cr sample. Open triangles: cooled in zero applied magnetic field and then warmed in 1 kOe; solid triangles: cooled and warmed in 1 kOe; open circles: cooled in zero field, and warmed in 0.5 kOe; solid circles: cooled and warmed in 0.5 kOe [79 C 11.
I cm3 s
x" a 1.5
1.0 0 50 100 150 200 250 K 300
T-
Landolf-Bbmstein New Series 111/19a
Franse, Gersdorf
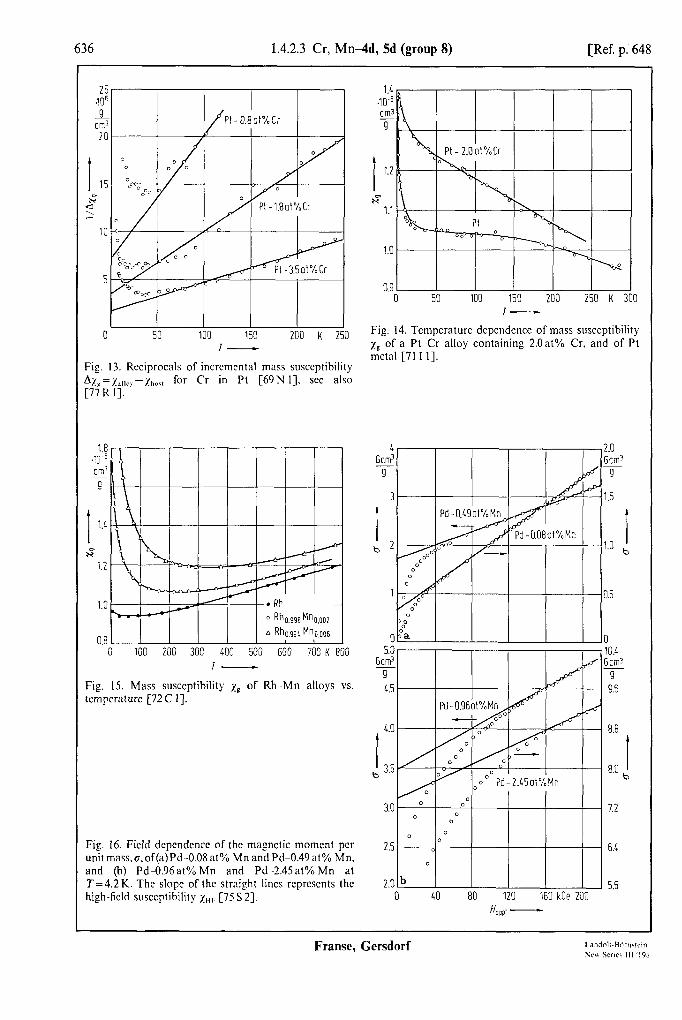
636 1.4.2.3 Cr, Mn-4d, Sd (group 8) [Ref. p. 648
I I I I 0 0 50 50 100 100 150 150 200 K 250 200 K 250
T-
Fig. 13. Reciprocals of incrcmcntal mass susceptibility Ax,= x~,,~,! -xholr for Cr in Pt [69 N I], see also [77 R I].
1.8 W5 cm’ 9
1 1.4
x” 1.2
1.0
08 0 100 200 300 400 500 600 700 K 800
I-
Fig. 15. Mass susceptibility xg of Rh Mn alloys vs. temperature [72 C I].
Fit. 16. Field dependence of the magnetic moment per umt mass. a,of(a)Pd -0.08 at% Mn and Pd-0.49 at% Mn, and @) Pdm0.96at% Mn and Pd -2.45at% Mn at T=4.2K. The slope of the straight lines rcprcscnts the high-field susceptibility z,,r [75 S 21.
1X .10-b cm! s
I
1.2
x" 1.1
1.0
0.9 50 100 150 200 250 K :
I-
Fig. 14. Tempcraturc dcpcndcncc of mass susccptibilit) xp of a Pt-Cr alloy containing 2.0at% Cr. and of Pt metal [71 I I].
4 Gcm3
9
3
I b 2
0 40 80 120 160 kOe 200 H - OpQl
LO ;crnl 5-l
1.5
I 1.0 b
3.5
3 0.4 cm? 9 9.6
8.8
I 8.0 b
I.2
6.4
5.6
Frame, Gersdorf

Ref. p. 6481 1.4.2.3 Mn4d, 5d (group 8) 637
Table 3. High-field magnetization data of Pd-Mn [75 S 21. xHF is the slope do/dH in the region of saturated solute magnetization. When saturation was not achieved (as indicated in the columns for xHF and J&J do/dH at maximum applied field is reported. os is obtained from the intersections of these high-field tangents with the rr axis (Fig. 16). j& is the saturation moment per solute atom as obtained from os, For g-factor data, see [64 S l] and [74A 11. Inelastic neutron scattering data are reported in [78 V 31.
at% Mn T H mm XHF
K kOe 10-6cm3g-1 2cm3g-’ PM”
PB
0.05 1.38 54 6.9 0.181 6.9 0.054 1.36 54 6.9 0.222 7.8 0.08 4.2 210 6.8 0.33 7.8 0.23 4.2 210 6.8 0.90 7.4 0.49 4.2 210 6.8 1.72 6.7 0.96 4.2 210 5 6.5 3.48 266.9 1.35 4.2 210 ~6.3 4.75 >6.7 2.45 4.2 210 <8.5 7.4 > 5.7
320
280
240
I 200
a, .> 2 160 -
2
120 0 0 0
80 0 0
0 0 Pd- 4at%Mn 0 . c Pd-6at%Mn
3 40 A Pd 8ot%Mn I. . l -- 0%
. . l
!--
nor?+--
A* A-b,~~A
n A------ n. .A a.
0 2 4 6 8 K IO T-
Fig. 17. Temperature dependence of the low-field ac susceptibility xLF for Pd-Mn alloys containing 4at%, 6 at% and 8 at% Mn. The position of the sharp peaks in xLF defines the freezing temperature T, [77 Z 11.
1 /'/ fiSot%Mn. 0.35ot%Fe 1 P IQ 2.5
2.0
1.5
1.0
0.5
0 3 6 9 12 15 T 18
8 WPl -
Fig. 18. High-field magnetization, expressed as average magnetic moment per solute atom, jsolute, for Pd-Mn and Pd-@In, Fe) vs. applied flux density [79 M 1] at 1.5 K and 4.2 K, respectively.
Land&BCmctein NW Serier 111/19a
Franse, Gersdorf

638 1.4.2.3 Mn4d, 5d (group 8) [Ref. p. 648
I
Pd-Mn
I_
0 2 6 8 at% 10 PJ E:n -
Fig. 19. Saturation magnetic moment j& as function of Mn concentration for Pd ~Mn alloys [79S I], see also [73 B 3, 75 D 1. 77C I]. and [78 F I]. Diffcrcnt sym- bols rcprcscnt data ofdifTcrcnt authors for PDF Mn (lower solid line). For comparison the upper solid line shows jpc VS. Fe concentration for Pd Fc.
L50 mJ
mol K LOO
150
100
50
0 0 3 6 9 12 15 K 18
T-
Fig. 20. (a) Diffcrcncc Aa in the thermal expansion cocflicicnt bctwccn various Pd-Mn alloys and pure Pd. The ferromagnetic and spin-glass transition temperatures arc indicated by T, and T,, rcspcctivcly. (b) Excess specific heat AC = C,,,,, - Ghost of various Pd--Mn alloys. The broken curve represents the ferromagnetic contribution to AC for the Pd -2 at% Mn alloy, whcrcas the solid curve shows the antiferromagnetic cluster part [S 1 B I], see also [Sl T I].
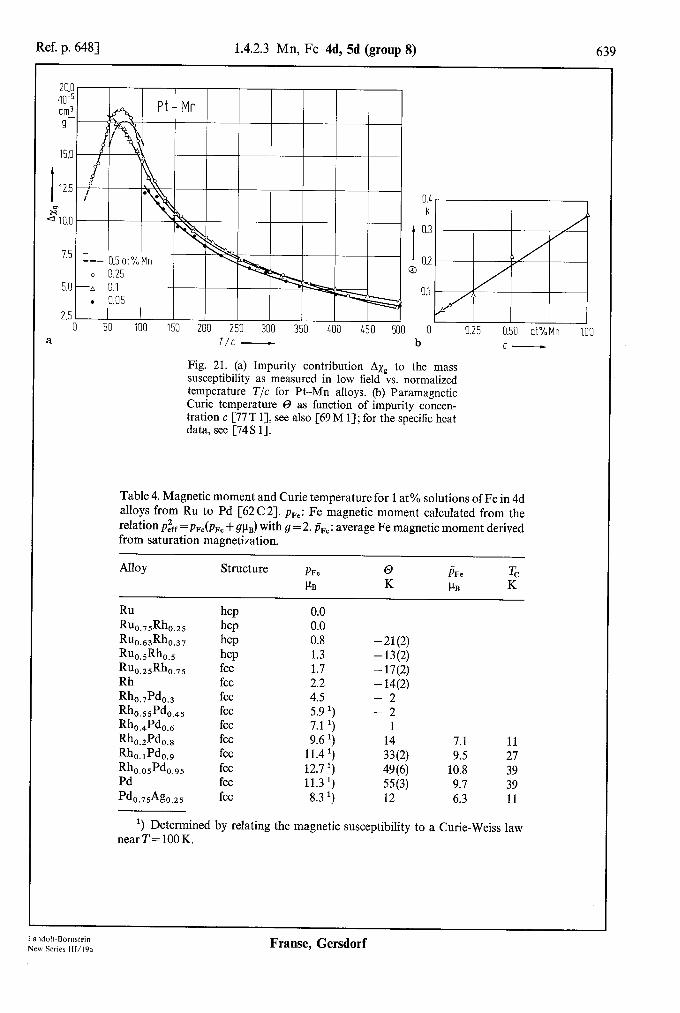
Ref. p. 6481 1.4.2.3 Mn, Fe-4d, 5d (group 8) 639
.10’5 cm3 - 9
Pt-Mn I
,
2.5 0 50 100 150 200 250 300 350 400 450 500
a 0
b 0.25 0.50 at% Mn 1.00
c-
Fig. 21. (a) Impurity contribution Axp to the mass susceptibility as measured in low field vs. normalized temperature T/c for Pt-Mn alloys. (b) Paramagnetic Curie temperature 0 as function of impurity concen- tration c [77 T I], see also [69 M 11; for the specific heat data, see [74 S 11.
Table 4. Magnetic moment and Curie temperature for 1 at% solutions of Fe in 4d alloys from Ru to Pd [62 C 21. pFe: Fe magnetic moment calculated from the relation p,“,, = pFe(PFe + gla) with g = 2. & : average Fe magnetic moment derived from saturation magnetization.
Alloy Structure PFe
PB
0 PFe T, K PB K
Ru RU o.,dWm km%,, Rudho., Ru o.zsRh,,,, Rh Rho.+&., Rhd%.ax bd’do., Rhd%.s Rho.,Pdo., Rbd’4,.,, Pd
Pdo.,,Ag,.,,
hcp hcp hcp hcp fee fee fee fee fee fee fee fee fee fee
0.0 0.0 0.8 -21(2) 1.3 -13(2) 1.7 -17(2) 2.2 -14(2) 4.5 -2 5.9 ') -2 7.1 ') 1 9.6')
11.4 ‘) E(2) 7.1 11 9.5 27
12.7') 49 (6) 10.8 39 11.3 ') 55(3) 9.7 39 8.3 1) 12 6.3 11
i) Determined by relating the magnetic susceptibility to a Curie-Weiss law near T = 100 K.
Landolt-Bbrnstein New Series 111/19a
Frame, Gersdorf

640 1.4.2.3 Fe-4d, 5d (group 8) [Ref. p. 648
0.i
0 5 10 15 20 kOe ; H- o;?
=ig. 22. hJngnctization curvzs for various conccnlrations If Pd Fc alloys at 1.25 K and 0.05 K. rcspcctivcly. The ron conrcntrntion is _piven in ppm [71 C 21.
0 0.0’ 0.02 0.03 at% 0.05 Pd Fe -
5 Gcir’ 9 i
I 3
6 2
1
c
1
Pd-Fe
Fe - I I c 0.25 0.50 0.75 1.00 ot% 1.25 PC Fe -
Fi_r. 25. Saturation mayctic moment per unit mass o, and Curie constant C, of Pd Fc alloys [7 1 C 2).
1.0 Crm3 I I
I 0.6
b
OX
Pd.T=l.ZgK /
8 12 16 kOe 20
Fig. 23. Magnctizntion curves of high-purity Pd and Pd-Fc alloys at low tcmpcratuics [70 M 31.
25.0 ,103
9 cm3
2o.c
17.5
I
15.c
b 12.: \ x
1O.I
7.:
5.1
2!
I I I I I I I
0.1 0.2 0.3 0.L 0.5 0.6(Gcm3/g)’ CT2 -
Fig. 24. H/a against ~7’ for Pd-O.l5at% Fe. The high- field points (I . ..I&5 kOc) arc marked with symbols denoting the tcmpcraturc of mcasurcmcnt. For the low- field points (0...1.25 kOe) the tcmpcraturcs are marked on the figure. The straight lines making intcrccpts on the G* axis arc drawn through isothermal points for liclds above IOkOc [70M3].
Frame, Gersdorf
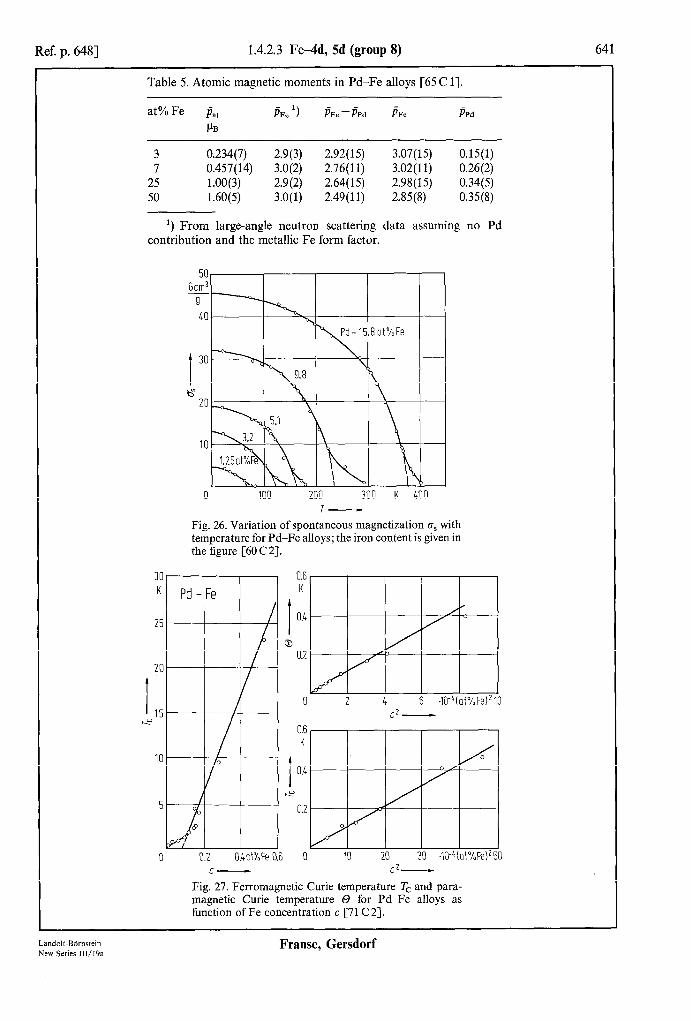
Ref. p. 6481 1.4.2.3 FewId, 5d (group 8) 641
Table 5. Atomic magnetic moments in Pd-Fe alloys [65 C 11.
3 0.234(7) 2.9(3) 2.92(H) 3.07(U) 0.15(l) 7 0.457(14) 3.0(2) 2.76(11) 3.02(11) 0.26(2)
25 1.00(3) 2.9(2) 2.64(H) 2.98(15) 0.34(5) 50 1.60(5) 3.0(l) 2.49(11) 2.85(8) 0.35(8)
‘) From large-angle neutron scattering data assuming no Pd contribution and the metallic Fe form factor.
0 -100 200 300 K 400 T-
Fig. 26. Variation of spontaneous magnetization gS with temperature for Pd-Fe alloys; the iron content is given in the figure [60 C 21.
K
I ox
Q 0.2
I 0 c*-
hy 0.6 K
I 0.4
I-Y
0.2
0 0.2 Il.kot%Fe 0.6 0 IO 20 30 m%t%Fe)*50 C- c*-
Fig. 27. Ferromagnetic Curie temperature ‘Kc and para- magnetic Curie temperature 0 for Pd-Fe alloys as function of Fe concentration c [7 1 C 21.
Landolt-Bdmstein New Series lWl9a
Franse, Gersdorf
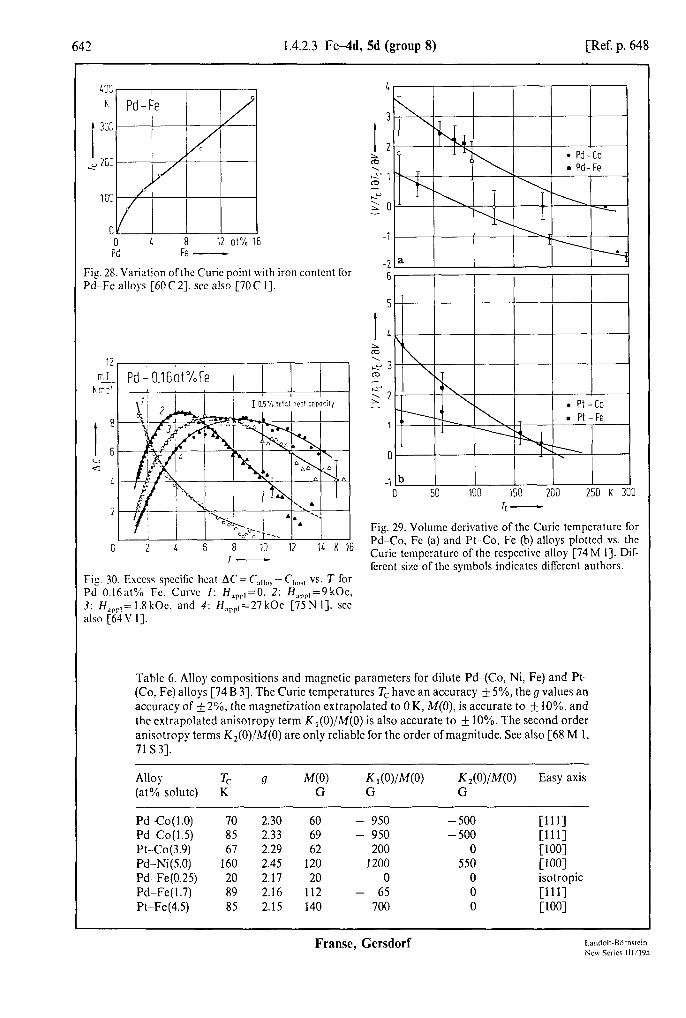
642 1.4.2.3 Fe-4d, 5d (group 8) [Ref. p. 648
PO6 4 8 12 at% 16
Fe -
Fig. 28. Variation ofthc Curie point with iron content for Pd-Fe alloys [60 C 23. see also [70 C I].
/ Pd - O.l6at%Fe ( 1
2 1 6 8 10 12 11 K 16 7-
Fig. 30. Excess specific hcnt AC= C’~llny-Chos, VS. T for Pd O.l6at% Fc. Curve I: H 3: H,,,,= I .8 kOc, and 4: H,,,zt=?k& ~%%~]?~ also [61 V I].
1
50 100 150 200 250 K 300 I ‘C -
Fig. 29. Volume derivative of the Curie temperature for Pd-Co, Fc (a) and Pt-Co, Fe (b) alloys plotted vs. the Curie tcmpcraturc of the respective alloy [74 M I]. Dif- fcrcnt size of the symbols indicates different authors.
Table 6. Alloy compositions and magnetic parameters for dilute Pd<Co, Ni, Fe) and Pt- (Co. Fe) alloys [74 B 31. The Curie temperatures ‘Fe have an accuracy rfi 5%, the g values an accuracy of f2%. the magnetization extrapolated to 0 K, M(O), is accurate to + iO%, and the extrapolated anisotropy term K,(O)/M(O) is also accurate to + 10%. The second order anisotropy terms K,(O)/M(O) are only reliable for the order of magnitude. See also [68 M 1, 71 S3].
Alloy Tc g (at% solute) K
M(O) G
K ,(0)/M(O) K,WM(O) Easy axis G G
Pd-Co( 1 .O) 70 2.30 60 - 950 - 500 Cl111 Pd-Co(l.5) 85 2.33 69 - 950 - 500 Cl111 Pt-Co(3.9) 67 2.29 62 200 0 Cl001 Pd-Ni(5.0) 160 2.45 120 1200 550 cw Pd-Fe(0.25) 20 2.17 20 0 0 isotropic Pd-Fe( 1.7) 89 2.16 112 - 65 0 Cl111 Pt-Fe(4.5) 85 2.15 140 700 0 Cl001
Frame, Gersdorf
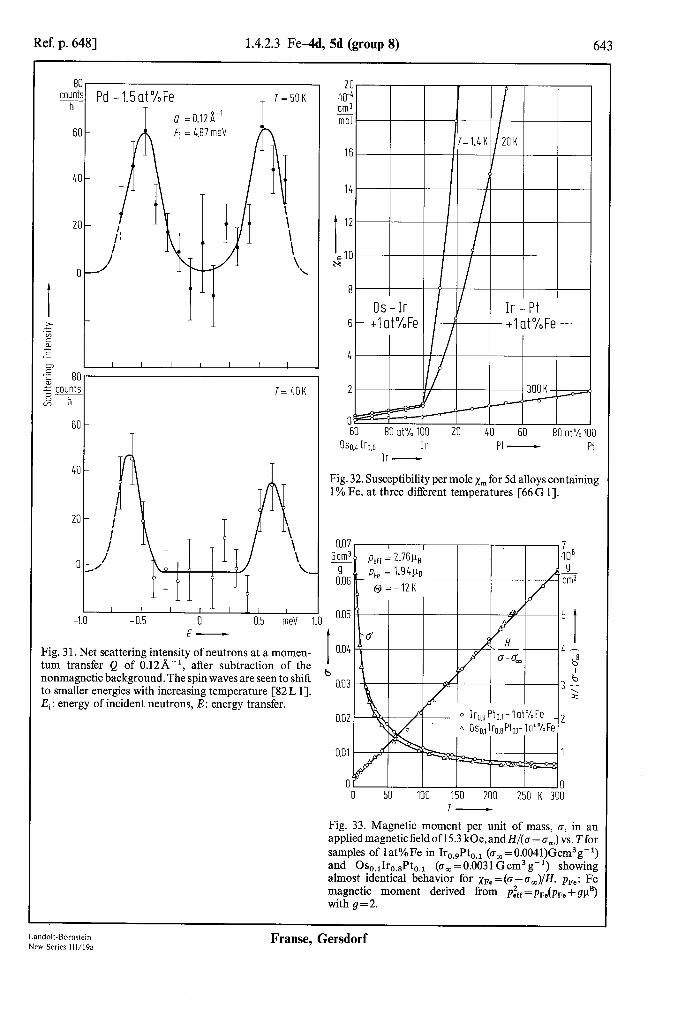
Ref. p. 6481 1.4.2.3 FewId, 5d (group 8) 643
%!!$k Pd -1.5at%Fe Q =0.12w-’
1=50K
\ \ \ \ \ \
\
F I I I I I I I
.- k 80 = counts o- l= 4OK s h
601
0
I I I I- I -I I
-1.0 -0.5 0 0.5 meV
1
? E-
Fig. 3 1. Net scattering intensity of neutrons at a momen- tum transfer Q of 0.12A-‘, after subtraction of the nonmagnetic background. The spin waves are seen to shift to smaller energies with increasing temperature [82 L 11. Ei: energy of incident neutrons, E: energy transfer.
2c .m4 cm3 - mol
I
12
.I0 H
8
6
60 80 at% 100 20 40 60 80 at% 100 0~0.4 Ir0.6 Ir Pt - Pt
Ir -
Fig. 32. Susceptibility per mole x,,, for 5d alloys containing 1% Fe, at three different temperatures [66 G 11.
Fig. 33. Magnetic moment per unit of mass, CJ, in an applied magnetic field of1 5.3 kOe,and H/(0-- a,) vs. Tfor samples of lat%Fe in Ir,,,Pt,,, (c, =0.0041)Gcm3g-‘) and Os,,,Ir,,,Pt,,, (cm =0.0031 Gcm3g-‘) showing almost identical behavior for ~r~=(a-crJH. pre: Fe magnetic moment derived Tom p& = pFe(pFe + gpB) with g = 2.
Landolt-Bbmsrein New Series 111/19a
Franse, Gersdorf
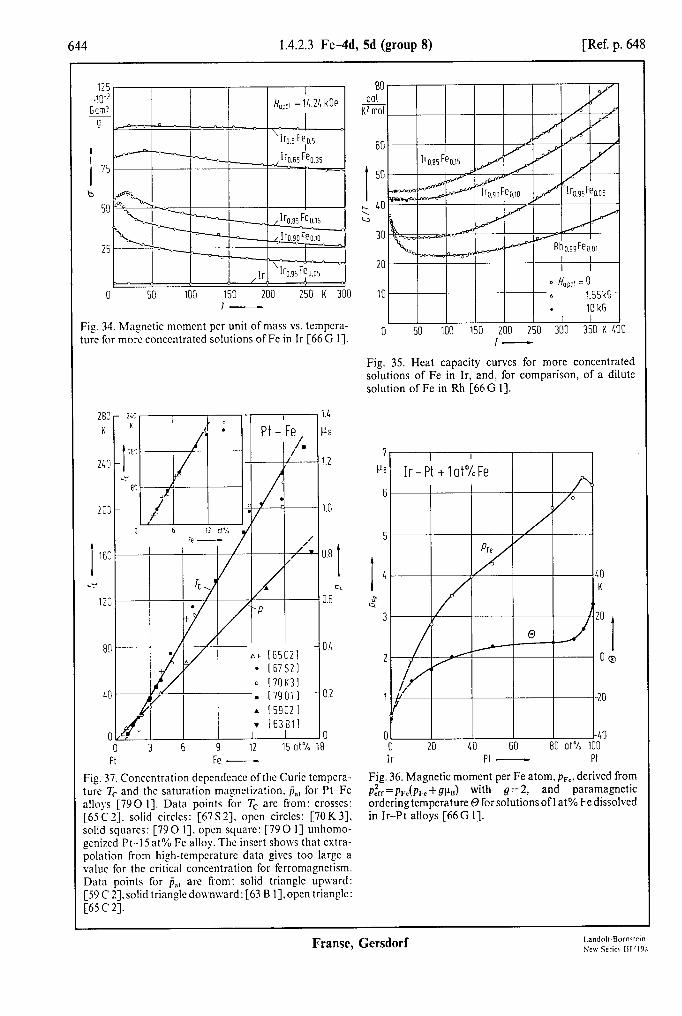
644 1.4.2.3 Fe-4d, 5d (group 8) [Ref. p. 648
1 Hoppr =k2L kOe 1 GUI
K2 mot
P- -
0 so 100 =i
150 200 250 K 300 7-
Fig. 34. hlagnetic moment per unit of mass vs. tempcra- ture for more conccntratcd solutions of Fe in Ir [66 G I].
21: k
I
16’
Y E!
I
‘I lx-----/‘.2 1.0
I 0.8 I 4
1 0.6
I 04
0.2
0 0 3 6 9 12 15 ot% 18
PI Fe -
Fig. 37. Concentration dcpendcncc ofthc Curie tcmpcra- turc Tc and the saturation magnetization. p,, for Pt-Fe alloys [790 I]. Data points for Tc arc from: crosses: [6S C 21. solid circles: [67S2]. open circles: [70K 33, solid squares: [790 I], open square: [790 I] unhomo- gcni7cd Pt.-l5 at% Fe alloy. The insert shows that extra- polation from high-tempcraturc data gives too large a value for the critical concentration for ferromagnetism. Data points for j,, arc from: solid triangle upward: [59 C 21. solid triangle downward: [63 B I],open triangle: [65C2].
I .Alr0.95Fe0.05 I 1 2 LO LD
30
20
10 . 10kG
I I II 50 100 150 200 250 300 350 K LOO
T-
Fig. 35. Heat capacity curves for more concentrated solutions of Fe in Ir, and, for comparison. of a dilute solution of Fe in Rh [66 G I].
7r I I I I I
pfi lr- Pt t lat%Fe I I Al
01 I I I- O 20 LO 60 80 at% lOi Ir Pt - Pt
Fig. 36. Magnetic moment per Fe atom, pFc. derived from pzrf = pFe( pFe + gua) with g = 2, and paramagnetic ordering temperature 0 for solutions of I at% Fe dissolved in Ir-Pt alloys [66G I].
Frame, Gersdorf
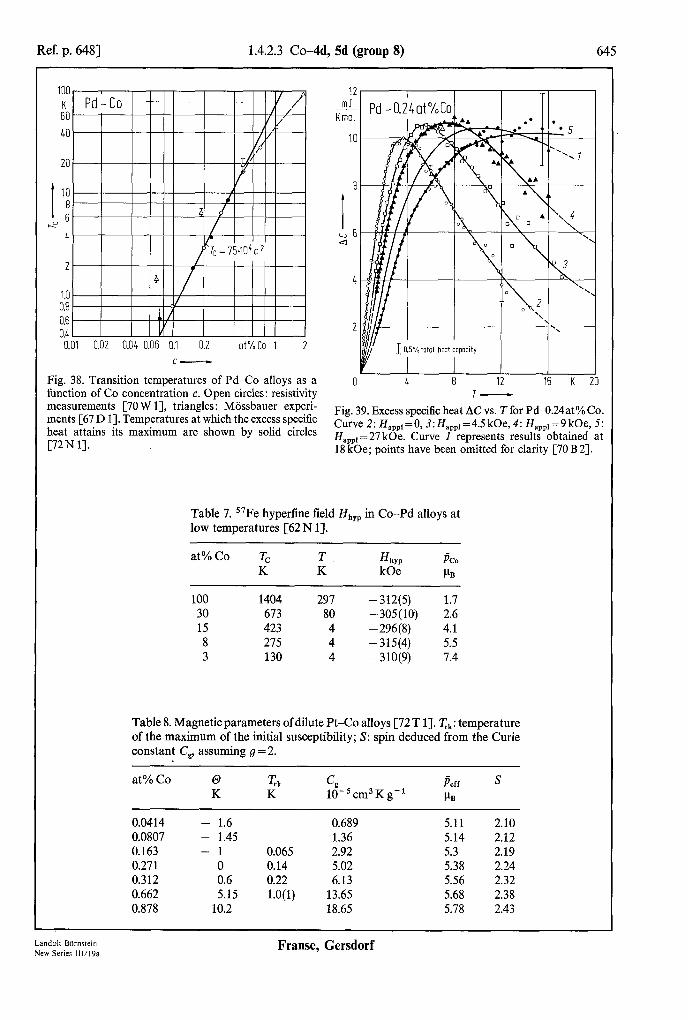
Ref. p. 6481 1.4.2.3 Co-4d, 5d (group 8) 645
I c ’ ” Tc=75404c~
2. 4
1.0 0.8 0.6 0.1, 0.01 0.02 0.01, 0.06 0.1 0.2 d%Co 1 2
Fig. 38. Transition temperatures of Pd-Co alloys as a function of Co concentration c. Open circles: resistivity
12 mJ
Kmol
I
4 8 12 16 K 20 T-
measurements [70 W 11, triangles: Miissbauer experi- ments [67 D I]. Temperatures at which the excess specific
Fig. 39. Excess specific heat AC vs. T for Pd-0.24at% Co.
heat attains its maximum are shown by solid circles Curve 2: H,,,r=O, 3:H,,,,=4.5 kOe,4: II,,,,=9 kOe, 5:
[72Nl]. H app,=27 kOe. Curve 1 represents results obtained at 18 kOe; points have been omitted for clarity [70 B 23.
Table 7. 57Fe hyperhne field HhYp in Co-Pd alloys at low temperatures [62 N 11.
at% Co T, T H hw PC, K K kOe PB
100 1404 297 -312(5) 1.7 30 673 80 -305(10) 2.6 15 423 4 -296(g) 4.1 8 275 4 -315(4) 5.5 3 130 4 - 310(9) 7.4
Table 8. Magnetic parameters of dilute Pt-Co alloys [72 T 11. rk: temperature of the maximum of the initial susceptibility; S: spin deduced from the Curie constant C,, assuming g = 2.
at% Co
0.0414 0.0807 0.163 0.271 0.312 0.662 0.878
0 Trk c, Peff s
K K 10-‘cm3Kg-r PB
- 1.6 0.689 5.11 2.10 - 1.45 1.36 5.14 2.12 -1 0.065 2.92 5.3 2.19
0 0.14 5.02 5.38 2.24 0.6 0.22 6.13 5.56 2.32 5.15 1.0(l) 13.65 5.68 2.38
10.2 18.65 5.78 2.43
Landolt-Bbmstein New Series III/l9a
Frame, Gersdorf
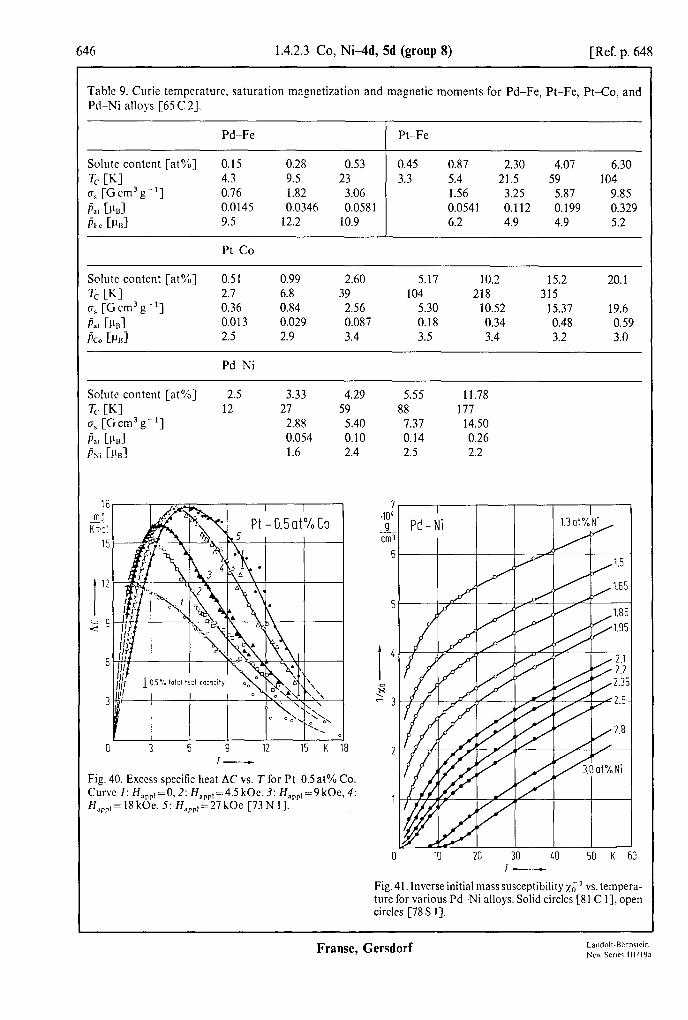
646 1.4.2.3 Co, NibId, 5d (group 8) [Ref. p. 648
Table 9. Curie temperature saturation magnetization and magnetic moments for Pd-Fe, Pt-Fe, Pt-Co, and Pd-Ni alloys [65 623.
PDF-Fe
Solute content [at%] 0.15 0.28 0.53 C WI 4.3 9.5 23 os [Gcm3g-‘1 0.76 1.82 3.06 Pat bnl 0.0145 0.0346 0.0581 i%e CPnl 9.5 12.2 10.9
Pt-Co
Pt-Fe
0.45 0.87 2.30 4.07 6.30 3.3 5.4 21.5 59 104
1.56 3.25 5.87 9.85 0.0541 0.112 0.199 0.329 6.2 4.9 4.9 5.2
Solute content [at%] 0.51 0.99 2.60 5.17 10.2 15.2 20.1 T, CKI 2.7 6.8 39 104 218 315 CT> [Gcm3g-‘1 0.36 0.84 2.56 5.30 10.52 15.37 19.6 Pa, CPBI 0.013 0.029 0.087 0.18 0.34 0.48 0.59 t% Ccd 2.5 2.9 3.4 3.5 3.4 3.2 3.0
Pd-Ni
Solute content [at%] 2.5 3.33 4.29 T,CKl 12 27 59 os [Gcm3g-‘1 2.88 5.40 L, Cd 0.054 0.10 Psi bnl 1.6 2.4
5.55 11.78 88 177
7.37 14.50 0.14 0.26 2.5 2.2
18 mJ
Krr:? 15
1
12
sg
6
3
0
.5% lolcl h?:t copxily
3 6 12 15 K 18
Fig. 40. Excess spccitic heat AC vs. T for Pt-0.5 at% Co. Curve I: H,,,,=O, 2: H,,,,=4.5 kOe. 3: Ha,,,=9 kOe, 4: H ,,,,=18kOe,5: H,,,,=27kOe [73Nl].
Fig. 41. Inverse initial mass susceptibility 10 ’ vs. tempera- ture for various Pd-Ni alloys. Solid circles [81 C I], open circles [78 S 11.
Frame, Gersdorf
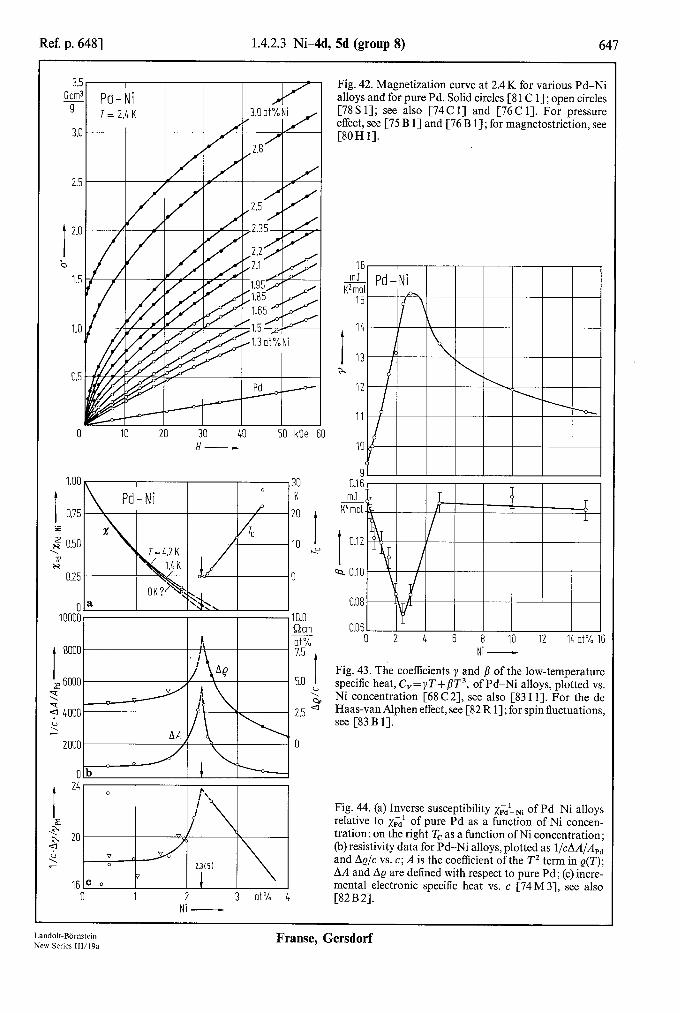
Ref. p. 6481 1.4.2.3 Ni-4d, 5d (group 8) 647
0 IO 20 30 40 50 kOe 60
1.00 I 30
t 0
Pd-Ni K
Qcm ai%
I 8000 7.5
z 6000 5.0 I 7 ?
2 4000 2.5 ' 4
2000 0
0 I 24
.g -2 20
4
Qcm
r\ ai%
j/-
'I 7.5
5.0 I D/I 1 \
\I :
AdI/\ I 0
16 0 1 2 3 at% 4
NI -
Fig. 42. Magnetization curve at 2.4 K for various Pd-Ni alloys and for pure Pd. Solid circles [S 1 C 11; open circles [78 S 11; see also [74 C I] and [76 C 11. For pressure effect, see [75 B 1] and [76 B 11; for magnetostriction, see [SO H I].
0.16
mJ K"mol
I 0.12
a 0.10
0.08
0.06 0 2 4 6 8 10 12 14 at% 16
NI -
Fig. 43. The coefficients y and /I of the low-temperature specific heat, C,=yT+ pT3, of Pd-Ni alloys, plotted vs. Ni concentration [68 C 23, see also [83 Ill. For the de Haas-van Alphen effect, see [82 R 11; for spin fluctuations, see [83 B 11.
Fig. 44. (a) Inverse susceptibility &lNi of Pd-Ni alloys relative to xpdl of pure Pd as a function of Ni concen- tration: on the right Tc as a function of Ni concentration; (b) resistivity data for Pd-Ni alloys, plotted as l/cAA/A,, and AQ/C vs. c; A is the coefficient of the T2 term in Q(T); AA and AQ are defined with respect to pure Pd; (c) incre- mental electronic specific heat vs. c [74M 31, see also [82B2].
Landolt-BOrnstein New Series ill/19a
Franse, Gersdorf
648 Rcfcrcnccs for 1.4.2
3oc 1 32Sl 35Fl 35Gl 36F1 37M 1 40Gl 50Al 50K 1 52Kl 5SG1 5SG2 59Cl 59C2 60C 1 6OC2 61 B I 62B I 62Cl 62C2
62Nl
62P 1 63B 1 63K 1 63 P 1 63Y1 64B I 64L1 64s 1
64S2 64V 1 65Cl 65C2 65C3 65Tl 66C 1 66G 1
66K I 66K2 66K3 66M I 67Dl 67M 1 67s 1 67S2 67Tl 6SA 1 6SB 1 6SB2 6SC 1 6SC2 6SG 1
1.4.2.4 References for 1.4.2
Constant, F.W.: Phys. Rev. 36 (1930) 1654. Sadron. C.: Ann. Phys. Paris 17 (1932) 371. Friederich. E.. Kussmann. A.: Phys. Z. 36 (1935) 185. Grubc. G.. Winklcr. 0.: Z. Elektrochem. 41 (1935) 52. Fallot, M.: Ann. Phys. 6 (1936) 305; 7 (1937) 420; 10 (1938) 29. Marian. V.: Ann. Phys. Paris 7 (1937) 459. Gebhardt, E., Kbster, W.: Z. Mctallkd. 32 (1940) 252. Auwgrter. M., Kussmann. A.: Ann. Phys. 7 (1950) 169. Kussmann. A.. Rittbcrg. G. v.: Ann. Phys. 7 (1950) 173. Kiister. W., Horn. E.: Z. Mctallkd. 43 (1952) 444. Gerstenbcrg. D.: Ann. Phys. Leipzig 2 (1958) 236. Gerstenberg. D.: Z. Metallkd. 49 (1958) 476. Corliss. L.M., Hastings, J.M., Weiss, R.J.: Phys. Rev. Lett. 3 (1959) 211. Crangle. J.: J. Phys. Paris 20 (1959) 435. Crangle. J.. Parsons. D.: Proc. R. Sot. 255 (1960) 509. Crangle. J.: Philos. Mag. 5 (1960) 335. Bozorth. R.M.. Wolff. P.A., Davis, D.D., Compton, V.B., Wernick, J.H.: Phys. Rev. 122 (1961) 1157. Bozorth. R.M.. Davis. D.D., Wernick, J.H.: J. Phys. Sot. Jpn. 17, B-I (1962) 112. Cable. J.W., Wollan. E.D., Koehler, W.C., Child, H.R.: Phys. Rev. 128 (1962) 2118. Clogston. A.M., Matthias, B.T., Peter, M., Williams, H.J., Corenzwit, E., Sherwood, R.C.: Phys. Rev.
125 (1963) 541. Nagle. D.E.. Craig. P.P., Barrett, P., Cochran, D.F.R., Olsen, C.E., Taylor, R.B.: Phys. Rev. 125(1962)
490. Pickart, S.J.. Nathans. R.: J. Appl. Phys. 33 (1962) 1336. Bacon. G.E., Crangle. J.: Proc. R. Sot. London A272 (1963) 387. Kouvel, J.S.. Hart&us. C.C., Osika, L.M.: J. Appl. Phys. 34 (1963) 1095. Pickart. S.J.. Nathans. R.: J. Appl. Phys. 34 (1963) 1203. Yokoyama. T., Wuttig, M.: Z. Metallkd. 54 (1963) 308. Booth. J.G.: Phys. Status Solidi 7 (1964) K 157. Laar. B. van: J. Phys. Paris 25 (1964) 600. Shaltiel. D., Wernick. J.H., Williams, H.J., Peter, M.: Phys. Rev. 135 (1964) A 1346. Shnltiel. D., Wernick. J.H.: Phys. Rev. 136 (1964) A 245. Shirane. G., Nathans, R., Chen, C.W.: Phys. Rev. 134 (1964) A 1547. Veal. B.W., Raync. J.A.: Phys. Rev. 135 (1964) A 442. Cable. J.W., Wollan. E.O., Koehler, WC.: Phys. Rev. 138 (1965) A755. Crangle. J., Scott. W.R.: J. Appl. Phys. 38 (1965) 921. Collins. M.F., Low, G.G.: Proc. Phys. Sot. (London) 86 (1965) 535. Tsiovkin. Yu.N., Volkenstheyn. N.V.: Phys. Met. Metallogr. (USSR) 19, 3 (1965) 45. Campbell. LA.: Proc. Phys. Sot. (London) 89 (1966) 71. Geballe. T.H., Matthias. B.T., Clogston, A.M., Williams, H.J., Sherwood, R.C., Maita, J.P.: J. Appl.
Phys. 37 (1966) 1181. Koehler. W.C., Moon, R.M., Trego, A.L., Mackintosh, A.R.: Phys. Rev. 151 (1966) 405. Krin, E.. KLdir. G., Pil. L., %lyom, J., Szab6, P.: Phys. Lett. 20 (1966) 331. Krt-n. E.. S6lyom. J.: Phys. Lett. 22 (1966) 273. Menzinger. F., Paoletti. A.: Phys. Rev. 143 (1966) 365. Dunlap, B.D., Dash. J.G.: Phys. Rev. 155 (1967) A460. Maley. M.P., Taylor. R.D.. Thompson, J.L.: J. Appl. Phys. 38 (1967) 1249. Sarachik. M.P., Shaltiel. D.: J. Appl. Phys. 38 (1967) 1155. Segnan. R.: Phys. Rev. 160 (1967) A404. Trousdale. W.L., Longworth, G., Kitchens, T.A.: J. Appl. Phys. 38 (1967) 922. Alekseevskii. N.E., Samerskii, Yu.A., Kir’yanov, A.P., Tsebro, V.I.: JETP Lett. 8 (1968) 403. Brinkman. W.F., Bucher, E., Williams, H.J., Matia, J.P.: J. Appl. Phys. 39 (1968) 547. Baggurley, D.M.S.. Robertson, J.A.: Phys. Lett. 27 A (1968) 516. Comly, J.C.. Holden. T.M.. Low, G.G.: J. Phys. C 1 (1968) 458. Chouteau. G., Fourneaux. R.. Tournier, R., Lederer, P.: Phys. Rev. Lett. 21 (1968) 1082. Gainon. D.. Sierra. J.: Phys. Lett. 26 A (1968) 601.
Frame, Gersdorf
References for 1.4.2 649
68Hl 68Kl 68K2 68Ml 68Pl 68P2
68s 1 68Wl 69Al 69Cl 69Fl 69F2 69Kl 69K2 69K3 69Ml 69Nl 69Pl 69Rl 69Sl 69Tl 69Vl
69Wl
69W2 70Al 70A2 70Bl 70B2 7OCl 7OC2 7OJl 70Kl 70K2 70K3 7OLl 70Ml 70M2 70M3 70Nl 70N2 7OVl 7OWl 71 c 1 71C2 71c3 7111 7112 71Ll 71Ml 71M2 7101 71Sl 71S2 71s3 71Tl
Hicks, T.J., Pepper, A.R., Smith, J.H.: J. Phys. Cl (1968) 1683. Kussmann, A., Miiller, K., Raub, E.: Z. Metallkd. 59 (1968) 859. KrCn, E., Kadar, G., Pal, L., Sblyom, J., Szabo, P., Tarnoczi, T.: Phys. Rev. 171 (1968) 574. McDougal, M., Manuel, A.J.: J. Appl. Phys. 39 (1968) 961. Pal, L., KrCn, E., Kadar, G., Szabb, P., Tarnoczi, T.: J. Appl. Phys. 39 (1968) 538. Ponyatovskii, E.G., Kutsar, A.R., Dubovka, G.T.: Kristallografiya 12 (1967) 79 (Sov. Phys.
Crystallogr. 12 (1968)). Shirley, D.A., Rosenblum, S.S., Matthias, E.: Phys. Rev. 170 (1968) 363. Wayne, R.C., Bartell, L.C.: Phys. Lett. 28A (1968) 196. Antonini, B., Lucari, F., Menzinger, F., Paoletti, A.: Phys. Rev. 187 (1969) 611. Calow, J.S., Meads, R.E.: J. Phys. C2 (1969) 2120. Fujimori, H., Saito, H.: J. Phys. Sot. Jpn. 26 (1969) 1115. Fischer, G., Besnus, M.J.: Solid State Commun. 7 (1969) 1527. KrCn, E., KBdLr, G.: Phys. Lett. 29A (1969) 340. Kouvel, J.S., Forsyth, J.B.: J. Appl. Phys. 40 (1969) 1359. Kawatra, M.P., Skalski, S., Mydosh, J.A., Budnick, J.I.: J. Appl. Phys. 40 (1969) 1202. Miyaka, Y., Morishita, H., Watanabe, T.: J. Phys. Sot. Jpn. 27 (1969) 1071. Nagasawa, H.: J. Phys. Sot. Jpn. 27 (1969) 787. Palaith, D., Kimball, C.W., Preston, R.S., Crangle, J.: Phys. Rev. 178 (1969) 795. Rault, J., Burger, J.P.: C.R. Acad. Sci., Ser. B 269 (1969) 1085. Star, W.M., Nieuwenhuys, G.J.: Phys. Lett. 30A (1969) 22. Tu, P., Heeger, A.J., Kouvel, J.S., Comley, J.B.: J. Appl. Phys. 40 (1969) 1368. Vinokurova, L.I., Nikolayev, I.N., Mel’nikov, Ye.V., Adis’yevich, I.K., Reutov, Yu.B.: Phys. Met.
Metallogr. (USSR) 28, 6 (1969) 147. Williams, G., Loram, J.W.: Solid State Commun. 7 (1969) 1261 and J. Phys. Chem. Solids 30 (1969)
1827. Wheeler, J.C.G.: J. Phys. C2 (1969) 135. Arajs, S., De Young, T.F., Anderson, E.E.: J. Appl. Phys. 41 (1970) 1426. Aldred, A.T., Rainford, B.D., Stringfellow, M.W.: Phys. Rev. Lett. 24 (1970) 897. Bucher, E., Brinkman, W., Maita, J.P., Cooper, A.S.: Phys. Rev. B 1 (1970) 274. Boerstoel, B.M., Baarle, C. van: J. Appl. Phys. 41 (1970) 1079. Clark, P.E., Meads, R.E.: J. Phys. C 3 (1970) S 308. Cable, J.W., Child, H.R.: Phys. Rev. B 1 (1970) 3809. Jayaraman, A., Rice, T.M., Bucher, E.: J. Appl. Phys. 41 (1970) 869. Kaneko, T., Fujimori, H.: J. Phys. Sot. Jpn. 28 (1970) 1373. Kawatra, M.P., Budnick, J.I.: Int. J. Magn. 1 (1970) 61. Kawatra, M.P., Mydosh, J.A., Budnick, J.A., Madden, B.: Proc. Low.Temp. (Kyoto) 12 (1970) 773. Loegel, B.: J. Phys. C3 (1970) S 355. McKinnon, J.B., Melville, D., Lee E.W.: J. Phys. C 3 (1970) S 46. Mizoguchi, T., Sasaki, T.: J. Phys. Sot. Jpn. 28 (1970) 532. McDougal, M., Manuel, A.J.: J. Phys. C3 (1970) 147. Nagasawa, H.: J. Phys. Sot. Jpn. 28 (1970) 1171. Nieuwenhuys, G.J., Boerstoel, B.M.: Phys. Lett. 33A (1970) 147. Vogt, E., Biilling, F., Treutmann, W.: Ann. Phys. 25 (1970) 280. Williams, G.: J. Phys. Chem. Solids 31 (1970) 529. Chakravorty, S., Panigrahy, P., Beck, P.A.: J. Appl. Phys. 42 (1971) 1698. Chouteau, G., Tournier, R.: J. Phys. Paris 32 (1971) C l-1002. Crangle, J., Goodman, G.M.: Proc. R. Sot. (London) A321 (1971) 477. Inoue, N., Nagasawa, H.: J. Phys. Sot. Jpn. 31 (1971) 477. Ivanova, G.V., Magat, L.M., Solina, L.V., Shur, Ya.S.: Phys. Met. Metallogr. (USSR) 32,3 (1971) 92. Loram, J.W., Williams, G., Swallow, G.A.: Phys. Rev. B3 (1971) 3060. Matsumoto, M., Goto, T., Kaneko, T.: J. Phys. Paris 32 (1971) C 1419. Moon, R.M.: Int. J. Magnetism 1 (1971) 219. Ohno, H.: J. Phys. Sot. Jpn. 31 (1971) 92. Star, W.M.: Thesis, University of Leiden, Netherlands 1971. Stoelinga, S.J.M., Grimberg, A.J.T., Gersdorf, R., Vries, G. de: J. Phys. Paris 32 (1971) Cl-330. Swallow, G.A., Williams, G., Grassie, A.D.C., Loram, J.W.: J. Phys. Fl (1971) 511. Ttriplett, B.B., Phillips, N.E.: Phys. Lett. 37A (1971) 443.
Land&B6msrein New Series 111/19a
Frame, Gersdorf

650 References for 1.4.2
71Vl 71Y 1 72B 1 72B2 72Cl 72Dl 72Fl 72Gl 72Ml 72Nl
72Sl 72Tl 73 Al 73A2 73Bl 73B2 73B3 73Dl 73Gl 7362
73Kl 73K2 73K3 73K4 73K5
73Nl
73s1 73Tl 73T2 74A1 74A2 74Bl 74B2 74B3 74C 1 74Dl 74Fl 7411 74Ml 74M2
74M3 74Nl 74Rl 74Sl 74S2 74s3
74Yl 74Y2 7421 75Al 75A2 75A3
Vinokurova, L., Pardavi-Horvath, M.: Phys. Status Solidi (b) 48 (1971) K 31. Yamaoka. T., Mekata. M., Takaki, H.: J. Phys. Sot. Jpn. 31 (1971) 301. Boerstoel. B.M., Zwart, J.J., Hansen, J.: Physica 57 (1972) 397. Besnus. M.J., Herr, A.: Phys. Lett. 39 A (1972) 83. Claus, H.: Phys. Rev. B5 (1972) 1134. DeYoung. T.F., Arajs, S., Anderson, E.E.: AIP Conf. Proc. 5 (1972) 517. Ferrando, W.A., Segnan, R., Schindler, AI.: Phys. Rev. B5 (1972) 4657. Gillespie, D.J., Schindler, AI.: AIP Conf. Proc. 5 (1972) 461. Menzinger, F., Romanazzo, M., Sacchetti, F.: Phys. Rev. B5 (1972) 3778. Nieuwenhuys, G.J., Boerstoel, B.M., Zwart, J.J., Dokter, H.D., Berg, G.J. van den: Physica 62 (1972)
278. Star, W.M., Vroede, E. de, Baarle, C. van: Physica 59 (1972) 128. Tissier, B., Tournier, R.: Solid State Commun. 11 (1972) 895. Abdul-Noor, S.S., Booth, J.G.: Phys. Lett. 43 A (1973) 381. Arajs, S., Rao, K.V., Astrom, H.U., DeYoung, T.F.: Physica Scripta 8 (1973) 109. Besnus. M.J., Meyer, A.J.P.: Phys. Status Solidi (b) 58 (1973) 533. Besnus. M.J., Meyer, A.J.P.: Phys. Status Solidi (b) 55 (1973) 521. Burger, J.P., McLachlan, D.S.: Solid State Commun. 13 (1973) 1563. DeYoung. T.F., Arajs, S., Anderson, E.E.: J. Less-Common Met. 32 (1973) 165. Goring, J.: Phys. Status Solidi (b) 57 (1973) K 7. Gillespie, D.J., Mackliet, C.A., Schindler, AI.: Amorphous Magnetism (Hooper, H., Graaf, A.M., de,
eds.). New York: Plenum Press 1973, 343. Kao, F.C.C., Colp, M.E., Williams, G.: Phys. Rev. B8 (1973) 1228. Kao, F.C.C., Williams, G.: Phys. Rev. B7 (1973) 267. Kuentzler, R., Meyer, A.J.P.: Phys. Lett. 43 A (1973) 3. Kadomatsu, H., Fujii, H., Okamoto, T.: J. Phys. Sot. Jpn. 34 (1973) 1417. Kelarev, V.V., Vokhmyanin, A.P., Dorofeyev, Yu.A., Sidorov, S.K.: Phys. Met. Metallogr. (USSR) 35,
6 (1973) 1302. Nieuwenhuys, G.J., Pikart, M.F., Zwart, J.J., Boerstoel, B.M., Berg, G.J. van den: Physica 69 (1973)
119. Sumiyama, K., Graham, G.M., Nakamura, Y.: J. Phys. Sot. Jpn. 35 (1973) 1255. Tamminga. Y., Barkman, B., Boer, F.R. de: Solid State Commun. 12 (1973) 731. Tokunaga. T., Tange, H., Goto, M.: J. Phys. Sot. Jpn. 34 (1973) 1103. Alquit. G., Kreisler, A., Sadoc, G., Burger, J.P.: J. Phys. Paris Lett. 35 (1974) L69. Alberts, H.L., Beille, J., Bloch, D., Wohlfarth, E.P.: Phys. Rev. B9 (1974) 2233. Beille. J., Bloch. D., Besnus, M.J.: J. Phys. F4 (1974) 1275. Beille, J., Bloch, D., Kuentzler, R.: Solid State Commun. 14 (1974) 963. Baggurley, D.M.S., Robertson, J.A.: J. Phys. F4 (1974) 2282. Chouteau, G., Tournier, R., Mallard, P.: J. Phys. Paris 35 (1974) C4-185. Dubovka, G.T.: Sov. Phys. JETP 38 (1974) 1140. Fujimori, H., Hiroyoshi, H.: Solid State Commun. 15 (1974) 1287. Ito, Y., Sasaki, T., Mizoguchi, T.: Solid State Commun. 15 (1974) 807. Meier, J.S., Christoe, C.W., Wortmann, G., Holzapfel, W.B.: Solid State Commun. 15 (1974) 485. Men’shikov, A.Z., Dorofeyev, Yu.A., Kazantsev,V.A., Sidorov, S.K.: Phys. Met. Metallogr. (USSR)38,
3 (1974) 47. Murani, A.P., Tari, A., Coles, B.R.: J. Phys. F4 (1974) 1769. Nikolayev, I.N., Vinogradov, B.V., Pavlynkov, L.S.: Phys. Met. Metallogr. (USSR) 38, 1 (1974) 85. Ricodeau, J.A.: J. Phys. F4 (1974) 1285. Sacli, O.A., Emerson, D.J., Brewer, D.F.: J. Low Temp. Phys. 17 (1974) 425. Scherg. M., Seidel, E.R., Litterst, F.J., Gierish, W., Kalvius, G.M.: J. Phys. Paris 35 (1974) C6527. Schinkel, C.J., in: Physique sous Champs Magnttiques Intenses, Colloque du CNRS, Grenoble 1974,
25. Yamaoka, T.: J. Phys. Sot. Jpn. 36 (1974) 445. Yamaoka, T., Mekata, M., Takaki, H.: J. Phys. Sot. Jpn. 36 (1974) 438. Zavadskii, E.A., Medvedeva, L.I.: Sov. Phys. Solid State 15 (1974) 1595. Arajs, S., Moyer, CA., Kelly, J.R., Rao, K.V.: Phys. Rev. B 12 (1975) 2747. Abdul-Noor, S.S., Booth, J.G.: J. Phys. F5 (1975) L 11. Arajs, S., Rao, K.V., Anderson, E.E.: Solid State Commun. 16 (1975) 331.
Frame, Gersdorf
References for 1.4.2 651
75A4 75Bl 75Cl 75C2 75Dl 75El 75Fl 75F2 7551 75Kl 75K2 75Ml 75M2 75M3 75Nl 75Sl 75S2 7583 7521 76Bl 76B2 76Cl 76Kl 76Ml 76Rl
76Tl 76Vl 76V2 77Cl 77C2 77Fl 77Gl 7762 77Kl 7701 77Rl 77R2 77Sl 7782
77Tl 7721 78Bl 78Cl 78Fl 7811 78Ml
78Nl 7801 78Pl 78P2 78Sl 78Tl 78Vl 78V2
Antonov, V.Ye., Dubovka, G.T.: Phys. Met. Metallogr. (USSR) 40, 3 (1975) 171. Beille, J., Chouteau, G.: J. Phys. F5 (1975) 721. Coles, B.R., Jamieson, H.C., Taylor, R.H., Tari, A.: J. Phys. F5 (1975) 565. Chen, C.W., Buttry, R.W.: AIP Conf. Proc. 24 (1975) 437. De Pater, C.J., Dijk, C. van, Nieuwenhuis, G.J.: J. Phys. F5 (1975) L 58. Eytel, L., Raghavan, P., Munnick, D.E., Raghavan, R.S.: Phys. Rev. B 11 (1975) 1160. Fukamichi, K., Saito, H.: J. Less-Common Met. 40 (1975) 357. Fujiwara, H., Tokunaga, T.: J. Phys. Sot. Jpn. 39 (1975) 927. Jamieson, H.C.: J. Phys. F5 (1975) 1021. Kadomatsu, H., Fujiwara, H., Ohishi, K., Yamamoto, Y.: J. Phys. Sot. Jpn. 38 (1975) 1211. Koon, N.C., Gubser, D.U.: AIP Conf. Proc. 24 (1975) 94. Menshikov, A., Tarnoczi, T., KrCn, E.: Phys. Status Solidi (a) 28 (1975) K 85. Martin, D.C.: J. Phys. F5 (1975) 1031. Muellner, W.C., Kouvel, J.S.: Phys. Rev. Bll (1975) 4552. Nieuwknhuys, G.J.: Adv. Phys. 24 (1975) 515. Strom-Olsen, J.O., Williams, G.: Phys. Rev. B 12 (1975) 1986. Star, W.M., Foner, S., McNiff Jr., E.J.: Phys. Rev. B 12 (1975) 2690. Swallow, G.A., Williams, G., Grassie, A.D.C., Loram, J.W.: Phys. Rev. Bll (1975) 337. Zweers, H.A., Berg, G.J. van den: J. Phys. F5 (1975) 555. Beille, J., Tournier, R.: J. Phys. F6 (1976) 621. Beille, J., Pataud, P., Radhakrishna, P.: Solid State Commun. 18 (1976) 1291. Chouteau, G.: Physica 84 B (1976) 25. Kortekaas, T.F.M., Franse, J.J.M.: J. Phys. F6 (1976) 1161. Maartense, I., Williams, G.: J. Phys. F6 (1976) L 121. Rao, K.V., Rapp, O., Johannesson, Ch., Budnick, J.I., Burch, T.J., Canella, V.: AIP Conf. Proc. 29
(1976) 346. Tsiovkin, Yu.N., Kourov, N.I., Volkenshteyn, N.V.: Phys. Met. Metallogr. (USSR) 42,2 (1976) 157. Vogt, E.: Phys. Status Solidi (a) 34 (1976) 11. Vinokurova, L., Vlasov, A.V., Pardavi-Horvath, M.: Phys. Status Solidi (b) 78 (1976) 353. Cable, J.W., David, L.: Phys. Rev. B 16 (1977) 297. Cable, J.W.: Phys. Rev. B 15 (1977) 3477. Franse, J.J.M.: Physica 86-88 B (1977) 283. Goto, T., Yamauchi, H.: J. Phys. Sot. Jpn. 43 (1977) 339. Goto, T.: J. Phys. Sot. Jpn. 43 (1977) 1848. Kortekaas, T.F.M., Franse, J.J.M.: Phys. Status Solidi (a) 40 (1977) 479. Oishi, K.: J. Sci. Hiroshima Univ. Ser. A41 (1977) 1. Roshko, R.M., Maartense, I., Williams, G.: J. Phys. F7 (1977) 1811; Physica 86-88B (1977) 829. Ryshenko, B.V., Sidorenko, F.A., Karpov, Yu.G., Gel’d, P.V.: Sov. Phys. JETP 46 (1977) 547. Smith, A.J., Stirling, W.G., Holden, T.M.: J. Phys. F7 (1977) 2411; Physica 86-88B (1977) 349. Savchenkova, S.F., Tsiovkin, Yu.N., Zolov, T.D., Volkenshteyn, N.V.: Phys. Met. Metallogr. (USSR)
43, 1 (1977) 188. Tholence, J.L., Wasserman, E.F.: Physica 86-88 B (1977) 875. Zweers, H.A., Pelt, W., Nieuwenhuys, G.J., Mydosh, J.A.: Physica 86-88 B (1977) 837. Beille, J., Bloch, D., Voiron, J.: J. Mag. Magn. Mater. 7 (1978) 271. Cable, J.W.: J. Appl. Phys. 49 (1978) 1527. Flouquet, J., Ribault, M., Taurian, V., Sanchez, J., Tholence, J.L.: Phys. Rev. B 18 (1978) 54. Inoue, N., Sugawara, T.: J. Phys. Sot. Jpn. 44 (1978) 440. Michelluti, B., Perrier de la Bathie, R., du Tremolet de Lacheisserie, E.: Solid State Commun. 28 (1978)
879. Nakamura, Y., Sumiyama, K., Shiga, M.: Inst. Phys. Conf. Proc. 39 (1978) 522. Ododo, J.C., Horvath, W.: Solid State Commun. 26 (1978) 39. Pardavi-Horvath, M., Vinokurova, L.I., Vlasov, A.V.: Inst. Phys. Conf. Proc. 39 (1978) 603. Ponomarev, B.K., Tiessen, V.G.: Phys. Status Solidi (b) 88 (1978) K 139. Sain, D., Kouvel, J.S.: Phys. Rev. B 17 (1978) 2257. Tokunaga, T., Fujiwara, H.: J. Phys. Sot. Jpn. 45 (1978) 1232. Verbeek, B.H., Nieuwenhuys, G.J., Stocker, H., Mydosh, J.A.: Phys. Rev. Lett. 40 (1978) 586. Vinokurova, L.I., Ivanov, V.Yu., Sagoyan, L.I., Rodionov, D.P.: Phys’Met. Metallogr. (USSR) 45,4,
(1978) 869.
Land&-Biirnsfein New Series 111/19a
Frame, Gersdorf

652 References for 1.4.2
7sv3 79Al 79Cl 79Gl 79K 1 79K2 79K3 79Ml 7901 79 P 1 79P2 79P3 79Rl 79Sl 79Wl 79w2 80Al 80B1 80Fl 80H 1 80Kl 80M 1 80M2
8001 8OPl 80R 1 8OYl 81Bl
81Cl 81 H 1 81 H2 81H3 8151 81Kl 81K2 81K3 81Pl 81Sl 81S2 81Tl 81 T2 81 v 1
81Wl 81 W2 82Al 82Bl 82B2 82H 1 82H2 82Jl 82Ll 8201 82Rl 82Tl 82Yl
Verbeek, B.H., van Dijk, C., Nieuwenhuys, G.J., Mydosh, J.A.: J. Phys. Paris 39 (1978) C&918. Acker. F., Huguenin. R.: J. Mag. Magn. Mater. 12 (1979) 58. Cochrane, R.W., Strom-Olsen, J.O., Williams, G.: J. Phys. F9 (1979) 1165. Guy. C.N., Strom-Olsen. J.O.: J. Appl. Phys. 50 (1979) 7353. Kaaakami, M., Goto, T.: J. Phys. Sot. Jpn. 46 (1979) 1492. Kelly, J.R.. Moyer, C.A., Arajs, S.: Phys. Rev. B20 (1979) 1099. Kadomatsu, H., Fujiwara, H.: Solid State Commun. 29 (1979) 255. Mydosh, J.A., Roth, S.: Phys. Lett. 69A (1979) 350. Ododo. J.C.: J. Phys. F9 (1979) 1441. Paul, D.M., Stirling, W.G.: J. Phys. F9 (1979) 2439. Parette, G., Kajzar, F.: J. Phys. F9 (1979) 1867. Parra, R.E., Cable, J.W.: J. Appl. Phys. 50 (1979) 7522. Rainford, B.D.: J. Mag. Magn. Mater. 14 (1979) 197. Smit, J.J., Nieuwenhuys, G.J., Jongh, L.J. de: Solid State Commun. 30 (1979) 243. Williams, D.E.G., Lewin, B.G.: Z. Metallkd. 70 (1979) 441. Wu? M.K., Aitken, R.G., Chu, C.W., Huang, C.Y., Olsen, C.E.: J. Appl. Phys. 50 (1979) 7356. Aubert, G., Michelluti, B.: J. Mag. Magn. Mater. 15-18 (1980) 575. Bieber. A.? Charaki. A., Kuentzler, R.: J. Mag. Magn. Mater. 15-18 (1980) 1161. Franse, J.J.M., Hiilscher, H., Mydosh, J.A.: J. Mag. Magn. Mater. 15-18 (1980) 179. Hiilscher. H., Franse, J.J.M.: J. Mag. Magn. Mater. 15-18 (1980) 605. Kadomatsu. H., Kamimori, T., Tokunaga, T., Fujiwara, H.: J. Phys. Sot. Jpn. 49 (1980) 1189. Moyer, CA., Arajs, S., Eroglu, A.: Phys. Rev. B 22 (1977) 3277. Mydosh. J.A., Nieuwenhuys, G.J., in: Ferromagnetic Materials I (Wohlfarth, E.P., ed.), Amsterdam:
North-Holland Publishing Company 1980, p. 71. Ododo, J.C.: J. Phys. F 10 (1980) 2515. Parra. R.E., Cable, J.W.: Phys. Rev. B21 (1980) 5494. Rouchy, J., du Tremolet de Lacheisserie, E., Genna, J.C.: J. Mag. Magn. Mater. 21 (1980) 69. Yamada. O., Ono, F., Arae, F., Arimune, H.: J. Mag. Magn. Mater. 15-18 (1980) 569. Brommer, P.E.. Franse, J.J.M., Geerken, B.M., Griessen, R., Holscher, H., Kragtwijk, J.A.M., Mydosh,
J.A., Nieuwenhuys, G.J.: Inst. Phys. Conf. Ser. 55 (1981) 253. Cheung, T.D., Kouvel, J.S., Garland, J.W.: Phys. Rev. B23 (1981) 1245. Hedman. L., Moyer, CA., Kelly, J.R., Arajs, S., Kote, G., Garbe, K.: J. Appl. Phys. 52 (1981) 1643. Ho, SC., Maartense, I., Williams, G.: J. Phys. Fll (1981) 699, 1107. Hayashi. K., Mori, N.: Solid State Commun. 38 (1981) 1057. Jesser. R., Bieber. A., Kuentzler, R.: J. Phys. Paris 42 (1981) 1157. Kadomatsu, H., Tokunaga. T., Fujiwara, H.: J. Phys. Sot. Jpn. 50 (1981) 3. Kuentzler, R.: Inst. Phys. Conf. Ser. 55 (1981) 397. Kadomatsu, H., Tokunaga, T., Fujiwara, H.: J. Phys. Sot. Jpn. 50 (1981) 1409. Papoular, R., Debray, D.: J. Mag. Magn. Mater. 24 (1981) 106. Sate, T., Miyako, Y.: J. Phys. Sot. Jpn. 51 (1981) 1394. Sumiyama, K., Emoto, Y., Shiga, M., Nakamura, Y.: J. Phys. Sot. Jpn. 50 (1981) 3296. Thomson, J.O., Thompson, J.R.: J. Phys. Fll (1981) 247. Tsiovkin. Yu.N., Kourov, N.I., Volkenshtein, N.V.: Sov. Phys. Solid State 23 (1981) 1534. Vinokurova. L.I.. Vlasov, A.V., Kulikov, N.I., Pardavi-Horvath, M.: Hungarian Acad. Sci. Budapest
1981. Williams. D.E.G., Ziebeck, K.R.A., Hukin, D.A., Kollmar, A.: J. Phys. Fll (1981) 1119. Watanabe, K.: Phys. Status Solidi (a) 40 (1981) 697. Amamou, A., Kuentzler, R.: Solid State Commun. 43 (1982) 423. Burmester, W.L.. Sellmyer, D.J.: J. Appl. Phys. 53 (1982) 2024. Burke, SK., Cywinski, R., Lindley, E.J., Rainford, B.D.: J. Phys. Sot. Jpn. 53 (1982) 8079. Ho, S.C., Maartense, I., Williams, G.: J. Appl. Phys. 53 (1982) 2235. Hiroyoshi, H., Hoshi, A., Nakagawa, Y.: J. Appl. Phys. 53 (1982) 2453. Jesser, R., Kuentzler, R.: J. Appl. Phys. 53 (1982) 2726. Lynn. J.W., Rhyne, J.J., Budnick, J.I.: J. Appl. Phys. 53 (1982) 1982. Oishi. K., Asai. A., Fujiwara, H.: J. Phys. Sot. Jpn. 51 (1982) 3504. Roeland, L.W., Wolfrat, J.C., Mak, D.K., Springford, M.: J. Phys. F 12 (1982) L267. Takahashi, Y., Jacobs, R.L.: J. Phys. F12 (1982) 517. Yamada. O., Ono. F., Nakai, I., Maruyama, H., Arae, F., Ohta, K.: Solid State Commun. 42 (1982) 473.
Franse, Gersdorf

References for 1.4.2 653
83Bl 83Cl 83Fl 8311 83Ml 8301 83Sl 83Tl 83T2 83Wl 83Yl
83Y2
83Y3
Burke, S.K., Rainford, B.D., Lindley, E.J., Maze, 0.: J. Mag. Magn. Mater. 31-34 (1983) 545. Campbell, S.J., Hicks, T.J., Wells, P.: J. Mag. Magn. Mater. 31-34 (1983) 625. Fujiwara, H., Kadomatsu, H., Tokunaga, T.: J. Mag. Magn. Mater. 31-34 (1983) 809. Ikeda, K., Gschneider, Jr., K.A., Schindler, A.I.: Phys. Rev. B28 (1983) 1457. Matsui, M., Adachi, K.: J. Mag. Magn. Mater. 31-34 (1983) 115. Ono, F., Maeta, H., Kittaka, T.: J. Mag. Magn. Mater. 31-34 (1983) 113. Sumiyama, K., Shiga, M., Nakamura, Y.: J. Mag. Magn. Mater. 31-34 (1983) 111. Tino, Y., Iguchi, Y.: J. Mag. Magn. Mater. 31-34 (1983) 117. Takahashi, Y., Jacobs, R.L.: J. Mag. Magn. Mater. 31-34 (1983) 49. Williams, D.E.G., Ziebeck, K.R.A., Jezierski, A.: J. Mag. Magn. Mater. 31-34 (1983) 611. Yamada, O., Ono, F., Nakai, I., Maruyama, H., Ohta, K., Suzuki, M.: J. Mag. Magn. Mater. 31-34
(1983) 105. Yamada, O., Maruyama, H., Pauthenet, R., in: High Field Magnetism (Date, M., ed.), Amsterdam:
North-Holland Publishing Company, 1983, p. 97. Yamada, 0.: Physica 119B (1983) 90.
Land&Bbmstein New Series IW19a
Franse, Gersdorf


](https://static.documents.pub/doc/80x56/5562ac71d8b42a7c4a8b51ad/presentation15-b15d5b15d1carolina-panthersgalea.jpg)


