40
Large-scale agent-based transport demand model for Singapore Alex Erath Pieter Fourie Michael van Eggermond Sergio Ordóñez Artem Chakirov Kay Axhausen Working paper June 2012

Large-scale agent-based transport demand modelfor Singapore
Alex ErathPieter FourieMichael van EggermondSergio OrdóñezArtem ChakirovKay Axhausen
Working paper
June 2012

Large-scale agent-based transport demand model for Singapore June 2012
1 Introduction
1.1 Context and Motivation
This century will, for the first time, see over half the world’s population living in cities UN (2007).Making these urban structures environmentally, economically and socially sustainable andliveable is one of today’s great challenges. Due to its central importance of cities’ infrastructureand performance, one key element to meet this challenge is transportation. Embedded in theSingapore National Research Foundation’s initiative Campus for Excellence and TechnologicalEnterprise CREATE, one project of the Future Cities Laboratory approaches the challenges ofurban transportation planning that stem from managing, planning and optimising the flow ofpeople and goods at different time scales and in its interaction with all elements of the futurecity. The basis of the research framework is a full implementation of the open-source multi-agent-based travel demand simulation MATSim 1 for the case of Singapore. The combination ofa variety of advanced transport demand policies such as time dependent road pricing, a multi-modal public transport system and the dynamic further development of transport infrastructuremakes Singapore arguably one of the most interesting places for an implementation of agentbased transport demand model.
Open-source MATSim is one of a group of agent-based models that have recently been developedto realise the potential of the activity-based approach into practise Bradley and Bowman (2006).In line with the activity-based approach (Jones et al., 1983), MATSim is based on the idea ofthe 24h daily activity schedule as the basic behavioural unit. In contrast to all other currentagent-based models, except TRANSIMS Beckmann et al. (2007), MATSim employs fullyintegrated traffic flow simulations for both private and public transport including dynamicroad pricing to calculate the generalised costs of travel implied by the schedule. In addition,MATSim is designed for speed and scale, which allows it to address large-scale and finelydetailed scenarios, for example, Switzerland which has 7.5 million agents, 1.0 million links and1.0 million destinations, and, to find a steady state solution with acceptable computing efforts(Balmer et al. (2010), Meister et al. (2009)), Toronto (Gao et al., 2010), Berlin (Rieser et al.,2008) or Tel-Aviv (Bekhor et al., 2011).
1.2 Objectives
This paper presents the development of a large-scale the agent-based transport model forSingapore using MATSim. Earlier papers on MATSim implementations have focused onsoftware architecture and simulation times (Balmer et al., 2010) and conversion of an existing
1See http://www.matsim.org
1
Large-scale agent-based transport demand model for Singapore June 2012
transport demand model to MATSim (Bekhor et al., 2011). In this paper, the design of thedemand modeling process including all necessary sub-models, its sequence and thoroughvalidation is central. Special attention is paid on the additional sub-models, which becamenecessary due to restricted availability of key data needed for agent-based transport demandmodeling.
2 General Framework
2.1 Activity based transport demand modeling
The general aim of multi-agent simulation is a to integrate activity-based demand generation withdynamic traffic assignment. Activity-based demand generation models generate a sequential listof activities and trips connecting these activities for every person in the study area. Demandgeneration is embedded in a concept of daily activity demand from which the need for transportis derived (Kitamura, 1988). A major advantage of activity-based demand modeling is that boththe spatial and temporal consistency of travel behavior can be ensured. For example, modechoice can be formulated on a subtour level, since the mode chosen for one trip may influence themode choice for other trips of a given subtour (Ciari et al., 2008). This is superior to traditionaldemand generation where aggregate traffic quantities represent isolated trips. Furthermore, notonly temporal dynamics, but also temporal interdependency of activities and trips are inherentlymodeled. For example, a delay of scheduled activities caused by increased travel time due tocongestion is propagated through the day and can either result in shortened or further postponedactivities.
Several approaches a wide variety of methods have been developed to generate daily activityplans. On the one hand, random utility theory is used to generate daily activity plans. Examplesare SACSIM for the Sacramento Area, California, and the comprehensive econometric mi-crosimulator for daily activity-travel patterns (CEMDAP) applied to the Dallas-Fort Worth Area(Bradley et al., 2010; Bhat et al., 2004). On the other hand, in a rule-based approach demandgeneration is based on psychological decision rules observed in travel diary or stated-adaptationsurveys. Examples include the travel activity scheduler for household agents (TASHA) for theGreater Toronto Area, and the learning-based simulation system ALBATROSS recently appliedto the Netherlands in the context of an air-quality study (Roorda et al., 2008; Beckx et al., 2009).
Most of the above approaches to generate a regional transport model have in common that onlythe first three steps of the traditional four-step model are performed on the basis of individualtravelers. For the traffic assignment step, the trips listed in the activity plans are independentlyaggregated to time-dependent (typically hourly) OD matrices which are fed into a dynamic traffic
2

Large-scale agent-based transport demand model for Singapore June 2012
assignment (DTA) (Watling, 1996). Examples of DTA implementations are a dynamic versionof VISUM (Vrtic and Axhausen, 2003), DynaMIT (Ben-Akiva et al., 2002) and Dynasmart(Mahmassani et al., 1992).
Conceptually, the iterative procedure of DTA can be extended to other dimensions of traveldecisions beyond route choice. Examples are “best-reply” models for departure time choice(de Palma and Marchal, 2002; Ettema et al., 2005) or optimal mode choice. Elements of demandgeneration are thus elevated from a simple pre-process to an integrated part of demand-supplyequilibration, as mode choice, departure time choice or even the activity sequence may besusceptible to changes in traffic patterns.
One major constraint of the DTA based approach is that information on individuals can not beretained once demand is aggregated to matrices to compute flows. By introducing multi-agenttransport simulation, this constraint is resolved and personal attributes such as sociodemographicproperties, the activity plan, and other internal variables can be accessed during the entiremodeling process. In such an approach, software objects representing travelers (“agents”) areretained not only in the demand generation stage, but also in the assignment step (Rieser et al.,2007).
By including more dimensions of travel behavior, the repeated realisation of an activity baseddemand generation process become computationally more expensive. To resolve this issue,learning is introduced in the feedback cycle: An agent can hold a set of activity plans in its“memory”, and chooses one of them for the traffic simulation (Raney and Nagel, 2006).
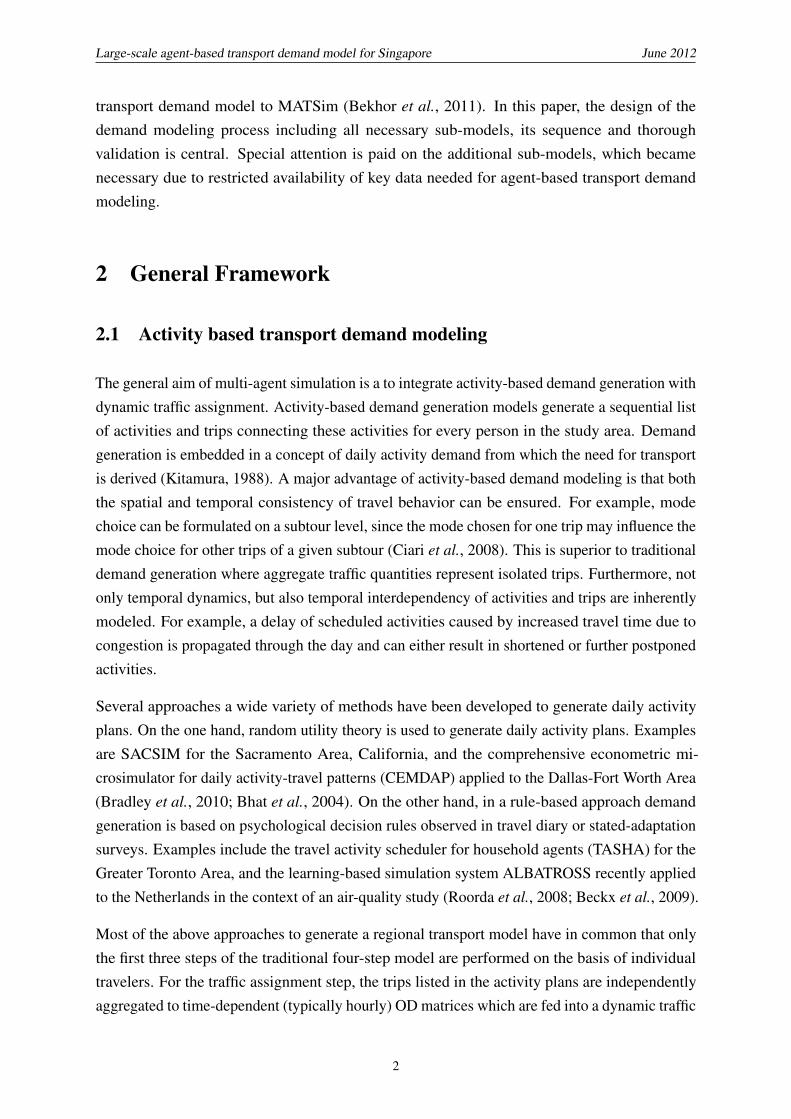
The open source MATSim (multi-agent transport simulation) is designed along those lines andallows the simulation of both private and public transport modes. The simulation structure ofthe underlying coevolutionary system is depicted in 1, and explained further in the followingsubsections. The initial demand generation results in daily activity plans which are composed offixed and flexible elements. Whereas the activity chains (number, type and sequence) as well asthe location of home, work and education activities remain unchanged during the whole process,start times and duration of activities, mode and route choice as well as activity locations forsecondary activities, i.e. shopping and leisure are optimised in the iterative learning processuntil a relaxed state is reached.
2.2 Generating initial activity plans
The approach presented in this paper combines a variety of concepts used in earlier implementa-tions of MATSim (e.g. Balmer et al. (2010), Balmer et al. (2009a) and applies it to the case ofSingapore. Given the data availability in Singapore, additional submodels became necessary toachieve the project’s goal of a full scale implementation of an agent-based transport demand
3

Large-scale agent-based transport demand model for Singapore June 2012
Figure 1: Structure of the MATSim-T simulation system
EvaluationIterative processInitial demand modeling
Supply data
Population
Demand
Facilities
Initial demand Execution Scoring
Replanning
Analysis
simulation featuring buildings as the base layer of spatial granularity.
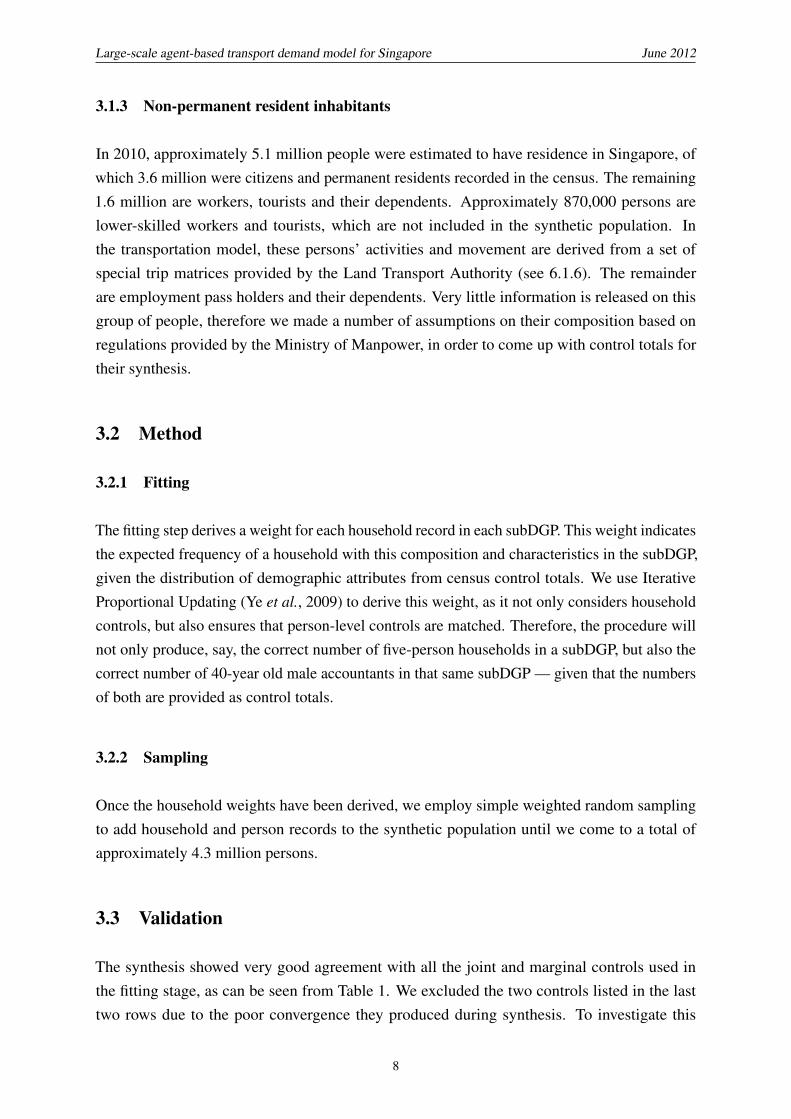
The demand modeling process is illustrated in Figure 2. It combines diverse data on land use,travel demand, demographics and transport supply in order to generate initial daily activityplans. The sequential process starts with a populations synthesis. For each person in thestudy area, a synthetic “agent” is generated. While single persons do not necessarily needto be represented by a corresponding agent with the same socio-demographic attribute, thegeneral statistical properties and correlation structure of the synthetic population should berepresentative for real population. Lacking a full census, for the case of Singapore an iterativeproportional fitting approach on a household level was employed (see Section 3). The agentpopulation is then spatially distributed taking into account the socio-demographic structure ofthe individual households based on a random sampling approach (see Section 4.2). To this end,a facilities data bases is established by combining information on building footprints, land useand diverse sources (see Section 4.1). Based on results of multinominal logit models that drawon information of the Household Interview Travel Survey (CITE), the synthetic population isenriched by availability of driving licenses on an agent’s level and car ownership on a householdlevel (see 4.2. Reported activity chains and preferred activity durations in the HouseholdInterview Travel Survey 2008 (Choi and Toh, 2010) are then assigned to individual agentsaccording to the enriched synthetic population information in a segmented random samplingapproach (see Section 6). In a next step, for each agent whose activity plans features work oreducation activities, fixed locations to perform such activities are assigned. The gravity modelbased approach combines information on distance between the home location and potential worklocations and the likelihood that a particular work location is suitable to the agent’s occupation.Secondary activity locations, i.e. shopping and leisure are again assigned in a random samplingapproach based on the prior activity location. Mode choice is attributed in a simple rule based
4

Large-scale agent-based transport demand model for Singapore June 2012
Figure 2: Structure of the MATSim-T simulation system
Out
put/
Inpu
t
M
odel
s
Inpu
t dat
a
Census
Home facilities
Work Facilities
Educ. Facilities
Other Facilities
Pop. synthesis
Pop. distribution
Driving license
Mode choice
EZ Link
Synthetic Pop.
Synthetic Pop. +1
Synthetic Pop. +2
Activity assign.
Primary location Initial Plans +1
Secondary location Initial Plans +2
Car ownership Synthetic Pop. +3
Initial Plans final.xml
HITS
M’plan/REALIS/St.Dir.
Activity duration
Initial Plan.xml
Initial Plans +3
Building footprints
Special Trips Special trips assign Special Plans.xml
Original input data
Generated data
Date type legend:
manner as this choice dimension is subject to the subsequent iterative learning process. Inaddition to the activity based demand, special plans are generated from origin destinationmatrices provided by the Singapore Land Transport Authority (LTA) to cover freight trips, tripsbetween Singapore and the neighboring state of Johor, Malaysia and Singapore and tourists trips.Those plans, however, are not subject of the iterative learning process but remained in terms ofstart time, mode and origin/destination unchanged.
2.3 The MATSim co-evolutionary learing process
Due to the imposed constraints, i.e. capacity of roads, public transport and capcity and openingtimes of facilities, the effective utility of a daily plan of one agent can only be determined by theinteraction with all other agents. In MATSim, a co-evolutionary learning loop (Holland, 1992;Palmer et al., 1994) consisting of the plan execution, scoring and replanning, is employed tofind an equilibrium state. Such a state is reached if the utility for each agent does not noticeablychange through variation of the day plans.
The general traffic simulation approach used in MATSim is based on queues (Waraich et al.,
5

Large-scale agent-based transport demand model for Singapore June 2012
2009; Charypar et al., 2007; Charypar, 2008). In this approach links are the active element,which move around cars. Each link contains a queue which stores the entry time of each car.Adjacent links collaborate with each other to assure that the different traffic parameters andelements are simulated correctly. For example link capacity, free speed travel time, intersectionprecedence and space available on the next link are parameters which are taken into accountby the simulation. In addition to the car simulation, MATSim features a detailed simulation ofschedule-based public transport Rieser (2010) which is integrated with the car simulation andhence covers interaction between public transport vehicles using public roads and cars.
Each plan is then scored according to the simulation’s outcome. The basic MATSim utilityfunction to score plans which is also used for the MATSim model presented in this work,was formulated in Charypar and Nagel (2005) from the Vickrey model for road congestion asdescribed in Vickrey (1969) and Arnott et al. (1993): a plan’s utility is computed as the sum ofall activity utilities plus the sum of all travel (dis)utilities.
In every subsequent iteration, a certain share of the agents is selected to clone the executed planand subsequently modify it using a replanning module. For the Singapore implementation, thefollowing replanning modules are included:
• Choice of activity start time and duration• Route choice• Mode choice• Location choice of secondary activity locations
If an agent has obtained a new plan, as described above, then that plan is selected for executionin the subsequent simulation. If the agent has not obtained a new plan, then the agent selects onefrom the existing plans. With increasing iterations, plans with a high utility survive, while planswith a low utility (e.g. caused by long travel times because of traffic jams) are eventually deleted.At the same time, marginal utility gains from changing activity plan diminish and gradually aequilibrium state is reached.
3 Population Synthesis
3.1 Sources
In absence of a full population census, the agent population is generated using iterative propor-tional updating (IPU) and weighted random sampling of household survey records. In lieu of apublic use micro data sample with matching marginal sums, data from a national travel diarysurvey (Household Interview Travel Survey, HITS (Choi and Toh, 2010)) which constitutes of a
6

Large-scale agent-based transport demand model for Singapore June 2012
1% sample of Singapore’s permanent population is combined with publicly available breakdownsof Singapore’s most recent census. Due to the inconsistency of the scope of the two data sources,the modular framework of the population synthesis is highlighted and thorough cross-validationwith independent data is performed.
3.1.1 Controls: Census 2010
Our controls were given at two levels of geographic resolution. These are the DevelopmentGuide Plan zones (DGP) used by the Urban Redevelopment Authority and their subdivisions(subDGP). Because the sample is sparse for certain areas, we conducted the synthesis on asubDGP-by-subDGP area. We grouped adjacent areas together where control numbers wererelatively small in order to minimise the number of iterations, to arrive at 30 DGP zones (fromthe original 36 in census) and 92 subDGP zones (down from 259).
On a household level, we used the following controls:
• household income x DGP• dwelling type x DGP• household size x DGP
On the person level, controls were as follows:
• age x ethnicity x sex• income x DGP• occupation x DGP• sex x subDGP• age x subDGP• ethnicity x DGP
3.1.2 Household Interview Travel Survey 2008
The HITS contains records for approximately 11,000 households in Singapore. The record is forthe entire household, including resident domestic workers. All the variable mentioned abovewere recorded for each household and every person in the household. We stripped the householdrecords of domestic workers to come up with a reference sample, as the control totals fromcensus is for the resident population only.
7
Large-scale agent-based transport demand model for Singapore June 2012
3.1.3 Non-permanent resident inhabitants
In 2010, approximately 5.1 million people were estimated to have residence in Singapore, ofwhich 3.6 million were citizens and permanent residents recorded in the census. The remaining1.6 million are workers, tourists and their dependents. Approximately 870,000 persons arelower-skilled workers and tourists, which are not included in the synthetic population. Inthe transportation model, these persons’ activities and movement are derived from a set ofspecial trip matrices provided by the Land Transport Authority (see 6.1.6). The remainderare employment pass holders and their dependents. Very little information is released on thisgroup of people, therefore we made a number of assumptions on their composition based onregulations provided by the Ministry of Manpower, in order to come up with control totals fortheir synthesis.
3.2 Method
3.2.1 Fitting
The fitting step derives a weight for each household record in each subDGP. This weight indicatesthe expected frequency of a household with this composition and characteristics in the subDGP,given the distribution of demographic attributes from census control totals. We use IterativeProportional Updating (Ye et al., 2009) to derive this weight, as it not only considers householdcontrols, but also ensures that person-level controls are matched. Therefore, the procedure willnot only produce, say, the correct number of five-person households in a subDGP, but also thecorrect number of 40-year old male accountants in that same subDGP — given that the numbersof both are provided as control totals.
3.2.2 Sampling
Once the household weights have been derived, we employ simple weighted random samplingto add household and person records to the synthetic population until we come to a total ofapproximately 4.3 million persons.
3.3 Validation
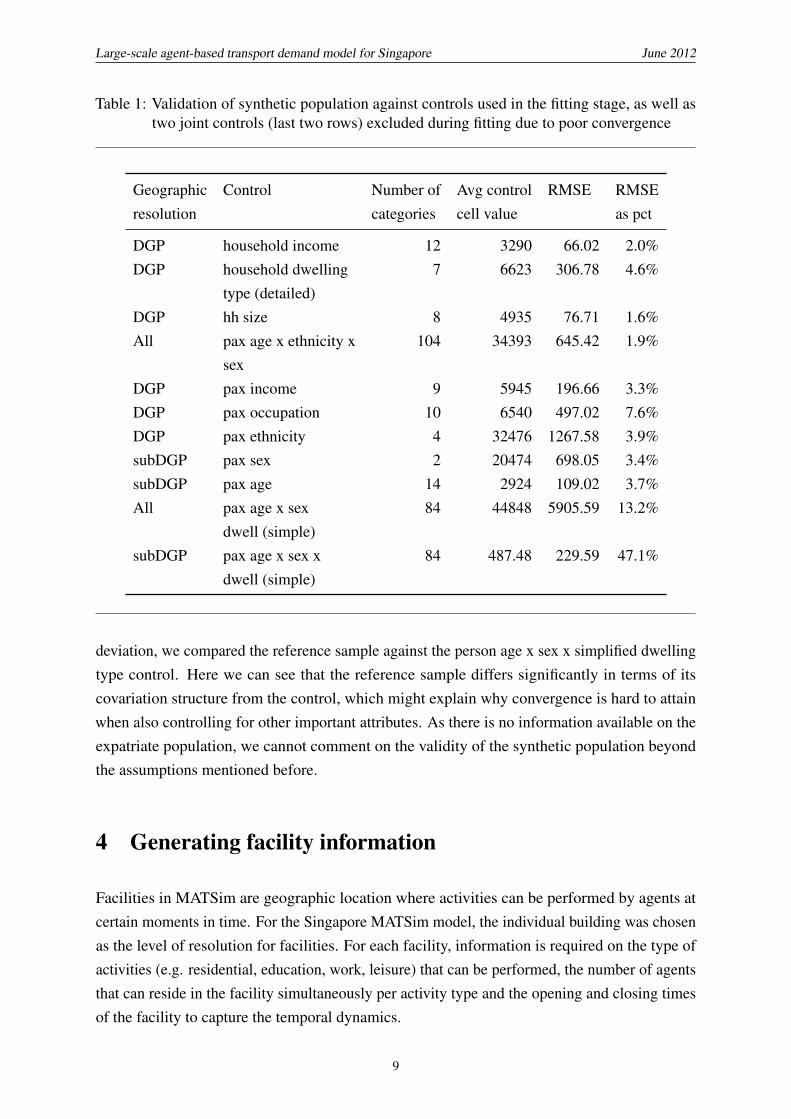
The synthesis showed very good agreement with all the joint and marginal controls used inthe fitting stage, as can be seen from Table 1. We excluded the two controls listed in the lasttwo rows due to the poor convergence they produced during synthesis. To investigate this
8
Large-scale agent-based transport demand model for Singapore June 2012
Table 1: Validation of synthetic population against controls used in the fitting stage, as well astwo joint controls (last two rows) excluded during fitting due to poor convergence
Geographic Control Number of Avg control RMSE RMSEresolution categories cell value as pct
DGP household income 12 3290 66.02 2.0%DGP household dwelling 7 6623 306.78 4.6%
type (detailed)DGP hh size 8 4935 76.71 1.6%All pax age x ethnicity x 104 34393 645.42 1.9%
sexDGP pax income 9 5945 196.66 3.3%DGP pax occupation 10 6540 497.02 7.6%DGP pax ethnicity 4 32476 1267.58 3.9%subDGP pax sex 2 20474 698.05 3.4%subDGP pax age 14 2924 109.02 3.7%All pax age x sex 84 44848 5905.59 13.2%
dwell (simple)subDGP pax age x sex x 84 487.48 229.59 47.1%
dwell (simple)
deviation, we compared the reference sample against the person age x sex x simplified dwellingtype control. Here we can see that the reference sample differs significantly in terms of itscovariation structure from the control, which might explain why convergence is hard to attainwhen also controlling for other important attributes. As there is no information available on theexpatriate population, we cannot comment on the validity of the synthetic population beyondthe assumptions mentioned before.
4 Generating facility information
Facilities in MATSim are geographic location where activities can be performed by agents atcertain moments in time. For the Singapore MATSim model, the individual building was chosenas the level of resolution for facilities. For each facility, information is required on the type ofactivities (e.g. residential, education, work, leisure) that can be performed, the number of agentsthat can reside in the facility simultaneously per activity type and the opening and closing timesof the facility to capture the temporal dynamics.
9

Large-scale agent-based transport demand model for Singapore June 2012
0 200 400 600 800 1000 1200Number of HITS person records0K20K40K60K80K100K120K140K160K
Control total
Sheet 11
dwellhdbprivateother
dwellhdbprivateother
Sum of Number of HITS person records (synthsample) vs. sum of Control total. Color shows de-tails about dwell. Shape shows details about dwell. Details are shown for sex and age.Figure 3: Comparison of relative frequencies of HITS person records vs census control numberswhen broken down by simplified dwelling type, age and sex.
This Section discusses the data sources used for facility and activity location generation and inwhich way this supply is matched to the demand for activity locations.
4.1 Sources
Land use planning Land-use is given by the URA Masterplan 2008. On one hand, theMasterplan provides land-use information on the type of land-use. On other, a gross-plot ratiois provided per plot. The plot ratio of a site is defined as the ratio of the gross floor area of abuilding(s) to its site area. In the Masterplan a distinction is made between over 20 land-usetypes, varying from residential to agriculture. For each land-use type, the distribution of attractedoccupation types is analysed based on the georeferenced work activities recored in HITS. This
10

Large-scale agent-based transport demand model for Singapore June 2012
distribution is then taken into account when assigning work activities based on the gravity model.
Online resources In addition to the URA Masterplan 2008, several governmental and com-mercial websites have been consulted for information on land-use and activity locations. Asummary can be found in Table 2.
Building footprints Building footprints are available from a navigation network (NAVTEQ,2011). These building footprints are reverse geocoded with address information based on thebuilding centroids. This makes it possible to assign information from the online resources tobuilding footprints. This makes it possible to compare the points of interest obtained online withthe number of building footprints.
Table 2: Data sources available
Facilities Source Number
Residential Public HDB (2011); AllProperty(2011)
10,041
Condominiums URA (2011); AllProperty(2011)
3,008
Landed URA landed housing plan 59,619Work URA MasterplanEducation Ministry of Education
(2011), websites of interna-tional schools
Secondary activities Streetdirectory (2011), Giant(2011), NTUC (2011)
14,965
4.1.1 Facilities
Residential facilities For public housing (HDB for Housing Development Board), the numberof units per type is available for the majority of the flats. To a large extent the number of unitsin the private flats (condominiums) can be found online as well. The number and type of unitsserves as a basis for the assignment of households to residential units.
Work facilities Initially, work locations were based on points of interest in the categoriescommercial and industrial. In addition, work locations are also added to education and residentialfacilities. With the release of the URA Masterplan (URA, 2008), work facilities are generated
11
Large-scale agent-based transport demand model for Singapore June 2012
based on the designation of a parcel and the gross plot ration indication given by the Masterplan.However, in absence of a census of entreprises, apart from the gross floor space for each workfacility, no information on the number of work location was available.
Education facilities Locations of primary, secondary and tertiary education is collected fromthe Ministry of Education. Additionally information on private schools has been gathered. Forprivate schools as well as for higher education, such as colleges and universities, the number ofstudents could be found. This is however not the case for primary and schools. Here the numberof students is based on the average number of pupils in Singapore per school type, multiplied bythe standard deviation multiplied by random number.
Secondary activity facilities Secondary facilities comprise of a broad set of point of interestbased on the activity locations as reported in the Household Interview Travel Survey (HITS)2008. Points of interests for secondary activity location include supermarkets, malls, markets,food centres, restaurants, sports facilities and parks. Also, a number of residential units isselected as secondary activity location, as a significant part of the sample in HITS reportedvisits to friends and family. For the moment, generic capacities have been assigned to differenttypes of secondary activity facilities. However, the data framework principally allows specifyinga dedicated capacity for every single facility, which could be the result of a shopping mall survey.
4.2 Data integration
4.2.1 Population distribution
The population synthesis described in Section 3 results in a number of households per planningzone per dwelling type. In order to assign the population to residential facilities the followingprocedure is followed:
• Number of residential units per type (7 types) are summed per planning zone (92).• Per residential facility a probability is computed by dividing the sum of the units of type i
of a facility by the total number of units of type i in zone q.• For each household residing in type i a residential unit of type i is drawn from the facilities
in zone q.
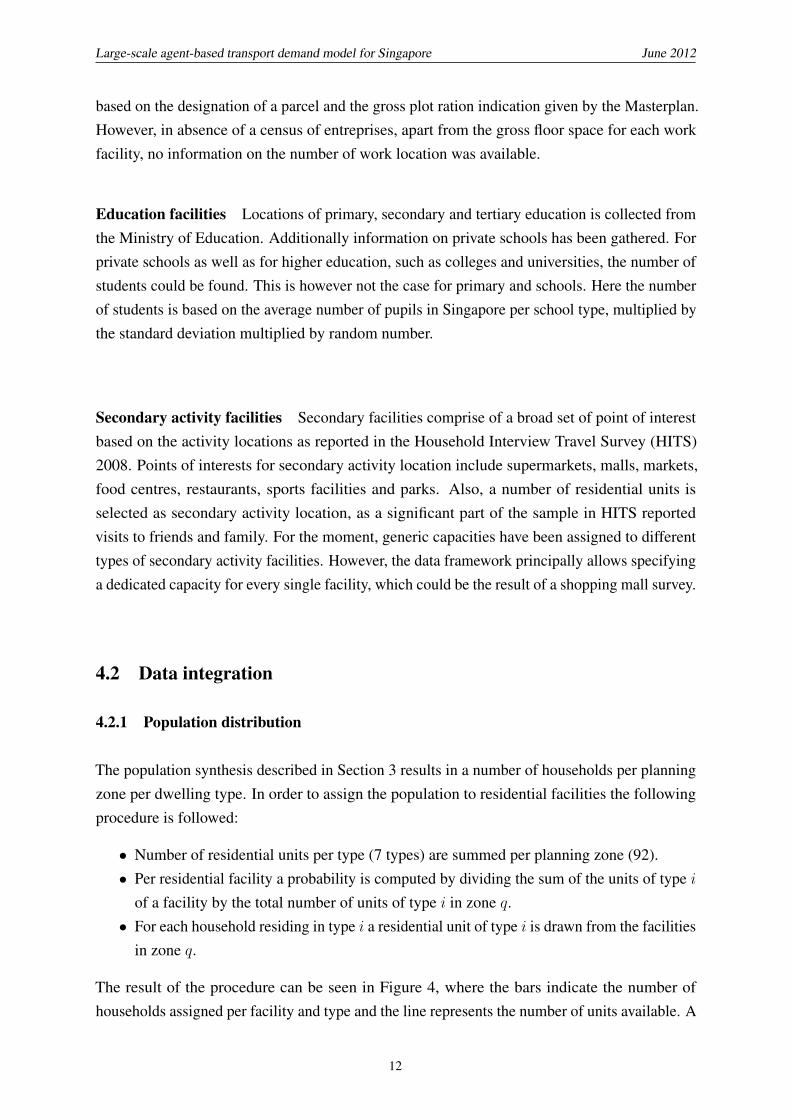
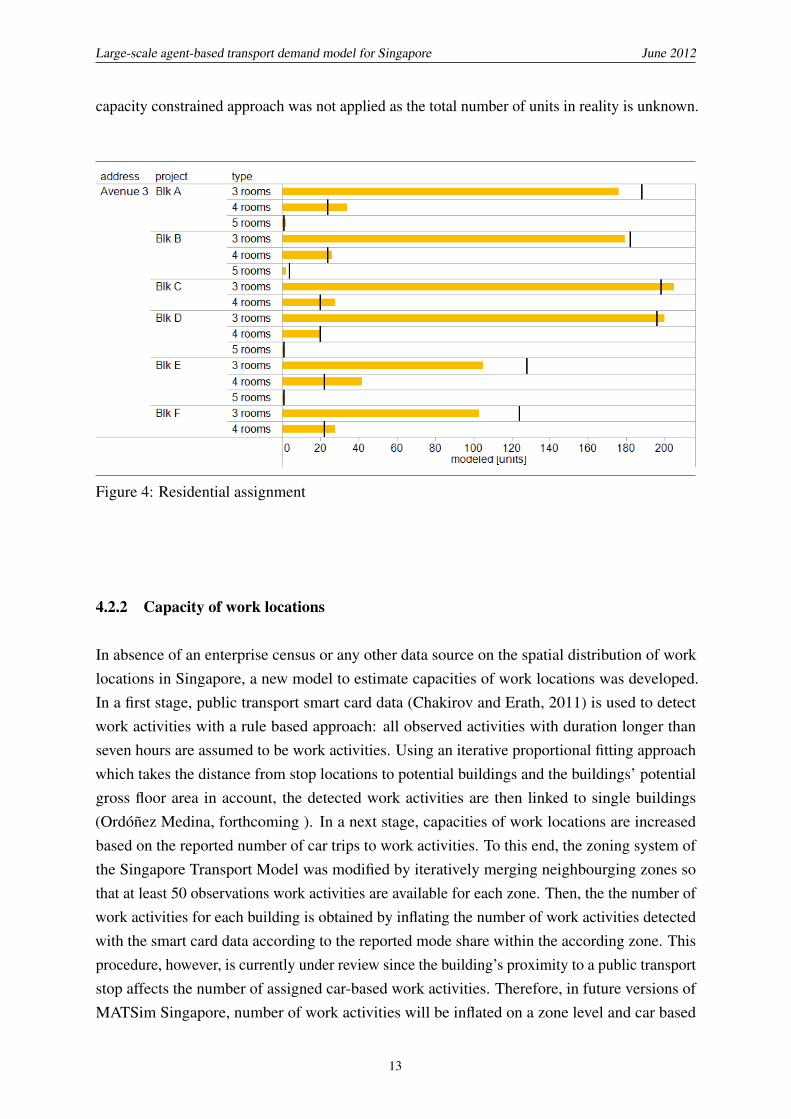
The result of the procedure can be seen in Figure 4, where the bars indicate the number ofhouseholds assigned per facility and type and the line represents the number of units available. A
12
Large-scale agent-based transport demand model for Singapore June 2012
capacity constrained approach was not applied as the total number of units in reality is unknown.
Figure 4: Residential assignment
4.2.2 Capacity of work locations
In absence of an enterprise census or any other data source on the spatial distribution of worklocations in Singapore, a new model to estimate capacities of work locations was developed.In a first stage, public transport smart card data (Chakirov and Erath, 2011) is used to detectwork activities with a rule based approach: all observed activities with duration longer thanseven hours are assumed to be work activities. Using an iterative proportional fitting approachwhich takes the distance from stop locations to potential buildings and the buildings’ potentialgross floor area in account, the detected work activities are then linked to single buildings(Ordóñez Medina, forthcoming ). In a next stage, capacities of work locations are increasedbased on the reported number of car trips to work activities. To this end, the zoning system ofthe Singapore Transport Model was modified by iteratively merging neighbourging zones sothat at least 50 observations work activities are available for each zone. Then, the the number ofwork activities for each building is obtained by inflating the number of work activities detectedwith the smart card data according to the reported mode share within the according zone. Thisprocedure, however, is currently under review since the building’s proximity to a public transportstop affects the number of assigned car-based work activities. Therefore, in future versions ofMATSim Singapore, number of work activities will be inflated on a zone level and car based
13

Large-scale agent-based transport demand model for Singapore June 2012
work activities are then distributed to individual buildings using the buildings’ gross floor areaas a weighting factor.
In addition, the model to detect work activities has been improved. Instead of the rule basedapproach, (Chakirov and Erath, 2012) propose a Logit model taking into account informationon start time, activity duration and density of different land use types around stop locations.This new model perform better in this regard and will be applied in future versions of MATSimSingapore.
It is planned to validate the work location model with data provided by Singapore’s UrbanRedevelopment Authority. URA’s work location information is based the effective gross floorarea of buildings and assumptions on the average space required for each work place dependingthe designated usage of the work facility. However, when this paper was submitted, thisinformation was not yet available.
5 Modeling of car license holdership and car availability
5.1 Approach
Persons generated by the synthetic population do not include a driving license; households donot own a car. In order to add these variables, logit models have been developed to add both adriving license and a vehicle to each person and household of the population.Two main model approaches based on a discrete choice framework can be found in literature:random utility models and Ordered Logit models. Whereas in the first modeling approach itassumed that vehicle ownership is a random variable, the latter modeling approach assumesthat households have a higher utility of owning a vehicle versus not owning a vehicle or drivinglicense (Bhat and Pulugurta, 1998; Potoglou and Susilo, 2008). Based on initial model resultsand literature, Multinomial Logit (MNL) models were estimated.Furthermore, it is possible to estimate the probability of the number of licenses and vehicleswith separate models, or to estimate these models simultaneously by applying a nested structure,the advantage of the latter being overcoming the correlation between number of driving licensesand number of vehicles within a household. However, we opted to estimate separate models forthe following reasons: modularity within the initial demand process, easier to validate marketshares and the possibility to ’age’ the population in a later stage.Vehicle ownership and household information are given by the Household Interview TravelSurvey (HITS) 2008 Choi and Toh (2010). For this survey 1% of the population is questioned ontheir travel behavior on a single workday in person. The survey contains 36,978 individuals in10,641 households. The survey is conducted once every four years and is commissioned by the
14

Large-scale agent-based transport demand model for Singapore June 2012
Singaporean Land Transport Authority (LTA). HITS contains data on three levels of aggregation.The highest level of aggregation contains household characteristics such as dwelling type, postalcode and quantity and type of vehicle available. Second, person characteristics are available suchas age, income, profession and employment type. On the lowest level of aggregation informationon trips is available such as mode, purpose, cost and time. In 1,533 of the households one ormembers refused to disclose their monthly income. In total 8,846 cases remain for estimationafter controlling for availability of a driving license; several households do have a vehicleavailable but not a driving license.
5.2 Models
5.2.1 License ownership model
Our final model for driving license ownership on a person level includes variables for dwellingtype, income, number of members in household, a dummy variable indicating if a person isemployed and a dummy variable indicating if the person is retired. Similar to Ciari et al. (2007)several variables representing the utility of having a driving license at a certain age per genderwere included. Table 3 shows the parameter estimates of the driving license model. Whereas
Table 3: Parameter estimates driving license model
No driver license Driver license*
Constant -26.6 (-29.91)HDB small -0.57 (-11.23)HDB medium (ref) -HDB large 0.486 (11.63)Condominium 1.27 (17.85)Landed property 1.82 (23.15)#members household 0.032 (2.47)Age -0.246 (-30.06)Age * Male 0.037 (39.56)Ln (age) 9.65 (29.26)Income k -0.103 (-17.13)
Number of observations 36,492Init log-likelihood -18533.679Final log-likelihood -13021.053Adjusted rho square 0.29
* License available to persons over 17 and non-domestic workers
males have the highest utility of a driving license around 45, females have the highest utility
15

Large-scale agent-based transport demand model for Singapore June 2012
around the age of 35. After this age, utility declines. It is hypothesized, that is due to thetransition of Singapore from a developing country to a highly developed country in a short timespan. Based on a rho-squared of 0.29, model performance is high.
Figure 5: Age vs utility driving license
5.2.2 Car ownership model
The model currently applied in the initial demand process of MATSim Singapore is a MNLmodel. It contains 18 variables regarding dwelling type, monthly household income, numberof children, number of adults, number of driving licenses. To capture the spatial structure ofSingapore, a series of parameters indicating the postal sector of the household were estimated.Two alternatives were considered: not owning a vehicle and owning a vehicle. Other modes oftransport, such as taxis, light gooded vehicles and motorcycles were omitted because of theirsmall market shares. Judging by the adjusting rho-square of 0.31, model performance is good.Households residing in landed property have the highest utility of owning a car, as do householdswith a high income. On one hand, this reflects that households residing in landed property needto travel farther to reach amenities like schools, supermarkets and sport facilities. On the otherhand, the relative high importance of income reflects the high costs of vehicle ownership andusage in Singapore. The number of children within a household increases the probability of
16

Large-scale agent-based transport demand model for Singapore June 2012
owning a vehicle.
5.3 Validation and application
Both the driving license model and car ownership model have been validated by both examiningthe market shares observed in HITS. In addition, the results of the car ownership model arecompared with the car registry on an aggregated level and presented in Table 4. With the currentmodel, the market shares still deviate from the sample population. This first model has recentlybeen improved by including spatial variables (van Eggermond et al., 2012). This new modelperform better in this regard and will be applied in future versions of MATSim Singapore.
Figure 6 shows a comparison of the car ownership model applied to synthetic population
Table 4: Market shares of driver license and vehicle ownership model
Actual sample Simulated Simulated modelwith spatial vari-ables
No driver license 71.1 71.3Driver license 28.9 28.7
No car 58.5 52.6 57.4Car 41.5 47.3 42.6
described in Section 3. Results of the car assignment have been aggregated to the zonal usedby the Singaporean Land Transport Authority. Although there is some variation in differencebetween modeled and observed varies, no systematic spatial distortion is visible. One reason offor such a pattern might be that some cars are registered for companies and hence georeferencedat the company’s location but used by individuals. 
6 Generating Activity Plans
6.1 Activity Plans
6.1.1 Travel decision
In the HITS, approximately one third of eligible persons did not make a motorised trip on thesurvey date. This population is generally classifiable by income, age, household car availabilityand car license. In order to assign a travel decision to our synthetic population, we firstly classify
17

Large-scale agent-based transport demand model for Singapore June 2012
Figure 6: Car ownership: modeled vs car registration, positive value indicates more cars regis-tered than modeled
the HITS person records based on modes of travel used during the course of a day. As wecurrently model only public transport and car traffic, we add exclusive users of other transportmodes to the list of non-travelers. We then produce joint distributions of age x income x caravailability x car driver licensure versus a joint travel decision / initial mode choice outcomevariable. The variable has four possible values: 1) no travel; 2) exclusive car travel as driver;3) exclusive public transport travel; and 4) a mixture of car driver and public transport travel.Based on the frequency of these values for each combination of predictors, we assign the traveldecision and initial mode choice for each member of our synthetic population, using weightedrandom sampling.
6.1.2 Activity chain assignment
Activity chains are assigned based on their observed frequency in HITS. We identify the 22 topactivity chain frequencies in the survey, and derive their joint distributions by sex, occupation,age and household car availability. Then we assign an activity chain to each member of thesynthetic population using stratified weighted random sampling. As our synthetic populationincludes foreign workers, the relative proportion of worker chains is higher than in HITS. Also,we have a smaller number of chains involving educational activities, as a lot of scholars get
18
Large-scale agent-based transport demand model for Singapore June 2012
dropped off at school, or take the school bus; both modes of transport that we don’t simulate.
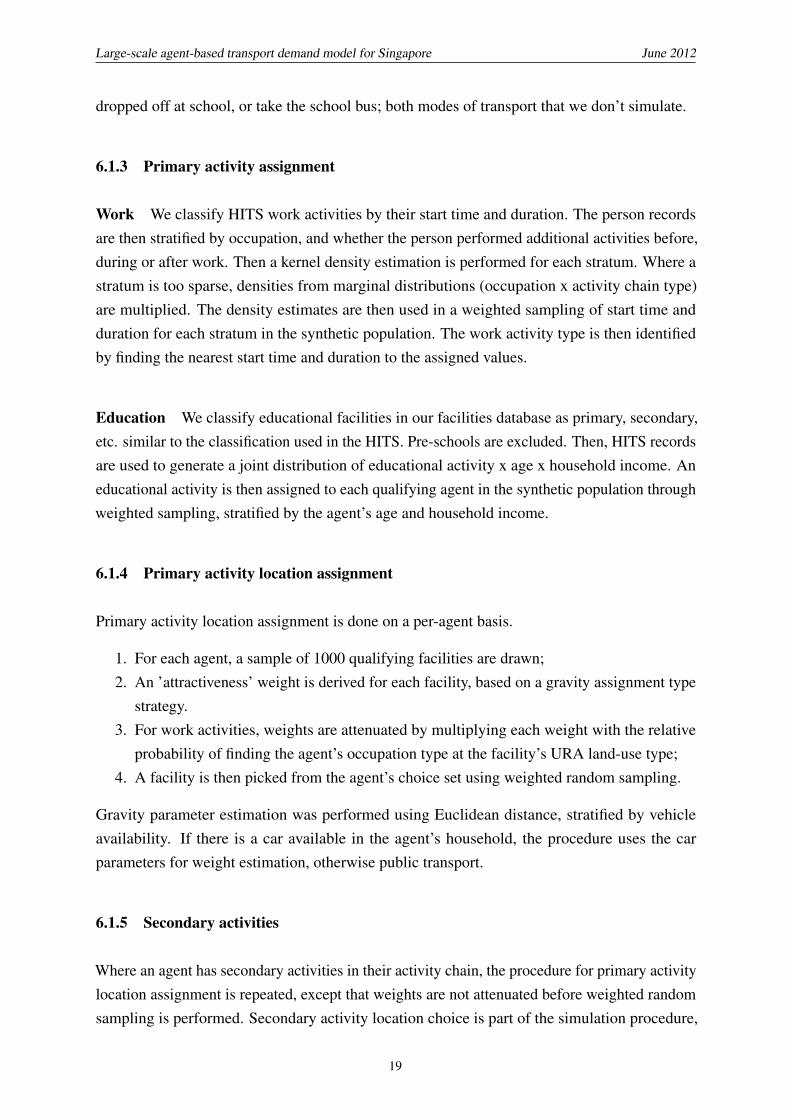
6.1.3 Primary activity assignment
Work We classify HITS work activities by their start time and duration. The person recordsare then stratified by occupation, and whether the person performed additional activities before,during or after work. Then a kernel density estimation is performed for each stratum. Where astratum is too sparse, densities from marginal distributions (occupation x activity chain type)are multiplied. The density estimates are then used in a weighted sampling of start time andduration for each stratum in the synthetic population. The work activity type is then identifiedby finding the nearest start time and duration to the assigned values.
Education We classify educational facilities in our facilities database as primary, secondary,etc. similar to the classification used in the HITS. Pre-schools are excluded. Then, HITS recordsare used to generate a joint distribution of educational activity x age x household income. Aneducational activity is then assigned to each qualifying agent in the synthetic population throughweighted sampling, stratified by the agent’s age and household income.
6.1.4 Primary activity location assignment
Primary activity location assignment is done on a per-agent basis.
1. For each agent, a sample of 1000 qualifying facilities are drawn;2. An ’attractiveness’ weight is derived for each facility, based on a gravity assignment type
strategy.3. For work activities, weights are attenuated by multiplying each weight with the relative
probability of finding the agent’s occupation type at the facility’s URA land-use type;4. A facility is then picked from the agent’s choice set using weighted random sampling.
Gravity parameter estimation was performed using Euclidean distance, stratified by vehicleavailability. If there is a car available in the agent’s household, the procedure uses the carparameters for weight estimation, otherwise public transport.
6.1.5 Secondary activities
Where an agent has secondary activities in their activity chain, the procedure for primary activitylocation assignment is repeated, except that weights are not attenuated before weighted randomsampling is performed. Secondary activity location choice is part of the simulation procedure,
19
Large-scale agent-based transport demand model for Singapore June 2012
therefore the initial assignment is of little consequence and is likely to change during the courseof the simulation.
6.1.6 Additional activity plans for freight, cross border and tourist travel demand
Additional activity plans for freight, cross border and tourist travel demand are generated fromorigin destination matrices provided by the Singapore Land Transport Authority (LTA). Thosetrips cover freight traffic, traffic between Singapore and the neighboring state of Johor, Malaysiaand Singapore and tourist trips.
In order to fit the agent based nature of the mobility simulation, the provided matrices needto be converted into single trips. Since the trip matrices have been generated for a zone-basedtransport demand model the following discretisation process is applied. Firstly, the floatingnumbers indicating of the origin demand matrices are transformed to integers using randomrounding. Secondly, within each zone trips are assigned to facilities a using a weighted randomsampling approach, using potential floor surfaces representing the weights. Thirdly, trip starttimes are generated according to different indications of temporal dynamics: for car trips toand from Johor and freight trips, correspondingly categorized road detector data is availableaggregated to 30 min time bins. After spatial aggregation of all count locations, the total numberof trips is distributed proportionally to the counts figures within each time bin. To generate tripstart times to the split second, uniform distribution is assumed within each time bin. Tourist tripsare temporally distributed in a similar way, but observations of visitor dynamics of major touristattractions are taken into account instead of loop detector data.
Since the plans representing special are not representing activity based daily plans, in theiterative learning process only the rerouting module is employed, whereas start time, mode andorigin/destination remain unchanged throughout the process.
6.2 Validation
As the home-work-home activity chain is prevalent in Singapore, making for half of the activitychains in HITS, a validation of work location assignment is important to our model. Figure 7compares work location assignments with the number of work-bound attractions in HITS byDGP. Our procedure produces more placements away from the city centre, especially in thenorth and the west. As a consequence, our commuting population tends to travel further thanwhat was reported in the survey. In the following section, we discuss a number of changes tothe work location assignment process that should produce a better match with the survey, bothwith respect to aggregate volumes of jobs assigned to each DGP, and the resulting trip distancedistribution.
20

Large-scale agent-based transport demand model for Singapore June 2012
Legend0.027006% - 2%2.000001% - 4%4.000001% - 6%6.000001% - 8%8.000001% - 11.237703%
Agent work locations HITS work-bound attractions
Figure 7: Comparison of agent work location assignment vs. HITS work-bound attractions.
6.3 Outlook
Based on the validation, a number of possible improvements to our initial demand generationprocess have been identified.
Alternative scheduling using machine learning approach Currently, scheduling is simplydone through sampling of the most prevalent schedules given an agent’s demographic attributes.No intra-household coordination takes place with regard to maintenance and joint trips andactivities, and agent schedules don’t display the full gamut of possible activity combinationsseen in the survey. An improved scheduling process, possibly incorporating machine-learningapproaches such as those put forward by Charypar and Nagel (2006) and Arentze and Timmer-mans (2009) will be investigated, along with further work on the intra-household schedulingprocess to model the large share of joint trip-making observed in Singapore.
Work location assignment Currently our gravity model estimation is stratified only by ve-hicle availability. It has been proposed that further stratification by occupation type would beappropriate. A process whereby an agent is first assigned a work DGP before being assigned awork facility, should produce a better match between our assignment and the expected distribu-tion of workers to centres of activity across the island. Such an assignment approach shouldat least produce comparable flows at the aggregate level, and thus ensure a better match of tripdistances to those recorded in HITS.
Facility capacity is an important component of the work location assignment process, withhigher capacity facilities attracting more jobs. The process of deriving facility capacities fromEZLink data and mode-shares by transportation zone could be further improved. Currently,facility capacities close to public transport stops are inflated more than those further away. In a
21

Large-scale agent-based transport demand model for Singapore June 2012
sense then, this model favours public transport accessibility in assigning capacities. The methodwill be adjusted to take account of car accessibility, so that facilities further away from transitstops, but with good accessibility by car, will have their capacities commensurately increased.
Motorized travel decision The reason for not making a motorized trip recorded in HITS aremanifold; some people are retired or unemployed or infirm, and don’t need to travel. Otherswalk or cycle to work, implying that they live close enough to work for those travel options tobe viable. Others work from home. Once our scheduling and work location assignment methodshave been improved, the distance to work, demands of the activity schedule, and the agent’spersonal means and wants all figure into whether they make use of motorized transport or not.As a result, cycling and walking should be included as mode choices in our model, and formpart of the simulation process.
7 Transport supply
7.1 Sources
7.1.1 Transport networks
To match the spatial granularity of the activity demand model, a high resolution transportnetwork model is required. For the Singapore implementation, a high resolution networkprovided by Navteq featuring directed links is used. Being primarily designed as a networkfor route guidance, some adjustment was required to make the network suitable for transportdemand modeling. First, the original network frequently features several links to representstreet shapes. Since very short links are not ideal for queue-based microsimulation because theproblematic representation of such links in terms of storage capacity, a transformation routinewas applied to simplify the network by merging such row of links together while saving originaldistances. Second, information about number of lanes, capacity and free speed is included withlimited accuracy. Therefore, a methodology for matching two networks was developed to enrichthe Navteq network with information from the existing transport planning network. Thirdly, theoriginal Navteq network does not include any public transport information. In order to obtaina multi-model network, a rail network was added by creating one link between each pair ofconsecutive MRT and LRT stations. The resulting network contains 43’118 nodes and 79’835links.
For planning purposes, LTA uses a simplified road network model. As conventional transportdemand models are designed to compute flows between zones, such simplified network match
22
Large-scale agent-based transport demand model for Singapore June 2012
feature sufficient resolution. However, the network used in the Singapore model is quiteextensive and features 12’420 nodes and 26’972 links. Given its main purpose and gradualdevelopment, this model provides accurate information on capacity, free speed and number oflanes for principal and secondary streets.
7.1.2 Public transport schedule
In MATSim, the base layer of public transport systems representation is a set of stop facilitiesand a set of public transport lines. For each line, one can define several routes and each routefeatures a sequence of stops, a path or sequence of links, and a set of departures or services.Each service has a vehicle of a specific type assigned. For each vehicle, characteristics such astype, capacity, size, door system and type of motorisation can be incorporated.
For Singapore the public transport systems information was provided in the General TransitFeed Specification (GTFS) created by Google. Each service of a certain line is defined witha sequence of stops and expected stop times. In addition, the Singapore GTFS informationincludes GPS traces to indicate the route of bus services between two subsequent stops.
7.2 Supply modeling
7.2.1 Combining planning and high resolution network
To enrich the Navteq network with information from the transport planning network, a semi-automatic map-to-map matching process is applied. In a first stage, an automatic process alongthe lines proposed by (Balmer et al., 2005) matches intersections between both networks. Sincenot all nodes necessarily represent intersections, an algorithm that qualified nodes accordingto topological characteristics is applied: the result are matching groups of nodes that representone intersection both in the planning and in the high resolution network. In a second stage, theresults of the automatic processes are reviewed using an interactive graphic tool. Visualisingboth network next to each other in split screen mode, it allows a user to navigate and zoom bothnetworks at the same time. The user can also match intersections selecting groups of nodes ofboth networks, and modify or remove existing matches. Supposing that all the intersectionsrepresented in the planning network are matched with the high resolution network, in a thirdstage, another automatic process is executed. It matches paths (sequence of consecutive links)between adjacent intersections taking into account distances and link directions. This is againfollowed by a manual process using a modified version of interactive tool. Again, both networksare in split screen, but this time, links are highlighted. To detect unmatched paths or errorsin the automatic process, link free speed is indicated by different colors and link capacity by
23

Large-scale agent-based transport demand model for Singapore June 2012
line thickness. By selecting paths from both networks, one can modify or remove matchings.After matching all paths between intersections, capacities, free speeds and number of lanes ,information form the planning network is then automatically assigned to the high resolutionnetwork. Finally, corrections on the enriched high resolution network are manually edited byvisual inspection using the tool’s single screen option. Video demonstrations of the tools areaccessible at (Ordóñez Medina, 2011d,c).
7.2.2 Electronic road pricing
The MATSim framework provides the functionality to simulate various types of road pricingscheme, including dynamic cordon tolls like Singapore’s Electronic Road Pricing (ERP) schemewhich feature time and vehicle dependent road toll. Based on two data sets indicating thelocation and time dependent toll levels, the links corresponding to the 69 gantries were manuallyidentified and specified with the prevailing tolls.
7.2.3 Traffic lights
Without specific information on traffic lights, at intersection where spillback occurs, the queuebased traffic simulation in MATSim priorises approaches probabilistically but does not specifi-cally cover green time fractions (Cetin, 2005). Using the approach proposed by (Grether et al.,2012), a link leading to an intersection is dissolved to several links to represent the layout ofturning lanes. Green time fractions can then be attributed to each newly generated link accordingto prespecified signal plans. Whereas the location of signal controlled intersection was available,time dependent signal plans remained inaccessible with reasonable effort due to the proprietaryformat of the signal control software. Thus, so far traffic lights are not specifically included inthe presented MATSim Singapore implementation.
7.2.4 Map matching public transport routes
To facilitate interaction between buses and cars in the simulation model, scheduled bus servicesavailable in the GTFS format need to be map matched to the navigation network. To this end, asemi-automatic map matching procedure was developed (Ordóñez Medina and Erath, 2011). Ina first stage, the following automated steps are processed. Locations of bus stops are matchedto a set of potential links according to the perpendicular distance between the stop coordinateand the candidate link. Then the shortest path between each pair of candidates is calculatedfinally. To include also the information provided by the GPS traces, the shortest path algorithmtakes the distance between tracing points and links into account by modifying the travel cost ofeach link. By selecting the shortest path between the two stops, the stop to link relationships are
24

Large-scale agent-based transport demand model for Singapore June 2012
determined. In a second stage, an interactive tool displays the results of the first stage and offerstools to modify the path and the stop-link relationships. The original network is displayed andfull navigation tools are provided as well. If according to the visual representation the relationbetween bus stop and link needs to be adjusted, this has implications to all bus lines serving thegiven bus stop. Since only unique relations between bus stops and links are allowed, all routesleading over a stop whose link relation is modified are erased and have to be processed again. Toensure the quality of the results, the tool also features verification routines that check importantproperties of the solution, like connectivity, order, completeness or u-turns. Once all routes arein ordere, the tool allows saving the edited version into MATSim public transport systems modelXML file. A video demonstration of the tool is available at (Ordóñez Medina, 2011b).
7.2.5 Bus lanes
On certain roads in Singapore, one lane is dedicated for bus use only. Two categories of buslanes exist: full day bus lane on which cars are only allowed between 8.00pm and 7.30amor on Sundays and normal bus lanes which operate during weekdays from 7.30am to 9.30amand 5.00pm to 8.00pm. To cover bus lane availability in the transport simulation, the roadnetwork was modified to model the availability of dedicated bus lanes. New links were addedto the network with the same coordinates but different mode restrictions. For example, insteadof having one link with four lanes allowing bus and car vehicles, two links with differentcharacteristics are generated. On the exisiting links, now only cars are allowed and featuresa three lanes capacity. On the new additional link, capacity is set to one lane and only busesare allowed. To cover competition caused by turning vehicles, this new sequence of links isthen connected to the network to nodes that represent intersections. As the information is onlyprovided in a text form an interactive tool was developed. It allows to select the initial and finalnodes of the exclusive bus lane, calculates the shortest path to assure that the correct street isselected and automatically executes the idea mentioned above. As only the name of the streetsis provided, but no coordinates, a high resolution graphical map is used as background layer. Tohelp finding the relevant area in the map efficiently, the map can be centered by entering thestreet name. For this feature an automated query using GoogleMap API was implemented. Avideo demonstration showing the functionality of this tool is accessible at (Ordóñez Medina,2011a). With the current implementation, bus lanes are assumed to be in operation during thewhole day. Since congested condition arise during the peak hours where both full day andnormal bus lanes are in operation, such a simplified consideration only affect only off peak hourswhere actual road capacity is underestimated. However, most links that feature bus lanes featurethree or more lanes, the effect of modeled traffic conditions is expected to be low.
25

Large-scale agent-based transport demand model for Singapore June 2012
7.2.6 Vehicle types
The GTFS information does not include any information on the vehicle type for individual busand MRT deployments. Rolling stock information for the MRT and LRT system was used asavailable on dedicated Wikipedia pages. Information provided by SGWiki on capacity andlayout was used to specify buses. Since several types of buses are used on single lines, for eachbus line, all listed bus types were assigned to individual deployments with equal probability.
7.2.7 Dwell times
MATSim provides two types for simulating boarding and alighting processes from and to publictransport vehicles. For MRT, dwell times are obtained by multiply the number of boarding andthe alighting passengers using flow constants, as both processes can be performed in parallel.For buses, in Singapore, front and back doors are exclusively used for boarding and alighting,respectively. Therefore, the longer of those two durations is considered as the total dwell time.
7.3 Outlook
Traffic lights Instead of the manual recoding traffic signal plans into the MATSim format,another strategy is envisaged. By adapting green time shares to simulated demand, the operatingsignal plans who also switch dependent on demand distribution can be mimicked. Changingsignal plans however is expected to affect transport behavior, at least in the dimension of routechoice. Therefore, an iterative process would be required equilibrate changing signal plans anddemand reactions.
Bus lanes With the current implementation of bus lanes, we assume that bus lanes are forexclusive usee of buses throughout the whole day. However, in future implementation cars willbe forced off from using the bus lanes during operation by imposing exceptionally high costfor traveling on such links. Such an approach reflects the actual circumstances, where cars arecharged fines for using bus lanes during operation hours.
Dwell times In a recent study, (Sun et al., 2012) propose based on an analysis of transportsmart card data collected in Singapore a new model for takes into account the observation thatpassengers only board at a constant rate when the number of passenger below a certain level.Statistically different boarding rates and criticality levels were estimated for different bus types.It is planned to adapt this model for MATSim which requires only minor code extension. Inthe current version of MATSim, boarding and alighting processes at public transport stops are
26

Large-scale agent-based transport demand model for Singapore June 2012
exclusively performed sequentially. However, a number of stop facilities are actually designedto allow parallel dwell process of two or three buses. To adequately represent such situations,modifications in the stop facility model and in the boarding and alighting processes are required.Besides this, information on the effective design of bus stop facilities in Singapore need to beobtained.
8 Implementation and Validation
8.1 Implementation
8.1.1 Execution
The simulation used for executing activity plans of MATSim Singapore is based on a timestep based parallel queue simulation as presented in (Dobler, 2010). In this model, each roadsegment is modeled as a First In, First Out waiting queue, with a minimum service time of thelength of the road segment divided by the maximum travel speed. Due to the time step basedapproach, the computational intensity scales linearly with the number of links in the networkand is independent of the number of agents. Congestion and spillbacks are modeled through thelink capacity information. The maximum number of vehicles that a queue can release equals thepredetermined flow capacity, the maximum number of vehicles that can be stored in a link isgiven by the storage capacity.
To simulate public transport, transit drivers are introduced whose routes follow a predefinedschedule and allow other agents to board and alight (Rieser, 2010). Based on the mapping of busservice routes to the road network, physical interaction between buses and cars is simulated (twovideo animations showing buses moving through congested parts of the network on links withand without dedicated bus lane are accessible at (Erath, 2011b,a). The output of the simulation isa so-called events file which documents all simulated state changes for all agents. State changesinclude start and end of an activity, enter and leaving a link or public transport stop and vehicle.For the 25% sample of the Singapore scenario (see section 8.1.4, in every iteration around117 millions events are generated. As a result of the complete integration of the simulation inMATSim allows direct handling of event information from RAM for subsequent model stepssuch as scoring and replanning.
27

Large-scale agent-based transport demand model for Singapore June 2012
8.1.2 Scoring function
Daily plans are evaluated with a measure of general utility. The employed scoring functionfollows the model presented in Charypar and Nagel (2005) and combines additively utilitygains from performing activities and losses from traveling between activity locations. For eachmodeled activity type (Section 6.1) both a minimal and optimal activity duration are predefinedaccording to the observations in HITS.
In addition, the score of performing shopping and leisure activities is discounted according tothe crowdedness of the related facility (Horni et al., 2009).
In absence of a discrete choice parameters estimated based on entire activity plans along theline of (Kickhöfer, 2009) or (Feil, 2010), generic parameters that already produced meaningfulresults in for MATSim implementations are applied. The marginal utility of performing activitiesis set to 6 SGD/h, with late arrival punished with a disutility of -18SGD/h.
Travelling between activities is scored with subject to the travel mode. The according parametersare derived from LTA’s travel demand model. For car, dedicated parameters for the cost ofdriving, tolls and travel times are employed. Similarly, public transport trips are scored accordingto travel time, number of transfers, walking distance from and to stops and fares which arecomputed based on the actual distance based fare scheme.
8.1.3 Replanning strategies
In the presented MATSim Singapore model, in every subsequent iteration, for 40% of all agents,a copy of the executed activity plan is generated. This copy is then changed using one offollowing replanning modules at which each module is selected with equal probability:
Time mutation The time mutation module varies randomly the departure times and durationsof activities in a daily plan. Based on experience from other implementation, maximumextent of the shifts was restricted to +/-50min.
Rerouting All trips are rerouted according to the shortest paths according to the loaded networkof the prior iteration.
Mode choice For each subtour of an activity plan, the mode is changed. Since the presentedversion of MATSim Singapore only include car and public transport trips, mode is alteredbetween those two options.
Assignment of secondary activity locations Based on the given locations of the primary ac-tivities, and the potential facilities suited to perform secondary activities, the employeddestination choice module is based on Hägerstrand’s time geography (Hägerstrand, 1970):secondary activity locations are chosen within the region restrained by travel time budgets
28
Large-scale agent-based transport demand model for Singapore June 2012
as defined by the time allocation module (Horni et al., 2009). Within this region the choiceis performed based on the MATSim utility function.
8.1.4 Computation intensity
To reduce the RAM intensity of the scenario, a 25% sample of the entire population is simulated.To ensure realistic traffic flows, also the flow and storage capacity of road links are adjusted.Whereas earlier, car-only simulations would typically use a sample population of 10%, the shareof 25% was chosen to prevent artefacts when simulating public transport. Hence, the capacity ofthe smallest bus types of 72 is reduced to 21 passengers, which is believed to minimize randomartificial incidences of bus overcrowding.
Performance runs were executed on two high performance computation servers:
• System 1: Fujitsu RX200 S6 with 2 Intel Nehalem-EP CPUs clocked at 2.67 GHz eachfeaturing six cores (double threaded) and 144Gb Ram. For simulation runs, 60 GbRAM were assigned, 24 threads are used for replanning and four threads for the trafficsimulation.
• System 2: IBM x3850 X5 with four Intel Westmere-EX CPUs clocked at 2.4 GHz eachfeaturing ten cores (double threaded) and 500Gb RAM. For simulation runs, 60 GbRAM were assigned, 72 threads are used for replanning and four threads for the trafficsimulation.
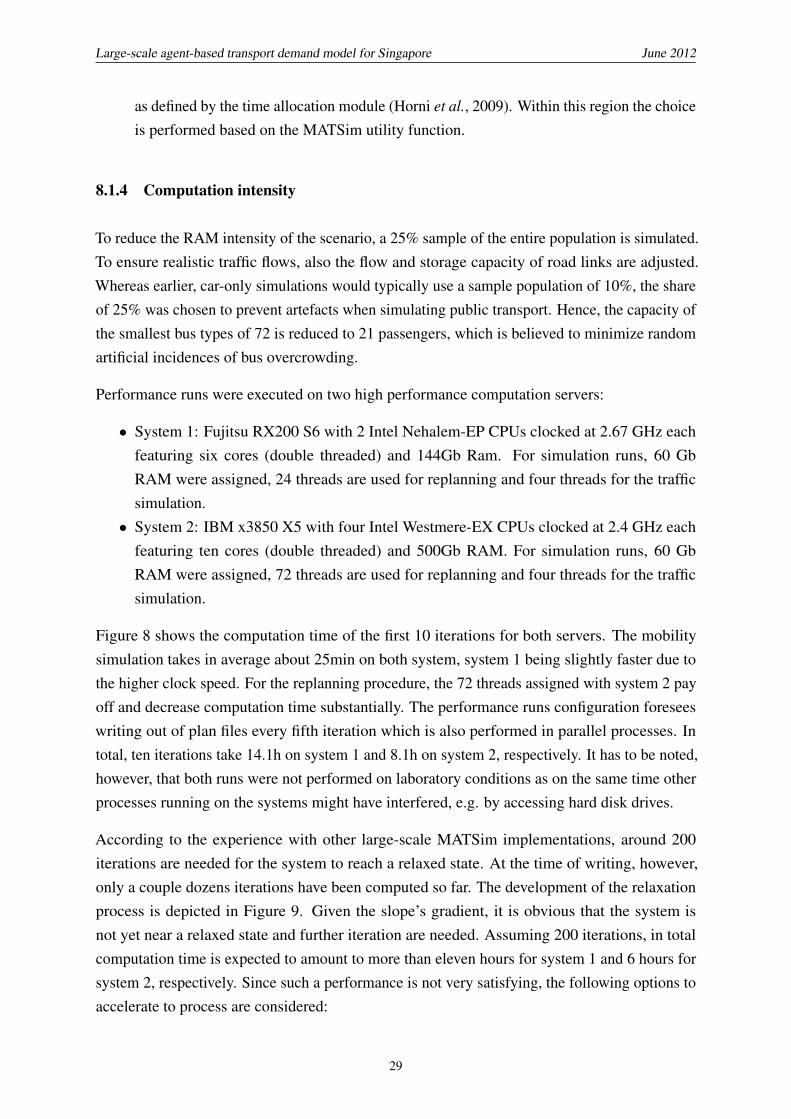
Figure 8 shows the computation time of the first 10 iterations for both servers. The mobilitysimulation takes in average about 25min on both system, system 1 being slightly faster due tothe higher clock speed. For the replanning procedure, the 72 threads assigned with system 2 payoff and decrease computation time substantially. The performance runs configuration foreseeswriting out of plan files every fifth iteration which is also performed in parallel processes. Intotal, ten iterations take 14.1h on system 1 and 8.1h on system 2, respectively. It has to be noted,however, that both runs were not performed on laboratory conditions as on the same time otherprocesses running on the systems might have interfered, e.g. by accessing hard disk drives.
According to the experience with other large-scale MATSim implementations, around 200iterations are needed for the system to reach a relaxed state. At the time of writing, however,only a couple dozens iterations have been computed so far. The development of the relaxationprocess is depicted in Figure 9. Given the slope’s gradient, it is obvious that the system isnot yet near a relaxed state and further iteration are needed. Assuming 200 iterations, in totalcomputation time is expected to amount to more than eleven hours for system 1 and 6 hours forsystem 2, respectively. Since such a performance is not very satisfying, the following options toaccelerate to process are considered:
29

Large-scale agent-based transport demand model for Singapore June 2012
Figure 8: Computation time for MATSim Singapore performance runs (first ten iterations)
Fujitsu RX200 S6 IBM x3850 X5
0 1 2 3 4 5 6 7 8 9 10 0 1 2 3 4 5 6 7 8 9 100102030405060708090100
Computation t
ime [min]
Write out plansReplanningMobsim
• A characterization of modules is whether they modify a plan randomly (Random Mutation)or whether they search for the best solution based on the results of the last traffic flowsimulation (Best Response). Despite being computationally more expensive, it wasdemonstrated that best response modules usually help to relax the system much faster(Balmer et al., 2009b) . Currently, the only best response replanning strategy is rerouting.Employing replanning modules that not only optimise one aspect of a daily plan, butall parts at the same time using genetic algorithms such as Planomat (Meister, 2011) orPlanomat X (Feil, 2010) would potentially reduce computation time substantially.
• Currently, after every replanning stage a mobility simulation is performed. Anotherapproach to simulate traffic flow less frequently. Assuming the outcome of the mobilitysimulation affects the scheduling and location choice of activities only partly, such astrategy has a great potential to reduce computation time substantially. First trial runs thatsimulate traffic only every 10th iteration show very promising results as the results seemsvery comparable with the conventional approach, but are obtained in much shorter time.
30

Large-scale agent-based transport demand model for Singapore June 2012
Figure 9: Relaxation process for MATSim Singapore (first 47 iterations)
-50
0
50
100
150
200
250
300
350
400
450
0 10 20 30 40 50
Score
Iteration
avg. BESTavg. EXECUTEDavg. AVGavg. WORST
8.2 Validation
When submitting this paper, no steady state solution that would allow meaningful validationwas available. Therefore, in this section only an outline of planned validation procedures ispresented.
Distributions of trip distance and duration As in the case with aggregated transport demandmodels, comparing trip distance distributions of the simulated demand with observed trips, forSingapore as reported in HITS, is central to control the validity of the results. By analysing tripsfrom and to primary activity locations, the plausibility of the spatial distribution of home andwork facilities is tested. Furthermore, indication of travel times allow a first verification of thetransport supply model and traffic simulation.
Road counts In addition to reviewing daily link volumes in the network, the validation withroad counts allows to check the modeled dynamics of travel demand over a day. Road countdata was made available in hourly interval by LTA for 200 count stations. To exclude effectscause be certain special events, the data draws from several weeks of observation.
31

Large-scale agent-based transport demand model for Singapore June 2012
Mode choice To test the appropriate function of the mode choice model parameters andreplanning module, mode shares for different distance bins and trip purposes as observed inthe simulation are opposed with corresponding values based on reported trips. If systematicdifferences are observed, one can either adjust the constant or individual parameters such asvaluation of travel times. However, such a procedure requires careful experiment design as thetesting a set of different parameter combinations is computationally extensive.
Travel speed By comparing simulated travel speed with observed values using for examplefloating car data, both the validity of the road network model and the demand and hence linkvolume dynamics can be tested on a network wide level. To monitor traffic, LTA gathers speedinformation collected by taxis. Given Singapore’s large taxi fleet, a vast amount of travel speeddata could be at hand for validation.
Scenario evaluation The opening of the fourth and fifth stage of the Circle Line (MRT) on8th October 2011 as well as another extension by two additional stops on 14th January 2012,provide a great opportunity to test the models abilities in terms of predicting effects of mode,route and secondary activity location choice.
9 Conclusion and Outlook
The main challenges of the implementation of MATSim Singapore were twofold: First, collect-ing and processing input data that allows a fully dynamic transport demand model featuringinteraction between public and private transport with the individual building as the level of spa-tial resolution required innovative data modeling approaches. However, for various sub-modelspotential for improvement has been identified and possible solutions formulated.
MATSim Singapore is the first implementation to feature integrated public transport simulation,secondary location choice, road tolls and using the individual building as the level of resolutionfor facilities in one in single model. Areas for improvement in that respect are mainly seen inimproving the interplay of replanning modules and its consistency with transport behaviourmodels, in particular for scoring and routing. The currently implemented public transport router,for example, only takes into account schedule information. Consequently, the same route whichmight be optimal according to the schedule but might lead over notoriously congested links ischosen in the iterative process over and over again. At the same time, the rather high share ofcaptive public transport ridership and constraints imposed by fixed work location and openingtimes may limit the effectiveness of other replanning strategies. Together, this might lead tobiased service loadings and hence travel times. To overcome this problem, consistent scoring
32

Large-scale agent-based transport demand model for Singapore June 2012
for replanning and traffic simulation would be required. Such an approach would also allow toinclude the indication of crowdedness and effective waiting times which both have repeatedlyproved to affect route and mode choice in travel behaviour surveys.
MATSim Singapore will be further improved along the lines stated at the end of the individualsections in this report. The model is the starting point of a extensive research project whichaddresses the questions of managing, planning and optimising the flow of people and goodsat different time scales and the interaction of these aspects with all elements of a future cityAxhausen and Erath (2011). On the medium term scale, the addressed research questions arehow to use a model like MATSim to optimise road toll schemes, how to account for coordinationamong agents, e.g. within a household and how to expand the scope from daily to weekly activityplans. On the long term scale, the research is organised on three pillars, namely, objective finelocation choice, service provider agents and social network geographies. Together, this willform the framework of forecasting future states of the cities by updating the spatial distributionof activity locations, the populations demography and transport infrastructure.
10 Acknowledgements
The authors would like to express their sincere gratitude to the Singaporean Land TransportAuthority in for supporting this research and providing all required data. Furthermore, theFinancial support from National Research Foundation of Singapore, the main funder of theFuture Cities Laboratory, is greatly appreciated. Last but not least, we would like to thanks theMATSim community for their contributions to the open source project and in particular MichaelBalmer and Marcel Rieser from Senozon for sharing advice and providing diligent support.
References
AllProperty (2011) Property Guru, webpage, http://www.propertyguru.com.sg. Ac-cessed from February to March 2011.
Arentze, T. A. and H. J. P. Timmermans (2009) A need-based model of multi-day, multi-personactivity generation, Transportation Research Part B: Methodological, 43 (2) 251–265.
Arnott, R., A. de Palma and R. Lindsey (1993) A structural model of peak-period congestion: Atraffic bottleneck with elastic demand, The American Economic Review, 83 (1) 161–179.
Axhausen, K. W. and A. Erath (2011) Urban Sustainability and Transportation: ResearchFramework for Medium and Long Term Transport Planning, Journeys, 7.
33

Large-scale agent-based transport demand model for Singapore June 2012
Balmer, M., M. Bernard and K. W. Axhausen (2005) Matching geo-coded graphs, paperpresented at the 5th Swiss Transport Research Conference, Ascona, March 2005.
Balmer, M., A. Horni, K. Meister, F. Ciari, D. Charypar and K. W. Axhausen (2009a) Wirkungender Westumfahrung Zürich: Eine Analyse mit einer Agenten-basierten Mikrosimulation, Final
Report, Baudirektion Kanton Zurich, IVT, ETH Zurich, Zurich, February 2009.
Balmer, M., K. Meister, R. A. Waraich, A. Horni, F. Ciari and K. W. Axhausen (2010) Agenten-basierte Simulation für location based services, Final Report, F&E Förderung: Science toMarket, KTI 8443.1 ESPP-ES, Datapuls AG, IVT, ETH Zurich, Zurich, February 2010.
Balmer, M., M. Rieser, K. Meister, D. Charypar, N. Lefebvre and K. Nagel (2009b) MATSim-T:Architecture and simulation times, in A. L. C. Bazzan and F. Klügl (eds.) Multi-Agent Systems
for Traffic and Transportation Engineering, 57–78, Information Science Reference, Hershey.
Beckmann, K. J., U. Brüggemann, J. Gräffe, F. Huber, H. Meiners, P. Mieth, R. Moeckel,H. Mühlhans, G. Rindsfüser, H. Schaub, R. Schrader, C. Schürmann, B. Schwarze, K. Spiek-ermann, D. Strauch, M. Spahn, P. Wagner and M. Wegener (2007) Ilumass: Integrated landuse modelling and transportation system simulation, Final Report, Technical University Dort-mund, Institute of Spatial Planning and Spiekermann & Wegener Stadt und Regionalforschungand University of Cologne, Centre for Applied Sciences and RWTH Aachen, Institut fürStadtbauswesen und Strassenverkehr (ISB) and University of Bamberg, Insitute for Theoreti-cal Psychology and German Aerospace Center (DLR), German Aerospace Centre, Instituteof Transport Research and University of Wuppertal, LUIS – Lehr- und ForschungsgebietUmweltverträgliche Infrastrukturplanung, Berlin.
Beckx, C., T. A. Arentze, L. Int Panis, D. Janssens, J. Vankerkorn and G. Wets (2009) Anintegrated activity-based modelling framework to assess vehicle emissions: Approach andapplication, Environment and Planning B, 36 (6) 1086–1102.
Bekhor, S., C. Dobler and K. W. Axhausen (2011) Integration of activity-based with agent-basedmodels: an example from the Tel Aviv model and MATSim, paper presented at the 90th
Annual Meeting of the Transportation Research Board, Washington, D.C., January 2011.
Ben-Akiva, M. E., M. Bierlaire, H. Koutsopoulos and R. Mishalani (2002) Real time simulationof traffic demand-supply interactions with DynaMIT, in M. Gendreau and P. Marcotte (eds.)Transportation and Network Analysis: Current Trends, 19–36, Kluwer, Dordrecht.
Bhat, C. R., J. Y. Guo, S. Srinivasan and A. Sivakumar (2004) A comprehensive econometricmicrosimulator for daily activity-travel patterns, Transportation Research Record, 1894,57–66.
34

Large-scale agent-based transport demand model for Singapore June 2012
Bhat, C. R. and V. Pulugurta (1998) A comparison of two alternative behavioral choice mecha-nisms for household auto ownership decisions, Transportation Research Part B: Methodologi-
cal, 32 (1) 61–75.
Bradley, M. A. and J. L. Bowman (2006) Design features of activity-based microsimulationmodels for U.S. metropolitan planning organizations, paper presented at the Innovations in
Travel Demand Modeling (ITM’06), Austin, May 2006.
Bradley, M. A., J. L. Bowman and B. Griesenbeck (2010) SACSIM: An applied activity-basedmodel system with fine-level spatial and temporal resolution, Journal of Choice Modelling,3 (1) 5–31.
Cetin, N. (2005) Large-scale parallel graph-based simulations, Ph.D. Thesis, ETH Zurich,Zurich.
Chakirov, A. and A. Erath (2011) Use of public transport smart card fare payment data for travelbehaviour analysis in singapore, paper presented at the 16th international conference of Hong
Kong Society for Transportation Studies, December 2011.
Chakirov, A. and A. Erath (2012) Activity identification and primary location modelling basedon smart card payment data for public transport, paper presented at the 13th International
Conference on Travel Behaviour Research (IATBR), Toronto, July 2012.
Charypar, D. (2008) Efficient algorithms for the microsimualtion of travel behavior in very largescenarios, Ph.D. Thesis, ETH Zurich, Zurich.
Charypar, D., K. W. Axhausen and K. Nagel (2007) Event-driven queue-based traffic flowmicrosimulation, Transportation Research Record, 2003, 35–40.
Charypar, D. and K. Nagel (2005) Generating complete all-day activity plans with geneticalgorithms, Transportation, 32 (4) 369–397.
Charypar, D. and K. Nagel (2006) Q-learning for flexible learning of daily activity plans,Transportation Research Record, 1935, 163–169.
Choi, C. C. and R. Toh (2010) Household interview surveys from 1997 to 2008: A decade ofchanging travel behaviours, Journeys, 5 (May 2010) 52–61.
Ciari, F., M. Balmer and K. W. Axhausen (2007) Mobility tool ownership and mode choicedecision processes in multi-agent transportation simulation, paper presented at the 7th Swiss
Transport Research Conference, Ascona, September 2007.
Ciari, F., M. Balmer and K. W. Axhausen (2008) A new mode choice model for a multi-agenttransport simulation, paper presented at the 8th Swiss Transport Research Conference, Ascona,October 2008.
35
Large-scale agent-based transport demand model for Singapore June 2012
de Palma, A. and F. Marchal (2002) Real cases applications of the fully dynamic METROPOLIStool-box: An advocacy for large-scale mesoscopic transportation systems, Networks and
Spatial Economics, 2 (4) 347–369.
Dobler, C. (2010) Implementation of a time step based parallel queue simulation in matsim,paper presented at the 10th Swiss Transport Research Conference, Ascona, September 2010.
Erath, A. (2011a) Visualisation of traffic simulation including public buses on dedicated laneswith matsim, http://vimeo.com/43729803.
Erath, A. (2011b) Visualisation of traffic simulation including public buses on shared roads withmatsim, http://vimeo.com/43729804.
Ettema, D. F., G. Tamminga, H. J. P. Timmermans and T. A. Arentze (2005) A micro-simulationmodel system of departure time using a perception updating model under travel time uncer-tainty, Transportation Research Part A: Policy and Practice, 39 (4) 325–344.
Feil, M. (2010) Choosing the daily schedule: Expanding activity-based travel demand modelling,Ph.D. Thesis, ETH Zurich, Zurich.
Gao, S., M. Balmer and E. J. Miller (2010) Comparisons between MATSim and EMME/2 onthe Greater Toronto and Hamilton Area network, paper presented at the 89th Annual Meeting
of the Transportation Research Board, Washington, D.C., January 2010.
Giant (2011) Giant hypermarket, webpage, http://www.gianthypermarket.com.sg.
Grether, D., M. Neumann and K. Nagel (2012) Simulation of urban traffic control: A queuemodel approach, paper presented at the 1st International Workshop on Agent-based Mobility,
Traffic and Transportation Models, Methodologies and Applications, Niagara Falls, August2012.
HDB (2011) HDB InfoWeb, http://services2.hdb.gov.sg/webapp/BB33RTIS/BB33PReslTrans.jsp. Accessed on 29/03/2011.
Hägerstrand, T. (1970) What about people in regional science?, Papers of the Regional Science
Association, 24 (1) 7–21.
Holland, J. H. (1992) Adaptation in Natural and Artificial Systems: An Introductory Analysis
with Applications to Biology, Control, and Artificial Intelligence, MIT Press, Cambridge.
Horni, A., D. M. Scott, M. Balmer and K. W. Axhausen (2009) Location choice modelingfor shopping and leisure activities with MATSim: Combining micro-simulation and timegeography, Transportation Research Record, 2135, 87–95.
Jones, P. M., M. C. Dix, M. I. Clarke and I. G. Heggie (1983) Understanding Travel Behaviour,Gower, Aldershot.
36

Large-scale agent-based transport demand model for Singapore June 2012
Kickhöfer, B. (2009) Die Methodik der ökonomischen Bewertung von Verkehrsmaßnahmen inMultiagentensimulationen, Master Thesis, Technical University Berlin, Berlin.
Kitamura, R. (1988) An evaluation of activity-based travel analysis, Transportation, 15 (1) 9–34.
Mahmassani, H. S., T. Hu and R. Jayakrishnan (1992) Dynamic traffic assignment and simu-lation for advanced network informatics, paper presented at the Compendium of the Second
International Seminar on Urban Traffic Networks, Capri.
Meister, K. (2011) Contribution to agent-based demand optimization in a multi-agent transportsimulation, Ph.D. Thesis, ETH Zurich, Zurich.
Meister, K., M. Rieser, F. Ciari, A. Horni, M. Balmer and K. W. Axhausen (2009) Anwendungeines agentenbasierten Modells der Verkehrsnachfrage auf die Schweiz, Straßenverkehrstech-
nik, 53 (5) 269–280.
Ministry of Education (2011) School Information Service, webpage, http://www.moe.gov.sg. Accessed on 05/04/2011.
NAVTEQ (2011) NAVTEQ Maps and Traffic, webpage, http://www.navteq.com.
NTUC (2011) Accessed on 10/04/2011, webpage, http://www.fairprice.com.sg/.Accessed on 10/04/2011.
Ordóñez Medina, S. A. (2011a) Adding bus lanes using matsim network editing tool, http://vimeo.com/37719740.
Ordóñez Medina, S. A. (2011b) Demonstration of semi-automatic tool for bus route mapmatching, http://vimeo.com/27137889.
Ordóñez Medina, S. A. (2011c) Interactive capacity and free speed fixing tool, http://vimeo.com/37719997.
Ordóñez Medina, S. A. (2011d) Updating link capacities after network to network matching,http://vimeo.com/37719479.
Ordóñez Medina, S. A. (forthcoming) Estimating workplace capacities using public transportsmart card data and a household travel survey, Working Paper, Future Cities Laboratory, ETHZurich, Zurich.
Ordóñez Medina, S. A. and A. Erath (2011) Semi-automatic tool for map-matching bus routeson high-resolution navigation networks, paper presented at the 16th international conference
of Hong Kong Society for Transportation Studies, December 2011.
Palmer, R. G., B. W. Arthur, J. H. Holland, B. Lebaron and P. Tayler (1994) Artificial economiclife: A simple model of a stockmarket, Physica D: Nonlinear Phenomena, 75 (1–3) 264–274.
37

Large-scale agent-based transport demand model for Singapore June 2012
Potoglou, D. and Y. O. Susilo (2008) Comparison of vehicle-ownership models, Transportation
Research Record, 2076, 97–105.
Raney, B. and K. Nagel (2006) An improved framework for large-scale multi-agent simulationsof travel behavior, in P. Rietveld, B. Jourquin and K. Westin (eds.) Towards Better Performing
Transport Networks, 305–347, Routledge, London.
Rieser, M. (2010) Adding transit to an agent-based transportation simulation, Ph.D. Thesis,Technical University Berlin, Berlin.
Rieser, M., U. Beuck, M. Balmer and K. Nagel (2008) Modelling and simulation of a morningreaction to an evening toll, paper presented at the Innovations in Travel Modeling (ITM’08),Portland, June 2008.
Rieser, M., K. Nagel, U. Beuck, M. Balmer and J. Rümenapp (2007) Agent-oriented coupling ofactivity-based demand generation with multiagent traffic simulation, Transportation Research
Record, 2021, 10–17.
Roorda, M. J., E. J. Miller and K. M. N. Habib (2008) Validation of TASHA: A 24-h activityscheduling microsimulation model, Transportation Research Part A: Policy and Practice,42 (2) 360–375.
Streetdirectory (2011) Streetdirectory Singapore, webpage, http://www.
streetdirectory.com. Accessed on 10/04/2011.
Sun, D., D.-H. Lee, A. Erath and X. Huang (2012) Using smart card data to extract passenger’sspatial-temporal density and train’s trajectory of mrt system, Working Paper, Future CitiesLaboratory, ETH Zurich, Singapore.
UN (2007) State of the world population 2007 - unleashing the potential of urban growth,Technical Report, United Nations Populations Funds, New York.
URA (2008) The planning act masterplan written statement, Technical Report, Urban Redevel-opement Authority, Singapore.
URA (2011) Real estate informations system REALIS, webpage, http://www.ura.gov.sg/realis/. Accessed on 29/03/2011.
van Eggermond, M. A. B., A. Erath and K. W. Axhausen (2012) Vehichle ownership in singaporeusing revealed-preference data and spatial variable, paper presented at the 13th International
Conference on Travel Behaviour Research (IATBR), Toronto, July 2012.
Vickrey, W. S. (1969) Congestion theory and transport investment, The American Economic
Review, 59 (2) 251–260.
38

Large-scale agent-based transport demand model for Singapore June 2012
Vrtic, M. and K. W. Axhausen (2003) Experiment mit einem dynamischen Umlegungsverfahren,Straßenverkehrstechnik, 47 (3) 121–126.
Waraich, R. A., D. Charypar, M. Balmer and K. W. Axhausen (2009) Performance improvementsfor large scale traffic simulation in MATSim, paper presented at the 9th Swiss Transport
Research Conference, Ascona, September 2009.
Watling, D. P. (1996) Asymmetric problems and stochastic process models of traffic assignment,Transportation Research Part B: Methodological, 30 (5) 339–357.
Ye, X., K. Konduri, R. M. Pendyala, B. Sana and P. A. Waddell (2009) A methodology tomatch distributions of both household and person attributes in the generation of syntheticpopulations, paper presented at the 88th Annual Meeting of the Transportation Research
Board, Washington, D.C., January 2009.
39


![INTELLECTUAL PROPERTY OFFICE OF SINGAPORE · SG INTELLECTUAL PROPERTY OFFICE OF SINGAPORE [Continued] SG Who can act as agent? Any individual, partnership or body corporate entitled](https://static.documents.pub/doc/80x56/5ed68d5e5cd0d56eef02e508/intellectual-property-office-of-singapore-sg-intellectual-property-office-of-singapore.jpg)


