7 th International Symposium on NDT in Aerospace – We.5.A.5 1 License: http://creativecommons.org/licenses/by/3.0/ LASER SPOT THERMOGRAPHY FOR CRACK DETECTION IN ALUMINUM STRUCTURES Jakub ROEMER 1 , Tadeusz UHL 1 , Łukasz PIECZONKA 1 1 AGH University of Science and Technology, Krakow, Poland Abstract. The paper investigates an application of active thermography for nondestructive testing and evaluation of aluminum structures. Two active thermography techniques are considered: vibrothermography and laser spot thermography. Experiments were performed on aluminum samples with fatigue cracks in order to compare the effectiveness of both measurement techniques. The paper discusses hardware setup required to perform measurements with bot techniques. Specifically the description is given for the developed laser spot thermography test rig including the control and signal processing software that allows automating measurement procedure and significantly limit the operator input. It is shown that laser spot thermography and vibrothermography can be effectively used to detect surface cracks in aluminum structures. Introduction Nondestructive testing of materials is an important part in virtually all engineering applications. Over the years a number of testing methods have been developed and successfully applied in engineering practice. These include visual inspection, liquid penetrant testing, leak testing, infrared and thermal testing, x-ray radiography, electromagnetic testing, magnetic testing, ultrasonic testing and shearography [1-3]. The constantly increasing requirements for reliability of structures stimulates the development of new and more effective testing methods. This paper deals with one of the dynamically developing techniques which is infrared thermography. It is recently gaining more attention in the fields like aerospace, civil engineering, automotive and welded joints inspection. [4- 6]. The most important advantages of infrared thermography include the noncontact and full field measurement capabilities, fast acquisition time, simple test setup and procedure [7]. This paper shows the application and comparison of two thermographic techniques, namely the laser spot thermography and vibrothermography that were applied for surface crack detection in an aluminium beam. The paper contains a detailed description of the measurement techniques and their experimental arrangements. Subsequently it describes the experimental tests that were performed on an aluminium plate with a fatigue crack. Experimental procedures as well as the results that were obtained from both techniques are described and compared.
Transcript
7th International Symposium on NDT in Aerospace – We.5.A.5
LASER SPOT THERMOGRAPHY FOR CRACK DETECTION IN ALUMINUM STRUCTURES
Jakub ROEMER 1, Tadeusz UHL 1, Łukasz PIECZONKA 1 1 AGH University of Science and Technology, Krakow, Poland
Abstract. The paper investigates an application of active thermography for nondestructive testing and evaluation of aluminum structures. Two active thermography techniques are considered: vibrothermography and laser spot thermography. Experiments were performed on aluminum samples with fatigue cracks in order to compare the effectiveness of both measurement techniques. The paper discusses hardware setup required to perform measurements with bot techniques. Specifically the description is given for the developed laser spot thermography test rig including the control and signal processing software that allows automating measurement procedure and significantly limit the operator input. It is shown that laser spot thermography and vibrothermography can be effectively used to detect surface cracks in aluminum structures.
Introduction
Nondestructive testing of materials is an important part in virtually all engineering applications. Over the years a number of testing methods have been developed and successfully applied in engineering practice. These include visual inspection, liquid penetrant testing, leak testing, infrared and thermal testing, x-ray radiography, electromagnetic testing, magnetic testing, ultrasonic testing and shearography [1-3]. The constantly increasing requirements for reliability of structures stimulates the development of new and more effective testing methods. This paper deals with one of the dynamically developing techniques which is infrared thermography. It is recently gaining more attention in the fields like aerospace, civil engineering, automotive and welded joints inspection. [4-6]. The most important advantages of infrared thermography include the noncontact and full field measurement capabilities, fast acquisition time, simple test setup and procedure [7]. This paper shows the application and comparison of two thermographic techniques, namely the laser spot thermography and vibrothermography that were applied for surface crack detection in an aluminium beam. The paper contains a detailed description of the measurement techniques and their experimental arrangements. Subsequently it describes the experimental tests that were performed on an aluminium plate with a fatigue crack. Experimental procedures as well as the results that were obtained from both techniques are described and compared.
2
Measurements Techniques
Thermography is a family of measurement techniques based on the analysis of surface temperature distributions of tested objects. All thermographic techniques can be divided in to two major groups: passive and active thermography [8]. Passive thermography is based on the detection of thermal anomalies in structures which could indicate malfunctions in their operation. Active thermography, on the other hand, requires an external energy to be delivered to the tested structure. Damage detection is based on the evaluation of the heat flow inside an object. Anomalies in the heat flow pattern can indicate hidden defects in the tested structures. Two of the active thermography techniques named laser spot thermography and vibrothermography were considered in this article.
Laser Spot Thermography
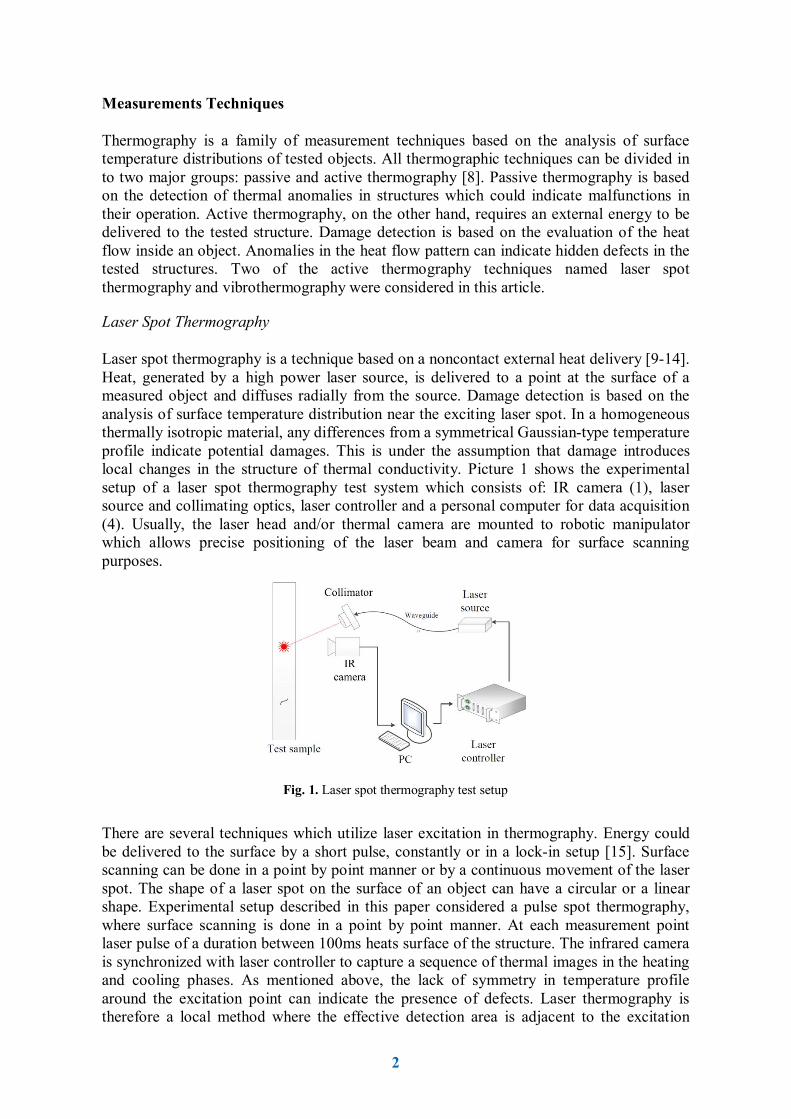
Laser spot thermography is a technique based on a noncontact external heat delivery [9-14]. Heat, generated by a high power laser source, is delivered to a point at the surface of a measured object and diffuses radially from the source. Damage detection is based on the analysis of surface temperature distribution near the exciting laser spot. In a homogeneous thermally isotropic material, any differences from a symmetrical Gaussian-type temperature profile indicate potential damages. This is under the assumption that damage introduces local changes in the structure of thermal conductivity. Picture 1 shows the experimental setup of a laser spot thermography test system which consists of: IR camera (1), laser source and collimating optics, laser controller and a personal computer for data acquisition (4). Usually, the laser head and/or thermal camera are mounted to robotic manipulator which allows precise positioning of the laser beam and camera for surface scanning purposes.
Fig. 1. Laser spot thermography test setup
There are several techniques which utilize laser excitation in thermography. Energy could be delivered to the surface by a short pulse, constantly or in a lock-in setup [15]. Surface scanning can be done in a point by point manner or by a continuous movement of the laser spot. The shape of a laser spot on the surface of an object can have a circular or a linear shape. Experimental setup described in this paper considered a pulse spot thermography, where surface scanning is done in a point by point manner. At each measurement point laser pulse of a duration between 100ms heats surface of the structure. The infrared camera is synchronized with laser controller to capture a sequence of thermal images in the heating and cooling phases. As mentioned above, the lack of symmetry in temperature profile around the excitation point can indicate the presence of defects. Laser thermography is therefore a local method where the effective detection area is adjacent to the excitation
3
location. The advantage of this approach is that the thermal camera can be positioned very close to the tested structure which increases the spatial resolution of the measurement (i.e. the ratio of unit length per pixel) and allows to detect smaller damages.
Vibrothermography
The second technique considered in this study was vibrothermography. The method is based on a local heat generation [16-19]. Energy is delivered to the inspected structure by elastic waves generated by ultrasonic transducer. Elastic waves of frequency in range from 15 to 70 kHz propagate in material and interact with defects such as delaminations or cracks. Due to friction occurring in defects energy is dissipated into the heat. Heat propagates to the surface where it is measured by a thermal camera. Damage detection is based on the analysis of the resultant surface temperature distribution.
Pic. 2.Vibrothermography test setup [20]
Picture 2 shows the experimental setup of vibrothermography test system which consists of: vibration source, infrared camera, control unit and a personal computer for data acquisition (4). Vibrothermography has several practical advantages such as a very short measurement time (few seconds), simple test setup and a straightforward post processing workflow. However, in contrast to laser spot thermography, vibrothermography is a contact technique (on the excitation side) which may limit its applicability in certain cases.
Tested Sample
The test sample was an aluminium bar with the overall dimensions of 300x20x10 mm. A small notch was introduced in the mid span of the beam using a wire-cut electric discharge machining (EDM). Then a fatigue test was performed to propagate the crack until it reached the depth of approximately 10 mm. Picture 3 the schematics of the beam, and Picture 4 shows a microscopic image of the crack area.
Because of a low thermal emissivity of aluminium, the beam surface was coated with black paint in order to increase the emissivity and provide its uniformity. Another practical issue with thermal measurements in aluminium is its high thermal conductivity. Aluminium has a significantly higher thermal conductivity than steel or plastics which requires high framerate data acquisition in order to capture the dynamic thermal events.
Laser Thermography Testing
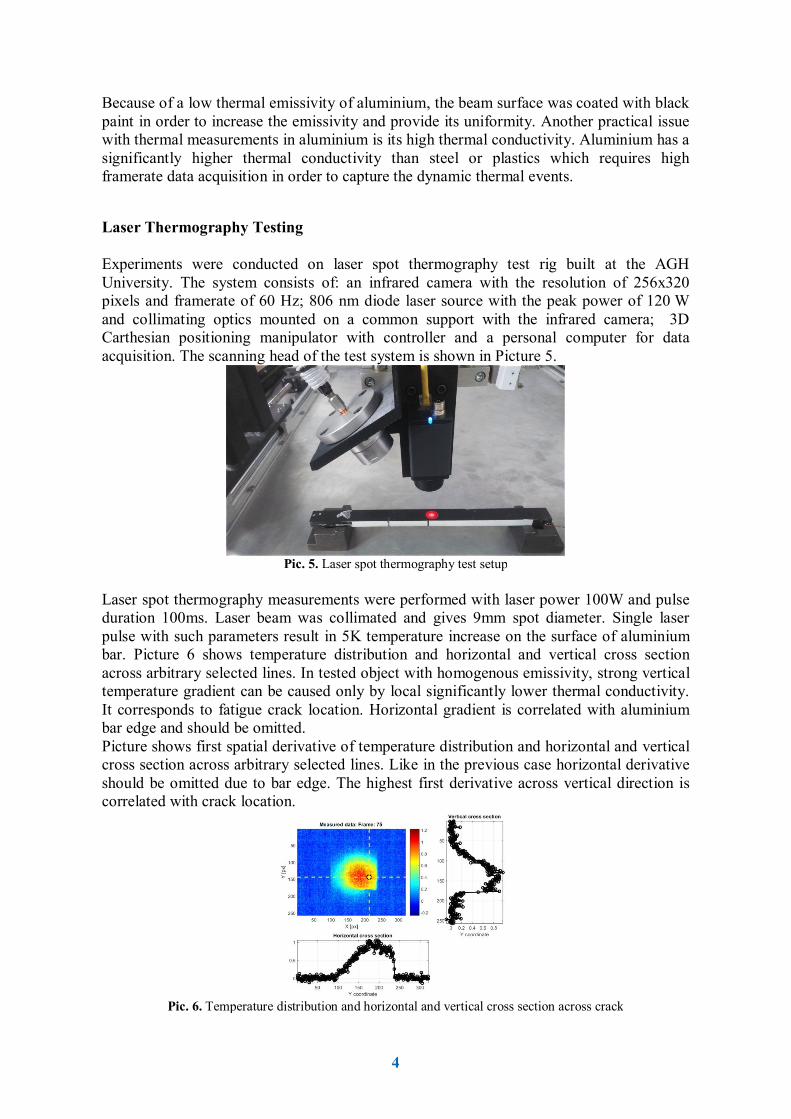
Experiments were conducted on laser spot thermography test rig built at the AGH University. The system consists of: an infrared camera with the resolution of 256x320 pixels and framerate of 60 Hz; 806 nm diode laser source with the peak power of 120 W and collimating optics mounted on a common support with the infrared camera; 3D Carthesian positioning manipulator with controller and a personal computer for data acquisition. The scanning head of the test system is shown in Picture 5.
Pic. 5. Laser spot thermography test setup
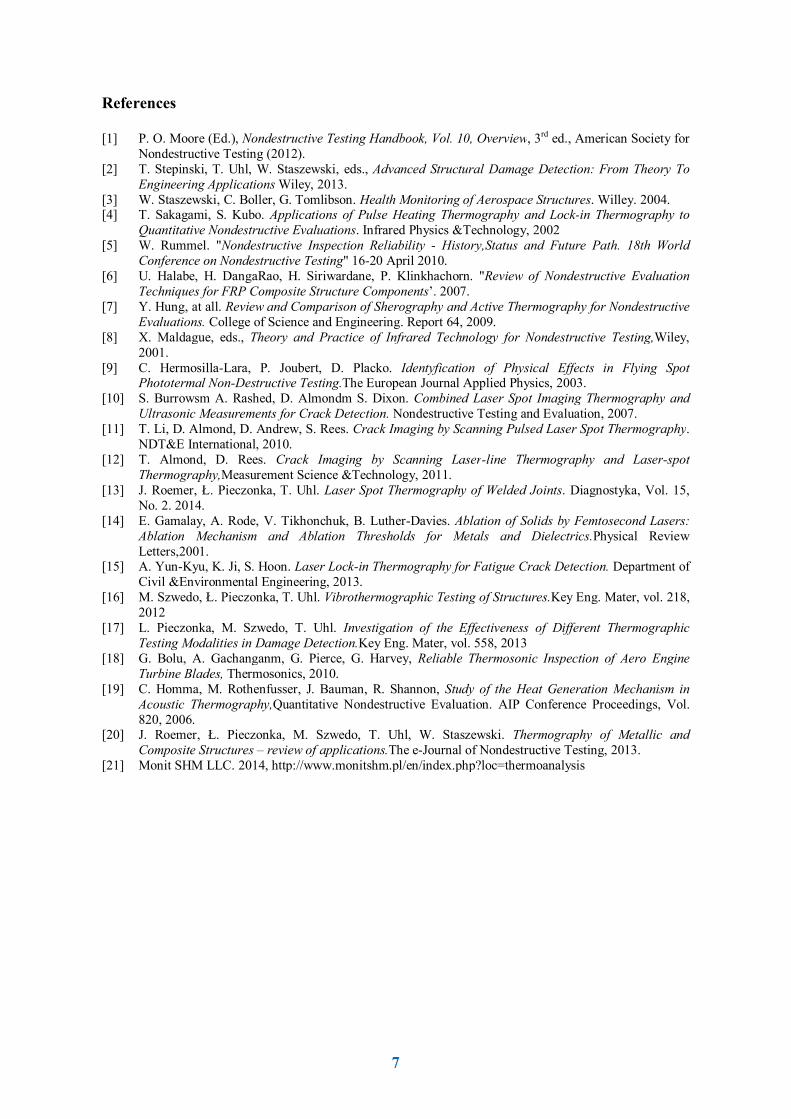
Laser spot thermography measurements were performed with laser power 100W and pulse duration 100ms. Laser beam was collimated and gives 9mm spot diameter. Single laser pulse with such parameters result in 5K temperature increase on the surface of aluminium bar. Picture 6 shows temperature distribution and horizontal and vertical cross section across arbitrary selected lines. In tested object with homogenous emissivity, strong vertical temperature gradient can be caused only by local significantly lower thermal conductivity. It corresponds to fatigue crack location. Horizontal gradient is correlated with aluminium bar edge and should be omitted. Picture shows first spatial derivative of temperature distribution and horizontal and vertical cross section across arbitrary selected lines. Like in the previous case horizontal derivative should be omitted due to bar edge. The highest first derivative across vertical direction is correlated with crack location.
Pic. 6. Temperature distribution and horizontal and vertical cross section across crack
5
Picture 8 shows time history plot for laser spot area with marked frame for which crack detection algorithm was applied. Temperature increase reaches level of 5K which is easily detectable by infrared camera. Time between heating period to completely cool down the structure is less then 1s, which is caused by relatively high thermal conductance of aluminium. Picture 9 presents the final result obtained with use of thermal image processing algorithm. Vertical line corresponds to bar edge and should be omitted for further analysis. Horizontal line position is correlated with position of fatigue crack.
Pic. 8. Temperature time graph for the point inside
the laser spot area Pic. 9. Crack (horizontal) and sample edge (vertical)
detected by automated algorithm It has been proved that fatigue cracks can be detected by laser spot thermography. Camera resolution of 256x320 pixels is sufficient due to close distance to tested object. Camera frame rate of 60Hz is sufficient. For materials with higher then aluminium thermal conductivity camera with 60Hz frame rate would be probably insufficient and cooled photon camera should be considered.
Vibrothermography Testing
Experiments were performed on a vibrothermographic test system at AGH University. The system was shown in Figure 10 and consists of: positioning press system, 35kHz ultrasonic transducer, power amplifier, 256x320 pixels with 150Hz frame rate photon infrared camera and PC computer. Vibrothermography provides global test which can revile defects hidden under whole visible by IR camera area.
Pic. 10. Vibrothermographic test setup
Measurements were performed by 35 kHz ultrasonic excitator with power stetted to 500W and for 500ms. Thermographic sequences were processed in the MONIT SHM ThermoAnalysis software package [21]. Picture 11 shows increase of temperature on the bar surface. Fatigue crack is clearly visible. The highest temperature rise is visible on the bottom of the crack which is correlated with crack closure. Picture 12 shows time evolution
6
for single point over fatigue crack. Correlation between sonic excitation and temperature increasing is clearly visible.
Pic. 11.Vibrothermographic tests results Pic. 12. Temperature time graph for defected area. Peak temperature increase was equal to 1.4
°C.
It has been verified that fatigue crack can be effectively detected by vibrothermography. Obtained accuracy is sufficient for detailed evaluation of crack depth and profile. Photonic camera with 150Hz frame rate gives sufficient time resolution.
Results and Conclusions
Picture 13 shows the comparison of laser spot thermography and vibrothermography. The left image in Picture 13 was obtained from semi-automated post processing algorithm used for laser spot thermography test results. Right image was obtained from vibrothermographic test with use of standard frame subtraction image processing algorithms. Very good agreement between both results was obtained.
Pic. 13. Laser spot thermography test setup
The paper confirms the effectiveness of two presented methods for fatigue crack detection in aluminum structures. Vibrothermography is a very effective technique with simple and robust test setup. Global nature of this method provides very short measurement time. Also this method requires only simple image processing which makes it easy to implement in various applications. Laser spot thermography is a very effective method for surface cracks detection. Noncontact nature and predispositions for automatization makes this technique very promising to apply in quality control applications. Local nature of this method makes it suitable for detection very small defect. With use of cameras with zooming and focusing lenses, laser spot thermography should be applicable for even micro-matter size defects.
7
References
[1] P. O. Moore (Ed.), Nondestructive Testing Handbook, Vol. 10, Overview, 3rd ed., American Society for Nondestructive Testing (2012).
[2] T. Stepinski, T. Uhl, W. Staszewski, eds., Advanced Structural Damage Detection: From Theory To Engineering Applications Wiley, 2013.
[3] W. Staszewski, C. Boller, G. Tomlibson. Health Monitoring of Aerospace Structures. Willey. 2004. [4] T. Sakagami, S. Kubo. Applications of Pulse Heating Thermography and Lock-in Thermography to
Quantitative Nondestructive Evaluations. Infrared Physics &Technology, 2002 [5] W. Rummel. "Nondestructive Inspection Reliability - History,Status and Future Path. 18th World
Conference on Nondestructive Testing" 16-20 April 2010. [6] U. Halabe, H. DangaRao, H. Siriwardane, P. Klinkhachorn. "Review of Nondestructive Evaluation
Techniques for FRP Composite Structure Components’. 2007. [7] Y. Hung, at all. Review and Comparison of Sherography and Active Thermography for Nondestructive
Evaluations. College of Science and Engineering. Report 64, 2009. [8] X. Maldague, eds., Theory and Practice of Infrared Technology for Nondestructive Testing,Wiley,
2001. [9] C. Hermosilla-Lara, P. Joubert, D. Placko. Identyfication of Physical Effects in Flying Spot
Phototermal Non-Destructive Testing.The European Journal Applied Physics, 2003. [10] S. Burrowsm A. Rashed, D. Almondm S. Dixon. Combined Laser Spot Imaging Thermography and
Ultrasonic Measurements for Crack Detection. Nondestructive Testing and Evaluation, 2007. [11] T. Li, D. Almond, D. Andrew, S. Rees. Crack Imaging by Scanning Pulsed Laser Spot Thermography.
NDT&E International, 2010. [12] T. Almond, D. Rees. Crack Imaging by Scanning Laser-line Thermography and Laser-spot
Thermography,Measurement Science &Technology, 2011. [13] J. Roemer, Ł. Pieczonka, T. Uhl. Laser Spot Thermography of Welded Joints. Diagnostyka, Vol. 15,
No. 2. 2014. [14] E. Gamalay, A. Rode, V. Tikhonchuk, B. Luther-Davies. Ablation of Solids by Femtosecond Lasers:
Ablation Mechanism and Ablation Thresholds for Metals and Dielectrics.Physical Review Letters,2001.
[15] A. Yun-Kyu, K. Ji, S. Hoon. Laser Lock-in Thermography for Fatigue Crack Detection. Department of Civil &Environmental Engineering, 2013.
[16] M. Szwedo, Ł. Pieczonka, T. Uhl. Vibrothermographic Testing of Structures.Key Eng. Mater, vol. 218, 2012
[17] L. Pieczonka, M. Szwedo, T. Uhl. Investigation of the Effectiveness of Different Thermographic Testing Modalities in Damage Detection.Key Eng. Mater, vol. 558, 2013
[18] G. Bolu, A. Gachanganm, G. Pierce, G. Harvey, Reliable Thermosonic Inspection of Aero Engine Turbine Blades, Thermosonics, 2010.
[19] C. Homma, M. Rothenfusser, J. Bauman, R. Shannon, Study of the Heat Generation Mechanism in Acoustic Thermography,Quantitative Nondestructive Evaluation. AIP Conference Proceedings, Vol. 820, 2006.
[20] J. Roemer, Ł. Pieczonka, M. Szwedo, T. Uhl, W. Staszewski. Thermography of Metallic and Composite Structures – review of applications.The e-Journal of Nondestructive Testing, 2013.