Page 1
Selection of the best maintenance approach in the maritime industry
under fuzzy multiple attributive group decision making environment
Contact author
Dr Iraklis Lazakis: [email protected]
Dpt of Naval Architecture, Ocean and Marine Engineering - NAOME
University of Strathclyde
Glasgow G4 0LZ, Scotland
Tel : +44 (0)141 548 3070
Co-author
Prof Aykut Olcer: [email protected]
World Maritime University (WMU)
Naval Architecture and Maritime Technology
Malmö, Sweden
Abstract
Many maintenance approaches have been developed and applied successfully in a variety of
sectors such as aviation and nuclear industries over the years. Some of those have also been
employed in the maritime industry such as condition based maintenance; however choosing
the best maintenance approach has always been a big challenge due to the involvement of
many attributes and alternatives which can be also associated with multiple experts and vague
information. In order to accommodate these aspects, and as part of an overall novel
Reliability and Criticality Based Maintenance (RCBM) strategy, an existing Fuzzy Multiple
Page 2
Attributive Group Decision Making (FMAGDM) technique is employed in this study, which
is further enhanced with the use of Analytical Hierarchy Process (AHP) to obtain a better
weighting of the maintenance attributes used. The FMAGDM technique has three distinctive
stages, namely rating, aggregation and selection in which multiple experts’ subjective
judgments are processed and aggregated to be able to arrive at a ranking for a finite number
of maintenance options. To demonstrate the applicability in a real life industrial context, the
technique is exemplified by selecting the best maintenance approach for shipboard equipment
such as the Diesel Generator (DG) system of a vessel. The results denote that preventive
maintenance is the best approach closely followed by predictive maintenance, thus steering
away from the ship corrective maintenance framework and increasing overall ship system
reliability and availability.
Keywords: Maintenance, maritime industry, Fuzzy Multiple Attributive Group Decision
Making, Analytical Hierarchy Process, Diesel Generator system
1. INTRODUCTION
While the maritime industry is responsible for the massive transportation of goods
worldwide, it is only recently that new approaches looking into the enhancement of ship’s
reliability, availability and accordingly profitability have been investigated. Ship maintenance
accounting for 20%-30% of a ship’s operational expenses, has been so far related to
downtime and financial burden in terms of unexpected ship repairs and loss of operational
availability and accordingly income. In this case, one needs to consider the implementation of
an overall maintenance strategy including a number of parameters indispensable to the
overall maintenance implementation onboard ships. These parameters are related to the
Page 3
prevailing shipping company maintenance management commitment/approach, the cost of
spare parts available onboard the ship, the company investment on novel maintenance tools
(e.g. permanent installed/hand-held condition monitoring equipment), the cost for crew
training on new maintenance shipboard applications and the overall increase in the ship
system reliability as a result of a well-maintained ship.
In this respect, a number of existing maintenance approaches implemented in various
industrial settings is initially investigated. These refer to the Terotechnology model, ILS and
LSA, BCM, AM, TPM, RBI, RBM, and RCM among others addressing maintenance in
various settings. Based on the above, by initially examining each one of these approaches, a
clear insight of the existing industrial maintenance framework is developed which can
provide the background for the creation and application of an innovative maintenance
strategy for the maritime domain, namely the RCBM approach. RCBM key features are
associated with the management characteristics of a shipping company’s operation as well as
the in-depth technical analysis of maintenance reliability and criticality aspects of ship
systems and equipment. In this respect, RCBM can employ a number of tools in order to
assess the reliability and criticality of ship systems and components. A particular one
presented in this paper is the one combining the benefits of FST and AHP in order to come up
with the best solution in a FMAGDM maintenance problem. The latter is originally described
through a given number of maintenance-related attributes leading to a number of maintenance
alternatives out of which the group of decision makers may select the best one. FST is
employed in combination with AHP as it enables the use of information, which may be vague
and imprecise to consider in the first place while AHP assists in the initial ranking of
weighting factors for a number of different attributes. AHP was first proposed by Saaty [1]
and was applied in many decision making studies in the maritime industry so far [2, 3, 4, 5, 6,
Page 4
7]. The hierarchical structure of attributes in the AHP model enables all group members of
decision making to visualize the problem systematically in terms of relevant attributes and
sub-attributes.
Having mentioned the above, the present paper demonstrates the application of a novel
approach to the multi attributive group decision making maintenance problem in the maritime
industry. Section two provides a background review regarding various maintenance
methodologies and approaches currently in place. Section three presents the novel FMAGDM
approach with the use of FST and AHP while section four shows the applicability of the
mentioned methodology in the selection of the best maintenance strategy for a DG system of
a motor cruise vessel. Verification and sensitivity analysis of the results takes place in section
four too. Finally, section five concludes the present paper with the discussion and final
remarks.
2. LITERATURE REVIEW - MAINTENANCE METHODOLOGIES
Since the beginning of a systematic approach into ship repairs and maintenance, corrective
maintenance was introduced as a first means of immediate response to ship structures and
machinery upkeep. As the name suggests, this approach refers to a ‘run-to-failure’ state of
components and ship systems. On the other hand, it does not consider the downtime
originating from unexpected failures, moreover leading to expensive repairs and loss of
productive trading time. Extending the scope of maintenance, preventive tasks were
introduced next following predefined/planned maintenance intervals according to
manufacturers’ guidelines and requirements while also reporting non-conformities and
keeping track of all maintenance and repair actions.
Page 5
In this respect, various preventive maintenance methodologies have been presented in the
past as far back as the 70s. Initially the Terotechnology model was introduced in the UK
manufacturing industry to assess the interrelation among maintenance costs, productivity and
overall profits [8]. In this context, the Terotechnology model focuses on the maintainability
concept, thus the design and operation of physical assets and products in order to improve
repair and maintenance [9]. ILS and LSA are also more of management concepts, which
include maintenance as part of their activities for improvement [10]. Mostly related to the
military sector ILS and LSA refer to complex industrial and maintenance organisations,
which on the other hand restrict them from being flexible enough to be applied in the ever-
changing environment of the maritime industry.
BCM on the other hand includes maintenance optimisation as part of the entire business
strategy [11]. BCM takes into account the business objectives for a specific
system/organisation and ways on how to maximise profitability. However, BCM may
become very extensive and complicated, thus requiring extensive use of resources including
personnel and finances. In a similar context, AM addresses a ‘better and more business
focused maintenance’ combining risk-controlled, optimised, life-cycle management of an
asset [12]. Business objectives are at the core of this approach too as shown in the PAS55 and
ISO55000 standards on the specifications for the optimised management of physical assets
[13, 14]. In this respect, although AM suggests the optimisation of the maintenance effort and
cost, it pertains to organisations with considerable financial and human resources and high
profit margins (e.g. oil and gas, power supply).
Page 6
On top of the above, TPM addresses maintenance in the context of the entire management
process [15]. TPM focuses on the increase of the Overall Equipment Effectiveness (OEE) by
minimising the ‘six big losses’ such as breakdowns, setup and adjustment time, small stops,
reduced speed, quality defects and start-up losses [16, 17]. The latter is in line with Bohoris et
al [18], which present the application of TPM in an automobile plant in UK. The difficulties
in TPM implementation i.e. the lack of multi-tasked and autonomous maintenance groups is
also discussed in Cooke [19] and Chan et al [20], who identified ‘organisational barriers’
which may impede the successful application of TPM. Moreover, the maritime operational
environment is directly influenced and linked to what Alsyouf [21] and Arca and Prado [22]
suggest about the participation and competence of the human element as an essential factor
for successful implementation of any maintenance approach. The latter could not be more
relevant in the shipping industry as it is an industrial sector formulated out of a vast number
of shipping companies operating with multinational crews.
Having in mind the above, predictive maintenance followed next as a step further into the
enhancement of the condition of a system by optimising maintenance intervals, extending
system operational life and reducing cost of repairs and maintenance. In this case, RBI and
RBM take into account the consideration of a risk element as shown in Khan et al [23] who
present a risk-based inspection and maintenance system for the oil and gas industry to
calculate the risk in the operation of onshore oil plants. Likewise, Patel [24] also discussed
the application of RBI in the onshore oil and gas industry and suggested that the actual use of
RBI lies within the inspection optimisation sequence. However, to the authors’ opinion, this
is a development, which still lacks the element of the reliability and criticality evaluation of
the system and its components.
Page 7
CBM and accordingly VBM investigate the condition based approach to the overall
maintenance characteristics of a subject system. In Tsang et al [25] the various condition
monitoring techniques are mentioned such as lube oil analysis of main and auxiliary engines,
infrared scanning of electrical equipment, performance testing of pumps and heat exchangers
and vibration monitoring of rotating machinery. As Ross [26] also states, CBM is a
maintenance approach that identifies problems before they take place as well as avoids
needless time-based replacement. However, CBM and VBM are not currently employed in
the maritime industry to a large extent as they are considered a much specialised type of
maintenance.
RCM on the other hand originates from the review of the civil aviation preventive
maintenance programme [27] through the Maintenance Steering Group handbook. Moreover,
an updated RCM version considering the maintenance impact on the environment was
presented by Moubray [28]. In terms of RCM applications, Fonseca and Knapp [29]
demonstrated the combination of RCM with a software package in the chemical process
industry while Gabbar et al [30] combined RCM with a CMMS in the case of a water-feed
process of a nuclear power plant and Rausand and Vatn [31] demonstrated an RCM
application in the railway sector. Although it is clear from the above cases that RCM is a
widely applied methodology, it may become challenging to implement in the case of complex
systems (e.g. military systems [9]). Furthermore, the company’s top management support in
the various tasks involved during RCM employment is highly required together with the need
of extensive use of resources. Moreover, RCM is only considered as part of the overall
integrated maintenance regime. It is this last remark which highlights a significant RCM
shortcoming; that is the lack of an overall maintenance management system which will be
flexible enough to suit each specific company/ship in the maritime domain. In the light of the
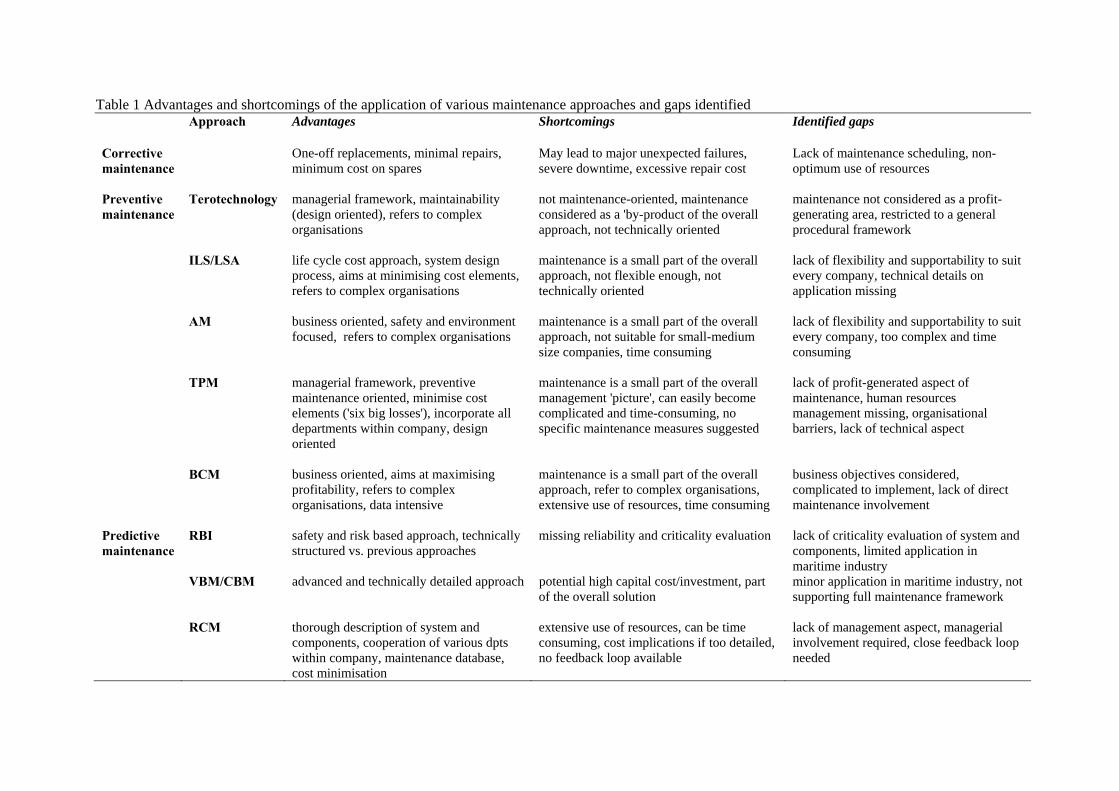
Page 8
above approaches and methodologies presented, Table 1 summarises the advantages and
shortcomings of the mentioned maintenance approaches together with the gaps identified.
These will assist further in the introduction of the novel RCBM strategy applied in the
maritime industry as shown in the next section.
Insert Table 1 here
3. METHODOLOGY
Considering the above, the novel Reliability and Criticality Based Maintenance (RCBM)
strategy eliminates the gaps, which are inherent to current maritime maintenance practices
and methodologies, by proposing a number of intrinsic features. It suggests a holistic
maintenance approach while it integrates the enhanced technical and management aspects in
the maritime context through the coordination of the current planned maintenance regime
with condition monitoring assessment, data acquisition and processing; also incorporating
reliability and criticality analysis and decision support platforms. Furthermore, RCBM
provides the framework for selecting the best maintenance approach for a specific ship or
ship system, given the knowledge about its reliability and criticality characteristics and
component functional relationships. Taking into account that the RCBM strategy has been
described in detail in Lazakis [32] at both micro [33] and macro level [34], the present paper
focuses on the application of RCBM using FMAGDM technique for selecting the best
maintenance strategy having in mind a specific ship system. The FMAGDM technique
combines FST with AHP in order to assist in the selection of the best maintenance approach
for a ship system when a group of multiple decision makers with different backgrounds,
expertise and preferences is involved.
Page 9
FST was initially introduced by Zadeh [35] in order to address the fuzziness of imprecise
answers to questions being asked. Since then, there have been various researchers updating
the original FST concept including Zimmermann [36], Chen and Hwang [37] and Ross [38]
among others. FST considers a variety of different solutions/alternatives with vague and
imprecise characteristics to choose from, while attributes can be assigned crisp or fuzzy
(linguistic) values. A broad field of applications include studies from Wang et al [39] who
address the issue of selecting the best maintenance approach for a power generation plant,
Yuniarto and Labib [40] who employ a decision making grid to prioritise maintenance
strategies for the operation of different systems. On the other hand, Carasco et al [41] suggest
that expert systems have some disadvantages such as inconsistent questions asked (input) and
subsequently wrong responses and solutions (output) suggested. In the maritime industry,
Riahi et al [42] examined the application of FST in investigating seafarers’ reliability. Olcer
and Odabasi [43] also applied FST for the selection of the best propulsion/manoeuvring
system of a passenger vessel. Moreover, Gaonkar et al studied the condition monitoring of a
ship turbine while Nwaoha et al elaborated on the risk analysis and control of a liquefied
natural gas ship [44, 45].
AHP was initially developed by Saaty in the ‘80s while a number of studies have shown its
applicability in different operational environments. In this respect Labib et al [46] developed
a model on maintenance decision making considering AHP and Fuzzy Set Theory for an
automotive plant reducing downtime considerably while Mansor et al [47] examined the
application of AHP in the manufacturing process of passenger vehicles brakes system.
Additionally, An et al [48] presented a risk management model employing fuzzy analytical
hierarchy process in the decision making regarding an application in the railways domain
Page 10
while Arslan and Turan [49] also explored the use of AHP in the case of the analytical
investigation of maritime accidents in busy and narrow shipping crossings.
The suggested FMAGDM technique (Olcer and Odabasi [43]) as part of the RCBM strategy
consists of three major parts: the rating, aggregation and finally the selection stages. It should
be noted that the chosen FMAGDM technique is improved through the use of AHP in
calculating the weights of attributes in this study. The suggested FMAGDM approach is
initiated with the setting up a specific objective under which the decision-making will take
place; that is the initial question that needs to be answered by a group of experts. This is
followed by the three distinctive stages, which form the core of the FMAGDM approach; that
is the rating, aggregation and selection stage. In the next paragraphs, each one of these stages
are described followed by the specific application with regards to the selection of the most
appropriate maintenance approach for the DG system of a given vessel. The reader is referred
to Olcer and Odabasi [43] for the details of the mathematical treatment of the FMAGDM
technique used in this research.
3.1 Rating stage
The rating stage is the first part of FMAGDM in which specific attributes, which are
originally instructed by the decision maker, as well as the specific number/group of experts
that will participate in the FMAGDM process are determined. Overall, there are two types of
attributes, which can be utilised: subjective and objective ones. The differentiation is that an
objective attribute is described with crisp (numerical) values. That is because crisp values can
be expressed in a numerical way for all experts involved (i.e. these values can be
acknowledged as common and standard values). On the other hand, whenever an attribute is
Page 11
described in a vague (fuzzy) way including experts’ subjective linguistic terms, then it is
defined as a subjective attribute. Furthermore, both attribute types mentioned above can be
also categorised according to the positive or negative linguistic value each attribute conveys.
Therefore, they can be categorised as ‘benefit’ (positive linguistic meaning) or ‘cost’
(negative linguistic meaning). An example of benefit and cost type attributes are the
‘maintenance efficiency’ attribute, which is sorted as a benefit type of attribute while
‘company investment’ is categorised as a cost type attribute (the less the better).
Following the above, each one of the attributes and the experts are assigned weighting factors
according to the relevance importance of the experts to the objective in question. When the
experts are assigned similar weighting factors, the group decision-making problem is of a
homogeneous nature while when the experts’ weighting varies, it is of a heterogeneous type.
The alternatives (or solutions) for the maintenance type to be used are also provided at this
stage. Subsequently, each expert provides an initial assessment on each alternative on the
initial objective/question relevant to the various attributes. In other terms, the expert answers
the questions deriving from the attributes of each solution (in this case maintenance type) and
assigns crisp or linguistic terms (qualitative information) to them. The specific set of
questions are provided by the facilitator of the decision making process in the first place. In
this way, the initial decision matrix for the FMAGDM selection is established.
What follows next is the transformation of the linguistic expression of the experts’ answers to
the initial fuzzy numerical expression. This is achieved by employing a set of different Scales
for transforming linguistic terms/answers to fuzzy trapezoidal numbers. The Scales used are
the ones suggested by Chen and Hwang [37], which propose a set of 8 different scales for the
transformation of the fuzzy linguistic expressions to fuzzy numerical expressions. These
Page 12
Scales vary from the simple ones using just two linguistic terms (Scale 1-‘medium’ and
‘high’ linguistic values) to the more complicated ones using 13 different linguistic terms
(Scale 8).
3.2 Aggregation and Selection stages
At this stage, all the answers given by the experts for each one of the suggested alternatives
concerning each single subjective attribute used in the previous stage are aggregated. This is
carried out in order to generate the set of fuzzy numbers for each one of the subjective
attributes for all alternatives suggested that would be used in the defuzzification sub-stage.
After finalising the aggregation stage of the FMAGDM process, the selection stage is
introduced next. This is compiled by two separate sub-stages: the defuzzification and
eventually the selection of the best alternative sub-stage, which are described in the following
section.
The first step in the selection stage is the defuzzification. This is performed so as to transform
the aggregated fuzzy trapezoidal numbers into crisp numbers, which can be then used in the
final selection stage of the best alternative available. In order to carry out the above, the fuzzy
scoring method is employed as described in Chen and Hwang [37].
In this way, the defuzzification stage is now concluded, enabling the transmission to the next
step of the selection stage of the FMAGDM approach, which is the ranking sub-stage. In this
case, the TOPSIS method is used in the present study as shown next.
Page 13
3.3 Ranking by using TOPSIS method
The most powerful and widely applicable is the Technique Ordered Preference by Similarity
to Ideal Solution (TOPSIS) method [50, 51]. TOPSIS applicability is based on the ranking of
each suggested alternative according to how close these are to an imaginary ideal positive
solution and at the same time how far from an imaginary ideal negative solution.
Subsequently, the alternative that is closer (or more similar) to the ideal positive solution and
further from (or not similar to) the ideal negative solution is the one ranked higher than the
other solutions and accordingly is the best one for the decision maker to choose.
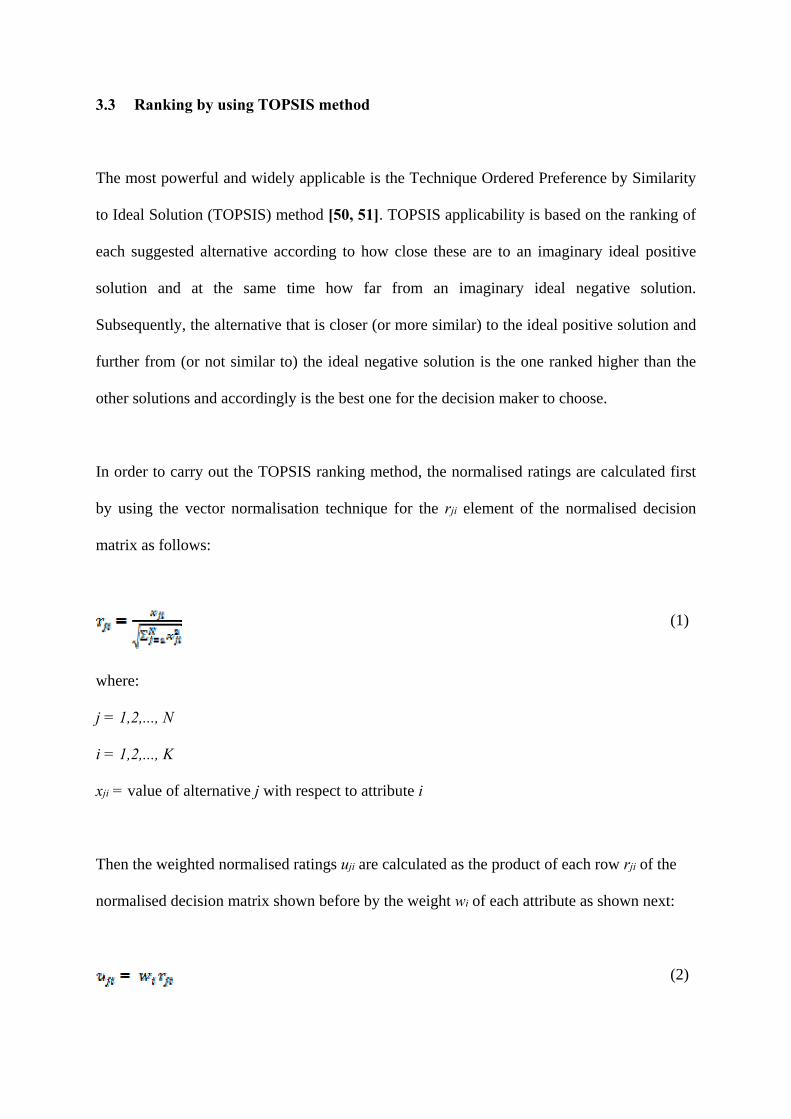
In order to carry out the TOPSIS ranking method, the normalised ratings are calculated first
by using the vector normalisation technique for the rji element of the normalised decision
matrix as follows:
(1)
where:
j = 1,2,..., N
i = 1,2,..., K
xji = value of alternative j with respect to attribute i
Then the weighted normalised ratings uji are calculated as the product of each row rji of the
normalised decision matrix shown before by the weight wi of each attribute as shown next:
(2)
Page 14
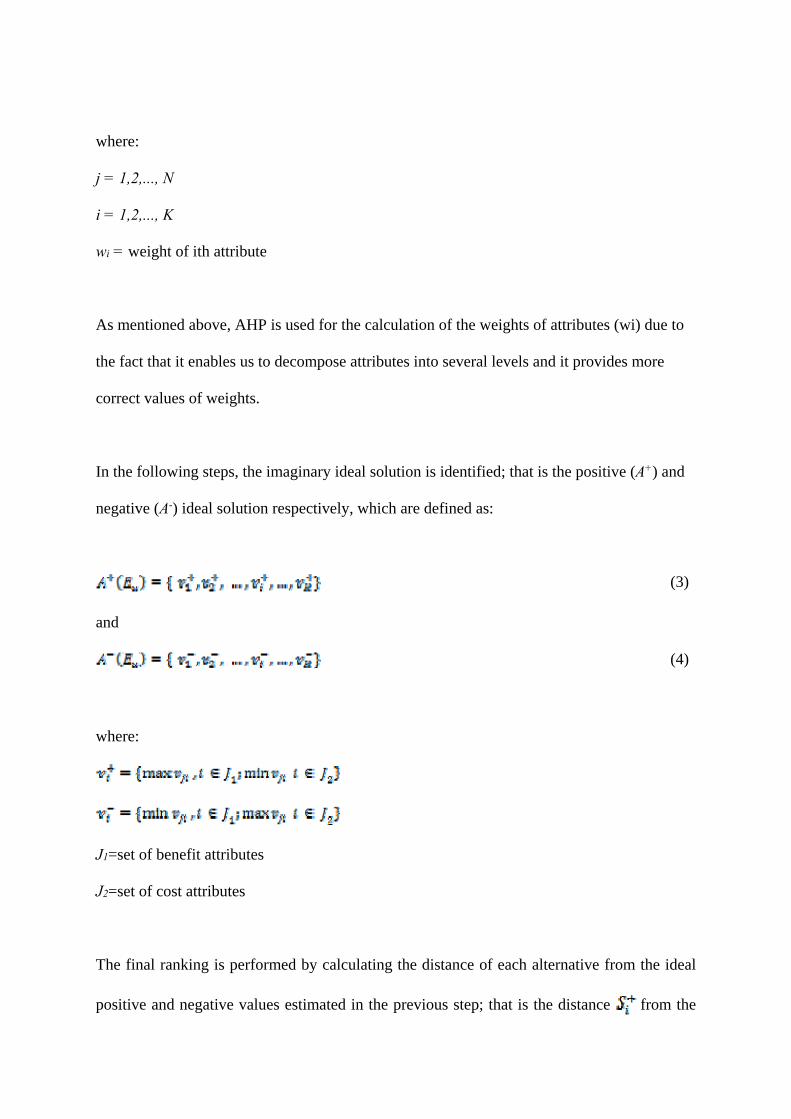
where:
j = 1,2,..., N
i = 1,2,..., K
wi = weight of ith attribute
As mentioned above, AHP is used for the calculation of the weights of attributes (wi) due to
the fact that it enables us to decompose attributes into several levels and it provides more
correct values of weights.
In the following steps, the imaginary ideal solution is identified; that is the positive (A+) and
negative (A-) ideal solution respectively, which are defined as:
(3)
and
(4)
where:
J1=set of benefit attributes
J2=set of cost attributes
The final ranking is performed by calculating the distance of each alternative from the ideal
positive and negative values estimated in the previous step; that is the distance from the
Page 15
positive ideal value and the distance from the negative ideal value. This is performed by
using the following formulas:
(5)
(6)
where:
j = 1, 2, ..., N
Finally, the overall distance (or similarity) of each alternative Aj from the positive ideal
solution is estimated as:
(7)
where:
; j = 1, 2, ..., N
Ultimately, the best-ranked alternative is the one with the maximum . In this case, if is
close to one, then the alternative Aj is considered as ideal. On the contrary, if it is closed to
zero, it is considered as non-ideal.
4. CASE STUDY: DIESEL GENERATOR SYSTEM MAINTENANCE OF A
MOTOR SAILING CRUISE VESSEL
Page 16
In any kind of FMAGDM problem, such as the selection of the best maintenance approach
for the DG system of a motor sailing cruise vessel, decision makers need to take into account
attributes which may be described with numerical/crisp answers, and also include answers
expressed in linguistic terms. As seen through the literature review presented before as well
as to the best of the authors’ knowledge, there is no such application yet in the maintenance
field of the maritime industry [33, 34]; that is where the novelty of this approach originates.
Moreover, the suggested FMAGDM technique considers parameters such as the effectiveness
of the maintenance, the crew training, the top management commitment and other attributes,
which are inherently vague and thus not easily quantified. The application of FMAGDM
selection of the maintenance type is initiated with the rating, aggregation and selection stage.
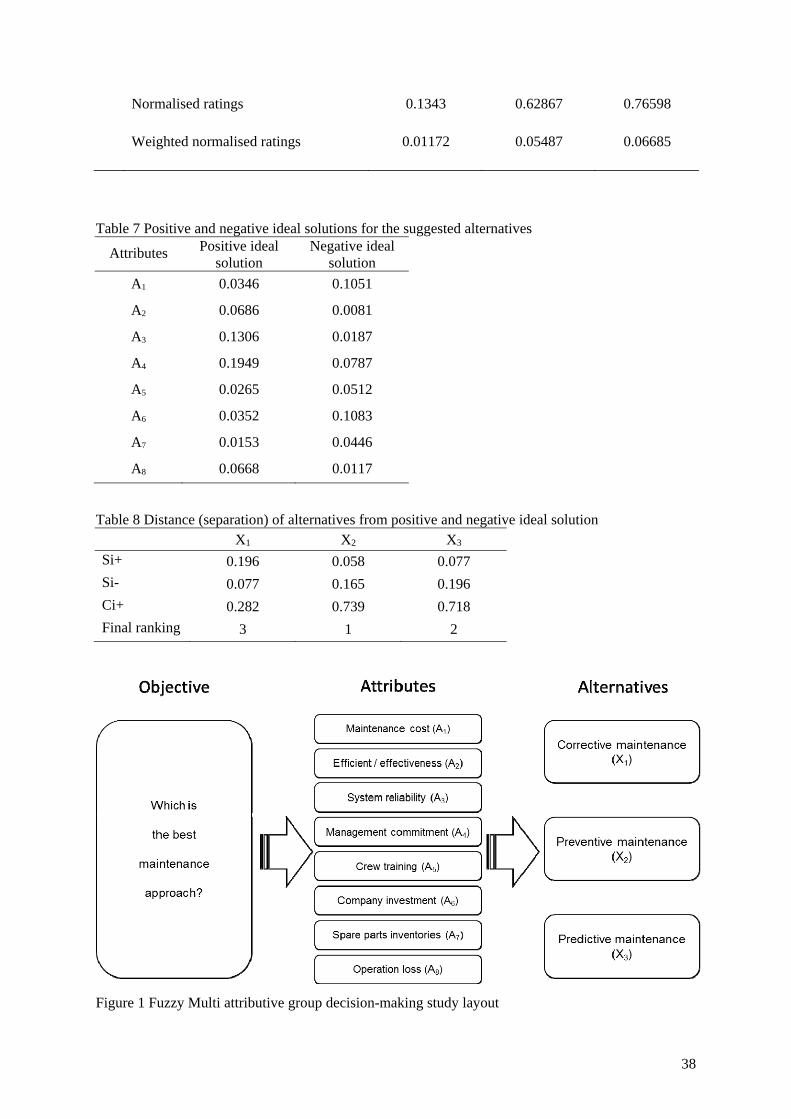
In this respect, a brief summarised description of the formulated maintenance question along
with the attributes involved and the various maintenance alternatives available is shown in
Figure 1.
Insert Figure 1 here
As is shown, the objective of the FMAGDM problem is to select the best maintenance
approach for the DG system of a vessel. There are three alternatives suggested for the subject
objective as shown in the literature review section. These refer to the three different
maintenance approaches, namely corrective (X1), preventive (X2) and predictive (X3)
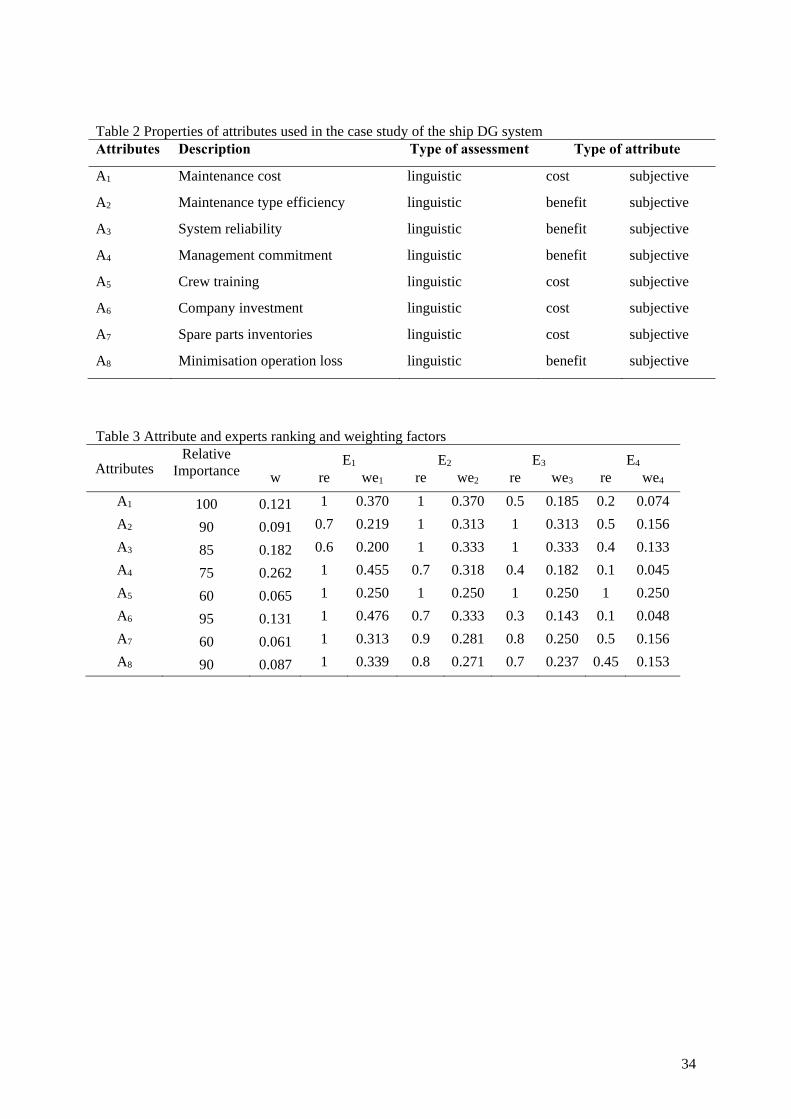
maintenance. These are examined regarding eight different attributes (A1 - A8). In more detail
(Table 2):
1. Maintenance cost in case of implementation of the specific maintenance approach
(A1). In this case, maintenance cost refers to the overall cost when comparing the
various maintenance alternatives
Page 17
2. Maintenance type efficiency (A2). This attribute considers how efficient is each
maintenance alternative
3. Increase in the system reliability after implementation of the maintenance approach
(A3). The growth in the system reliability is taken into account with this attribute (this
is related to the effectiveness of the attribute)
4. Top management commitment towards implementation of each of the maintenance
types (A4). With this attribute the engagement of the high-level managerial team in
order to support the maintenance effort
5. Crew training cost involved in each maintenance type (A5). This attribute highlights
the potential crew training needed in order to get specialised knowledge in the use of
equipment for carrying out the maintenance tasks (e.g. condition monitoring)
6. Company investment cost regarding each maintenance approach (A6). Discusses the
initial company capital cost that needs to be tied-up in additional equipment in order
to perform the selected maintenance approach
7. Spare parts inventories (A7). Refers to the spare parts that need to be available
beforehand in order to carry out the maintenance alternative
8. Minimisation of the operation loss that may occur (A8). The last attribute considers
the extent of the operation loss that may occur in the case that a specific maintenance
alternative/approach is selected
Insert Table 2 here
In this case, all the attributes are described in linguistic terms. Furthermore, the attributes are
categorised according to their contribution in the problem objective that is whether they have
a benefit or cost impact on it. The last column of Table 2 signifies the subjective or objective
Page 18
nature of the attribute. In this case, all the attributes are of subjective type, meaning that all
the initial rankings are provided based on the experts’ subjective view. After having
presented the alternatives as well as the related attributes for the FMAGDM maintenance
problem, the specific steps followed in order to achieve the selection of the most appropriate
maintenance type are explicitly shown in the next sections.
4.1 Rating stage
As described above, the rating stage of the different alternatives per attribute and expert
involved in the FMAGDM problem is demonstrated in this section. Initially, each alternative
is allocated a relative importance factor (RI) concerning the importance that each alternative
conveys in the decision-making procedure. In this respect, the highest/most important
attribute is given a factor of 100, while the rest of the attributes are compared with the highest
one and are assigned lower weighting factors. Following the above, each attribute is assigned
a separate weighting factor wi with 0 < wi < 1 as mentioned in the methodology section. The
initial allocation of the mentioned factors is carried out by the selected group of experts,
whose opinion is requested in the first place.
In terms of the group of experts participating in the FMAGDM, they originate from different
levels of the maritime industry and accordingly each expert’s operational experience and
expertise on the subject matter of maintenance approach selection has been considered. More
specifically, the experts who participate and provide the performance ratings of the
maintenance solutions with regards to the specific attributes are the technical manager of a
shipping company (E1), a superintendent engineer (E2), a 2nd engineering officer (E3) and a
3rd engineering officer (E4). In this case, the AHP method is employed in order to provide the
Page 19
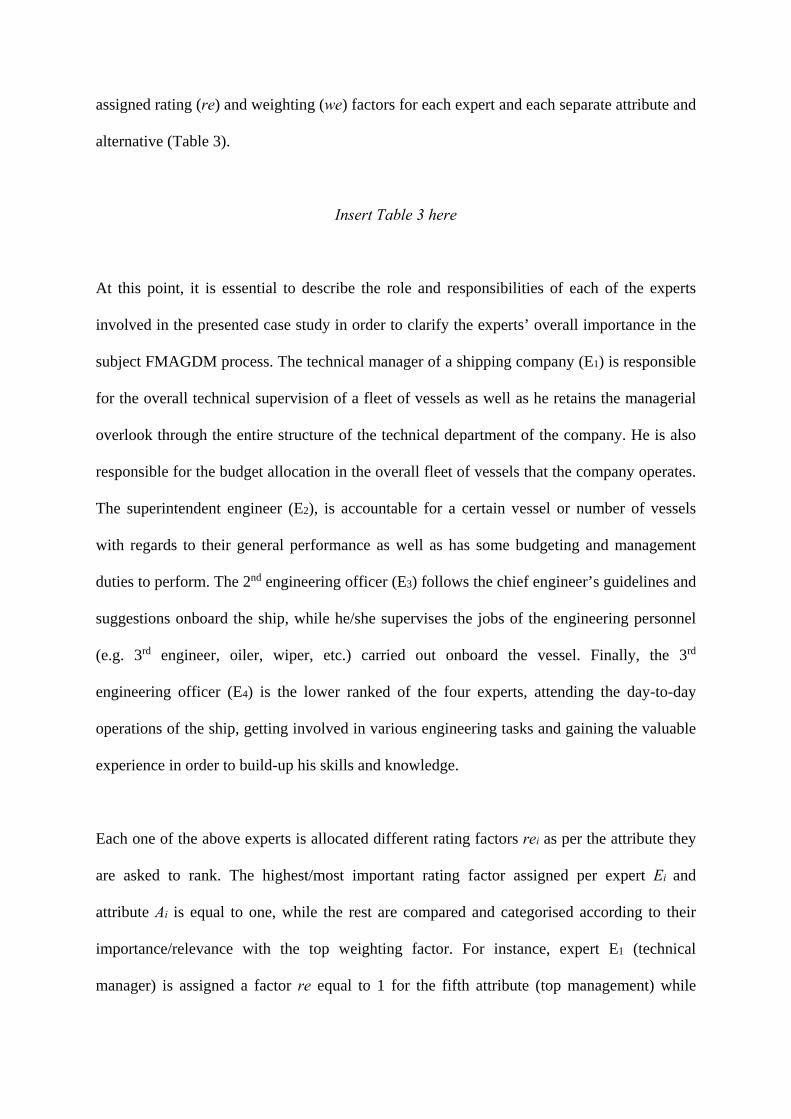
assigned rating (re) and weighting (we) factors for each expert and each separate attribute and
alternative (Table 3).
Insert Table 3 here
At this point, it is essential to describe the role and responsibilities of each of the experts
involved in the presented case study in order to clarify the experts’ overall importance in the
subject FMAGDM process. The technical manager of a shipping company (E1) is responsible
for the overall technical supervision of a fleet of vessels as well as he retains the managerial
overlook through the entire structure of the technical department of the company. He is also
responsible for the budget allocation in the overall fleet of vessels that the company operates.
The superintendent engineer (E2), is accountable for a certain vessel or number of vessels
with regards to their general performance as well as has some budgeting and management
duties to perform. The 2nd engineering officer (E3) follows the chief engineer’s guidelines and
suggestions onboard the ship, while he/she supervises the jobs of the engineering personnel
(e.g. 3rd engineer, oiler, wiper, etc.) carried out onboard the vessel. Finally, the 3rd
engineering officer (E4) is the lower ranked of the four experts, attending the day-to-day
operations of the ship, getting involved in various engineering tasks and gaining the valuable
experience in order to build-up his skills and knowledge.
Each one of the above experts is allocated different rating factors rei as per the attribute they
are asked to rank. The highest/most important rating factor assigned per expert Ei and
attribute Ai is equal to one, while the rest are compared and categorised according to their
importance/relevance with the top weighting factor. For instance, expert E1 (technical
manager) is assigned a factor re equal to 1 for the fifth attribute (top management) while
Page 20
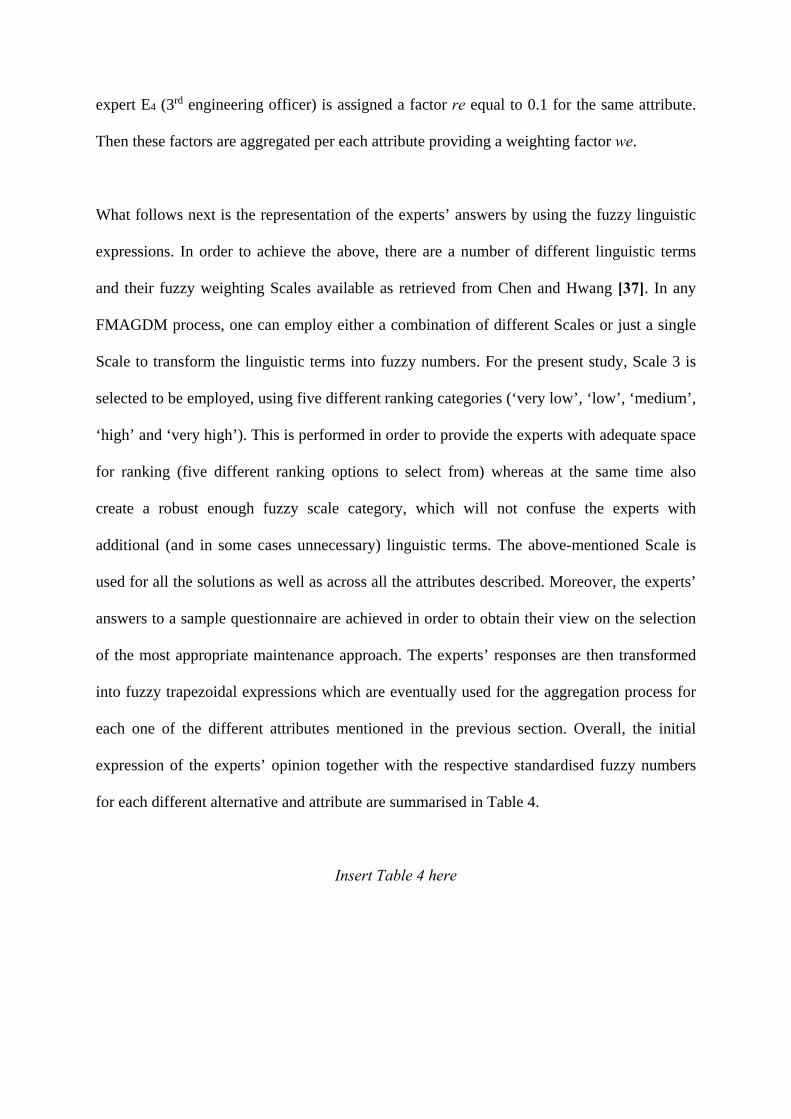
expert E4 (3rd engineering officer) is assigned a factor re equal to 0.1 for the same attribute.
Then these factors are aggregated per each attribute providing a weighting factor we.
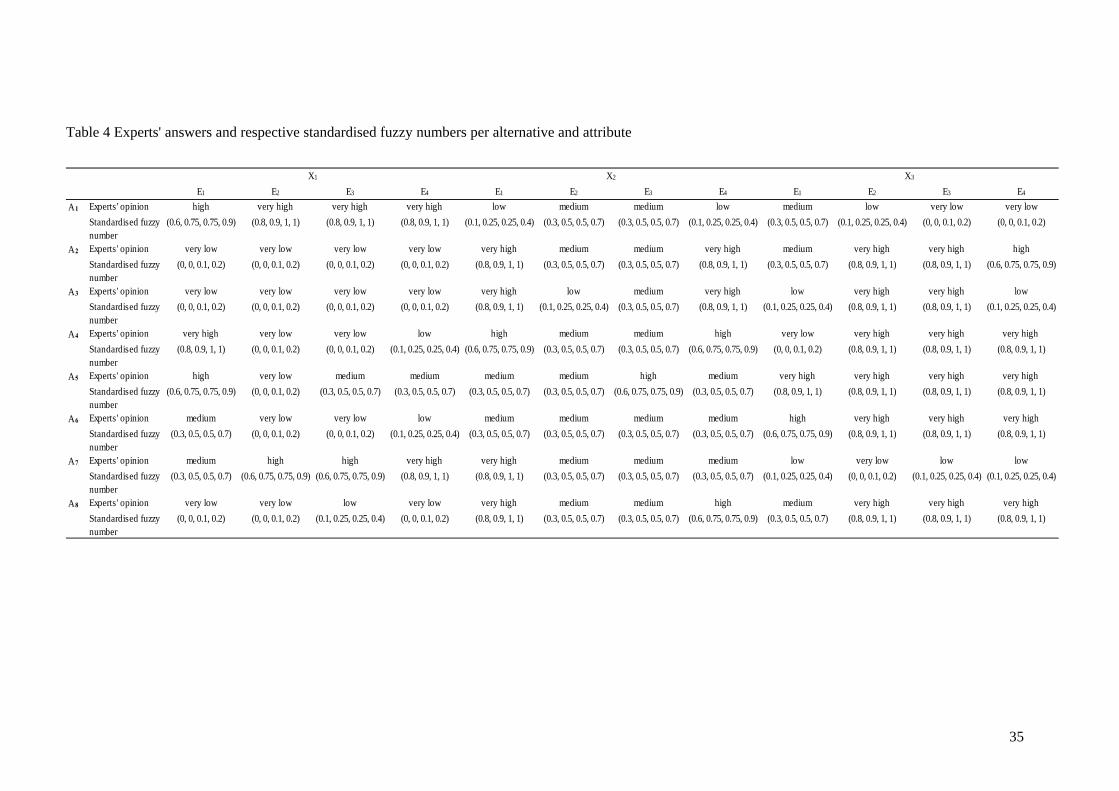
What follows next is the representation of the experts’ answers by using the fuzzy linguistic
expressions. In order to achieve the above, there are a number of different linguistic terms
and their fuzzy weighting Scales available as retrieved from Chen and Hwang [37]. In any
FMAGDM process, one can employ either a combination of different Scales or just a single
Scale to transform the linguistic terms into fuzzy numbers. For the present study, Scale 3 is
selected to be employed, using five different ranking categories (‘very low’, ‘low’, ‘medium’,
‘high’ and ‘very high’). This is performed in order to provide the experts with adequate space
for ranking (five different ranking options to select from) whereas at the same time also
create a robust enough fuzzy scale category, which will not confuse the experts with
additional (and in some cases unnecessary) linguistic terms. The above-mentioned Scale is
used for all the solutions as well as across all the attributes described. Moreover, the experts’
answers to a sample questionnaire are achieved in order to obtain their view on the selection
of the most appropriate maintenance approach. The experts’ responses are then transformed
into fuzzy trapezoidal expressions which are eventually used for the aggregation process for
each one of the different attributes mentioned in the previous section. Overall, the initial
expression of the experts’ opinion together with the respective standardised fuzzy numbers
for each different alternative and attribute are summarised in Table 4.
Insert Table 4 here
Page 21
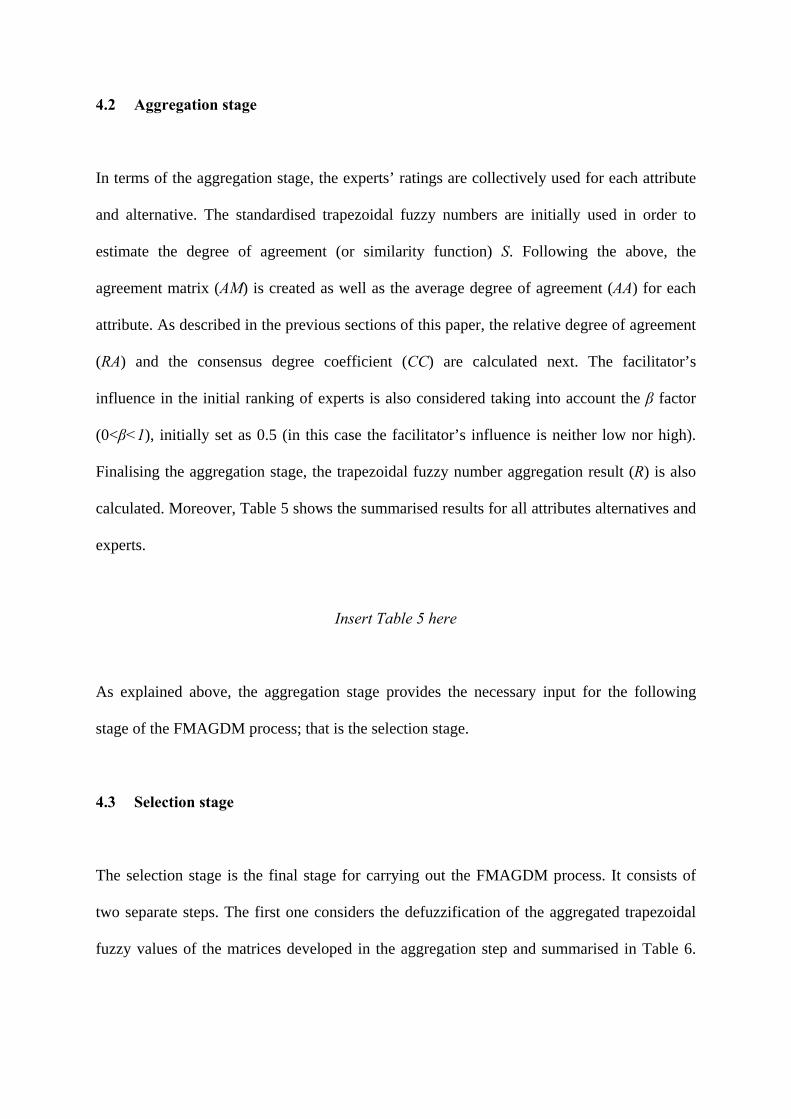
4.2 Aggregation stage
In terms of the aggregation stage, the experts’ ratings are collectively used for each attribute
and alternative. The standardised trapezoidal fuzzy numbers are initially used in order to
estimate the degree of agreement (or similarity function) S. Following the above, the
agreement matrix (AM) is created as well as the average degree of agreement (AA) for each
attribute. As described in the previous sections of this paper, the relative degree of agreement
(RA) and the consensus degree coefficient (CC) are calculated next. The facilitator’s
influence in the initial ranking of experts is also considered taking into account the β factor
(0<β<1), initially set as 0.5 (in this case the facilitator’s influence is neither low nor high).
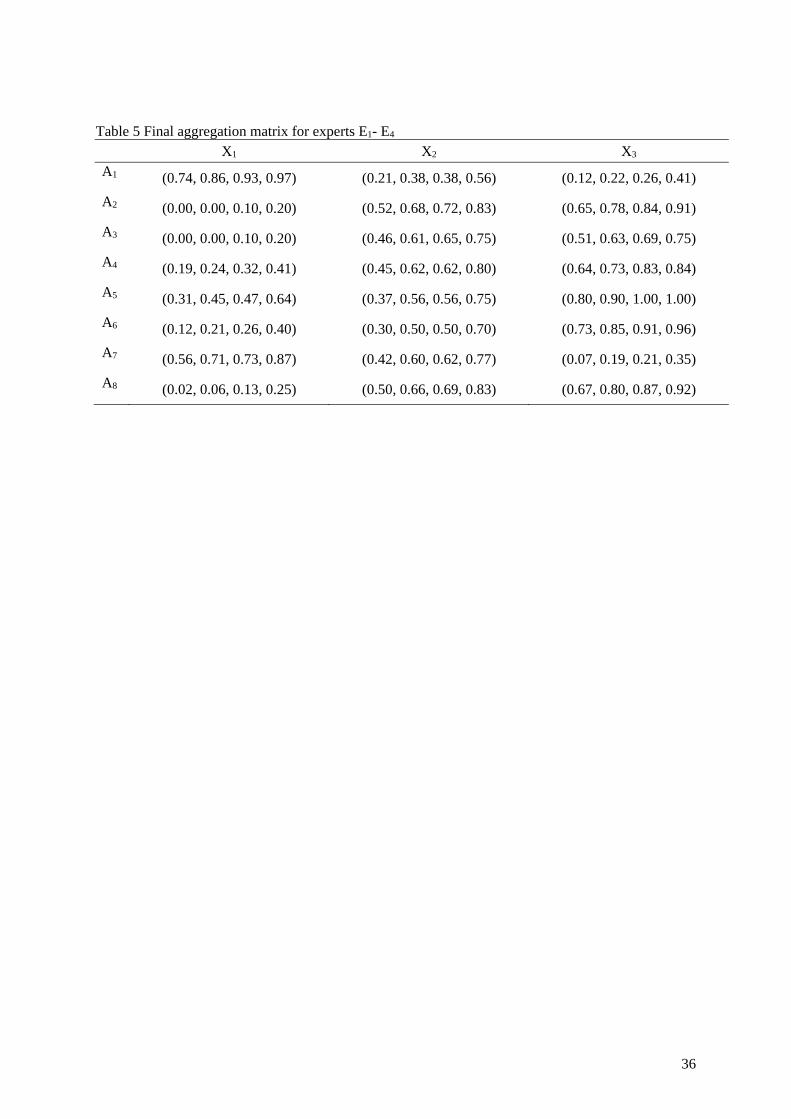
Finalising the aggregation stage, the trapezoidal fuzzy number aggregation result (R) is also
calculated. Moreover, Table 5 shows the summarised results for all attributes alternatives and
experts.
Insert Table 5 here
As explained above, the aggregation stage provides the necessary input for the following
stage of the FMAGDM process; that is the selection stage.
4.3 Selection stage
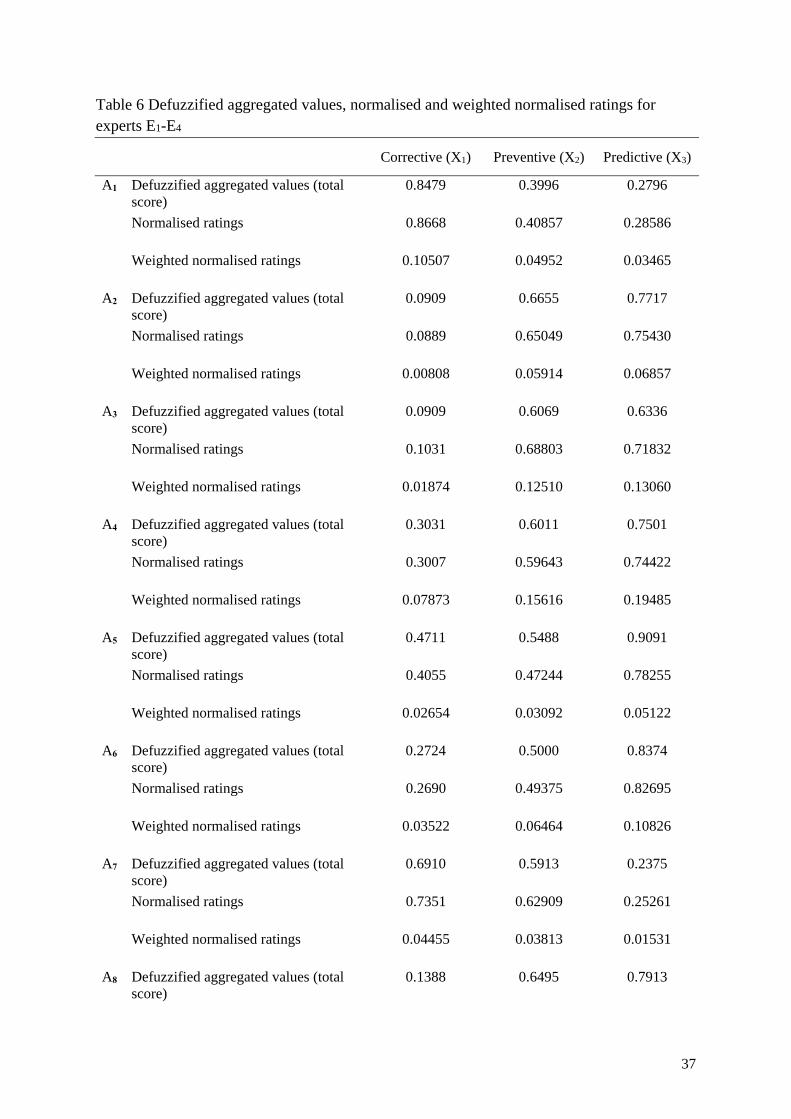
The selection stage is the final stage for carrying out the FMAGDM process. It consists of
two separate steps. The first one considers the defuzzification of the aggregated trapezoidal
fuzzy values of the matrices developed in the aggregation step and summarised in Table 6.
Page 22
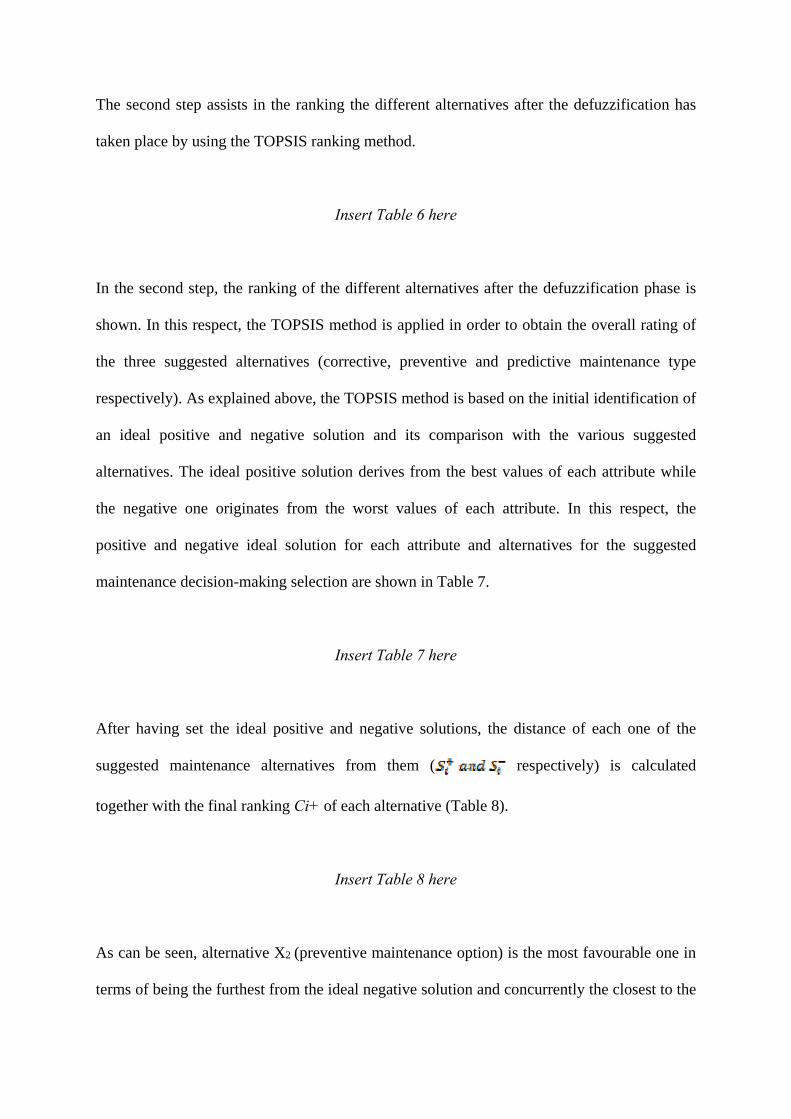
The second step assists in the ranking the different alternatives after the defuzzification has
taken place by using the TOPSIS ranking method.
Insert Table 6 here
In the second step, the ranking of the different alternatives after the defuzzification phase is
shown. In this respect, the TOPSIS method is applied in order to obtain the overall rating of
the three suggested alternatives (corrective, preventive and predictive maintenance type
respectively). As explained above, the TOPSIS method is based on the initial identification of
an ideal positive and negative solution and its comparison with the various suggested
alternatives. The ideal positive solution derives from the best values of each attribute while
the negative one originates from the worst values of each attribute. In this respect, the
positive and negative ideal solution for each attribute and alternatives for the suggested
maintenance decision-making selection are shown in Table 7.
Insert Table 7 here
After having set the ideal positive and negative solutions, the distance of each one of the
suggested maintenance alternatives from them ( respectively) is calculated
together with the final ranking Ci+ of each alternative (Table 8).
Insert Table 8 here
As can be seen, alternative X2 (preventive maintenance option) is the most favourable one in
terms of being the furthest from the ideal negative solution and concurrently the closest to the
Page 23
ideal positive solution, while its overall Ci+ ranking is the highest of all three alternatives. On
the other hand, the predictive maintenance approach (X3) of the DG system of the motor
sailing cruise ship is ranked in the second place overall, although very close to the first
alternative X2. The latter observation denotes that predictive maintenance has gained
momentum over the last few years, clearly approaching a state at which it will be preferred
type of maintenance to be implemented in the next few years as the overall mind-set of the
maritime industry is changing, being able to see the obvious benefits of applying predictive
maintenance in the long term. Moreover, the corrective maintenance approach (X1) is clearly
ranked as the third preferred option, showing that ship operators have started steering away
from this type of maintenance and moving to a predictive approach. The above results are
clearly evident especially in the case of cruise ships, in which unexpected machinery system
breakdowns lead not only to operational loss and additional repair expenditure but also and
most importantly to depraved ship operator reputation.
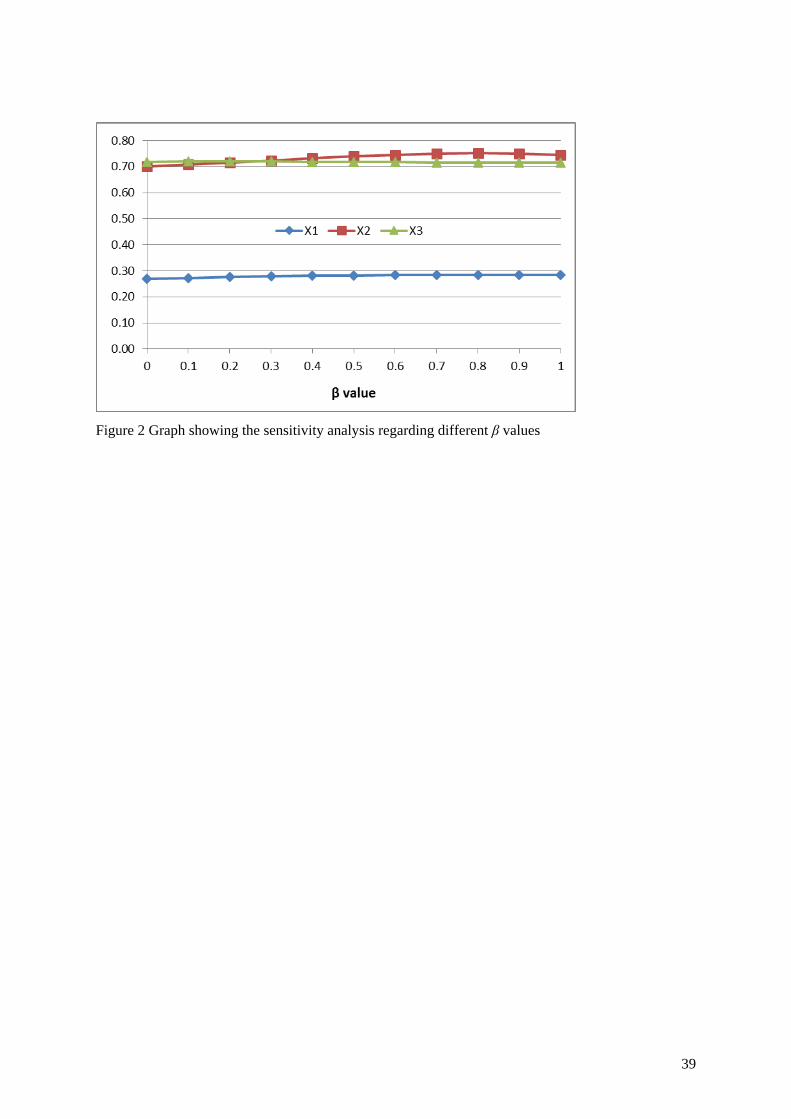
4.4 Sensitivity analysis
Moreover, in order to observe the facilitator’ influence in the FMAGDM process, a
sensitivity analysis is performed regarding the β values. It is reminded that the β values
reflect the facilitator’s influence in the entire FMAGDM process. A β value of zero denotes
that there is no influence in the process while a β value of one denotes that the facilitator’s
choice on the initial weighting factors attributed to the experts is of major importance. In this
respect, the range of the β values together with the ranking results for the three suggested
alternatives is shown in Figure 2.
Insert Figure 2 here
Page 24
As can be seen, the overall ranking of the decision making approach does not change as the β
values increase from zero to one. More specifically, corrective maintenance (X1) is still
considered as the least favourable option compared to preventive (X2) and predictive (X3)
ones. Moreover, although the predictive maintenance approach is ranked slightly higher than
the preventive one for the lower β values (0-0.3), preventive maintenance is the most
preferred one for the rest of the β values. This shows that the facilitator’s influence in the
entire process is of some degree, although demonstrating that the group of experts consider
that the maritime maintenance regime should clearly steer away from the predominant
corrective maintenance approach implemented so far.
5. CONCLUSIONS
In this paper, an existing FMAGDM approach based on the employment of FST and AHP
was presented. This approach has been used as part of the novel RCBM framework. In this
respect, a thorough review on the various maintenance methodologies was performed
highlighting the advantages, shortcomings and gaps identified of the existing maintenance
regime. Furthermore, a case study of the selection of the best maintenance method for the DG
system of a motor sailing cruise vessel was developed employing attributes such as the actual
cost of the maintenance approach, its degree of efficiency as well as the increment in the
system’s reliability were employed. Additionally, attributes including the top management
commitment, company investment, crew training cost, the cost of spare parts inventories and
the reduction of the operational loss were also considered. AHP was also implemented in
order to initially assist with the use of the attribute weighting factors w when considering the
multi attributive decision making process. All the above attributes were examined when
Page 25
implementing three different maintenance approaches, namely corrective, preventive and
predictive ones. By using the three distinctive stages of rating, aggregation and selection,
FMAGDM enabled the group of decision makers to establish the best maintenance approach;
that is, the preventive one, which was closely followed by predictive maintenance showing
the change of attitude in the use of maintenance in the maritime industry.
Considering the above, the present study showed that decision making can be improved by
combining the benefits of FST and AHP in order to avoid vagueness of information related to
the mentioned maintenance objective. Linguistic terms can be employed, rated, aggregated
and ranked in order to enhance the description of the fuzzy nature of some of the attributes in
question. The methodological framework presented herein also demonstrated that complex
maintenance problems in the maritime industry could be addressed successfully, enabling the
decision makers to make timely cost-effective decisions.
Moreover, a further enhancement of the suggested FMAGDM process would include the
development of a larger group of experts with supplementary personnel from both the
onshore (e.g. operation’s manager) and onboard (e.g. chief engineer, cadets) environment.
Crisp values for some of the attributes may be also used (e.g. cost elements for crew training,
initial company investment, cost of spare parts). In the same manner, additional alternatives
can be included in order to enhance the novel methodology presented herein by introducing
different types of preventive (e.g. general overhauling and single repair) and predictive (e.g.
continuous and interval condition monitoring) maintenance.
Page 26
REFERENCES
1. Saaty, T.L. The analytic hierarchy process. 1980 New York: McGraw-Hill
2. Ding, J.F., Tseng, W.-J., and Hsu, F.-T. An evaluation of key risk factors affecting
shipping market operations across the Taiwan Strait for liner carriers, Proceedings of the
Institution of Mechanical Engineers, Part M: Journal of Engineering for the Maritime
Environment, 2014, 228(3), 302-311.
3. Prabhu Gaonkar, R.S., Xie, M. and Majumdar, I. Reference ship selection for the on-
time performance benchmarking of ships, Proceedings of the Institution of Mechanical
Engineers, Part M: Journal of Engineering for the Maritime Environment, 2013, 227(1),
39-50.
4. Riahi, R., Li, K., Robertson, I., Jenkinson, I., Bonsall, S. and Wang, J. A proposed
decision-making model for evaluating a container’s security score. Proceedings of the
Institution of Mechanical Engineers, Part M: Journal of Engineering for the Maritime
Environment, 2014, 228(1), 81-104.
5. Prabhu Gaonkar, R.S., Xie, M., Habibullah, M.S. and Verma, A.K. Comparative
studies of multi-criteria decision making with application to condition monitoring of a
ship turbine, Proceedings of the Institution of Mechanical Engineers, Part M: Journal of
Engineering for the Maritime Environment, 2011, 225(2), 149-160.
6. Boulougouris, E.K., Papanikolaou, A.D. and Pavlou, A. Energy efficiency parametric
design tool in the framework of holistic ship design optimization, Proceedings of the
Institution of Mechanical Engineers, Part M: Journal of Engineering for the Maritime
Environment, 2011, 225(3), 242-260.
7. Theotokatos, G. and Livanos, G. Techno-economical analysis of single pressure
exhaust gas waste heat recovery systems in marine propulsion plants, Proceedings of the
Page 27
Institution of Mechanical Engineers, Part M: Journal of Engineering for the Maritime
Environment, 2013, 227(2) 83-97.
8. BS/ISO 3811. Glossary of Terms used in Terotechnology. 1993, Common BSI/ISO
standard, London
9. UK MoD. Using Reliability Centred Maintenance to Manage Engineering Failures Part
3. Guidance on the Application of Reliability Centred Maintenance. 2006, Defence
Standard 00-45, London
10. Blanchard, B.S. Logistics Engineering and Management 1992, Prentice-Hall,
Englewood Cliffs, NJ
11. Kelly, A. Maintenance planning and control. 1984 Cambridge, UK: Butterworth & Co
12. Rodriguez, V. and Woodhouse, J. PDVSA: an implementation story of risk-based asset
management, 2003, PDVSA & The Woodhouse Partnership Ltd.
13. BSI. PAS 55-2-Asset management Part 2: Guidelines for the application of PAS 55-1.
2008, London
14. ISO 55000. ISO 55000 Standard for Asset Management, 2013,
http://www.assetmanagementstandards.com/ [07/12/2013]
15. Nakajima, S. Introduction to Total Productive Maintenance. 1988 Cambridge, USA:
Productivity Press Inc
16. Ahuja, I.P.S and Khamba, J.S. Total productive maintenance: literature review and
directions. International Journal of Quality & Reliability Management, 2008, 25(7), 709-
756
17. Shamsuddin, A., Masjuki, H.j.H. and Zahari, T. TPM can go beyond maintenance:
excerpt from a case implementation. Journal of Quality in Maintenance Engineering,
2005, 11(1):19-42
Page 28
18. Bohoris, G.A., Vamvalis C, Tracey W, Ignatiadou K. TPM implementation in Land-
Rover with the assistance of a CMMS. Journal of Quality in Maintenance Engineering,
1995, 1(4), 3-16
19. Cooke, F.L. Implementing TPM in plant maintenance: some organisational barriers.
International Journal of Quality and Reliability Management, 2000, 17(9), 1003-1016
20. Chan, F.T.S., Lau, H.C.W., Ip, R.W.L., Chan, H.K. and Kong, S. Implementation of
Total Productive Maintenance: a case study. International Journal of Production
Economics, 2005, 95, 71-94
21. Alsyouf, I. Maintenance practices in Swedish industries: survey results. International
journal of Production Economics 2009, 121, 212-223
22. Arca, J. and Prado, J.C. Personnel participation as a key factor for success in
maintenance program implementation: A case study. International Journal of
Productivity and Performance Management, 2008, 57(3), 247-258
23. Khan, F.I., Sadiq, R. and Haddara, M.M. Risk-based inspection and maintenance
(RBIM)-Multi attribute decision making with aggregative risk analysis. Institution of
Chemical Engineers, Transactions of the Institution of Chemical Engineers, Part B:
Process Safety and Environmental Protection, 2004, 82(B6), 398–411
24. Patel, R.J. Risk Based Inspection. 3rd MENDT - Middle East Non-destructive Testing
Conference & Exhibition, Bahrain, 27-30 November 2005
25. Tsang, A.H.C., Yeung, W.K., Jardine, A.K.S. and Leung, B.P.K. Data management
for CBM Optimization. Journal of Quality in Maintenance Engineering, 2006, 12(1), 37-
51.
26. Ross, J.M. Condition based maintenance-a tool for improving productivity in shipyards.
Journal of ship production, 2002, 18(3), 175-184
Page 29
27. ATA. Maintenance evaluation and programme development: 737 maintenance steering
group handbook (MSG 1) 1968, Washington, USA
28. Moubray, J. Reliability-Centred Maintenance II. 1991. Oxford: Butterworth-Heinemann
Ltd
29. Fonseca, D.J. and Knapp, G.M. An expert system for reliability centered maintenance
in the chemical industry. Expert Systems with Applications, 2000, 19, 45–57
30. Gabbar, H.A, Yamashita, H., Suzuki, K. and Shimada, Y. Computer-aided RCM-
based plant maintenance management system. Robotics and Computer Integrated
Manufacturing, 2003, 19, 449-458
31. Rausand, M. and Vatn, J. Reliability Centred Maintenance. In: Complex System
Maintenance Handbook 2008, pp. 79-108, Kobbacy KAH and Murthy DNP (eds),
London: Springer-Verlag
32. Lazakis, I. Establishing an innovative and integrated reliability and criticality based
maintenance strategy for the maritime industry. 2011. PhD thesis, Department of Naval
Architecture and Marine Engineering – NAME, University of Strathclyde, Glasgow
33. Lazakis, I., Turan, O., Aksu, Seref and Incecik, A. Increasing ship operational
reliability through the implementation of a holistic maintenance management strategy.
Journal of Ships and Offshore Structures, 2010, 5(4), 337-357, doi:
10.1080/17445302.2010.480899
34. Turan, O., Lazakis, I., Judah S. and Incecik, A. Investigating the reliability and
criticality of the maintenance characteristics of a Diving Support Vessel. Journal of
Quality Reliability Engineering International, 2011, 27(7), 931-946 doi:
10.1002/qre.1182
35. Zadeh, L.A. Fuzzy sets. Information and control. 1965, 8, 338-353
Page 30
36. Zimmermann, H.-J. Fuzzy set theory and its applications. 1991. 2nd edition, Boston:
Kluwer Academic Publishers
37. Chen, S-J. and Hwang, C-L. Fuzzy multiple attribute decision making: methods and
applications. 1992. New York: Springer-Verlag
38. Ross, T.J. Fuzzy logic with engineering applications 2004. 2nd edition, Hoboken: NJ
39. Wang, L., Chua, J. and Wu, J. Selection of optimum maintenance strategies based on a
fuzzy analytic hierarchy process. International Journal of Production Economics, 2007,
107, 151–163
40. Yuniarto, M.N. and Labib, A.W. Fuzzy adaptive preventive maintenance in a
manufacturing control system: a step towards self-maintenance. International Journal of
Production Research, 2006, 44(1), 159-180
41. Carasco, E.F., Rodrı́guez, J., Puñal, A., Roca, E. and Lema, J.M. Rule-based
diagnosis and supervision of a pilot-scale wastewater treatment plant using fuzzy logic
techniques. Expert systems with application, 2002, 22, 11-20
42. Riahi, H., Bonsall, S., Jenkinson, I.D. and Wang, J. A proposed fuzzy evidential
reasoning (FER) model for measuring seafarers’ reliability. Proceedings of the
International conference on Human performance at Sea (HPAS), 497-508, Glasgow,
Scotland, UK, 16-18 June 2011
43. Ölçer, A.İ. and Odabasi, A.Y. A new fuzzy multiple attributive group decision making
methodology and its application to propulsion/manoeuvring system selection problem.
European Journal of Operational Research, 2005, 166, 93–114, Number 1
44. Nwaoha, T.C., Yang, Z., Wang, J. and Bonsall, S. A new fuzzy evidential reasoning
method for risk analysis and control of a liquefied natural gas carrier system. Proc.
IMechE Vol. 225 Part M: J. Engineering for the Maritime Environment, 2011, 225, 206-
225, DOI: 10.1177/1475090211411849
Page 31
45. Prabhu Gaonkar, R. S., Xie, M., Habibullah, M.S. and Verma, A.K. Comparative
studies of multi-criteria decision making with application to condition monitoring of a
ship turbine. Proc. of the IMechE Vol. 225 Part M: J. Engineering for the Maritime
Environment, 2011, 225, 149-160, DOI: 10.1177/1475090210397437
46. Labib, A.W., Williams, G.B. and O'Connor, R.F. An Intelligent Maintenance Model
(System): An Application of the Analytic Hierarchy Process and a Fuzzy Logic Rule-
Based Controller, The Journal of the Operational Research Society 1998, 49(7), 745-757
47. Mansor, M.R., Sapuan, S.M., Zainudin, E.S., Nuraini, A.A. and Hambali, A. Hybrid
natural and glass fibers reinforced polymer composites material selection using
Analytical Hierarchy Process for automotive brake lever design, Materials and Design,
2013, 51, 484–492, http://dx.doi.org/10.1016/j.matdes.2013.04.072
48. An, M., Chen, Y. and Baker, C.J. A fuzzy reasoning and fuzzy-analytical hierarchy
process based approach to the process of railway risk information: A railway risk
management system, Information Sciences 2011, 181, 3946–3966
49. Arslan, O. and Turan, O. Analytical investigation of marine casualties at the Strait of
Istanbul with SWOT-AHP method. Maritime Policy and Management, 2009, 36(2), 131-
146
50. Song, W., Ming, X., Wu, Z. and Zhu, B. A rough TOPSIS Approach for Failure Mode
and Effects Analysis in Uncertain Environments, Quality and Reliability Engineering
International, 2013, 4, 473–486 DOI: 10.1002/qre.1500
51. Braglia, M., Frosolini, M. and Montanari, R. Fuzzy TOPSIS Approach for Failure
Mode, Effects and Criticality Analysis, Quality and reliability engineering international,
2003, 19, 425–443 DOI: 10.1002/qre.528
Page 32
APPENDIX
Acronyms
AHP Analytical Hierarchy Process
AM Asset Management
BCM Business Centered Maintenance
CBM Condition Based Maintenance
CMMS Computerised Maintenance Management Systems
DG Diesel Generator
FMAGDM Fuzzy Multiple Attributive Group Decision Making
FST Fuzzy Set Theory
ILS Integrated Logistic Support
LSA Logistic Support Analysis
RBI Risk Based Inspection
RBM Risk Based Maintenance
RCBM Reliability and Criticality Based Maintenance
RCM Reliability Centered Maintenance
TPM Total Productive Maintenance
VBM Vibration Based Maintenance
UK MoD UK Ministry of Defence
Page 33
Table 1 Advantages and shortcomings of the application of various maintenance approaches and gaps identified Approach Advantages Shortcomings Identified gaps
Corrective maintenance
One-off replacements, minimal repairs, minimum cost on spares
May lead to major unexpected failures, severe downtime, excessive repair cost
Lack of maintenance scheduling, non-optimum use of resources
Preventive maintenance
Terotechnology managerial framework, maintainability (design oriented), refers to complex organisations
not maintenance-oriented, maintenance considered as a 'by-product of the overall approach, not technically oriented
maintenance not considered as a profit-generating area, restricted to a general procedural framework
ILS/LSA life cycle cost approach, system design process, aims at minimising cost elements, refers to complex organisations
maintenance is a small part of the overall approach, not flexible enough, not technically oriented
lack of flexibility and supportability to suit every company, technical details on application missing
AM business oriented, safety and environment focused, refers to complex organisations
maintenance is a small part of the overall approach, not suitable for small-medium size companies, time consuming
lack of flexibility and supportability to suit every company, too complex and time consuming
TPM managerial framework, preventive maintenance oriented, minimise cost elements ('six big losses'), incorporate all departments within company, design oriented
maintenance is a small part of the overall management 'picture', can easily become complicated and time-consuming, no specific maintenance measures suggested
lack of profit-generated aspect of maintenance, human resources management missing, organisational barriers, lack of technical aspect
BCM business oriented, aims at maximising profitability, refers to complex organisations, data intensive
maintenance is a small part of the overall approach, refer to complex organisations, extensive use of resources, time consuming
business objectives considered, complicated to implement, lack of direct maintenance involvement
Predictive maintenance
RBI safety and risk based approach, technically structured vs. previous approaches
missing reliability and criticality evaluation lack of criticality evaluation of system and components, limited application in maritime industry
VBM/CBM advanced and technically detailed approach potential high capital cost/investment, part of the overall solution
minor application in maritime industry, not supporting full maintenance framework
RCM thorough description of system and components, cooperation of various dpts within company, maintenance database, cost minimisation
extensive use of resources, can be time consuming, cost implications if too detailed, no feedback loop available
lack of management aspect, managerial involvement required, close feedback loop needed
Page 34
34
Table 2 Properties of attributes used in the case study of the ship DG system Attributes Description Type of assessment Type of attribute
A1 Maintenance cost linguistic cost subjective
A2 Maintenance type efficiency linguistic benefit subjective
A3 System reliability linguistic benefit subjective
A4 Management commitment linguistic benefit subjective
A5 Crew training linguistic cost subjective
A6 Company investment linguistic cost subjective
A7 Spare parts inventories linguistic cost subjective
A8 Minimisation operation loss linguistic benefit subjective
Table 3 Attribute and experts ranking and weighting factors
Attributes Relative
Importance E1 E2 E3 E4 w re we1 re we2 re we3 re we4
A1 100 0.121 1 0.370 1 0.370 0.5 0.185 0.2 0.074
A2 90 0.091 0.7 0.219 1 0.313 1 0.313 0.5 0.156
A3 85 0.182 0.6 0.200 1 0.333 1 0.333 0.4 0.133
A4 75 0.262 1 0.455 0.7 0.318 0.4 0.182 0.1 0.045
A5 60 0.065 1 0.250 1 0.250 1 0.250 1 0.250
A6 95 0.131 1 0.476 0.7 0.333 0.3 0.143 0.1 0.048
A7 60 0.061 1 0.313 0.9 0.281 0.8 0.250 0.5 0.156
A8 90 0.087 1 0.339 0.8 0.271 0.7 0.237 0.45 0.153
Page 35
35
Table 4 Experts' answers and respective standardised fuzzy numbers per alternative and attribute
E1 E2 E3 E4 E1 E2 E3 E4 E1 E2 E3 E4
A1 Experts' opinion high very high very high very high low medium medium low medium low very low very low
Standardised fuzzy number
(0.6, 0.75, 0.75, 0.9) (0.8, 0.9, 1, 1) (0.8, 0.9, 1, 1) (0.8, 0.9, 1, 1) (0.1, 0.25, 0.25, 0.4) (0.3, 0.5, 0.5, 0.7) (0.3, 0.5, 0.5, 0.7) (0.1, 0.25, 0.25, 0.4) (0.3, 0.5, 0.5, 0.7) (0.1, 0.25, 0.25, 0.4) (0, 0, 0.1, 0.2) (0, 0, 0.1, 0.2)
A2 Experts' opinion very low very low very low very low very high medium medium very high medium very high very high high
Standardised fuzzy number
(0, 0, 0.1, 0.2) (0, 0, 0.1, 0.2) (0, 0, 0.1, 0.2) (0, 0, 0.1, 0.2) (0.8, 0.9, 1, 1) (0.3, 0.5, 0.5, 0.7) (0.3, 0.5, 0.5, 0.7) (0.8, 0.9, 1, 1) (0.3, 0.5, 0.5, 0.7) (0.8, 0.9, 1, 1) (0.8, 0.9, 1, 1) (0.6, 0.75, 0.75, 0.9)
A3 Experts' opinion very low very low very low very low very high low medium very high low very high very high low
Standardised fuzzy number
(0, 0, 0.1, 0.2) (0, 0, 0.1, 0.2) (0, 0, 0.1, 0.2) (0, 0, 0.1, 0.2) (0.8, 0.9, 1, 1) (0.1, 0.25, 0.25, 0.4) (0.3, 0.5, 0.5, 0.7) (0.8, 0.9, 1, 1) (0.1, 0.25, 0.25, 0.4) (0.8, 0.9, 1, 1) (0.8, 0.9, 1, 1) (0.1, 0.25, 0.25, 0.4)
A4 Experts' opinion very high very low very low low high medium medium high very low very high very high very high
Standardised fuzzy number
(0.8, 0.9, 1, 1) (0, 0, 0.1, 0.2) (0, 0, 0.1, 0.2) (0.1, 0.25, 0.25, 0.4) (0.6, 0.75, 0.75, 0.9) (0.3, 0.5, 0.5, 0.7) (0.3, 0.5, 0.5, 0.7) (0.6, 0.75, 0.75, 0.9) (0, 0, 0.1, 0.2) (0.8, 0.9, 1, 1) (0.8, 0.9, 1, 1) (0.8, 0.9, 1, 1)
A5 Experts' opinion high very low medium medium medium medium high medium very high very high very high very high
Standardised fuzzy number
(0.6, 0.75, 0.75, 0.9) (0, 0, 0.1, 0.2) (0.3, 0.5, 0.5, 0.7) (0.3, 0.5, 0.5, 0.7) (0.3, 0.5, 0.5, 0.7) (0.3, 0.5, 0.5, 0.7) (0.6, 0.75, 0.75, 0.9) (0.3, 0.5, 0.5, 0.7) (0.8, 0.9, 1, 1) (0.8, 0.9, 1, 1) (0.8, 0.9, 1, 1) (0.8, 0.9, 1, 1)
A6 Experts' opinion medium very low very low low medium medium medium medium high very high very high very high
Standardised fuzzy number
(0.3, 0.5, 0.5, 0.7) (0, 0, 0.1, 0.2) (0, 0, 0.1, 0.2) (0.1, 0.25, 0.25, 0.4) (0.3, 0.5, 0.5, 0.7) (0.3, 0.5, 0.5, 0.7) (0.3, 0.5, 0.5, 0.7) (0.3, 0.5, 0.5, 0.7) (0.6, 0.75, 0.75, 0.9) (0.8, 0.9, 1, 1) (0.8, 0.9, 1, 1) (0.8, 0.9, 1, 1)
A7 Experts' opinion medium high high very high very high medium medium medium low very low low low
Standardised fuzzy number
(0.3, 0.5, 0.5, 0.7) (0.6, 0.75, 0.75, 0.9) (0.6, 0.75, 0.75, 0.9) (0.8, 0.9, 1, 1) (0.8, 0.9, 1, 1) (0.3, 0.5, 0.5, 0.7) (0.3, 0.5, 0.5, 0.7) (0.3, 0.5, 0.5, 0.7) (0.1, 0.25, 0.25, 0.4) (0, 0, 0.1, 0.2) (0.1, 0.25, 0.25, 0.4) (0.1, 0.25, 0.25, 0.4)
A8 Experts' opinion very low very low low very low very high medium medium high medium very high very high very high
Standardised fuzzy number
(0, 0, 0.1, 0.2) (0, 0, 0.1, 0.2) (0.1, 0.25, 0.25, 0.4) (0, 0, 0.1, 0.2) (0.8, 0.9, 1, 1) (0.3, 0.5, 0.5, 0.7) (0.3, 0.5, 0.5, 0.7) (0.6, 0.75, 0.75, 0.9) (0.3, 0.5, 0.5, 0.7) (0.8, 0.9, 1, 1) (0.8, 0.9, 1, 1) (0.8, 0.9, 1, 1)
X1 X3X2
Page 36
36
Table 5 Final aggregation matrix for experts E1- E4
X1 X2 X3 A1 (0.74, 0.86, 0.93, 0.97) (0.21, 0.38, 0.38, 0.56) (0.12, 0.22, 0.26, 0.41)
A2 (0.00, 0.00, 0.10, 0.20) (0.52, 0.68, 0.72, 0.83) (0.65, 0.78, 0.84, 0.91)
A3 (0.00, 0.00, 0.10, 0.20) (0.46, 0.61, 0.65, 0.75) (0.51, 0.63, 0.69, 0.75)
A4 (0.19, 0.24, 0.32, 0.41) (0.45, 0.62, 0.62, 0.80) (0.64, 0.73, 0.83, 0.84)
A5 (0.31, 0.45, 0.47, 0.64) (0.37, 0.56, 0.56, 0.75) (0.80, 0.90, 1.00, 1.00)
A6 (0.12, 0.21, 0.26, 0.40) (0.30, 0.50, 0.50, 0.70) (0.73, 0.85, 0.91, 0.96)
A7 (0.56, 0.71, 0.73, 0.87) (0.42, 0.60, 0.62, 0.77) (0.07, 0.19, 0.21, 0.35)
A8 (0.02, 0.06, 0.13, 0.25) (0.50, 0.66, 0.69, 0.83) (0.67, 0.80, 0.87, 0.92)
Page 37
37
Table 6 Defuzzified aggregated values, normalised and weighted normalised ratings for experts E1-E4
Corrective (X1) Preventive (X2) Predictive (X3)
A1 Defuzzified aggregated values (total score)
0.8479 0.3996 0.2796
Normalised ratings 0.8668 0.40857 0.28586
Weighted normalised ratings 0.10507 0.04952 0.03465
A2 Defuzzified aggregated values (total score)
0.0909 0.6655 0.7717
Normalised ratings 0.0889 0.65049 0.75430
Weighted normalised ratings 0.00808 0.05914 0.06857
A3 Defuzzified aggregated values (total score)
0.0909 0.6069 0.6336
Normalised ratings 0.1031 0.68803 0.71832
Weighted normalised ratings 0.01874 0.12510 0.13060
A4 Defuzzified aggregated values (total score)
0.3031 0.6011 0.7501
Normalised ratings 0.3007 0.59643 0.74422
Weighted normalised ratings 0.07873 0.15616 0.19485
A5 Defuzzified aggregated values (total score)
0.4711 0.5488 0.9091
Normalised ratings 0.4055 0.47244 0.78255
Weighted normalised ratings 0.02654 0.03092 0.05122
A6 Defuzzified aggregated values (total score)
0.2724 0.5000 0.8374
Normalised ratings 0.2690 0.49375 0.82695
Weighted normalised ratings 0.03522 0.06464 0.10826
A7 Defuzzified aggregated values (total score)
0.6910 0.5913 0.2375
Normalised ratings 0.7351 0.62909 0.25261
Weighted normalised ratings 0.04455 0.03813 0.01531
A8 Defuzzified aggregated values (total score)
0.1388 0.6495 0.7913
Page 38
38
Normalised ratings 0.1343 0.62867 0.76598
Weighted normalised ratings 0.01172 0.05487 0.06685
Table 7 Positive and negative ideal solutions for the suggested alternatives
Attributes Positive ideal solution
Negative ideal solution
A1 0.0346 0.1051
A2 0.0686 0.0081
A3 0.1306 0.0187
A4 0.1949 0.0787
A5 0.0265 0.0512
A6 0.0352 0.1083
A7 0.0153 0.0446
A8 0.0668 0.0117
Table 8 Distance (separation) of alternatives from positive and negative ideal solution X1 X2 X3 Si+ 0.196 0.058 0.077
Si- 0.077 0.165 0.196
Ci+ 0.282 0.739 0.718
Final ranking 3 1 2
Figure 1 Fuzzy Multi attributive group decision-making study layout
Page 39
39
Figure 2 Graph showing the sensitivity analysis regarding different β values