49

Leading position
globally • Indian chemical industry stood as 3rd largest producer in Asia in 2011 in terms of volume
High GDP share • The chemical industry in India is a key constituent of Indian economy, accounting for
about five per cent of the GDP
Global dye supplier • India accounts for approximately 7 per cent of the world production of dyestuff and dye
intermediates, particularly for reactive acid and direct dyes
Source: TATA Strategic Management Group, Planning Commission,
Department of Industrial Policy and Promotion (DIPP), Aranca Research
Notes: PCPIR - Petroleum, Chemicals and Petrochemical Investment Regions; E - Estimated,
Global player in
specialty chemicals • India is currently the world’s third largest consumer of polymers and fourth largest
producer of agrochemicals

• The engineering sector is delicensed; 100 per cent FDI is allowed in the sector
• Due to policy support, there was cumulative FDI of USD14.0 billion into the sector over April 2000 – February 2012, making up 8.6 per cent of total FDI into the country in that period
Growing demand
Source: TATA Strategic Management Group, Planning Commission, Department of Industrial Policy and Promotion (DIPP), Aranca Research
Notes: PCPIR - Petroleum, Chemicals and Petrochemical Investment Regions; E – Estimated,
Robust demand
• A large population, dependence on agriculture, and strong export demand are the key growth drivers for the chemicals industry
• Per-capita consumption of chemicals in India is lower relative to Western peers and there exists a large latent demand
Attractive opportunities
• Polymers and agrochemicals industries in India present immense growth opportunities
• The size of India’s construction chemical market stood at USD591 million in 2011, which accounted for only 2 per cent of global demand,
• thereby representing ample
• growth opportunity
Policy support
• 100 per cent FDI is permissible in the Indian chemicals sector; manufacturing of most chemical products is de-licensed
• The government has been encouraging R&D in the sector
• Setting up of PCPIRs
Increasing investments
• Lured by the size and returns of the Indian market, foreign firms have strengthened their presence in India
• From April 2000 to March 2013, total FDI inflows into the Indian chemicals industry (excluding fertilisers) were USD8.9 billion
2011
Market
size:
USD108
billion
2017E
Market
size:
USD290
billion
Advantage
India
Source: KPMG, Aranca Research
Notes: MNC – Multinational Corporation
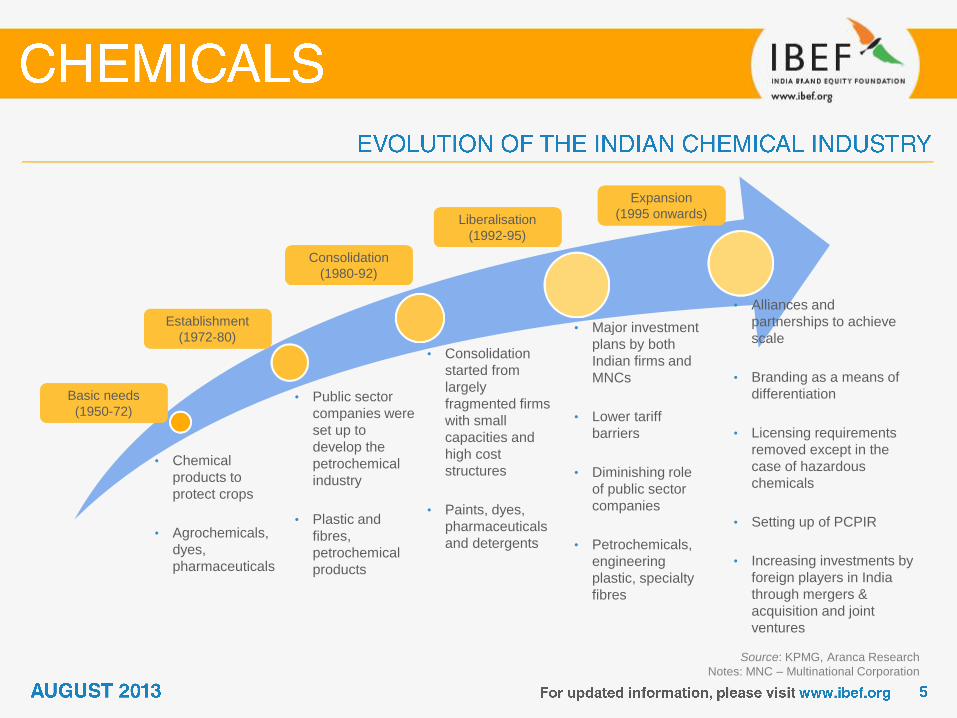
• Chemical
products to
protect crops
• Agrochemicals,
dyes,
pharmaceuticals
• Public sector
companies were
set up to
develop the
petrochemical
industry
• Plastic and
fibres,
petrochemical
products
• Consolidation
started from
largely
fragmented firms
with small
capacities and
high cost
structures
• Paints, dyes,
pharmaceuticals
and detergents
• Alliances and
partnerships to achieve
scale
• Branding as a means of
differentiation
• Licensing requirements
removed except in the
case of hazardous
chemicals
• Setting up of PCPIR
• Increasing investments by
foreign players in India
through mergers &
acquisition and joint
ventures
Basic needs
(1950-72)
Establishment
(1972-80)
Consolidation
(1980-92)
Liberalisation
(1992-95)
Expansion
(1995 onwards)
• Major investment
plans by both
Indian firms and
MNCs
• Lower tariff
barriers
• Diminishing role
of public sector
companies
• Petrochemicals,
engineering
plastic, specialty
fibres

Base chemicals • Petrochemicals, man-made fibres, industrial gases, fertilisers, chlor-alkali, and other
organic and inorganic chemicals
Specialty chemicals • Dyes and pigments, leather chemicals, construction chemicals, personal care ingredients
and other specialty chemicals
Pharmaceuticals • Active Pharmaceutical Ingredients (APIs) and formulations
Source: TATA Strategic Management Group, Aranca Research
Agrochemicals • Insecticides, herbicides, fungicides and other crop protection chemicals
Biotechnology • Bio-pharma, bio-agri, and bio-industrial products
Source: Aranca Research
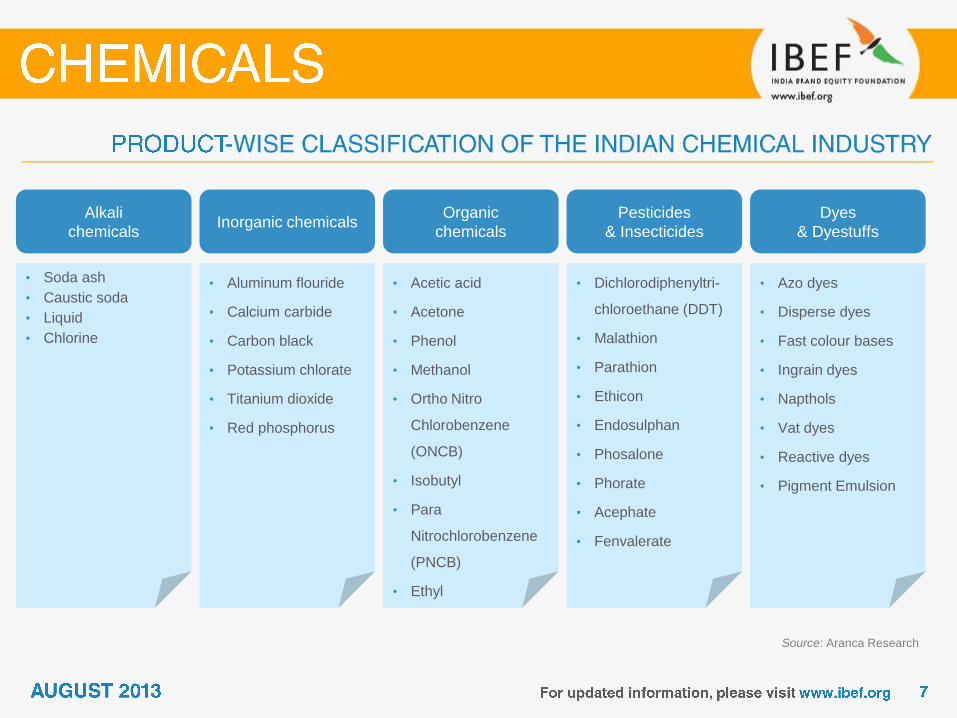
Alkali
chemicals
• Soda ash
• Caustic soda
• Liquid
• Chlorine
Inorganic chemicals
• Aluminum flouride
• Calcium carbide
• Carbon black
• Potassium chlorate
• Titanium dioxide
• Red phosphorus
Organic
chemicals
• Acetic acid
• Acetone
• Phenol
• Methanol
• Ortho Nitro
Chlorobenzene
(ONCB)
• Isobutyl
• Para
Nitrochlorobenzene
(PNCB)
• Ethyl
Pesticides
& Insecticides
• Dichlorodiphenyltri-
chloroethane (DDT)
• Malathion
• Parathion
• Ethicon
• Endosulphan
• Phosalone
• Phorate
• Acephate
• Fenvalerate
Dyes
& Dyestuffs
• Azo dyes
• Disperse dyes
• Fast colour bases
• Ingrain dyes
• Napthols
• Vat dyes
• Reactive dyes
• Pigment Emulsion

Source: KPMG International 2011, Aranca Research
Notes: R&D – Research and Development
High domestic
demand potential
• The industry has changed over time to meet the dynamic needs of an emerging economy
• Strong economic growth and rise in per-capita income has meant a steady increase in demand for chemicals
• The industry has left behind a low-growth and regulated environment to emerge more mature
• There is strong government support towards R&D; this would benefit the sector
Focus on new
segments such as
specialty and
knowledge
chemicals
Gujarat and
Maharashtra have
emerged as most
favoured zones
Fragmented
industry
Increase in focus
on R&D
Indian
Chemical
Industry
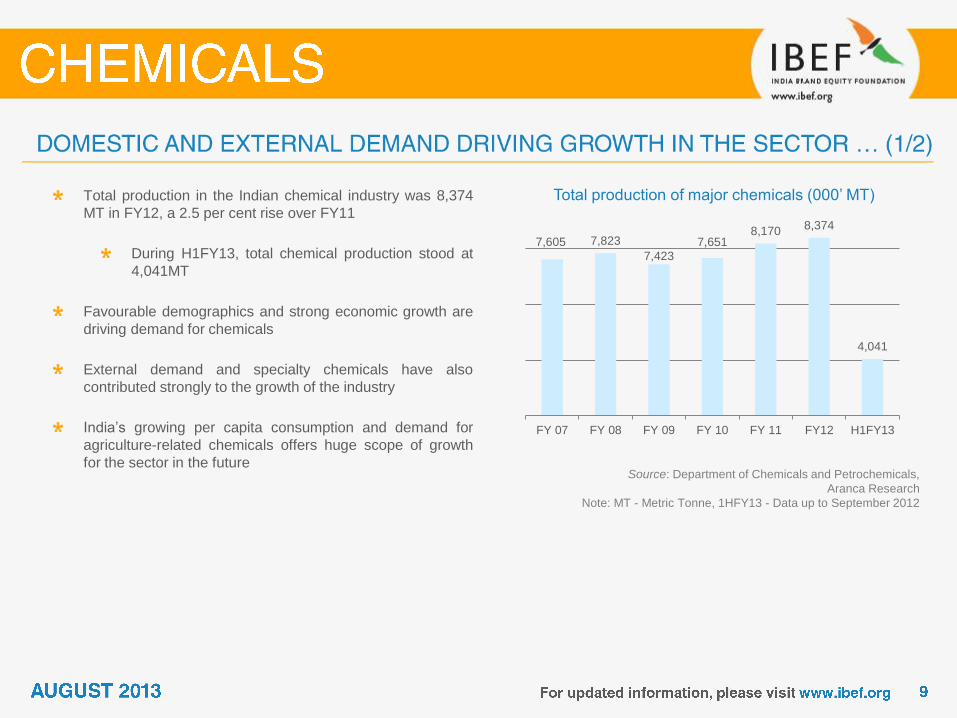
Total production of major chemicals (000’ MT)
Source: Department of Chemicals and Petrochemicals,
Aranca Research
Note: MT - Metric Tonne, 1HFY13 - Data up to September 2012
Total production in the Indian chemical industry was 8,374
MT in FY12, a 2.5 per cent rise over FY11
During H1FY13, total chemical production stood at
4,041MT
Favourable demographics and strong economic growth are
driving demand for chemicals
External demand and specialty chemicals have also
contributed strongly to the growth of the industry
India’s growing per capita consumption and demand for
agriculture-related chemicals offers huge scope of growth
for the sector in the future
7,605 7,823
7,423 7,651
8,170 8,374
4,041
FY 07 FY 08 FY 09 FY 10 FY 11 FY12 H1FY13
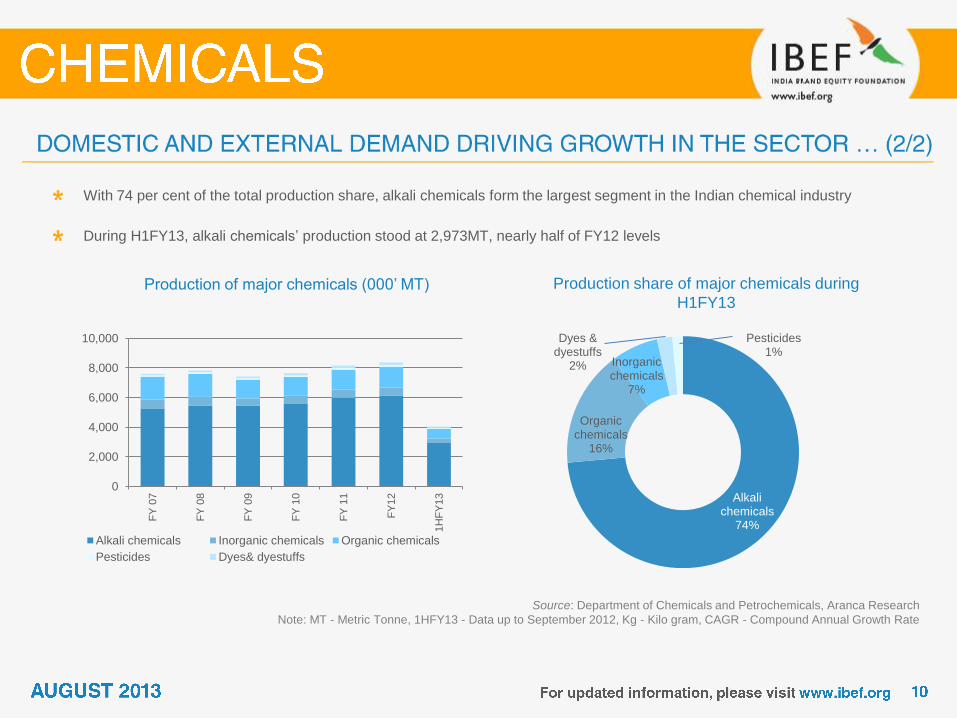
Production of major chemicals (000’ MT)
Source: Department of Chemicals and Petrochemicals, Aranca Research
Note: MT - Metric Tonne, 1HFY13 - Data up to September 2012, Kg - Kilo gram, CAGR - Compound Annual Growth Rate
With 74 per cent of the total production share, alkali chemicals form the largest segment in the Indian chemical industry
During H1FY13, alkali chemicals’ production stood at 2,973MT, nearly half of FY12 levels
Production share of major chemicals during
H1FY13
Alkali chemicals
74%
Organic chemicals
16%
Inorganic chemicals
7%
Dyes & dyestuffs
2%
Pesticides 1%
0
2,000
4,000
6,000
8,000
10,000
FY
07
FY
08
FY
09
FY
10
FY
11
FY
12
1H
FY
13
Alkali chemicals Inorganic chemicals Organic chemicals
Pesticides Dyes& dyestuffs
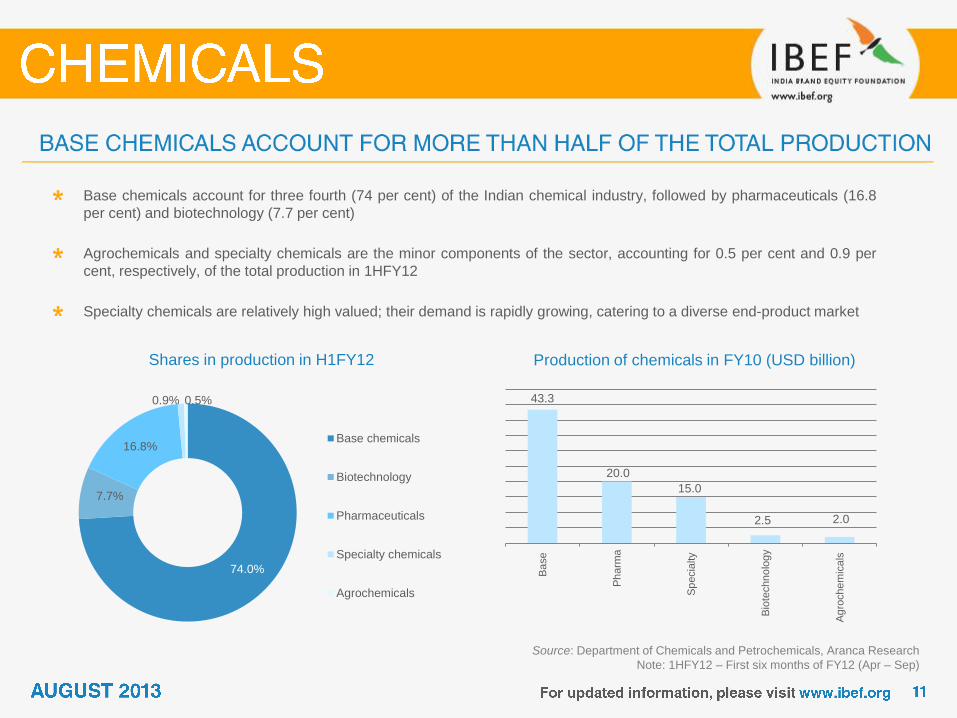
Shares in production in H1FY12
Source: Department of Chemicals and Petrochemicals, Aranca Research
Note: 1HFY12 – First six months of FY12 (Apr – Sep)
Base chemicals account for three fourth (74 per cent) of the Indian chemical industry, followed by pharmaceuticals (16.8
per cent) and biotechnology (7.7 per cent)
Agrochemicals and specialty chemicals are the minor components of the sector, accounting for 0.5 per cent and 0.9 per
cent, respectively, of the total production in 1HFY12
Specialty chemicals are relatively high valued; their demand is rapidly growing, catering to a diverse end-product market
Production of chemicals in FY10 (USD billion)
43.3
20.0
15.0
2.5 2.0
Ba
se
Ph
arm
a
Sp
ecia
lty
Bio
techno
log
y
Ag
rochem
icals
74.0%
7.7%
16.8%
0.9% 0.5%
Base chemicals
Biotechnology
Pharmaceuticals
Specialty chemicals
Agrochemicals
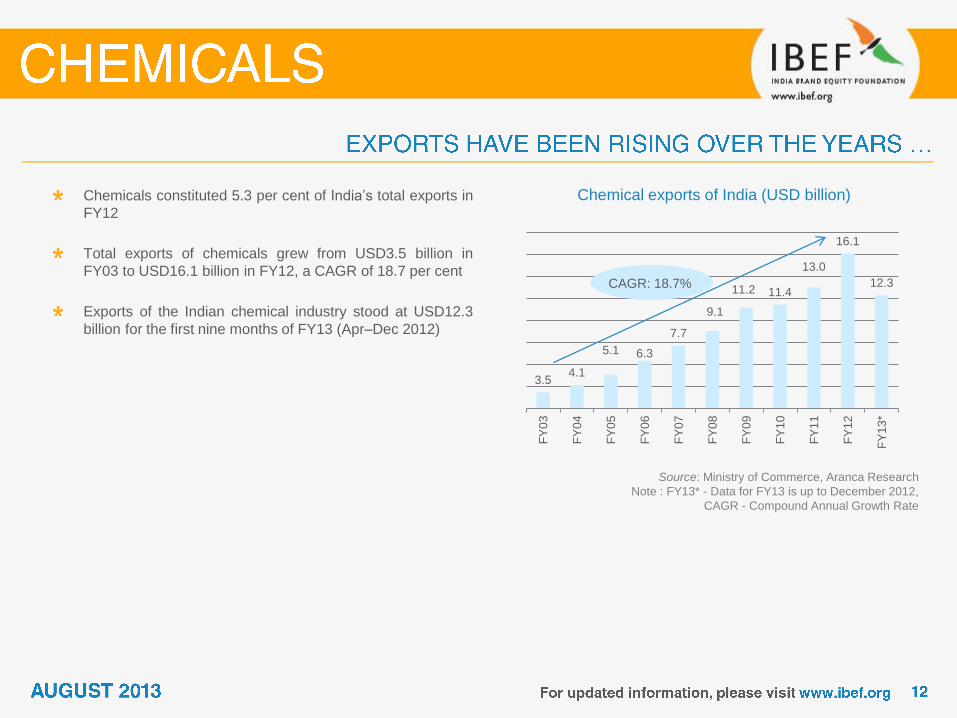
Chemical exports of India (USD billion)
Source: Ministry of Commerce, Aranca Research
Note : FY13* - Data for FY13 is up to December 2012,
CAGR - Compound Annual Growth Rate
Chemicals constituted 5.3 per cent of India’s total exports in
FY12
Total exports of chemicals grew from USD3.5 billion in
FY03 to USD16.1 billion in FY12, a CAGR of 18.7 per cent
Exports of the Indian chemical industry stood at USD12.3
billion for the first nine months of FY13 (Apr–Dec 2012)
3.5 4.1
5.1 6.3
7.7
9.1
11.2 11.4
13.0
16.1
12.3
FY
03
FY
04
FY
05
FY
06
FY
07
FY
08
FY
09
FY
10
FY
11
FY
12
FY
13*
CAGR: 18.7%
3.7 4.7
6.1 7.5
8.8
11.3
15.6 16.0
19.5
24.0
18.4
FY
03
FY
04
FY
05
FY
06
FY
07
FY
08
FY
09
FY
10
FY
11
FY
12
FY
13*
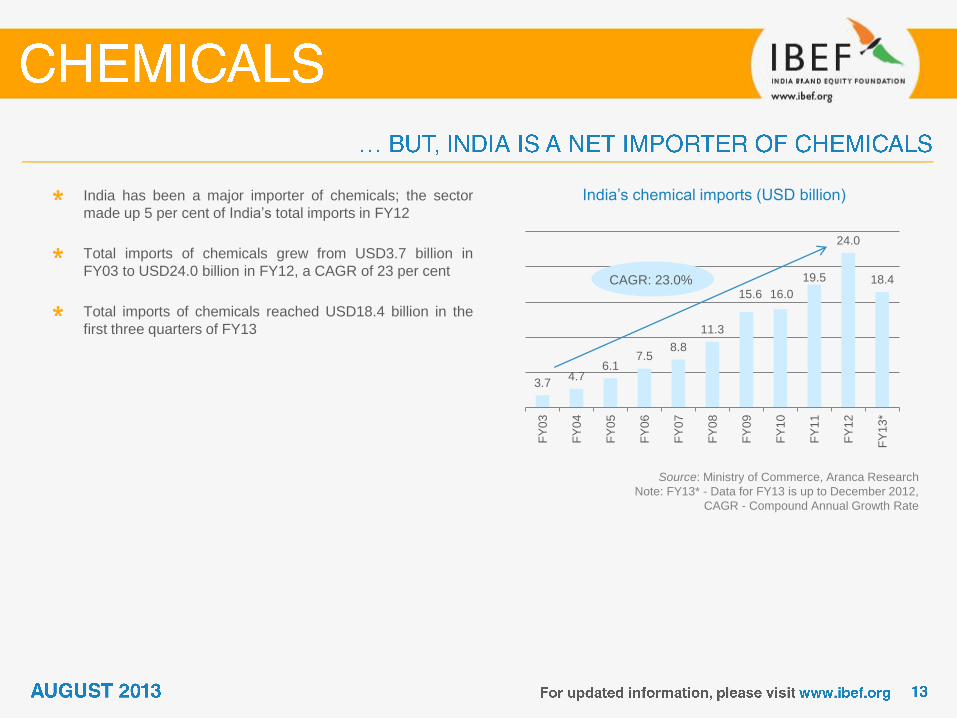
India’s chemical imports (USD billion)
Source: Ministry of Commerce, Aranca Research
Note: FY13* - Data for FY13 is up to December 2012,
CAGR - Compound Annual Growth Rate
India has been a major importer of chemicals; the sector
made up 5 per cent of India’s total imports in FY12
Total imports of chemicals grew from USD3.7 billion in
FY03 to USD24.0 billion in FY12, a CAGR of 23 per cent
Total imports of chemicals reached USD18.4 billion in the
first three quarters of FY13
CAGR: 23.0%

Shares in exports of chemicals in FY13
Source: Department of Chemicals and Petrochemicals, Aranca Research
Note: CAGR - Compound Annual Growth Rate
During FY13, organic chemicals constituted 70 per cent of
India’s total chemical exports, followed by dyes & dyestuff at
11 per cent
Over FY03–13, organic chemicals exports rose at a CAGR
of 19.6 per cent, followed by pesticides at a rate of 18.9 per
cent during same period
Exports of inorganic chemicals and dyes & dyestuff grew at
a CAGR of 14.6 and 13.1 per cent, respectively, during
FY03–13 70%
11%
10%
9% Organic chemicals
Dyes & dyestuffs
Pesticides
Inorganicchemicals

Shares in imports of chemicals in FY13
Source: Department of Chemicals and Petrochemicals, Aranca Research
Note: CAGR - Compound Annual Growth Rate
Organic chemicals also dominate imports, with a share of
68 per cent, followed by inorganic chemicals at 23 per cent
in FY13
Over FY03–13, pesticides imports rose at a CAGR of 28.8
per cent, followed by organic chemicals at a rate of 21.7 per
cent
Imports of dyes & dyestuff and inorganic chemicals grew at
a CAGR of 18.1 and 16.4 per cent, respectively, during
FY03–13 68%
23%
6% 3%
Organic chemicals
Inorganicchemicals
Dyes & dyestuffs
Pesticides

Source: Ministry of Environment and Forests,
Central Pollution Control Board, Aranca Research
Note: Figures mentioned above is taken from Dept. of
Chemicals and Petrochemicals;
* Data for 2011
India’s
chemicals
industry
(2013)
10 per cent of
overall industrial index
Production (IIP)
5 per cent of
national
GDP
3rd
largest chemical
industry in Asia
20 per cent
contribution to
national tax
Revenue*
One of the
most diversified
sectors, covering
more than
70,000 commercial
Products*
5.3 per cent of
total exports
and 5 per cent
of total imports

Contribution to global chemical industry
would increase
Source: TATA Strategic Management Group, Planning Commission, Aranca Research,
CAGR - Compound Annual Growth Rate
Strong growth outlook for the Indian chemicals
industry
2011
• Global chemical industry: USD3.4 trillion
• India chemical industry: USD108 billion
2017E
• Global chemical industry: USD5 trillion
• India chemical industry: USD290 billion
108
290
2011 2017E
2011
2017E
97% 3% 95%
5%
CAGR: 21.0%
Global India
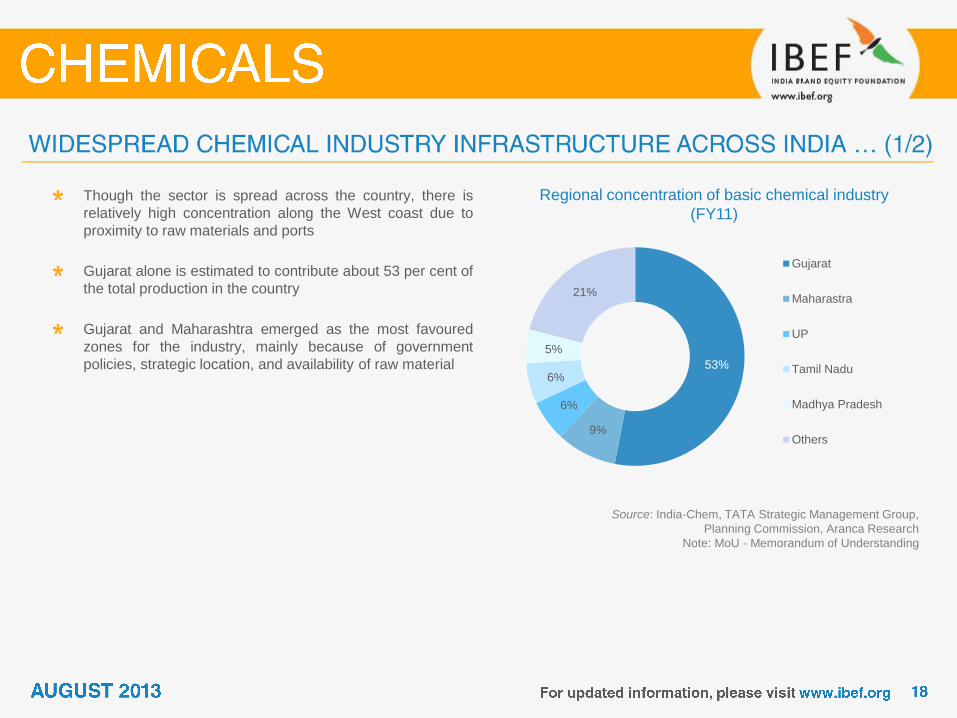
Regional concentration of basic chemical industry
(FY11)
Source: India-Chem, TATA Strategic Management Group,
Planning Commission, Aranca Research
Note: MoU - Memorandum of Understanding
Though the sector is spread across the country, there is
relatively high concentration along the West coast due to
proximity to raw materials and ports
Gujarat alone is estimated to contribute about 53 per cent of
the total production in the country
Gujarat and Maharashtra emerged as the most favoured
zones for the industry, mainly because of government
policies, strategic location, and availability of raw material 53%
9%
6%
6%
5%
21%
Gujarat
Maharastra
UP
Tamil Nadu
Madhya Pradesh
Others
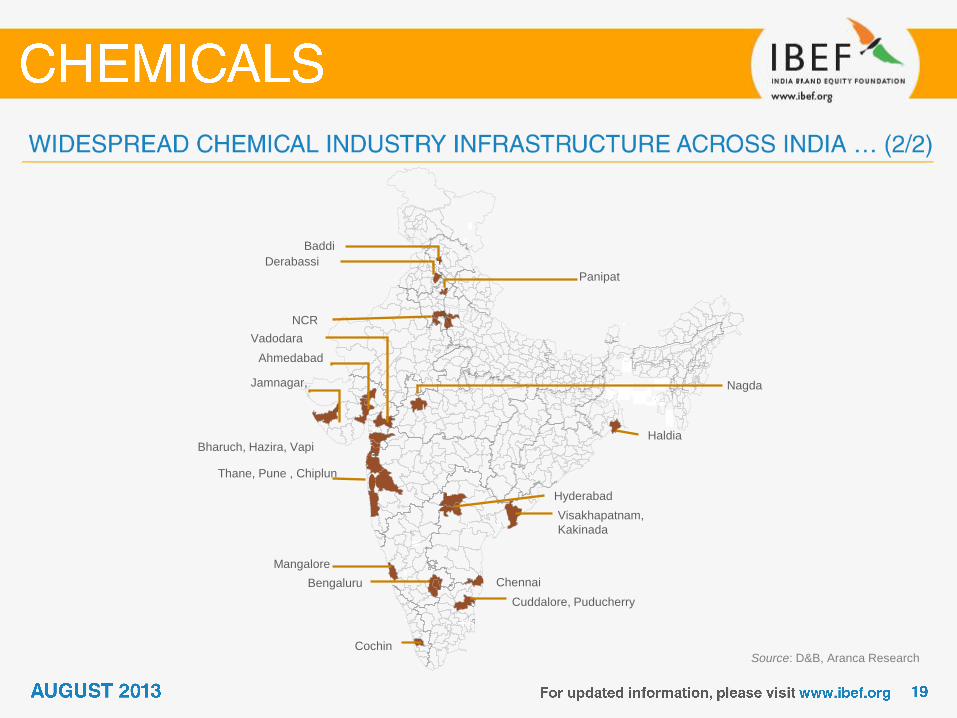
Source: D&B, Aranca Research
Jamnagar,
Thane, Pune , Chiplun
Ahmedabad
Hyderabad
Vadodara
Cochin
Haldia
Bengaluru
NCR
Chennai
Bharuch, Hazira, Vapi
Baddi
Derabassi
Panipat
Nagda
Visakhapatnam,
Kakinada
Cuddalore, Puducherry
Mangalore

Proposed investments by chemical manufacturers
in Gujarat
Source: India Chem, Aranca Research
Note: PCPIR - Petroleum, Chemicals and Petrochemical
Investment Regions
With the presence of world class manufacturing facilities of
Indian and multinational chemical manufacturers, Gujarat
houses 53 per cent of India’s manufacturing capacity of
chemicals
Reliance Industries, ONGC, Dow Chemicals, Cheminova,
Lanxess, Gujarat State Fertilisers & Chemicals Ltd (GSFC),
Gujarat Alkalis & Chemicals Ltd (GACL) and many other
companies have their production facilities in Gujarat
Government support, world class infrastructure, strategic
location, availability of skilled workforce and raw material
makes Gujarat a preferred location for chemical plants
The Dahej PCPIR has been the most successful one; it is
spread over an area of around 453 sq km and has attracted
investments of around of USD25 billion
Badische Anilin- und Soda-Fabrik (BASF), a German
chemical major aims to invest USD183.7 million for setting
up a new manufacturing facility at Dahej in Gujarat by
March 2014
0.0
4.0
8.0
12.0
16.0
0
20
40
60
80
100
2003 2005 2007 2009 2011
MoUs - left axis Investments (USD billion)
Source: Company Annual Reports, Aranca Research
Note: * - FY12,
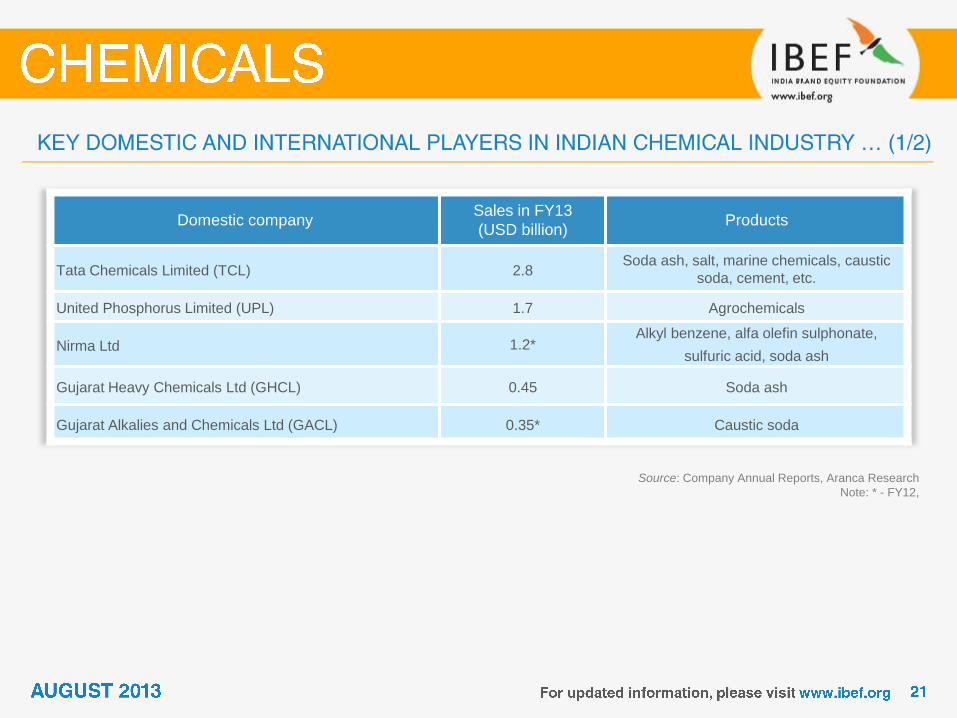
Domestic company Sales in FY13
(USD billion) Products
Tata Chemicals Limited (TCL) 2.8 Soda ash, salt, marine chemicals, caustic
soda, cement, etc.
United Phosphorus Limited (UPL) 1.7 Agrochemicals
Nirma Ltd 1.2* Alkyl benzene, alfa olefin sulphonate,
sulfuric acid, soda ash
Gujarat Heavy Chemicals Ltd (GHCL) 0.45 Soda ash
Gujarat Alkalies and Chemicals Ltd (GACL) 0.35* Caustic soda

Source: Company ANR, Aranca Research
Note : * Sales data for 2011
International Company Sales in 2012
(USD billion) Products
BASF 92.8 Chemicals, plastics, performance and
nutrition products
The Dow Chemicals 56.8 Specialty chemicals, agrochemicals and plastics
Bayer 19.3* Agrochemicals, pharmaceuticals, polymers,
technology services
E. I. du Pont de Nemours and Company 34.8 Specialty and fine chemicals
INEOS ABS India 16* PVC films and specialty resins
AkzoNobel 21* Coatings, decorative paints and specialty chemicals
Evonik Industries 17.3 Specialty chemicals
Lanxess 9.1 Plastics, rubber, specialty chemicals and intermediates
Wacker Chemie 6.0 Silicone, polymer, specialty and fine chemicals

Source: Aranca Research
Low-cost
manufacturing
Skilled science
professionals
and English
speaking
workforce
Rise in GDP and
purchasing
power
World class
engineering and
strong R&D
capabilities
Huge growth
potential for the
domestic market

Real GDP growth
Source: IMF, Aranca Research
Being largely an intermediate product, strong economic growth is an important factor in sustaining demand for chemical
products
Per capita consumption of most of the finished products under chemicals sector is far below the world average; this points
to the vast potential for growth in the industry
As in a number of other industries in India, strong growth in discretionary income and changing lifestyles are counted as a
few of the other major growth drivers of the chemicals sector
Per capita GDP growth
7.8
%
8.5
%
4.7
%
3.6
%
9.7
%
6.3
%
2.6
%
4.3
%
4.9
%
5.2
%
5.5
%
5.5
%
200
6
200
7
200
8
200
9
201
0
201
1
201
2F
201
3F
201
4F
201
5F
201
6F
201
7F
9.5
%
10
.0%
6.9
%
5.9
%
10
.1%
6.8
%
4.9
%
6.0
%
6.4
%
6.7
%
6.9
%
6.9
%
200
6
200
7
200
8
200
9
201
0
201
1
201
2F
201
3F
201
4F
201
5F
201
6F
201
7F
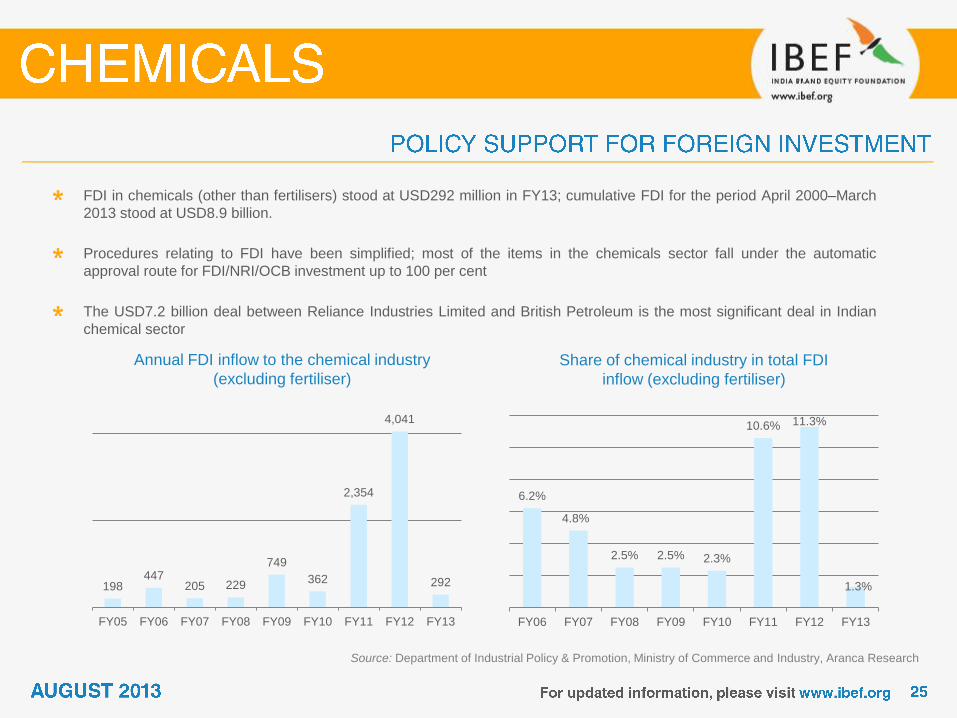
Annual FDI inflow to the chemical industry
(excluding fertiliser)
Source: Department of Industrial Policy & Promotion, Ministry of Commerce and Industry, Aranca Research
FDI in chemicals (other than fertilisers) stood at USD292 million in FY13; cumulative FDI for the period April 2000–March
2013 stood at USD8.9 billion.
Procedures relating to FDI have been simplified; most of the items in the chemicals sector fall under the automatic
approval route for FDI/NRI/OCB investment up to 100 per cent
The USD7.2 billion deal between Reliance Industries Limited and British Petroleum is the most significant deal in Indian
chemical sector
Share of chemical industry in total FDI
inflow (excluding fertiliser)
198 447
205 229
749
362
2,354
4,041
292
FY05 FY06 FY07 FY08 FY09 FY10 FY11 FY12 FY13
6.2%
4.8%
2.5% 2.5% 2.3%
10.6% 11.3%
1.3%
FY06 FY07 FY08 FY09 FY10 FY11 FY12 FY13
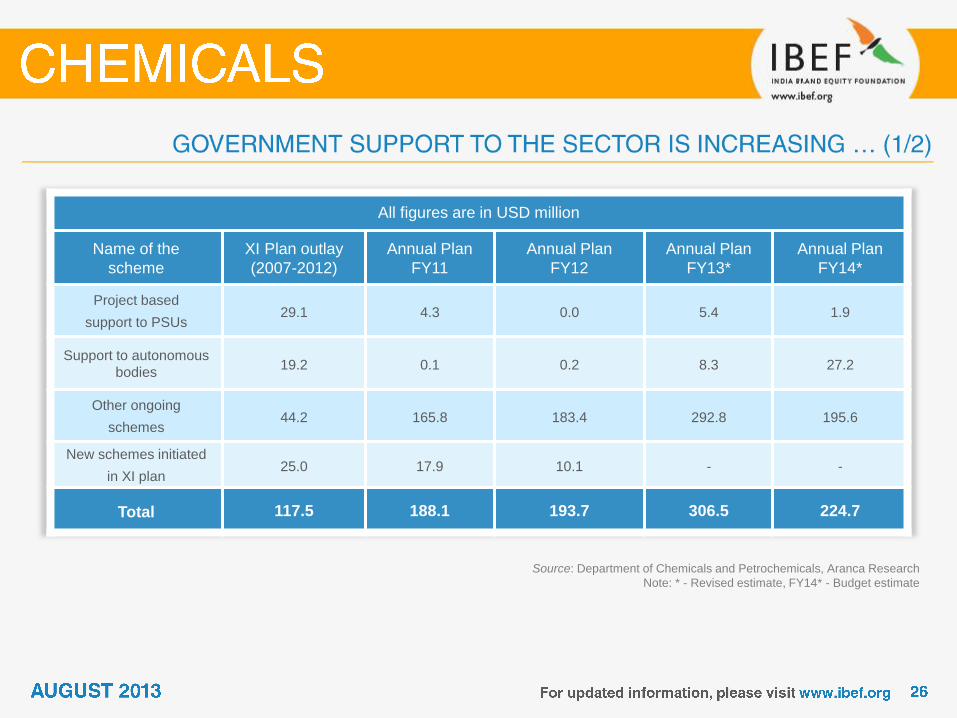
Source: Department of Chemicals and Petrochemicals, Aranca Research
Note: * - Revised estimate, FY14* - Budget estimate
All figures are in USD million
Name of the
scheme
XI Plan outlay
(2007-2012)
Annual Plan
FY11
Annual Plan
FY12
Annual Plan
FY13*
Annual Plan
FY14*
Project based
support to PSUs 29.1 4.3 0.0 5.4 1.9
Support to autonomous
bodies 19.2 0.1 0.2 8.3 27.2
Other ongoing
schemes 44.2 165.8 183.4 292.8 195.6
New schemes initiated
in XI plan 25.0 17.9 10.1 - -
Total 117.5 188.1 193.7 306.5 224.7

Source: Department of Chemicals and Petrochemicals, Aranca Research
All figures are in USD million
Name of the
scheme
Non Plan outlay
(FY10)
Non Plan outlay
(FY11)
Non Plan outlay
(FY12)
Non Plan outlay
(FY13)
Non Plan outlay
(FY14)
Secretariat 2.21 2.52 2.79 2.3 2.4
Central Institute of Plastics
Engg. & Technology
(CIPET)
0.63 0.10 0.10 0 0
Bhopal Gas Leak Disaster 0 0 0 17.5 23.3
Institute of Pesticide
Formulation Technology
(IPFT) 0 0 0 0.6 0.6
Others 0.50 0.54 0.63 0 0
Total 3.34 3.16 3.52 20.4 26.3
Source: EXIM Bank of India, Aranca Research,
PCPIR - Petroleum, Chemicals and Petrochemicals Investment Regions
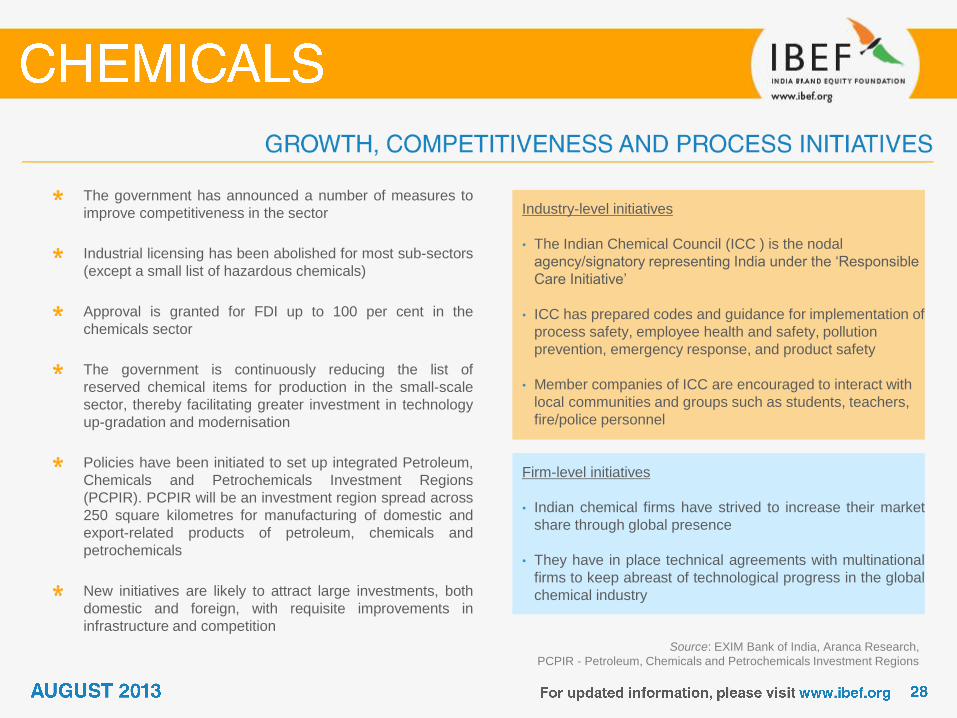
The government has announced a number of measures to
improve competitiveness in the sector
Industrial licensing has been abolished for most sub-sectors
(except a small list of hazardous chemicals)
Approval is granted for FDI up to 100 per cent in the
chemicals sector
The government is continuously reducing the list of
reserved chemical items for production in the small-scale
sector, thereby facilitating greater investment in technology
up-gradation and modernisation
Policies have been initiated to set up integrated Petroleum,
Chemicals and Petrochemicals Investment Regions
(PCPIR). PCPIR will be an investment region spread across
250 square kilometres for manufacturing of domestic and
export-related products of petroleum, chemicals and
petrochemicals
New initiatives are likely to attract large investments, both
domestic and foreign, with requisite improvements in
infrastructure and competition
Industry-level initiatives
• The Indian Chemical Council (ICC ) is the nodal
agency/signatory representing India under the ‘Responsible
Care Initiative’
• ICC has prepared codes and guidance for implementation of
process safety, employee health and safety, pollution
prevention, emergency response, and product safety
• Member companies of ICC are encouraged to interact with
local communities and groups such as students, teachers,
fire/police personnel
Firm-level initiatives
• Indian chemical firms have strived to increase their market
share through global presence
• They have in place technical agreements with multinational
firms to keep abreast of technological progress in the global
chemical industry

Source: Aranca Research
Note: PCPIR - Petroleum, Chemicals and Petrochemicals Investment Regions
• Make PCPIRs a
reality
• Provide
infrastructure support
to the industry by
constructing roads,
ports and other
similar facilities
• Implementation of
strategy for sourcing
and allocation of
feedstock
• Setting up of
technology up-
gradation fund of
USD100 million
• Allocation of 10 per
cent share of the
USD1 billion
National Innovation
Fund to chemicals
• Development of the
first set of chemical
usage standards for
the industry
addressing key
issues related to
water supply,
environmental
impact, raw materials
supply, safety over
lifecycle, and energy
use
• Committee to frame
regulatory structure
and eliminate
redundancies
• Rationalisation of
taxes and duties for
the sector (to be
implemented by
2014)
• Setting up of a
national chemical
inventory
Infrastructure Feedstock R&D and
Technology Sustainability Regulations
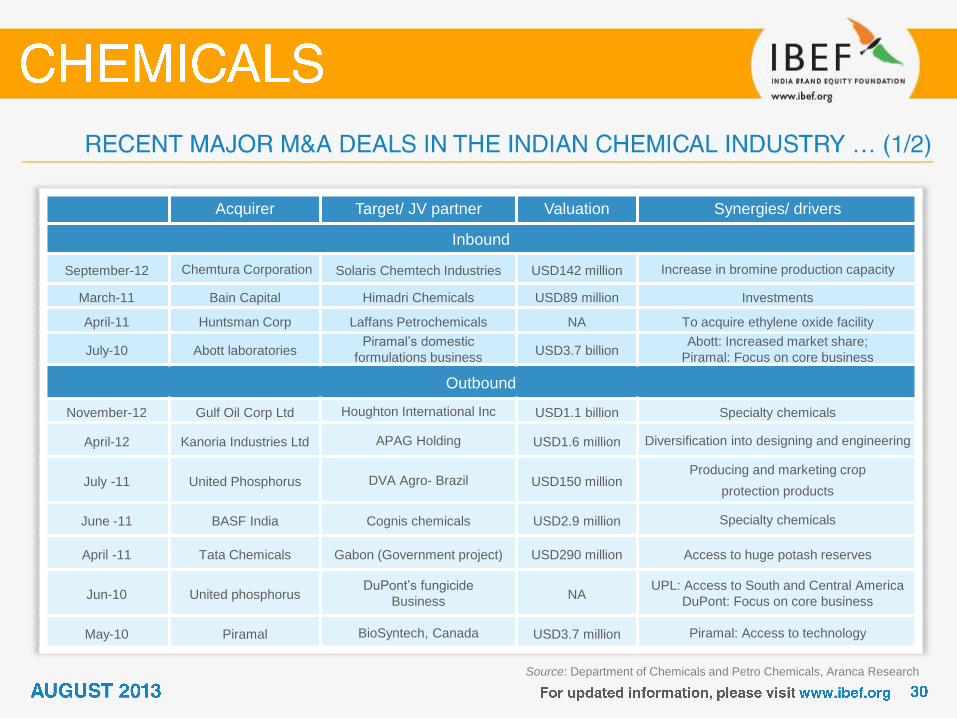
Source: Department of Chemicals and Petro Chemicals, Aranca Research
Acquirer Target/ JV partner Valuation Synergies/ drivers
Inbound
September-12 Chemtura Corporation Solaris Chemtech Industries USD142 million Increase in bromine production capacity
March-11 Bain Capital Himadri Chemicals USD89 million Investments
April-11 Huntsman Corp Laffans Petrochemicals NA To acquire ethylene oxide facility
July-10 Abott laboratories Piramal’s domestic
formulations business USD3.7 billion
Abott: Increased market share;
Piramal: Focus on core business
Outbound
November-12 Gulf Oil Corp Ltd Houghton International Inc USD1.1 billion Specialty chemicals
April-12 Kanoria Industries Ltd APAG Holding USD1.6 million Diversification into designing and engineering
July -11 United Phosphorus DVA Agro- Brazil USD150 million Producing and marketing crop
protection products
June -11 BASF India Cognis chemicals USD2.9 million Specialty chemicals
April -11 Tata Chemicals Gabon (Government project) USD290 million Access to huge potash reserves
Jun-10 United phosphorus DuPont’s fungicide
Business NA
UPL: Access to South and Central America
DuPont: Focus on core business
May-10 Piramal BioSyntech, Canada USD3.7 million Piramal: Access to technology
Source: Department of Chemicals and Petro Chemicals, Aranca Research
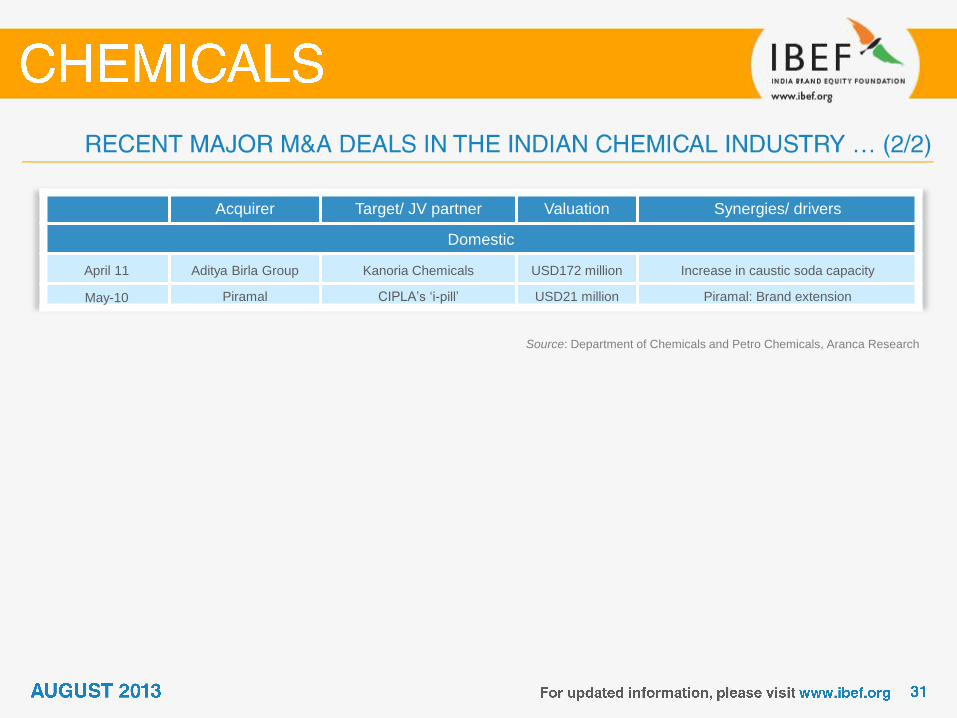
Acquirer Target/ JV partner Valuation Synergies/ drivers
Domestic
April 11 Aditya Birla Group Kanoria Chemicals USD172 million Increase in caustic soda capacity
May-10 Piramal CIPLA’s ‘i-pill’ USD21 million Piramal: Brand extension

Revenue breakup of TATA chemicals (FY12)
Source: TATA Strategic Analysis, Aranca Research
Notes: STPP * - Sodium Tripolyphosphate
IMACID - Indo Maroc Phosphore S.A.
Tata Chemicals Limited (TCL) is one of the leading
chemical companies in India, with significant operations in
India and Africa
Second-largest soda ash producer in the world and the
largest in India
A market leader in edible salt; largest STPP player in the
country
Most energy-efficient urea fertiliser manufacturer in India;
amongst the most efficient globally
1/3rd stake holder in IMACID, Morocco, assured supply of
key inputs
27%
10%
1%
16% 3%
38%
5% Complex fertilizers
Urea
Cement
Others
Other income
Soda Ash
Vacuum Salt
Source: Company Website, Aranca Research
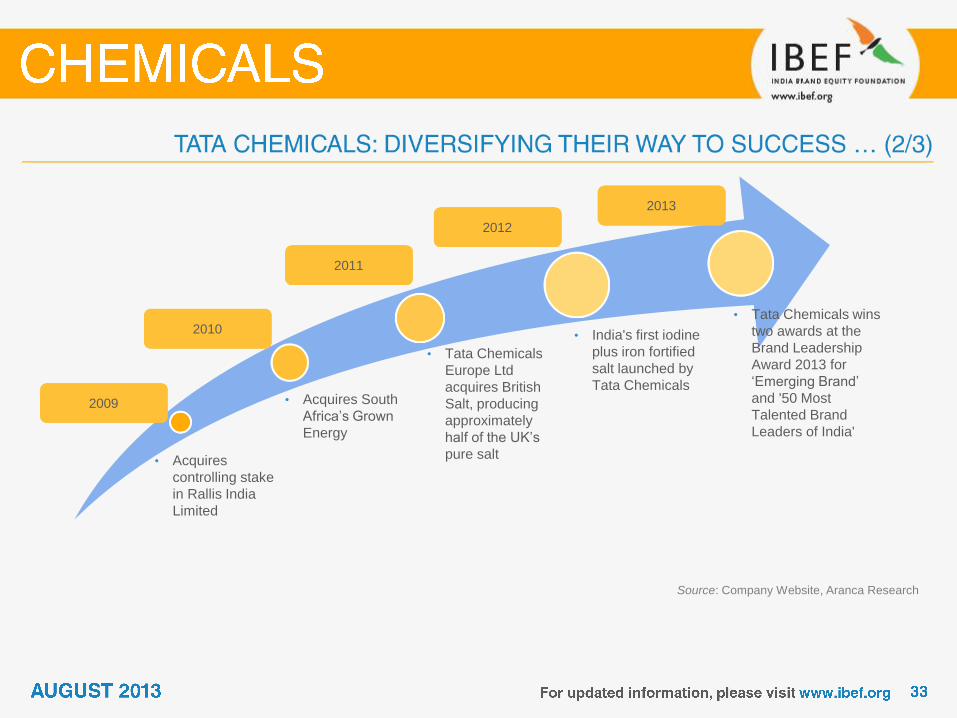
• Acquires
controlling stake
in Rallis India
Limited
• Acquires South
Africa’s Grown
Energy
• Tata Chemicals
Europe Ltd
acquires British
Salt, producing
approximately
half of the UK’s
pure salt
• Tata Chemicals wins
two awards at the
Brand Leadership
Award 2013 for
‘Emerging Brand’
and '50 Most
Talented Brand
Leaders of India'
2009
2010
2011
2012
2013
• India's first iodine
plus iron fortified
salt launched by
Tata Chemicals
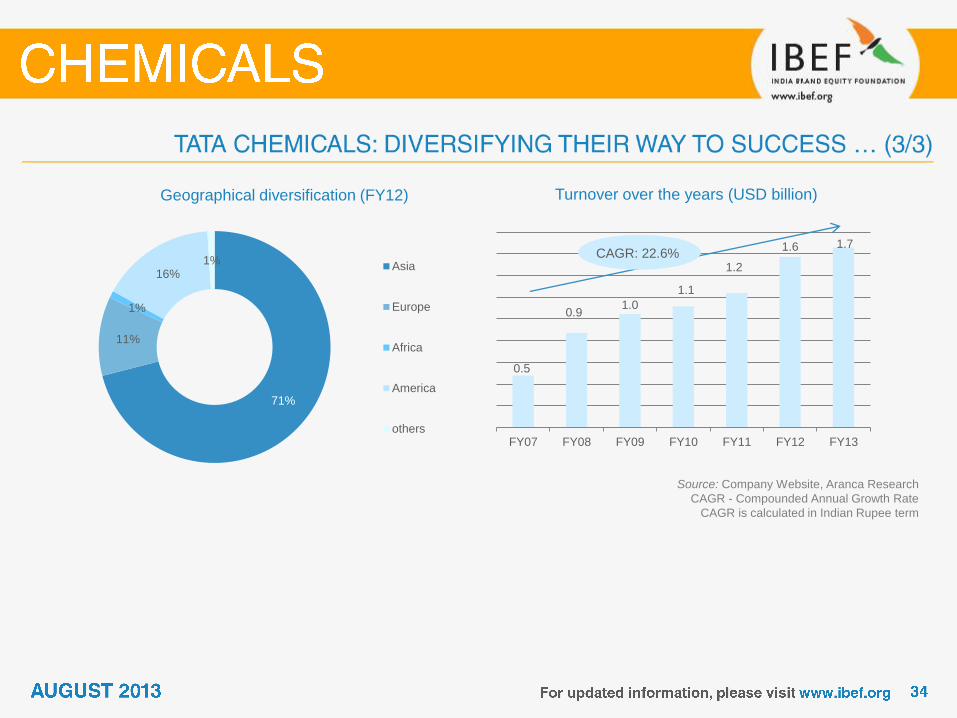
Geographical diversification (FY12)
Source: Company Website, Aranca Research
CAGR - Compounded Annual Growth Rate
CAGR is calculated in Indian Rupee term
Turnover over the years (USD billion)
0.5
0.9 1.0
1.1
1.2
1.6 1.7
FY07 FY08 FY09 FY10 FY11 FY12 FY13
71%
11%
1%
16% 1%
Asia
Europe
Africa
America
others
CAGR: 22.6%

Total sales (USD billion)
Source: United Phosphorus Limited (UPL) Annual Reports,
Aranca Research
Note: CAGR - Compound Annual Growth Rate
UPL is mainly engaged in the business of agrochemicals,
other industrial chemicals, and chemical intermediates
Agrochemicals account for 80 per cent of the total sales of
the company, while the industrial chemicals and
intermediates segments together account for 19 per cent
UPL has 23 manufacturing sites – nine in India, four in
France, two in Spain, three in Argentina, and one each in
UK, Vietnam, Netherlands, Italy and China
The company has also strengthened its distribution reach
and access to new markets through strategic alliances with
agrochemical manufacturers in other countries
The company is planning to launch innovative technology,
farming solutions, and new products through its other arms
such as Advanta and Golden Seeds
0.5
0.9
1.0
1.1
1.2
1.6 1.7
FY07 FY08 FY09 FY10 FY11 FY12 FY13
CAGR: 23%
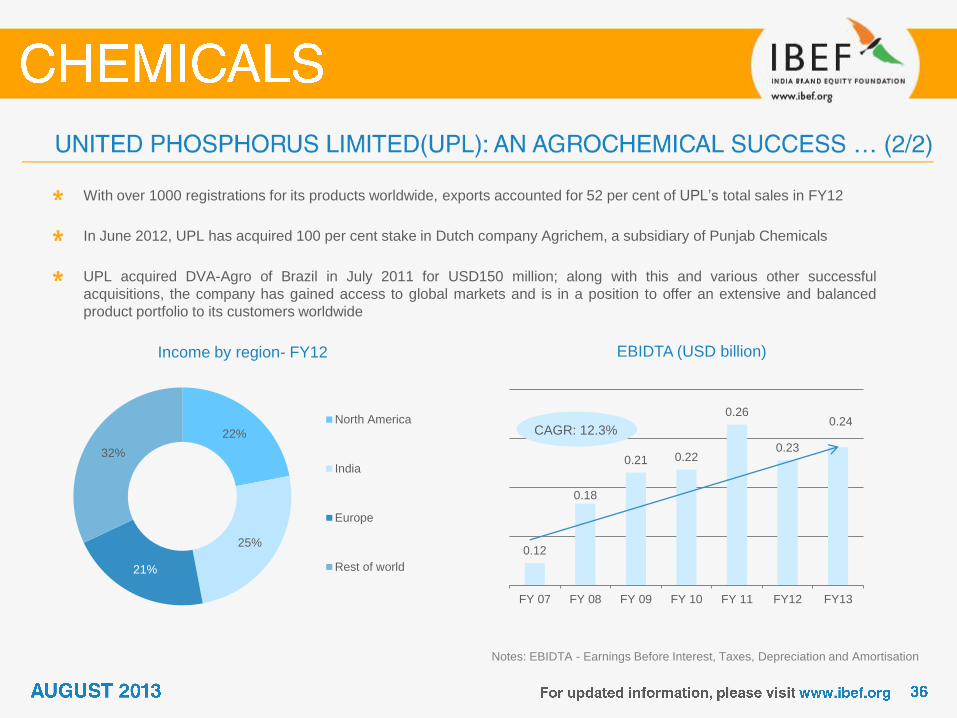
Income by region- FY12
Notes: EBIDTA - Earnings Before Interest, Taxes, Depreciation and Amortisation
With over 1000 registrations for its products worldwide, exports accounted for 52 per cent of UPL’s total sales in FY12
In June 2012, UPL has acquired 100 per cent stake in Dutch company Agrichem, a subsidiary of Punjab Chemicals
UPL acquired DVA-Agro of Brazil in July 2011 for USD150 million; along with this and various other successful
acquisitions, the company has gained access to global markets and is in a position to offer an extensive and balanced
product portfolio to its customers worldwide
EBIDTA (USD billion)
22%
25%
21%
32%
North America
India
Europe
Rest of world
0.12
0.18
0.21 0.22
0.26
0.23
0.24
FY 07 FY 08 FY 09 FY 10 FY 11 FY12 FY13
CAGR: 12.3%

Asian Paints geography wise sales (FY12)
Source: Company Annual report, Aranca Research;
Note: KL - Kilo Litre, CAGR - Compound Annual Growth Rate
In 1942, Asian Paints started manufacturing in a Mumbai garage; now, with total installed capacity of nearly 1 million kilo-
litre, Asian Paints is amongst the largest paint manufacturing companies in the world
Asian Paints has grown at an excellent pace over the years; a CAGR of 20.7 per cent from FY08–13
The company’s seventh and largest decorative paint manufacturing plant with an installed capacity was commissioned in
February 2013
The company has a wide presence across all home decorative products across geographies; the company featured in
Forbes Asia's Fab 50 List (2012)
Asian Paints sales (USD billion)
1.0 1.1 1.2
1.6
1.9 1.9
FY08 FY09 FY10 FY11 FY12 FY13
51.3%
26.8%
13.9%
8.0% Middle East
Asia
Caribbean
South Pacific
CAGR: 20.7%
334.2
224.5 252.9
386.9
566.9 625.3
FY08 FY09 FY10 FY11 FY12 FY13
India Glycols Limited sales (USD million)
Source: Company Annual report, Aranca Research;
Note: CAGR - Compound Annual Growth Rate
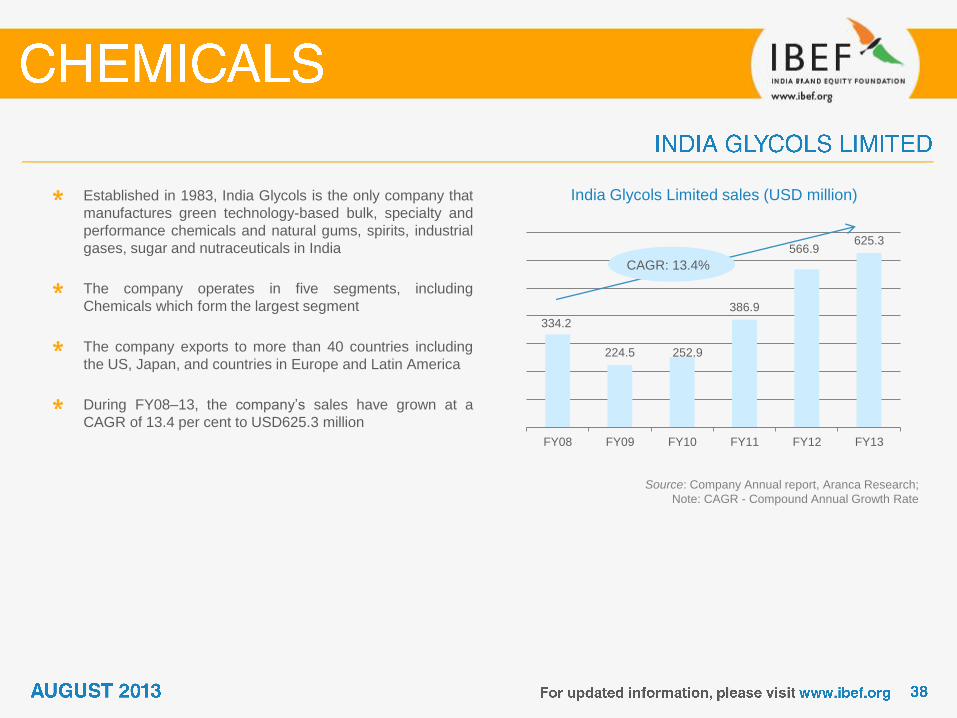
Established in 1983, India Glycols is the only company that
manufactures green technology-based bulk, specialty and
performance chemicals and natural gums, spirits, industrial
gases, sugar and nutraceuticals in India
The company operates in five segments, including
Chemicals which form the largest segment
The company exports to more than 40 countries including
the US, Japan, and countries in Europe and Latin America
During FY08–13, the company’s sales have grown at a
CAGR of 13.4 per cent to USD625.3 million
CAGR: 13.4%
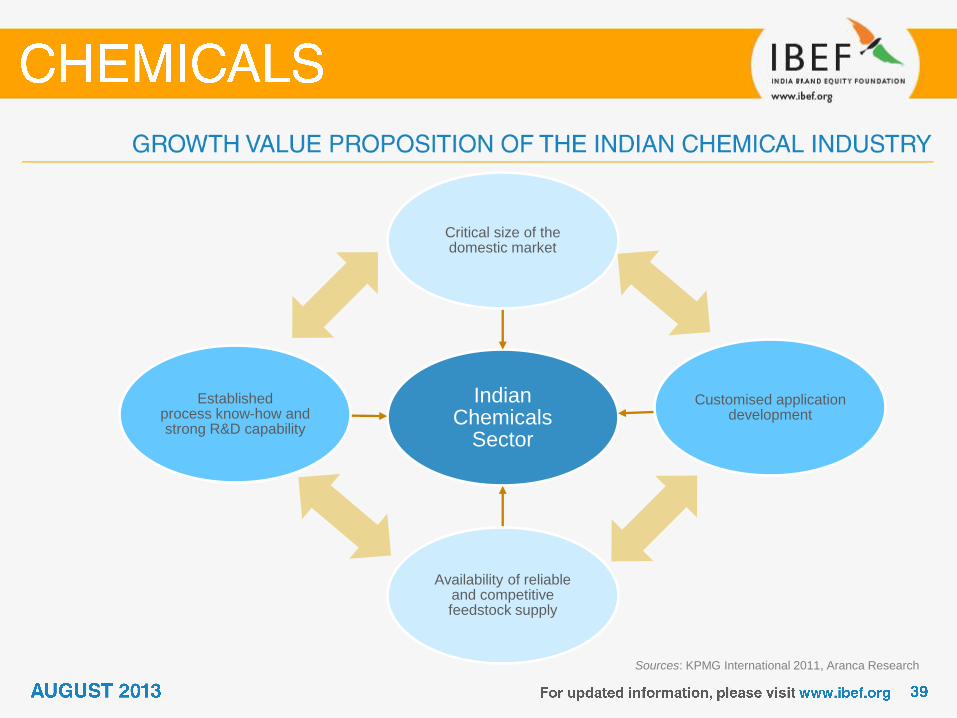
Indian Chemicals
Sector
Critical size of the domestic market
Customised application development
Availability of reliable and competitive feedstock supply
Established process know-how and strong R&D capability
Sources: KPMG International 2011, Aranca Research
18
38
FY11 FY17*
3.6
2.3
0.6 0.8 0.6
8.2
5.3
1.4 1.5
1.1
Paints andcoatings
Specialitypolymers
Constructionchemicals
Textilechemicals
Waterchemicals
FY11 FY17*
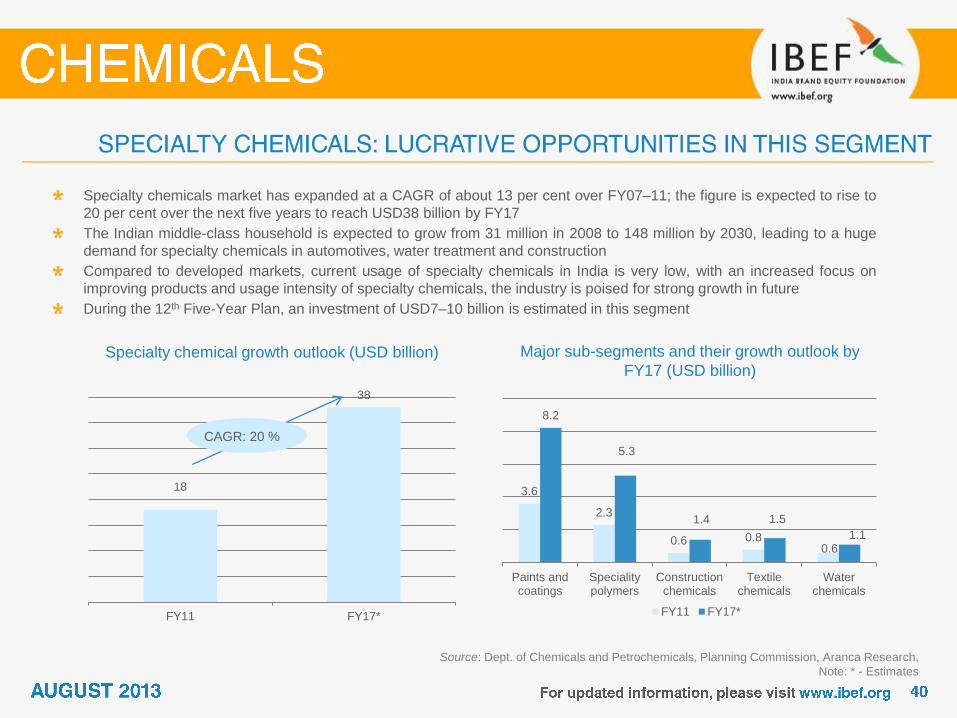
Specialty chemical growth outlook (USD billion)
Source: Dept. of Chemicals and Petrochemicals, Planning Commission, Aranca Research,
Note: * - Estimates
Specialty chemicals market has expanded at a CAGR of about 13 per cent over FY07–11; the figure is expected to rise to
20 per cent over the next five years to reach USD38 billion by FY17
The Indian middle-class household is expected to grow from 31 million in 2008 to 148 million by 2030, leading to a huge
demand for specialty chemicals in automotives, water treatment and construction
Compared to developed markets, current usage of specialty chemicals in India is very low, with an increased focus on
improving products and usage intensity of specialty chemicals, the industry is poised for strong growth in future
During the 12th Five-Year Plan, an investment of USD7–10 billion is estimated in this segment
Major sub-segments and their growth outlook by
FY17 (USD billion)
CAGR: 20 %
180
591
800
2005 2011 2015E
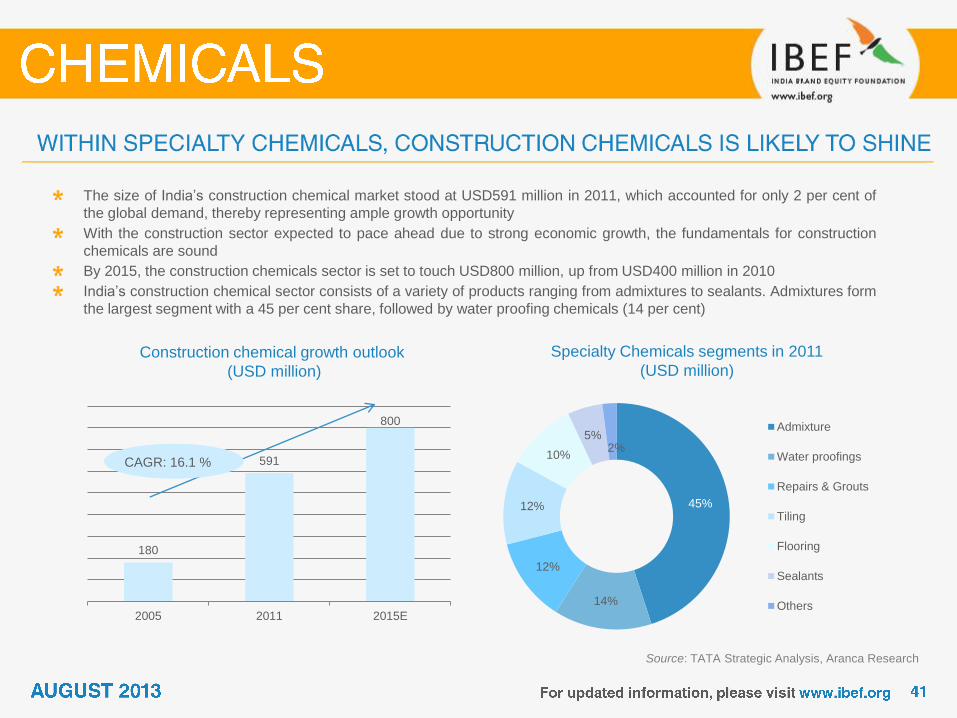
Construction chemical growth outlook
(USD million)
Source: TATA Strategic Analysis, Aranca Research
The size of India’s construction chemical market stood at USD591 million in 2011, which accounted for only 2 per cent of
the global demand, thereby representing ample growth opportunity
With the construction sector expected to pace ahead due to strong economic growth, the fundamentals for construction
chemicals are sound
By 2015, the construction chemicals sector is set to touch USD800 million, up from USD400 million in 2010
India’s construction chemical sector consists of a variety of products ranging from admixtures to sealants. Admixtures form
the largest segment with a 45 per cent share, followed by water proofing chemicals (14 per cent)
Specialty Chemicals segments in 2011
(USD million)
CAGR: 16.1 %
45%
14%
12%
12%
10%
5% 2%
Admixture
Water proofings
Repairs & Grouts
Tiling
Flooring
Sealants
Others

Source: Aranca Research
Automotive
Construction
Water
Automotive sector in India has
been expanding at a CAGR of
10 per cent over the last five
years. Automotive sector growth
will drive demand for automotive
components and consequently
for plastics, paints and coatings
used in their production
Water treatment chemicals
are widely used in purification
of water and also in large
power plants, refineries and
fertiliser factories
Construction industry in India has been
registering a CAGR of about 16 per cent
over the last few years and is likely to
gather momentum in the near future.
Adoption of advanced coating, ceiling and
polymer-based reinforcing material in
construction will drive the demand for
related chemicals
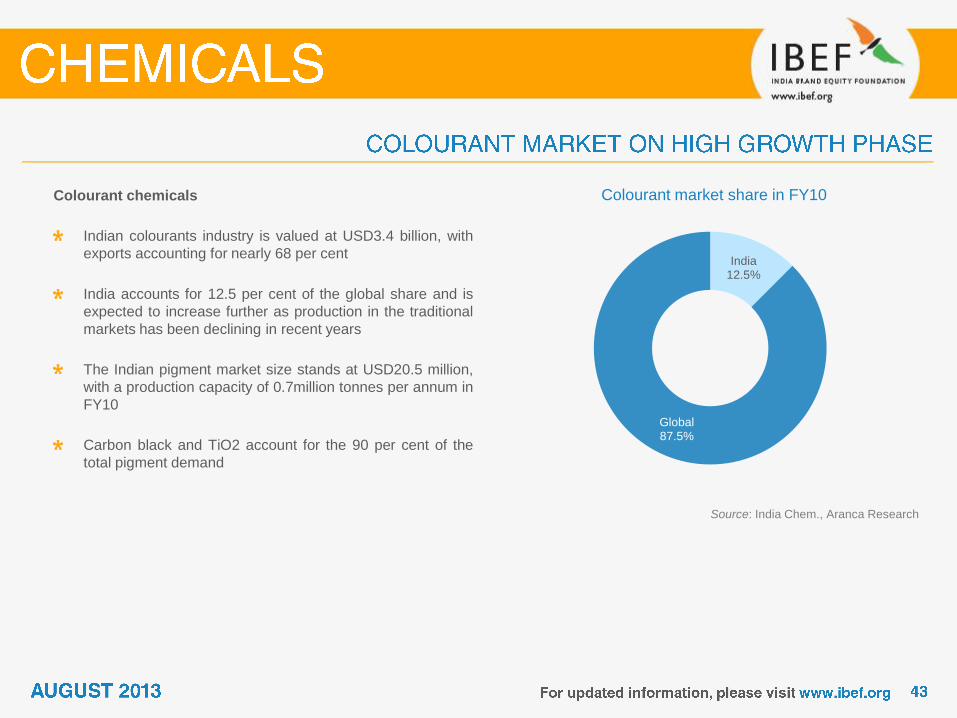
Colourant market share in FY10
Source: India Chem., Aranca Research
Colourant chemicals
Indian colourants industry is valued at USD3.4 billion, with
exports accounting for nearly 68 per cent
India accounts for 12.5 per cent of the global share and is
expected to increase further as production in the traditional
markets has been declining in recent years
The Indian pigment market size stands at USD20.5 million,
with a production capacity of 0.7million tonnes per annum in
FY10
Carbon black and TiO2 account for the 90 per cent of the
total pigment demand
India 12.5%
Global 87.5%
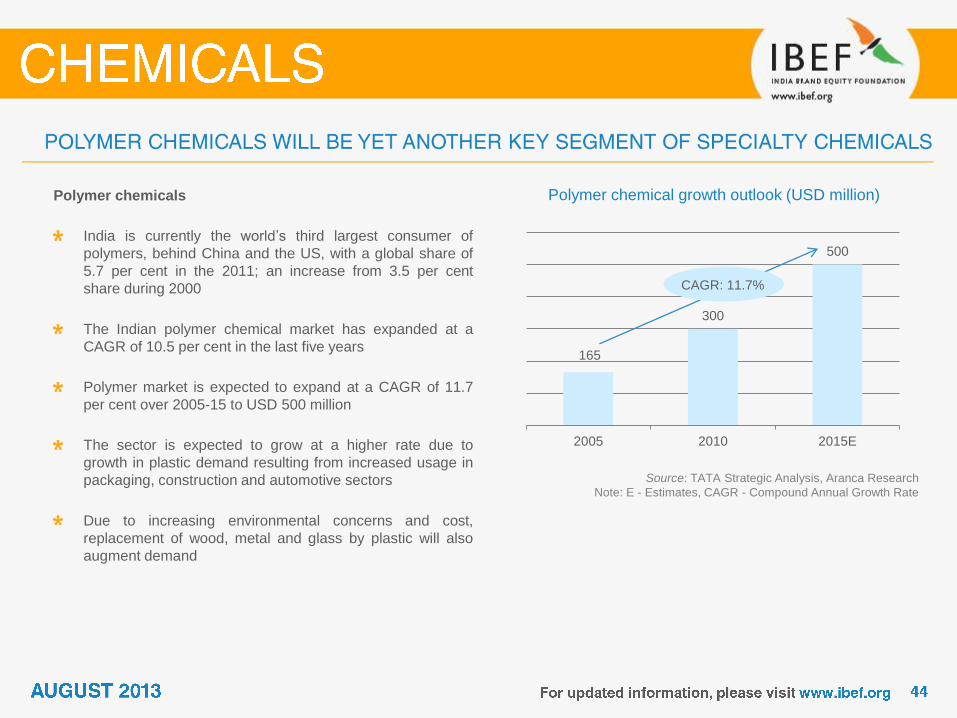
Polymer chemical growth outlook (USD million)
Source: TATA Strategic Analysis, Aranca Research
Note: E - Estimates, CAGR - Compound Annual Growth Rate
Polymer chemicals
India is currently the world’s third largest consumer of
polymers, behind China and the US, with a global share of
5.7 per cent in the 2011; an increase from 3.5 per cent
share during 2000
The Indian polymer chemical market has expanded at a
CAGR of 10.5 per cent in the last five years
Polymer market is expected to expand at a CAGR of 11.7
per cent over 2005-15 to USD 500 million
The sector is expected to grow at a higher rate due to
growth in plastic demand resulting from increased usage in
packaging, construction and automotive sectors
Due to increasing environmental concerns and cost,
replacement of wood, metal and glass by plastic will also
augment demand
165
300
500
2005 2010 2015E
CAGR: 11.7%
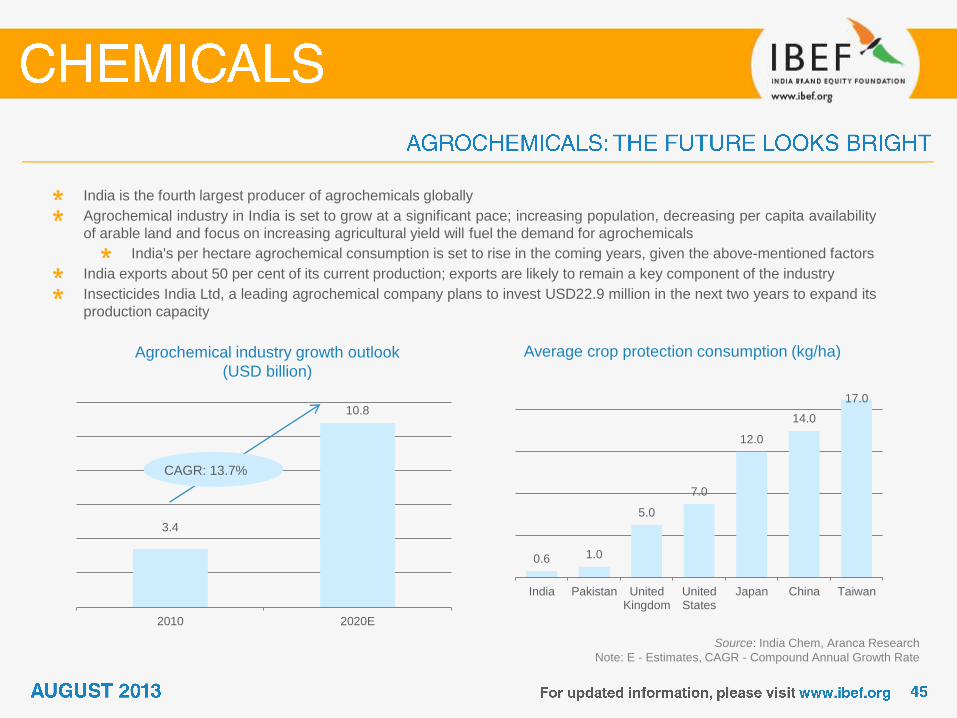
3.4
10.8
2010 2020E
Agrochemical industry growth outlook
(USD billion)
Source: India Chem, Aranca Research
Note: E - Estimates, CAGR - Compound Annual Growth Rate
India is the fourth largest producer of agrochemicals globally
Agrochemical industry in India is set to grow at a significant pace; increasing population, decreasing per capita availability
of arable land and focus on increasing agricultural yield will fuel the demand for agrochemicals
India's per hectare agrochemical consumption is set to rise in the coming years, given the above-mentioned factors
India exports about 50 per cent of its current production; exports are likely to remain a key component of the industry
Insecticides India Ltd, a leading agrochemical company plans to invest USD22.9 million in the next two years to expand its
production capacity
Average crop protection consumption (kg/ha)
CAGR: 13.7%
0.6 1.0
5.0
7.0
12.0
14.0
17.0
India Pakistan UnitedKingdom
UnitedStates
Japan China Taiwan
Indian Chemical Council Sir Vithaldas Chambers, 16-Mumbai Samachar Marg,
Mumbai – 400023
Phone: 91 22 22047649/ 22846852
Fax: 91 22 22048057
Website: www.icmaindia.com
Alkali Manufacturers Association of India 3rd Floor, Pankaj Chambers, Preet Vihar Commercial Complex,
Vikas Marg, New Delhi – 110092
Phone: 91 11 22432003, 22410150, 55253401
Fax: 91 11 22468249
Website: www.ama-india.org
Indian Specialty Chemical Manufacturers' Association 1156, Bole Smruti, Suryavanshi Kshatriya Sabhagriha Marg,
Off. Veer Savarkar Marg, Dadar (West)
Mumbai – 400 028
Tel: 91 22 2446 5003
Website: www.iscma.in
OCB: Overseas Corporate Bodies
NRI: Non-resident Indian
FY: Indian financial year (April to March)
So FY10 implies April 2009 to March 2010
NA: Not Available
STPP: Sodium tripolyphosphate
MT: Metric tonnes
USD: US Dollar
Wherever applicable, numbers have been rounded off to the nearest whole number
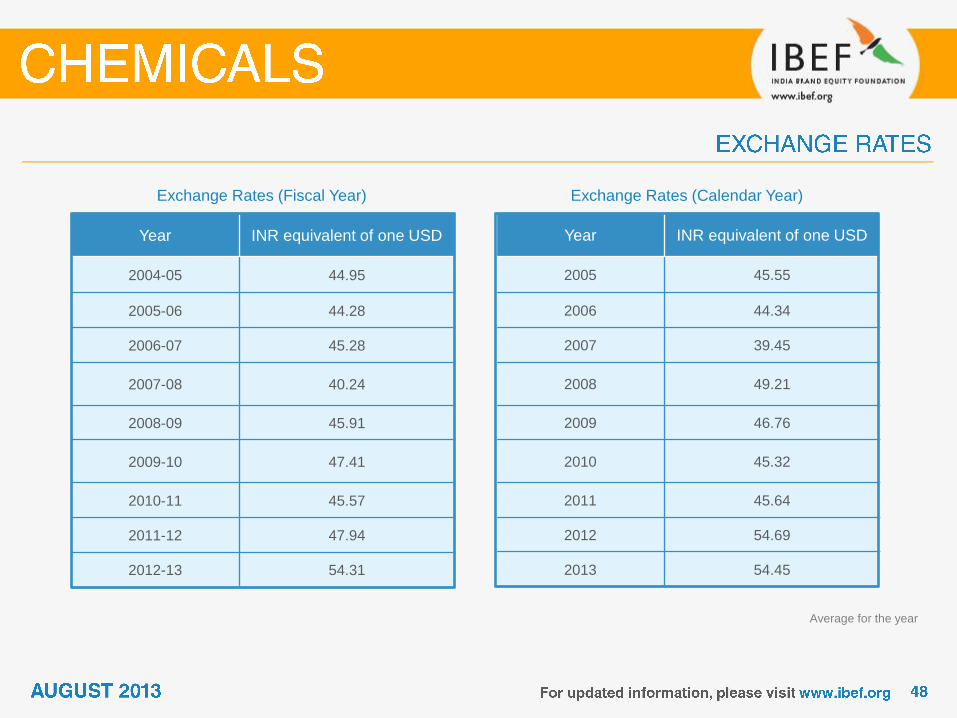
Year INR equivalent of one USD
2004-05 44.95
2005-06 44.28
2006-07 45.28
2007-08 40.24
2008-09 45.91
2009-10 47.41
2010-11 45.57
2011-12 47.94
2012-13 54.31
Exchange Rates (Fiscal Year)
Year INR equivalent of one USD
2005 45.55
2006 44.34
2007 39.45
2008 49.21
2009 46.76
2010 45.32
2011 45.64
2012 54.69
2013 54.45
Exchange Rates (Calendar Year)
Average for the year
India Brand Equity Foundation (“IBEF”) engaged Aranca to prepare this presentation and the same has been prepared
by Aranca in consultation with IBEF.
All rights reserved. All copyright in this presentation and related works is solely and exclusively owned by IBEF. The
same may not be reproduced, wholly or in part in any material form (including photocopying or storing it in any medium
by electronic means and whether or not transiently or incidentally to some other use of this presentation), modified or in
any manner communicated to any third party except with the written approval of IBEF.
This presentation is for information purposes only. While due care has been taken during the compilation of this
presentation to ensure that the information is accurate to the best of Aranca and IBEF’s knowledge and belief, the
content is not to be construed in any manner whatsoever as a substitute for professional advice.
Aranca and IBEF neither recommend nor endorse any specific products or services that may have been mentioned in
this presentation and nor do they assume any liability or responsibility for the outcome of decisions taken as a result of
any reliance placed on this presentation.
Neither Aranca nor IBEF shall be liable for any direct or indirect damages that may arise due to any act or omission on
the part of the user due to any reliance placed or guidance taken from any portion of this presentation.


