29
Lean Process Flow Project at Wells Fargo Financial Proplanner Webinar September 6, 2007 Aaron Bruner
| Date post: | 22-Dec-2015 |
| Category: |
Documents |
| View: | 218 times |
| Download: | 0 times |

Lean Process Flow Project at Wells Fargo Financial
Proplanner Webinar
September 6, 2007
Aaron Bruner

Introducing Wells Fargo Financial
WFF financing allows clients such as Slumberland to offer “12 Months No Interest and No Payments”
We maintain clients by funding and servicing their customers’ transactions
We Provide Private Label Credit Card Services for Clients

Introducing the Document Storage Department
Centralized document storage operations in Des Moines We process over 300,000 documents per month Applications and sales slips are retained so that we have
proof of a binding contract between us and the customer
Wells Fargo Retailer Services in Des Moines

Document Retention - Process Overview
Dealers mail customer applications to our department We image and then store documents for a specified period
of time before destroying Retrieve documents or images when requested
Document Viewed as an Image on Intranet
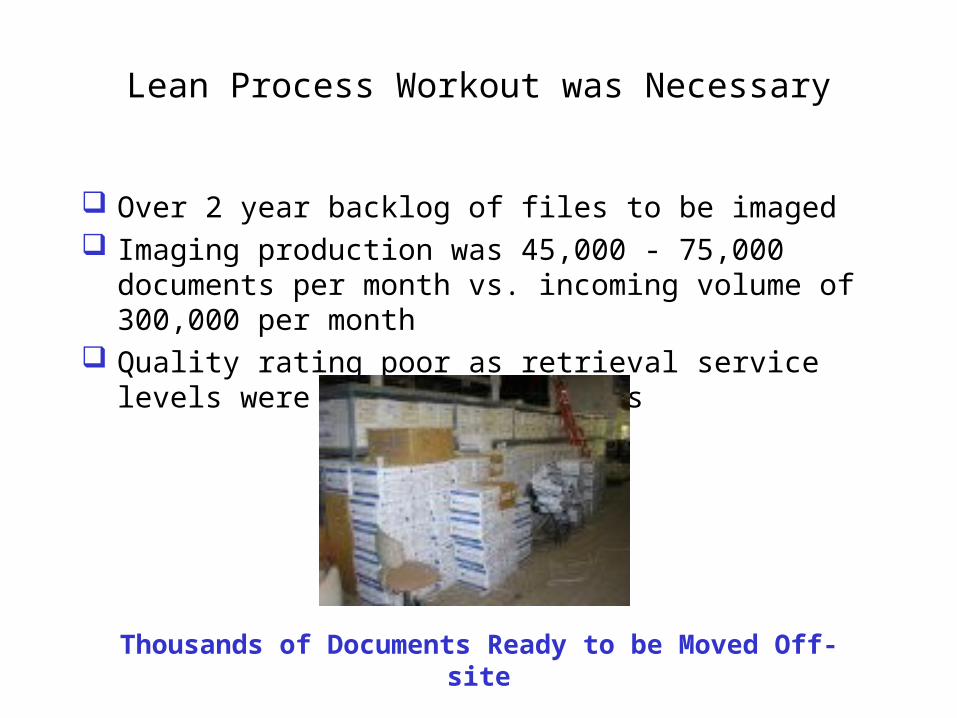
Lean Process Workout was Necessary
Over 2 year backlog of files to be imaged Imaging production was 45,000 - 75,000 documents per
month vs. incoming volume of 300,000 per month Quality rating poor as retrieval service levels were often
over 14 days
Thousands of Documents Ready to be Moved Off-site

Build S.I.P.O.C. of document storage process Develop value stream maps Create detailed process flow chart Record processing times and Balance Processes* Analyze value add and non-value added tasks* Roll-out new processes for Future State Record productivity and retrieval summary
Lean Workout Project Steps
* ProBalance and Workplace Planner from Proplanner Used

S I P O C
Start
Clients Invoice Collections
Bankruptcy Dept. Application Legal
Dealer Set-up Charge Slips Fraud Dept.
Transmitals/BuyLine Tickets
WI Notices Bankruptcy Dept.
Legal Documents Retrievable Image Compliance & QCU
Customers
Document Storage Process
Suppliers Input Process Output
Dealer/BK Dept submits documents to Retailer Doc
Retention
Document is imaged
Document is filed
Document is prepped
Document is validated/indexed
S.I.P.O.C.

CustomerDealer / Client
Operations Management i.e.: Control
10 Docs Requested / Day
Mail Delivery3-4 trips per day
Fax \ Intranet Document Scan
OPEN
C\T
Cap
Avail
Prep
C\T
Cap
Avail
File
C\T
Cap
Avail
SCAN
C\T
Cap
Avail
INDEX
C\T
Cap
Avail
File
C\T
Cap
Avail
Work Director
Weekly
Forecast
Retrievals Estimate
7 Days
2 min
1 Hr
2 min
1 Day
2 min
7 Days
1 Sec
1 Hr
5 Min
1 Day
1 min
5 Day
Value Stream Map – Beginning State
14 Days
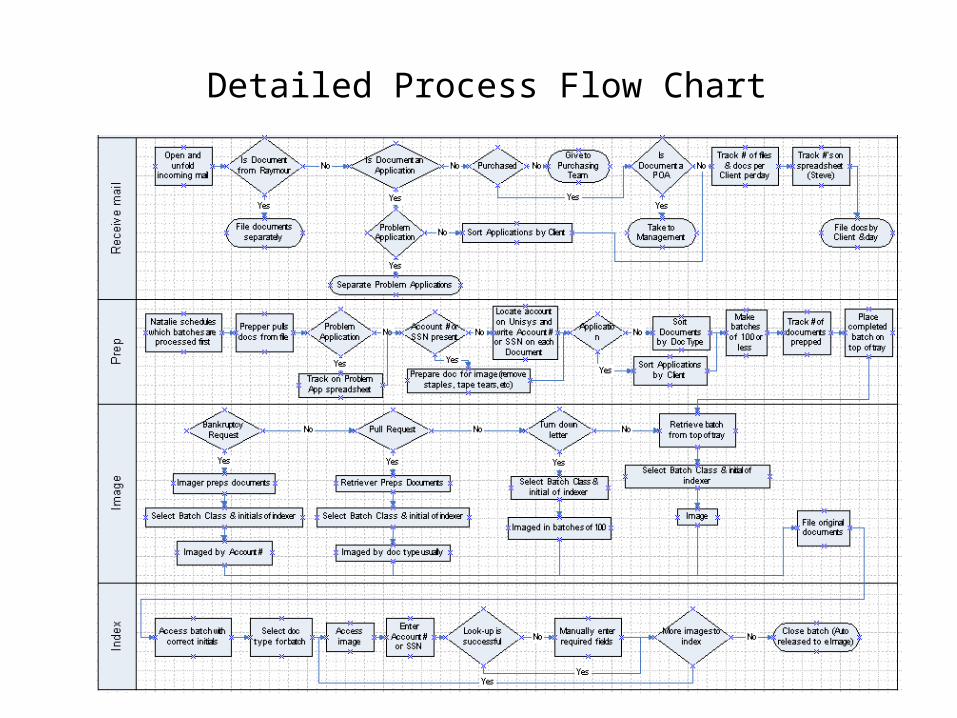
Detailed Process Flow Chart
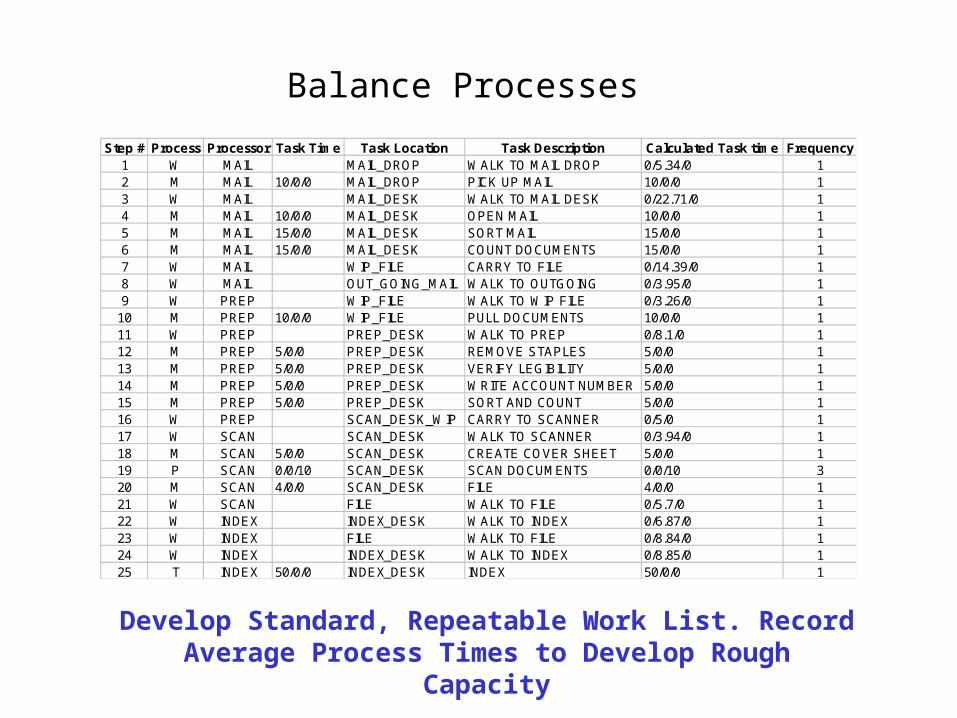
Balance Processes
Develop Standard, Repeatable Work List. Record Average Process Times to Develop Rough Capacity
Step # Process Processor Task Time Task Location Task Description Calculated Task time Frequency1 W MAIL MAIL_DROP WALK TO MAIL DROP 0/5.34/0 12 M MAIL 10/0/0 MAIL_DROP PICK UP MAIL 10/0/0 13 W MAIL MAIL_DESK WALK TO MAIL DESK 0/22.71/0 14 M MAIL 10/0/0 MAIL_DESK OPEN MAIL 10/0/0 15 M MAIL 15/0/0 MAIL_DESK SORT MAIL 15/0/0 16 M MAIL 15/0/0 MAIL_DESK COUNT DOCUMENTS 15/0/0 17 W MAIL WIP_FILE CARRY TO FILE 0/14.39/0 18 W MAIL OUT_GOING_MAIL WALK TO OUTGOING 0/3.95/0 19 W PREP WIP_FILE WALK TO WIP FILE 0/3.26/0 1
10 M PREP 10/0/0 WIP_FILE PULL DOCUMENTS 10/0/0 111 W PREP PREP_DESK WALK TO PREP 0/8.1/0 112 M PREP 5/0/0 PREP_DESK REMOVE STAPLES 5/0/0 113 M PREP 5/0/0 PREP_DESK VERIFY LEGIBILITY 5/0/0 114 M PREP 5/0/0 PREP_DESK WRITE ACCOUNT NUMBER 5/0/0 115 M PREP 5/0/0 PREP_DESK SORT AND COUNT 5/0/0 116 W PREP SCAN_DESK_WIP CARRY TO SCANNER 0/5/0 117 W SCAN SCAN_DESK WALK TO SCANNER 0/3.94/0 118 M SCAN 5/0/0 SCAN_DESK CREATE COVER SHEET 5/0/0 119 P SCAN 0/0/10 SCAN_DESK SCAN DOCUMENTS 0/0/10 320 M SCAN 4/0/0 SCAN_DESK FILE 4/0/0 121 W SCAN FILE WALK TO FILE 0/5.7/0 122 W INDEX INDEX_DESK WALK TO INDEX 0/6.87/0 123 W INDEX FILE WALK TO FILE 0/8.84/0 124 W INDEX INDEX_DESK WALK TO INDEX 0/8.85/0 125 T INDEX 50/0/0 INDEX_DESK INDEX 50/0/0 1
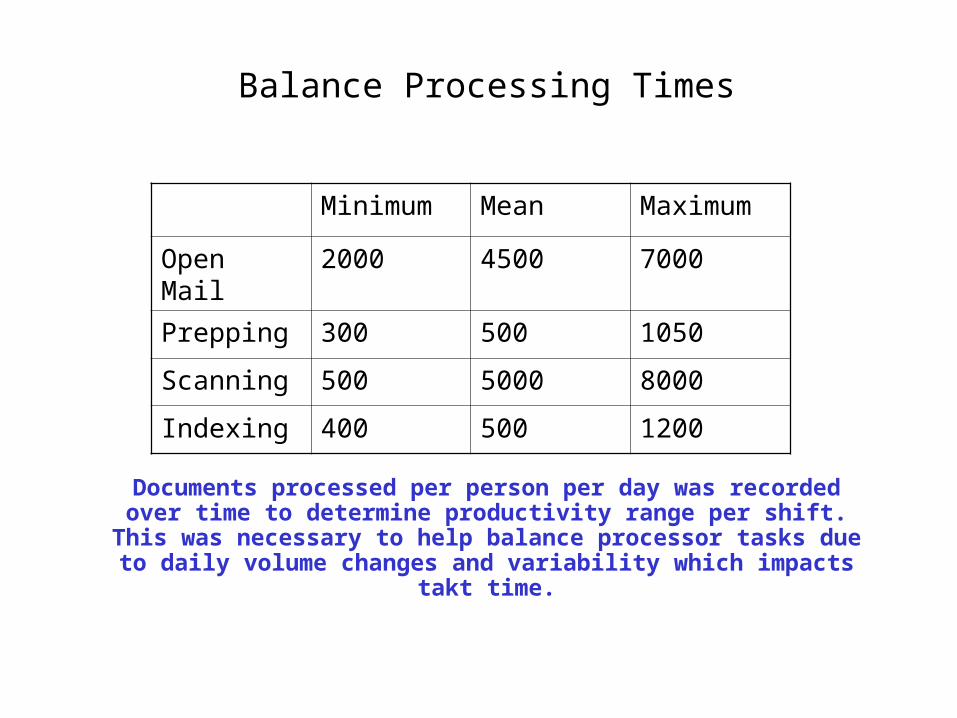
Documents processed per person per day was recorded over time to determine productivity range per shift. This
was necessary to help balance processor tasks due to daily volume changes and variability which impacts takt time.
Minimum Mean Maximum
Open Mail 2000 4500 7000
Prepping 300 500 1050
Scanning 500 5000 8000
Indexing 400 500 1200
Balance Processing Times
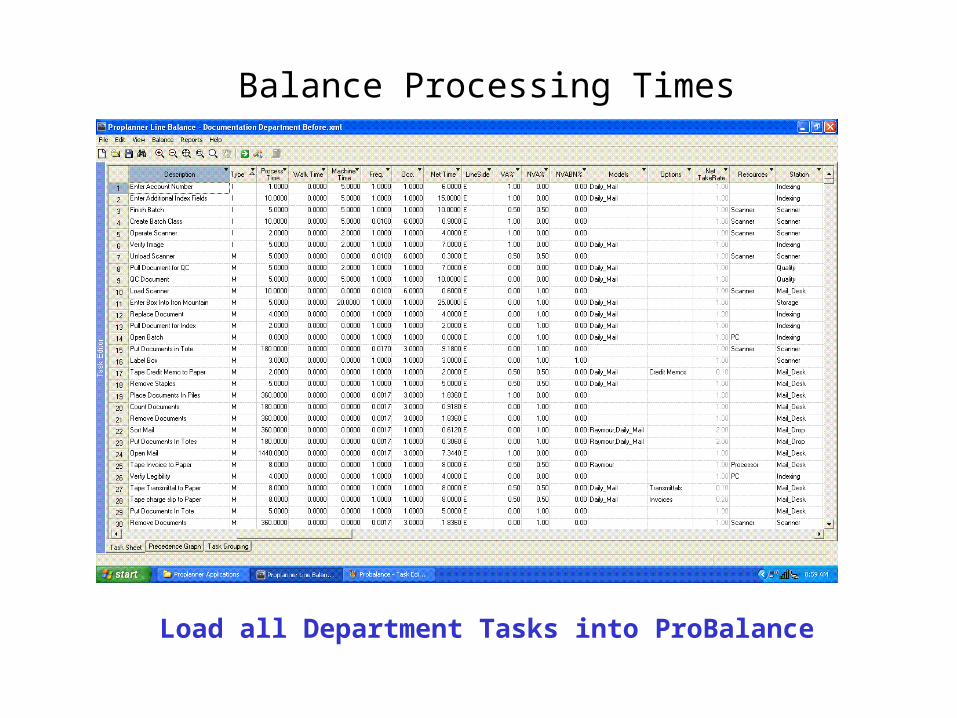
Load all Department Tasks into ProBalance
Balance Processing Times

Look at Existing Balance of Tasks Among Stations
Balance Processes

Review Station Summary During Balancing Process
Balance Processes

Evaluate Processes On the Layout
Workplace Planner to Calculate Non-Value Added Times

Analyze Non-Value Added Tasks
Walk Path Diagram to Calculate Non-Value Added Times

Analyze Non-Value Added Tasks
Lean Graph shows Percentage of Non Value Added Work

Compare Processes on Layout Alternatives
Results and Reports Assist with the Layout Improvements

Standardized Work Chart
From
To
Date Prepared Dept./Location Team Leader SupervisorPrepared by
Quality Check Safety Precaution Standard WIP Units of STD WIP Takt Time Cycle Time Operation
DMIC RetailerEvent Team10-24-06Retailer CellAP/ Daily/Raymour
Wes SepterBob Engler
Input of Retailer
Scanner of Retailer
1 box
Kevin Dellopoulos
Standard Work Chart
ALLRaymour 1.5 secDaily/ AP 3 sec
Raymour 125.2 minDaily/AP 169.5
Prep APrep B
Prep C
Jogger
Current State
One Piece Flow – Beginning State
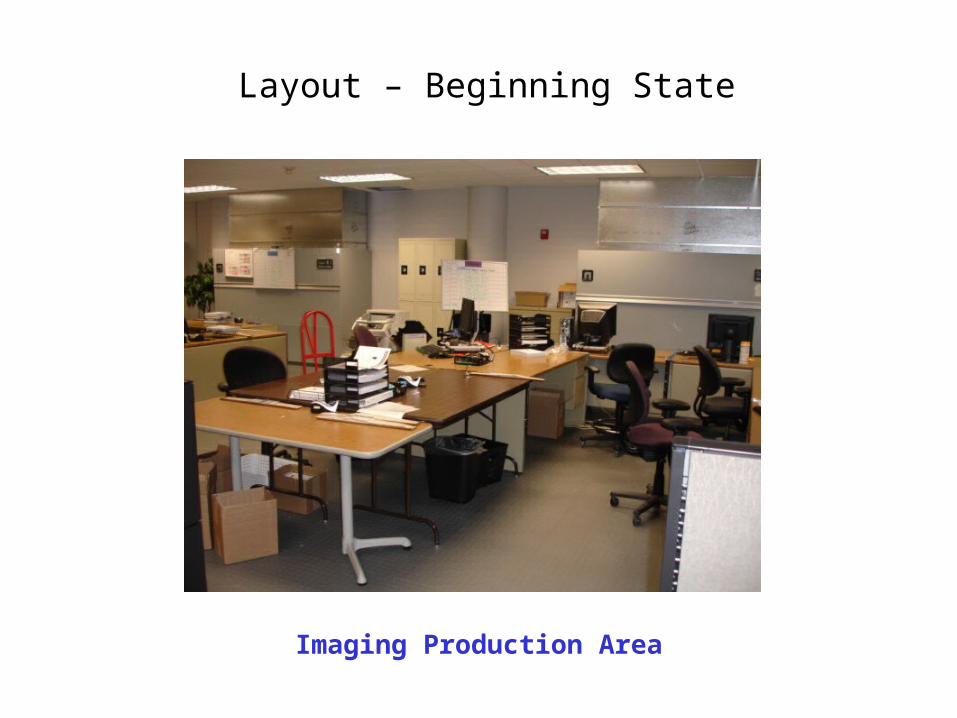
Layout – Beginning State
Imaging Production Area

Standardized Work Chart
From
To
Date Prepared Dept./Location Team Leader SupervisorPrepared by
`
Quality Check Safety Precaution Standard WIP Units of STD WIP Takt Time Cycle Time Operation
DMIC RetailerEvent Team10-24-06Retailer CellAP/ Daily/Raymour
Wes SepterBob Engler
Jogg
er
Prep A
Prep C
Prep B
Input Doc’s Prepped Doc’sPrepped Doc’s Incoming
work
Input Doc’s
Tracking From A and B
Tracking From A and B
Tracking From A and B
Input of Retailer
Scanner of Retailer
≈150 documents
Kevin Dellopoulos
Standard Work Chart
ALL
Jogg
er
Raymour 2.3Daily/ AP 2.52
Raymour 31:20Daily/AP 1:41:00
Staged box
`
One Piece Flow – Future State

Layout – Future State
New Imaging Production Cells
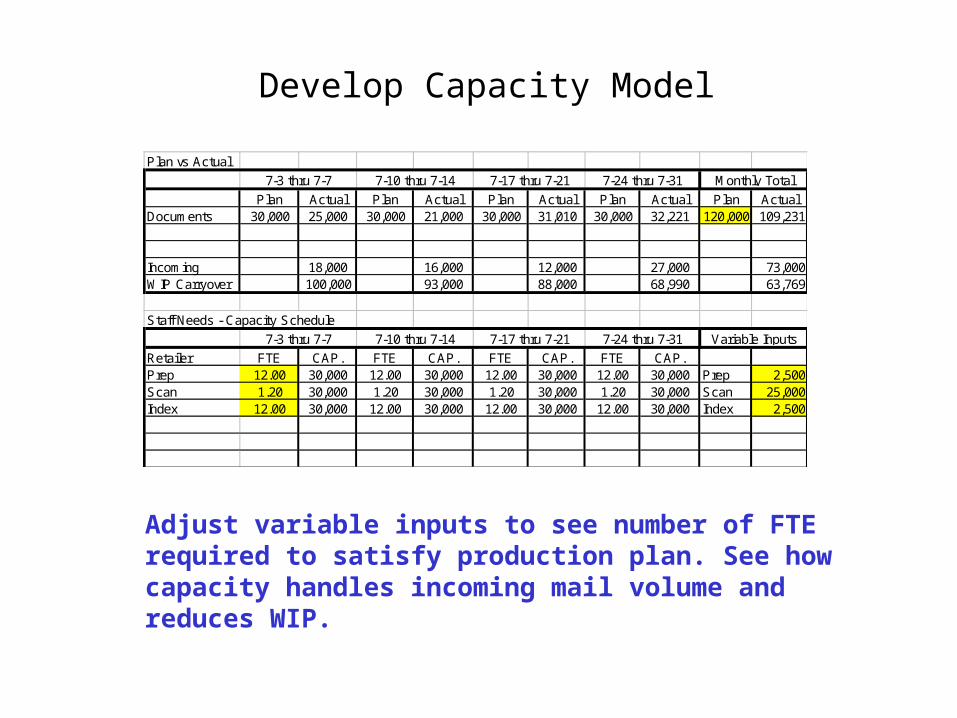
Adjust variable inputs to see number of FTE required to satisfy production plan. See how capacity handles incoming mail volume and reduces WIP.
Develop Capacity Model
Plan vs Actual
Plan Actual Plan Actual Plan Actual Plan Actual Plan ActualDocuments 30,000 25,000 30,000 21,000 30,000 31,010 30,000 32,221 120,000 109,231
Incoming 18,000 16,000 12,000 27,000 73,000WIP Carryover 100,000 93,000 88,000 68,990 63,769
Staff Needs - Capacity Schedule
Retailer FTE CAP. FTE CAP. FTE CAP. FTE CAP.Prep 12.00 30,000 12.00 30,000 12.00 30,000 12.00 30,000 Prep 2,500Scan 1.20 30,000 1.20 30,000 1.20 30,000 1.20 30,000 Scan 25,000Index 12.00 30,000 12.00 30,000 12.00 30,000 12.00 30,000 Index 2,500
Monthly Total
7-3 thru 7-7 7-10 thru 7-14 7-17 thru 7-21 7-24 thru 7-31 Variable Inputs
7-3 thru 7-7 7-10 thru 7-14 7-17 thru 7-21 7-24 thru 7-31

Customer
Dealer / Client
Operations Management i.e.: Control
10 Docs Requested / Day
Mail Delivery3-4 trips per day
View Document on Intranet
OPEN
C\T
Cap
Avail
Prep
C\T
Cap
Avail
SCAN
C\T
Cap
Avail
INDEX
C\T
Cap
Avail
File
C\T
Cap
Avail
Processing Cell
Weekly
Forecast
Retrievals Estimate
7 Days
1 min
1 min
1 min
5 min
.01 min
40 min
.4 min
.1 min
.5 min
5 min 1 Day
Value Stream Map – Present State
< 1 Day

68,006
34,425 39,37717,480
85,877
29,246
210,075
83,132279,16
1
105,809
321,320
143,293
January February March April May June July August September October November December0
100,000
200,000
300,000
400,000
500,000
Month
To
tal #
Ima
ge
d
Total # Central Capture & Retailer Imaged
RB
R
RB
R
Ca
ptu
re C
en
ter
RB
R
Ca
ptu
re C
en
ter
Ca
ptu
re C
en
ter
Productivity Improvements
Productivity Increased Over 6 Months
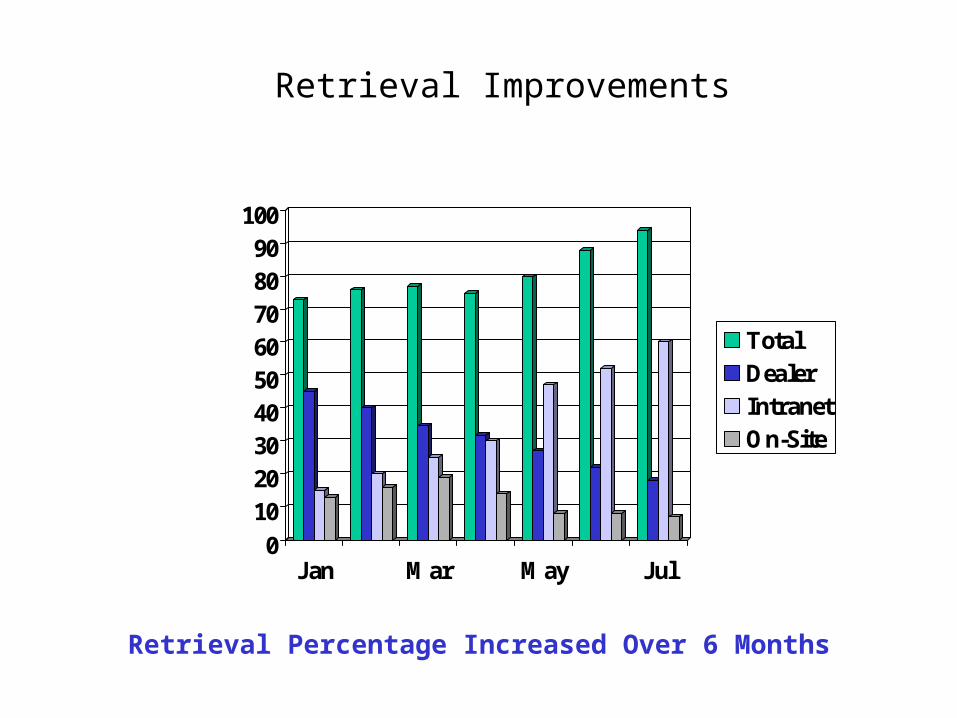
Retrieval Improvements
Retrieval Percentage Increased Over 6 Months
0
102030405060708090100
Jan Mar May Jul
TotalDealerIntranetOn-Site

Beginning State Project Duration Post Project
Several Million Documents on-site
Organized and moved off site to secure storage
Stored off-site in secure storage
2 Year Imaging Backlog
Jan 1, 2003 and newer has been imaged
24 hr SLA from receipt of document to being available as an image on Intranet
Project Productivity Summary
Productivity Increase Will Help Quality of Retrievals

Beginning State Project Duration Post Project
Documents found on-site or at client
Documents on-site, Intranet or at client
All documents on Intranet
Retrieval requests are manual
Dept. finds most on Intranet and some manual
Dept. finds all on Intranet – automated
Approx 14 Day Service Level
Approx 7 Day Service Level
Immediate to under 1 Day Service Level
Retrievals at 75% found
Retrievals @ 85% found
Retrievals @ > 97% found
Document Retrieval Summary
Quality of Retrieval Requests up Significantly

Proplanner Software Review
• ProBalance
• Workplace Planner


