39
Learning to Profit in the New Normal Prepared for 2012 Specialty Paper Conference Frank Perkowski Business Development Advisory November 9, 2012

Learning to Profit in
the New Normal
Prepared for
2012 Specialty Paper Conference
Frank PerkowskiBusiness Development Advisory
November 9, 2012
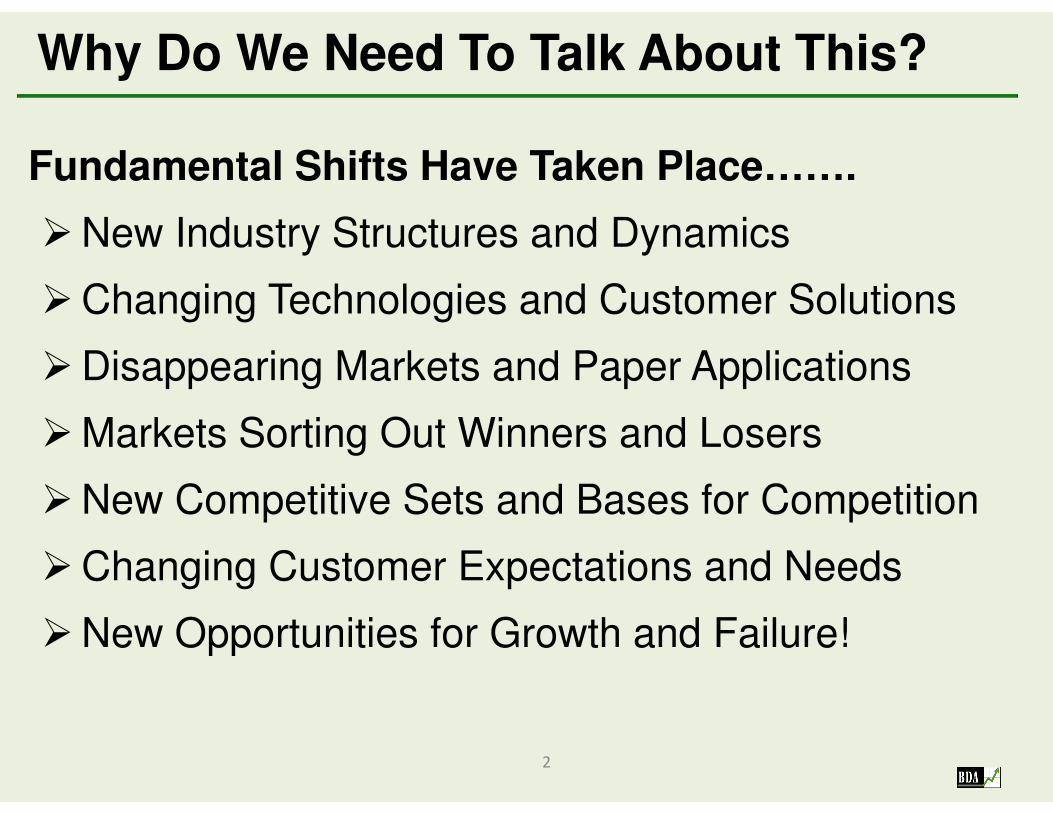
Fundamental Shifts Have Taken Place…….
�New Industry Structures and Dynamics
�Changing Technologies and Customer Solutions
�Disappearing Markets and Paper Applications
Why Do We Need To Talk About This?
2
�Markets Sorting Out Winners and Losers
�New Competitive Sets and Bases for Competition
�Changing Customer Expectations and Needs
�New Opportunities for Growth and Failure!

1. What has changed / stayed
the same?
2. How should specialty paper
Presentation Outline
3
2. How should specialty paper
companies respond?
3. Path Forward

What Has
Changed or
4
Changed or
Stayed the Same?

The World Has Changed Overnight!
�Electronic Media Growth
�Graphic Paper Declines
�Industry Shift to Asia / LA
�Declining US Paper Demand
�Recession Impact on Usage
�Nano Technology Development
�Globalization / Localization
� Asia / New Economy Growth
�Convenience Technologies
�Connected World
�Social Networking
�Smart Technologies
Macro Developments Industry Developments
5
�Nano Technology Development
�Paper / Plastic Interactions
�Secure Packaging Solutions
�Sustainable Materials Focus
�Third Party Certifications
�Renewable Energy Sources
�Industry Consolidation
�Company Repositionings
�Import / Export Growth
�New Wax / Plastic Alternatives
�Smart Technologies
�Increased Transparency
�Sustainability Focus
�New Energy Solutions
�Aging Populations
�Female Empowerment
�Health & Well Being
�Terrorism / Security
�Global Economic Collapse
�US Economic Decline

Paper Demand Has Shifted
100
110
120
130
US
Pro
du
ctio
n In
de
x (2
00
7 =
10
0)
Historic US Paper Production Trends by Selected Grade (1982-2012)
Total Paper Production
Other converted paper
Paper bag & coated / treated paper
All Publishing Papers
New
Normal
6
60
70
80
90
19
82
-01
19
82
-09
19
83
-05
19
84
-01
19
84
-09
19
85
-05
19
86
-01
19
86
-09
19
87
-05
19
88
-01
19
88
-09
19
89
-05
19
90
-01
19
90
-09
19
91
-05
19
92
-01
19
92
-09
19
93
-05
19
94
-01
19
94
-09
19
95
-05
19
96
-01
19
96
-09
19
97
-05
19
98
-01
19
98
-09
19
99
-05
20
00
-01
20
00
-09
20
01
-05
20
02
-01
20
02
-09
20
03
-05
20
04
-01
20
04
-09
20
05
-05
20
06
-01
20
06
-09
20
07
-05
20
08
-01
20
08
-09
20
09
-05
20
10
-01
20
10
-09
20
11
-05
20
12
-01
US
Pro
du
ctio
n In
de
x (2
00
7 =
10
0)
Source: US
Census Data

Pricing Trends Vary By Grade / Market
200
225
250
US
No
min
al P
rice
Ind
ex
(19
82
=1
00
)
Historic US Nominal Price Trends for Major Paper / Converting Grades
Packaging & Ind Converting Paper
Paperboard
Overall Paper
Printing & Writing Papers
Coated / Laminated Papers
All Commodities
7
125
150
175
20
02
-1
20
02
-4
20
02
-7
20
02
-10
20
03
-1
20
03
-4
20
03
-7
20
03
-10
20
04
-1
20
04
-4
20
04
-7
20
04
-10
20
05
-1
20
05
-4
20
05
-7
20
05
-10
20
06
-1
20
06
-4
20
06
-7
20
06
-10
20
07
-1
20
07
-4
20
07
-7
20
07
-10
20
08
-1
20
08
-4
20
08
-7
20
08
-10
20
09
-1
20
09
-4
20
09
-7
20
09
-10
20
10
-1
20
10
-4
20
10
-7
20
10
-10
20
11
-1
20
11
-4
20
11
-7
20
11
-10
20
12
-1
20
12
-4
US
No
min
al P
rice
Ind
ex
(19
82
=1
00
)

Paper Application Dynamics Changing
0.0%
1.0%
2.0%
3.0%
Av
era
ge
De
ma
nd
Gro
wth
Ra
tes
by
5 Y
ea
r P
eri
od
Specialty Paper Growth Rates by End Use Application
2006-2010 AAPC
2011-2015 AAPC
8
-3.0%
-2.0%
-1.0%
Av
era
ge
De
ma
nd
Gro
wth
Ra
tes
by
5 Y
ea
r P
eri
od

Winners and Losers in Specialty Paper
0.0%
2.0%
4.0%
6.0%
8.0%
Estimated Growth Rate Trends by Major Specialty Paper Grade
Sorted Based on Five Year Projected Rate
2006-2010 AAPC
2011-2015 AAPC
9
-10.0%
-8.0%
-6.0%
-4.0%
-2.0%
Art papers Kraft specialties Photographic base
Asphalt sat base Label facestock Premium cutsize
Carbonless Label release base Premium writing
Coating base Laminating base Security papers
Décor paper Latex sat base Text & cover
Direct thermal base Lightweight pkg Tissue pkg / wraps
Electrical papers Lightweight printing Wallpaper base
Filter base stock Medical / Hygienic Waxing base
Industrial sat base OGR treated Wide format inkjet
Specialty Paper Grades In Study

Competitive Dynamics Have Shifted
� Fewer but more focused / smaller competitors in many segments
� More disciplined pricing environments� Lower capital investment but… more
flexible / capable assets
10
flexible / capable assets� Better management / optimization focus� Less import threats in some markets
while export opportunities expand� Widening gap between commodity and
specialty solutions

Customers Have Different Needs
� More knowledgeable / informed� More sophisticated supplier selection /
product qualification process� Stronger emphasis on preferred
suppliers and relationship development
11
suppliers and relationship development� Consolidations have improved
operations / focus � Sustainability / environmental focus
resulting in new solutions� Increased global orientation

Changing Product Requirements
� Electronic substitution threat accelerating
� More customer SKU’s and increased targeting capabilities
� Increased cost focus due to economy� More integrated products / solutions
12
� More integrated products / solutions� Higher performing materials available� Need for more sustainable materials and
processes� E-commerce and electronics affecting
every aspect of product and delivery
How Should
Specialty Paper
13
Specialty Paper
Companies
Respond?

Re - Evaluate Your Business
Develop and implement successful business models by employing time - tested management practices that chart your future development activities …….
� Understand how the industry is changing� Respond to Industry structural shifts� Prune and develop new product lines� Develop both products and markets
14
� Develop both products and markets� Determine where the money is made in your industry� Invest strategically and selectively� Establish / develop your competitive advantages� Spur increased growth and profits through new products� Differentiate away from competition� Consider all paths to growth� Focus on solutions that solve the most critical problems……

Employ Time Tested Strategic
Planning Tools To
15
Planning Tools To Change Course

Understand How Market is ChangingAre your assets, activities, or both being threatened?
While most specialty paper markets are changing, only a few cases exist where assets
and activities are seriously threatened. In most cases, you need adapt to feedback and
incrementally change your strategic approach. Some markets (carbonless, white paper,
printing papers, text & cover) may require a more radical response.
16

Prune and Re-Develop Product Lines
Product lines should be
continually reviewed
and refined to maximize
profitability.
Specialty paper
companies need to
understand how their
products are
17
products are
strategically positioned
in order to maximize
profits
Most specialty paper
companies are too
focused on capabilities
and cost.

Develop Both Products and MarketsSub-performing specialty
paper companies must
expand into new markets
and /or products to survive
in the future.
The best approach is to
evolve the business into
new markets OR new
products
Ansoff Matrix
18
products
Doing both simultaneously
(diversification) is risky
and often fails
Even more risky is failing to develop new markets and products on an ongoing basis.

Determine Where the Money is Made
High revenues and shares do not translate to high profit margins…..
Analysis of other industries such as autos, airlines, and personal computers show that supporting products and services tend to carry higher margins.
Specialty paper companies should consider
Profit Pool Assessment
0
2
4
6
8
10
12
14
16
0
5
10
15
20
25
30
35
Op
era
tin
g M
arg
in -
%
Re
ve
nu
e S
ha
re o
f In
du
stry
-%
Auto Industry Profit Pool Analysis (Bain - 1990's)
Revenue Share
Operating Margin
19
Specialty paper companies should consider related and supporting segments to grow their sales and profits:
• forward integrate into converting• supporting / related services• supporting / related products• bundled / integrated solutions• similar solution with different process or
technology• offer competing processes or solutions.
00
Used Car
Dealers
Auto Manuf Auto
Insurance
Service &
Repair
Aftermarket
Parts
Auto
Financing
Auto Rental New Car
Dealers
Warranty Gasoline
0
5
10
15
20
25
30
35
40
0
5
10
15
20
25
30
35
40
45
Personal
Computers
Other Components Periferals Services Software Micro Compressors
Op
era
tin
g M
arg
in -
%
Ind
ust
4ry
Re
ve
nu
e S
ha
re -
%
PC Industry Profit Pool Analysis (Bain - 1998)
Revenue Share
Operating Margin

Invest Strategically & Selectively
Another required
analysis considers the
attractiveness of markets
and the company’s
business position in
each.
“Business position” and
“attractiveness” can be
20
“attractiveness” can be
defined in different ways
to yield different results.
Depending on the
analytical result,
investments should then
be prioritized to ensure
the highest returns and
long term viability.

Develop a Real Competitive Advantage
Competitive advantages
can be based on cost or
product differentiation)
related dimensions
Unlike commodity papers,
successful specialty papers
are more likely to offer
product advantages
21
A narrow focus is most
appropriate for a small
specialty paper company
with limited resources
A broader focus creates
economies of scale which
potentially result in higher
profit margins.

New Products Spur Growth & Profits
Most specialty paper
markets and products
today operate in the
mature or declining
stage
This is evidenced by low
growth rates and a
2
2
growth rates and a
declining base of
competitors
Companies in these
businesses can only
grow by developing new
products, markets, or
broader / better
solutions (innovation).

Differentiate Away from the Competition“Blue Ocean” strategies
reduce the relevance
and impact of
competition
Declining markets are
often the result of
someone else's Blue
Ocean success
23
Successful Blue Ocean
initiatives have their
basis in a superior
understanding of
customer needs
Success requires a
totally different approach
and method of satisfying
customer needs.
*Excerpted from W. Chan Kim and Renee Mauborgne book

Consider All Paths to GrowthUnique tangible or
intangible capabilities
should provide the
foundation for a growth
initiative ….
But internal development
may not be the best growth
option for some companies
but it is usually the only
McKinsey Growth Pyramid
24
but it is usually the only
one considered
In mature or declining
markets, other approaches
are often the best option
Special relationships can
often provide the basis for
growth but this is rarely
pursued in our industry.

Specialty Paper
Companies –
25
Companies –
The Path to Success

New Broad-Based Approaches Are Needed
� Globalization / Localization
� Asia / New Economies
�Convenience Technologies
�Connected World
�Smart Technologies
�Increased Transparency
� Smarter Solutions using
High Performance
Materials and
Information Technologies
� Interactive Offerings
that Integrate Products &
26
�Increased Transparency
�Global Sustainability
�New Energy Solutions
�Aging Populations
�“Want it Now” Mentality
�Health & Well Being
that Integrate Products &
Services to Create Better
Solutions
� Relevant Values and
Methods that Match
Customer Objectives
� Empathetic Interactions
with Customers Based on
Deeper Understanding of
their Business
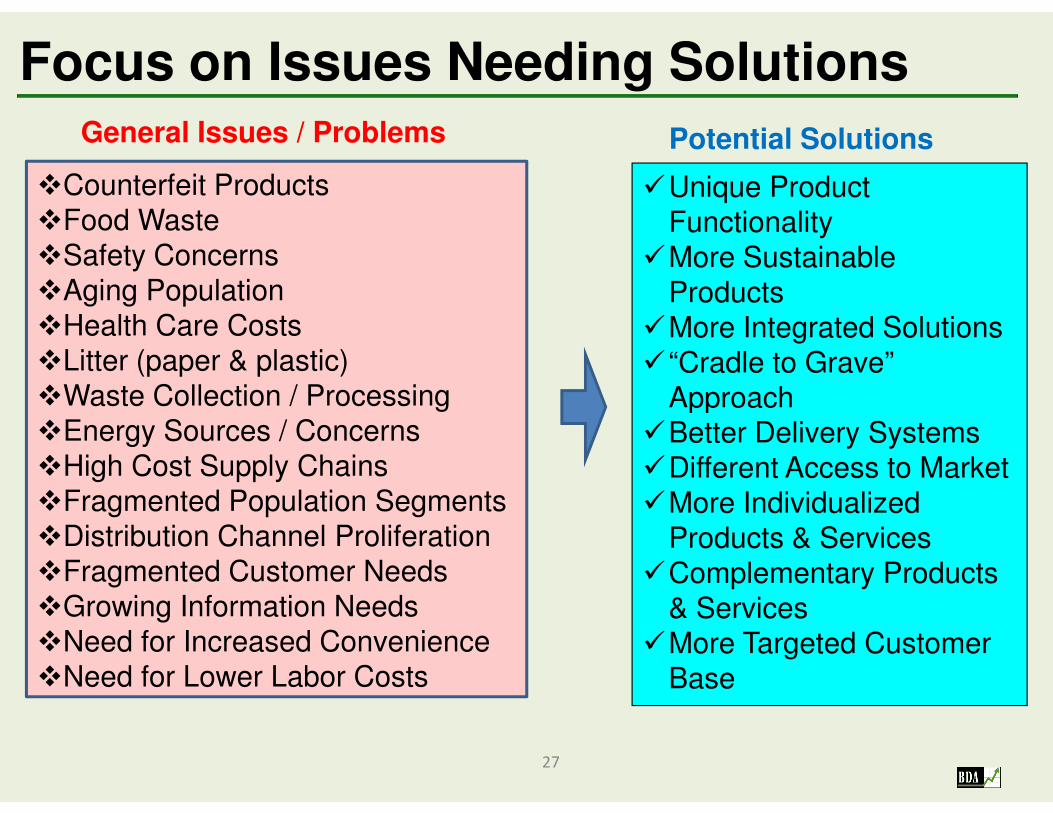
Focus on Issues Needing Solutions
�Counterfeit Products
�Food Waste
�Safety Concerns
�Aging Population
�Health Care Costs
�Litter (paper & plastic)
�Waste Collection / Processing
�Unique Product
Functionality
�More Sustainable
Products
�More Integrated Solutions
� “Cradle to Grave”
Approach
General Issues / Problems Potential Solutions
27
�Waste Collection / Processing
�Energy Sources / Concerns
�High Cost Supply Chains
�Fragmented Population Segments
�Distribution Channel Proliferation
�Fragmented Customer Needs
�Growing Information Needs
�Need for Increased Convenience
�Need for Lower Labor Costs
Approach
�Better Delivery Systems
�Different Access to Market
�More Individualized
Products & Services
�Complementary Products
& Services
�More Targeted Customer
Base

� Highly focused on a global niche segment
(grade / customer base / market / process)
� Forward integrated into converting / value
adding processes
Characteristics of Successful Specialty Paper Companies in Future
28
adding processes
� Value added service / solutions provider
� Unique value proposition
� Strong supply chain relationships / networks
� Commitment to ongoing development efforts

Food for Thought………
"It's not the strongest nor most
intelligent of the species that
survive; it is the one most adaptable
to change."
29
to change."
~ Charles Darwin

• Growth development consulting firm
focused on paper and packaging markets
• Based in Marietta, GA
• Contact:
Who is BDA?
30
• Contact:
Frank [email protected]

Factors
Limiting Future
31
Limiting Future
Success

Traditional Thinking
Head in sand
3
2
mentalityFailure to Redefine your business in the face of change

“Head in Sand” Mentality
Failure to Redefine
3
3
your business in the face of change

Failure to Redefine the Business
Head in sand
3
4
mentality

New Products Spur Growth & Profits
Many specialty paper
grades compete as
mature or declining
products in the market.
This is shown by the
reduced number of
competitors in each
3
5
competitors in each
segment.
New industry solutions
are required to generate
new growth.

Processes and Supply Chains Trending in Different Directions
-1.0%
0.0%
1.0%
2.0%
3.0%
Av
era
ge
An
nu
al
Gro
wth
Ra
te b
y P
eri
od
Forecasted Growth Rates for Specialty Paper Converting Processes
3
6
-5.0%
-4.0%
-3.0%
-2.0%
Av
era
ge
An
nu
al
Gro
wth
Ra
te b
y P
eri
od
2006-2010 AAPC
2011-2015 AAPC

Supply / Value Chains Have Changed
� More global in nature� Increasingly fragmented� Widening gap between commodity and
specialty solutions� More / new channels to access
37
� More / new channels to access customers and deliver solutions
� E-commerce and electronics affecting every aspect of product and delivery
� Sustainability / green solutions taking hold

Structural Changes Affect Profit PotentialPorter’s Five Forces Model
Respond to
market structural
shifts in order to
increase profits.
Major shifts
include:
• Competitor exit / entry
38
• New product intro
• Customer changes
• New applications
• Supply / value chain changes.

Dynamics Vary by Grade Segment
1.0%
1.5%
2.0%
2.5%
Av
era
ge
5 Y
ea
r D
em
an
d G
row
th R
ate
%
Specialty Paper Demand Growth
By Major End Use Market and Period
3
9
-2.0%
-1.5%
-1.0%
-0.5%
0.0%
0.5%
Packaging Papers Printing Papers Technical Papers
Av
era
ge
5 Y
ea
r D
em
an
d G
row
th R
ate
%
2006-2010 AAPC
2011-2015 AAPC


