SEPTIEMBRE / OCTUBRE 2016 Empresa de asesoramiento financiero (EAFI) inscrita con el número 191 en el Registro de la CNMV Paseo de la Castellana 13, 2º izda. Madrid www.lebris.es SHALUQA 2016
Transcript
SEPTIEMBRE / OCTUBRE 2016Empresa de asesoramiento financiero (EAFI) inscrita con el número 191 en el Registro de la CNMV
Private sector debt continues to decline but remains high, making the country vulnerable to shocks…
60%
70%
80%
90%
100%
110%
120%
130%
140%
150%
Household debt (% gross disposable income)
50%
60%
70%
80%
90%
100%
110%
120%
130%
140%
Non financial corporations debt (% GDP)
Breakdown of debt in Spain by sector
18
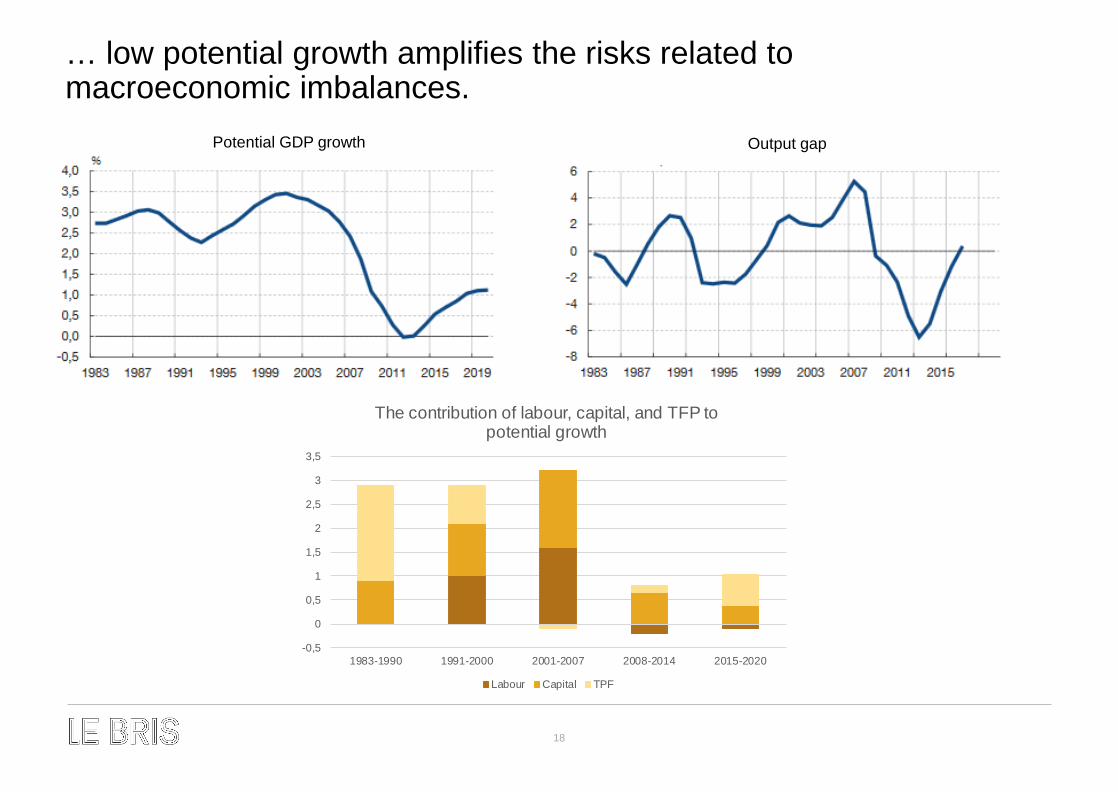
… low potential growth amplifies the risks related to macroeconomic imbalances.
-0,5
0
0,5
1
1,5
2
2,5
3
3,5
1983-1990 1991-2000 2001-2007 2008-2014 2015-2020
The contribution of labour, capital, and TFP to potential growth
Labour Capital TPF
Potential GDP growth Output gap
19
LCP SECTORS: SENSE & SENSIBILITY
20
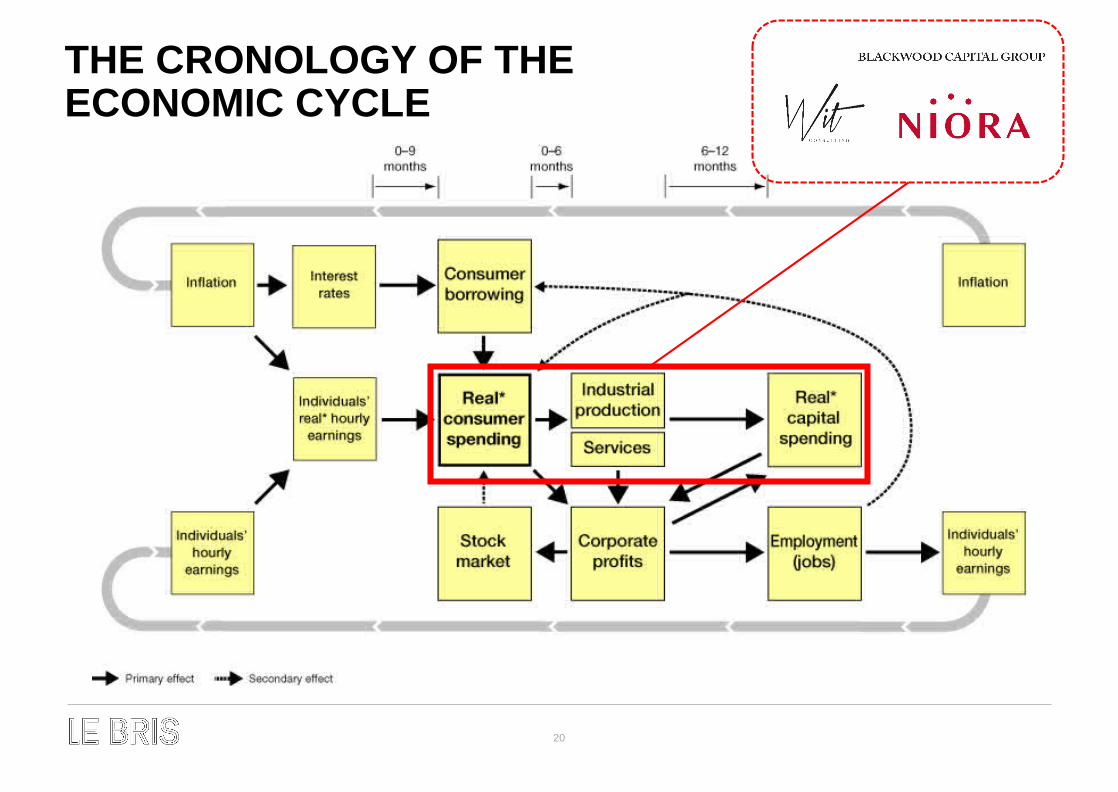
THE CRONOLOGY OF THE ECONOMIC CYCLE
21
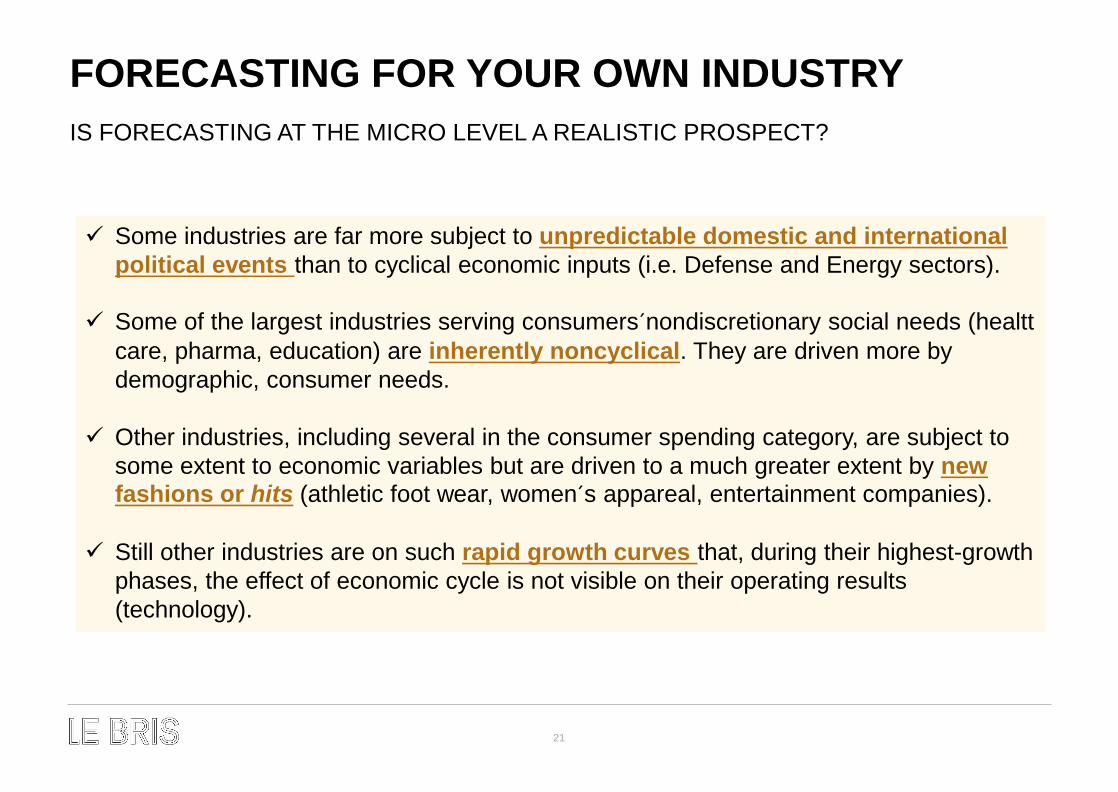
FORECASTING FOR YOUR OWN INDUSTRYIS FORECASTING AT THE MICRO LEVEL A REALISTIC PROSPECT?
Some industries are far more subject to unpredictable domestic and international political events than to cyclical economic inputs (i.e. Defense and Energy sectors).
Some of the largest industries serving consumers´nondiscretionary social needs (healtt care, pharma, education) are inherently noncyclical. They are driven more by demographic, consumer needs.
Other industries, including several in the consumer spending category, are subject to some extent to economic variables but are driven to a much greater extent by new fashions or hits (athletic foot wear, women´s appareal, entertainment companies).
Still other industries are on such rapid growth curves that, during their highest-growth phases, the effect of economic cycle is not visible on their operating results (technology).
22
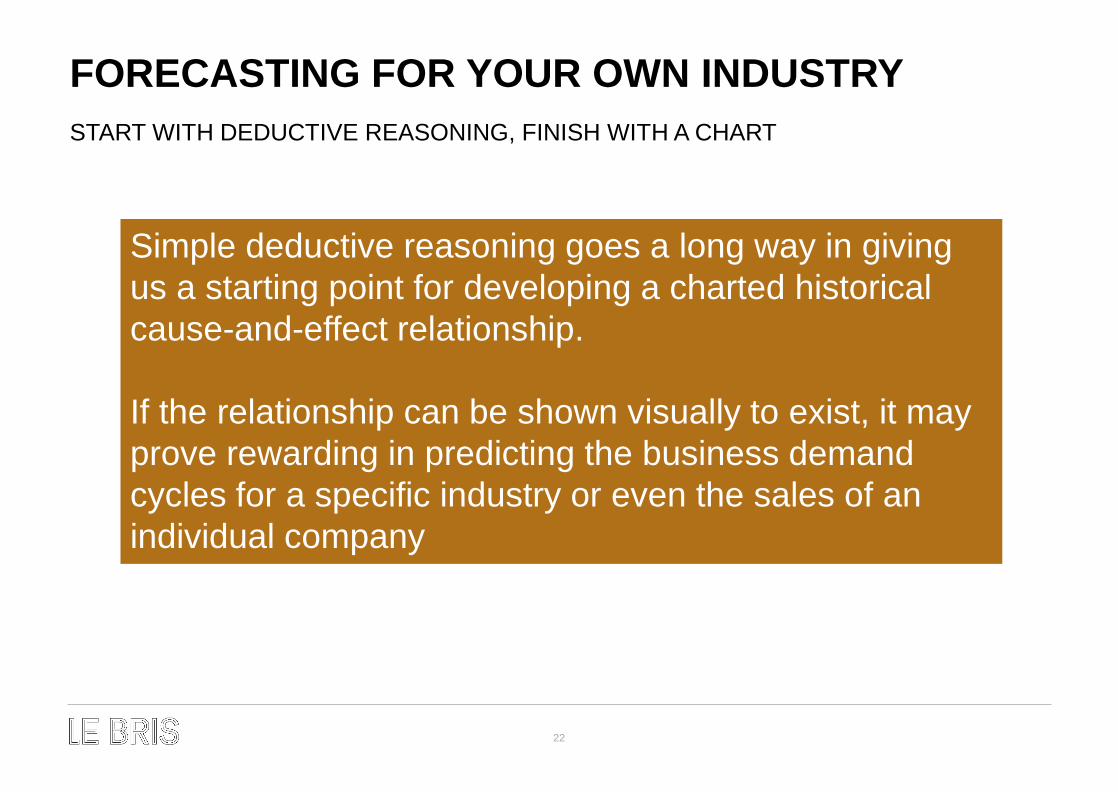
FORECASTING FOR YOUR OWN INDUSTRYSTART WITH DEDUCTIVE REASONING, FINISH WITH A CHART
Simple deductive reasoning goes a long way in giving us a starting point for developing a charted historical cause-and-effect relationship.
If the relationship can be shown visually to exist, it may prove rewarding in predicting the business demand cycles for a specific industry or even the sales of an individual company
23
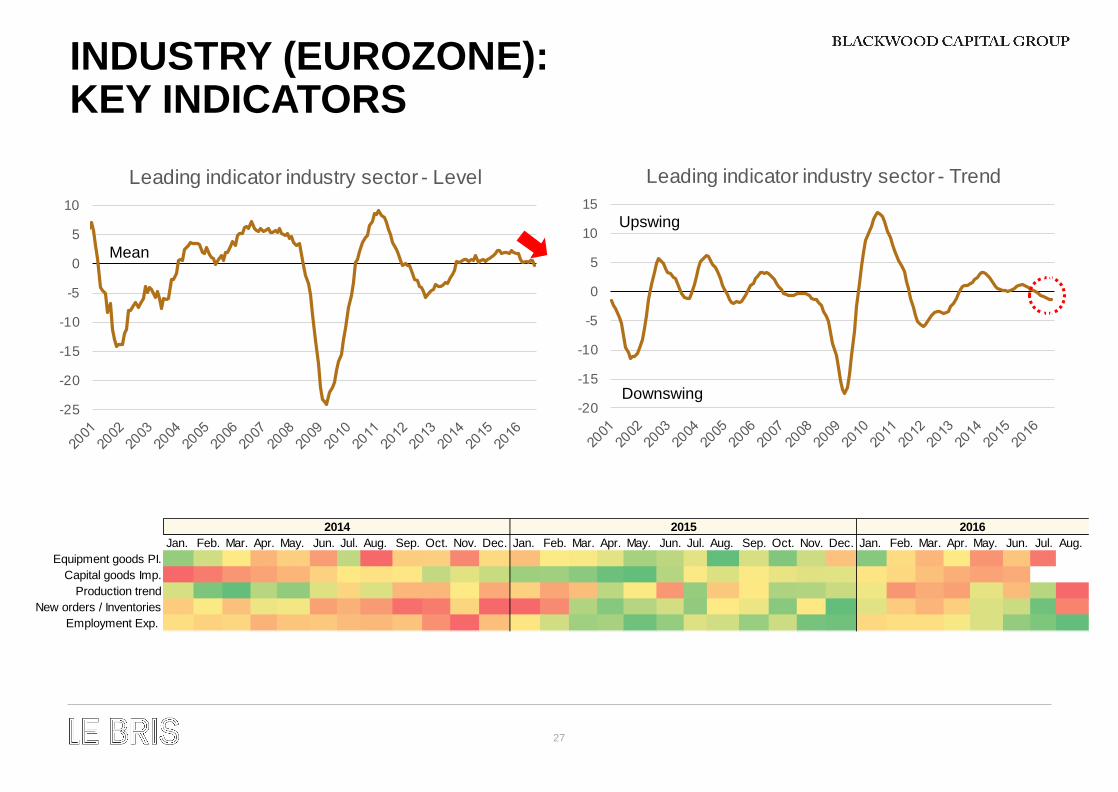
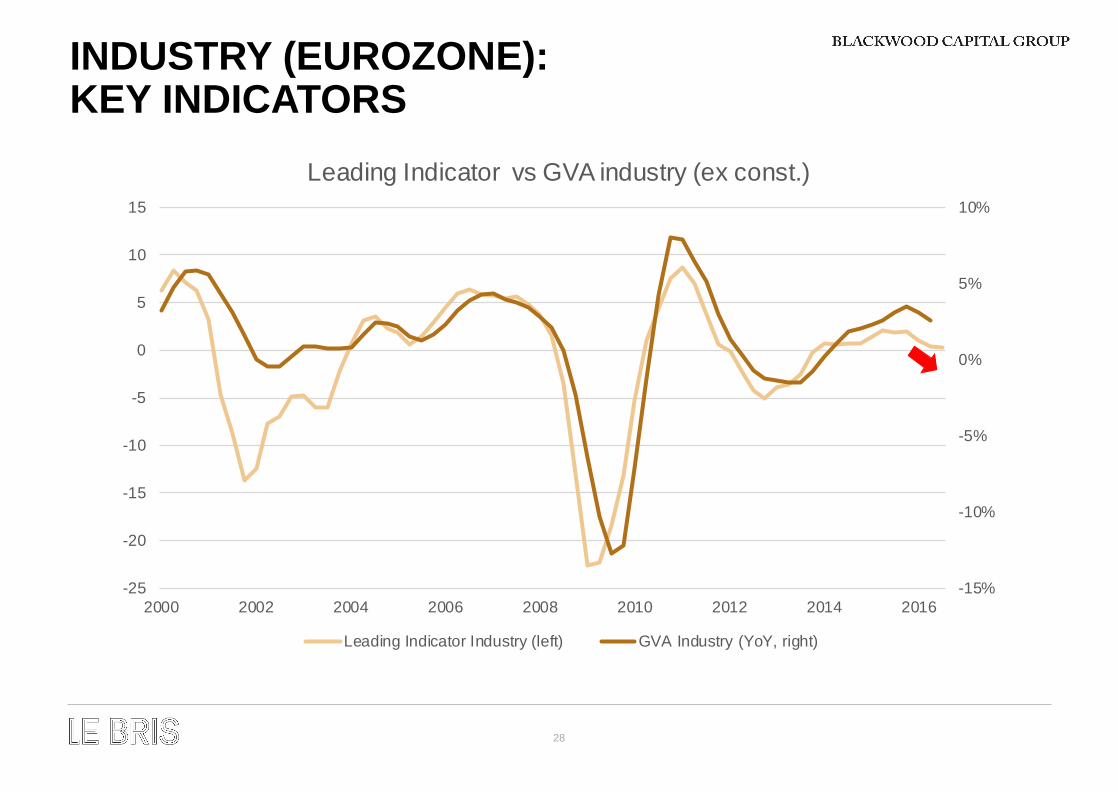
INDUSTRY (EUROZONE): KEY INDICATORS
24
YEAR 1 YEAR 2 YEAR 3 YEAR 4
+2
+4
+6
+8
+10
+12
-2
-4
-6
-8
Industrial Production
Real Capital Spending
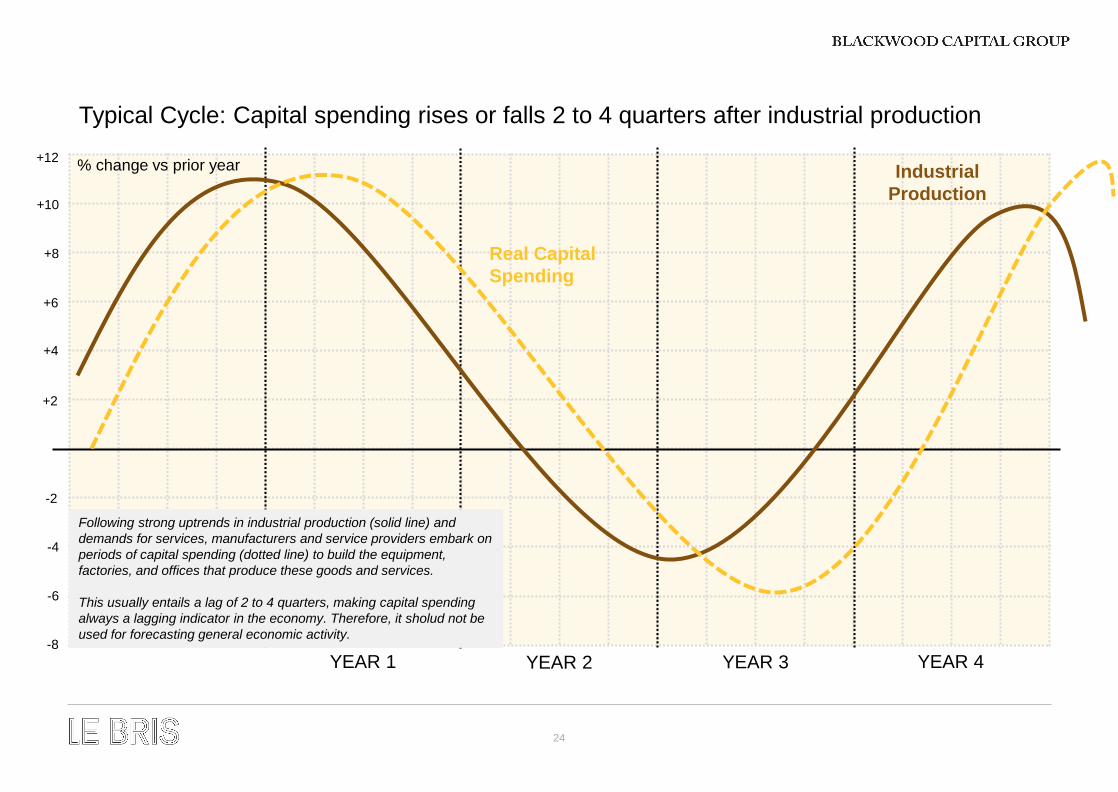
Typical Cycle: Capital spending rises or falls 2 to 4 quarters after industrial production
Following strong uptrends in industrial production (solid line) and demands for services, manufacturers and service providers embark on periods of capital spending (dotted line) to build the equipment, factories, and offices that produce these goods and services.
This usually entails a lag of 2 to 4 quarters, making capital spending always a lagging indicator in the economy. Therefore, it sholud not be used for forecasting general economic activity.
% change vs prior year
25
YEAR 1 YEAR 2 YEAR 3 YEAR 4
+2
+4
+6
+8
+10
+12
-2
-4
-6
-8
Real Consumer Spending
Real Capital Spending
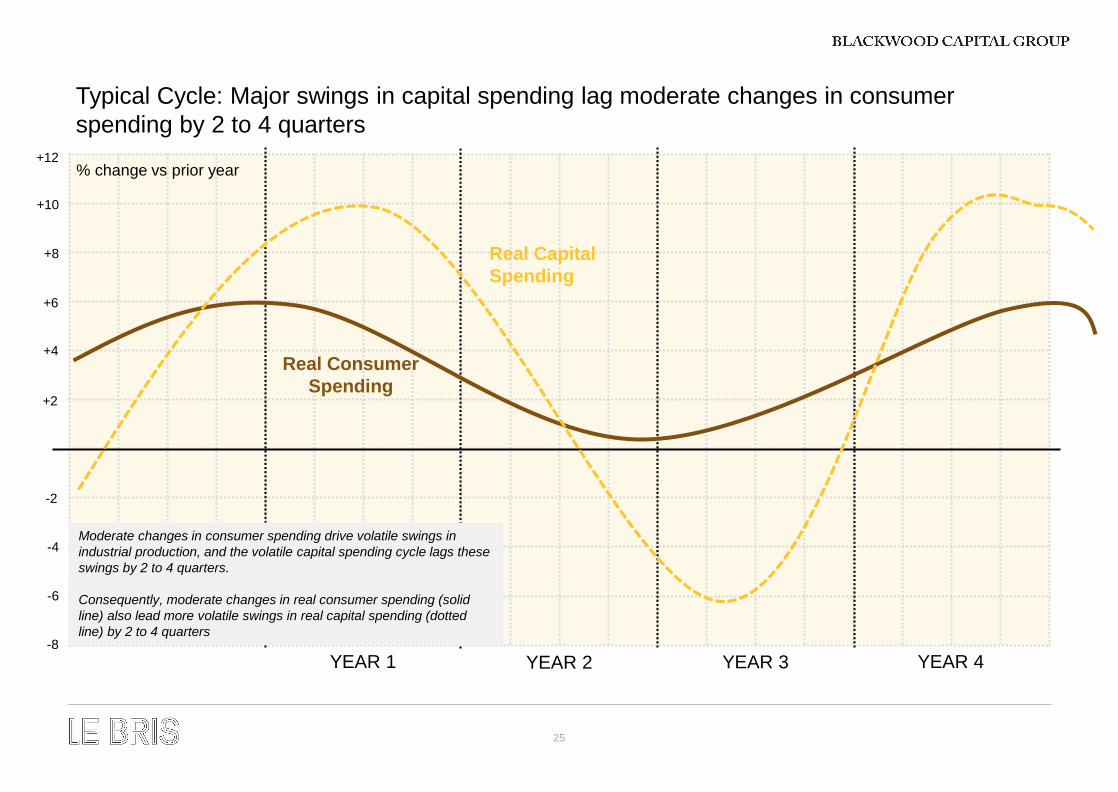
Typical Cycle: Major swings in capital spending lag moderate changes in consumer spending by 2 to 4 quarters
Moderate changes in consumer spending drive volatile swings in industrial production, and the volatile capital spending cycle lags these swings by 2 to 4 quarters.
Consequently, moderate changes in real consumer spending (solid line) also lead more volatile swings in real capital spending (dotted line) by 2 to 4 quarters
Leading Indicator Industry (left) GVA Industry (YoY, right)
29
30
31
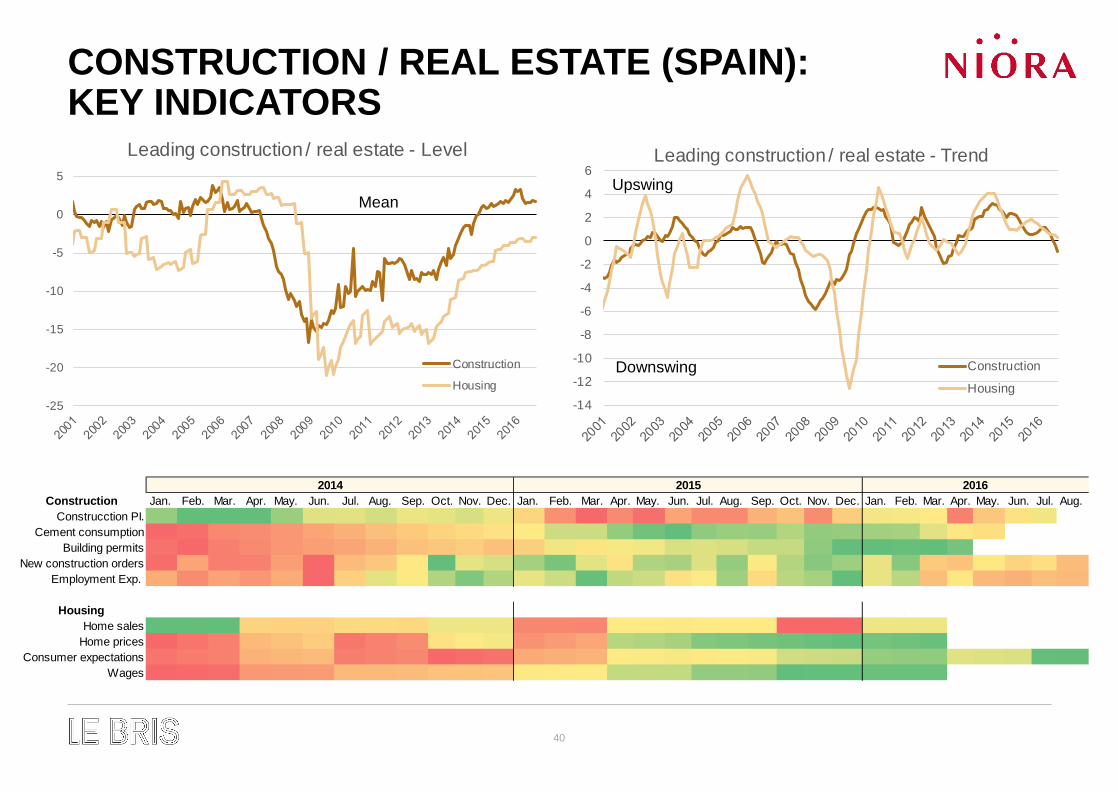
CONSUMER GOODS / RETAIL (SPAIN): KEY INDICATORS
32
A SIMPLE FORMULA FOR CONSUMER SPENDINGWage growth, and not employment, is a leading indicator of consumer spending
WAGES PER
WORKER
NUMBER OF
WORKERS
TOTAL WAGES
AND SALARIES
REAL CONSUMER SPENDING
LEADING INDICATOR
LAGGING INDICATOR
X
equals
Which drives
33
YEAR 1 YEAR 2 YEAR 3 YEAR 4
+2
+4
-2
Real personal consumption expenditures
Real average hourly earnings
Typical Cycle: How real average hourly earnings lead real consumer spending
Changes in individuals´year over year real average hourly earnings (dotted line) –usually ranging form -2% to +3% - have typically been a reliable indicator of broader swings in real consumer spending (solid line). And because stock market declines have often correlated with the early stages of consumer-spending slowdowns, real hourly earnings have also been a useful leading indicator of stock market direction, particulary before bear markets.