14
Lecture 6: Normal Quantile Plot; Chance Experiments, Probability Concepts Chapter 5: Probability and Sampling Distributions

Lecture 6: Normal Quantile Plot; Chance Experiments, Probability
Concepts
Chapter 5: Probability and Sampling Distributions
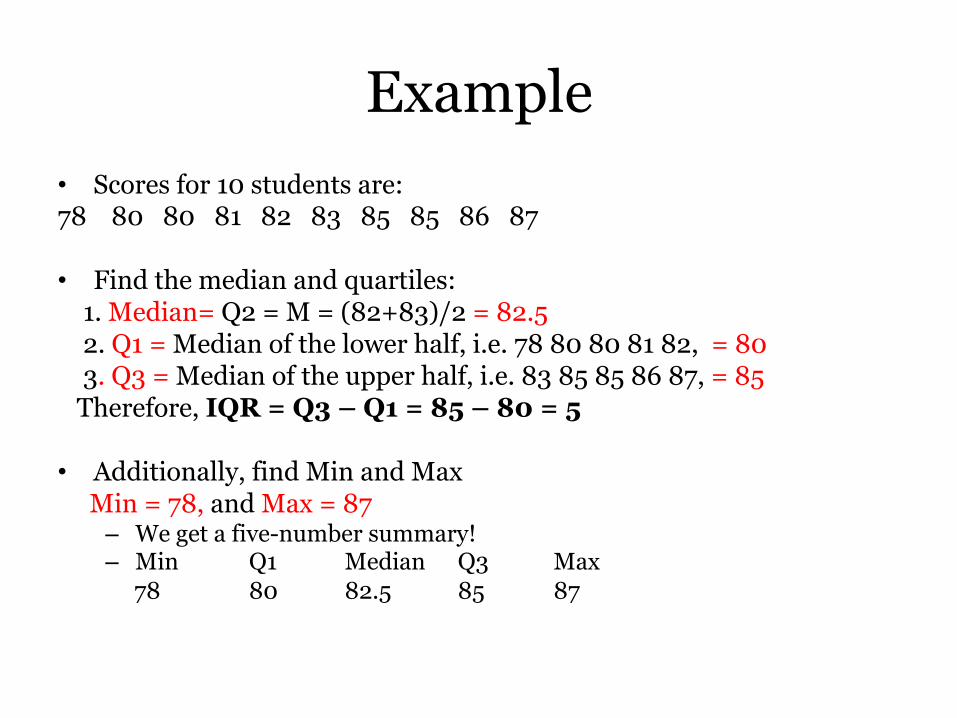
Example • Scores for 10 students are: 78 80 80 81 82 83 85 85 86 87 • Find the median and quartiles: 1. Median= Q2 = M = (82+83)/2 = 82.5 2. Q1 = Median of the lower half, i.e. 78 80 80 81 82, = 80 3. Q3 = Median of the upper half, i.e. 83 85 85 86 87, = 85 Therefore, IQR = Q3 – Q1 = 85 – 80 = 5 • Additionally, find Min and Max Min = 78, and Max = 87
– We get a five-number summary! – Min Q1 Median Q3 Max 78 80 82.5 85 87
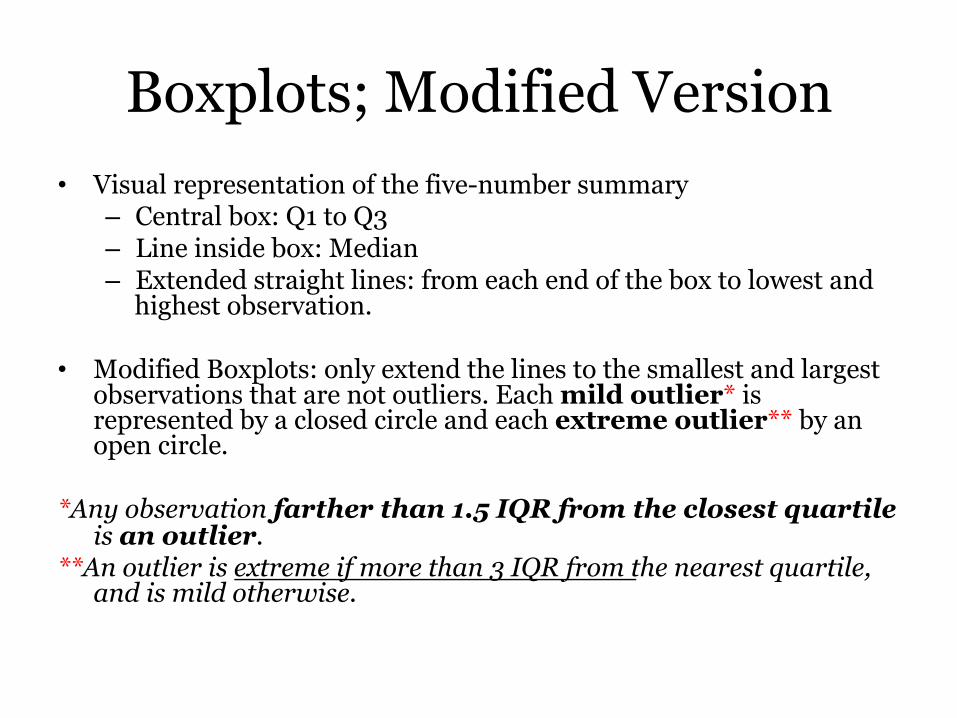
Boxplots; Modified Version • Visual representation of the five-number summary
– Central box: Q1 to Q3 – Line inside box: Median – Extended straight lines: from each end of the box to lowest and
highest observation. • Modified Boxplots: only extend the lines to the smallest and largest
observations that are not outliers. Each mild outlier* is represented by a closed circle and each extreme outlier** by an open circle.
*Any observation farther than 1.5 IQR from the closest quartile
is an outlier. **An outlier is extreme if more than 3 IQR from the nearest quartile,
and is mild otherwise.

Example
• Five-number summary is: • Min: 78 • Q1: 80 • Median: 82.5 • Q3: 85 • Max: 87 • Draw a boxplot:

More on Boxplots
• Much more compact than histograms • “Quick and Dirty” visual picture • Gives rough idea on how data is distributed – Shows center/typical value (the median); – Position of median line indicates symmetric/not
symmetric, positively/negatively skewed. – IQR gives the middle 50% – Min to Max gives the entire range
• Side-by-side boxplots very useful for comparisons – See from slide 10
Describe a Boxplot
• Symmetric? if not, positively or negatively skewed (based on median line)
• Outliers? Based on 1.5IQR rule (and 3IQR rule for extreme outliers)
• Overall range : = Max - Min; • IQR : = Central box’s range;
• Similar procedure for side-by-side comparison
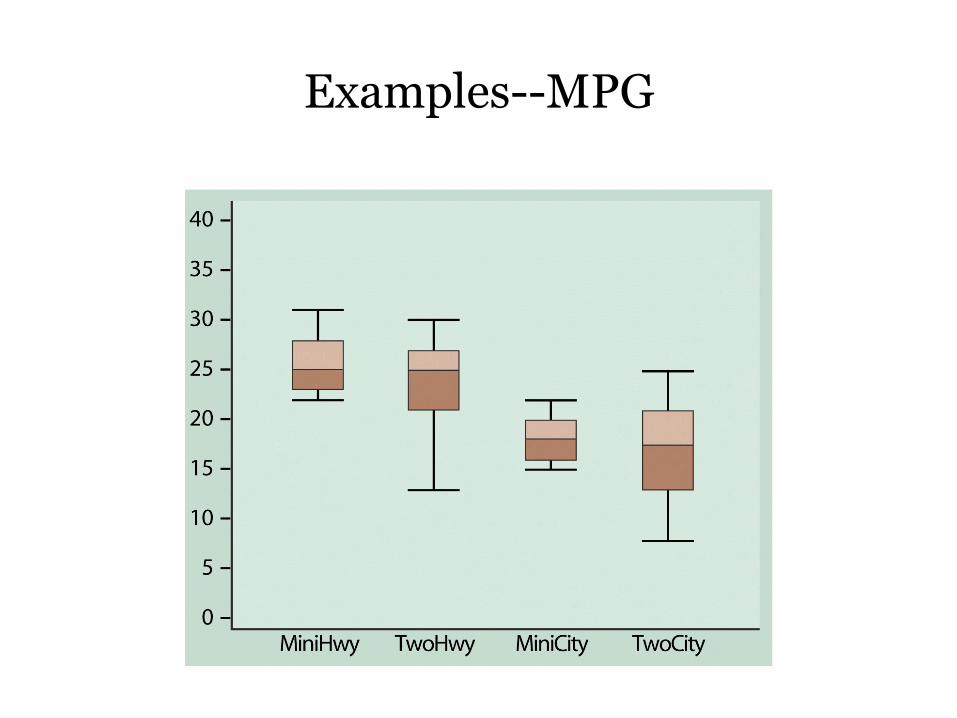
Examples--MPG
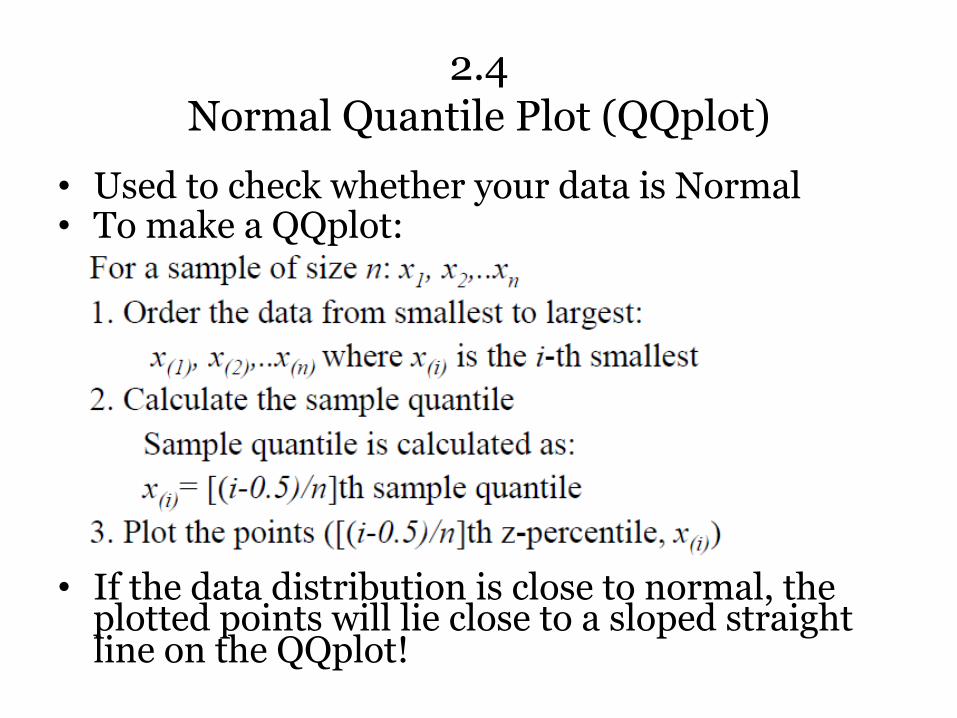
2.4 Normal Quantile Plot (QQplot)
• Used to check whether your data is Normal • To make a QQplot:
• If the data distribution is close to normal, the plotted points will lie close to a sloped straight line on the QQplot!

Examples
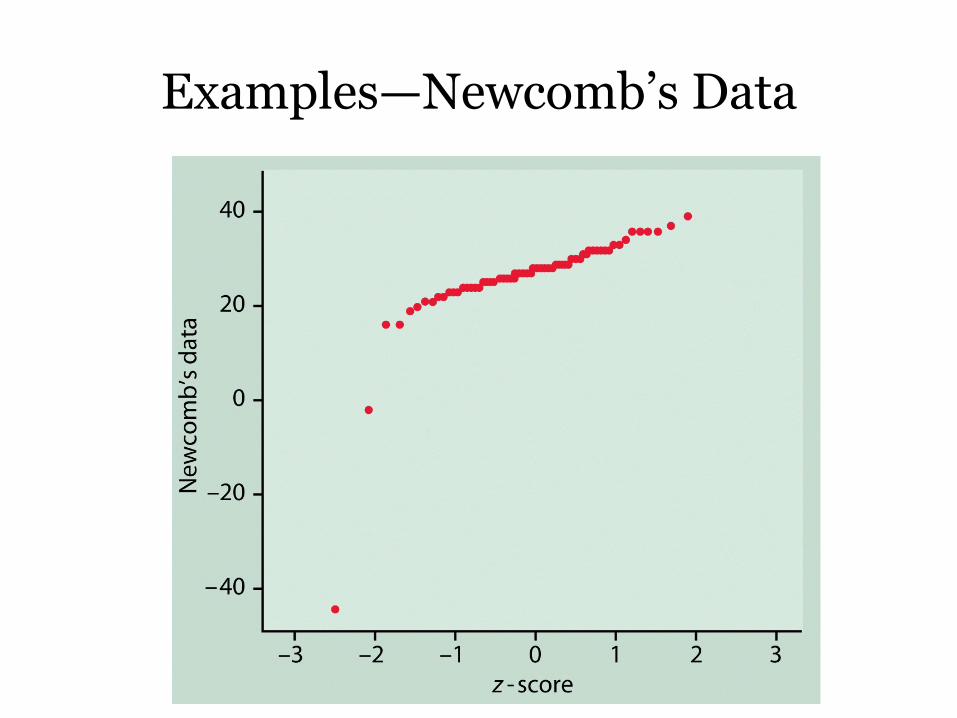
Examples—Newcomb’s Data

Newcomb’s Data (without outliers)

Examples—Supermarket data
A Statistic, or Statistical Inference?
• A statistic is any numerical measure calculated from sample data.
E.g., the sample mean, sample s.d., 5-number-summary, and correlation coefficient …
• What parameter values to use to describe
the continuous or discrete distribution? We have to use statistical inference that converts the information from random samples into reliable estimates of population parameters.
After Class…
• Review Ch. 2 • Read Sec 5.1 through 5.3, till Pg 207
• Hw#2, 5pm next Monday • Lab#2 (next Wed, due on next Friday)


