30
FX Markets RER PPP UIP and CIP Lecture 7: The Foreign Exchange Market Gregory Corcos Eco572: International Economics 5 November 2014

FX Markets RER PPP UIP and CIP
Lecture 7: The Foreign Exchange Market
Gregory Corcos
Eco572: International Economics
5 November 2014

FX Markets RER PPP UIP and CIP
Lecture 7: Outline
1 Introduction to Foreign Exchange Markets
2 Nominal and Real Exchange Rates
3 The Monetary Approach and PPP
4 Interest-Rate Parities
Suggested reading: Feenstra and Taylor, chapters 13 and 14.1
2/30
FX Markets RER PPP UIP and CIP
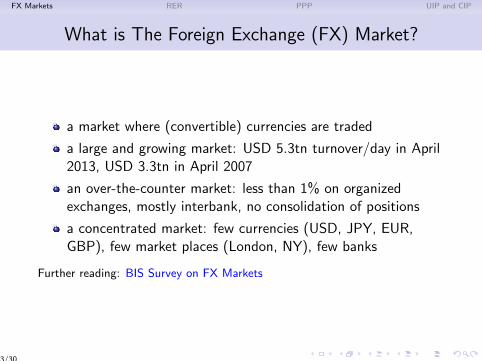
What is The Foreign Exchange (FX) Market?
a market where (convertible) currencies are traded
a large and growing market: USD 5.3tn turnover/day in April2013, USD 3.3tn in April 2007
an over-the-counter market: less than 1% on organizedexchanges, mostly interbank, no consolidation of positions
a concentrated market: few currencies (USD, JPY, EUR,GBP), few market places (London, NY), few banks
Further reading: BIS Survey on FX Markets
3/30

FX Markets RER PPP UIP and CIP
Facts About FX Markets
Triennial Central Bank Survey 2013 5
The role of the renminbi in global FX trading surged, in line with increased efforts to internationalise the Chinese currency. Renminbi turnover soared from $34 billion to $120 billion. The renminbi has thus become the ninth most actively traded currency in 2013, with a share of 2.2% in global FX volumes, mostly driven by a significant expansion of offshore renminbi trading.
Turnover by counterparty
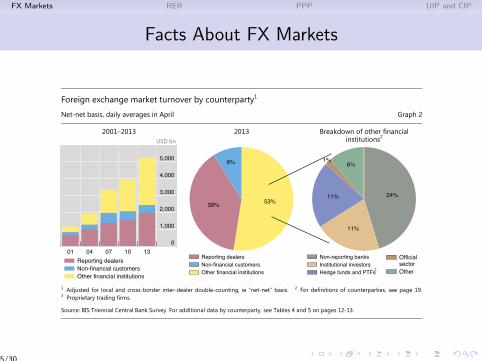
The counterparty segment that contributed the most to growth in global FX turnover between 2010 and 2013 was other financia l institutions (Table 4 and Graph 2), thus continuing the trend evident in past Triennial Surveys. This category includes smaller banks that do not act as dealers in the FX market (and therefore do not report in the Triennial Survey), institutional investors, hedge funds and proprietary trading firms as well as official sector financial institutions, among others. In the 2010 survey, other financia l institutions had for the first time surpassed other reporting dea lers (ie trading in the inter-dealer market) as the main counterparty category in the Triennial Survey. Transactions of FX dealers with this group of customers grew by 48% to $2.8 trillion in 2013, up from $1.9 trillion in 2010. Trading activity
Foreign exchange market turnover by currency and currency pairs1
Net-net basis, daily averages in April, in per cent Graph 1
Selected currencies2 Selected currency pairs
1 Adjusted for local and cross-border inter-dealer double-counting, ie “net-net” basis. 2 As two currencies are involved in each transaction, the sum of shares in individual currencies will total 200%. The share of currencies other than the ones listed is 12.2% for 2013 and 13.7% for 2010. 3 Turnover for 2010 may be underestimated owing to incomplete reporting of offshore trading. Methodological changes in the 2013 survey ensured a more complete coverage of the indicated currencies.
Source: BIS Triennial Central Bank Survey. For additional data by currency and currency pairs, see Tables 2 and 3 on pages 10-11.
87.0
33.4
23.0
84.9
39.1
19.0 JPY
EUR
USD0 20 40 60 80 100
11.8
8.6
5.2
4.6
2.5
2.2
2
1.8
1.6
1.4
1.4
1.3
12.9
7.6
6.3
5.3
1.3
0.9
1.6
2.2
0.9
2.4
1.4
0.7TRY
SGD
HKD
RUB
SEK
NZD
CNY
MXN
CAD
CHF
AUD
GBP
0 3 6 9 12 15
3
3
3
3
3
3
3
2013 2010
24.1
18.3
8.8
27.7
14.3
9.1USD / GBP
USD / JPY
USD / EUR0 5 10 15 20 25 30
6.8
3.7
3.4
2.4
2.1
1.5
1.5
1.3
1.2
2.8
1.9
1.3
6.3
4.6
4.2
0.8
2.1
2.8
2.7
1.8EUR / CHF
EUR / GBP
EUR / JPY
USD / SGD
USD / HKD
USD / RUB
USD / NZD
USD / CNY
USD / MXN
USD / CHF
USD / CAD
USD / AUD
0 3 6 92013 2010
4/30
FX Markets RER PPP UIP and CIP
Facts About FX Markets
6 Triennial Central Bank Survey 2013
with these counterparties expanded most strongly in FX options (82%), outright forwards (58%) and the spot market (57%).
Trading with other reporting dealers rose at a similar rate as the aggregate foreign exchange market between 2010 and 2013, whereas transactions with non-financial customers contracted significantly over the past three years.
The 2013 survey provides a breakdown of the heterogeneous counterparty category other financia l institutions to shed more light on the contribution of various financial FX end users to global trading activity. The new figures indicate that non-reporting banks, ie smaller and regional banks that serve as clients of the large FX dealing banks but do not engage in market-making in major currency pairs, account for roughly 24% of global FX turnover (Graph 2). Other quantitatively significant financial players include institutional investors as well as hedge funds and proprietary trading firms, with a share in global FX turnover of about 11% for each group (Table 5).3 By contrast, trading by official sector financial institutions such as central banks and sovereign wealth funds accounted for less than 1% of global FX market activity in April 2013.
Inter-dealer trading grew by 34% to $2.1 trillion in 2013, up from $1.5 trillion in 2010. The share of inter-dealer trading in global FX transactions stood at 39% in 2013, and hence remained roughly constant over the past three years.4
3 The category of hedge funds and proprietary trading firms also includes counterparties that specialise in algorithmic and
high-frequency trading. For a definition of the different counterparty categories, see the table on page 19. 4 The relative importance of inter-dealer trading in the global FX market has decreased by almost 25 percentage points since
1998 (Table 4), as increased concentration and market share has allowed dealers to match larger quantities of customer trades on their own books by internalising trades. Moreover, heavy investment in IT infrastructure by top-tier dealers in recent years has facilitated the warehousing of inventory risk, reducing the need to offload accumulated inventory quickly in the inter-dealer market.
Foreign exchange market turnover by counterparty1
Net-net basis, daily averages in April Graph 2
2001–2013 USD bn
2013 Breakdown of other financial institutions2
1 Adjusted for local and cross-border inter-dealer double-counting, ie “net-net” basis. 2 For definitions of counterparties, see page 19. 3 Proprietary trading firms.
Source: BIS Triennial Central Bank Survey. For additional data by counterparty, see Tables 4 and 5 on pages 12-13.
0
1,000
2,000
3,000
4,000
5,000
01 04 07 10 13Reporting dealersNon-financial customersOther financial institutions
53%39%
9%
Reporting dealersNon-financial customersOther financial institutions
24%
11%
11%
6%1%
3
Non-reporting banksInstitutional investorsHedge funds and PTFs
Official sectorOther
5/30

FX Markets RER PPP UIP and CIP
Facts About FX Markets
Triennial Central Bank Survey 2013 9
3. Tables
Global foreign exchange market turnover
Net-net basis,1 daily averages in April, in billions of US dollars Table 1
Instrument 1998 2001 2004 2007 2010 2013
Foreign exchange instruments 1,527 1,239 1,934 3,324 3,971 5,345
Spot transactions 568 386 631 1,005 1,488 2,046
Outright forwards 128 130 209 362 475 680
Foreign exchange swaps 734 656 954 1,714 1,759 2,228 Currency swaps 10 7 21 31 43 54
Options and other products² 87 60 119 212 207 337
Memo:
Turnover at April 2013 exchange rat es 31,718 1,500 2,036 3,376 3,969 5,345
Exchange-traded derivat ives 411 12 26 80 155 160
1 Adjusted for local and cross- border inter- dealer double- counting (ie “ net- net” basis). 2 The category “ other FX products”covers highly leveraged transactions and/or trades whose notional amount is variable and where a decomposition into individualplain vanilla components was impractical or impossible. 3 Non- US dollar legs of foreign currency transactions were convertedinto original currency amounts at average exchange rates for April of each survey year and then reconverted into US dollaramounts at average April 2013 exchange rates. 4 Sources: FOW TRADEdata; Futures Industry Association; various futures andoptions exchanges. Foreign exchange futures and options traded worldwide.
6/30
FX Markets RER PPP UIP and CIP
Types of FX Transactions and Motivations
Different types of transactionsspot: delivery within 24 hoursforward: future delivery at price set in advanceoption: possible future delivery at price set in advanceswap: two transactions in opposite directions at differentpoints in time
cross-currency swap: swap principal and interest payments indifferent currencies, swap principal at the end of the periodoften to exploit lower interest rates in home currencyused by banks to raise funds from money markets in differentcurrencies
Different types of motivations:Insurance: hedging FX risk of cross-border trade or financialtransactions.Arbitrage: taking advantage of spread differences acrossmarketplacesSpeculation: mostly intraday, covered (assets and liabilities insame currency) or uncovered.
7/30
FX Markets RER PPP UIP and CIP
Exchange Rates: Definitions
Nominal bilateral ER Sijt , e.g. 1 EUR/USD=1.37
Real bilateral ER: Qijt =SijtPit
P∗jt
Effective ER: against a basket of currencies.REER: Qit =
∏j Q
αj
ijt .The BIS computes NEERs and REERs using weights based ona country’s share in another country’s exports.
8/30
FX Markets RER PPP UIP and CIP
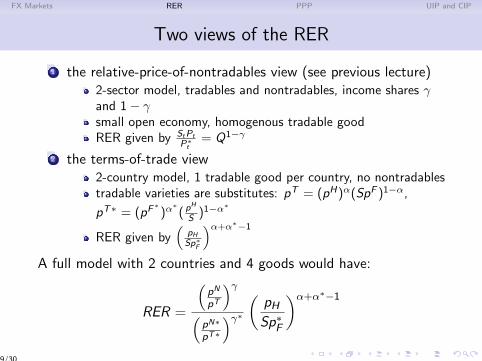
Two views of the RER
1 the relative-price-of-nontradables view (see previous lecture)2-sector model, tradables and nontradables, income shares γand 1− γsmall open economy, homogenous tradable goodRER given by StPt
P∗t
= Q1−γ
2 the terms-of-trade view2-country model, 1 tradable good per country, no nontradablestradable varieties are substitutes: pT = (pH)α(SpF )1−α,
pT∗ = (pF∗)α
∗( pH
S )1−α∗
RER given by(
pHSp∗
F
)α+α∗−1
A full model with 2 countries and 4 goods would have:
RER =
(pN
pT
)γ(pN∗
pT∗
)γ∗ ( pHSp∗F
)α+α∗−1
9/30
FX Markets RER PPP UIP and CIP
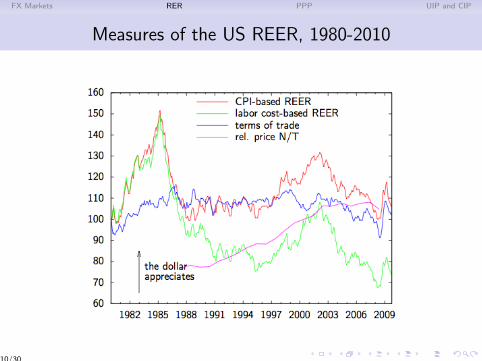
Measures of the US REER, 1980-2010
10/30
FX Markets RER PPP UIP and CIP
Exchange Rate Regimes
Fixed: the Central Bank defends a fixed value of the currency(peg) by trading foreign currency reserves.
Floating: currencies are freely traded on FX markets.
Intermediate cases:
crawling peg (Mexico 1990’s)soft peg with fluctuation band (Denmark)managed float (China since 2005)
11/30
FX Markets RER PPP UIP and CIP
Money and Adjustment in a Fixed ER Regime
David Hume’s price-specie flow mechanism, based on aquantitative theory of money:
Suppose domestic prices are higher than world prices (incl.transport costs).
then the country incurs a trade deficitthen official reserves (gold or foreign currency) fallthen money supply contractsthen prices of home goods and wages decline (deflation)then the trade deficit is eliminated.
12/30
FX Markets RER PPP UIP and CIP
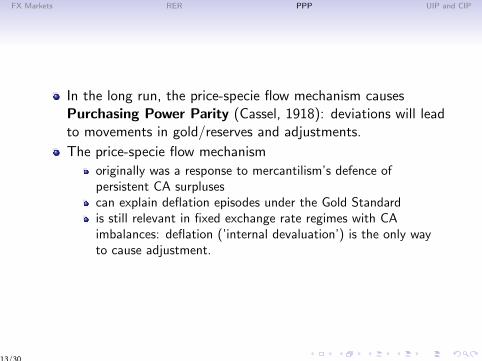
In the long run, the price-specie flow mechanism causesPurchasing Power Parity (Cassel, 1918): deviations will leadto movements in gold/reserves and adjustments.
The price-specie flow mechanism
originally was a response to mercantilism’s defence ofpersistent CA surplusescan explain deflation episodes under the Gold Standardis still relevant in fixed exchange rate regimes with CAimbalances: deflation (’internal devaluation’) is the only wayto cause adjustment.
13/30

FX Markets RER PPP UIP and CIP
Adjustment Under Fixed and Floating ER Regimes
Flexible ER regime: B+NFI=0 Fixed ER regime: B+NFI=dR
Exports Imports
B<0
Financial inflows
Financial ou@lows
NFI>0
Exports Imports
Financial inflows
Financial ou@lows
Decrease in official reserves dR<0 B+NFI<0
Floating: CA equals Net Financial OutflowsFixed : CA equals Net Financial Outflows Plus Change in Reserves
14/30
FX Markets RER PPP UIP and CIP
Adjustment Under Fixed and Floating ER Regimes
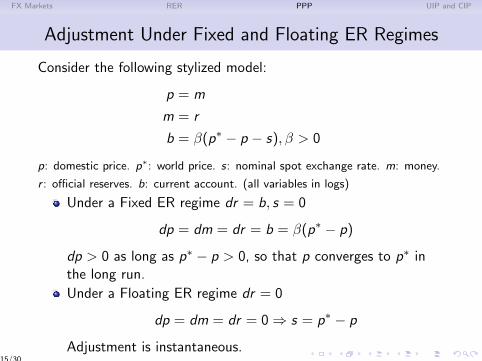
Consider the following stylized model:
p = m
m = r
b = β(p∗ − p − s), β > 0
p: domestic price. p∗: world price. s: nominal spot exchange rate. m: money.
r : official reserves. b: current account. (all variables in logs)
Under a Fixed ER regime dr = b, s = 0
dp = dm = dr = b = β(p∗ − p)
dp > 0 as long as p∗ − p > 0, so that p converges to p∗ inthe long run.
Under a Floating ER regime dr = 0
dp = dm = dr = 0⇒ s = p∗ − p
Adjustment is instantaneous.15/30

FX Markets RER PPP UIP and CIP
PPP in Practice
Two versions of PPP:
absolute: same prices for the same basket of goods whenexpressed in the same currencyrelative: prices for the same basket of good have the sameinflation rate when expressed in the same currency
Problem: CPIs use typically different baskets!
Solution 1: International Comparison Program (ICOP)measures prices at 5-year intervals.
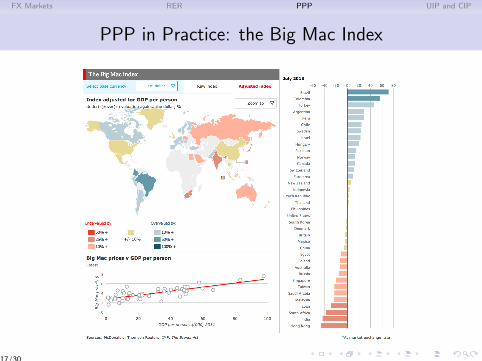
Solution 2: Big Mac Index. Big Macs are comparable andcapture local prices of both tradables and nontradables.
Further reading: ICOP 2011, Big Mac Index
16/30
FX Markets RER PPP UIP and CIP
PPP in Practice: the Big Mac Index
17/30

FX Markets RER PPP UIP and CIP
PPP in Practice: French NEER and REER, 1994-2011
0
20
40
60
80
100
120
1994-‐01
1994-‐05
1994-‐09
1995-‐01
1995-‐05
1995-‐09
1996-‐01
1996-‐05
1996-‐09
1997-‐01
1997-‐05
1997-‐09
1998-‐01
1998-‐05
1998-‐09
1999-‐01
1999-‐05
1999-‐09
2000-‐01
2000-‐05
2000-‐09
2001-‐01
2001-‐05
2001-‐09
2002-‐01
2002-‐05
2002-‐09
2003-‐01
2003-‐05
2003-‐09
2004-‐01
2004-‐05
2004-‐09
2005-‐01
2005-‐05
2005-‐09
2006-‐01
2006-‐05
2006-‐09
2007-‐01
2007-‐05
2007-‐09
2008-‐01
2008-‐05
2008-‐09
2009-‐01
2009-‐05
2009-‐09
2010-‐01
2010-‐05
2010-‐09
2011-‐01
2011-‐05
French REER
French NEER
Source: Bank of International Settlements.18/30

FX Markets RER PPP UIP and CIP
Testing for PPP
Test: if RER has a unit root, its deviations are permanent,and PPP fails. If not, RER is mean-reverting and PPP holds.
Hypothesis H0: ρ = 0 in
∆ lnQt = ρ lnQt−1 + εt
Empirically H0 is rejected against H1 : ρ < 0. Consistent withlong-term PPP: lnQt tends to zero.
Convergence speed:
at PPP lnQt = lnQ∗ = 0E [lnQt ]− lnQ∗ = (1 + ρ)t lnQ0 = (1 + ρ)t (lnQ0 − lnQ∗)denote by T the half-life of the convergence process:(1 + ρ)T = 1
2 . Then T = − ln 2ln(1+ρ)
Empirically Rogoff (1995) finds ρ ≈ −0, 15 for developedcountries, implying T ≈ 4 years.
19/30
FX Markets RER PPP UIP and CIP
PPP and the Balassa-Samuelson Effect
The Balassa-Samuelson effect describes how price levels rise ascountries grow, which explains long-term deviations from PPP.
Intuition:
suppose a country’s productivity is below world averagethe law of one price implies implies that wages in the tradablesector are below world averageworker mobility and labor market competition imply equalwages in the non-tradable sectornon-tradable prices are lower than world averagedomestic prices are lower than world prices, the currency isundervalued relative to PPPcatching-up in the tradables sector causes a wage increase, arise in nontradables prices, and a RER appreciation
20/30
FX Markets RER PPP UIP and CIP
PPP and the Balassa-Samuelson Effect
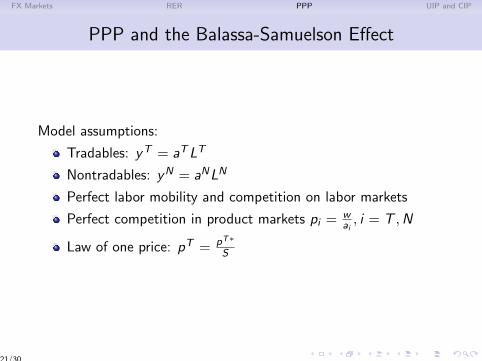
Model assumptions:
Tradables: yT = aTLT
Nontradables: yN = aNLN
Perfect labor mobility and competition on labor markets
Perfect competition in product markets pi = wai, i = T ,N
Law of one price: pT = pT∗
S
21/30
FX Markets RER PPP UIP and CIP
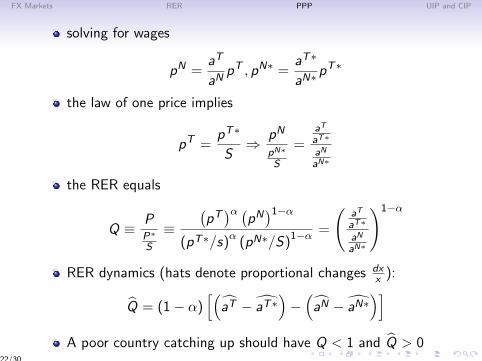
solving for wages
pN =aT
aNpT , pN∗ =
aT∗
aN∗pT∗
the law of one price implies
pT =pT∗
S⇒ pN
pN∗
S
=aT
aT∗
aN
aN∗
the RER equals
Q ≡ PP∗
S
≡(pT)α (
pN)1−α
(pT∗/s)α
(pN∗/S)1−α =
(aT
aT∗
aN
aN∗
)1−α
RER dynamics (hats denote proportional changes dxx ):
Q = (1− α)[(
aT − aT∗)−(aN − aN∗
)]A poor country catching up should have Q < 1 and Q > 0
22/30
FX Markets RER PPP UIP and CIP
The Balassa-Samuelson Effect in the Data
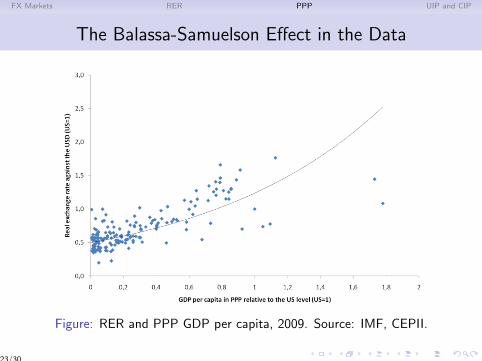
Figure: RER and PPP GDP per capita, 2009. Source: IMF, CEPII.
23/30
FX Markets RER PPP UIP and CIP
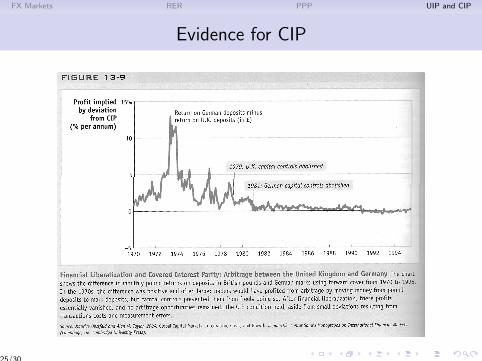
Covered Interest Rate Parity (CIP)
Investing x euros at rate i yields (1 + i)tx after t years.
Converting x in USD at spot ER S0, investing at rate i∗ andselling at the forward USD/EUR rate Ft , yields x(1 + i∗)t S0Ft
.
No-arbitrage when (1 + i
1 + i∗
)t
=S0Ft
Sometimes this formula is expressed in logs with t = 1.
i − i∗ = s − f
CIP offers a benchmark forward exchange rate.
In practice, deviations will come from transaction costs,country risk, and barriers to capital flows.
24/30
FX Markets RER PPP UIP and CIP
Evidence for CIP
25/30
FX Markets RER PPP UIP and CIP
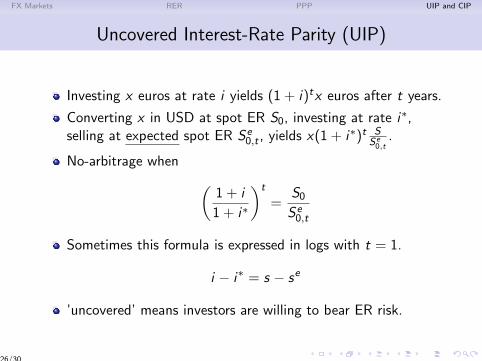
Uncovered Interest-Rate Parity (UIP)
Investing x euros at rate i yields (1 + i)tx euros after t years.
Converting x in USD at spot ER S0, investing at rate i∗,selling at expected spot ER Se
0,t , yields x(1 + i∗)t SSe0,t
.
No-arbitrage when (1 + i
1 + i∗
)t
=S0Se0,t
Sometimes this formula is expressed in logs with t = 1.
i − i∗ = s − se
’uncovered’ means investors are willing to bear ER risk.
26/30
FX Markets RER PPP UIP and CIP
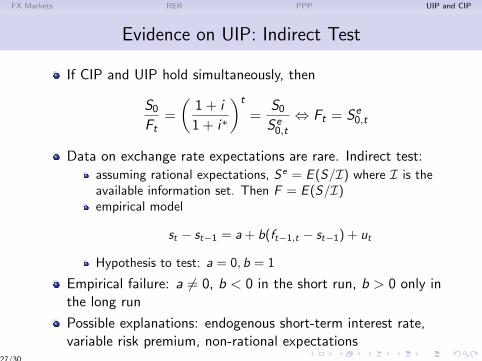
Evidence on UIP: Indirect Test
If CIP and UIP hold simultaneously, then
S0Ft
=
(1 + i
1 + i∗
)t
=S0Se0,t
⇔ Ft = Se0,t
Data on exchange rate expectations are rare. Indirect test:assuming rational expectations, Se = E (S/I) where I is theavailable information set. Then F = E (S/I)empirical model
st − st−1 = a + b(ft−1,t − st−1) + ut
Hypothesis to test: a = 0, b = 1
Empirical failure: a 6= 0, b < 0 in the short run, b > 0 only inthe long run
Possible explanations: endogenous short-term interest rate,variable risk premium, non-rational expectations
27/30
FX Markets RER PPP UIP and CIP
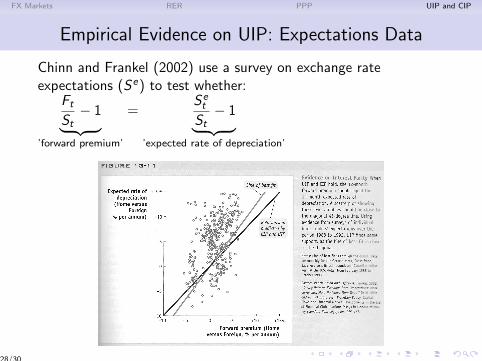
Empirical Evidence on UIP: Expectations Data
Chinn and Frankel (2002) use a survey on exchange rateexpectations (Se) to test whether:
FtSt− 1︸ ︷︷ ︸
’forward premium’
=Set
St− 1︸ ︷︷ ︸
’expected rate of depreciation’
28/30

FX Markets RER PPP UIP and CIP
Implications of Interest-Rate Parities For ER Dynamics
Floating ER regimes
st = set,t+1 + it − i∗t = ... = set,+∞ +∑k=0
(iet+k − ie∗t+k)
the spot ER is forward-looking: it reflects expectations onmonetary policy and long-term ERsthe spot ER is more volatile than the interest rate differential,because it captures all future interest-rate changes
Fixed ER regimes (using the n-year UIP formula)
it = i∗t −1
n(set,t+n − st)
to defend a fixed ER can be very costly for a Central Banksuppose the ER is expected to depreciate by 10% in a month.Then the CB must raise interest rates by 120% (= 0.1
1/12 )).
29/30

FX Markets RER PPP UIP and CIP
Conclusions
The FX market is decentralized, mostly OTC and shows largevolumes and high volatility.
In theory, PPP should hold in the long-run. Evidence insupport of convergence in about 4 years.
The Balassa-Samuelson effect predicts RER appreciation indeveloping countries.
According to no-arbitrage principles, forward ERs shouldfollow UIP and CIP. Mixed empirical evidence.
CA Adjustment works differently under fixed and flexible ERregimes.
30/30


