63
LED Street Lighting Assessment and Strategies for the Northeast and Mid-Atlantic Northeast Energy Efficiency Partnerships January 2015

LED Street Lighting Assessment and Strategies for the Northeast and Mid-Atlantic
Northeast Energy Efficiency Partnerships January 2015

Northeast Energy Efficiency Partnerships 91 Hartwell Avenue Lexington, MA 02421 P: 781.860.9177 www.neep.org
2
LED Street Lighting Assessment and Strategies
For the Northeast and Mid-Atlantic
Northeast Energy Efficiency Partnerships January 2015
Acknowledgements NEEP verified the data in this report to the best of our ability. The assessment of lighting opportunities, barriers, and available strategies is purely our own, and does not reflect the opinions of NEEP’s board of directors. We thank the following allies for their contributions, review of data, and general insights: the US Department of Energy; NYSERDA, Energy and Resource Solutions, Optimal Energy, and others who contributed to the Assessment of Street Lighting Opportunities in New York State; and the Massachusetts Department of Energy Resources and others who contributed to the Assessment of Street Lighting Opportunities in Massachusetts. In addition, we thank NEEP’s contributors and reviewers: Sue Coakley, Alicia Dunn, Josh Craft, Carolyn Sarno Goldthwaite, Jim O’Reilly, and Irina Rasputnis. This Project was funded in part by the United States Department of Energy, Office of Energy Efficiency and Renewable Energy, Weatherization and Intergovernmental Programs Office. For more information, please contact the authors of this report: Gabe Arnold, Market Strategies Program Manager [email protected] 781-860-9177 x152 Brian Buckley, High Performance Buildings Associate [email protected] 781-860-9177 x161
About NEEP Founded in 1996 as a non-profit, NEEP’s mission is to serve the Northeast and Mid-Atlantic to accelerate energy efficiency in the building sector through public policy, program strategies, and education. Our vision is that the region will fully embrace energy efficiency as a cornerstone of sustainable energy policy to achieve a cleaner environment and a more reliable and affordable energy system. With an annual budget of $6 million, our work is supported by states, utilities, federal agencies, project fees, and private foundations. About NEEP’s High Performance Buildings Project The High Performance Buildings Project has been developed to promote operational energy savings via municipal energy efficiency and high performance public building construction or retrofit throughout the region. NEEP's vision is that the work done today on High Performance Buildings will pave the way toward Zero Net Energy.
Northeast Energy Efficiency Partnerships 91 Hartwell Avenue Lexington, MA 02421 P: 781.860.9177 www.neep.org
3
TABLE OF CONTENTS 1. EXECUTIVE SUMMARY 4
2. LED STREET LIGHTING BENEFITS 7
2.1. Cost-Savings Benefits 7
2.2. Additional Benefits 7
3. OPPORTUNITY ANALYSIS 8
4. BARRIERS TO LED STREET LIGHT CONVERSIONS 10
4.1. Technical Barriers 10
4.2. Regulatory Barriers 10
4.3. Financial Barriers 14
5. A REGIONAL STRATEGY TO OVERCOME CONVERSION BARRIERS 19
APPENDIX A: STATE ANALYSES 27
A. Connecticut 30
B. Delaware 33
C. District of Columbia 35
D. Maine 37
E. Maryland 39
F. Massachusetts 42
G. New Hampshire 45
H. New Jersey 47
I. New York 50
J. Pennsylvania 52
K. Rhode Island 55
L. Vermont 57
APPENDIX B: METHODOLOGIES DETAILED 60

Northeast Energy Efficiency Partnerships 91 Hartwell Avenue Lexington, MA 02421 P: 781.860.9177 www.neep.org
4
1. EXECUTIVE SUMMARY
There are approximately 4.96 million municipal1 street lights in the Northeast and Mid-Atlantic region using 3.17 TWh of electricity annually.2 These street lights are composed primarily of High Pressure Sodium (HPS), Metal Halide (MH), and Mercury Vapor (MV) technology, but Light Emitting Diode (LED) technology is now capable of cost-effectively replacing traditional street light technologies. LEDs use less than half the energy consumed by traditional lights and last significantly longer. If all street lights in the region are converted to LED technology and combined with advanced controls,3 1.76 TWh of energy could be saved.4 Throughout the region, cities like New York, Boston, and Philadelphia are converting their street lights to LEDs, yet significant technical, regulatory, and financial barriers to widespread conversion remain for most municipalities in the region.5 This report assesses the current status of LED street light conversion barriers in the Northeast and Mid-Atlantic region. It provides a quantitative analysis of the regional street lighting efficiency opportunity and a recommended strategy to address the barriers and achieve large scale conversion. Finally, the report provides information on activities and progress across the region to install LED street lighting. Summary of Key LED Street Lighting Barriers and Recommendations The barriers to LED street lighting conversions are technical, regulatory, and financial:
Barrier Type
Description
Technical Many municipalities lack the resources and the technical expertise needed to design and implement successful LED street lighting upgrade projects.
Regulatory
Most utility tariffs in the region for utility-owned street lights do not offer LED technology and/or street lighting controls as options. This prevents most municipalities in the region from converting street lights to LED technology, installing street lighting controls, and receiving any economic benefit for doing so.
1 Municipal street lights are street lights that are paid for by municipalities. They may be either owned by the municipality or owned by the utility. They do not include privately funded street lights on private roads or non-municipal street lights that may be paid for by other government or non-government entities (e.g., college or university street lights, street lights on prison roadways, or some bridge/tunnel lighting). 2 The Northeast and Mid-Atlantic Region is composed of New York, Pennsylvania, New Jersey, Massachusetts, Maryland, Connecticut, Maine, New Hampshire, Rhode Island, Delaware, Washington D.C., and Vermont. Methodologies for arriving at this number discussed in Appendix B. 3 In the context of street lights, advanced controls offer energy savings over the traditional photocell control because they allow for street lights to dim or turn off during off-peak hours and a network that can inform operators when a light has failed (et.al.). 4 Savings estimates detailed in Table 1. 5 This report focuses on the opportunities, barriers, status, and best practices surrounding LED street light conversion. While other high efficiency lighting technologies exist, LEDs have represented the vast majority of documented conversion projects in the region and have become the technology of choice for street lighting. However, many of the technical, regulatory, and financial issues described in this report can also be applied to other technologies.

Northeast Energy Efficiency Partnerships 91 Hartwell Avenue Lexington, MA 02421 P: 781.860.9177 www.neep.org
5
Barrier Type
Description
Regulatory
The structure and assumptions used in some tariffs for utility-owned LED street lights result in little or no electricity bill savings compared to traditional HPS street light tariffs. In turn, this results in little or no cost savings to municipalities that opt for LED street lights.
Financial
Access to—and the cost of—capital to purchase street lights from the utility and/or to fund LED street light conversions is a significant barrier for municipalities. Further, municipalities that choose to purchase or convert utility-owned street lights before legacy street light systems have fully depreciated can face additional capital costs.
To address these barriers, we recommend a regional strategy with the goal to convert 30 percent of all municipal street lights to LED by 2020. This strategy includes overcoming the most significant regulatory and financial barriers in a manner that sets the stage for nearly 100 percent adoption by 2030 (i.e., market transformation) as shown in Figure ES1 below:
Figure ES1: 30% of Municipal Street Lights Converted to LED by 2020
The core driver of this result is the adoption and implementation of street lighting tariffs that encourage LED conversions supported by complementary regulatory policies that address issues of stranded cost and other disincentives, as well as financial tools and strategies that reduce the cost of LED street lights. Indeed, if all states and utilities adopted such tariffs and policies by 2020, full market transformation could occur well before 2030.
Regional Strategic Coordination Begins
All Region's Regulated Utility Tariffs Offer LED, 30% of Street Lights Converted
Regional Goal: 30% of Municipal Street Lights Converted to LED by 2020
Coordinated Regional Strategy (Northeast/Mid-Atlantic)
Department of Energy National Projections

Northeast Energy Efficiency Partnerships 91 Hartwell Avenue Lexington, MA 02421 P: 781.860.9177 www.neep.org
6
This recommended regional strategy includes three key elements:
1. Provide Publicly Accessible Solutions - Identify, develop and make available solutions to overcome the known barriers to high efficiency municipal street lighting;
2. Engage and Support Stakeholders - Engage stakeholders and recruit and support states and municipalities to adopt these solutions to achieve municipal street light conversion goals; and
3. Make Progress Visible - Track and communicate progress across the region toward the goal of 30 percent conversion by 2020.
Figure ES2 below provides an overview of this strategy. The recommended strategy is described in detail in Section 5 of this report.
Figure ES2 – Regional Strategy to Achieve 30% LED Street Light Conversion by 2020
Provide Publicly Accessible Solutions
Create Regional On-Line Resource Center Facilitate Access to Existing Financial Solutions & Expertise Develop Additional Regulatory Policy and Tariff Solutions
Engage & Support Stakeholders
Stakeholder Outreach & Engagement Participant Recruitment Education and Technical Assistance
Make Progress Visible
Regional Street Lighting Scorecard and Map Estimate Achieved Street Lighting Energy, Cost, and Carbon Savings Track Market Penetration & Milestones for Market Transformation
Regional Strategy to Achieve 30% LED Street Light Conversion by 2020

Northeast Energy Efficiency Partnerships 91 Hartwell Avenue Lexington, MA 02421 P: 781.860.9177 www.neep.org
7
LED Street Lighting Benefits Energy Cost-Savings
Maintenance Cost-Savings
Extended Lifecycle
Reduced Carbon Emissions
Reduced Light Pollution at Night
Lighting Quality
Greater Perceived Security
2. LED STREET LIGHTING BENEFITS
Recent advances in LED street lighting options present a unique opportunity for reducing a municipality’s street lighting costs through energy and maintenance cost-savings, which translate into a reduced burden for municipal taxpayers. Also, energy efficient LED street lights reduce carbon emissions, improve visibility and public safety, and reduce light pollution.
2.1. Cost-Savings Benefits Street lighting can account for as much as 40 percent of a municipality’s electric utility bill.6 In many jurisdictions, this is a significant amount of the overall municipal budget. When compared against traditional street lights, LEDs can drastically lower energy usage and associated costs. For example, case studies show that municipalities can reduce their street lighting costs by as much as 65 percent when switching to LED street lights, and even more if they incorporate advanced lighting controls.7 Such energy savings translate directly to savings for taxpayers. Furthermore, municipalities can also capture maintenance cost-savings associated with an LED street light’s projected lifetime and diminished maintenance requirements, as compared to traditional street lights.8 Maintenance savings—which equate to approximately $50 annually per fixture—can provide approximately twice the financial advantages available through energy savings.9
2.2. Additional Benefits Investing in an LED street light conversion project provides benefits beyond reduced costs. Since LED street lights have a higher efficacy than previous lighting options, they result in lower carbon emission while performing the same task. Because LED street lights have improved optical control, less light is directed into the night sky, reducing light pollution. Observers often find the light from an LED street light, which has a better color rendering
6 New York Department of Environmental Conservation. Energy and Climate. Reduce Utility Bills for Municipal Facilities and Operations. Accessed: 1/12/15. Available at: http://www.dec.ny.gov/energy/64089.html 7 Gerdes, Justin. “Los Angeles Completes World’s Largest LED Street Light Retrofit.” (Citing a 63 percent overall energy savings for Los Angeles’ LED Street light Project) (July 2013) Accessed: 1/12/15. Available at: http://www.forbes.com/sites/justingerdes/2013/07/31/los-angeles-completes-worlds-largest-led-street-light-retrofit/ 8 US Department of Energy Building Technologies Office. Solid State Lighting Technology Fact Sheet. (August 2013) (Stating that “LEDs have the potential to best other technologies in terms of longevity,”) Accessed: 1/12/15. Available at: http://apps1.eere.energy.gov/buildings/publications/pdfs/ssl/life-reliability_fact-sheet.pdf 9 New York State Energy Research and Development Authority. Street Lighting in New York State: Opportunities and Challenges. Page 7. (December 2014). Accessed: 1/12/15. Available at: http://www.nyserda.ny.gov/-/media/Files/Publications/Research/Energy-Efficiency-Services/Street-Lighting-in-NYS.pdf

Northeast Energy Efficiency Partnerships 91 Hartwell Avenue Lexington, MA 02421 P: 781.860.9177 www.neep.org
8
index and a broader spectrum than HPS lights, is brighter and improves visibility.10 From a public safety perspective, LED light provides greater perceived security and has been reported to reduce crime rates.11 Furthermore, maintenance costs associated with vandalism are reduced for LEDs street lights because their components are more durable than traditional high pressure sodium street lights.
3. OPPORTUNITY ANALYSIS
There are approximately 4.96 million municipal street lights12 in the Northeast and Mid-Atlantic region using approximately 3.17 TWh of electricity annually. If all of these street lights are converted to LED technology, approximately 1.62 TWh of energy could be saved. Additional savings of at least 141 GWh are possible with the installation of street lighting controls. Beyond energy savings, LED street lighting and controls provide opportunities for municipalities to greatly reduce the cost and the associated tax burden of providing street lighting service to their citizens and businesses. While cost savings for more efficient street lighting will vary by municipality, utility, and associated tariff charges, we conservatively estimate cost savings of more than $382.1 million annually are available across the region if all street lights are converted to
LED and controls are installed on 30 percent of those lights.13 Over 10 years, the potential savings approaches $4 billion. With municipal budgets across the region stretched thin, LED street lighting is an important solution to the financial challenges faced by municipalities. Table 1 provides estimates of the region’s potential savings according to whether an LED conversion includes advanced controls. Table 2 provides a state-by state analysis of energy, maintenance, and cost savings.14
10 US Department of Energy, Office of Energy Efficiency and Renewable Energy, Solid State Lighting Program. “Light at Night: the Latest Science.” (November 2010) Accessed: 1/12/15. Available at: http://apps1.eere.energy.gov/buildings/publications/pdfs/ssl/ssl_whitepaper_nov2010.pdf 11 Gerdes, Justin. Forbes.com. “Los Angeles Saves Millions with LED Street Light Deployment.” (Citing an approximate 10 percent drop in nighttime crime rates after LED conversion) (January 2013) Accessed: 8/23/14. Available at: http://www.forbes.com/sites/justingerdes/2013/01/25/los-angeles-saves-millions-with-led-street-light-deployment/ 12 For a discussion of methodologies used in estimating the number of street lights, see Appendix B. 13 This analysis assumes that only 30 percent of the existing streetlights throughout the region are appropriate for controls, due to both aesthetic and practical barriers. Controls-based savings for those lights were estimated to be 30 percent of energy usage, in accordance with a California Lighting Technology Center estimate of 30-50 percent savings as cited in Michael Siminovitch’s essay “Taking the Long view on LED Street Lighting.” Accessed: 1/12/15. Available at: http://cltc.ucdavis.edu/sites/default/files/files/publication/20100700-researchmatters.pdf 14 For further discussion of estimates and methodologies, see Appendix B.

Northeast Energy Efficiency Partnerships 91 Hartwell Avenue Lexington, MA 02421 P: 781.860.9177 www.neep.org
9
Table 1: Northeast and Mid-Atlantic Potential Savings and Cost Estimates
Measure Annual Energy Savings (MWh)
Annual Energy Cost
Savings ($ Million)
Annual Maintenance
Savings ($ Million)
Total Annual Cost
Savings ($ Million)
Total Installed
Cost ($ Million)
Simple Payback Period (years)
LED Retrofit 1,622,036 $123.43 $247.86 $371.3 $1,392.96 3.75
Advanced Controls 141,035 $10.79 --- $10.79 $148.71 13.78
Retrofit and Controls 1,763,071 $134.22 $247.86 $382.09 $1,541.07 4.03
Table 2: State-by-State Savings and Cost Estimates
State
Number of Municipal
Street Lights
Annual MWh
Savings (LED
Retrofits & Controls)
Annual Energy Cost
Savings ($
Million)
Annual Maintenance
Savings ($ Million)
Total Annual
Cost Savings
($ Million)
Total Installed
Cost ($
Million)
New York 1,386,000 566,111 $36.8 $69.30 $106.1 $431.05
Pennsylvania 1,070,109 358,674 $25.1 $53.50 $78.61 $332.80
Connecticut 312,140 104,621 $12.56 $15.60 $28.16 $97.08
New Jersey 763,137 255,784 $21.74 $38.16 $59.9 $237.34
Maryland 527,237 176,716 $10.6 $26.36 $36.96 $163.97
Massachusetts 496,000 166,247 $14.96 $24.80 $39.76 $154.26
Rhode Island 91,363 30,623 $2.76 $4.56 $7.32 $28.41
Delaware 77,940 26,124 $2.35 $3.90 $6.25 $24.24
District of Columbia 71,000 23,797 $1.9 $3.55 $5.45 $22.08
Maine 65,887 22,084 $2.03 $3.29 $5.50 $20.49
New Hampshire 65,297 21,886 $2.19 $3.26 $5.45 $20.3
Vermont 31,037 10,403 $1.04 $1.55 $2.59 $9.65

Northeast Energy Efficiency Partnerships 91 Hartwell Avenue Lexington, MA 02421 P: 781.860.9177 www.neep.org
10
4. BARRIERS TO LED STREET LIGHT CONVERSIONS
Technical, regulatory, and financial barriers stand between the current street lighting landscape and the widespread adoption of LEDs by municipalities and we discuss each barrier in detail below.
4.1. Technical Barriers
Barrier: Many municipalities lack resources and the technical expertise needed to design and implement successful LED street lighting upgrade projects.
The field of available LED street lighting products has changed drastically in recent years. The industry has hosted a rapid advancement in lumen/watt efficacy, a rapid decrease in costs per unit, and a stunning proliferation of products and manufacturers in the marketplace. LED technology is vastly different from legacy street lighting technologies and requires new and different approaches in using it. With this, new tools and expertise are needed to successfully implement LED street lighting upgrade projects. Municipalities need expertise in how to evaluate street lighting systems; design new systems; procure high quality and reliable LED products; understand regulatory tariffs; and evaluate the economics of street lighting upgrades. Providing municipalities with tools, resources and expertise offers a significant opportunity regionally and nationally to accelerate adoption of LED street lighting.
4.2. Regulatory Barriers
Barrier: Most utility tariffs in the region for utility-owned street lights do not offer LED technology and/or street lighting controls as options. This prevents most municipalities in the region from converting street lights to LED technology, installing street lighting controls, and receiving any economic benefit for doing so.
Barrier: The structure and assumptions used in some tariffs for utility-owned LED street lights result in little or no electricity bill savings compared to traditional HPS street light tariffs, resulting in little or no cost savings to municipalities that opt for LED street lights.
A discussion of regulatory barriers requires understanding of: (1) street light ownership models; (2) utility tariffs; and (3) municipal purchase opportunities.
4.2.1 Street Lighting Ownership
Street lights may be owned by either the utility or the municipality. In both cases, the street lights and the service they provide are paid for by the municipality, but whether a municipality can install LED technology, and the cost savings they may realize for doing so, depends largely on which party owns the street lights.

Northeast Energy Efficiency Partnerships 91 Hartwell Avenue Lexington, MA 02421 P: 781.860.9177 www.neep.org
11
Rhode Island’s Municipal Street Light
Investment Act Rhode Island enacted a 2013 law (Chapter 39-30) establishing formal procedures for municipalities to purchase their utility-owned outdoor lighting systems and directing electric distribution companies to file a tariff incorporating rates for customer-owned dimmable lighting.
4.2.2 Utility-Owned Street Lights
The majority of street lights in the region are utility-owned.15 In this case, a utility purchases, owns, and depreciates the street light on its balance sheet while leasing the use of a luminaire to the customer for the purpose of street lighting. The customer, in most cases a municipality, pays a monthly charge that includes all costs associated with providing the street lighting service, which includes the cost of the energy distribution, transmission, and generation charges,16 as well as a luminaire charge. The luminaire charge is an itemized charge that generally accounts for the cost of capital, the cost of the luminaire and associated equipment, and the cost of the luminaire’s maintenance, amortized over the expected useful life of the asset. All of these charges are defined in a utility’s street lighting tariff for utility-owned street lights. When street lights are owned by the utility, the customer’s choice of street light technologies is in most cases limited to the utility’s offerings within the approved tariffs.17 While utilities generally offer several options for street lighting technologies, they can be slow to develop offerings for newer technologies, as is the case with LEDs. As of August 2014, only 13 of 45 investor-owned utilities in the Northeast and Mid-Atlantic region offer LEDs within their utility-owned tariffs. Why have investor-owned utilities been slow to develop tariff offerings for LED technology?18 While there are many factors—financial and otherwise—that may or may
15 Howe, Dan. (et.al.) Rocky Mountain Institute. “Street Fight: LED Street Lighting the Newest Challenge to Old Utility Business Models” (November 2013) (Stating: “[I]n most cities around the country, the local electric distribution company provides overhead street lighting as a basic service at a flat monthly rate per light, which includes the light itself, maintenance, and electricity.”) Accessed: 9/26/14. Available at: http://blog.rmi.org/blog_2013_11_26_Street_Fight. It’s also important to note that according to data cited in this report’s appendix, the majority of street lights in New York, Rhode Island, and near majority in Massachusetts are utility-owned. 16 Distribution utility generation charges hinge upon whether the customer accepts that utility’s standard offer generation rate. In the case of Vermont, which has not undergone electric industry restructuring, the transmission, distribution, and generation rates are predetermined by the distribution utility. 17 New Jersey’s Public Service Electric and Gas is a notable exception to this general rule, explicitly providing an equation for specialty equipment that it will purchase on behalf of a municipality. 18 From a timing perspective, many utilities are only required to file new rate cases with their regulators every three years. This is a significant amount of time in the context of rapidly developing technology.
Utility-Owned Street Lighting Tariffs
If an LED rate is not included in a company-owned street light tariff, then LEDs are unavailable to municipalities that provide street lighting service through that tariff. As of August 2014, approximately 30 percent of investor-owned utilities in the region offer LEDs within their company-owned tariffs. (Table A1, Appendix A).

Northeast Energy Efficiency Partnerships 91 Hartwell Avenue Lexington, MA 02421 P: 781.860.9177 www.neep.org
12
not motivate an investor-owned utility to develop LED tariff offerings, an LED tariff may reduce utility revenues and undermine fixed cost recovery. If a lower LED rate is developed by the utility and customers convert their street lights, the utility’s revenues will decrease. Further if there is high demand for LED street lighting conversions due to the cost savings a utility-owned LED tariff may provide, the utility will face significant capital expenditures. While they will recover the capital expenditures over time through rates, the initial capital outlay can be very large and affect the utility’s financial standing. To address this initial capital outlay issue, some utilities that have developed utility-owned LED tariffs that limit the number of conversions they can complete each year and have written that into the tariff. It is this combination of decreased revenue and capital outlay that can create disincentives for utilities to develop LED tariffs. What is needed to address these disincentives is a clear public policy mandate and an accompanying business model that works for utilities to offer and more actively promote LED street lighting. A secondary reason utilities can be slow to invest in LED street lighting is that they can be penalized by regulators and/or customers for making investments in a new and unfamiliar technology if that technology does not perform as predicted. For example, if the utilities invest in LED street lights and they do not perform as expected, it could present a liability to the utility in the form of additional capital outlays to correct or replace malfunctioning street lights.19 These additional costs could also lead to a finding that the utility investment in the technology was either not 100 percent economically used or useful (i.e. above market replacement cost) leading to some disallowed cost recovery and/or penalties for poor customer service. As LED technology continues to mature and prove itself, this particular impediment to utility adoption of LEDs has become less of a concern.
4.2.3 Customer-Owned (Municipally-Owned) Street Lights
Unlike municipalities with utility-owned street lights, municipalities that own their street lights are generally free to install any technology (e.g. LED) they would like and receive the full economic benefits of doing so. Under municipal ownership, the municipality is fully responsible for the purchase, operation, and maintenance of the street light and only pays the utility for the cost of energy to the street light. The municipalities may maintain the luminaires themselves or contract with a third-party or the utility for maintenance. Most municipalities in the region, however, do not own their street lights as municipal ownership of street lights is more common with large municipalities that have the resources to manage a street lighting system, while smaller municipalities tend to use utility-owned street lights. For this reason, most of the LED street lighting activity to date in the region has been with large municipalities.
19 Inside Electric News. “New LED Street Lights Fail in the Rain.” (Describing the installation, removal, and reinstallation of 2,000 street lights in San Antonio to adjust a design flaw) Accessed 11/23/14. Available at: http://www.insideelectricnews.com/index.php/top-stories/manufacturers/5587-new-led-street-lights-fail-in-the-rain

Northeast Energy Efficiency Partnerships 91 Hartwell Avenue Lexington, MA 02421 P: 781.860.9177 www.neep.org
13
4.2.4 Assessment of Utility-Owned LED Tariffs in the Region
Thirteen of the forty-five investor-owned utilities in the Northeast and Mid-Atlantic offer a utility-owned LED street light tariff.20 The remaining utilities do not currently offer LED as an option. As a result, many municipalities cannot choose to install LED technology through a street light tariff. However, a further challenge exists in that a portion of the 13 LED tariffs in the region provide little or no cost savings to municipalities compared to their existing street lighting rates. In some cases, the LED rate actually costs a municipality more than the less efficient and shorter-life high-pressure sodium rate municipalities are looking to replace. This is a critical issue because if a municipality does not receive adequate cost savings for converting to LED, an LED upgrade will not make economic sense. How is this higher LED rate possible when cities across the region and country are cost-effectively replacing high pressure sodium street lighting with LEDs? The reason has to do with how some utility-owned street lighting tariffs are structured and the assumptions used within to calculate those rates. These structures and rates are examined below.
4.2.5 Examining Street Lighting Tariff Structures and Assumptions
A utility-owned LED street lighting rate is built from three components: the energy cost, the capital cost including the cost of the LED fixture, and the maintenance cost. The largest portion of the rate is the capital cost. All of these costs are bundled to a monthly charge that a municipality pays on their electric bill. Although LEDs reduce the energy and maintenance components of the rate, they increase the largest component of the rate: capital costs. Therefore, it is possible that the increased capital cost of the LED technology compared to other technologies can offset the energy and maintenance savings in the way that the rate tariff is designed, resulting in little or no cost savings to the municipality. Much depends on the assumptions used for reduced energy costs, potential maintenance savings, and the cost of the LED fixture. It is critical that the utility and regulators appropriately value the energy and maintenance savings while using up-to-date and competitive fixture cost assumptions to develop a rate that reflects the real potential for cost savings to municipalities.
4.2.6 Applied Tariff Structure Examination
As an example, one New York investor-owned utility developed a utility-owned LED rate in 2011 that is still in place today. This LED rate costs a municipality approximately 30 percent more than the comparable high pressure sodium rate. Research into the utility’s assumptions revealed that the utility selected an LED street lighting fixture that provided 31 percent energy savings compared to high-pressure sodium with a fixture cost of $571. Research of recent case studies found that current comparable LED fixtures should provide 50-70 percent 20 Public Service of New Hampshire and Connecticut Light and Power have LED tariffs pending publication and not included here. The PSNH tariff is based upon customer-contributed equipment, which becomes property of the utility once contributed. Additionally, Public Service Electric and Gas offers a flexible company-owned tariff that could be read to include LED technologies.

Northeast Energy Efficiency Partnerships 91 Hartwell Avenue Lexington, MA 02421 P: 781.860.9177 www.neep.org
14
in energy savings with a fixture cost of between $113 and $350. If the utility revised their rate with current assumptions, the rate could be reduced from 30 percent more than the HPS rate to 10-15 percent lower than the HPS rate. A comparison of high pressure sodium and LED rates for each utility in the region offering an LED rate is provided in Appendix A of this report.
4.2.7 Municipal Purchase of Street Lighting System from Utility
Due to the lack of LED rates or cost-savings provided by LED rates, many municipalities are looking to purchase their street lighting system from the utility so that it is no longer utility-owned. Whether this is a viable option varies by state and, in many cases, is at the discretion of the utility. In some states including Massachusetts, Rhode Island, and Maine, street lighting system purchases have been enabled by specific legislation that requires utilities to allow municipalities to purchase street lights and attain ownership. This has been an especially valuable tool in Massachusetts where more than 75 municipalities have purchased their street lights from the utility, and more than 37 of those have converted to LED. According to the Massachusetts Department of Energy Resources, LED conversion in 41 of Massachusetts municipalities has saved more than 28,885,287 kWh (almost 29 GWh) over a period of three years, resulting in over $7.6 million in efficiency program incentives.
4.3. Financial Barriers
Barrier: Access to and the cost of capital to purchase street lights from the utility and/or fund LED street light conversions is a significant barrier for municipalities. Further, municipalities that choose to purchase or convert utility-owned street lights before the street light asset has been fully depreciated will face additional capital costs.
A discussion of financial barriers slowing LED conversion requires examining: (1) common misconceptions regarding LED costs; (2) stranded assets associated with conversion; and (3) available sources of capital.
4.3.1 Common Misconceptions Regarding LED Costs
Two common misconceptions regarding LED costs can discourage prospective street light purchasers: (i) perceived high up-front costs; and (ii) the perceived ‘first-mover’ dilemma.
4.3.1.1 Perceived High Up-Front Cost of LED Technology
Decision-makers sometimes cite the cost of LED technology as the most significant roadblock toward prospective street light conversions. Yet, when examined on a life-cycle basis, reductions in energy usage and maintenance costs depict LED street light conversions as an attractive financial proposition even prior to the recent decline in LED cost. High quality LED

Northeast Energy Efficiency Partnerships 91 Hartwell Avenue Lexington, MA 02421 P: 781.860.9177 www.neep.org
15
street lights are available from respected manufacturers for as little as $99.21 Table 3 shows typical costs of an LED conversion based on recent case studies.
Table 3: Typical LED Street Light Retrofit Costs22
4.3.1.2 Perceived First-Mover Dilemma
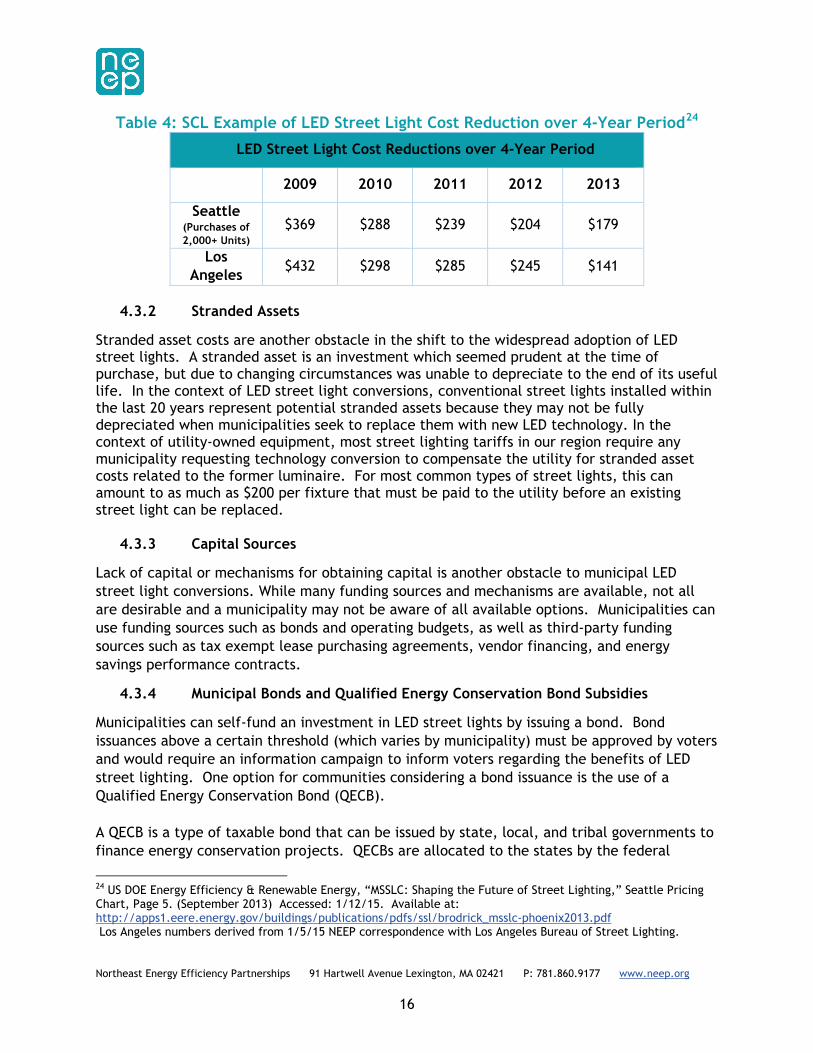
A utility or municipality may be hesitant to invest in LED street light conversions due to concerns about early adoption. These actors are cautious of a new technology’s early cost-benefit ratio, which can be low until robust competition has a chance to decreases prices, improve energy savings, and improve overall product performance. This perceived first-mover dilemma can discourage or delay utility or municipal LED street light investments. However, when an analysis is performed that compares the operating cost savings of installing LED technology now to the product cost and energy cost savings if the technology is installed in the future, it is more economically beneficial to install the technology now. It will ultimately cost a municipality or utility more to wait. This is often referred to as the “cost-of-waiting”. Though economically it makes sense for municipalities and utilities to install LED technology right now, what further price reductions might we expect? A 2013 Department of Energy report notes that price reductions, which have followed a logarithmic curve, have begun to slow substantially and will be less significant than they have been in the past.23 For example, Seattle City Light (SCL) in Seattle, Washington has been in the process of a phased LED street light replacement project since 2009. Each year, the cost of equivalent LED street lights has fallen significantly. Table 4 tracks the decline in cost of a 70 W LED cobrahead street light used by the city of Seattle, which replaced a 100 W HPS cobrahead fixture. In general, LED street light products are maturing with more competitive pricing for a range of product choices. While further product innovations and cost reductions are still possible, product costs today make LED replacements attractive investments - reducing the concern of missing out on future possible product improvements or cost reductions. More important now is the missed opportunity to reduce costs by re-lamping undepreciated legacy technologies with LED street lights.
21 Reuters. “Cree Introduces the Industry’s First $99 LED Street Light as a Direct Replacement for Residential Street Lights,” (August 2013) Accessed: 1/12/15. Available at: http://uk.reuters.com/article/2013/08/06/nc-cree-idUSnBw065147a+100+BSW20130806 22 Supra, at note 9. Page 12. 23US Department of Energy Building Technologies Office: “SSL Pricing and Efficacy Trend Analysis for Utility Program Planning.” (October 2013) Page 32. Accessed: 1/12/15. Available at: http://apps1.eere.energy.gov/buildings/publications/pdfs/ssl/ssl_trend-analysis_2013.pdf
Northeast Energy Efficiency Partnerships 91 Hartwell Avenue Lexington, MA 02421 P: 781.860.9177 www.neep.org
16
Table 4: SCL Example of LED Street Light Cost Reduction over 4-Year Period24
LED Street Light Cost Reductions over 4-Year Period
2009 2010 2011 2012 2013
Seattle (Purchases of 2,000+ Units)
$369 $288 $239 $204 $179
Los Angeles
$432 $298 $285 $245 $141
4.3.2 Stranded Assets
Stranded asset costs are another obstacle in the shift to the widespread adoption of LED street lights. A stranded asset is an investment which seemed prudent at the time of purchase, but due to changing circumstances was unable to depreciate to the end of its useful life. In the context of LED street light conversions, conventional street lights installed within the last 20 years represent potential stranded assets because they may not be fully depreciated when municipalities seek to replace them with new LED technology. In the context of utility-owned equipment, most street lighting tariffs in our region require any municipality requesting technology conversion to compensate the utility for stranded asset costs related to the former luminaire. For most common types of street lights, this can amount to as much as $200 per fixture that must be paid to the utility before an existing street light can be replaced.
4.3.3 Capital Sources
Lack of capital or mechanisms for obtaining capital is another obstacle to municipal LED street light conversions. While many funding sources and mechanisms are available, not all are desirable and a municipality may not be aware of all available options. Municipalities can use funding sources such as bonds and operating budgets, as well as third-party funding sources such as tax exempt lease purchasing agreements, vendor financing, and energy savings performance contracts.
4.3.4 Municipal Bonds and Qualified Energy Conservation Bond Subsidies
Municipalities can self-fund an investment in LED street lights by issuing a bond. Bond issuances above a certain threshold (which varies by municipality) must be approved by voters and would require an information campaign to inform voters regarding the benefits of LED street lighting. One option for communities considering a bond issuance is the use of a Qualified Energy Conservation Bond (QECB). A QECB is a type of taxable bond that can be issued by state, local, and tribal governments to finance energy conservation projects. QECBs are allocated to the states by the federal
24 US DOE Energy Efficiency & Renewable Energy, “MSSLC: Shaping the Future of Street Lighting,” Seattle Pricing Chart, Page 5. (September 2013) Accessed: 1/12/15. Available at: http://apps1.eere.energy.gov/buildings/publications/pdfs/ssl/brodrick_msslc-phoenix2013.pdf Los Angeles numbers derived from 1/5/15 NEEP correspondence with Los Angeles Bureau of Street Lighting.

Northeast Energy Efficiency Partnerships 91 Hartwell Avenue Lexington, MA 02421 P: 781.860.9177 www.neep.org
17
government according to population, with the expectation that each state will sub-allocate a portion of their QECBs to large local governments and municipalities (populations of 100,000 or more).25 Federal subsidies for QECBs can reduce the bond’s interest payment to below three percent, making them an attractive financing vehicle for municipally sponsored energy conservation projects.26 QECBs can either be issued as direct payment bonds or tax credit bonds. Direct payment bonds offer the municipality a direct payment from the treasury to subsidize the bond interest, while tax credit bonds offer the bond holder a subsidy in the form of a tax credit. A major barrier limiting the use of QECBs for small projects is the high transactions costs associated with their issuance.27 No more than two percent of a bond’s proceeds can be used to finance its cost of issuance.28 Also, transaction costs may make small issuances harder to place with accredited investors. Nevertheless, some jurisdictions have been able to surmount the transaction cost barrier by pairing their issuances with other funds or bonds to buy down transaction costs covered by the issuance itself.29 QECBs have successfully been used by San Diego, CA and Richmond, CA to finance high efficiency street lighting projects.30 In both instances, the QECBs were privately placed with a single qualified investor, and the transaction structured as a lease-purchase agreement where the investment is secured by investor-ownership of the lighting equipment until the debt is repaid.
4.3.5 Operating Budgets
Alternatively, a city with a large enough operating budget can fund the cost of a phased conversion through the energy and maintenance savings that result from a prior conversion phase. For example, the New York City Department of Transportation (NYCDOT) was able to use operational cost-savings resulting from a first phase of LED conversions to subsequently invest in additional LED street light conversions.31
25 IRS Notice 2009-29. Qualified Energy Conservation Bond Allocations for 2009. Accessed: 1/12/15. Available at: http://www.irs.gov/pub/irs-drop/n-09-29.pdf 26 Bellis, Elizabeth (et. al.). Energy Programs Consortium. Qualified Energy Conservation Bonds (QECBs). Page 6. Accessed: 1/12/15. Available at: http://energy.gov/sites/prod/files/2014/06/f16/QECB_memo_12-13-13.pdf. 27 Id. 28 26 USC 54A (e)(4) 29 Supra, at note 25 30 Lawrence Berkeley National Laboratory. Using QECBs for Street Lighting Upgrades: Lighting the Way to Lower Energy Bills in San Diego. (July 2012) Accessed: 1/12/15. Available at: http://energy.gov/sites/prod/files/2014/06/f16/street-lighting-qecb.pdf 31 US Department of Energy. New York: Self-Funding. (Date Unknown). Accessed: 1/12/15. Available at: http://apps1.eere.energy.gov/buildings/publications/pdfs/ssl/financing_nyc-brief.pdf

Northeast Energy Efficiency Partnerships 91 Hartwell Avenue Lexington, MA 02421 P: 781.860.9177 www.neep.org
18
Metropolitan Area Planning Council Street
Lighting Program The Metropolitan Area Planning Council is a Massachusetts non-profit that guides municipalities through the LED street light conversions process, including street light buybacks, the energy performance contracting process, and Massachusetts’ statewide procurement process.
4.3.6 Third-Party Funding Sources
An abundance of third-party funding sources are available for LED street lighting conversions. For example, tax exempt lease purchasing arrangements, vendor financing, energy savings performance contracts and global management performance contracts enable municipalities to obtain equipment without up-front capital, and instead pay for LED conversions over a period of time based on projected energy cost-savings. A major access barrier for such financing options is that most third parties will not finance the retrofit of a small facility or number of lights. For this reason, it is better for small municipalities to aggregate with other small municipalities for investment in street lighting conversion. Such aggregation methods have been successfully utilized in Iowa32 and Massachusetts.33 In some locales, utility efficiency program incentives are another source of third-party funding for LED street light conversions. For example, the city of Boston funded its LED street light conversion in part with NSTAR incentives of $0.20 for each kWh of energy saved annually. This provided approximately $142/luminaire or 26 percent of the project’s costs.34
32 US Department of Energy, Building Technologies Program. Iowa Municipalities Unite to Save Energy with LED Street Lighting. (November 2012). Accessed: 1/12/15. Available at: http://apps1.eere.energy.gov/buildings/publications/pdfs/ssl/iowa-muni_brief.pdf 33 Metropolitan Area Planning Council. LED Street Lighting. Accessed: 1/12/15. Available at: http://www.mapc.org/led-street-lighting 34 US Department of Energy. Boston: Grants and/or Rebates. Accessed: 1/12/15. Available at: http://apps1.eere.energy.gov/buildings/publications/pdfs/ssl/financing_boston-brief.pdf

Northeast Energy Efficiency Partnerships 91 Hartwell Avenue Lexington, MA 02421 P: 781.860.9177 www.neep.org
19
5. A Regional Strategy to Overcome Municipal Street Lighting Conversion Barriers
As communities continue to explore the adoption of LED street lights there is good news: here in the Northeast-Mid-Atlantic region viable solutions already exist to overcome the technical, regulatory, and financial barriers. For every barrier, there is at least one state, utility, municipality, or organization that has developed a creative solution to overcome that barrier. Appendix A provides an overview of what states are doing in this arena.
The news is encouraging but the reality is that these barriers will continue to impede broad adoption of cost-effective LED street lights without a concerted regional initiative to “champion” a regional conversion goal and connect stakeholders with solutions to achieve it. Such an effort should build on the success of US DOE’s High Performance Outdoor Lighting Accelerator (HPOLA) and Municipal Solid-State Street Lighting Consortium (MSSLC) which address these issues on a national scale.35 Selecting the Northeast-Mid-Atlantic region for such an effort makes sense given the high cost of electricity and state commitments to reduce carbon emissions through increased energy efficiency.
Recommended Regional Goal: 30% Conversion by 2020 To accelerate municipal LED street light conversions in the Northeast-Mid-Atlantic region, we recommend a regional initiative with the goal to convert 30 percent of the region’s street lights to high efficiency LED by 2020. This would deliver more than 529,000 MWh energy savings annually, $114 million in cost savings, reduced light pollution, improved lighting quality, greater perceived security, and reduced carbon emissions. A strategy beginning in 2015 to achieve 30 percent conversion by 2020 could be accomplished with conversion commitments from 30 of the region’s largest cities (population of 100,000+), plus conversion commitments from approximately 50 additional medium sized cities. While this goal is optimistic,36 we believe it is achievable.37
To put this goal in perspective, Figure 1 compares US DOE’s national LED street light penetration estimates and projections (i.e., the dark line) with the potential for increased penetration in the Northeast-Mid-Atlantic regional resulting from a coordinated regional 35 The Department of Energy provides a trove of outreach materials through their MSSSLC and High Performance Street and Outdoor Lighting Accelerator. For example, the Department of Energy publishes a Model Specification for LED Roadway Luminaires V2.0 and Retrofit Financial Analysis Tool that can that can be used by municipalities to plan streetlight conversions. A regional strategy would leverage these—and other MSSSLC publications—in referring prospective participants to the High Performance Street and Outdoor Lighting Accelerator. 36 US Department of Energy, Office of Energy Efficiency and Renewable Energy. Solid State Lighting Research and Development: Multi-Year Program Plan. (April 2014) Page 8, 13. (US DOE estimates 2013 area/roadway installed penetration at 7.1%, and projects 68% of all area, roadway, and highway lighting will be converted to LED by 2030) Accessed: 1/12/15. Available at: http://apps1.eere.energy.gov/buildings/publications/pdfs/ssl/ssl_mypp2014_web.pdf 37 For example: There are approximately five million street lights in the region; therefore 30 percent of total inventories equates to roughly 1.5 million luminaires. If the region’s 30 largest cities convert their lighting inventories to LED, they will have converted approximately one million luminaires; about 1/3 of these cities have already committed to conversion. If approximately 10 smaller cities within the region commit to conversion each year until 2020, the goal of 1.5 million luminaires will have been reached.

Northeast Energy Efficiency Partnerships 91 Hartwell Avenue Lexington, MA 02421 P: 781.860.9177 www.neep.org
20
strategy (i.e., light blue line). As has been achieved in other market transformation efforts, we believe that achieving an installed penetration of 30 percent regionally will build a critical mass of momentum that will carry the region to achieve near complete conversion by 2030 compared to US DOE’s national projection of 70 percent by 2030. For example, once tariffs and regulatory policies have been adopted by a state, they can be fully deployed across that state and provide an important model for other states to follow.
Figure 1: 30% of Municipal Street Lights Converted to LED by 2020
Recommended Regional Strategy: Identify Solutions, Engage Stakeholders/Recruit Participants, Track Progress
As articulated in section 4, the barriers to street light adoption are technical, regulatory, and financial. From a technical perspective, municipalities lack resources and expertise to understand and implement successful street lighting upgrade projects. From a regulatory perspective, utilities are slow to develop tariffs that offer LED or lighting controls and lack financial or regulatory incentives that would motivate them to do so. Financially, both utilities and municipalities are challenged by the high initial costs of LED technology and the stranded costs of legacy lighting that is replaced before it is depreciated. Solutions to address these barriers exist, and in some cases need further development.
Figure 2 Provides an Overview of Barriers and Proposed Regional Solutions.
Regional Strategic Coordination Begins
All Region's Regulated Utility Tariffs Offer LED, 30% of Street Lights Converted
Regional Goal: 30% of Municipal Street Lights Converted to LED by 2020
National Penetration Estimates (DOE)
Northeast and Mid-Atlantic Estimates (Coordinated Strategy)

Northeast Energy Efficiency Partnerships 91 Hartwell Avenue Lexington, MA 02421 P: 781.860.9177 www.neep.org
21
Figure 2: Barriers & Proposed Regional Solution BARRIERS SOLUTIONS
Technical Municipalities lack resources and technical expertise
Regional information sharing Forums, On-line Resource Center and Identified Expertise
Financial Stranded costs from legacy lighting and high up-front transactional costs for new LED street lights
Financial Tools and Resources
Regulatory Utilities lack incentives to retire legacy lighting or adjust street lighting tariffs to encourage LED street light conversions
Regulatory Policies and Model Tariffs
The need, opportunity and solutions exist across the region to overcome these barriers. In some cases additional solutions are needed (e.g., new regulatory policies and model tariffs). In all cases, solutions require supported dissemination and active stakeholder engagement to gain traction towards the regional goal.
Our recommended three-part strategy to achieve this includes:
1. Identify, develop and make available solutions to overcome the known barriers to high efficiency municipal street lighting;
2. Engage stakeholders and recruit and support states and municipalities to adopt these solutions to achieve municipal street light conversion goals; and
3. Track and communicate progress across the region toward the goal of 30 percent conversion by 2020.
Figure 3: Regional Strategy to Achieve 30% LED Street Light Conversion by 2020
Provide Publicly Accessible Solutions
Create Regional On-Line Resource Center Facilitate Access to Existing Financial Solutions & Expertise Develop Additional Regulatory Policy and Tariff Solutions
Engage & Support Stakeholders
Stakeholder Outreach & Engagement Participant Recruitment Education and Technical Assistance
Make Progress Visible
Regional Street Lighting Scorecard and Map Estimate Achieved Street Lighting Energy, Cost, and Carbon Savings Track Market Penetration & Milestones for Market Transformation
Regional Strategy to Achieve 30% LED Street Light Conversion by 2020

Northeast Energy Efficiency Partnerships 91 Hartwell Avenue Lexington, MA 02421 P: 781.860.9177 www.neep.org
22
Strategy Element 1: Provide Publicly Accessible Solutions A primary element of the regional strategy is to transfer learning from across the region where states and municipalities have already overcome technical, regulatory, and financial barriers supplemented by the development of additional needed solutions – primarily targeted to financial, regulatory and tariff related barriers. Available solutions and related expertise should be made available through an on-line regional resource center with links to other relevant experience and resources available nationally (e.g., through US DOE efforts).
1. Create a Regional Online High Efficiency Street Lighting Resource Center For nearly every adoption barrier, whether technical, financial, or regulatory, our research found that at least one state, utility, municipality, or organization in the region that has developed a creative solution to overcome it. However little of this information is disseminated beyond the local stakeholders that have implemented them. Connecting stakeholders across the region with these solutions is a high priority recommended strategy.
A major component of connecting stakeholders to these solutions is the development of a Regional Online High Efficiency Street Lighting Resource Center to convey best practices from across the region. With references and links to other relevant resources nationally, components of the Online Resource Center could include the following:
• Information about the Regional Goal, Initiative and Stakeholder Participation • Regional Street Lighting News and Progress Updates • Media and Communication Kits • Case Studies and Exemplars of Successful Projects • Links to Successful Utility Tariff Models • Information on Successful Financing Methods
o Bulk Purchasing Resources o Innovative Energy Services Models o Model Transactional Documents
Example RFQs and RFPs • Links to all MSSLC and HPOLA Tools and Resources
o Key Reports and Conversion Guidance Documents o Retrofit Analysis Tools o Model Specifications
2. Develop Regulatory Policies, Incentives & Tariffs to Encourage LED Street Light
Conversions
Regulatory barriers and lack of LED and advanced controls tariff offerings remain among the largest hurdles to increased implementation of high efficiency street lighting. To overcome this we recommend that a team of experts be engaged through a stakeholder advised process to identify potential regulatory policies and tools that could encourage utilities to develop tariff offerings and support their municipal customers to implement upgrade projects at

Northeast Energy Efficiency Partnerships 91 Hartwell Avenue Lexington, MA 02421 P: 781.860.9177 www.neep.org
23
scale. These constructs may include unique applications of cost trackers,38 return on equity adders,39 and non kWh based performance incentives and targets.40 In developing these regulatory policies, tools and model tariffs, the team should engage key stakeholders including regulators and utilities as well as consumer advocates. If successful, adoption of such policies could financially motivate utilities to move forward with tariffs and encourage large-scale conversion – an outcome that could potentially convert the entire region in a few short years once the policies and tariffs are in place.
3. Facilitate Access to Financial Tools and Resources
Many municipal and utility stakeholders cite financial barriers as the largest hurdle to high efficiency street lighting conversion. While clearly advantageous on a lifecycle basis, initial costs of LED equipment are higher than incumbent technologies. Furthermore, costs stranded in legacy assets must be accounted for during conversion. This effort should seek to develop and/or leverage resources such as: (1) Utility Incentive Programs;41 (2) Bulk Procurement Options;42 and (3) Innovative Financing Models.43 We recommend a stakeholder advised effort supported by experts to develop recommended guidance while leveraging existing financial tools and resources. Such development could be undertaken either as a regional effort as a task of an existing national effort (e.g., US DOE’s MSSLC).
Strategy Element 2: Engage Stakeholders to Support Municipal LED Streetlight Conversions Another key element of the regionally coordinated strategy is engaging key stakeholders to aid the development, review, dissemination, and implementation of recommended solutions
38 Accelerating capital recovery for certain investments deemed as supporting the public good (e.g. streetlights) could help provide utilities with up-front capital necessary for conversion. This tactic is already used in several different venues including grid modernization efforts, advanced metering infrastructure, and emission control equipment. A similar strategy would allow utilities to earn an immediate return for construction work in progress within the realm of street lighting. This would enable utility bulk purchase of street lighting equipment in a manner that lowers purchasing costs through economies of scale. 39 The Federal Energy Regulatory Commission provides incentives through the use of Return on Equity (ROE) adders. ROE adders increase the rate of return an investor would normally receive from ratepayers for investing their capital in a specific project or equipment. This market based incentive could potentially be applied in the field of street lighting by providing a slightly elevated return on investment for LED street lighting equipment. 40 Weatherization goals are unique from typical efficiency program goals in that their performance targets are not based upon KWh saved, but rather number of homes weatherized. Borrowing from this field of utility incentives, a savvy incentive program could set annual goals for number of street lights converted and provide tiered performance incentives to a utility according to how far they surpass the baseline goal. Such incentives could be conditioned upon meeting traditional KWh-based program requirements. 41 Drawing upon previous successes, the region’s utilities and energy efficiency programs could be engaged to develop effective incentive offerings for street lighting conversions. For example, in Vermont regulators approved the use of energy efficiency incentives as a mechanism to buy-down a large portion of stranded costs associated with legacy street lighting systems. While not without controversy, this model eliminated much of the capital cost required of municipalities to convert street lights. 42 Bulk procurement of LED street lighting equipment has become a popular tool for reducing conversion costs. Further, municipal aggregation presents the opportunity for smaller cities and towns to band together for purchase-price negotiation, as well as to explore other alternative procurement strategies. 43 Lease-purchase agreements, municipal bonding options, infrastructure as a service, and other avenues are available for municipalities that own their street lights, or have an interest in their purchase. Further, innovative companies in the energy services field, such as Commons Energy, are incorporating the use of patient capital to complete projects in municipalities that previously had been unable to access to performance contracts.

Northeast Energy Efficiency Partnerships 91 Hartwell Avenue Lexington, MA 02421 P: 781.860.9177 www.neep.org
24
to achieve the regional goal of 30 percent conversion by 2020. Stakeholder engagement can be accomplished through: (1) Outreach and Education; (2) Participant Recruitment; and (3) Connecting Participants with Technical Expertise. Such engagement should complement existing processes to engage communities to set and achieve energy efficiency, clean energy and carbon emission reduction goals.
1. Stakeholder Outreach and Engagement
A robust stakeholder outreach and engagement campaign is an essential tool to disseminate best practices to relevant regional actors. This campaign should leverage existing regional and national support networks to connect stakeholders and build productive working relationships, aligning policy, program, and market efforts toward advancement of high efficiency street lighting. Outreach to engage stakeholders should use multiple dissemination avenues, including social media, newsletter contributions, journal articles, and presentations at relevant conferences or events targeting community, state, and utility stakeholders.
Such a campaign should leverage the collective experiences of a regional working group to facilitate knowledge transfers, identify best practices, and scale up through combined efforts until regional street lighting inventories have reached a transformation tipping point of approximately 30 percent installed LED capacity.44 To fulfill this purpose, the working group should communicate via monthly or bi-monthly calls, quarterly webinars, and annual in-person meetings. All webinars should be recorded and archived for dissemination via the Online Resource Center. Working group members should be representative of all actors in the conversion process, including state energy offices, municipal officials, energy advocates, regulators, utilities, and key national stakeholders such as DOE. The working group could use subgroups, or “leadership advisory committees”, assisted by expert consultants to develop specific technical, regulatory, and fiscal solutions to overcome regulatory and financial barriers.
2. Targeted Participant Recruitment
In addition to the generalized outreach and education facilitated by the stakeholder group, the regionally coordinated strategy should target participant recruitment to reach a high efficiency lighting penetration rate of 30 percent by 2020.45 Major street lighting stakeholders such as state departments of transportation and large municipalities can deliver opportunities to convert large inventories through a single point of contact. Likewise, those communities that have already demonstrated an interest in energy conservation or carbon
44 To ensure widespread dissemination of best practices through municipal point-of-contact engagement, the working group should forge strategic alliances to facilitate member presentations at regional conferences, workshops, and events. The working group should align themselves with initiatives like the Department of Energy’s High Performance Outdoor Lighting Accelerator (HPOLA), and regional members of membership groups like the Municipal Solid-State Street Lighting Consortium (MSSLC). It may work with groups such as the National Association of State Utility Consumer Advocates (NASUCA), the National Association of Regulatory Utility Commissioners (NARUC), and the National Association of State Energy Officials (NASEO). 45 In this context, “Participants” are stakeholders that commit to converting their street lighting inventory and may or may not be part of the working group.

Northeast Energy Efficiency Partnerships 91 Hartwell Avenue Lexington, MA 02421 P: 781.860.9177 www.neep.org
25
reduction strategies should also be targeted for recruitment.46
In the same way that communities currently engaged in energy conservation strategies could be targeted for street lighting outreach, street lighting conversion could be used as the cornerstone of a broader energy conservation strategy. Street lighting is one of the most visible opportunities for energy efficiency in any community. Often when a street lighting conversion takes place, news outlets document the conversion, elected officials hold press conferences, and the public is asked to provide input. A regionally-supported, community-based initiative could leverage the high visibility of street lighting to connect communities to other energy conservation strategies, including DOE resources such as the Better Buildings Initiative and Accelerators.
3. Technical Assistance and Education
In addition to technical assistance provided through the Regional Online Street Lighting Resource Center, the regional stakeholder working group could connect interested participants with local regulatory, technical, and financial expertise through a comprehensive stakeholder network. Further, the initiative can facilitate knowledge transfer by subject matter experts through webinars, presentations, peer exchanges, and case studies recorded and archived within the Regional Online Street Lighting Resource Center.
Strategy Element 3: Track, Measure and Make Progress towards Goals Visible Tracking and measurement of progress toward the goal of 30 percent conversion by 2020 can support effective implementation of the regional strategy using tools such as: (1) a Regional Street Lighting Scorecard and Map; (2) Quantification of Street Lighting Energy, Cost, and Carbon Savings Estimates; and (3) Verification and Adjustment of LED Penetration Projections. These progress trackers could be disseminated to media outlets as well as provided to policymakers and other stakeholders to support achievement of the 2020 and long-term market transformation goals.
1. A Regional Street Lighting Scorecard and Map
To highlight the region’s progress toward high efficiency street lighting, the online resource center could host and maintain a regional map focused on high efficiency street lighting to track: (1) Jurisdictions that have converted their inventories/committed to conversion; (2) Jurisdictions that have enacted laws enabling LED conversion; and (3) Utilities offering LED tariffs. To supplement the street lighting map, the initiative could produce an annual scorecard identifying champions amongst municipalities, regulators, energy offices, and utilities.
46 Most importantly, the working group may identify stakeholders through regional and state-level groups such as State Energy Offices, Energy and Climate Action Groups, local municipal associations, and the Conference of Mayors. One potential avenue for recruitment might be through membership associations, such as the Urban Sustainability Director’s Network.

Northeast Energy Efficiency Partnerships 91 Hartwell Avenue Lexington, MA 02421 P: 781.860.9177 www.neep.org
26
2. Street Lighting Conversion Energy, Cost, and Carbon Savings Estimates
Quantifying the benefits of completed LED conversions will buttress arguments in favor of conversion for those municipalities considering high efficiency street lighting. While case studies provided by the DOE and MSSLC are an excellent resource in this respect, communities would benefit from knowledge of what their neighbors have saved, as well as cumulative savings within the region. Energy savings, cost savings, and carbon emission reductions from within the region should be identified for every participant completing a conversion and documented through case studies, as well as via a dashboard within the resource center.
3. LED Penetration Projections and Key Performance Indicators
This report projects that the region can achieve 30 percent conversion to high efficiency street lighting by 2020. While initial progress may be slow, we project that momentum for street lighting conversion will grow rapidly over the next five years. The penetration curve in Figure 1 and its associated projections will serve as a guidepost against which to measure progress, helping to determine the most efficient allocation of resources to achieve the regional goal.
In addition, the regional initiative should track progress by key performance indicators that relate to indicators of success relative to the 2020 goal and long-term market transformation such as those indicated below.
Key Performance Indicators Towards 30% Goal by 2020
Strategy 1:
Provide Publicly
Accessible Solutions
1. Online Regional Resource Center is widely used and referenced by regional stakeholders to support streetlight conversions.
2. State regulators, utilities and consumer advocates adopt and use recommended regulatory policies, tools and model LED street light tariffs.
3. States and municipalities adopt and use financial solutions and resources to make undertake conversion to LED streetlights.
Strategy 2:
Stakeholder Outreach and Engagement
1. 30 major and 50 medium-size municipalities adopt LED streetlight conversion goals and undertake programs to make significant progress by 2020.
2. Utilities propose and regulators adopt policies and tariffs that support accelerated municipal conversion to LED street lighting.
3. Municipalities participate in coordinated bulk procurement of LED street lights.
Strategy 3:
Track and Make Progress
Visible
1. Media outlets and stakeholders (e.g., state agencies, clean energy advocates) reference the Regional Street Lighting Conversion Map, Scorecard recognize or support LED street light conversion programs.
2. States and municipalities are publicly recognized for their commitments and progress to accelerate LED street light conversions.

Northeast Energy Efficiency Partnerships 91 Hartwell Avenue Lexington, MA 02421 P: 781.860.9177 www.neep.org
27
Appendix A: State Analyses
There are 45 investor-owned utilities in the region, representing the vast majority of the street light conversion opportunities. 13 of these investor-owned utilities offer a utility-owned LED tariff. (Table A1)
Table A1: Northeast and Mid-Atlantic Investor-Owned Utilities Tariff Offerings Investor-Owned Utilities and Utility-Owned LED Tariff Offerings
State Investor Owned Utility % State’s
Residential Customers
Utility-Owned LED Tariff
CT Connecticut Light & Power 75% Pending CT United Illuminating 17% Yes DC PEPCO 100% No DE Delmarva Power 66% Yes MA Massachusetts Electric Co. (National Grid) 43% Yes MA NSTAR 34% No MA Western Massachusetts Electric Co 7% No MA Nantucket Electric Co 1% No MA Fitchburg Gas and Electric 1% Yes MD Baltimore Gas and Electric 47% Yes MD Potomac Electric Power Co 21% No MD Potomac Edison Co 11% Yes MD Delmarva Power 9% No ME Central Maine Power 77% Yes ME Bangor Hydroelectric Co. 15% No ME Maine Public Service Co. 4% No NH Public Service of New Hampshire 70% Pending NH Unitil 11% No NH Liberty Utilities 6% No NJ Public Service Electric and Gas 56% No NJ Jersey Central Power and Light 27% No NJ Atlantic City Electric Co. 14% Yes NJ Rockland Electric Co. 2% Yes NY Consolidated Edison 40% No NY Niagara Mohawk Power Co. 20% No NY Public Service Electric and Gas- Long Island 18% No NY New York State Electric and Gas 10% No NY Central Hudson Gas and Electric 4% No NY Rochester Gas and Electric Co. 4% No NY Orange and Rockland 2% Yes NY Pennsylvania Electric Co ~0% No PA Potomac Edison Co 27% No PA PPL Electric 20% No PA Western Pennsylvania Power Co. 14% No PA Metropolitan Edison 10% No

Northeast Energy Efficiency Partnerships 91 Hartwell Avenue Lexington, MA 02421 P: 781.860.9177 www.neep.org
28
Investor-Owned Utilities and Utility-Owned LED Tariff Offerings
State Investor Owned Utility % State’s
Residential Customers
Utility-Owned LED Tariff
PA Pennsylvania Electric Co 10% No PA Duquesne Light and Power 9% Yes PA Pennsylvania Power co 3% No PA UGI Utilities 1% No PA Pike County Power Co. ~0% Yes PA Citizens Electric ~0% No RI Narragansett Electric Co. (National Grid) 99% No RI Block Island Power Co. ~0% No VT Green Mountain Power 39% Yes VT Central Vermont Public Service (Legacy) 34% Yes
Almost every state has legislatively enabled energy performance contracting, and some states encourage utilities to offer street lighting equipment for sale to interested purchasers. The region is also home to over 50 participants in the Department of Energy’s MSSSLC, including two utility commissions, nine utilities, and 35 municipalities. (Table A2)
Table A2: Northeast and Mid-Atlantic MSSSLC Participants Northeast and Mid-Atlantic MSSSLC Participants
State Participant Type CT Northeast Utilities (CL&P) Utility CT United Illuminating Utility CT Groton Utilities Utility CT City of Hartford Municipality CT Town of Madison Municipality CT Town of Manchester Municipality DC District of Columbia DOT Municipality DC Pepco Utility DC Demonstration of Energy Efficient Developments (DEED) Other DC US Air Force, Secretary of Air Force for Energy Other DE City of Lewes Municipality MA National Grid Utility MA City of Holyoke Gas and Electric Department Utility MA SELCO - Shrewsbury Electric Utility MA Massachusetts Department of Energy Resources Other MA Cambridge Community Development Dept Other MA City of Boston Municipality MA City of Woburn Municipality MA Town of Acton Municipality MA Town of Barnstable Municipality MA Town of Easton Municipality MA Town of Medfield Municipality MD Maryland Department of the Environment Other ME City of South Portland Municipality

Northeast Energy Efficiency Partnerships 91 Hartwell Avenue Lexington, MA 02421 P: 781.860.9177 www.neep.org
29
Northeast and Mid-Atlantic MSSSLC Participants State Participant Type ME City of Westbrook Municipality NH New Hampshire Department of Transportation Other NH City of Keene Municipality NH Hollis Department of Public Works Municipality NJ New Jersey Board of Public Utilities Other NJ Township of Jackson Municipality NY New York State Department of Public Service Other NY Port Authority of NJ and NY Other NY New York City Department of Transportation Other NY Orange and Rockland Utility NY Village of Sherburne Electric Light Department Utility NY City of Corning Municipality NY City of New Rochelle Municipality NY City of Rochester Municipality NY City of Schenectady Energy Advisory Board Municipality NY Town of Amherst Municipality NY Village of Croton-on-Hudson Municipality NY Village of Great Neck Plaza Municipality NY Town of Amherst Municipality NY Village of Southampton Municipality PA Delaware Valley Regional Planning Commission Other PA City of Philadelphia Municipality PA Borough of Ellwood City Municipality PA Borough of St Lawrence Municipality PA City of Sunbury Municipality PA City of York Municipality PA Lower Merion Township Municipality PA Milford Township Municipality PA Springfield Township Municipality PA Whitehall Township Municipality RI US Naval Undersea Warfare Center Other RI Town of Barrington Municipality VT Burlington Electric Department Utility

Northeast Energy Efficiency Partnerships 91 Hartwell Avenue Lexington, MA 02421 P: 781.860.9177 www.neep.org
30
Connecticut Street Light Summary Number of Street Lights: 312,140 Percent Region’s Total Street Lights: 6 percent Annual Street light Energy Usage: 192 GWh Annual Potential Energy Savings: 96 GWh Annual Potential Energy-Cost Savings: $12.6 Million Annual Potential Maintenance Cost-Savings: $15.6 Million LED Conversion Installed Costs: $87.7 Million Annual Potential Lighting Controls Energy Savings: 8.6 GWh Annual Potential Lighting Controls Cost Savings: $1.04 Million Lighting Controls Installed Cost: $9.36 Million
A. Connecticut
1. Tariff Status United Illuminating, which carries roughly 17 percent of the state’s street light opportunities offers a utility-owned LED street light rate. (Table A3) Connecticut Light and Power (CL&P), which carries roughly 75 percent of the state’s street light opportunities, does not currently offer a utility-owned tariff, but evidence indicates that a pending rate case includes an LED tariff.47
2. Legislative Background As mentioned in the body of this assessment, some states have enacted legislation requiring a utility to sell their street lighting equipment to an interested municipality. While Connecticut has not enacted such legislation, a 2005 Public Utility Commission decision directs CL&P (the state’s largest utility) to make the purchase of street lighting equipment available to interested municipalities.48 Such purchase can be staggered over a five year period. Also, Connecticut has a legislatively enabled energy savings performance contracting program for municipalities.49
47 State of Connecticut Public Utilities Regulatory Authority. Docket No. 14-05-06. PFT of Kenneth B. Bowes. (June 9, 2014) Accessed 1/12/15. Available at: http://nuwnotes1.nu.com/apps/financial/nuinvest.nsf/0/05212330CECC6D8985257CF300521543/$FILE/201420CLpercent20CL&P20rate%20casepercent20ratepercent20case--distribution20resiliency%20testimonypercent20resiliencypercent20testimony.pdf 48 Connecticut Department of Public Utility Control. Docket No. 04-01-01. DPUC Investigation in the Connecticut Light and Power Company’s Street light Asset Plant Values, Accounting Practices, and Rates. (June 2005). Accessed: 1/12/15. Available at: http://www.dpuc.state.ct.us/FINALDEC.NSF/0d1e102026cb64d98525644800691cfe/781f166b5751fefd85257030006f45d2/$FILE/040101-063005.doc 49 Public Act 11-80, Section 123. Connecticut Statutes on Energy-Savings Performance Contracting for State Agencies and Municipalities. Accessed: 1/12/15. Available at: http://www.ct.gov/deep/lib/deep/energy/lbe/CT_Enabling_Legislation.pdf

Northeast Energy Efficiency Partnerships 91 Hartwell Avenue Lexington, MA 02421 P: 781.860.9177 www.neep.org
31
3. Notable Projects A simple search revealed six jurisdictions have converted, are pending conversion, or have an interest in converting to LED street lights. These jurisdictions include Middletown, East Hartford, Plainville, New Haven, Stamford, and Pawcatuck. (Table A4) 4. Connecticut Street Light Request for Qualifications Connecticut is unique in the region because the Connecticut Conference of Municipalities recently issued a Request for Qualifications (RFQ) regarding street light LED retrofit, management, and maintenance services.50 The RFQ states that most Connecticut municipalities do not own their street lights and solicits assistance for towns who wish to purchase their street lights from CL&P. This solicitation is important because it potentially offers municipalities the option to achieve efficiencies during the exchange with CL&P, standing as one voice and utilizing a centralized bargaining ambassador who likely will have a technical expertise that municipal representatives themselves do not possess. It also offers easily accessible economies of scale to municipalities who might participate in a volume purchasing agreement to procure equipment or maintenance and management services. Organizations like the Connecticut Conference of Municipalities exist in every state in the region. This is likely a widely replicable model that deserves close attention.
Table A3: United Illuminating HPS/ LED Rate Comparison United Illuminating (Connecticut)51
HPS Rate
LED Rate
Lumen Rating
Annual Rate Per Light
LED Equivalent Lumen Rating
Fixture Wattage
Annual Rate Per Light
4,000 $85.06 3000 (50 W HPS Equivalent) 20 $99.74
5,800 $97.36 3300 (70 W HPS Equivalent) 43 $99.74
9,500 $129.50 5300 (100 W HPS Equivalent) 67 $155.12
16,000 $160.74 8400 (150 W HPS Equivalent) 106 $245.64
27,500 $208.37 10,500 (250 W HPS/MH Equivalent) 130 $265.37
50,000 $271.01 15,500 (400W HPS/MH Equivalent) 196 $398.25
50 Connecticut Conference of Municipalities. RFQ#52014: Street light LED Retrofit, Management, & Maintenance Services. Accessed: 1/12/15. Available at: http://programs.ccm-ct.org/Resources.ashx?id=77b6c587-fada-4e9e-8e01-fb7916ce7a6c 51 United Illuminating Rate Schedule. Accessed: 1/12/15. Available at: http://www.uinet.com/wps/wcm/connect/e1c9170040d8535ca7b9bfd2ce51850f/UI+Tariffs+Effective+January+1,+2011+(clean).pdf?MOD=AJPERES&CACHEID=e1c9170040d8535ca7b9bfd2ce51850f
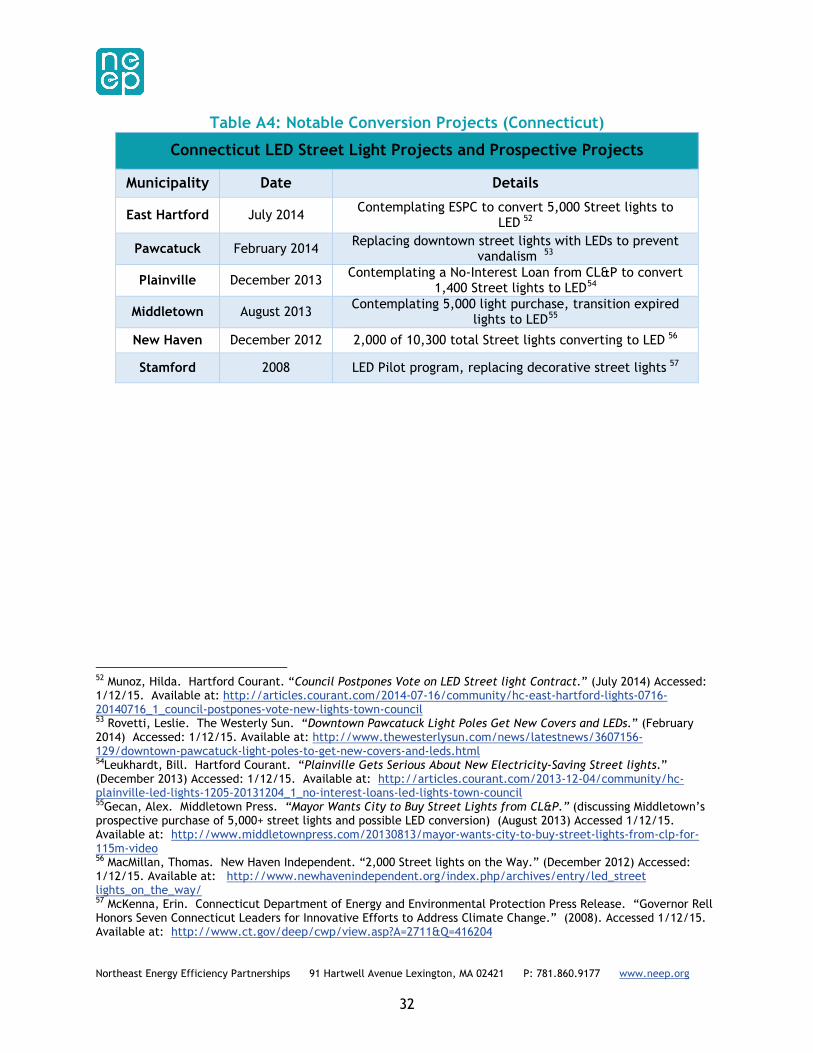
Northeast Energy Efficiency Partnerships 91 Hartwell Avenue Lexington, MA 02421 P: 781.860.9177 www.neep.org
32
Table A4: Notable Conversion Projects (Connecticut)
Connecticut LED Street Light Projects and Prospective Projects
Municipality Date Details
East Hartford July 2014 Contemplating ESPC to convert 5,000 Street lights to LED 52
Pawcatuck February 2014 Replacing downtown street lights with LEDs to prevent vandalism 53
Plainville December 2013 Contemplating a No-Interest Loan from CL&P to convert 1,400 Street lights to LED54
Middletown August 2013 Contemplating 5,000 light purchase, transition expired lights to LED55
New Haven December 2012 2,000 of 10,300 total Street lights converting to LED 56
Stamford 2008 LED Pilot program, replacing decorative street lights 57
52 Munoz, Hilda. Hartford Courant. “Council Postpones Vote on LED Street light Contract.” (July 2014) Accessed: 1/12/15. Available at: http://articles.courant.com/2014-07-16/community/hc-east-hartford-lights-0716-20140716_1_council-postpones-vote-new-lights-town-council 53 Rovetti, Leslie. The Westerly Sun. “Downtown Pawcatuck Light Poles Get New Covers and LEDs.” (February 2014) Accessed: 1/12/15. Available at: http://www.thewesterlysun.com/news/latestnews/3607156-129/downtown-pawcatuck-light-poles-to-get-new-covers-and-leds.html 54Leukhardt, Bill. Hartford Courant. “Plainville Gets Serious About New Electricity-Saving Street lights.” (December 2013) Accessed: 1/12/15. Available at: http://articles.courant.com/2013-12-04/community/hc-plainville-led-lights-1205-20131204_1_no-interest-loans-led-lights-town-council 55Gecan, Alex. Middletown Press. “Mayor Wants City to Buy Street Lights from CL&P.” (discussing Middletown’s prospective purchase of 5,000+ street lights and possible LED conversion) (August 2013) Accessed 1/12/15. Available at: http://www.middletownpress.com/20130813/mayor-wants-city-to-buy-street-lights-from-clp-for-115m-video 56 MacMillan, Thomas. New Haven Independent. “2,000 Street lights on the Way.” (December 2012) Accessed: 1/12/15. Available at: http://www.newhavenindependent.org/index.php/archives/entry/led_street lights_on_the_way/ 57 McKenna, Erin. Connecticut Department of Energy and Environmental Protection Press Release. “Governor Rell Honors Seven Connecticut Leaders for Innovative Efforts to Address Climate Change.” (2008). Accessed 1/12/15. Available at: http://www.ct.gov/deep/cwp/view.asp?A=2711&Q=416204

Northeast Energy Efficiency Partnerships 91 Hartwell Avenue Lexington, MA 02421 P: 781.860.9177 www.neep.org
33
Delaware Street Light Summary Number of Street Lights: 77,941 Percent Region’s Total Street Lights: 2 percent Annual Street light Energy Usage: 48 GWh Annual Potential Energy Savings: 24 GWh Annual Potential Energy-Cost Savings: $2.16 Million Annual Potential Maintenance Cost-Savings: $3.9 Million LED Conversion Installed Costs: $21.9 Million Annual Potential Lighting Controls Energy Savings: 2.2 GWh Annual Potential Lighting Controls Cost Savings: $194,000 Lighting Controls Installed Cost: $2.3 Million
B. Delaware
1. Tariff Status Delmarva Power, which is responsible for approximately two-thirds of Delaware’s street lights, offers a utility-owned LED tariff containing a luminaire charge that is slightly higher than a comparable HPS. (Table A5) Delmarva’s-customer owned tariff also explicitly provides an LED rate. 2. Legislative Background Delaware has legislatively enabled an energy savings performance contracting program for
municipalities and any municipality who owns their street lights could enter into a contract with an energy services company for LED conversion.58 There is no record of legislation designed to encourage the municipal purchase of a utility-owned street lights. 3. Notable Projects A simple search revealed no records of major street lighting projects in Delaware.
58 29 Del Laws § 6971

Northeast Energy Efficiency Partnerships 91 Hartwell Avenue Lexington, MA 02421 P: 781.860.9177 www.neep.org
34
Table A5: Delmarva Power HPS/LED Rate Comparison Delmarva Power (Delaware)59
HPS Rate
LED Rate
Lumen
Rating
Watts
(Nominal)
Annual
Rate Per
Light
Estimated
Monthly Avg.
kWh
Watts
(HPS
Equivalent)
Estimated
Monthly
Avg. kWh
Annual
Rate Per
Light
4,000 50W $80.76 21 50W 8 $111.12
5,800 70W $91.44 36 70W 15 $109.8
9,500 100W $96.48 49 100W 19 $111.36
16,000 150W $106.92 69 150W 30 $128.28
25,000 250W $165.24 109 250W 38 $149.76
50,000 4000W $195.36 164
59 Delmarva Power Electric Tariff. Accessed: 9/13/14. Available at: http://www.delmarva.com/uploadedFiles/wwwdelmarvacom/Content/Page_Content/My_Business/Master20tariff%20eff%2007percent20tariffpercent20effpercent2007-1-201420filed%2007percent20filedpercent2007-08-14.pdf

Northeast Energy Efficiency Partnerships 91 Hartwell Avenue Lexington, MA 02421 P: 781.860.9177 www.neep.org
35
District of Columbia Street Light Summary Number of Street Lights: 71,000 Percent Region’s Total Street Lights: 1 percent Annual Street light Energy Usage: 43.6 GWh Annual Potential Energy Savings: 21.8 GWh Annual Potential Energy-Cost Savings: $1.7 Million Annual Potential Maintenance Cost-Savings: $ 3.55Million LED Conversion Installed Costs: $20 Million Annual Potential Lighting Controls Energy Savings: 2 GWh Annual Potential Lighting Controls Cost Savings: $157,194 Lighting Controls Installed Cost: $2.13 Million
C. District of Columbia
1. Tariff Status The District of Columbia is unique in the region because it faces no tariff-based barriers to implementing an LED conversion project. PEPCO is the only distribution utility in the District of Columbia, and its customer-owned tariff makes no mention of luminaire type. Therefore, LED luminaries would be permitted within the District of Columbia under the current tariff. The District
Department of Public Works also publishes a GIS map containing the location of every street light.60 This is a clear best practice which would streamline the conversion process in Washington D.C. 2. Legislative Background The District has legislatively enabled energy performance contracting for municipalities.61 A tariff for utility-owned equipment was not available. It is possible that all street lights in the District are customer-owned. 3. Notable Projects A simple search revealed several LED initiatives including the Washington Metropolitan Transit Authority’s 13,000 fixture parking garage replacement project, a 1,360 fixture project in 2012, a completed alley light conversion project, and an ongoing controversy over a contract for the Street Light Asset Management Program, which will convert 32,500 street lights over a period of two years. (Table A6) Also noteworthy is a Howard University study on street light conversions, focused on the District of Columbia.
60 District of Columbia. Office of the City Administrator. Street Light GIS Map. Accessed 1/12/14. Available at: http://data.octo.dc.gov/Metadata.aspx?id=435 61 D.C. Code § 8-1778.01

Northeast Energy Efficiency Partnerships 91 Hartwell Avenue Lexington, MA 02421 P: 781.860.9177 www.neep.org
36
Table A6: Notable Conversion Projects (District of Columbia)
62 District Department of Transportation Powerpoint. Accessed: 8/23/14. Available at: http://www.mwcog.org/uploads/committee-documents/aV1aW1hc20130918152241.pdf 63 Washington Metropolitan Transit Authority (WMATA). Press Release. Metro to Overhaul Parking Garage Lighting for Safety, Efficiency. (November 2013) Accessed: 8/23/14. Available at: http://www.wmata.com/about_metro/news/PressReleaseDetail.cfm?ReleaseID=5613 64 Arhin, Stephen (et.al.). Howard University Transportation Research Center. “LED Energy Efficient Street Light Pilot Study.” Accessed: 8/23/14. Available at: http://www.scribd.com/doc/150596127/FINAL-EVALUATION-REPORT-LED-Energy-Efficient-Street light-Pilot-Study 65 Reuters. “Lighting Science Group Lights Up Washington D.C. With Ultra-Efficient LED Street Lights.” Accessed: 8/23/14. Available at: http://www.reuters.com/article/2012/05/14/idUS190060+14-May-2012+PRN20120514
District of Columbia LED Street Light Projects and Prospective Projects
Municipality Date Details District of
Columbia June 2014
Ongoing controversy regarding contract awards for Street light Asset Management Program to convert 32,500 street lights over a period of two years.62
WMTA November 2013 WMTA replacing 13,000 parking garage fixtures to promote safety and efficiency63
District of
Columbia May 2012 DDOT teamed with Howard University for LED study,64
then replaced 1,360 Alley Lights65

Northeast Energy Efficiency Partnerships 91 Hartwell Avenue Lexington, MA 02421 P: 781.860.9177 www.neep.org
37
Maine Street Light Summary Number of Street Lights: 65,887 Percent Region’s Total Street Lights: 1% Annual Street light Energy Usage: 40.5 GWh Annual Potential Energy Savings: 20.3 GWh Annual Potential Energy-Cost Savings: $2.2 Million Annual Potential Maintenance Cost-Savings: $3.3 Million LED Conversion Installed Costs: $18.5 Million Annual Potential Lighting Controls Energy Savings: 1.8 GWh Annual Potential Lighting Controls Cost Savings: $182,341 Lighting Controls Installed Cost: $2 Million
D. Maine
1. Tariff Status Maine’s three investor-owned utilities account for approximately 95 percent of the state’s street light opportunities, with a single utility—Central Maine Power Co—accounting for 77 percent of the opportunities. Central Maine Power Co offers a single utility-owned 50 Watt LED option within its street lighting tariff. (Table A7)
2. Legislative Background Maine has legislatively enabled energy savings
performance contracting for municipalities.66 The state also recently passed a law requiring utilities to sell their utility-owned street lights to any municipality requesting a purchase.67 3. Notable Projects A simple search revealed seven completed or pending LED conversion projects, including the jurisdictions of Kennebunk, Saco, Lewiston, Bangor, Brunswick Landing, and 105 light towers on I-295. (Table A8)
66 5 M.R.S.A. § 1770 67 35-A M.R.S.A. § 2518(6)

Northeast Energy Efficiency Partnerships 91 Hartwell Avenue Lexington, MA 02421 P: 781.860.9177 www.neep.org
38
Table A7: Central Maine Power HPS/LED Rate Comparison
Central Maine Power (Maine)68
HPS Rate
LED Rate
Lumen Rating
Watts (Nominal)
Input Watts
Annual Rate Per Light
Lumens Rating
Watts (Nominal)
Input Watts
Annual Rate Per
Light
3,600 50W 65 $131.88 4190 50 50 $248.64
5,670 70W 95 $130.68
8,550 100W 130 $140.04
14,400 150W 195 $166.32
25,600 250W 300 $228.96
45,000 400W 465 $290.76
Table A8: Notable Conversion Projects (Maine)
Maine LED Street Light Projects and Prospective Projects
Municipality Date Details
Lewiston March 2014 Request for quotation for purchase of 120 LED Street lights69
I-295 June 2012 Retrofitting 105 high mast light towers on I-29570
Brunswick Landing May 2012 Energy performance contract to replace parking lot
lights and street lights71
Saco February 2012 $71,000 of decorative retrofits for downtown 72
Fort Fairfield June 2011 Converted 174 Street lights to LED73
Kennebunk June 2011 Retrofit of 50 Antique Lampposts74
Bangor June 2009 Converted 300 downtown street lights to LED75
68 Central Maine Power Schedule SL. Accessed: 1/12/15. Available at: http://www.cmpco.com/MediaLibrary/3/6/Content20Managementpercent20Management/Suppliers20And%20Partnerspercent20Andpercent20Partners/PDFs20and%20Docpercent20andpercent20Doc/sl.pdf 69 City of Lewiston Purchasing Department. Request for Quotation. (March 2014) Accessed: 1/12/15. Available at: http://www.lewistonmaine.gov/DocumentCenter/View/4185 70 LEDs Magazine. “LED Modules Bring Energy Savings to High Mast Outdoor Lighting.” (June 2012) Accessed: 1/12/15. Available at: http://www.ledsmagazine.com/articles/print/volume-9/issue-6/features/led-modules-bring-energy-savings-to-high-mast-outdoor-lighting-magazine.html 71 Green Energy Maine. “LED Street Lighting to Save Brunswick Landing $11k Per Year.” (May 2012) Accessed: 1/12/15. Available at: http://greenenergymaine.com/blog/efficiency-conservation-posts/led-street-lighting-save-brunswick-landing-11k-year 72 The Pepperrell Post. “LED Lighting Conversions for Street Lights on Main Street.” (February 2011) Accessed: 1/12/15. Available at: http://www.sacomaine.org/news/pparchives/1102-led.shtml 73 Galm, Chris. US Department of Energy. “Maine Community Seeing Things in a New Light. (June 2011). Accessed: 1/12/15. Available at: http://energy.gov/articles/maine-community-seeing-things-new-light 74 Atkinson, William. Public Power Magazine. “LED Street Lighting: Worth the Investment?” (July 2011) Accessed: 1/12/15. Available at: http://www.publicpower.org/Media/magazine/ArticleDetail.cfm?ItemNumber=32308 75 Russel, Eric. Bangor Daily News. “Bangor Street lights to be LED.” (June 2009) Accessed: 1/12/15. Available at: http://bangordailynews.com/2009/06/24/news/bangor/some-bangor-street lights-to-be-led/

Northeast Energy Efficiency Partnerships 91 Hartwell Avenue Lexington, MA 02421 P: 781.860.9177 www.neep.org
39
Maryland Street Light Summary Number of Street Lights: 527,238 Percent Region’s Total Street Lights: 10 percent Annual Street light Energy Usage: 324.3 GWh Annual Potential Energy Savings: 162.1 GWh Annual Potential Energy-Cost Savings: $9.7 Million Annual Potential Maintenance Cost-Savings: $26.4 Million LED Conversion Installed Costs: $148.2 Million Annual Potential Lighting Controls Energy Savings: 14.6 GWh Annual Potential Lighting Controls Cost Savings: $875, 478 Lighting Controls Installed Cost: $15.8 Million
E. Maryland
1. Tariff Status Two Maryland utilities, Potomac Edison and Baltimore Gas and Electric (BGE), offer utility-owned LED street light tariffs. These tariffs reach more than 55 percent of the state’s street lighting inventory and each offer significant savings over similar high pressure sodium lighting options (Table A9 and Table A10)
2. Legislative Background Maryland has legislatively enabled energy savings
performance contracting.76 The legislature also passed a 2007 law that required utilities to sell their streets lights to interested municipal purchasers.77 Some ambiguities remain surrounding the buyback process,78 but BGE—the state’s largest utility—explicitly provides for street light buybacks within their tariff.
76 Article 12, §301, Annotated Code of Maryland. 77 Maryland General Assembly. Department of Legislative Services Fiscal and Policy Note. H.B. 729. County and Municipal Street Lighting Investment Act. Accessed 1/12/15. Available at: http://mgaleg.maryland.gov/2014RS/fnotes/bil_0009/hb0729.pdf 78 Maryland General Assembly, Department of Legislative Services. County and Municipal Street Lighting Investment Act. “Analysis.” (Stating: In Maryland, Chapters 554 and 555 of 2007 authorized local governments to purchase and maintain street lighting equipment. A May 2007 letter from the Attorney General indicated that although the bills were approved for constitutionality, the bills must be administered properly to ensure the right to just compensation protected by the U.S. and Maryland constitutions. Just compensation must be provided before the government can take private property. The Acts provided for compensation based on fair market value, which is usually construed to mean just compensation. However, the Acts do not expressly provide for the amount of compensation to be determined by a jury, as required in the Maryland Constitution. The Attorney General noted that this does not render the bills invalid and that the Acts may be implemented in a constitutional manner by use of the local governments’ condemnation powers to obtain possession of street lighting equipment when the electric company objects to a sale.”)

Northeast Energy Efficiency Partnerships 91 Hartwell Avenue Lexington, MA 02421 P: 781.860.9177 www.neep.org
40
3. Notable Conversion Projects A simple search revealed six pending or completed LED conversion projects within the jurisdictions of Baltimore, Chevy Chase, Princess Anne, Middletown, Montgomery County, and the State Highway Administration. (Table A11)
Table A9: Baltimore Gas and Electric HPS/LED Rate Comparison
Table A10: Potomac Edison HPS/LED Rate Comparison
79 Baltimore Gas and Electric Rate Schedule SL. Accessed: 1/12/15. Available at: http://www.bge.com/myaccount/billsrates/ratestariffs/electricservice/Electric20Services%20Rates%20and%20Tariffspercent20Servicespercent20Ratespercent20andpercent20Tariffs/P3_SCH_SL.pdf 80 Potomac Edison (First Energy/Allegheny Power) Rate Schedule. Accessed: 1/12/15. Available at: https://www.firstenergycorp.com/content/dam/customer/Customer20Choicepercent20Choice/Files/maryland/tariffs/PotomacEdisonRetailTariff.pdf
Baltimore Gas and Electric (Maryland)79
HPS Rate
LED Rate
Watts Nominal
Billing Watts
Annual Rate Per Light
Watts (HPS Equivalent)
Billing Watts
Annual Rate Per Light
100-150W 120-173 $136.92 100W 73 $131.76
150-250W 173-298 $540.00 150W 82-110 $148.92
250W 298 $215.16 200W 135-146 $187.12
400W 467 $237.24 250W 208 $211.08
1000W 1,130 $266.52 400W 258-275 $255.24
Potomac Edison (Maryland)80
HPS Rate
LED Rate
Lumen Rating
Watts (Nominal)
Annual Rate Per
Light
Estimated Monthly
Avg. kWh Lumens
Watts (Actual)
Estimated Monthly
Avg. kWh
Annual Rate Per
Light
5,800 70W $101.52 37 4,000 50W 18 $79.80
9,500 100W $100.56 51 7,000 90W 32 $100.44
22,000 200W $156.72 86 11,500 130W 46 $106.92
50,000 400W $223.08 167 24,000 260W 91 $166.32

Northeast Energy Efficiency Partnerships 91 Hartwell Avenue Lexington, MA 02421 P: 781.860.9177 www.neep.org
41
Table A11: Notable Conversion Projects (Maryland)
81 Berliner, Roger. “Summary of Earth Day Legislation Passed by the City Council” (April 2014) Accessed: 1/12/15. Available at: https://www.google.com/url?sa=t&rct=j&q=&esrc=s&source=web&cd=5&cad=rja&uact=8&ved=0CDkQFjAE&url=http%3A%2F%2Forigin.library.constantcontact.com%2Fdownload%2Fget%2Ffile%2F1102603838255-387%2FEarth%2BDay%2BLegislation%2BSummary%2B--%2BFINAL.pdf&ei=qlG0VOCNI4KZNry3gKgH&usg=AFQjCNHXt4dO-if5kAUtDpmdSonrCLxsIw&sig2=Q87LTUNqrweL6NUWBq719g&bvm=bv.83339334,d.eXY 82 Wilson, Ike. Fredrick News-Post. “Middletown Considers Street light Buyback Program.” (March 2014) Accessed: 1/12/15. Available at: http://m.fredericknewspost.com/news/politics_and_government/middletown-considers-street light-buy-back-program/article_7cd0f241-256b-5799-a8d8-611e747f9a81.html?mode=jqm 83 Town of Princess Anne. Request for Bids. (March 2014) Accessed: 1/12/15. Available at: http://www.townofprincessanne.com/pdf-2014/RFB-Retrofit-Feb-2014.pdf 84 Younes, Michael. Memo to Board of Managers. “Update on Village Street light Improvements.” (December 2013) Accessed: 1/12/15. Available at: http://www.chevychasevillagemd.gov/assets/PEPCO/LED20Streetpercent20Street lights.pdf 85 Maryland Department of Transportation. “State High Administration Begins Major US 50 Lighting Upgrades in Queen Anne’s County” Accessed: 1/12/15. Available at: http://www.marylandroads.com/pages/release.aspx?newsId=1483 86 Anderson, Jessica (et. al.). The Baltimore Sun. “City Converts Street lights to Energy-Saving LEDs.” (August 2012) Accessed: 1/12/15. Available at: http://articles.baltimoresun.com/2012-08-16/news/bs-md-city-street-lights-20120816_1_leds-new-lights-light-pollution
Maryland LED Street Light Projects and Prospective Projects
Municipality Date Details
Montgomery County 2015
Requiring county to contract with provider of LED lighting in 201581
Middletown March 2014 Proposed purchase of 7,000 street lights from
Potomac Edison and replace with LED82
Princess Anne March 2014 Request for bids to retrofit 48 street lights83
Chevy Chase December 2013 Participating in 22 light PEPCO pilot program84
State Highway Administration April 2013 Converting 18 miles of street lights on US 50.85
Baltimore August 2012 Converted 8,000 of 70,000 street lights, 80 percent
complete with first of three phases86

Northeast Energy Efficiency Partnerships 91 Hartwell Avenue Lexington, MA 02421 P: 781.860.9177 www.neep.org
42
Massachusetts Street Light Summary Number of Street Lights: 496,000 Percent Region’s Total Street Lights: 10 percent Annual Street light Energy Usage: 305 GWh Annual Potential Energy Savings: 152.5 GWh Annual Potential Energy-Cost Savings: $13.7 Million Annual Potential Maintenance Cost-Savings: $24.8 Million LED Conversion Installed Costs: $139.4 Million Annual Potential Lighting Controls Energy Savings: 13.7 GWh Annual Potential Lighting Controls Cost Savings: $1.2 Million Lighting Controls Installed Cost: $13.9 Million
F. Massachusetts
1. Tariff Status Unitil, which accounts for less than 1 percent of Massachusetts’ street light opportunities, is the only utility in the state that offers a utility-owned LED street light tariff. (Table A12) National Grid and Unitil both offer LED-specific tariffs for customer-owned equipment.
2. Legislative Background Massachusetts has legislatively enabled energy savings performance contracting,87 provided a
mechanism for bulk purchasing, 88 and legally requires a utility to sell utility-owned street lights to a municipality that is interested in purchasing.89 3. Notable Conversion Projects Massachusetts is unique in the region because a large number of municipalities have purchased their street lights and converted them to LEDs. At least 37 Massachusetts jurisdictions have converted their street lights to LED. (Table A13) According to the Massachusetts Department of Energy Resource, LED conversion in 41 of Massachusetts municipalities has saved more than 28,885,287 kWh (almost 29 GWh) over a period of three years, resulting in over $7.6 million in efficiency program incentives. A simple searched revealed documented conversions in at least 37 municipalities. (Table A13). Many of these conversions were accomplished through the efforts of two specific bodies, the Metropolitan Area Planning Council and Cape Light Compact.
87 Mass. Gen. Laws ch. 25A, §11C. 88 Mass. Gen. Laws ch. 25A, §11i. 89 Mass. Gen. Laws ch. 164, §34A

Northeast Energy Efficiency Partnerships 91 Hartwell Avenue Lexington, MA 02421 P: 781.860.9177 www.neep.org
43
4. Cape Light Compact Conversion Program A member of the US Department of Energy’s Solid State Street Lighting Consortium, Cape Light Compact is a non-profit energy efficiency program administrator located in Southeastern Massachusetts. Aside from administering energy efficiency programs, it also leverages community choice aggregation to increase the purchasing power of its customers and drive down electric rates. As of June 2014, Cape Light Compact had coordinated the conversion of approximately 14,000 street lights in 20 jurisdictions.90 Community choice power aggregation should be explored by other municipalities who join together to purchase street lights and negotiate maintenance or management contracts. 5. Metropolitan Area Planning Council Conversion Program The Metropolitan Area Planning Council is a non-profit regional planning council that aggregates communities seeking to purchase and/or convert their street lights to LEDs. They have coordinated the conversion or pending conversion of 58,000 lamps in 21 municipalities. Most notably, MAPC produces two guides which serve as an excellent resource for a community considering the purchase of their street lights,91 or the conversion of legacy lighting to LED.92
Table A12: Unitil HPS/LED Rate Comparison
Unitil (Massachusetts)93
HPS Rate LED Rate
Lumen Rating
Annual Rate Per Light
Lumen Rating Annual
Rate Per Light
3,300 $117.48 3,850 $101.64
9,500 $139.80 6,100 $120.48
20,000 $208.20 10,680 $150.96
50,000 $295.92 20,000 $243.24
140,000 $607.08
90 Cape Light Compact. LED Municipal Street light Project. Accessed: 1/12/15. Available at: http://www.capelightcompact.org/energy-efficiency/municipal/ 91 Metropolitan Area Planning Council. Buy Back Street lights from Utility. (September 2013) Accessed: 1/12/15. Available at: http://www.mapc.org/system/files/bids/Buy20Back%20Streetpercent20Backpercent20Street lights20from%20Utilitypercent20frompercent20Utility.pdf 92 Metropolitan Area Planning Council. Retrofit Street lights with LEDs. (September 2013) Accessed: 1/12/15. Available at: http://www.mapc.org/system/files/bids/Retrofit20Streetpercent20Street lights20with%20LEDspercent20withpercent20LEDs.pdf 93 Fitchburg Gas and Electric (Unitil) Schedule SR. Accessed: 1/12/15. Available at: http://unitil.com/sites/default/files/tariffs/E_dpu256_Summary_of_Rates_060114.pdf

Northeast Energy Efficiency Partnerships 91 Hartwell Avenue Lexington, MA 02421 P: 781.860.9177 www.neep.org
44
Table A13: Notable Conversion Projects (Massachusetts)
94City of Cambridge Electric Department Website. Accessed: 1/12/15. Available at: http://www.cambridgema.gov/electrical.aspx 95 Melanson, Alana. Sentinel Enterprise. “Fitchburg Considers LED Lights.” (March 2014) Accessed: 1/12/15. Available at: http://www.sentinelandenterprise.com/news/ci_25325595/fitchburg-considers-led-lights 96 Holyoke Gas and Electric 2013 Annual Report. Page 1. (December 2013) Accessed: 1/12/15. Available at: http://www.hged.com/about/mission-vision/annual-reports/hgeannreport2013WEB.pdf 97 Greenfield LED Street Lighting Project. Initiation to Bid. (October 2013) Accessed: 1/12/15. Available at: http://www.townofgreenfield.org/pages/greenfieldma_finance/purchasing/13-10IFBLEDStreet lightInstallation.pdf 98 Jones, Trevor. Wicked Local. “Newton Considering LED Lights Throughout the City.” (May 2013) Accessed: 8/23/14. Available at: http://www.wickedlocal.com/x438184798/Newton-considering-LED-lights-throughout-city#axzz2UhrQqnOZ
Massachusetts LED Street Light Projects and Prospective Projects
Municipality Date Details
Cape Light Compact Present
Has Coordinated the Conversion of 15,000 Street lights in 20 municipalities including:
Hyannis, Dennis, Harwich, Chilmark, Chatham, Orleans, Brewster, Wellfleet, Truro, Provincetown,
Mashpee, Cotuit, Edgartown, Oak Bluffs, Barnstable, Sandwich, W. Barnstable, Yarmouth, Falmouth, and
Bourne.
Conversions planned in: C-O-MM FD, Tisbury, and West Tisbury
Metropolitan Area Planning
Council (MAPC) Present
Has Coordinated the conversion or Pending Conversion of 58,000 Street lights in 21 municipalities including:
Arlington, Chelsea, Natick, Woburn, Somerville, Sharon, Winchester, Swampscott, Winthrop,
Gloucester, Hamilton, Melrose, Wenham, Beverly, Northampton, Salem, Lowell, Chicopee, Westfield,
Malden, Brockton
Cambridge Present Replacing all street, park, and decorative lights with LED Fixtures, plus wireless controls for street lights94
Fitchburg March 2014 Considering Conversion95
Holyoke December 2013 Completed Second Year of Three Phase Project to
Convert all Street lights to LED96
Greenfield May 2013 Invitation to Bid for Conversion of 416 Fixtures to
LED97
Newton May 2013 26 pilot lights converted with plan to convert all
8,40098

Northeast Energy Efficiency Partnerships 91 Hartwell Avenue Lexington, MA 02421 P: 781.860.9177 www.neep.org
45
New Hampshire Street Light Summary Number of Street Lights: 65,267 Percent Region’s Total Street Lights: 1% Annual Street light Energy Usage: 40.2 GWh Annual Potential Energy Savings: 20.1 GWh Annual Potential Energy-Cost Savings: $2 Million Annual Potential Maintenance Cost-Savings: $3.3 Million LED Conversion Installed Costs: $18.34 Million Annual Potential Lighting Controls Energy Savings: 1.8 GWh Annual Potential Lighting Controls Cost Savings: $180,709 Lighting Controls Installed Cost: $2 Million
G. New Hampshire
1. Tariff Status Accounting for approximately 70 percent of the street lights in New Hampshire, PSNH is the state’s largest utility. A new customer-contributed99 LED (EOL LED) tariff is currently pending publication, but a recent rate case regarding this tariff can provide some insight into the regulatory process.100 In August 2013, PSNH initially proposed an LED rate with a fixed monthly charge of $8.50 and a per
watt charge of $.0139. The of City of Manchester filed a request to intervene on December 4th, 2013 and after discussions between PSNH and the City, each agreed to a fixed rate of 3.30 and a per-watt charge of $0.05, representing an overall decrease in the EOL LED rate. The parties also agreed that, on a pilot basis, the City would assume the maintenance responsibilities which are normally an obligation of the PSNH under rate EOL. This example provides two takeaways: (1) Utilities may be skeptical of the low-maintenance and extended lifecycle claim of most LED manufacturers;101 and (2) The City of Manchester was acting in its own interest, but also bargained with the utility to provide the reduced rate to all LED EOL customers outside of the city. This is likely a recommended best practice when discussing tariff revisions with a utility.
99 Customer Contributed tariffs allow a municipality to choose their own lighting fixture, purchase that fixture, and provide it to the utility. The fixture becomes property of the utility, but the municipality receives their light free of any luminaire charge. 100 New Hampshire Public Utilities Commission. Docket No. DE 12-248. Petition to Amend Rate EOL to Include Light Emitting Diode Technology. Settlement Agreement. Accessed: 1/12/15. Available at: http://puc.nh.gov/Regulatory/Docketbk/2013/13-248/LETTERS-MEMOS-TARIFFS/13-248202014percent202014-07-0120PSNH%20SETTLEMENT%20AGREEMENTpercent20PSNHpercent20SETTLEMENTpercent20AGREEMENT.PDF 101 id. (Referencing a prior proposal which projected higher maintenance costs within the rate structure that the city of Manchester was able to circumvent by agreeing to take on maintenance responsibilities themselves)

Northeast Energy Efficiency Partnerships 91 Hartwell Avenue Lexington, MA 02421 P: 781.860.9177 www.neep.org
46
2. Legislative Background New Hampshire has legislatively enabled energy savings performance contracting for municipalities,102 but has no law or precedent requiring a utility to sell its street lights to a municipal purchaser. 3. Notable Conversion Projects A simple search found LED conversion projects pending or completed in Durham, Lebanon, Littleton, Manchester, and a bridge between New Hampshire and Maine. In the case of Lebanon, the Upper Valley Lake Sunapee Planning Commission is acting as project manager. 103 (Table A14) The New Hampshire Electric Cooperative no longer installs any lights except for LEDs.
Table A14: Notable Conversion Projects (New Hampshire)
102 N.H. Rev. Stat. Ann. § 33:3; N.H. Rev. Stat. Ann. § 33:7-e; See also, New Hampshire Town and City. Multi-Year Contracts: When and How Are They Authorized? (Discussing frequently asked questions regarding multi-year contracts, including performance contracts in New Hampshire.) (February 2009) Accessed: 8/23/14. Available at: http://www.nhmunicipal.org/TownAndCity/Article/274 103 Upper Valley Lake Sunapee Regional Planning Commission. Request for Proposals. Municipal Street light Redesign and Policy Development, Lebanon, NH. (January 2014). Accessed: 8/23/14. Available at: http://www.uvlsrpc.org/files/9913/9005/7304/Lebanon_Street light_RFP_Jan_2014.pdf 104 Lebanon City Council Agenda. “Request by Lebanon Energy Advisory Committee: Letter of Support for Street light Design Project.” Accessed: 1/12/15. Available at: http://www.lebcity.net/BComm/agendas/City20Councilpercent20Council/2014/March2019,%202014percent2019,percent202014/2014-03-19-Item-9.A-LEACSupportltrLEDStreet lightProject.pdf 105 Lumenistics Press Release. Accessed: 1/12/15. Available at: http://lumenistics.com/new-hampshire-bridge-project-promotes-energy-efficiency/ 106 Durham New Hampshire Energy Committee Webpage. “Street Light Program Saves Energy, Money.” (April 2012) Accessed: 1/12/15. Available at: http://www.ci.durham.nh.us/boc_energy/energy-savings-town AND https://www.sylvania.com/en-us/innovation/case-studies/Pages/durham-nh.aspx 107 Littleton Water and Light Meeting Minutes. (April 2012) Accessed: 1/12/15. Available at: http://www.littletonwaterandlight.org/minutes.php?rec=79&yr=2012
New Hampshire LED Street Light Projects and Prospective Projects
Municipality Date Details
Lebanon March 2014 Lebanon possible community for Liberty Utilities LED
street light pilot104
Portsmouth March 2013 Portsmouth Illuminate the Memorial Bridge between
New Hampshire and Maine.105
Durham April 2012 EECBG funds to convert 234 street lights to LED 106
Littleton April 2012 Littleton Water and Light Developing LED Tariff107
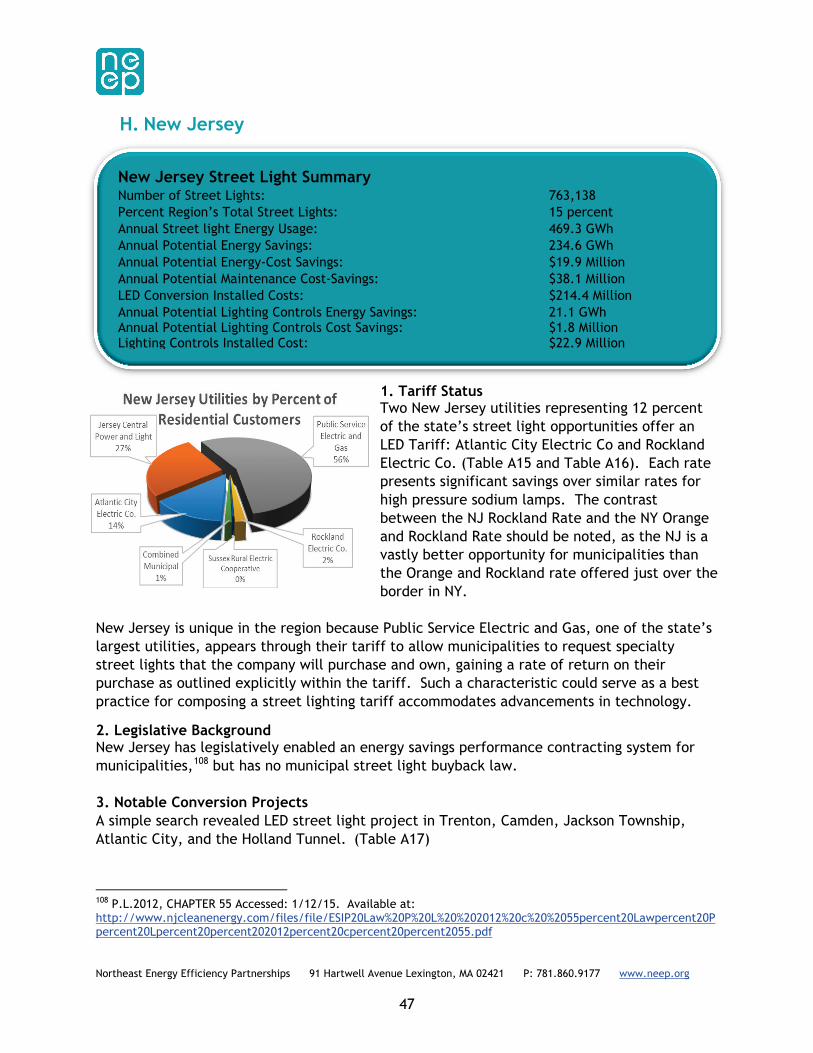
Northeast Energy Efficiency Partnerships 91 Hartwell Avenue Lexington, MA 02421 P: 781.860.9177 www.neep.org
47
New Jersey Street Light Summary Number of Street Lights: 763,138 Percent Region’s Total Street Lights: 15 percent Annual Street light Energy Usage: 469.3 GWh Annual Potential Energy Savings: 234.6 GWh Annual Potential Energy-Cost Savings: $19.9 Million Annual Potential Maintenance Cost-Savings: $38.1 Million LED Conversion Installed Costs: $214.4 Million Annual Potential Lighting Controls Energy Savings: 21.1 GWh Annual Potential Lighting Controls Cost Savings: $1.8 Million Lighting Controls Installed Cost: $22.9 Million
H. New Jersey
1. Tariff Status Two New Jersey utilities representing 12 percent of the state’s street light opportunities offer an LED Tariff: Atlantic City Electric Co and Rockland Electric Co. (Table A15 and Table A16). Each rate presents significant savings over similar rates for high pressure sodium lamps. The contrast between the NJ Rockland Rate and the NY Orange and Rockland Rate should be noted, as the NJ is a vastly better opportunity for municipalities than the Orange and Rockland rate offered just over the border in NY.
New Jersey is unique in the region because Public Service Electric and Gas, one of the state’s largest utilities, appears through their tariff to allow municipalities to request specialty street lights that the company will purchase and own, gaining a rate of return on their purchase as outlined explicitly within the tariff. Such a characteristic could serve as a best practice for composing a street lighting tariff accommodates advancements in technology.
2. Legislative Background New Jersey has legislatively enabled an energy savings performance contracting system for municipalities,108 but has no municipal street light buyback law. 3. Notable Conversion Projects A simple search revealed LED street light project in Trenton, Camden, Jackson Township, Atlantic City, and the Holland Tunnel. (Table A17)
108 P.L.2012, CHAPTER 55 Accessed: 1/12/15. Available at: http://www.njcleanenergy.com/files/file/ESIP20Law%20P%20L%20%202012%20c%20%2055percent20Lawpercent20Ppercent20Lpercent20percent202012percent20cpercent20percent2055.pdf

Northeast Energy Efficiency Partnerships 91 Hartwell Avenue Lexington, MA 02421 P: 781.860.9177 www.neep.org
48
Table A15: Atlantic City Electric HPS/LED Rate Comparison
Table A16: Rockland Electric HPS/LED Rate Comparison
109 Atlantic City Electric Tariff. Accessed: 1/12/15. Available at: http://www.atlanticcityelectric.com/uploadedFiles/wwwatlanticcityelectriccom/Content/Page_Content/My_Home/Choices_and_Rates/NJ20Tariff%20Section%20IV%20Effective%2006percent20Tariffpercent20Sectionpercent20IVpercent20Effectivepercent2006-01-2014.pdf 110 Rockland Electric Company Rate Schedule. Accessed: 1/12/15. Available at: http://www.oru.com/documents/tariffsandregulatorydocuments/nj/electrictariff/SC4.pdf
Atlantic City Electric (New Jersey)109
HPS Rate
LED Rate
Lumen Rating
Watts (Nominal)
Annual Rate Per Light
Lumen Rating
Watts (HPS Equivalent)
Annual Rate Per Light
3,600 50 $112.08 3,000 50 $105.72
5,500 70 $116.04 4,000 70 $104.40
8,500 100 $122.40 7,000 100 $106.08
14,000 150 $133.32 10,000 150 $124.20
24,750 250 $189.12 17,000 250 $147.00
45,000 400 $219.12
Rockland Electric Company (New Jersey)110 Note: Tariff denote Distribution Rate, not Luminaire Rate.
Does not include transmission charge.
HPS Rate
LED Rate
Lumen Rating
Watts (Nominal)
Input Watts
Annual Distribution
Charge Lumens
Watts (Actual)
Input Watts
Annual Distribution
Charge
5,800 70W 108 $101.16 5,890 70 74 $115.80
9,500 100W 142 $109.80 9,365 100 101 $142.32
16,000 150W 199 $133.68
27,500 250W 311 $170.64
46,000 400W 488 $276.60

Northeast Energy Efficiency Partnerships 91 Hartwell Avenue Lexington, MA 02421 P: 781.860.9177 www.neep.org
49
Table A17: Notable Conversion Projects (New Jersey)
111 Lemongello, Steve. Press of Atlantic City. “Atlantic City Streets to Get Brighter Under New Lighting Program.” (July 2014) Accessed: 1/12/15. Available at: http://www.pressofatlanticcity.com/news/breaking/atlantic-city-streets-to-get-brighter-under-new-lighting-program/article_7c8556e0-158f-11e4-9409-0019bb2963f4.html 112 Lamb, Rich. CBS New York. “Port Authority Replacing Holland Tunnel Lights with LEDs.” (January 2013) Accessed: 1/12/15. Available at: http://www.nj.com/news/index.ssf/2013/01/holland_tunnel_getting_environ.html 113 New Jersey Board of Public Utilities. Docket No. EO12030222. Accessed: 1/12/15. Available at: http://www.state.nj.us/bpu/pdf/boardorders/2012/20120618/6-18-12-2F.pdf 114US Department of Energy. Office of Weatherization and Intergovernmental Programs. EECBG/SEP Grantee TA Impact Statement. Accessed: 1/12/15. Available at: http://www1.eere.energy.gov/wip/solutioncenter/pdfs/eecbg_tap_impact_statement_trenton_nj_revised_0811.pdf 115 Bob Menendez Office’s Press Release. “Menendez Announces $750,000 for Energy Efficiency in Camden City Through Program He Created.” Accessed: 1/12/15. Available at: http://www.menendez.senate.gov/newsroom/press/menendez-announces-750-000-for-energy-efficiency-in-camden-city-through-program-he-created
New Jersey LED Street Light Projects and Prospective Projects
Municipality Date Details
Atlantic City December 2015 Plans to convert all 8,000 street lights to LED by 2016111
Port Authority
February 2013 Replacing 3,300 fluorescents in Holland Tunnel with LEDs112
Jackson Township
June 2012 Limited non-Tariff Street Lighting Service (LED SL) between
Jackson Township and Jersey Central Power and Light113
Trenton February 2011 Received EECBG funds for LED Retrofits114
Camden November 2009 Received $750,000 EECBG to fund LED conversion.115

Northeast Energy Efficiency Partnerships 91 Hartwell Avenue Lexington, MA 02421 P: 781.860.9177 www.neep.org
50
New York Street Light Summary Number of Street Lights: 1,386,000 Percent Region’s Total Street Lights: 27 percent Annual Street light Energy Usage: 970 GWh Annual Potential Energy Savings: 523.9 GWh Annual Potential Energy-Cost Savings: $36.8 Million Annual Potential Maintenance Cost-Savings: $69.3 Million LED Conversion Installed Costs: $389.5 Million Annual Potential Lighting Controls Energy Savings: 42.2 GWh Annual Potential Lighting Controls Cost Savings: $2.7 Million Lighting Controls Installed Cost: $41.6 Million
I. New York
1. Tariff Status New York is unique because it accounts for 27 percent percent of the region’s street light opportunities, but only a single investor owned utility in the state offers a utility-owned LED tariff. The Orange and Rockland tariff, which applies to roughly 2 percent of the state’s street lights, rates LED as more expensive than high pressure sodium. (Table A18)
2. Legislative Background New York has legislatively enabled energy savings performance contracting for municipalities,116 but has no statute requiring a utility to offer street light for purchase to a municipality. However, in 2009, the office of the NY State Comptroller issued a report noting that street light buybacks often cut municipal expenses and have a payback period of less than ten years.117 3. Notable Conversion Projects A simple search revealed LED street light Projects in New York, Brookhaven, Yonkers, Binghamton, and Islip. (Table A19)
116 N.Y. ENG. LAW § 9-103 117 Office of New York State Comptroller. “Street Lighting Cost Containment.” (2007) Accessed: 1/12/15. Available at: http://www.osc.state.ny.us/localgov/pubs/research/costsavingcontainment.pdf

Northeast Energy Efficiency Partnerships 91 Hartwell Avenue Lexington, MA 02421 P: 781.860.9177 www.neep.org
51
Table A18: Orange and Rockland HPS/LED Rate Comparison
Table A19: Notable Conversion Projects (New York)
118 Rockland Electric Company Rate Schedule. Accessed: 1/12/15. Available at: http://www.oru.com/documents/tariffsandregulatorydocuments/ny/electrictariff/electricSC04.pdf 119 New York City Press Release. “Mayor Bloomberg and Transportation Commissioner Sadik-Khan Announce All 250,000 Street Lights in New York City Will Be Replaced With Energy-Efficient LEDs by 2017, Reducing Energy Consumption and Cost.” (October 2013) Accessed: 1/12/15. Available at: http://www1.nyc.gov/office-of-the-mayor/news/343-13/mayor-bloomberg-transportation-commissioner-sadik-khan-all-250-000-street-lights-in#/0 120 City of Yonkers Press Release. (July 2013) Accessed: 1/12/15. Available at: http://www.yonkersny.gov/government/mayor-s-office/priorities-initiatives/initiatives-/led-street-light-replacement-project 121 City of Binghamton Press Release. “Mayor David Announces Latest Initiatives to Improve Operations and Save Tax Payer Dollars.” (May 2014) Accessed: 1/12/15. Available at: http://www.binghamton-ny.gov/mayor-david-announces-latest-initiatives-improve-operations-and-save-taxpayer-dollars 122 Sampson, Christine. Port Jefferson Patch. “Energy Efficient Lights Coming to Brookhaven Roads.” (May 2013) Accessed: 1/12/15. Available at: http://patch.com/new-york/portjefferson/energy-efficient-street-lights-coming-to-brookhaven-roads_85848576#.U_5LTPldVUU 123 Barton, Siobhan. Newsday. “Islip Installs Thousands of Energy Efficient Street Lights.” (May 2014) Accessed: 1/12/15. Available at: http://www.newsday.com/long-island/towns/islip-installs-thousands-of-energy-efficient-street-lights-1.8023700 124Gleberman, Monica. Times Beacon Record. “Smithtown Town Installs New LED Street lights.” Accessed: 1/12/15. Available at: http://www.northshoreoflongisland.com/Articles-i-2010-12-09-86352.112114-sub18241.112114-Smithtown-Town-installs-new-LED-street lights.html
Orange and Rockland (New York)118 Note: Tariff denotes Delivery Charge, not Luminaire Rate (likely includes transmission).
HPS Rate
LED Rate
Lumen Rating
Watts (Nominal)
Input Watts
Annual Distribution
Charge Lumens
Watts (Actual)
Input Watts
Annual Distribution
Charge
5,800 70W 108 $174.72 5,890 70 74 $232.68
9,500 100W 142 $190.68 9,365 100 101 $257.40
16,000 150W 199 $226.56
27,500 250W 311 $302.64
46,000 400W 488 $423.96
New York LED Street Light Projects and Prospective Projects
Municipality Date Details
New York December 2016 Converting 250,000 Street lights to LED by 2017119
Yonkers December 2014 Converting 12,000 Street lights to LED before 2015120
Binghamton May 2014 Requesting Proposals to Convert 7,000 Street lights to LED121
Brookhaven May 2013 Brookhaven Converting 2,500 street lights to LED122
Islip May 2013 Converted 15,000 street lights to LEDs.123 Smithtown December 2010 Converted 1000 street lights to LEDs124

Northeast Energy Efficiency Partnerships 91 Hartwell Avenue Lexington, MA 02421 P: 781.860.9177 www.neep.org
52
Pennsylvania Street Light Analysis Number of Street Lights: 1,079,109 Percent Region’s Total Street Lights: 21 percent Annual Street light Energy Usage: 658.1 GWh Annual Potential Energy Savings: 329 GWh Annual Potential Energy-Cost Savings: $23 Million Annual Potential Maintenance Cost-Savings: $53.5 Million LED Conversion Installed Costs: $300.7 Million Annual Potential Lighting Controls Energy Savings: 29.6 GWh Annual Potential Lighting Controls Cost Savings: $2.1 Million Lighting Controls Installed Cost: $32.1 Million
J. Pennsylvania
1. Tariff Status Two investor-owned utilities in Pennsylvania representing approximately 8 percent of the lighting stock offer a utility-owned LED tariff: Pike County Electric Co and Duquesne Light and Power. (Table A20 and Table A21) Metropolitan Energy and Penelec represent 20 percent of the lighting stock and offer a customer-owned tariff providing an LED rate.
2. Legislative Background Pennsylvania has legislatively enabled energy savings performance contracting for municipalities.125 3. Notable Conversion Projects A simple search found LED conversion projects under discussion, pending, or completed in 12 jurisdictions including: Pittsburgh, Bristol Township, West Nottingham, Horsham, Denver Borough, Allentown, Bethlehem, Tarentum, Perkasie, Abington, and Altoona. (Table A22) 4. Lessons from Richland, Pennsylvania The City of Richland’s experience with third-party street light contractors offers a lesson for similarly situated municipalities. In February 2009, city officials paid an energy consulting company $165,488 to facilitate the purchase of 160 street lights from their local utility and
125 73 PS § 1646.1-1646.8 Accessed: 1/12/15. Available at: http://www.portal.state.pa.us/portal/server.pt/community/guaranteed_energy_savings_manual_for_pennsylvania27spercent27s_government_organizations/9292
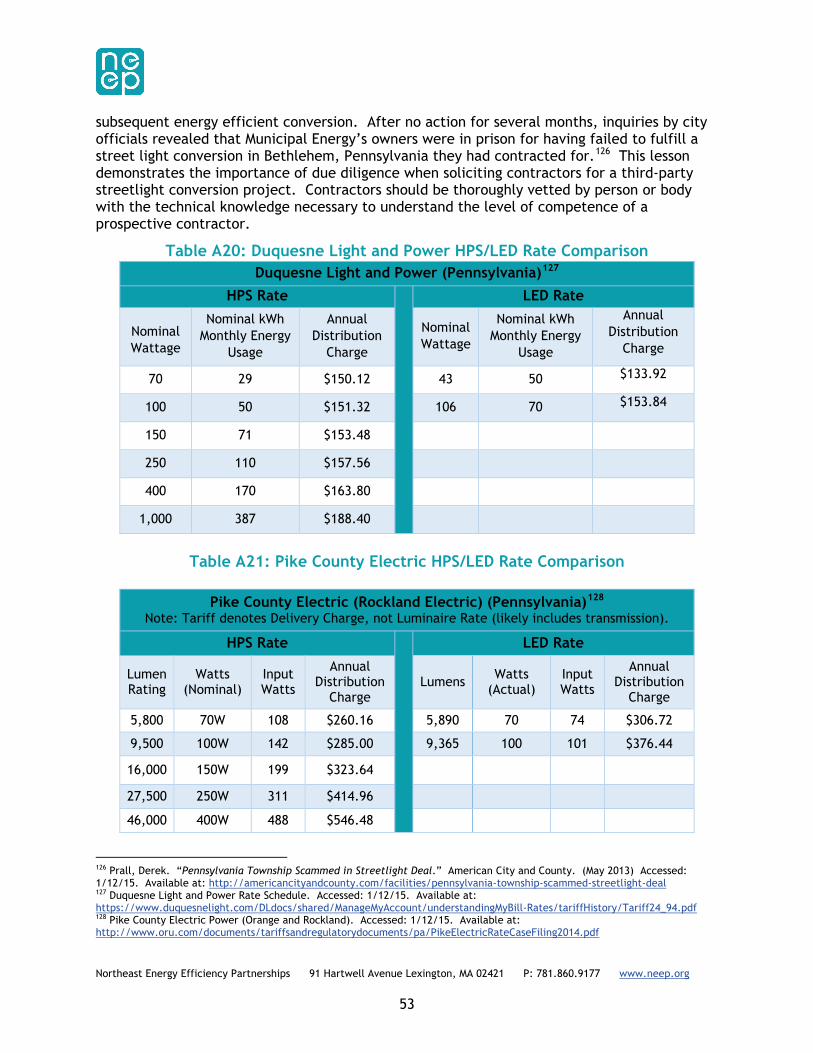
Northeast Energy Efficiency Partnerships 91 Hartwell Avenue Lexington, MA 02421 P: 781.860.9177 www.neep.org
53
subsequent energy efficient conversion. After no action for several months, inquiries by city officials revealed that Municipal Energy’s owners were in prison for having failed to fulfill a street light conversion in Bethlehem, Pennsylvania they had contracted for.126 This lesson demonstrates the importance of due diligence when soliciting contractors for a third-party streetlight conversion project. Contractors should be thoroughly vetted by person or body with the technical knowledge necessary to understand the level of competence of a prospective contractor.
Table A20: Duquesne Light and Power HPS/LED Rate Comparison
Table A21: Pike County Electric HPS/LED Rate Comparison
126 Prall, Derek. “Pennsylvania Township Scammed in Streetlight Deal.” American City and County. (May 2013) Accessed: 1/12/15. Available at: http://americancityandcounty.com/facilities/pennsylvania-township-scammed-streetlight-deal 127 Duquesne Light and Power Rate Schedule. Accessed: 1/12/15. Available at: https://www.duquesnelight.com/DLdocs/shared/ManageMyAccount/understandingMyBill-Rates/tariffHistory/Tariff24_94.pdf 128 Pike County Electric Power (Orange and Rockland). Accessed: 1/12/15. Available at: http://www.oru.com/documents/tariffsandregulatorydocuments/pa/PikeElectricRateCaseFiling2014.pdf
Duquesne Light and Power (Pennsylvania)127
HPS Rate
LED Rate
Nominal Wattage
Nominal kWh Monthly Energy
Usage
Annual Distribution
Charge
Nominal Wattage
Nominal kWh Monthly Energy
Usage
Annual Distribution
Charge
70 29 $150.12 43 50 $133.92
100 50 $151.32 106 70 $153.84
150 71 $153.48
250 110 $157.56
400 170 $163.80
1,000 387 $188.40
Pike County Electric (Rockland Electric) (Pennsylvania)128 Note: Tariff denotes Delivery Charge, not Luminaire Rate (likely includes transmission).
HPS Rate
LED Rate
Lumen Rating
Watts (Nominal)
Input Watts
Annual Distribution
Charge Lumens Watts
(Actual) Input Watts
Annual Distribution
Charge
5,800 70W 108 $260.16 5,890 70 74 $306.72
9,500 100W 142 $285.00 9,365 100 101 $376.44
16,000 150W 199 $323.64
27,500 250W 311 $414.96
46,000 400W 488 $546.48

Northeast Energy Efficiency Partnerships 91 Hartwell Avenue Lexington, MA 02421 P: 781.860.9177 www.neep.org
54
Table A22: Notable Conversion Projects (Pennsylvania)
129 Denver Express Newsletter. “Denver Borough Street light System Purchase and LED Conversion.” Spring 2014. Accessed: 1/12/15. Available at: http://www.denverboro.net/ArchiveCenter/ViewFile/Item/36 130 Bristol Township Press Release. “New LED Street lights Brighten Bristol Township. (March 2014) Accessed: 1/12/15. Available at: http://www.bristoltwp.com/uploads/PRESS20RELEASE%20LED%20STREETpercent20RELEASEpercent20LEDpercent20STREET LIGHTS203%2027%2014percent203percent2027percent2014.pdf 131 Lehigh Valley News. “Bethlehem Replaces 4,000 Street lights with LED Bulbs.” (October 2013) Accessed: 1/12/15. Available at: http://www.wfmz.com/news/news-regional-lehighvalley/Bethlehem-replaces-4-000-street-lights-with-LED-bulbs/22321802 132 Borough of Perkasie Fall Newsletter. (Fall 2012) Accessed: 1/12/15. Available at: http://www.perkasieborough.org/newsletter/2012_Edition_2_website.pdf 133 GE Lighting Press Release. “Pennsylvania Town Finds $40,000 Savings and Cash Flow Positive Financing in GE LED Street Lighting Solution.” (December 2012) Accessed: 1/12/15. Available at: http://pressroom.gelighting.com/news/pennsylvania-town-finds-40-000-savings-and-cash-flow-positive-financing-in-ge-led-street-lighting-solution#.U-0V4vldVUU 134 Remaking Cities Institute. LED Street Light Research Project. (September 2011) Accessed: 1/12/15. Available at: http://www.cmu.edu/rci/documents/led-updated-web-report.pdf 135 CBS News Detroit. “Relume Technologies Upgrades PA Town’s Street Lights to LEDs” (May 2011) Accessed: 1/12/15. Available at: http://detroit.cbslocal.com/2011/05/11/relume-technologies-upgrades-pa-towns-street-lights-to-leds/ 136 Power Online Press Release. “Obama Administration Delivers More Than $36M to Pennsylvania Communities for Energy Efficiency Projects.” (September 2009) Accessed: 1/12/15. Available at: http://www.poweronline.com/doc/obama-administration-delivers-more-than-36m-0001 137 Power Online Press Release. “Obama Administration Delivers More Than $36M to Pennsylvania Communities for Energy Efficiency Projects.” (September 2009) Accessed: 1/12/15. Available at: http://www.poweronline.com/doc/obama-administration-delivers-more-than-36m-0001 138 Atlantic Energy Concepts Press Release (Date Unknown) Accessed: 1/12/15. Available at: http://www.atlanticenergyconcepts.com/case-studies/Allentown-City-Hall.aspx 139 Horsham Township Website. Accessed: 1/12/15. Available at: http://www.horsham.org/pView.aspx?id=10625&catid=611
Pennsylvania LED Street Light Projects and Prospective Projects
Municipality Date Details
Denver Borough Fall 2014 Planning purchase of 344 street lights from PPL, LED conversion129
Bristol Township Fall 2014 Converting 4,259 street lights by fall 2014130
Bethlehem October 2013 Converted 4,000 street lights to LEDs131
Perkasie Fall 2012 Converting 1,000 150W HPS fixtures to 55W LED fixtures 132
Tarentum December 2012 Converted 430 Street lights to dimmable and programmable LED fixtures133
Pittsburgh September 2011 Converting 40,000 street light Inventory over 5-10 years134
West Nottingham May 2011 Converting lights through Relume Technologies135
Altoona 2009 Received a $200,000 grant to convert 179 lights to LED. 136
Abbington 2009 Received a $500,000 grant for LED conversion137
Allentown Unknown Converted walkway lighting outside city hall 138
Horsham Unknown Replacing lamps on an as-needed basis with LED139
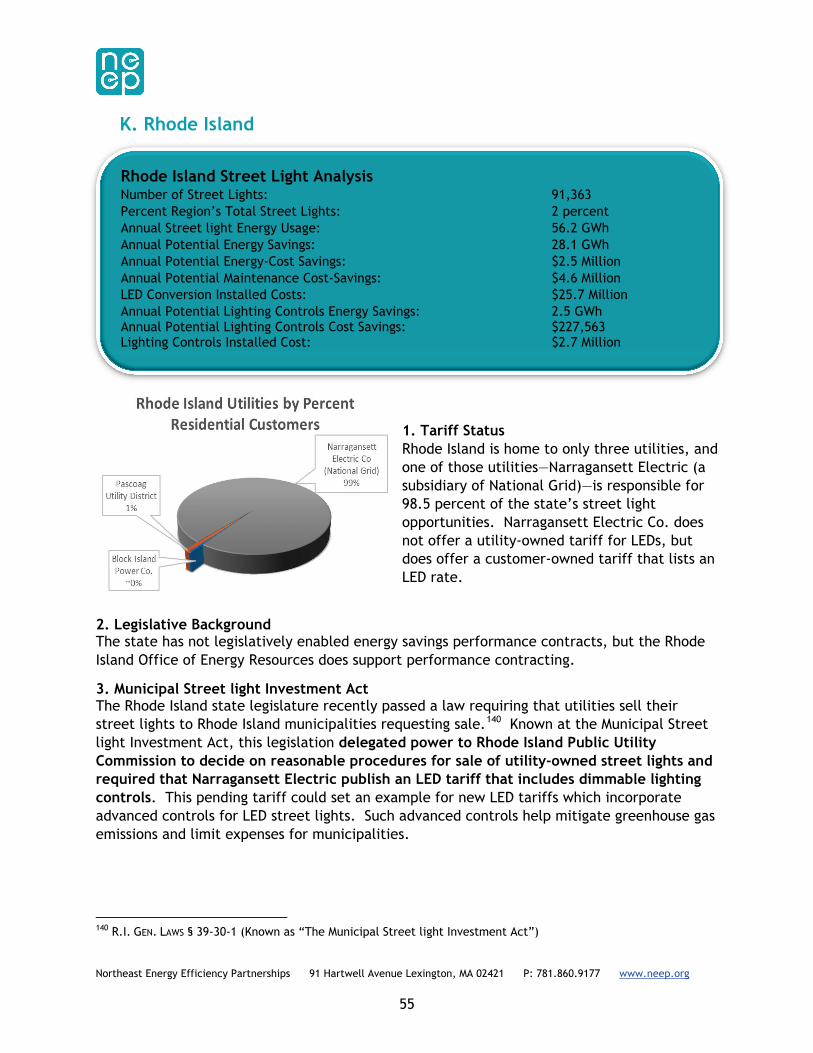
Northeast Energy Efficiency Partnerships 91 Hartwell Avenue Lexington, MA 02421 P: 781.860.9177 www.neep.org
55
Rhode Island Street Light Analysis Number of Street Lights: 91,363 Percent Region’s Total Street Lights: 2 percent Annual Street light Energy Usage: 56.2 GWh Annual Potential Energy Savings: 28.1 GWh Annual Potential Energy-Cost Savings: $2.5 Million Annual Potential Maintenance Cost-Savings: $4.6 Million LED Conversion Installed Costs: $25.7 Million Annual Potential Lighting Controls Energy Savings: 2.5 GWh Annual Potential Lighting Controls Cost Savings: $227,563 Lighting Controls Installed Cost: $2.7 Million
K. Rhode Island
1. Tariff Status Rhode Island is home to only three utilities, and one of those utilities—Narragansett Electric (a subsidiary of National Grid)—is responsible for 98.5 percent of the state’s street light opportunities. Narragansett Electric Co. does not offer a utility-owned tariff for LEDs, but does offer a customer-owned tariff that lists an LED rate.
2. Legislative Background The state has not legislatively enabled energy savings performance contracts, but the Rhode Island Office of Energy Resources does support performance contracting.
3. Municipal Street light Investment Act The Rhode Island state legislature recently passed a law requiring that utilities sell their street lights to Rhode Island municipalities requesting sale.140 Known at the Municipal Street light Investment Act, this legislation delegated power to Rhode Island Public Utility Commission to decide on reasonable procedures for sale of utility-owned street lights and required that Narragansett Electric publish an LED tariff that includes dimmable lighting controls. This pending tariff could set an example for new LED tariffs which incorporate advanced controls for LED street lights. Such advanced controls help mitigate greenhouse gas emissions and limit expenses for municipalities.
140 R.I. GEN. LAWS § 39-30-1 (Known as “The Municipal Street light Investment Act”)

Northeast Energy Efficiency Partnerships 91 Hartwell Avenue Lexington, MA 02421 P: 781.860.9177 www.neep.org
56
3. Notable Conversion Projects A simple search found LED conversion projects under discussion, pending, or completed in Pascoagville, Burilloville, and Harrisville. (Table A23)
Table A23: Notable Conversion Projects (Rhode Island)
141 Kirkwood, Michael R. Pascoag Utility District Letter RE: Proposed Plan for Allocation and Distribution of Regional greenhouse Gas Initiative Auction Proceeds. (July 2014) Accessed: 1/12/15. Available at: http://www.energy.ri.gov/documents/rggi/201420Plan%20Itemspercent20Planpercent20Items/PUD20-%20RGGI%20Allocation%20letter%202014percent20-percent20RGGIpercent20Allocationpercent20letterpercent202014_3.pdf 142Alban Inspections Website. “Rhode Island Community Converting to Energy Efficient Street Lamps.” (November 2013) Accessed: 1/12/15. Available at: http://www.albaninspect.com/news/home-inspection/rhode-island-community-converting-to-energy-efficient-street-lamps/
Rhode Island LED Street Light Projects and Prospective Projects
Municipality Date Details
Pascoag/Harrisville July 2014 Currently implementing a “very aggressive” street-lighting retrofit program141
Burilloville November 2013 Converted 56 of 1,147 street lights to LED142

Northeast Energy Efficiency Partnerships 91 Hartwell Avenue Lexington, MA 02421 P: 781.860.9177 www.neep.org
57
Vermont Street Light Analysis Number of Street Lights: 31,036 Percent Region’s Total Street Lights: 1% Annual Street light Energy Usage: 19 GWh Annual Potential Energy Savings: 9.5 GWh Annual Potential Energy-Cost Savings: $1 Million Annual Potential Maintenance Cost-Savings: $1.6 Million LED Conversion Installed Costs: $8.7 Million Annual Potential Lighting Controls Energy Savings: 859 MWh Annual Potential Lighting Controls Cost Savings: $85,894 Lighting Controls Installed Cost: $931,108
L. Vermont
1. Tariff Status Vermont is unique in the region due to a 2011 law requiring all investor-owned utilities offer a utility-owned LED street light tariff.143 Further, a partnership between Efficiency Vermont (EVT), the state’s largest electric utilities, and several municipalities aims to convert more than 18,000144 of Vermont’s investor owned street lights. EVT estimates that as of January 2015, 11,800 Vermont street lights have been converted to LED.145 (Table A24
and Table A25)
2. Legislative Background Vermont has not legislatively enabled energy performance contracting outside the context of a “district,”146 but appears to have municipalities who have engaged in city-wide energy performance contracting.147 A 2009 bill requiring the sale of street lights to interested municipalities did not pass the legislature; 148 however there is evidence of a Central Vermont Public Service (CVPS) Memorandum of Understanding (MOU) that sets clear guidelines for municipal street light purchases.149
143 Vermont Energy Act of 2011. Accessed: 1/12/15. Available at: http://www.leg.state.vt.us/docs/2012/acts/act047.pdf 144 DeMarco, Peter. The Boston Globe. “Future Seems Bright for LED Lights.” (December 2013) Accessed: 1/12/15. Available at: http://www.bostonglobe.com/metro/regionals/north/2013/12/22/who-taught-you-drive-shedding-some-new-light-street-signs/BRbQaLcTByChA4Uj10edEO/story.html 145 NEEP staff Communications with Efficiency Vermont on 1/5/15. Estimates do not include conversions within the Burlington Electric Department’s geographic territory. 146 16 V.S.A. §3448f. 147 Efficiency Vermont. “Preliminary Review of Energy Savings Measures for the Town of Brattleboro and Brattleboro Public School Facilities.” (July 2004). Accessed: 1/12/15. Available at: http://www.sustainablecitiesinstitute.org/Documents/SCI/Case_Study/Case20Study%20-%20Performance%20Contracting%20Brattleboropercent20Studypercent20-percent20Performancepercent20Contractingpercent20Brattleboro.pdf 148 Vermont House Bill 273. “An Act Relating to Municipal Acquisition of Street Lights.” Accessed: 1/12/15. Available at: http://legiscan.com/VT/text/H0273/id/483388/Vermont-2009-H0273-Introduced.pdf 149 Vermont Public Service Board. Docket No. 7085. Petition of Town of [Woodstock et. al.] Requesting an Investigation into Terms and Conditions offered by Central Vermont Public Service. Accessed: 1/12/15. Available at: http://www.state.vt.us/psb/orders/2008/files/7085finalorderonmou.pdf

Northeast Energy Efficiency Partnerships 91 Hartwell Avenue Lexington, MA 02421 P: 781.860.9177 www.neep.org
58
3. Notable Conversion Projects A simple search revealed several municipalities with current or pending LED conversion projects including Colchester, Waterbury, Montpelier, Burlington, Hartford, Thetford, Bradford, Sharon, Cabot, Bennington, and Northfield. (Table A26)
Table A24: Green Mountain Power HPS/LED Rate Comparison Green Mountain Power (Vermont)150
Note: Includes Luminaire, Distribution, Generation, and Transmission Charges
HPS Rate
LED Rate
Nominal Wattage
Lumens Annual
Charge Per Light
LEDs Lumens Input Watts Annual Charge
Per Light
70 5,200 $173.16 20 2,530 37 $127.20
100 8,500 $191.04 20 3,162 50 $130.92
150 14,400 $219.12 40 5,050 67 $158.88
200 19,800 $253.92 40 6,312 92 $166.08
250 24,700 $279.72
Table A25: Central Vermont Public Service HPS/LED Rate Comparison Central Vermont Public Service (Legacy Customers- now GMP) (Vermont)151
Note: Includes Luminaire, Distribution, Generation, and Transmission Charges
HPS Rate
LED Rate
Nominal Wattage
Approximate Initial
Lumens
Annual Charge
Per Light LEDs
Approximate Initial
Lumens Input Watts
Annual Charge Per
Light
70 5,800 $198.20 20 2,000 39 $147.46
150 16,000 $254.40 30 3,100 55 $166.44
250 30,000 $375.59 40 3,500 70 $184.69
400 50,000 $517.57 50 4,300 95 $221.56
60 5,100 113 $237.98
80 8,100 140 $287.26
150 Green Mountain Power Outdoor Lighting Rate 18. Accessed: 9/13/14. Available at: http://www.greenmountainpower.com/upload/photos/308Outdoor_Lighting_new_10-1-14.pdf 151 Green Mountain Power Rate Schedule for former Central Vermont Public Service Customers. Accessed: 9/13/14. Available at: http://www.greenmountainpower.com/upload/photos/307RATE_6_Municipal_Street_and_Highway_Lighting_10-1-14.pdf

Northeast Energy Efficiency Partnerships 91 Hartwell Avenue Lexington, MA 02421 P: 781.860.9177 www.neep.org
59
TableA26: Notable Conversion Projects (Vermont)
152 Northfield Celebrates National Night Out. (August 2014) Accessed: 8/23/14. Available at: http://www.northfield-vt.gov/text/Current_Notices/National_Night_Out_2014.pdf 153 Report of the Street lighting Committee to the Burlington Electric Commission. (July 2014) Accessed: 1/12/15. Available at: http://www.burlingtonvt.gov/sites/default/files/Agendas/Item204%20-%20Newly%20Adopted%20Lighting%20Policypercent204percent20-percent20Newlypercent20Adoptedpercent20Lightingpercent20Policy.pdf 154 Robinson, Susan. Vermont Guide. “Bennington Racks Up Accolades” (October 2013) Accessed: 1/12/15. Available at: http://vermontnews-guide.com/bennington-racks-up-accolades/ 155 Letter from Sharon Energy Committee to Business Owners/Residents. (May 2013) Accessed: 1/12/15. Available at: http://www.sharonvt.net/government/documents/doc_download/215-street light-study-details.html (Also mentioning Bradford and Sharon as having finished conversions) 156 Bernadino, Alyssa. The Cabot Chronicle. ”A Bright Idea.” (February 2012) Accessed: 8/23/14. Available at: http://www.cabotchronicle.org/index.php?option=com_content&view=article&id=2093Aapercent3Aa-bright-idea&Itemid=7 157 Rancis, Eric. Vermont Standard. “Quechee in Line for LED Lighting.” (December 2011) Accessed: 1/12/15. Available at: http://www.thevermontstandard.com/2011/12/quechee-in-line-for-led-lighting/ 158 Sutkoski, Matt. Burlington Free Press. “Light Future: Vermont Towns Turning to LED Lights.” (February 2011) Accessed: 1/12/15. Available at: http://archive.burlingtonfreepress.com/article/20110220/LIVING09/102200304/Light-Future-Vermont-towns-turning-LED-lights 159 Town of Colchester Public Works Department Website. Accessed: 1/12/15. Available at: http://colchestervt.gov/PublicWorks/Highway/Street lights.shtml and http://colchestervt.gov/Manager/AroundTown/23FinalLightsParksBallotItems110131.pdf 160 Middlebury Energy Committee Website. (Date Unknown) Accessed: 1/12/15. Available at: http://www.middleburyenergy.org/efficiency_first.php 161 Burgess, Nathan. “Big Construction Projects Get Started.” (June 2011) Accessed: 1/12/15. Available at: http://www.stowetoday.com/stowe_reporter/news/article_de264076-a323-11e0-a697-001cc4c002e0.html
Vermont LED Street Light Projects and Prospective Projects
Municipality Date Details
Northfield August 2014 Converting all lights to LED152
Burlington July 2014 LED mentioned within Street Lighting Policy 153
Bennington October 2013 Converted more than 500 street lights154
Thetford Summer 2013 Converted Street lights155
Bradford Summer 2013 Converted Street lights
Sharon Summer 2013 Considering Conversion
Cabot February 2012 Converted all street lights to LED156
Hartford/Queechee/White River
2011 All Fixtures Converted157
Waterbury 2011 Converted several Streets to LED158
Colchester Unknown Phased LED conversion of 780 street lights159
Middlebury Unknown Converted Street lights to LEDs160
Johnson Unknown Converted Street lights to LEDs161

Northeast Energy Efficiency Partnerships 91 Hartwell Avenue Lexington, MA 02421 P: 781.860.9177 www.neep.org
60
APPENDIX B: Methodologies Detailed
Each state’s opportunity analysis contains information on approximate number of street lights, energy savings opportunities, tariffs, legislation, street light purchases, and ongoing efforts. Methodologies used to reach conclusions are discussed in detail below. In general, the approximate number of streetlights was determined through use of data from New York, Massachusetts, Rhode Island, and Vermont. Analysis of this data found that the number of streetlights correlates strongly with population of a given municipality or state, but is also affected also by population density. Cities with populations over 500,000 were outliers within a regression analysis measuring population against street light quantities, so they were extracted from the state by state analysis and considered independently. States with low population density (Vermont, New Hampshire, and Maine) were also separated out from the rest of the region and considered separately.162 Average wattages and percentage savings were calculated according to the average for the entire inventory, as described below. Approximate Number of Street Lights Street light inventories were obtained for: (1) Nine municipalities in New York;163 (2) all National Grid-served municipalities in the state of Rhode Island;164 and (3) 21 municipalities in Massachusetts.165 Also, previous street light counts from Massachusetts, New York, and Rhode Island were utilized in calculation assumptions, including to check for a tolerable margin of error in other states. Population as Street Light Quantity Indicator Supplementing these inventories with data obtained from the 2010 census, regression analysis identified a strong correlation between number of street lights and population. (Table A27) As a general rule of thumb, there are approximately 8.7 street lights for every 100 persons in a municipal population.
162 This strategy is consistent with a 2014 MSSLC survey which found, “[G]reater variability in towns with populations of less than a few thousand, suggesting that other variables begin to markedly influence the number of luminaires below some threshold.” While this threshold likely affects many municipalities, it does not likely affect the majority of street lighting counts as weighted by population. 163 New York municipalities included Rochester, Huntington, Yonkers, Albany, Mt. Vernon, Union, Vestal, Oneonta, and New York City. 164 Rhode Island municipalities included Barrington, Bristol, Burrillville, Central Falls, Charlestown, Coventry, Cranston, Cumberland, East Greenwich, East Providence, Exeter, Foster, Glocester, Hopkinton, Jamestown, Johnston, Lincoln, Lincoln, Little Compton, Middletown, Narragansett, Newport, North Kingstown, North Providence, North Smithfield, Pawtucket, Portsmouth, Providence, Richmond, Scituate, Smithfield, South Kingstown, Tiverton, Warren, Warwick, West Greenwich, West Warwick, Westerly, and Woonsocket. 165 Massachusetts municipalities included Arlington, Chelsea, Natick, Woburn, Somerville, Sharon, Winchester, Swampscott, Winthrop, Gloucester, Hamilton, Melrose, Wenham, Beverly, Northampton, Salem, Lowell, Chicopee, Westfield, Malden, and Brockton.

Northeast Energy Efficiency Partnerships 91 Hartwell Avenue Lexington, MA 02421 P: 781.860.9177 www.neep.org
61
Table A27: Existing Street light Quantities vs. Population
Cities having populations greater than 500,000 within each state were then identified and an approximate number of street lights determined according to a publicly accessible inventory approximations, often found on a city’s department of public works’ website.166 These approximate inventories were then used to run an analysis of street light inventories in cities with populations greater than 500,000. A strong correlation was found and extrapolated out for cities having populations of greater than 500,000, but without a publicly listed street light inventory.167 (Table A28) Estimated inventories for cities having a population greater than 500,000 were then combined with estimated inventories for each state according to population residing in jurisdictions of 500,000 people or less to arrive at statewide street light totals.
Table A28: Existing Street light Quantities vs. Population (500,000+)
166 These cities included New York, Los Angeles, Philadelphia, Washington D.C., Boston, and Baltimore. 167 New York City, the largest city in the country, was identified as an outlier with street lighting characteristics unique to that jurisdiction, and therefore excluded from this analysis.
y = 0.0868x R² = 0.9257
0
5000
10000
15000
20000
0 50000 100000 150000 200000 250000
Lum
inai
res
Population
Street Lights by Population (RI/NY)

Northeast Energy Efficiency Partnerships 91 Hartwell Avenue Lexington, MA 02421 P: 781.860.9177 www.neep.org
62
Street Light Opportunities per Utility The number of residential customers a utility serves can be used to calculate its approximate number of street lights served. To reach this conclusion, a combination of EIA data containing residential customers per utility and census data containing populations for each municipality were analyzed. EIA data on almost all municipal utilities in the United States was sorted to determine which municipal utilities shared an approximate boundary with only their namesake municipality.168 A regression analysis comparing residential customers per municipal utility against population for each municipality proved a strong correlation. (Table A29) Therefore, since number of residential customers strongly correlates with population, and population correlates strongly with number of street lights, one can assume that a state’s percentage of residential customers by utility accurately represents each utility’s percentage share of a state’s total street lights.
Table A29: Expanded Data Set- Residential Customers v. Population
Savings Opportunities Savings Opportunities were identified by using the dataset outlined above to determine an approximate average street light input wattage, which was then extrapolated out across estimated street light inventories. Conservative estimates were utilized in determining luminaire type, wattage, and energy savings. Since our data set shows that the vast majority of existing lamps are high pressure sodium (94 percent in Rhode Island communities, 89 percent in New York communities, and 72 percent in Massachusetts communities), this report conservatively assumes all existing luminaries to be high pressure sodium. Of the three major existing legacy technologies—High Pressure Sodium, Metal Halide, and Mercury Vapor—High Pressure Sodium is, in many cases the most efficient of the three, and therefore will provide the most conservative energy savings assumptions when compared with a LED luminaire. Approximate nominal wattage was calculated according to a simple average of all 168 Municipal Utilities often reach beyond the geographic area of a single municipality and incorporate customers in surrounding jurisdictions. The vast majority of utilities who offer such services make note of it on their website.

Northeast Energy Efficiency Partnerships 91 Hartwell Avenue Lexington, MA 02421 P: 781.860.9177 www.neep.org
63
luminaries within the available data set, and came to 140 Watts. This number was then assigned a conservative input wattage of 170 Watts. To determine annual energy usage per luminaire, the input wattage was multiplied by an approximate annual hourly run-time of 4100 hours, then divided by 1,000 to find annual kWh per luminaire. The resulting estimate was then multiplied by the number of luminaries in each state to determine current street lighting energy usage estimates per state. Energy savings opportunities per state were conservatively estimated at 50percent of total input wattage169 and maintenance savings were estimated at $50/luminaire annually.170 Advanced controls were assumed to only be available for roughly 30percent of street lights due to aesthetic and practice barriers. Savings were conservatively estimated at 30percent of after-conversion consumption. Tariff Status Tariff status was analyzed according to currently published tariffs, either as identified on a utility’s website, or as listed according to a state public utility commission. In states where utility restructuring has occurred, standard offers were approximated according to those utilities offering LED tariffs, and extrapolated on a statewide basis to determine energy cost-savings resulting from a conversion. Legislation, Completed or Pending Conversions, and Ongoing Efforts This paper lists relevant legislation, completed or pending street light LED conversion projects, and ongoing efforts within each state. This information was extracted from a multitude of sources, including simple web searches, interview of relevant industry actors, newspaper articles, and docket searches. The listing of completed or pending conversions in each state recognizes that not all LED street light conversions are documented in the public record. Individual Utility-Owned LED Tariffs
Individual utility tariffs values were gathered, unless otherwise noted, to include only: (1) Lights being served from overhead wires; (2) Lights mounted on existing poles with existing brackets/arms; and (4) cobra head or cutoff HPS lights depending upon each utility’s offerings. Whenever possible, rates in the utility tariff charts cover only luminaire charges, not distribution, transmission, energy, or other charges. Those that include distribution or transmission charges do so for both HPS and LED rates. This data should be used to compare across lighting types, not across utilities, as tariff components vary from utility to utility and are not displayed uniformly here.
169 Supra, at note 11. (Citing a 63 percent overall energy savings for Los Angeles’ LED Street light Project) 170 US Department of Energy. Gateway Demonstrations: Demonstration Assessment of LED Post Top Lighting in New York City. Page 3.1. (September 2012) (Citing maintenance cost-savings between $46 and $111) Accessed: 1/12/15. Available at: http://apps1.eere.energy.gov/buildings/publications/pdfs/ssl/2012_gateway_central-park.pdf


