Gold Loans ‘Lending with comfort’ June 21, 2011 Muthoot Finance – BUY CMP: Rs154 Target: Rs202 Manappuram – BUY CMP: Rs57 Target: Rs73 Research Analyst Rajiv Mehta, CFA [email protected]India - a huge gold loan market India is one of the largest markets for gold accounting for ~10% (18,000- 20,000 tons) of the global gold stock. Rural India is estimated to hold around 65% of this. Shaped by sentimental and structural factors, country’s demand for gold has been buoyant defying the phenomenal rally in price. It is estimated that ~10% of country’s gold stock has been pledged, of which, ~75% is in the unorganized market (money lenders, pawn brokers, etc) and balance ~25% in organized market (specialized NBFCs, other NBFCs, commercial/cooperative banks, etc). Organized market growing at robust pace As per IMaCS Industry Report (2010 update), the organized gold loan market in India stood at Rs350-400bn at end-FY10 having witnessed a robust 40% CAGR over FY02-10. We estimate the market to have crossed Rs550bn by end-FY11 as specialized NBFCs Muthoot Finance and Manappuram combine have grown their book by Rs130bn+ during the year. Share of the organized pie has been increasing rapidly due to significantly lower rate of interest charged, higher LTV offered and perceived safety of the ornaments. With penetration still negligible at 1- 1.5%, the organized market would continue to witness strong growth. Specialized NBFCs better placed than banks Amongst organized players, specialized gold loan NBFCs have witnessed exceptional growth driven by management aggression/strength, robust branch expansion, belligerent marketing spend and ability to raise capital timely. Given the customers preference for them over banks due to critical factors like low levels of documentation, quick disbursal of loans, higher LTV offered, flexibility in loan terms, etc, specialized NBFCs command premium yields and enjoy superior profitability. Therefore, they represent a much better medium to ride the gold loan growth story. Initiate coverage on Muthoot and Manappuram with BUY rating We initiate coverage on Muthoot Finance and Manappuram with a BUY rating. Both the companies have witnessed 100%+ CAGR in their gross gold loan book over FY09-11. Notwithstanding the substantial business investments made, they have improved their profitability profile. Their dream run is expected to normalize though on account of higher base, intensifying competition in the key Southern region, recent adverse regulation with respect to assignments and steep increase in funding cost. Nevertheless, their earnings CAGR is estimated to be strong in the range of 35-50% thereby making current valuations (1.6-1.7x FY13 P/BV) attractive. Key risk factors would be unfavorable regulatory changes and material correction in gold prices. Financial summary Y/e 31 Mar Muthoot Finance Manappuram (Rs m) FY12E FY13E FY12E FY13E Total operating income 18,307 25,029 13,325 17,755 Yoy growth (%) 42.7 36.7 56.8 33.2 Operating profit (pre-provisions) 11,220 15,573 7,168 9,687 Net profit 6,891 9,576 4,498 6,106 yoy growth (%) 39.4 39.0 59.1 35.7 EPS (Rs) 18.5 25.8 5.4 7.3 BVPS (Rs) 75.2 96.3 27.3 33.2 P/E (x) 8.3 6.0 10.6 7.8 P/BV (x) 2.0 1.6 2.1 1.7 ROE (%) 33.4 30.1 21.4 24.2 ROA (%) 3.4 3.6 4.3 4.2 CAR (%) 17.4 16.6 21.7 19.0 Source: Company, India Infoline Research Largest gold financing company in the country with 20%+ market share AUM growth to moderate but remain strong on higher base NIM to decline on steep increase in funding cost; yield to be relatively resilient Earnings CAGR to remain brisk at 39% over FY11-13E RoA to marginally come-off; RoE to normalize Fastest growing gold loan company; 8x AUM growth over FY09-11 New branches to drive 45% AUM CAGR over FY11-13E NIM to contract sharply due to decline in yield and increase in funding cost Earnings CAGR to remain robust at 47% over FY11-13E RoA to trend down while RoE to improve
India - a huge gold loan market India is one of the largest markets for gold accounting for ~10% (18,000-20,000 tons) of the global gold stock. Rural India is estimated to hold around 65% of this. Shaped by sentimental and structural factors, country’s demand for gold has been buoyant defying the phenomenal rally in price. It is estimated that ~10% of country’s gold stock has been pledged, of which, ~75% is in the unorganized market (money lenders, pawn brokers, etc) and balance ~25% in organized market (specialized NBFCs, other NBFCs, commercial/cooperative banks, etc).
Organized market growing at robust pace As per IMaCS Industry Report (2010 update), the organized gold loan market in India stood at Rs350-400bn at end-FY10 having witnessed a robust 40% CAGR over FY02-10. We estimate the market to have crossed Rs550bn by end-FY11 as specialized NBFCs Muthoot Finance and Manappuram combine have grown their book by Rs130bn+ during the year. Share of the organized pie has been increasing rapidly due to significantly lower rate of interest charged, higher LTV offered and perceived safety of the ornaments. With penetration still negligible at 1-1.5%, the organized market would continue to witness strong growth.
Specialized NBFCs better placed than banks Amongst organized players, specialized gold loan NBFCs have witnessed exceptional growth driven by management aggression/strength, robust branch expansion, belligerent marketing spend and ability to raise capital timely. Given the customers preference for them over banks due to critical factors like low levels of documentation, quick disbursal of loans, higher LTV offered, flexibility in loan terms, etc, specialized NBFCs command premium yields and enjoy superior profitability. Therefore, they represent a much better medium to ride the gold loan growth story. Initiate coverage on Muthoot and Manappuram with BUY rating We initiate coverage on Muthoot Finance and Manappuram with a BUY rating. Both the companies have witnessed 100%+ CAGR in their gross gold loan book over FY09-11. Notwithstanding the substantial business investments made, they have improved their profitability profile. Their dream run is expected to normalize though on account of higher base, intensifying competition in the key Southern region, recent adverse regulation with respect to assignments and steep increase in funding cost. Nevertheless, their earnings CAGR is estimated to be strong in the range of 35-50% thereby making current valuations (1.6-1.7x FY13 P/BV) attractive. Key risk factors would be unfavorable regulatory changes and material correction in gold prices. Financial summary
Largest gold financing company in the country with 20%+ market share
AUM growth to moderate but remain strong on higher base
NIM to decline on steep increase in funding cost; yield to be relatively resilient
Earnings CAGR to remain brisk at 39% over FY11-13E
RoA to marginally come-off; RoE to normalize
Fastest growing gold loan company; 8x AUM growth over FY09-11
New branches to drive 45% AUM CAGR over FY11-13E
NIM to contract sharply due to decline in yield and increase in funding cost
Earnings CAGR to remain robust at 47% over FY11-13E
RoA to trend down while RoE to improve
Gold Loans
Sector Report 2
India is one of the largest markets for gold accounting for ~10% of the global gold stock Inelasticity in gold demand shaped by multiple structural factors Rural India is estimated to hold around 65% of total gold stock ~10% of the country’s gold stock has been pledged for loans Of this ~75% is with the unorganized players such as money lenders, pawn brokers, etc Unorganized players charge exorbitant interest rates and offer lower LTV Estimated more than 1lac money lenders across the country; 40-50% of them in Southern India The share of organized players (NBFCs and Banks) has been increasing rapidly
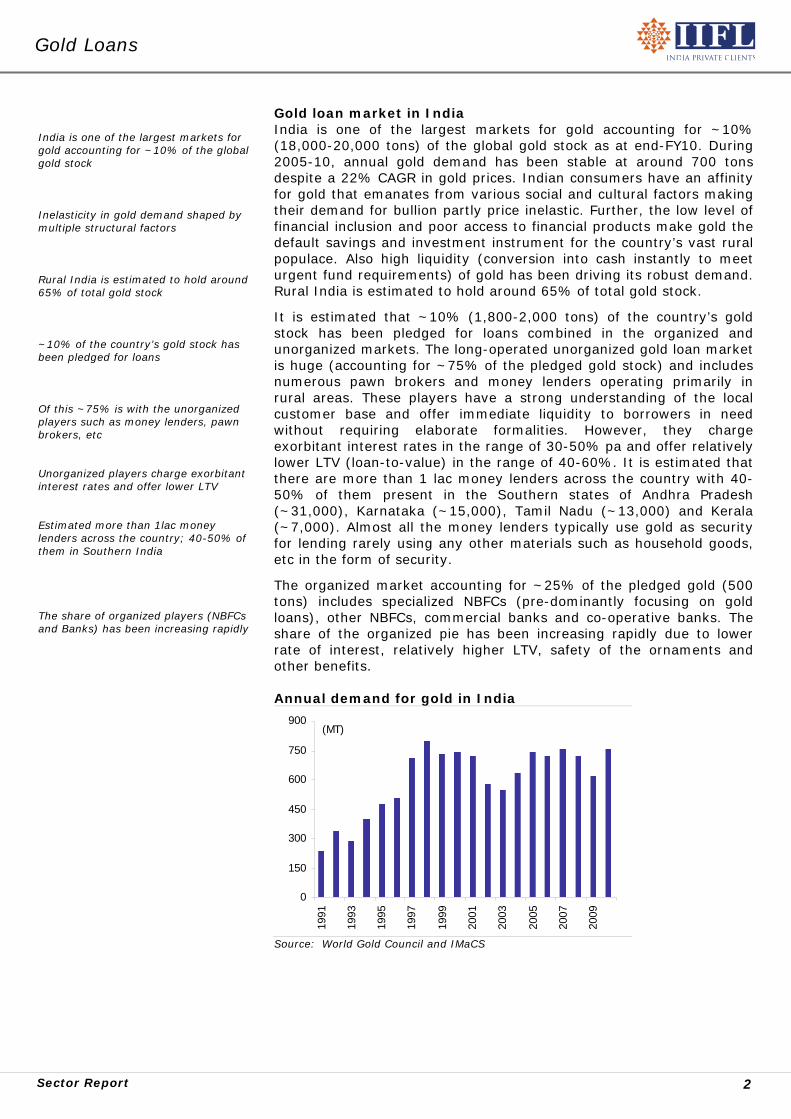
Gold loan market in India India is one of the largest markets for gold accounting for ~10% (18,000-20,000 tons) of the global gold stock as at end-FY10. During 2005-10, annual gold demand has been stable at around 700 tons despite a 22% CAGR in gold prices. Indian consumers have an affinity for gold that emanates from various social and cultural factors making their demand for bullion partly price inelastic. Further, the low level of financial inclusion and poor access to financial products make gold the default savings and investment instrument for the country’s vast rural populace. Also high liquidity (conversion into cash instantly to meet urgent fund requirements) of gold has been driving its robust demand. Rural India is estimated to hold around 65% of total gold stock.
It is estimated that ~10% (1,800-2,000 tons) of the country’s gold stock has been pledged for loans combined in the organized and unorganized markets. The long-operated unorganized gold loan market is huge (accounting for ~75% of the pledged gold stock) and includes numerous pawn brokers and money lenders operating primarily in rural areas. These players have a strong understanding of the local customer base and offer immediate liquidity to borrowers in need without requiring elaborate formalities. However, they charge exorbitant interest rates in the range of 30-50% pa and offer relatively lower LTV (loan-to-value) in the range of 40-60%. It is estimated that there are more than 1 lac money lenders across the country with 40-50% of them present in the Southern states of Andhra Pradesh (~31,000), Karnataka (~15,000), Tamil Nadu (~13,000) and Kerala (~7,000). Almost all the money lenders typically use gold as security for lending rarely using any other materials such as household goods, etc in the form of security.
The organized market accounting for ~25% of the pledged gold (500 tons) includes specialized NBFCs (pre-dominantly focusing on gold loans), other NBFCs, commercial banks and co-operative banks. The share of the organized pie has been increasing rapidly due to lower rate of interest, relatively higher LTV, safety of the ornaments and other benefits. Annual demand for gold in India
0
150
300
450
600
750
900
1991
1993
1995
1997
1999
2001
2003
2005
2007
2009
(MT)
Source: World Gold Council and IMaCS
Gold Loans
Sector Report 3
Organized gold loan market stood at Rs350-400bn at the end of FY10; estimated at Rs550bn+ by end FY11 Substituting traditional players, tapping fresh markets and rally in gold prices have driven the growth of organized market Notwithstanding the growth witnessed, penetration still remains negligible Organized market to continue to grow at robust pace Changing perception of gold loans could drive accelerated adoption by upper middle and higher income groups
Organized gold loan market growing at robust pace As per IMaCS Industry Report (2010 update), the organized gold loan market in India stood at Rs350-400bn at the end of FY10. Over FY02-10, the market has witnessed a robust 40% CAGR. We estimate organized market to have crossed Rs550bn at the end of FY11 as leading NBFCs, Muthoot Finance and Manappuram have combined registered Rs130bn+ accretion in their gold loan book during the year. Apart from substituting unorganized players and tapping fresh markets (areas/locality), the impressive growth of organized market has been driven by handsome rally in gold prices since 2005. During FY05-11, gold prices have witnessed 22% CAGR.
The organized gold loan portfolio accounted for merely 1.2% of the value of total gold stock in India as at end-FY10, as per IMaCS Industry Report (2010 update). The sheer negligible penetration, aggressive network expansion/marketing initiatives by players and increasing awareness/adoption of gold loans would drive strong growth of the organized market over the next 3-4 years. The only caveat would be a material correction in gold prices.
The sustained marketing efforts of specialized NBFCs have been diminishing the stigma attached to pledging gold jewellery and altering the perception of gold loans from an ‘option of the last resort’ to an ‘option of convenience’. Therefore, we believe that market for gold loan products could exponentially grow if there is an accelerated adoption by upper middle and higher income groups.
Organized gold loan market Penetration of the organized market
0
100
200
300
400
500
600
FY
02
FY
07
FY
09
FY
10
FY
11
(Rs bn)
0
6
12
18
24
30
36
FY02 FY07 FY09 FY10
(Rs tn)
0.0
0.3
0.5
0.8
1.0
1.3
1.5(%)
Value of Gold stock Penetration of Org Mkt
Source: World Gold Council, IMaCS and India Infoline Research
Stupendous rally in Gold since 2005 Returns delivered by Gold each fiscal
0
4,000
8,000
12,000
16,000
20,000
24,000
Oct
-05
Jul-0
6
Apr
-07
Jan-
08
Oct
-08
Jul-0
9
Apr
-10
Jan-
11
(Rs/10gm)
0.0
7.0
14.0
21.0
28.0
35.0
42.0
FY06 FY07 FY08 FY09 FY10 FY11 YTD
(%)
Source: Bloomberg, India Infoline Research
Gold Loans
Sector Report 4
Southern region accounts for ~40% of India’s annual gold demand and 85-90% of the organized gold loan market ~70-75% of the branches of specialized NBFCs are located in the southern region Share of southern region has been on decline with these NBFCs expanding aggressively in other regions Operating dynamics of specialized NBFCs and banks are vastly different Banks have enhanced focus on gold loans due to its higher profitability adjusted for lower default rates Specialized NBFCs typically command premium yields and therefore enjoy significantly superior profitability Their NIM and RoA are in the range of 8-16% and 3-5% as compared to 2-4% and 1-2% respectively for banks Branches of specialized NBFCs located closer to banks are witnessing higher customer visits Customer preference for these NBFCs despite their higher interest rates is driven by multiple structural factors Customers are usually in urgent need of funds and therefore are driven by maximum loan exposure and minimum disbursal time
Southern India is the largest gold loan market Presently, the southern region of India accounts for 85-90% of the organized gold loan market. The dominance of the region is attributed to its majority share in the country’s gold holding and more openness towards borrowing against gold. According to IMaCS Industry Report, south India accounts for 40% of India’s annual gold demand, followed by the western region at 25%, northern region at 20-25% and eastern region at 10-15%.
Not surprisingly, ~70-75% of the branches of specialized NBFCs such as Muthoot Finance and Manappuram are located in the southern region. More importantly, a disproportionately higher share of business comes from this region manifesting its higher proclivity towards borrowing against gold. Over the past two years, however, specialized NBFCs have started expanding aggressively in the other three regions accompanied by belligerent promotions to enhance awareness. This along with shifting psychographics is likely to drive a gradual decline in southern region’s share in the organized gold loan market. Specialized NBFCs better placed than banks The operating dynamics of specialized NBFCs (Muthoot and Manappuram) and banks are vastly different which is reflected in the margins and profitability. For a specialized NBFC, gold loans is the primary business while banks have traditionally viewed gold loans for agriculture purpose as a safer means to meet their priority lending targets. Further, with increase in default rates in some retail segments especially personal loans over the past few years, banks have enhanced focus on gold loans as it offers attractive returns adjusted for low levels of defaults. Recently, RBI precluded gold loans from being classified under the agriculture sector, thereby making such loans ineligible to meet banks' priority lending targets.
Specialized NBFCs have invested heavily in building their service offerings and typically command premium yields and attractive profitability. Though interest rate charged varies in the wide range of 12-26%, average yield earned by these players is between 18-25%. Interest rates charged by commercial and co-operative banks are significantly lower varying from 8-13%. Generally, banks also levy processing charges which is not in the case of NBFCs. Resultantly, NIMs of gold loan NBFCs are substantially higher at 8-16% as against 2-4% for banks. RoA of NBFCs is much attractive at 3-5% v/s 1-2% for banks.
Our conversations with Muthoot and Manappuram revealed that their branches located near to banks (some even in the same building) are able to attract more customers than latter in spite of higher interest rates. They attribute customer’s preference for NBFCs to 1) low levels of documentation and formalities 2) quick approval and disbursal of loans (average turnaround time is 10-15 minutes for a new customer and 5-8 minutes for an existing customer) 3) higher loan-to-value exposure (75% at the higher end as compared to 60-65% given by banks) 4) flexibility in terms of loans and 5) presence of expert valuers. It has to be understood that gold loan customers typically look at minimum disbursal time and maximum loan exposure for their gold as they have an urgent need for funds. Further, since loans are all over-collateralized by gold jewellery, there is minimal requirement for documentation and credit assessment, thereby shortening the response time.
Gold Loans
Sector Report 5
Market share of NBFCs has increased significantly from 18% in FY07 to 32% in FY10 However, commercial banks focused on southern India continue to dominate the market with 58% share
NBFC’s market share has been increasing at fast clip According to IMaCS Industry Report, the market share of NBFCs in the organized gold loan market has increased significantly from 18% in FY07 to 32% in FY10. On the other hand, other players such as public and private banks and co-operatives have witnessed a material decline in their market shares. However, commercial banks focused on southern India (IOB, SIB, Indian Bank, Andhra Bank, Federal Bank, etc) continue to dominate the market with 58% share in FY10. NBFC’s market share gain has been mainly driven by exceptional growth of specialized gold loan companies such as Muthoot and Manappuram.
Movement in market share of organized players
Growth over FY07-10 of organized players
52.3 50.6 46.5
14.8 13.711.6
18.4 23.6 32.2
14.5 12.1 9.7
0.0%
20.0%
40.0%
60.0%
80.0%
100.0%
FY07 FY09 FY10
Public Banks Private Banks NBFCs Co-operatives
0
15
30
45
60
75
Pub
licB
anks
Priv
ate
Ban
ks
NB
FC
s
Co-
oper
ativ
es
(%)
Source: IMaCS and India Infoline Research
Growth in loan book witnessed by leading players
Top 5 gold loan providers with market share
0
15
30
45
60
75
Mut
hoot
Fin
ance
Mut
hoot
Fin
corp
Man
appu
ram
Indi
an B
ank
IOB
Sou
th In
dian
Ban
k
And
hra
Ban
k
(Rs bn)
FY07 FY09 FY10
0.0
4.0
8.0
12.0
16.0
20.0
24.0
0
15
30
45
60
75
90
Mut
hoot
Fin
IOB
Indi
an B
k
Man
appu
ram
SIB
(%)(Rs bn)
Gold Loan Book Market Share
Source: IMaCS and India Infoline Research
Gold Loans
Sector Report 6
Kerala has imposed its Money Lenders Act on all NBFCs operating in the state proposing an interest rate cap of 18% Its imposition is being challenged by specialized NBFCs in Supreme Court Other southern states have not imposed Money Lenders Act on NBFCs A material portion of AUM growth for gold loan companies was driven by gold price uptrend Therefore, a significant correction in gold prices would have a direct impact on their future growth
Critical success factors for Gold Loan companies
Source: Company, India Infoline Research Adverse regulations could hurt profitability Kerala has imposed its Money Lenders Act on all NBFCs operating in the state that proposes an interest rate ceiling of 18%, substantially lower than 20-24% charged by gold loan companies. The imposition of the Act was later upheld by the High Court and NBFCs such as Manappuram and Muthoot have challenged this decision in the Supreme Court. Their contention is that they are already governed by RBI and interest rate charged is as per the guidelines under the fair practice code. Further, the 7,000+ registered money lenders in Kerala are actually charging higher interest rate of 30-40% than prescribed 18%. Tamil Nadu, Karnataka and Andhra Pradesh also have their own Money Lenders Act but have not imposed it on NBFCs. In our view, a perceivable risk could be RBI setting an interest rate and margin cap for gold loan companies as done for MFIs recently. If caps are set at similar levels (26% for interest and 12% for margin), than some gold loan companies (such as Manappuram) would be impacted at the margin level. Correction in gold prices would impact growth Over the past three years, there has been a sustained rally in gold prices having risen from US$917/ounce in FY08 to US$1,432/ounce in FY11 (a 16% CAGR). We believe that a material portion of AUM growth for gold loan companies was driven by the gold price uptrend mainly reflected in improving average ticket size of loans. In the light of persisting global uncertainty, we assume gold prices to be stable over the next two years. However, if there is a material correction in price than AUM growth of the gold loan companies would be directly impacted. Companies would need to add higher number of customers as average ticket size would decline. We believe that impact of sharp decline in gold prices on asset quality would be limited given a comfortable LTV ratio of ~70% and shorter loan tenures.
Largest gold financing company in the country Muthoot Finance (Muthoot) is the largest gold financing company in India with a gross gold loan portfolio of Rs15.9bn as at March 2011 and a commanding market share (20% in FY10). Company’s AUM has witnessed a phenomenal 82% CAGR over the past four years driven by substantial network expansion, significant improvement in branch productivity, sustained rally in gold prices and strong brand recognition. Gold stock has increased from 23MT to 112MT over FY07-11 representing 49% CAGR. About 67% of the current ~2,900 branches are located in the southern region which contribute 74% to the gold loan portfolio. AUM growth to moderate but balance sheet growth to be strong We anticipate Muthoot’s AUM growth to slow down to a more normalized 37.5% pa over FY11-13 due to base effect, increasing penetration and competition in South (especially Kerala) and slower adoption of gold loan product in other regions. Further, if the gold rally were to halt, AUM growth would be purely volume driven. With limited incentive for assignments now, bulk of the incremental growth would be reflected on the balance sheet propping up the net loan CAGR to 57.5% over FY11-13. Business growth would be mainly driven by significant improvement in productivity of ~1,750 branches added in the past two years. NIM to contract on sharp increase in funding cost Notwithstanding the tailwind from IPO, Muthoot’s NIM is estimated to correct by 140bps in FY12 to 9.5% due to steep rise in the cost of funds. The cost of bank borrowings has increased by 150-200bps in recent months on account of lending rate hikes by banks and loss of PSL status for assignments. Any fresh retail secured NCD issuance by Muthoot would likely happen at elevated rates (11-12%) in-line with recent issuances by other NBFCs. The yield on loan portfolio is expected to remain firm during the year despite intensifying competition aided by the recent hike (100-150bps) in interest rate by the company. RoA to marginally come-off; RoE to remain impressive though Significant improvement in AUM/Branch (from Rs58mn to Rs80mn over FY11-13) and lower incremental marketing/promotion expenditure would drive some operating leverage. Resultantly, opex/average assets ratio is estimated to decline by 30bps over FY11-13 to 3.6% marginally cushioning the impact of NIM contraction on RoA. The recent IPO has augmented capital adequacy and reduced leverage. RoE, as a result, is likely to normalize to 30-35% from 51% in FY11. Considering the estimated robust earnings of 39% over FY11-13, we initiate coverage on Muthoot with a BUY rating and 9-month target of Rs202. Financial summary
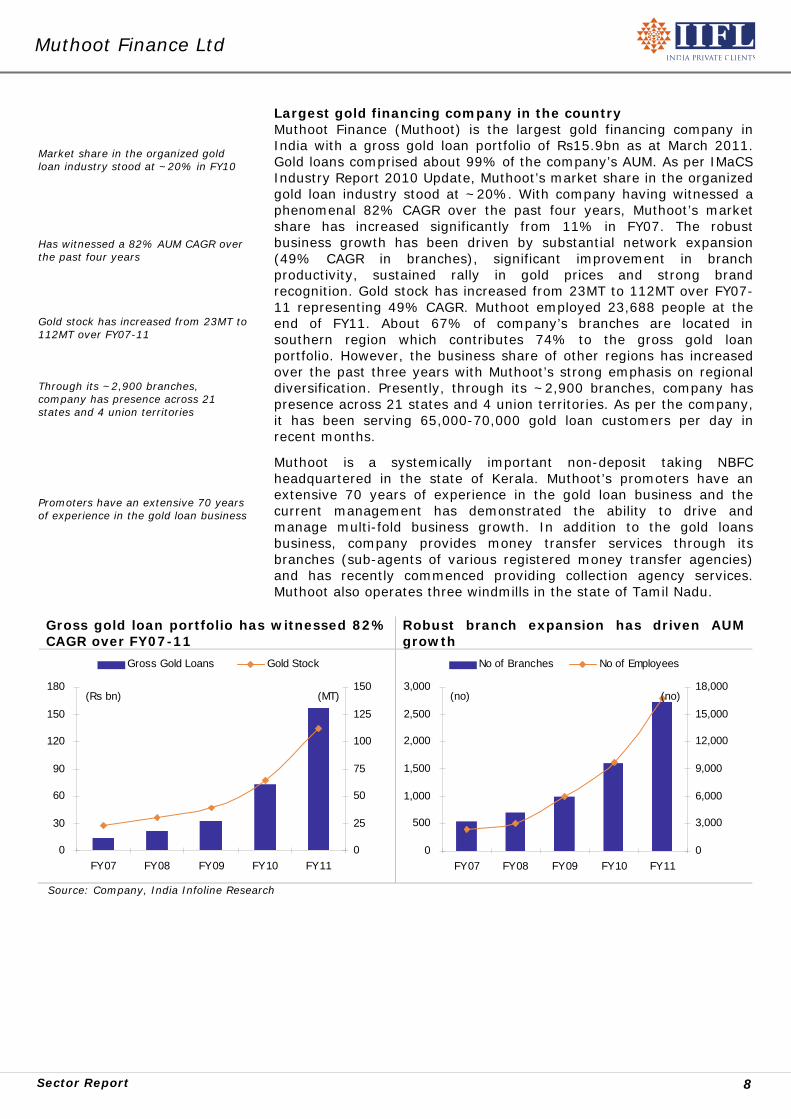
Market share in the organized gold loan industry stood at ~20% in FY10 Has witnessed a 82% AUM CAGR over the past four years Gold stock has increased from 23MT to 112MT over FY07-11 Through its ~2,900 branches, company has presence across 21 states and 4 union territories Promoters have an extensive 70 years of experience in the gold loan business
Largest gold financing company in the country Muthoot Finance (Muthoot) is the largest gold financing company in India with a gross gold loan portfolio of Rs15.9bn as at March 2011. Gold loans comprised about 99% of the company’s AUM. As per IMaCS Industry Report 2010 Update, Muthoot’s market share in the organized gold loan industry stood at ~20%. With company having witnessed a phenomenal 82% CAGR over the past four years, Muthoot’s market share has increased significantly from 11% in FY07. The robust business growth has been driven by substantial network expansion (49% CAGR in branches), significant improvement in branch productivity, sustained rally in gold prices and strong brand recognition. Gold stock has increased from 23MT to 112MT over FY07-11 representing 49% CAGR. Muthoot employed 23,688 people at the end of FY11. About 67% of company’s branches are located in southern region which contributes 74% to the gross gold loan portfolio. However, the business share of other regions has increased over the past three years with Muthoot’s strong emphasis on regional diversification. Presently, through its ~2,900 branches, company has presence across 21 states and 4 union territories. As per the company, it has been serving 65,000-70,000 gold loan customers per day in recent months.
Muthoot is a systemically important non-deposit taking NBFC headquartered in the state of Kerala. Muthoot’s promoters have an extensive 70 years of experience in the gold loan business and the current management has demonstrated the ability to drive and manage multi-fold business growth. In addition to the gold loans business, company provides money transfer services through its branches (sub-agents of various registered money transfer agencies) and has recently commenced providing collection agency services. Muthoot also operates three windmills in the state of Tamil Nadu.
Gross gold loan portfolio has witnessed 82% CAGR over FY07-11
Robust branch expansion has driven AUM growth
0
30
60
90
120
150
180
FY07 FY08 FY09 FY10 FY11
(Rs bn)
0
25
50
75
100
125
150(MT)
Gross Gold Loans Gold Stock
0
500
1,000
1,500
2,000
2,500
3,000
FY07 FY08 FY09 FY10 FY11
(no)
0
3,000
6,000
9,000
12,000
15,000
18,000(no)
No of Branches No of Employees
Source: Company, India Infoline Research
Muthoot Finance Ltd
Sector Report 9
Company had 4.7mn loan accounts at the end of FY11 Interest rate vary in the range of 12-30% pa; most of the loans are in the range of Rs5,000-50,000 Average tenure of loans is about 4 months As loans are over-collateralized by, credit assessment and documentary requirements are minimal Two key factors that impact response time are loan ticket size and number of items pledged Company has two staff training colleges and three regional training centers
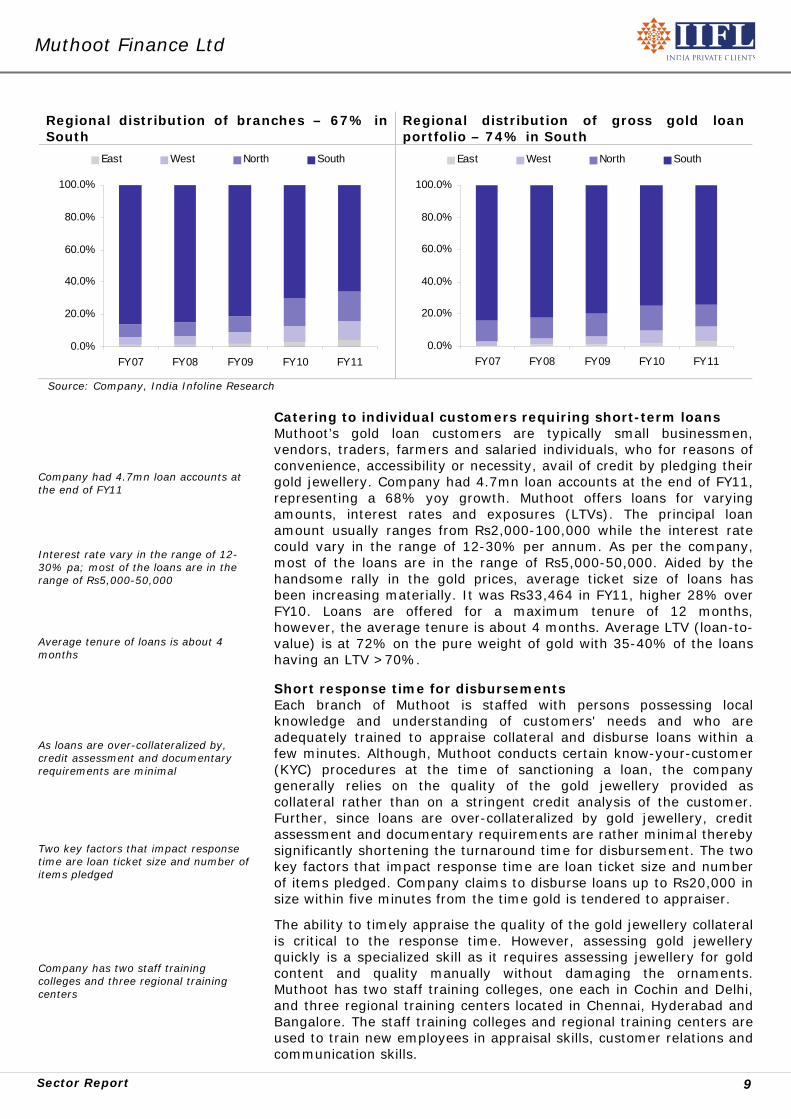
Catering to individual customers requiring short-term loans Muthoot’s gold loan customers are typically small businessmen, vendors, traders, farmers and salaried individuals, who for reasons of convenience, accessibility or necessity, avail of credit by pledging their gold jewellery. Company had 4.7mn loan accounts at the end of FY11, representing a 68% yoy growth. Muthoot offers loans for varying amounts, interest rates and exposures (LTVs). The principal loan amount usually ranges from Rs2,000-100,000 while the interest rate could vary in the range of 12-30% per annum. As per the company, most of the loans are in the range of Rs5,000-50,000. Aided by the handsome rally in the gold prices, average ticket size of loans has been increasing materially. It was Rs33,464 in FY11, higher 28% over FY10. Loans are offered for a maximum tenure of 12 months, however, the average tenure is about 4 months. Average LTV (loan-to-value) is at 72% on the pure weight of gold with 35-40% of the loans having an LTV >70%. Short response time for disbursements Each branch of Muthoot is staffed with persons possessing local knowledge and understanding of customers' needs and who are adequately trained to appraise collateral and disburse loans within a few minutes. Although, Muthoot conducts certain know-your-customer (KYC) procedures at the time of sanctioning a loan, the company generally relies on the quality of the gold jewellery provided as collateral rather than on a stringent credit analysis of the customer. Further, since loans are over-collateralized by gold jewellery, credit assessment and documentary requirements are rather minimal thereby significantly shortening the turnaround time for disbursement. The two key factors that impact response time are loan ticket size and number of items pledged. Company claims to disburse loans up to Rs20,000 in size within five minutes from the time gold is tendered to appraiser.
The ability to timely appraise the quality of the gold jewellery collateral is critical to the response time. However, assessing gold jewellery quickly is a specialized skill as it requires assessing jewellery for gold content and quality manually without damaging the ornaments. Muthoot has two staff training colleges, one each in Cochin and Delhi, and three regional training centers located in Chennai, Hyderabad and Bangalore. The staff training colleges and regional training centers are used to train new employees in appraisal skills, customer relations and communication skills.
Regional distribution of branches – 67% in South
Regional distribution of gross gold loan portfolio – 74% in South
0.0%
20.0%
40.0%
60.0%
80.0%
100.0%
FY07 FY08 FY09 FY10 FY11
East West North South
0.0%
20.0%
40.0%
60.0%
80.0%
100.0%
FY07 FY08 FY09 FY10 FY11
East West North South
Source: Company, India Infoline Research
Muthoot Finance Ltd
Sector Report 10
Muthoot has significantly outpaced industry growth over FY07-11 Expect AUM growth to moderate significantly; estimate FY11-13 CAGR at 37.5% Substantial growth would be driven by relatively new branches AUM/Branch to increase from Rs58mn at end-FY11 to Rs80mn at end-FY13
AUM growth to moderate significantly over FY11-13E Despite being the largest player in the organized gold loan market, Muthoot has significantly outpaced the industry in terms of growth. Company’s gross gold loan book has witnessed 82% CAGR over FY07-11 as against 46% CAGR of the organized market. In the past two years, growth has been much stronger at 118% pa. Sheer size of the opportunity, management aggression, timely fund raising, robust branch expansion and buoyancy in gold prices have driven the robust growth. Gold stock has increased from 23MT to 112MT over FY07-11 representing 49% CAGR. Gold loans being the flagship lending product for Muthoot constitute 99% of its AUM. Going ahead, we expect AUM growth to moderate significantly on account of increasing penetration and competition in South (especially Kerala) and slower adoption of gold loan product in other regions. Further, if the gold rally were to halt, AUM growth would be purely volume driven. We factor in a substantial moderation and expect AUM CAGR of 37.5% over FY11-13.
With Muthoot having added ~1,750 branches (64% of March-ending strength) in the past two years, we believe that a substantial portion of the incremental growth would be driven by these relatively new branches. Company has planned for a modest branch addition of 500 each in FY12 and FY13. Resultantly, average branch productivity is estimated to shoot up with AUM/Branch increasing by 38% from Rs58mn at end-FY11 to Rs80mn at end-FY13.
AUM/Branch to increase significantly
0
15
30
45
60
75
90
FY08 FY09 FY10 FY11 FY12E FY13E
(Rs mn)
Source: Company, India Infoline Research
AUM to witness 37.5% CAGR over FY11-13E FY12E and FY13E branch addition to be modest
0
50
100
150
200
250
300
FY08 FY09 FY10 FY11 FY12E FY13E
(Rs bn)
0
20
40
60
80
100
120(%)
AUM yoy grow th
0
200
400
600
800
1,000
1,200
FY07 FY08 FY09 FY10 FY11 FY12E FY13E
(no)
Source: Company, India Infoline Research
Muthoot Finance Ltd
Sector Report 11
Assignments have been ~25% of AUM in the past three years Interest rates on assignments were 150-200bps lower than other bank borrowings RBI recently precluded gold loans from being classified as PSL for banks Thus, interest benefit on loan assignments has disappeared Company has assigned loans worth ~Rs8bn since the RBI circular Lower assignments would prop-up net loan CAGR to 57.5% over FY11-13
Assignments to come-off sharply; net loan book to grow much faster than AUM Loan assignment has been a significant feature for Muthoot forming ~25% of its AUM in the past three years. Company has been selling a portion of its loan portfolio to banks on regular basis for an upfront fixed consideration. This arrangement represented a relatively cheaper source of capital as the interest rates were 150-200bps lower than other bank borrowings. The interest benefit was offered by banks as the purchased portfolio could be classified under the agriculture sector for meeting the priority sector lending target. Under such transactions, Muthoot has to provide credit enhancement through fixed deposits with respective bank or by issuing a corporate guarantee for an amount equal to a negotiated percentage of the value of the loans being assigned.
The assigned book and liability does not appear on the balance sheet of the company. Cash raised by assignment is used for generating fresh gold loans. The loans assigned are managed by the company (therefore, customers not impacted) and interest income as well as assignment expenses are recorded in the P&L. On maturity of the assigned portfolio, the repayment goes to the bank and assignment liability disappears. In a recent circular (dated February 2nd 2011), RBI precluded gold loans from being classified under the agriculture sector for meeting PSL requirements. Thus the interest benefit has disappeared and the cost of loan assignments has become similar to other bank borrowings. As per the company, the new regulation would apply to new assignments and not impact the existing arrangements. Also, it is unlikely to impact the availability of funds.
In the absence of any interest advantage under assignments, company expects majority of its incremental bank borrowings through its routine cash credit/working capital loan facility. With some of the banks still interested, company has assigned loans worth ~Rs8bn since the RBI circular. However, management has hinted at lower assignments going ahead. With this, bulk of the growth would be reflected on the balance sheet thereby propping up the net loan CAGR to 57.5% over FY11-13.
Assignments to decline sharply on loss of PSL status
Resultantly, net loan book on balance sheet to grow much faster than AUM
0
8
16
24
32
40
48
FY08 FY09 FY10 FY11 FY12E FY13E
(Rs bn)
0
5
10
15
20
25
30(%)
Assignments as a % of AUM
0
50
100
150
200
250
300
FY08 FY09 FY10 FY11 FY12E FY13E
(Rs bn)
0
20
40
60
80
100
120(%)
Net loan book yoy grow th
Source: Company, India Infoline Research
Muthoot Finance Ltd
Sector Report 12
Borrowing mix to materially shift towards retail secured NCDs and bank borrowings Share of equity in Total Assets funding has received a boost from recent IPO n
30-35% of borrowings carry fixed rate of interest v/s 100% of loans Cost of bank borrowings has shot-up by 150-200bps in the recent past Interest rate offered on Retail NCDs would also track the macro trend Expect Muthoot’s funding cost to increase sharply by 180bps in FY12.
Share of NCDs and Banks to increase in borrowings The primary sources of borrowing for Muthoot have been Retail secured NCDs (known as Muthoot Gold Bonds), banks (CC/WC loan facility) and assignments. Combined, these three sources formed 90% of company’s total borrowings. Retail NCDs having a term of 1, 2 or 3 years are placed privately to the customers visiting branches. With assignment estimated to significantly come down, the borrowing mix would move materially shift towards retail secured NCDs and bank borrowings. The share of subordinated debt and other forms of borrowings including CPs would also rise. The share of equity in Total Assets (including Assignments) funding would receive a boost from the recent IPO of ~Rs9bn.
Cost of borrowing to rise materially in FY12E Muthoot’s cost of borrowing stood at 8.8% for FY11 representing a marginal increase over FY10. As against 100% of loans assets that are at fixed rates, only 30-35% of company’s borrowings (primarily NCDs and subordinated debt) carry fixed rate of interest. The interest rate on the balance 65% borrowings, mainly from banks (assignment and others), are floating linked to the respective banks' BPLR or base rate. In the recent past, the cost of bank borrowing (including assignments) has shot-up by 150-200bps due to material increase in lending rates and loss of PSL status for assignments. The central bank’s monetary tightening and difficult liquidity conditions have forced all commercial banks to raise their BPLR and base rate substantially over the past 6-9 months. The interest rate offered on Retail NCDs would also track the macro trend as already seen in higher rates (11-12%) being offered by many NBFCs on new NCD issuances. We therefore expect Muthoot’s cost of borrowings to witness a steep increase of 180bps in FY12.
Borrowing profile as at FY11-end Total asset (incl. assignments) funding mix trend
38%
4%
26%
26%
6%
NCD - MGB Banks Borrow ings Subordinated debt
Assignments Others
0.0%
20.0%
40.0%
60.0%
80.0%
100.0%
FY07 FY08 FY09 FY10 FY11 FY12E FY13E
Ow ned Funds NCD - MGB Banks Borrow
Subordinated debt Assignments Others
Source: Company, India Infoline Research
Muthoot Finance Ltd
Sector Report 13
Yield on loan portfolio has been steady around 20% over the past five years Recently, company has raised interest rates on loans by 100-150bps to pass-on the increase in funding cost Expect a stable loan yield in FY12 and a correction of 70bps in FY13 NIM to decline sharply by 140bps in FY12 due to steep increase in funding cost
Cost of funds to rise by 180bps in FY12E
6.0
7.0
8.0
9.0
10.0
11.0
12.0
FY08 FY09 FY10 FY11 FY12E FY13E
(%)
Source: Company, India Infoline Research Yield to be resilient in FY12E but may weaken in FY13E; NIM to correct materially The average yield earned on the loan portfolio was 19.7% in FY11. It has been steady around 20% over the past five years despite a significant increase in organized competition. As per Muthoot, further competition in the Southern region is also unlikely to impact its loan yields as the overall business pie is expanding with increasing adoption of gold loans by middle and higher income individuals. Recently, company has raised interest rates on loans by 100-150bps to pass-on the increase in funding cost thus reflecting its strong pricing power. Company’s loan yield is materially lower when compared to its closest competitor, Manappuram, and in-line with most NBFCs present in the gold loan segment. We assume a stable loan yield in FY12 and a correction of 70bps in FY13 factoring some impact of intensifying competition.
NIM on the other hand is estimated to decline sharply by 140bps in FY12 due to steep increase in funding cost. This would be despite the beneficial impact of the recent equity raising though an IPO. NIM is likely to stabilize in FY13 near 9.5%. The key upside risk to our margin assumption for FY13 would be a sharp reversal in interest rate cycle.
Yield on AUM to be relatively stable NIM to witness steep fall in FY12E due to sharp increase in funding cost
11.0
13.0
15.0
17.0
19.0
21.0
23.0
FY07 FY08 FY09 FY10 FY11 FY12E FY13E
(%)
6.0
7.0
8.0
9.0
10.0
11.0
12.0
FY07 FY08 FY09 FY10 FY11 FY12E FY13E
(%)
Source: Company, India Infoline Research
Muthoot Finance Ltd
Sector Report 14
AUM/Branch to increase sharply from Rs58mn in FY11 to Rs80mn in FY13 Operating leverage would be driven by advertising and other opex Opex/average assets ratio to decline from 3.9% in FY11 to 3.6% in FY13
Company raised ~Rs9bn through an IPO in April 2011 augmenting its Tier-1 ratio by ~700bps Tier-1 ratio is unlikely to dip below 10% over the next two years aided by substantial plough backs
Improvement in branch productivity would drive some operating leverage With substantial growth to be driven by relatively younger branches (<2 years old) and modest new branch addition plans, we expect average branch productivity to witness a significant jump. Year-ending AUM/Branch is estimated to increase sharply from Rs58mn in FY11 to Rs80mn in FY13. This is likely to kick-in some operating leverage for Muthoot over the next two years. We don’t expect any leverage in staff and rent expenditure as salary and rental inflation would likely remain firm. Material leverage would actually come in from advertising and other opex. The advertising expenditure has increased three-fold in the past two years driven by aggressive marketing and promotion to improve brand awareness. Company expects only a marginal increase in FY12. Lower other opex ratio would be driven by higher capacity utilization. Overall, we expect opex/average assets ratio to decline from 3.9% in FY11 to 3.6% in FY13.
Recent equity issuance has augmented capital adequacy; further dilution unlikely till FY13E As per the revised norms of RBI, all systemically important non-deposit taking NBFCs are required to maintain a CAR of at least 15% from March 31, 2011. To adhere to this regulation in the backdrop of strong business growth, Muthoot raised ~Rs9bn (67% of its FY11 networth) through an IPO in the month of April 2011. This has significantly augmented its Tier-1 ratio (likely by ~700bps) which stood at 10.3% at the end of FY11, just above new minimum requirement of 10%. Though AUM growth is expected to moderate substantially over the next two years, capital consumption would remain high as bulk of the growth would be reflected on balance sheet. However, the Tier-1 ratio is unlikely to dip below 10% over the next two years aided by substantial plough backs. We therefore do not foresee any need for further equity dilution in the medium term.
Advertising and other opex would be the drivers of operating leverage
Opex/Avg. Assets to decline marginally over FY11-13E
0.0
0.4
0.7
1.1
1.4
1.8
2.1
FY08 FY09 FY10 FY11 FY12E FY13E
(% of Avg Assets)
Staff Exp Rent Advertising Other Opex
2.5
3.0
3.5
4.0
4.5
5.0
FY08 FY09 FY10 FY11 FY12E FY13E
(%)
Source: Company, India Infoline Research
Muthoot Finance Ltd
Sector Report 15
Muthoot’s GNPL% has moved in a narrow band of 0.2-0.5% in the past five years Historically, company’s NPL provisioning has been limited to regulatory levels Expect more conservative provisioning by the company in future
Negligible asset quality concerns With gold loans constituting 99% of AUM, Muthoot’s GNPL% has moved in a narrow band of 0.2-0.5% in the past five years. As the pledged gold jewelry holds high sentimental value for the borrower, defaults have been rare. In the case of a default, company sells the gold jewellery collateral through auctions to the local jewellers. The loans are over-collateralized thereby providing cushion against material correction in gold prices. Therefore, probability of any loss arising to the company is extremely low.
Historically, Muthoot provisioning for NPLs has been limited to regulatory requirements – 10% for sub-standard assets and 50-100% for doubtful assets. With 95% of NPLs being sub-standard assets, overall provisioning cover stands lower at 15%. We expect more conservative provisioning by the company in future taking the provisioning cover to 25% by FY13. During Q3 FY11, RBI introduced 0.25% provisioning for standard gold loans which the company met in H2 FY11. We estimate stable credit charge in FY12 and FY13 at 0.3%.
Capital adequacy augmented by recent IPO; Tier-1 ratio to remain comfortable
Plough backs would be substantial in FY12E and FY13E; would aid capital adequacy
5.0
7.5
10.0
12.5
15.0
17.5
20.0
FY07 FY08 FY09 FY10 FY11 FY12E FY13E
(%)
CAR Tier-1
0
2
3
5
6
8
9
FY07 FY08 FY09 FY10 FY11 FY12E FY13E
(Rs bn)
Source: Company, India Infoline Research
Asset quality to remain robust Credit charge to be stabilize near 0.3%
0.0
0.1
0.2
0.3
0.4
0.5
0.6
FY07 FY08 FY09 FY10 FY11 FY12E FY13E
(%)
GNPL NNPL
0.0
0.1
0.2
0.3
0.4
0.5
FY08 FY09 FY10 FY11 FY12E FY13E
(%)
Source: Company, India Infoline Research
Muthoot Finance Ltd
Sector Report 16
RoA to decline by marginal 30bps over FY11-13 to 3.6% RoE to normalize to 30-35% with recent reduction in leverage
RoA to come-off marginally; RoE to decline but remain robust Muthoot’s RoA in FY11 was handsome 3.9% reflecting its robust profitability. In the next two years, a key headwind for RoA would be the anticipated 140bps decline in NIM. However, this would be partly offset by the expected operating leverage. With asset quality to remain sanguine, provisioning in unlikely to pose any threat to profitability. Overall, we estimate Muthoot’s RoA to decline by marginal 30bps over FY11-13 to 3.6%. RoE, which stood at exceptional 51.9% in FY11 due to peak leverage (9x), would normalize to above 30% with leverage correcting to around 7x.
RoE to fall from exceptionally high levels due to reduction in leverage
5.0
6.0
7.0
8.0
9.0
10.0
22.0
27.0
32.0
37.0
42.0
47.0
52.0
FY08 FY09 FY10 FY11 FY12E FY13E
(x)(%)
RoE Leverage
Source: Company, India Infoline Research
Decline in PAT/AUM % to be lower than NIM cushioned by operating leverage
RoA to marginally trend down impacted by NIM correction
2.5
3.0
3.5
4.0
4.5
5.0
FY08 FY09 FY10 FY11 FY12E FY13E
(%)
1.5
2.0
2.5
3.0
3.5
4.0
4.5
FY08 FY09 FY10 FY11 FY12E FY13E
(%)
Source: Company, India Infoline Research
Muthoot Finance Ltd
Sector Report 17
Overall profitability of Muthoot to remain robust Estimate earnings CAGR at strong 39% over FY11-13 Recommend BUY with a 9-month target of Rs202
Valuation attractive considering robust profitability and strong earnings growth Despite the anticipated slowdown in AUM growth and contraction in margin, overall profitability of Muthoot would still remain robust with RoA in the range of 3.5-4% and RoE in the range of 30-35%. Further, earnings CAGR over FY11-13 is estimated to be strong at 39% on an average AUM growth of 50%. At the current price of Rs154, the stock trades at 12% below the IPO price and at attractive valuation of 1.6x FY13E P/BV. Though there are valid concerns with respect to further increase in the funding cost and potential adverse regulations, current valuation seems to have digested a significant part of it. We initiate coverage on Muthoot with a BUY rating and 9-month target of Rs202 (valued at 2.1x FY13 P/BV).
Muthoot Finance Ltd
Sector Report 18
Financials
Income statement Y/e 31 Mar (Rs m) FY10 FY11E FY12E FY13E
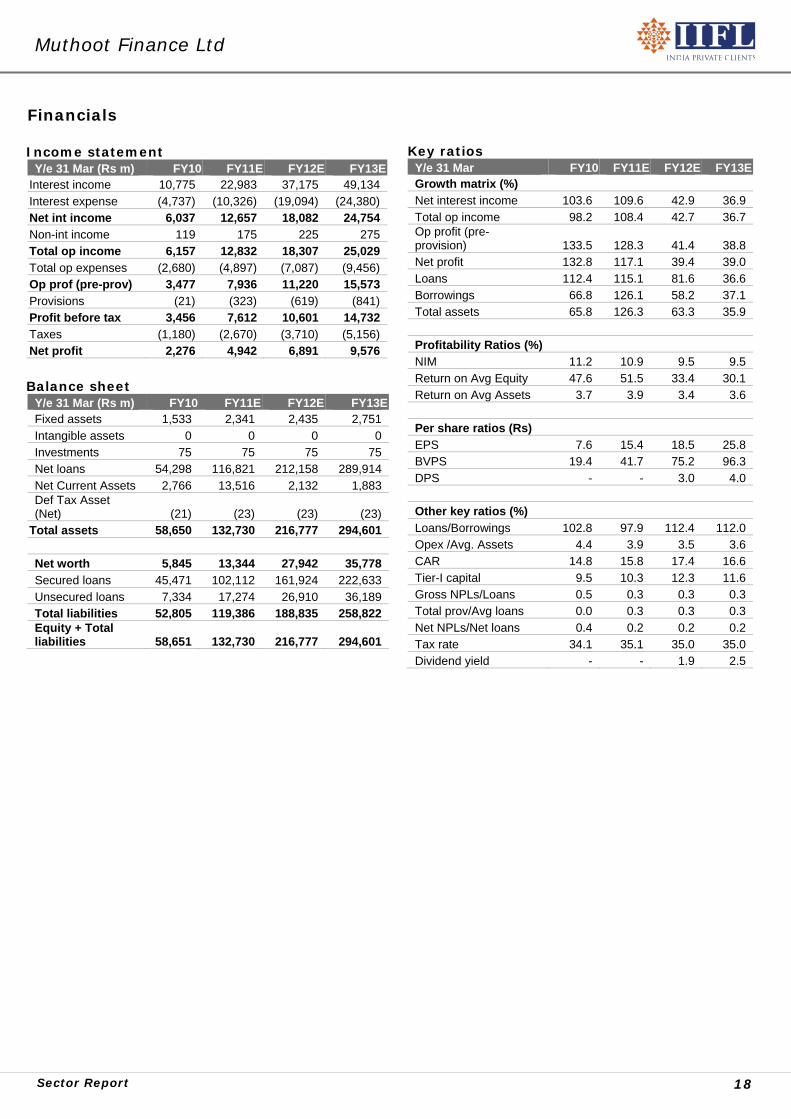
Interest income 10,775 22,983 37,175 49,134 Interest expense (4,737) (10,326) (19,094) (24,380) Net int income 6,037 12,657 18,082 24,754 Non-int income 119 175 225 275 Total op income 6,157 12,832 18,307 25,029 Total op expenses (2,680) (4,897) (7,087) (9,456) Op prof (pre-prov) 3,477 7,936 11,220 15,573 Provisions (21) (323) (619) (841) Profit before tax 3,456 7,612 10,601 14,732 Taxes (1,180) (2,670) (3,710) (5,156) Net profit 2,276 4,942 6,891 9,576
Balance sheet Y/e 31 Mar (Rs m) FY10 FY11E FY12E FY13EFixed assets 1,533 2,341 2,435 2,751 Intangible assets 0 0 0 0 Investments 75 75 75 75 Net loans 54,298 116,821 212,158 289,914 Net Current Assets 2,766 13,516 2,132 1,883 Def Tax Asset (Net) (21) (23) (23) (23)
Total assets 58,650 132,730 216,777 294,601 Net worth 5,845 13,344 27,942 35,778 Secured loans 45,471 102,112 161,924 222,633 Unsecured loans 7,334 17,274 26,910 36,189 Total liabilities 52,805 119,386 188,835 258,822 Equity + Total liabilities 58,651 132,730 216,777 294,601
Key ratios
Y/e 31 Mar FY10 FY11E FY12E FY13EGrowth matrix (%) Net interest income 103.6 109.6 42.9 36.9 Total op income 98.2 108.4 42.7 36.7 Op profit (pre-provision) 133.5 128.3 41.4 38.8 Net profit 132.8 117.1 39.4 39.0 Loans 112.4 115.1 81.6 36.6 Borrowings 66.8 126.1 58.2 37.1 Total assets 65.8 126.3 63.3 35.9 Profitability Ratios (%) NIM 11.2 10.9 9.5 9.5 Return on Avg Equity 47.6 51.5 33.4 30.1 Return on Avg Assets 3.7 3.9 3.4 3.6 Per share ratios (Rs) EPS 7.6 15.4 18.5 25.8 BVPS 19.4 41.7 75.2 96.3 DPS - - 3.0 4.0 Other key ratios (%) Loans/Borrowings 102.8 97.9 112.4 112.0 Opex /Avg. Assets 4.4 3.9 3.5 3.6 CAR 14.8 15.8 17.4 16.6 Tier-I capital 9.5 10.3 12.3 11.6 Gross NPLs/Loans 0.5 0.3 0.3 0.3 Total prov/Avg loans 0.0 0.3 0.3 0.3 Net NPLs/Net loans 0.4 0.2 0.2 0.2 Tax rate 34.1 35.1 35.0 35.0 Dividend yield - - 1.9 2.5
Fastest growing gold loan company; 8x AUM growth over FY09-11 Manappuram has been the fastest growing gold loan company in the country. It has tripled its AUM in the past one year and grown it eight times in the last two years. Company is the second largest listed gold loan company after Muthoot with ~7% share of the organized market. Apart from a sustained rally in gold prices, substantial network expansion (79% CAGR in branches over FY09-11) has driven the exponential growth in AUM. The robust growth was mainly funded by two back-to-back QIP issues in FY10 (Rs2.45bn) and FY11 (Rs10bn). Presently, >75% of its 2,200-2,300 branches are located in the largest business region of South that contributes a disproportionate ~87% to company’s business. New branches to drive 45% AUM CAGR over FY11-13E After a significant outperformance to industry growth, we expect Manappuram’s growth momentum to moderate over FY11-13 to 45% with increased penetration/competition in South (especially Kerala) and slower adoption in other regions. More importantly, net loans (on the balance sheet) would witness a higher 57% CAGR in the absence of any loan assignments in future. With Manappuram having more than doubled its branches in FY11, bulk of the anticipated growth would be fuelled by substantial uptick in productivity of the new branches. NIM to contract on declining yield and increase in funding cost We estimate Manappuram’s margin to correct by ~360bps over FY11-13 from 16.7% to 13.1%. Current loan yield at ~24% is not only substantially higher than interest charged by commercial and co-operative banks but also materially elevated than Muthoot, a like-to-like competitor. Increasing competition in Southern region could push company’s yield lower in the medium term. On the other hand, funding cost has already increased by 150-200 bps qoq in Q1 FY12 due to loss of PSL status on assignments and increase in bank lending/CP rates. Operating leverage to cushion RoA while RoE to improve With company having significantly invested in capacity augmentation and brand awareness, material operating leverage would kick-in over FY11-13. We expect a substantial improvement in AUM/Branch from Rs36mn to Rs55mn as new branches mature. Further, advertising expenditure is estimated to remain stable or marginally increase. As such, opex/average assets ratio is likely to decline considerably from 7% in FY11 to 5.5% in FY13. This would cushion the impact of margin contraction on RoA. However, RoE would improve as leverage increases from 2.9x to 5.1x. Given the strong growth and profitability profile, we initiate coverage on Manappuram with a BUY rating and 9-month target of Rs73. Financial summary
Manappuram is the second largest listed gold loan company with ~7% share of the organized market By having grown its AUM 8xin the past two years, Manappuram is the fastest growing gold loan company Exponential growth was supported by substantial branch addition and the rally in gold prices >75% of branches are located in the largest business region of South In terms of business, Southern region has a disproportionate share of ~87% Strong Board comprising 13 members with high level of independence
Fastest growing gold loan company Headquartered in the State of Kerala, Manappuram General Finance and Leasing Ltd (Manappuram) is the second largest listed gold loan company with ~7% share of the organized market. Initially registered as deposit taking NBFC, company has changed its status recently to become a non-deposit taking NBFC. Manappuram, a flagship company of Manappuram Group, is primarily engaged in providing loans against household used jewellery pledged by customers. As at March 2011, company’s AUM stood at Rs75bn; 99.3% of which were gold loans and remaining are historical portfolio of hypothecation against vehicle loans and other business/personal loans. By having tripled its AUM is the past one year and grown eight times in the past two years, Manappuram is the fastest growing gold loan company in the country. The exponential growth was supported by substantial branch (79% CAGR over FY09-11) and employee (103% CAGR over FY09-11) addition. A sustained rally in gold prices also played a critical role in AUM accretion. The robust growth was funded mainly by two back-to-back QIP issues in FY10 (Rs2.45bn) and FY11 (Rs10bn). Presently, more than 75% of its 2,200-2,300 branches are located in the largest business region of South (uniformly spread across Kerala, Tamil Nadu, Karnataka and Andhra Pradesh). In terms of business, Southern region has a disproportionate share of ~87%. However, this has been declining gradually as company has been aggressively adding branches in the other three regions. Manappuram employed 16,751 employees as at end-March 2011. Manappuram was founded by late V C Padmanabhan in 1949 and is currently managed by his son V P Nandakumar, who is the Executive Chairman. Company has a strong Board comprising 13 members with high level of independence.
AUM has grown 8x in the past two years Branch expansion has supported AUM growth
0
15
30
45
60
75
90
FY07 FY08 FY09 FY10 FY11
(Rs bn)
0
400
800
1,200
1,600
2,000
2,400
FY08 FY09 FY10 FY11
(no)
Source: Company, India Infoline Research
Manappuram General Finance & Leasing Ltd
Sector Report 21
Gold loan customers borrow for an emergency or funding a cash flow mismatch Average loan disbursal time is 15 minutes for a new customer and 7-8 minutes for an existing customer Loans are provided for standard one year tenure but the average duration is near 4 months Average ticket size of loan has increased from Rs27,000 to Rs35,000 over the past one year Provides exposure against scrap value of gold jewellery arrived after making various deductions
Catering to individual customers requiring short-term loans Individuals such as traders, merchants, small enterprise owners, self-employed/professionals, farmers, etc are the typical gold loan customers of Manappuram. They do not borrow for planned expenditures but rather for an emergency or funding a cash flow mismatch (bridge financing). These customers prefer NBFCs such as Manappuram due to near access, lesser formalities/procedures, no processing charges and faster turnaround time. Company’s average loan disbursal time is 15 minutes for a new customer and 7-8 minutes for an existing customer as KYC takes about 5 minutes. This is in comparison to 1-2 days for commercial and cooperative banks. Lower turnaround time is a critical advantage is this business as most customers want money immediately. Company’s branches next to banks such as IOB, Indian Bank, SIB and Federal Bank offering materially lower interest rates (8-12%) has been able to attract significantly higher number of customers.
Though loans are provided for standard one year tenure (promissory note is signed for one year), the average duration is actually much shorter at near 4 months as these loans are essentially taken to manage transient cash flow issues. Borrowers have the option to settle the loan whenever they want (not even one-day lock-in) and the interest is charged only for that period. Further, there is no pre-payment fee. After closing the old loan, the same customer may return to take a new loan after few months. Interest is serviced either monthly or quarterly depending on duration of the loan.
With decades of presence, extensive branch network and endorsements by multiple well-known celebrities, Manappuram enjoys a strong brand recall and trust. The average ticket size of loan has increased from Rs27,000 to Rs35,000 over the past one year. Presently, company witnesses an average 25,000 customer visits daily across its ~2,300 branches (more than 10 customers/branch). Provides exposure against scrap value of the gold jewelry Manappuram accepts only household used jewelry and gold coins as security. For jewelry, the scrap value of gold arrived at after making various deductions is used as base for lending exposure. Conversely, a gold jewelry worth Rs100 (buying price) for the borrower is not of the same value for the company as making charges, value of studded stones/diamonds, carving/shouldering expenses, costs involved in selling (in case of payment default) needs to be adjusted. As per the company, the scrap value for offering exposure is typically 80-85% of customer value. The gold appraisers at the branches are thoroughly trained in gold appraisal methods. Several tests are performed for checking spurious gold such as touchstone test, nitric acid test, sound test and hallmark confirmation.
Manappuram General Finance & Leasing Ltd
Sector Report 22
Interest rate varies in the range of 12-24% determined by weight/purity of gold and exposure taken System throws up 3 to 4 LTV options with associated interest rates 85-90% of borrowers choose the highest LTV option that attracts interest of 24% Gold does not travel more than 2-3km Company has not only increased penetration in South bus also aggressively expanded in other regions Each branch of the company has seven employees Average size of branch is 700-800 sqft and cost of setting-up is Rs0.7-0.8mn Branch breakeven happens when AUM reaches Rs12-13mn which typically takes less than one year’s time
Interest rate charged are higher than banks but lower than money lenders Typically, the interest rate on the loan varies in the range of 12-24% mainly determined by weight/purity of gold and exposure taken. The determination of interest rate is software (program) driven and not ad hoc or at the discretion of appraiser who is just responsible for appraising the gold for its purity and weight. The latter details are fed in the system which throws up 3 to 4 LTV (loan-to-value) options with associated interest rates. The top end of the interest rate range is charged for highest LTVs, generally 75-77% of the scrap value. The lowest 12% interest is charged only for combination of 24 carat gold and low (40-50%) LTV. As per the company, 85-90% of borrowers choose the highest LTV option that attracts interest of 24%. The residual customers choose lower LTV (40-60%) attracting lower interest rates of 12-18%. However, the average duration of lower LTV loans is significantly shorter than higher LTV loans. Interest rate contracted on a loan is not altered later if the cost of funds increases. Extensive branch network is at the heart of the business In the gold loans business, being near to the customer is extremely important as gold does not travel more than 2-3km. In few Southern states, Manappuram’s branches are at an average distance of 2-3km from each other. With higher availability of funds (via QIP issuances and promoter fund infusion) over the past couple of years, company has not only increased penetration in the Southern states bus also aggressively expanded in other three regions. Currently, which is the largest gold loan market accounting for 40-45% of the country’s gold stock. Operating cost dynamics – Branch breakeven at Rs12-14mn AUM Each branch of the company has seven employees – Branch Head, Assistant Branch Head, Two Appraisers (GL1 and GL2), Cashier, Security and House Keeper. The average size of the branch is 700-800 sqft and the cost of setting-up is Rs0.7-0.8mn mainly comprising four computers, furniture, safe room/strong room (made as per RBI norms for Banks) and security systems (IP cameras, burglar alarm of three categories, etc). The monthly running cost of a branch (pre-dominantly salaries and rental) is ~Rs150,000 in rural and semi-urban areas and ~Rs175,000 in urban areas (higher rentals). Two different keys are required for opening the safe/strong room – one is with the Branch Head and the other with Assistant Branch Head. Company undertakes theft insurance of all the Gold stock across its branches. For a branch to breakeven, its AUM has to reach Rs12-14mn which typically takes less than one year’s time.
Manappuram General Finance & Leasing Ltd
Sector Report 23
Manappuram has significantly outperformed industry growth over FY07-11 Expect exceptional growth momentum to moderate significantly over FY11-13 Management expects 50-60% growth over the next two years Bulk of growth to come from substantial uptick in productivity of new branches Material improvement in AUM/Branch from Rs36mn at end-FY11 to Rs55mn at end-FY13
AUM to witness 45% CAGR over FY11-13E; newly opened branches to drive growth Organized gold loan market has grown by more than 40% pa over FY07-11. Manappuram, driven by management aggression and aided by significant capital raising has grown at far superior rate of 109% albeit on a low base. We expect the exceptional growth momentum to moderate significantly over FY11-13 to 45% as penetration and competition has increased significantly in South (especially Kerala) while other regions may take some time for a full-fledged adoption of gold loan product. However, such growth would still be commendable on the existing higher base. Our growth forecast for the company is conservative than Management’s expectation of 50-60% growth over the next two years. Organized gold loan market is likely to grow by 35-40%. With Manappuram having more than doubled its branch network in FY11 (added 1,059 branches), bulk of the anticipated growth would come from substantial uptick in productivity of the new branches. The new branches which were average 6-month old had an average AUM/Branch of ~Rs8mn at the end of FY11 as compared to ~Rs67mn for old branches. As such, we expect a material improvement in AUM/Branch from Rs36mn at end-FY11 to Rs55mn at end-FY13. It also factors a relatively modest branch addition of 400 each in FY12 and FY13, as indicated by the company. About 70% of the new branches would come in North, West and East regions.
AUM to witness 45% CAGR over FY11-13E Branch expansion to be relatively modest
0
30
60
90
120
150
180
FY08 FY09 FY10 FY11 FY12E FY13E
(Rs bn)
0
200
400
600
800
1,000
1,200
FY09 FY10 FY11 FY12E FY13E
(no)
Source: Company, India Infoline Research
Branch vintage and AUM AUM/Branch to increase significantly
0
20
40
60
80
100
120
In FY11 In FY10 In FY09 In FY08 In FY07 In FY06 TillFY05
(Rs mn)
0
10
20
30
40
50
60
FY09 FY10 FY11 FY12E FY13E
(Rs mn)
Source: Company, India Infoline Research
Manappuram General Finance & Leasing Ltd
Sector Report 24
On-balance sheet loans to witness a higher 57% CAGR in the absence of assignments Year-end assignments have registered 42% CAGR over FY08-11 With robust 30% CAR, company does not foresee any need for new assignments
Entire growth to reflect on balance sheet in the absence of assignments While the AUM is expected to witness 45% CAGR over FY11-13, net loans (on balance sheet) would witness a higher 57% CAGR in the absence of any loan assignments in future. Under loan assignments, Manappuram would assign (sell) a portion of its gold loan portfolio to banks in return for an instant drawdown (generally 95-100% exposure given) under the existing working capital limit at a lower rate (typically 100-125bps cheaper than other borrowings). As the gold loans purchased could be categorized as priority sector lending under the agriculture advance category, assignments were attractive for banks despite offering subsidized interest rate. Year-end assignments have registered 42% CAGR over FY08-11; however declining significantly as a proportion of AUM from 68% to 15% over the period. Through a circular dated February 2nd 2011, RBI disallowed banks from classifying purchased/assigned gold loans as priority sector lending under the agriculture advance category. Since then, banks are not offering lower interest on assignments and Manappuram is not keen on selling its portfolio without interest benefit. Outstanding loan assignments fell by 22% during Q4 FY11 to stand at Rs11.2bn at the end of the year. These loans are maturing over the next 4-5 months. With robust 30% CAR, company does not foresee any need for new assignments in the medium term. We have taken year-end assignments as zero for FY12 and FY13 in our model. As per the management, the need for assignments would only arise when CAR dips below 18% and company not choosing to raise equity capital.
Assignments have been a critical part of the business
Net loan book to witness a faster 65% CAGR over FY11-13E
0.0
2.0
4.0
6.0
8.0
10.0
12.0
FY07 FY08 FY09 FY10 FY11
(Rs bn)
0
30
60
90
120
150
180
FY08 FY09 FY10 FY11 FY12E FY13E
(Rs bn)
AUM Net Loans
Source: Company, India Infoline Research
Manappuram General Finance & Leasing Ltd
Sector Report 25
Absence of assignments is unlikely to act as a constraint on AUM growth Bank borrowings form a substantial portion of company’s total borrowings Borrowing mix to shift significantly towards NCDs and CPs in future Recently, company announced its maiden retail NCD issue of Rs7.5-10bn
Assignments to not impact availability of funds The absence of assignments is unlikely to act as a constraint for robust AUM growth. As per the understanding given by the company, assignments were a part of the original credit limit extended by banks and at the requirement of either the company or the bank assignments were worked out. So non-attractiveness of assignments post the RBI disqualification from PSL has not impacted availability of funds from banks. Rather, banks are offering significantly higher credit limits yoy to Manappuram. The credit limit outstanding stands near Rs50bn spread across more than 25 banks. Company has enjoyed high credit rating and recently its long term rating was upgraded from LA+ to LAA- by CARE. The latest short-term debt raising programme was rated P1+ by Crisil and A1+ by ICRA. Significant reliance on short-term funds; funding mix to move towards NCDs and CPs With Manappuram essentially into short-term lending with average duration of loans at less than four months, company is heavily reliant on wholesale funding. Bank borrowings (Cash Credit facility and 1-year working capital loans) form a substantial part of the total borrowings of the company with 56% share. Commercial Papers having average maturity of 5 months are the second largest source of funding with 15% contribution. The share of retail non-convertible debentures (NCDs) privately placed to customers visiting branches having maturity of 1-3 years is ~7-8%. Subordinated debt qualifying for Tier-2 capital with maturity of five years is 4-5% of total borrowings. Assignments were 16-17% of borrowings as at FY11-end. In the absence of assignments in future, we expect the borrowing mix to significantly skew towards NCDs and CPs. Their share in the Total Assets (including Assignments) funding is estimated to increase from 6% and 12% respectively in FY11 to 10% and 21% respectively in FY13. Recently, company announced its maiden retail NCD issue of Rs7.5-10bn.
Borrowing profile as at FY11-end Total asset (incl. assignments) funding mix trend
56%
17%
15%
4% 7%1%
Retail NCD Banks Borrow ings Assignments
CP Bonds Others
0.0%
20.0%
40.0%
60.0%
80.0%
100.0%
FY08 FY09 FY10 FY11 FY12E FY13E
Ow ned Funds Bank Borr Retail NCD Bonds
CP Others Assignments
Source: Company, India Infoline Research
Manappuram General Finance & Leasing Ltd
Sector Report 26
In Q4 FY11, cost of borrowings increased by 80bps qoq Company expects a considerable spike of 150-200 bps qoq in Q1 FY12
Current loan yield materially higher than Muthoot, a like-to-like competitor Intensying compettion to pressurize loan yields NIM to fall from 16.7% in FY11 to 13.1% in FY13
Cost of funds has increased materially in the recent past Manappuram’s cost of borrowing is expected to spike-up during Q1 FY12 impacted by 1) loss of PSL status on bank funding against assignments (interest rate to increase 100-125bps) 2) material hike in bank lending rates (other borrowings linked to either Base Rate or PLR) and 3) significant increase in CP rates due to tight liquidity. Company’s reliance on bank borrowings, assignments and CPs is substantial with these sources combined comprising ~88% of total borrowings as at the end-FY11. During Q4 FY11, Manappuram witnessed 80bps qoq increase in its cost of borrowings to 10%. In Q1 FY12, company expects a considerable spike of 150-200 bps. We expect the cost of borrowings to further increase (though not significantly) in Q2 FY12 as interest rate are likely to remain firm and liquidity may remain tight for some time. In our view, the full-year borrowing cost would likely be higher by 150bps yoy.
Yields may weaken; NIM to contract significantly Current loan yield at ~24% is not only substantially higher than interest charged by commercial and co-operative banks but also materially elevated than Muthoot, a like-to-like competitor. Increasing competition in Southern region could push company’s yield lower in the medium term. We have assumed a decline of 250-300bps in loan yield over FY11-13. This is in contrast to the management’s expectation of steady loan yield near 24%. A weakening yield and higher cost of funds would drive a significant correction in NIM. We estimate Manappuram’s margin to correct by more than 350bps over the next two years. NIM would fall from 16.7% in FY11 to 13.1% in FY13. The key upside risk to our margin assumption for FY13 would be a sharp reversal in interest rate cycle.
Quarterly cost of borrowings (reported) Annual cost of borrowings (calculated)
7.0
8.0
9.0
10.0
11.0
12.0
13.0
Q2FY10
Q3FY10
Q4FY10
Q1FY11
Q2FY11
Q3FY11
Q4FY11
(%)
6.0
7.0
8.0
9.0
10.0
11.0
12.0
FY08 FY09 FY10 FY11 FY12E FY13E
(%)
Source: Company, India Infoline Research
Manappuram General Finance & Leasing Ltd
Sector Report 27
Added 1,059 branches during FY11 more than doubling its network Advertising exp has risen from Rs8mn in FY09 to Rs1.04bn in FY11 Improvement in branch productivity and lower advertising exp to drive operating leverage Opex/avg assets ratio to decline from 7% in FY11 to 5.5% in FY13
Substantial operating leverage to kick in as branch productivity improves considerably Aided by Rs10bn raised via QIP, Manappuram added 1,059 branches during FY11 more than doubling its network. Company has also been on an aggressive marketing spree to improve brand recognition and enhance awareness of gold loan product. Manappuram has signed various regional film superstars for promotion through television ad campaign. Resultantly, advertising expenditure of the company has risen from an abysmal Rs8mn in FY09 to Rs1.04bn in FY11.
Bulk of the anticipated business growth in the next two years is expected to come from significant improvement in productivity of the new branches. Also, branch addition plans for FY12 and FY13 are relatively modest at 400 branches pa. As such, we expect a material improvement in AUM/Branch from Rs36mn at end-FY11 to Rs55mn at end-FY13. Advertising expenditure is unlikely to jump substantially with company having already established its brand. Management, in fact, expects lower advertisement expenditure in FY12. Improvement in capacity utilization and restrained advertisement expenditure would drive substantial operating leverage over the next two years. We estimate opex/average assets ratio to decline considerably from 7% in FY11 to 5.5% in FY13.
Yield on AUM to decline in the medium term NIM to witness a sharp correction
12.0
15.0
18.0
21.0
24.0
27.0
30.0
FY08 FY09 FY10 FY11 FY12E FY13E
(%)
8.0
10.0
12.0
14.0
16.0
18.0
20.0
FY08 FY09 FY10 FY11 FY12E FY13E
(%)
Source: Company, India Infoline Research
Substantial leverage would come from Advertising and other opex
Opex/Avg. Assets to decline considerably
0.0
0.5
1.0
1.5
2.0
2.5
3.0
3.5
FY08 FY09 FY10 FY11 FY12E FY13E
(% of Avg Assets)
Staff Rent Advt Other Opex
3.0
4.0
5.0
6.0
7.0
8.0
9.0
FY08 FY09 FY10 FY11 FY12E FY13E
(%)
Source: Company, India Infoline Research
Manappuram General Finance & Leasing Ltd
Sector Report 28
CAR stood at robust 30.5% at end-FY11 significantly augmented by the QIP issue Further equity issuance unlikely till end-FY13
Negligible NPLs in the gold loan business In the third month post default, gold jewelry is auctioned for recovery of the loan In Q3 FY11, RBI advocated provisioning of 0.25% for standard gold loans Company has substantially provided against the legacy business NPLs
Robust capital adequacy to support growth; no need for equity fund raising till FY13E Manappuram’s CAR stood at robust 30.5% as at the end of FY11, substantially higher than regulatory floor of 15%. Capital adequacy of the company was significantly augmented by the Rs10bn QIP issue in November 2010. As per management, need for raising equity capital would arise only when CAR dives below 18%. Based on our AUM growth assumption and anticipated substantial plough backs, we do not foresee any urgent need of equity fund raising for Manappuram till end-FY13. We estimate CAR at 21.7% for FY12-end and 19% for FY13-end.
Asset quality has been impressive; NPLs to remain stable Manappuram has negligible 0.2% GNPL and 0.1% NNPL in the gold loan business. The probability of default is relatively low as the gold jewelry pledged has high sentimental value for the borrower. In case of default on repayment, company sends three repayment notices in the subsequent two months (last notice would contain intimation of jewelry action). In the third month post default, gold jewelry is auctioned for recovery of the loan. Loans outstanding for more than 180 days from repayment date are classified as NPLs. So NPLs would be recognized only in cases where the pledged gold jewelry could not be sold due to some reasons between the 3rd and 6th month from repayment date. During Q3 FY11, RBI advocated provisioning of 0.25% for standard gold loans, which was earlier not there. Provisioning for sub-standard loans is 10% and doubtful loans is 50-100%. Overall GNPL% of the company has declined significantly over the past three years in-line with conscious ramp down of the hypothecation (vehicle) loan portfolio and exceptional growth in gold loan book. By FY11, Manappuram had substantially provided against the hypothecation loan NPLs and only marginal provisioning remains. We forecast stable asset quality and credit charge in FY12 and FY13.
Plough backs would be substantial in FY12E and FY13E
Capital adequacy to remain comfortably above the regulatory requirements
0.0
1.0
2.0
3.0
4.0
5.0
6.0
FY08 FY09 FY10 FY11 FY12E FY13E
(Rs bn)
5.0
10.0
15.0
20.0
25.0
30.0
35.0
FY09 FY10 FY11 FY12E FY13E
(%)
CAR Tier-1
Source: Company, India Infoline Research
Manappuram General Finance & Leasing Ltd
Sector Report 29
Higher profitability driven by exceptional NIM and negligible NPLs RoA to trend down due to margin contraction while RoE to improve on increasing leverage
RoA to come-off but remain stunning; RoE to rise on improving leverage As compared to banks and most NBFCs, Manappuram’s RoA is significantly superior at near 5%. Higher return has been driven by exceptional NIM, lower operating cost and negligible NPLs. While NIM is expected to correct materially over FY11-13, substantial operating leverage should cushion its impact on RoA. Also, NPL provisioning is unlikely to witness a spike in the light of stable asset quality. Overall, we believe RoA would trend down from 4.8% in FY11 to 4.2% in FY13, still remaining impressive both in absolute and relative terms. RoE, on the other hand, is estimated to improve to 24% in FY13 from 22% in FY11 driven by increasing leverage. Further, our business growth and profitability projections suggest that Manappuram may not require any equity fund raising in the next two years.
Asset quality would continue to be robust Prov/Avg. loans to be marginal
0.0
0.5
1.0
1.5
2.0
2.5
3.0
FY08 FY09 FY10 FY11 FY12E FY13E
(%)
GNPL NNPL
0.0
0.2
0.3
0.5
0.6
0.8
0.9
FY08 FY09 FY10 FY11 FY12E FY13E
(%)
Source: Company, India Infoline Research
PAT/AUM % to decline lower than NIM aided by operating leverage
RoA to trend down impacted by NIM correction
2.0
3.0
4.0
5.0
6.0
7.0
8.0
FY08 FY09 FY10 FY11 FY12E FY13E
(%)
3.0
3.5
4.0
4.5
5.0
5.5
6.0
FY08 FY09 FY10 FY11 FY12E FY13E
(%)
Source: Company, India Infoline Research
Manappuram General Finance & Leasing Ltd
Sector Report 30
Post QIP, underperformance to Bankex has been glaring Estimate robust 47% earnings CAGR over FY11-13 BUY with a 9-month target of Rs73
RoE to improve on increasing leverage
0.0
6.0
12.0
18.0
24.0
30.0
36.0
FY08 FY09 FY10 FY11 FY12E FY13E
(%)
0.0
1.0
2.0
3.0
4.0
5.0
6.0(x)
RoE Leverage
Source: World Gold Council and IMaCS Steep price correction post QIP; valuation cheap given growth and profitability profile Post the QIP issue in November 2010 at Rs84 (adjusted for recent 1:1 bonus), Manappuram has witnessed a significant price correction of 32%. The underperformance to Bankex has been glaring at 22% since then. Concerns with respect to increasing cost of funding (due to loss of PSL status for assignments and higher bank lending/CP rates) and potential regulations with respect to interest rate and margin have weighed heavily on company’s valuation. Despite being conservative than management in our growth and margin assumptions, we estimate robust 47% earnings CAGR over FY11-13. We have not factored any regulation changes in our projections as it is difficult to anticipate. We initiate coverage on Manappuram with a BUY rating and 9-month target of Rs73 (valued at 2.2x FY13 P/BV).
Manappuram General Finance & Leasing Ltd
Sector Report 31
Financials
Income statement Y/e 31 Mar (Rs m) FY10 FY11E FY12E FY13E
Interest income 4,675 11,634 21,013 29,277 Interest expense (1,305) (3,157) (7,707) (11,542) Net int income 3,371 8,477 13,306 17,736 Non-int income 42 18 19 19 Total op income 3,413 8,496 13,325 17,755 Total op expenses (1,506) (4,123) (6,157) (8,068) Op prof (pre-prov) 1,907 4,373 7,168 9,687 Provisions (89) (134) (352) (435) Profit before tax 1,818 4,239 6,816 9,252 Taxes (621) (1,412) (2,317) (3,146) Net profit 1,197 2,827 4,498 6,106
Balance sheet Y/e 31 Mar (Rs m) FY10 FY11E FY12E FY13EFixed assets 535 1,388 1,517 1,610 Intangible assets 34 60 60 60 Investments 1,407 403 403 403 Net loans 18,694 63,670 112,235 157,120 Net Current Assets 3,759 10,171 8,317 9,209 Def Tax Asset (Net) 33 87 87 87
Total assets 24,462 75,779 122,620 168,488 Net worth 6,106 19,240 22,762 27,649 Secured loans 16,501 43,724 71,037 101,001 Unsecured loans 1,856 12,817 28,821 39,838 Total liabilities 18,357 56,541 99,858 140,839 Equity + Total liabilities 24,462 75,780 122,620 168,488
Key ratios
Y/e 31 Mar FY10 FY11E FY12E FY13EGrowth matrix (%) Net interest income 174.3 151.5 57.0 33.3 Total op income 167.6 148.9 56.8 33.2 Op profit (pre-provision) 264.5 129.3 63.9 35.1 Net profit 295.2 136.1 59.1 35.7 Loans 323.7 240.6 76.3 40.0 Borrowings 307.4 208.0 76.6 41.0 Total assets 295.5 209.8 61.8 37.4 Profitability Ratios (%) NIM 18.8 16.7 14.1 13.1 Return on Avg Equity 30.8 22.3 21.4 24.2 Return on Avg Assets 5.6 4.8 4.3 4.2 Per share ratios (Rs) EPS 3.5 3.4 5.4 7.3 BVPS 17.9 23.1 27.3 33.2 DPS 0.5 0.6 1.0 1.3 Other key ratios (%) Loans/Borrowings 101.8 112.6 112.4 111.6 Opex /Avg. Assets 7.0 7.0 5.9 5.5 CAR 31.0 30.5 21.7 19.0 Tier-I capital 26.1 26.7 18.6 16.2 Gross NPLs/Loans 1.3 0.4 0.3 0.3 Total prov/Avg loans 0.5 0.3 0.4 0.3 Net NPLs/Net loans 0.6 0.1 0.1 0.1 Tax rate 34.2 33.3 34.0 34.0 Dividend yield 1.8 2.1 1.8 2.2
Recommendation parameters for fundamental reports:
Buy – Absolute return of over +10%
Market Performer – Absolute return between -10% to +10%
IIFL, IIFL Centre, Kamala City, Senapati Bapat Marg, Lower Parel (W), Mumbai 400 013. For Research related queries, write to: Amar Ambani, Head of Research at [email protected] or [email protected] For Sales and Account related information, write to customer care: [email protected] or call on 91-44 4007 1000