Sector: Mid Caps Sector view: Positive Sensex: 19,684 52 Week h/l (Rs): 578 / 330 Market cap (Rscr) : 1,485 6m Avg vol (‘000Nos): 45 Bloomberg code: VATW IN BSE code: 533269 NSE code: WABAG FV (Re): 2 Price as on Jan 10, 2012 Company rating grid Low High 1 2 3 4 5 Earnings Growth Cash Flow B/S Strength Valuation appeal Risk Share price trend 70 90 110 130 150 170 Jan‐12 May‐12 Sep‐12 Jan‐13 VA Tech Sensex Share holding pattern - 20 40 60 80 100 Dec-11 M ar-12 Jun-12 Sep-12 Promoters Institutions Others % Rating: BUY Target (9‐12 months): Rs735 CMP: Rs560 Upside: 31.2% Company Report January 11, 2013 Research Analyst: Kalpit Oza [email protected]Initiating Coverage VA Tech Wabag Secular play Investment into water management technology is the need of the hour. Globally, water is scarce and rising demand fueled by growing population and higher urbanization will make it even scarcer. The situation is aggravated with unequal distribution of water resources; India constitutes 17% of world population and a mere 4% of the total water resources. VA Tech Wabag (VA Tech), the largest player in water management space in India, could be a key beneficiary of any jump in investment in this segment. We believe VA Tech’s leadership in the domestic market is backed by three vital factors: 1) its ability to provide comprehensive range of services across the life cycle of project, 2) use of advance technology, through its R&D centres and patents which it owns, (differentiates the company as water management projects are technically complex) and 3) strong execution track and brand recognition with established relationships with key clients. Healthy order book at Rs42bn (2.9x FY12 revenues) provides strong revenue growth visibility. Diversification of its order book, both on geographical and segmental basis, aids in reduction of the dependency risk. Further, increase in share of O&M orders provides steady cash flow visibility. We expect robust order book for the company to translate into 16% revenue CAGR over FY12‐15E. OPM is expected to expand by 120bps over FY12‐15E led by higher contribution from high margin O&M segment and cost reduction in global operations. The company has a strong balance sheet with a large cash balance of Rs2.9bn (~20% of market cap) and strategy of staying asset light has resulted into healthy return ratios (avg. ROIC of 46% over FY09‐12). VA Tech plans to use the cash for an acquisition, which could be a key trigger for the stock in the medium term. Premium valuations for VA Tech against infra companies, we believe, is justified considering secular growth potential and sound fundamentals of the company. We assign a P/E of 14x to FY15E EPS to arrive at a 9‐12‐month target price of Rs735. Initiate with BUY. Financial summary (consolidated) Y/e 31 Mar (Rs m) FY12 FY13E FY14E FY15E Revenues 14,435 16,851 19,529 22,272 yoy growth (%) 16.2 16.7 15.9 14.0 Operating profit 1,300 1,685 1,972 2,272 OPM (%) 9.0 10.0 10.1 10.2 Reported PAT 738 985 1,199 1,391 yoy growth (%) 40.2 33.6 21.7 16.0 EPS (Rs) 27.8 37.2 45.2 52.5 P/E (x) 20.0 15.0 12.3 10.6 Price/Book (x) 2.3 2.1 1.8 1.6 EV/EBITDA (x) 9.2 6.1 5.3 4.0 Debt/Equity (x) 0.2 0.1 0.1 0.1 RoE (%) 12.2 14.5 15.7 16.2 RoCE (%) 17.6 20.7 22.9 23.6 Source: Company, India Infoline Research
Investment into water management technology is the need of the hour. Globally, water is scarce and rising demand fueled by growing population and higher urbanization will make it even scarcer. The situation is aggravated with unequal distribution of water resources; India constitutes 17% of world population and a mere 4% of the total water resources. VA Tech Wabag (VA Tech), the largest player in water management space in India, could be a key beneficiary of any jump in investment in this segment. We believe VA Tech’s leadership in the domestic market is backed by three vital factors: 1) its ability to provide comprehensive range of services across the life cycle of project, 2) use of advance technology, through its R&D centres and patents which it owns, (differentiates the company as water management projects are technically complex) and 3) strong execution track and brand recognition with established relationships with key clients. Healthy order book at Rs42bn (2.9x FY12 revenues) provides strong revenue growth visibility. Diversification of its order book, both on geographical and segmental basis, aids in reduction of the dependency risk. Further, increase in share of O&M orders provides steady cash flow visibility. We expect robust order book for the company to translate into 16% revenue CAGR over FY12‐15E. OPM is expected to expand by 120bps over FY12‐15E led by higher contribution from high margin O&M segment and cost reduction in global operations. The company has a strong balance sheet with a large cash balance of Rs2.9bn (~20% of market cap) and strategy of staying asset light has resulted into healthy return ratios (avg. ROIC of 46% over FY09‐12). VA Tech plans to use the cash for an acquisition, which could be a key trigger for the stock in the medium term. Premium valuations for VA Tech against infra companies, we believe, is justified considering secular growth potential and sound fundamentals of the company. We assign a P/E of 14x to FY15E EPS to arrive at a 9‐12‐month target price of Rs735. Initiate with BUY. Financial summary (consolidated) Y/e 31 Mar (Rs m) FY12 FY13E FY14E FY15E
Revenues 14,435 16,851 19,529 22,272
yoy growth (%) 16.2 16.7 15.9 14.0
Operating profit 1,300 1,685 1,972 2,272
OPM (%) 9.0 10.0 10.1 10.2
Reported PAT 738 985 1,199 1,391
yoy growth (%) 40.2 33.6 21.7 16.0
EPS (Rs) 27.8 37.2 45.2 52.5
P/E (x) 20.0 15.0 12.3 10.6
Price/Book (x) 2.3 2.1 1.8 1.6
EV/EBITDA (x) 9.2 6.1 5.3 4.0
Debt/Equity (x) 0.2 0.1 0.1 0.1
RoE (%) 12.2 14.5 15.7 16.2
RoCE (%) 17.6 20.7 22.9 23.6 Source: Company, India Infoline Research
VA Tech Wabag
2
Water is scarce and will grow scarcer Globally, factors like population growth, increasing amount of water drawn for farming and irrigation and rising urbanization are driving demand for water each year. Meeting this growing demand would be a big challenge considering finite and fix supply of water. While 70% of the earth surface is covered by water, most of this surface (~97.5) is sea, and water below it is salty. Of the remaining 2.5% of water that is not salty, about ~70% is frozen either at the poles, in glaciers or in permafrost. This leaves only 0.76% of the total water resources accessible and usable. The crisis is worsened with unequal distribution of water resources. Just nine countries account for 60% of all available fresh supplies and among them only Brazil, Canada, Colombia, Congo, Indonesia and Russia have abundance. America is relatively well off, but China and India, with over a third of the world's population between them, have less than 10% of its water. Water scarcity looms large
Source: Company Unequal distribution of water resources
0
10
20
30
40
50
60
70
North &
Centra l
America
Europe As ia South
America
Africa Austra l ia &
Oceania
% of globa l population % of globa l ava i lable fresh water resources
(%)
Source: Company, India Infoline Research
Multiple factors viz. population growth, rising urbanization, etc are driving demand for water with finite supply. This has resulted into water scarcity and it is expected to get worse in future
Unequal distribution of water worsens the water crisis with only 9 countries accounting for 60% of the available water resources
Out of the total global water reserves of 1.4 Bn Cu Kms, only 0.76%* of the water is most easily accessible & used source of water
VA Tech Wabag
3
Fast track investment is the need of the hour; VA Tech well placed As scarcity of water gets more acute, investment in water management technology will be the need of the hour. While globally the water scarcity concern remains, India faces even tougher challenges with 17% of world population and paltry 4% of the total water resources. The document for the twelfth plan cites the urgent need to improve the efficiency in the use of water resource. VA Tech Wabag (VA Tech), being one of the largest player in the water management technology space, is set to capture the benefits of jump in investment into water management technology. The HI business, accounting for 45% of domestic revenues and growing at ~16% revenue CAGR over the past three years is the most value‐accretive business
As scarcity of water gets more acute, investment in water management technology will be the need of the hour. VA Tech is well placed to capitalize on the opportunity
Excerpts from the approach paper of Twelfth Five Year Plan (2012‐17) Management of water resources poses increasingly difficult challenges that will require attention in the Twelfth Plan. The total quantity of usable fresh water annually available in India is fixed, but its demand from expanding agriculture and other sectors is increasing. Water resources in many parts of the country are under severe stress leading to excessive exploitation of ground water. There is some scope for increasing water availability. While these opportunities must be fully exploited, the real solution has to come from greater efficiency in water use.
Agriculture accounts for 80% of water needs at present, and there is considerable scope for increasing efficiency of water use in this area. This requires better management of water in areas of large and medium irrigation projects. It also requires putting in place more holistic aquifer management strategies. Separation of electricity feeders for agriculture and domestic use can help limit the availability of electricity for pumping ground water thus breaking the vicious cycle between free energy and excess use of groundwater. Wherever this has been done in combination with large‐scale watershed programmes, there is evidence that groundwater levels have recovered.
Normally, efficient use of scarce resources requires appropriate pricing, but pricing of water is a sensitive issue. This problem can be solved by providing ‘lifeline’ water supplies for drinking and cooking at very low prices, while charging appropriately for additional water use by domestic consumers. There is a stronger case for rational pricing reflecting the scarcity of water for commercial and industrial use. There is also a strong case for rational pricing of water for agricultural purposes. The proportion of water recycled in urban areas, and by Indian industry needs to be significantly increased. This will happens if supply for commercial purposes is appropriately priced.
Even if we succeed in bringing about a major rationalization of water prices, by itself, it will not lead to optimal use. For this, a rational pricing must be accompanied by regulatory measures to ration water to different agricultural users, and stronger measures to discourage pollution. Contamination of drinking water is the principal cause of health disorders, particularly amongst children. It is estimated that up to 13% of drinking water in rural areas contains chemical contaminants including fertilizer run‐offs (particularly urea and its decomposition products).
VA Tech Wabag
4
VA Tech’s leadership; backed by multiple advantages VA Tech is the market leader in domestic water solution provider market. Its leadership is backed by a) use of advanced technology with R&D centers located in India and across various other countries, b) strong execution track record c) presence across life cycle of the project and d) brand recognition VA Tech offers a comprehensive range of services across the value chain from conceptualization, design, installation, construction to Operate & Maintain (O&M) support. Projects are executed on turnkey or item rate basis and the company’s principal expertise is technology, while outsourcing the civil construction work of the project. In India, water solutions market is broadly divided into two categories, Municipal and Industrial. Within Municipal segment contracts are awarded for a) high technology drinking water solutions and b) waste water treatment. Under Industrial segment contracts are awarded to a) build affluent treatment plant and b) build plants wherein water is used as feedstock. VA Tech is present across the entire spectrum of services while most of the peer companies are present in one or few segments. The company’s ability to bid for projects across the entire value chain attracts more clients thereby limiting competition and reduces concentration risk in terms of clientele. The designing and engineering in the water treatment segment is technically complex. Most of the peer companies do not own advanced technology offerings that differentiate the top players. VA Tech, through its R&D centres in India, Austria and Switzerland and the patents that it owns, has a technology expertise in the execution of water management project. Further through strong execution track record and brand recognition the company has established strong relationship with key clients. These factors augur well for order inflow prospects both from new clients and repeat orders from the existing clients. VA Tech is present in all the segments of domestic water market
Domestic Water Market
Municipal Industrial
Drinking Water Waste Water
Treatment
Affluent
Treatment Plant
Water as
Feedstock
VA Tech wabag is present across
all the segments
Source: Company, India Infoline Research
VA Tech is the market leader in domestic market with strong execution track record, presence in the entire life cycle of the project and solid brand recognition Indian water market is broadly divided in two categories: a) Muncipal and b) Industrial. Unlike most other players who are present in just one or few of the segments in water project management, VA Tech is present in all the segments and that increases its ability to bid for the project Designing in water treatment segment is technically complex. VA Tech through its R&D centers and patents that it owns has technology expertise in execution
VA Tech Wabag
5
Segmental break up for order book (FY12) Geographical break up for order book (FY12)
81%
19%
Muncipal
Industrial
34%
66%
India
Overseas
Source: Company, India Infoline Research
Share of O&M in the domestic order book has increased significantly over the past 5 years
…. bulk of O&M orders are awarded by municipal segment (O&M order book break up for FY12)
‐
20
40
60
80
100
FY07 FY08 FY09 FY10 FY11 FY12
O&M EPC(%)
95%
5%
- Muncipal
- Industrial
Source: Company, India Infoline Research
Diversification in order book to improve revenue profile VA Tech provides water solutions primarily to Industrial and municipal sector undertaking projects on EPC and O&M basis. The current order book for the company stands at ~Rs42bn (2.8x FY12 revenues), which provides strong revenue visibility for the next two years. It has managed to mellow down its dependency risk through geographical and segmental diversification of order book. On Segmental basis, municipal segment accounts for 81% of the overall order book at the end of FY12 and industrial segment contributed 19%. Geographically, overseas orders account for 35% of the overall order book at the end of FY12. Diversifying geographically also facilitates the company in capturing growth opportunities arising in the emerging overseas market.
Order book for domestic operations has registered robust 30% CAGR over the past 5 years primarily driven by strong growth in the orders from O&M segment. This has resulted into O&M’s share rising to 44% currently from ~15% in FY07. Chunk of the O&M orders are awarded by the Municipal sector. Average ticket size of an O&M contract is generally smaller (Rs500mn) than EPC contract (Rs1bn). Larger execution period for O&M contracts (~5‐7 years) than EPC (execution cycle of 12‐18 months) reduces volatility in revenues for the company. That apart, margins in O&M contracts are ~500bps higher than EPC contracts.
VA Tech has a strong and well diversified order book,, providing revenue growth visibility for the next three years
The share of high margin O&M segment vis‐avis EPC segment has increased over the years and we expect the trend to continue going forward
VA Tech Wabag
6
Global Slowdown has resulted into sluggish order inflows overseas reflected in declining share
Overseas order book break up
‐
20
40
60
80
100
FY07 FY08 FY09 FY10 FY11 FY12
India Overseas(%)
15%
4%
61%
9%
11%Austria
Czech
Romania
Swiss
Others
Source: Company, India Infoline Research
Over the years, VA Tech has forayed into various foreign countries including the Philippines and Sri Lanka, along with inroads to other emerging markets such as China. Recently, the company has won a large order in Oman in JV with Sumitomo. Overall size of the order stands at ~US$350mn, of which VA Tech along with two other partners would undertake the EPC contract worth ~US$250mn and Sumitomo would undertake the O&M contract. Sharp slowdown led by global financial crisis has slackened growth (7% CAGR over FY07‐12) in the order book from the overseas market. Concomitantly, share of overseas orders declined to 33% currently from 43% in FY08. In the international market, 11% CAGR over FY07‐12 in EPC orders was offset by 5% decline in the order book of O&M contracts.
VA Tech has guided for revenues of Rs16.5‐Rs17bn for FY13 coupled with order book growth of 15%. Order awarding is generally weak in H1 and second half is the period of highest award activity. However, in H1 FY13 VA Tech has won orders worth Rs8.6bn, a jump of 125% in order inflow on yoy basis. We build in conservative growth in the order inflow for H2 and estimate overall inflow to grow by 31% in FY13.
Order Book trend Particulars (Rs mn) FY09 FY10 FY11 FY12 FY13E FY14E FY15E
Opening Order Book 20,472 21,869 28,607 34,298 37,314 43,331 47,813
% yoy growth 31.2 6.8 30.8 19.9 8.8 16.1 10.3
Order Inflows 12,705 18,975 18,020 17,456 22,868 24,011 25,212
Closing Order book 21,869 28,607 34,298 37,314 43,331 47,813 50,752
% yoy growth 6.8 30.8 19.9 8.8 16.1 10.3 6.1 Source: Company, India Infoline Research
The company has diversified globally by entering into newer geographies
We expect 30% order inflow growth in FY13. Growth in order inflow for H1 FY13 stood at 125%
VA Tech Wabag
7
Key Projects Name of the project Amount (Rs bn)
Nemmeli Desalination, Chennai 5.8
Reliance ETP Project 2.7
Water Treatment Plant & distribution system, Sri Lanka 2.2
APGENCO for Kakatiya and Rayalaseema BoP 2.2
195 MLD WTP for Ulhasnagar Municipal Corporation withO&M for 30 years . EPC
1.0
195 MLD WTP for Ulhasnagar Municipal Corporation withO&M for 30 years . O&M
2.3
Delhi Jal Board 3.8
Madinah STP, Saudi Arabia 1.1
Source: Company, India Infoline Research
Focus on high value O&M
VA Tech as a company from executing its own O&M contract has gradually moved towards execution of O&M contracts for others. Over the past 5 years the share of O&M contracts has increased significantly to 36.5% in FY12 from 24% in FY07. As the market is continuously evolving for O&M contracts, the company, been an established player, plans to further increase the participation in the O&M contracts through DBO and BOOT projects. Increase in share of O&M contracts is expected to translate into steady cash flows and higher margins and thereby improve the overall profitability for the company. VA Tech, backed by its advanced technology, brand recognition and strong execution track record, would bid for larger projects in joint venture and undertake EPC work of the BOOT contract. The company does not plan to own significant stake of any asset thereby retaining its asset light business model strategy ensuring lower capital requirement. In case of other infra segments viz. roads and power, the developer bids for the entire project and executes EPC in‐house. EPC for water projects involves the use of advance technology and hence the developer generally owns the asset and outsources the EPC part to specialized players like VA Tech. Share of O&M has jumped over past 5 years with focus on this segment
‐
20
40
60
80
100
FY07 FY08 FY09 FY10 FY11 FY12
EPC O&M
Source: Company, India Infoline Research
The company plans to increase its order backlog from O&M segment wherein the company would take minority stake in O&M and take EPC contract of the project
VA Tech Wabag
8
Strategic alliance; key catalyst for growth VA Tech has entered into joint ventures and alliance in the past, both at strategic and project‐specific level, to gain pre‐qualification for the bids and for technology references. Furthermore, these alliances facilitate the company to understand the local market better and build on the capabilities. It also enables the company to expand its reach to various geographies and bid for larger projects. In the past, the company has entered into three key alliances to bid for projects jointly. Sumitomo Corp Wabag is partnering with Sumitomo Corp of Japan to bid for BOT projects in India. This alliance will help VA Tech Wabag to expand more into concession type business, where the projects are capital intensive and de‐risk the company’s balance sheet. Sumitomo''s financial strength, network and expertise in implementing large scale infrastructure projects would add value to the Company, both domestically and worldwide. VA Tech can participate in larger BOT projects through this alliance without substantial equity commitments. The tie‐up has recently bagged US$350mn desalination plant contract in Oman modeled on a Build Own Operate basis as an Independent Water Project. The EPC portion of the contract will be executed jointly by three companies including VA Tech, while the development will be undertaken by consortium of Malakoff International Limited (Malaysia), Sumitomo Corporation (Japan), and Cadagua (Spain). Tecpro and Gammon India VA Tech has partnered with Tecpro Systems and Gammon India to bid for balance‐of‐plant (BOP) projects for power plants. VA Tech will undertake the waste water treatment plant of the entire BOP package. The coal and ash handling portion will be executed by Tecpro India and Gammon will build the chimney. The alliance aids in bidding for the entire BOP package of a power plant. Zawawi Oman is a key country for the company in the international arena. The Global Water Markets (2008) report estimates the opportunity to be around USD343b, growing at approximately 12% per annum; by 2016, Oman represents a US$921bn market. VA Tech has entered into a joint venture agreement with Zawawi Trading Company, well known business group in Sultanate of Oman, to tap the operation and maintenance business in the water space in Oman. The JV is likely to target contracts for operation and maintenance of water and waste water treatment plants, sewerage and water networks, pumping stations, etc.
VA Tech has entered into joint ventures and alliance in the past, both at strategic and project‐specific level, to gain pre‐qualification for the bids and for technology references. That apart it aids in understanding the local markets better Alliance with Sumitomo Corp. will help VA Tech Wabag to expand more into concession type business, where the projects are capital intensive and de‐risk the company’s balance sheet.
VA Tech has partnered with Tecpro Systems and Gammon India to bid for balance‐of‐plant (BOP) projects for power plants. VA Tech has entered into a joint venture agreement with Zawawi Trading Company, well known business group in Sultanate of Oman, to tap the operation and maintenance business in the water space in Oman.
VA Tech Wabag
9
Restructuring global operations; fillip to the margins Majorly water supply is the responsibility of regional public agencies. Hence, presence in key geographies is important for building relationship with the clients. Previously, execution of all the projects internationally for VA Tech was carried out by its subsidiary based in Austria. The company now plans to set up teams in key geographies to execute project within that country. This augurs well for the company in the long term as it would help VA Tech to establish its network in these markets. That apart, it would aid in faster execution of the projects at lower cost. We expect improvement in the business for its international operation resulting into higher margins on the back of benefit from operating leverage.
Strategy of staying asset light bodes well for longer term VA Tech usually outsources the civil works, construction and erection works for projects to third party contractor. This enables the company to focus on engineering, design and technology and pass on the construction risk to a construction company. We like the strategy of staying asset light as it helps in efficient execution of the projects and allow the company to expand at a fast pace without any significant capital expenditure. Lower investment in assets yields healthy return ratios for the company. Excluding cash on books, return ratios for VA Tech Wabag are healthy. Average ROIC for the past 3 years stood at 46%. Healthy return ratios backed by asset light business model
‐
10
20
30
40
50
60
70
FY10 FY11 FY12 FY13E FY14E FY15E
ROCE ROIC(%)
Source: Company, India Infoline Research
The company plans set up teams in various geographies to execute the overseas project VA Tech outsources construction and erection work while focusing on design and technology. This helps the company to stay asset light resulting into robust return ratios.
VA Tech Wabag
10
Lower working capital intensity supports cash flows
Working capital requirement for VA Tech is much lower (12‐15% of revenue) compared to construction companies (~45% of revenue) on account of multiple factors viz a) VA Tech typically takes the entire EPC contract, does the detailed design and engineering work and subcontracts the construction portion of the contract to local construction players. Thereby the company evades the working capital challenges faced by construction companies. b) The company sources ~40% of contract value from third party on which it has back to back payment arrangements and c) domestic projects are largely funded by multilateral agencies ensuring timely payments.
In the past 4 years, working capital cycle for the company has deteriorated on the back of increasing share of revenues from domestic business. Advance payments, which are part of current liabilities, are generally not collected by the company in the Indian operations considering higher (16‐18%) interest cost on the same. Whereas, in the international projects the interest cost on the advance payment collected is nil, hence, VA Tech collects advances for most of the international projects. We expect the share of international business to improve, with revival in investment spending and company’s entrance into newer markets. This would translate into higher share of international operations and hence a reduction in overall working capital intensity.
Large Cash balance (~20% of market cap); acquisition on cards Majority of the companies operating in the infra space are loaded with substantial debt which depresses their profitability during revenue slowdown. Net debt‐free status for VA Tech has helped the company to expand its size significantly over a period of time and leaves scope for leveraging as and when required. The company has large cash balance of Rs2.9bn, which is ~20% of its current market cap. Management indicated that cash will be strategically used for the inorganic acquisition as and when the opportunity arises. The target companies would be either companies which can strengthen its technology further or companies that provides access to key markets. We do not factor in any revenues from acquisition into our financial model. We believe, inorganic acquisition could act as a key trigger for the stock in the medium to long term. Further, unlike most peers, VA Tech has been generating positive operating cash flows, highlighting its impressive operating efficiency.
Net cash to jump from Rs2.7bn to Rs5.7bn over FY12‐15E
‐
1,000
2,000
3,000
4,000
5,000
6,000
FY08 FY09 FY10 FY11 FY12 FY13E FY14E FY15E
‐
20
40
60
80
100
120
Net Cash (LHS) Cash % of Cap. Emp.(RHS)
(Rs mn)(%)
Source: Company, India Infoline Research
Subcontracting the civil construction work aids in lower working capital requirements against the infra companies
Lower share of international business has resulted into increase in overall working capital requirements for the company as advances are not collected in case of domestic orders
Unlike most of the companies in infra space, which are loaded with debt, VA Tech is net debt free with a large cash balance of Rs~3bn which is ~20% of the market cap
VA Tech Wabag
11
Growth in order inflows is expected to continue … translating into 16% revenue CAGR over FY12‐15
8,000
12,000
16,000
20,000
24,000
28,000
FY08 FY09 FY10 FY11 FY12 FY13E FY14E FY15E
(Rs mn)
15% CAGR
‐
5,000
10,000
15,000
20,000
25,000
FY09 FY10 FY11 FY12 FY13E FY14E FY15E
‐
10
20
30
40
50
60
70
80
90
Revenues (LHS) yoy growth (RHS)
(Rs mn) (%)
Source: Company, India Infoline Research
Earnings likely to double in 3 years In H1 FY13, VA Tech has received orders of Rs8.6bn, a jump of 125% on yoy basis. We factor in conservative 5% growth in order inflows for H2 FY13, to arrive at 30% growth in order inflow for FY13. Strong order book backed by healthy order inflows for the company in FY13 and increase in execution rate is expected to translate into 16% revenue CAGR for the company over FY12‐15. Despite the increase in share of international revenue (wherein O&M contribution is lower), the overall contribution of O&M to the total revenue is likely to increase. This is expected to translate into 120bps OPM expansion for VA Tech over next three years. Strong revenue growth in addition to margin expansion is likely to double the earnings over FY12‐15E.
Trend of increase in OPM to continue
‐
500
1,000
1,500
2,000
2,500
FY08 FY09 FY10 FY11 FY12 FY13E FY14E FY15E
‐
2.0
4.0
6.0
8.0
10.0
12.0
Operating Profi t (LHS) OPM (RHS)
(%)(Rs mn)
Source: Company, India Infoline Research
We expect 15% revenue CAGR over FY12‐15 coupled with 120bps OPM expansion translating into 24% earnings CAGR over FYY12‐15E
VA Tech Wabag
12
Trading below its average 1‐year forward rolling P/E trend
1‐year forward rolling P/B trend
200
400
600
800
1000
1200
1400
Oct‐10 Mar‐11 Aug‐11 Jan‐12 Jun‐12 Nov‐12
11.8x
17.7x
23.5x
29.3x
35.1x
(Rs)
200
400
600
800
1000
Oct‐10 Mar‐11 Aug‐11 Jan‐12 Jun‐12 Nov‐12
1.3x
1.8x
2.4x
3.0x
3.5x
(Rs)
Source: Company, India Infoline Research
Out-performance to continue; Initiate with BUY In the past one year, VA Tech stock price has delivered 45% returns against 15% gain in the NIFTY index. This sharp out‐performance in VA Tech was led by strong order inflows for the company, robust earnings growth in H1 FY13, healthy balance sheet and improvement in earnings visibility for the next two years. At current levels, the company is trading at premium valuations vis‐à‐vis an infra player. We believe premium valuations for VA Tech is justified and expect the trend to continue backed by multiple reasons: a) robust earnings growth, b) lower working capital intensity, c) improvement in profitability of overseas subsidiary with successful implementation of restructuring process, d) overall margin expansion caused by shift towards high value O&M contracts and e) usage of the large cash for value accretive acquisition. Considering strong business potential and robust financials, in the form of healthy return ratios, we value the company at 14x FY15E EPS of Rs52.5 to arrive at a target price of Rs735. We initiate coverage on VA Tech, with BUY rating and 9‐12 month target price of Rs735, an upside potential of 31.2%.
We expect the out‐performance of the stock to continue and recommend BUY with 9‐12 month target price of Rs735
VA Tech Wabag
13
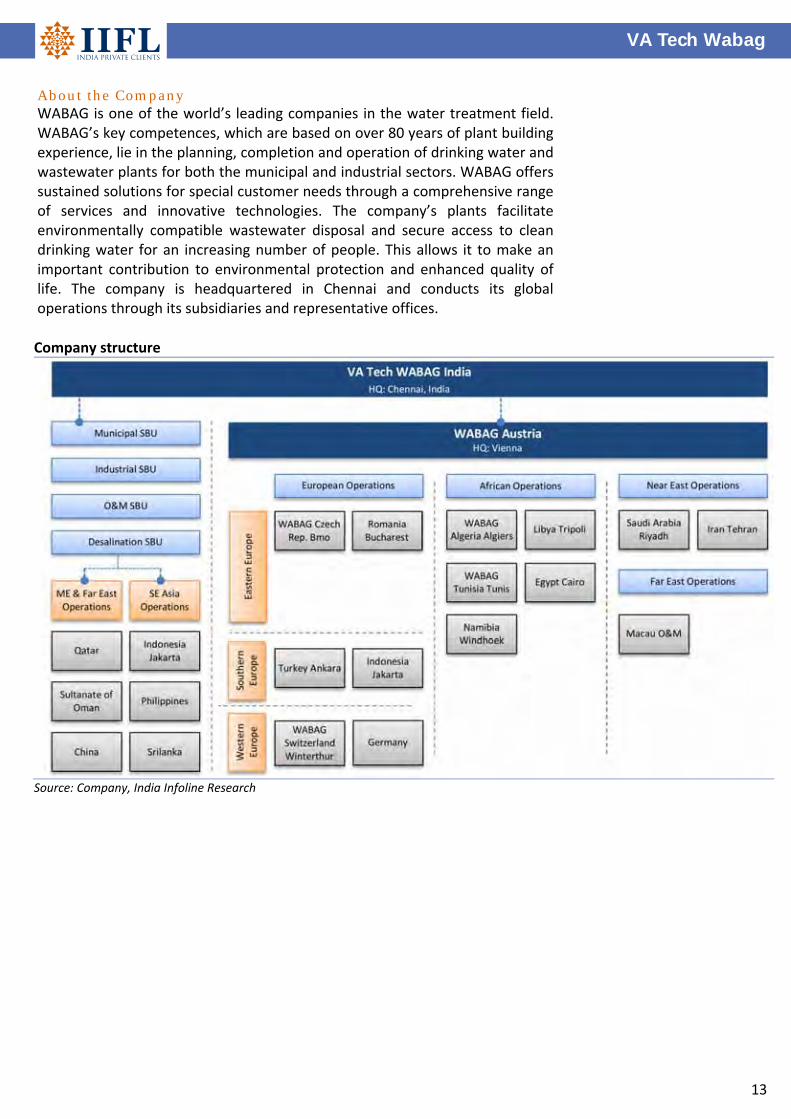
About the Company WABAG is one of the world’s leading companies in the water treatment field. WABAG’s key competences, which are based on over 80 years of plant building experience, lie in the planning, completion and operation of drinking water and wastewater plants for both the municipal and industrial sectors. WABAG offers sustained solutions for special customer needs through a comprehensive range of services and innovative technologies. The company’s plants facilitate environmentally compatible wastewater disposal and secure access to clean drinking water for an increasing number of people. This allows it to make an important contribution to environmental protection and enhanced quality of life. The company is headquartered in Chennai and conducts its global operations through its subsidiaries and representative offices.
Company structure
Source: Company, India Infoline Research
VA Tech Wabag
14
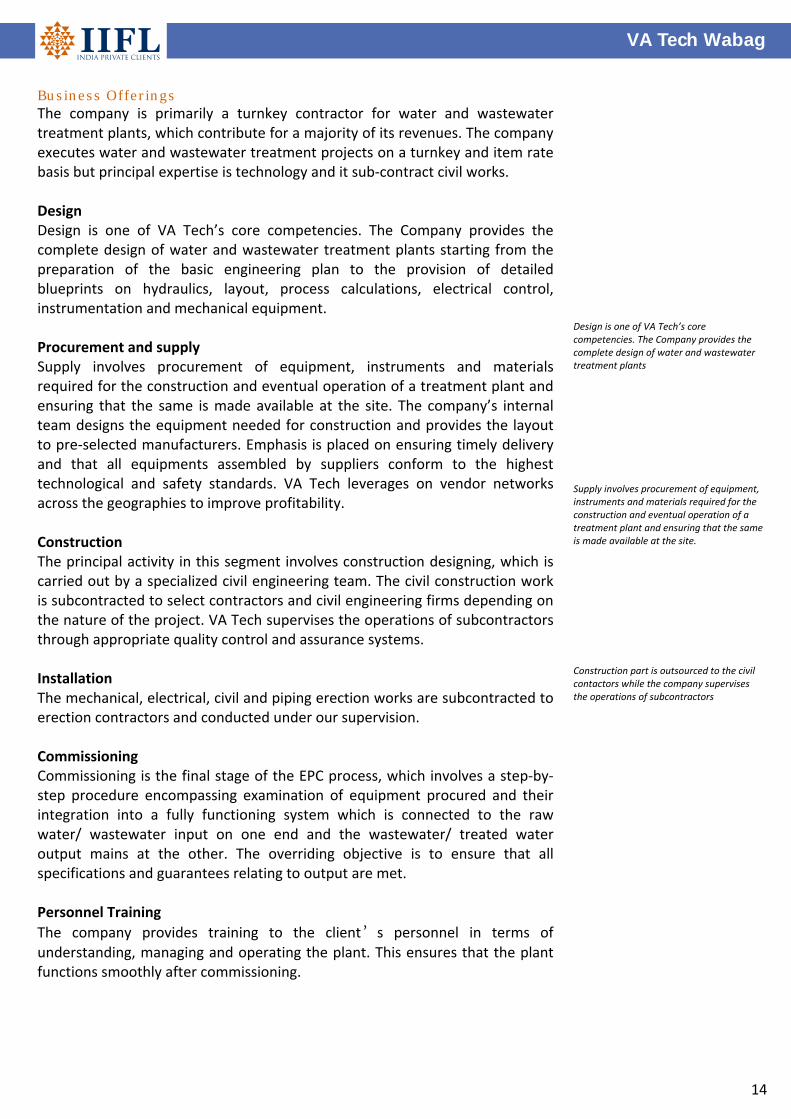
Business Offerings The company is primarily a turnkey contractor for water and wastewater treatment plants, which contribute for a majority of its revenues. The company executes water and wastewater treatment projects on a turnkey and item rate basis but principal expertise is technology and it sub‐contract civil works. Design Design is one of VA Tech’s core competencies. The Company provides the complete design of water and wastewater treatment plants starting from the preparation of the basic engineering plan to the provision of detailed blueprints on hydraulics, layout, process calculations, electrical control, instrumentation and mechanical equipment. Procurement and supply Supply involves procurement of equipment, instruments and materials required for the construction and eventual operation of a treatment plant and ensuring that the same is made available at the site. The company’s internal team designs the equipment needed for construction and provides the layout to pre‐selected manufacturers. Emphasis is placed on ensuring timely delivery and that all equipments assembled by suppliers conform to the highest technological and safety standards. VA Tech leverages on vendor networks across the geographies to improve profitability. Construction The principal activity in this segment involves construction designing, which is carried out by a specialized civil engineering team. The civil construction work is subcontracted to select contractors and civil engineering firms depending on the nature of the project. VA Tech supervises the operations of subcontractors through appropriate quality control and assurance systems. Installation The mechanical, electrical, civil and piping erection works are subcontracted to erection contractors and conducted under our supervision. Commissioning Commissioning is the final stage of the EPC process, which involves a step‐by‐step procedure encompassing examination of equipment procured and their integration into a fully functioning system which is connected to the raw water/ wastewater input on one end and the wastewater/ treated water output mains at the other. The overriding objective is to ensure that all specifications and guarantees relating to output are met. Personnel Training
The company provides training to the client’s personnel in terms of understanding, managing and operating the plant. This ensures that the plant functions smoothly after commissioning.
Design is one of VA Tech’s core competencies. The Company provides the complete design of water and wastewater treatment plants Supply involves procurement of equipment, instruments and materials required for the construction and eventual operation of a treatment plant and ensuring that the same is made available at the site. Construction part is outsourced to the civil contactors while the company supervises the operations of subcontractors
VA Tech Wabag
15
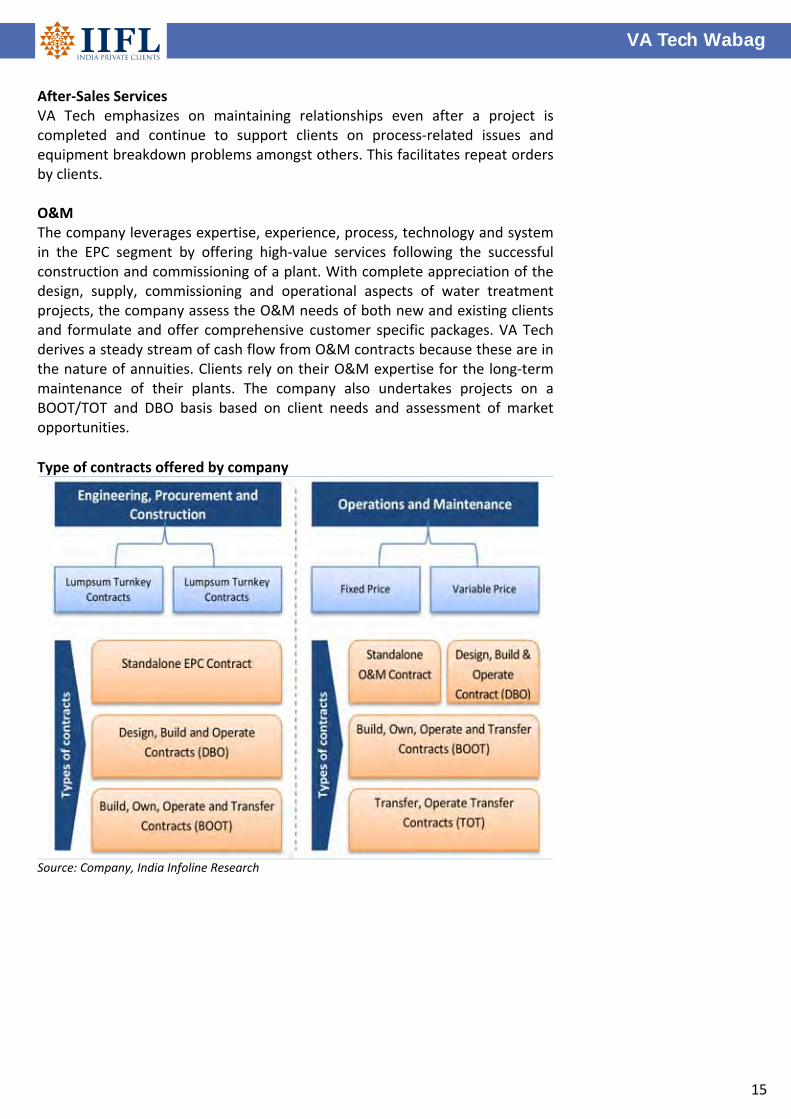
After‐Sales Services VA Tech emphasizes on maintaining relationships even after a project is completed and continue to support clients on process‐related issues and equipment breakdown problems amongst others. This facilitates repeat orders by clients. O&M The company leverages expertise, experience, process, technology and system in the EPC segment by offering high‐value services following the successful construction and commissioning of a plant. With complete appreciation of the design, supply, commissioning and operational aspects of water treatment projects, the company assess the O&M needs of both new and existing clients and formulate and offer comprehensive customer specific packages. VA Tech derives a steady stream of cash flow from O&M contracts because these are in the nature of annuities. Clients rely on their O&M expertise for the long‐term maintenance of their plants. The company also undertakes projects on a BOOT/TOT and DBO basis based on client needs and assessment of market opportunities.
Type of contracts offered by company
Source: Company, India Infoline Research
VA Tech Wabag
16
Financials (consolidated)
Income statement Y/e 31 Mar (Rs m) FY12 FY13E FY14E FY15E
Revenue 14,435 16,851 19,529 22,272
Operating profit 1,300 1,685 1,972 2,272
Depreciation (86) (92) (100) (108)
Interest expense (104) (108) (65) (65)
Profit before tax 1,111 1,486 1,807 2,098
Taxes (379) (490) (596) (692)
Minorities & other 6 (10) (12) (15)
Net profit 738 985 1,199 1,391
Balance sheet Y/e 31 Mar (Rs m) FY12 FY13E FY14E FY15E
IIFL, IIFL Centre, Kamala City, Senapati Bapat Marg, Lower Parel (W), Mumbai 400 013. For Research related queries, write to: Amar Ambani, Head of Research at [email protected] or [email protected] For Sales and Account related information, write to customer care: [email protected] or call on 91‐22 4007 1000