Page 1
LEVELS OF TOTAL MERCURY IN FARMED AND WILD-CAUGHT
Oreochromis niloticus niloticus (NILE TILAPIA), POND SEDIMENTS AND
WATER IN THE MIGORI GOLD MINING BELT, KENYA
DR SAMWEL KOLA OWUOR (BPharm)
A thesis submitted in partial fulfilment of the requirements for the Degree of
Master of Science in Pharmacology and Toxicology
Department of Public Health, Pharmacology and Toxicology
Faculty of Veterinary Medicine
University of Nairobi
2019
Page 3
iii
DEDICATION
I dedicate this work and give special thanks to my family - the K‟Ogollah family, and especially
to my wife Betty, my sons Timela and Tawali; and to my loving mum Min Kola, without whose
caring support it would not have been possible. Most importantly, all thanks and glory goes to
God, the Almighty for the gift of life and good health.
ACKNOWLEDGEMENTS
Page 4
iv
This work would not have been possible without the invaluable input from my supervisors: Dr
Laetitia Kanja and Professor James Mbaria - both from the Department of Public Health,
Pharmacology and Toxicology and Dr Joyce Maina from the Department of Animal Production,
University of Nairobi. This study was supported by a grant from the National Science
Foundation of the United States, funded by the Partnerships for Enhanced Engagement in
Research Science project and United States Agency for International Development. For this, I
am grateful to Dr Joyce Maina, the principal investigator in the grant project for allowing me to
be part of the project.
My gratitude goes to the Migori County Fisheries Department staff – Ruth Odhiambo, Joseph
Oruru and George Otieno for their help with the identification of sites, coordination with farmers
and collection of samples. I also thank the University of Nairobi, Public Health, Pharmacology
and Toxicology laboratory Technical staff; Joseph Nderitu, Gitahi Nduhiu, Kenneth Maloba and
John Kimotho for their help in the storage and processing of samples.
I appreciate the invaluable help and guidance from the Kenya Plant Health Inspectorate Service
(KEPHIS) analytical chemistry laboratory staff; Paul Njuguna and Peter Osoro. They contributed
immensely to the successful analysis of the samples. I thank the input of Dr Gerald Muchemi, Dr
Florence Mutua and Mr Billy Odhiambo in data analysis of the results. My classmates; Dr Abdi
Hadun, Dr Okumu Mitchell, Dr Yiaile Antony, Dr Rose Wainaina and Dr James Githinji, gave
me constant encouragement and invaluable inputs throughout the project. I am truly indebted.
TABLE OF CONTENTS
PAGE
DECLARATION ....................................................................... Error! Bookmark not defined.
Page 5
v
DEDICATION ........................................................................................................................... iii
ACKNOWLEDGEMENTS ....................................................................................................... iii
LIST OF TABLES .................................................................................................................... vii
LIST OF FIGURES ................................................................................................................... ix
LIST OF APPENDICES ............................................................................................................. x
LIST OF ABBREVIATIONS .................................................................................................... xi
ABSTRACT .............................................................................................................................. xii
CHAPTER ONE ......................................................................................................................... 1
INTRODUCTION ...................................................................................................................... 1
1.1 Background Information and Justification ................................................................... 1 1.2 Research Objectives ..................................................................................................... 4
1.2.1 General Objective ............................................................................................................. 4
1.2.2 Specific Objectives ............................................................................................................ 4
1.3. Hypotheses.................................................................................................................... 5 1.3.1 Null Hypotheses ................................................................................................................ 5
1.3.1 Alternate Hypotheses ....................................................................................................... 5
CHAPTER TWO ........................................................................................................................ 7
LITERATURE REVIEW ........................................................................................................... 7
2.1 Chemical Forms of Mercury ......................................................................................... 7
2.2 Mercury Transformation in the Environment ............................................................... 7 2.3 Significance of Mercury Chemical Forms and Transformation ................................... 8 2.4 Sources and Toxicology of Mercury ............................................................................ 9
2.5 Uses of Mercury ......................................................................................................... 10 2.6 Mercury Release to the Environment ......................................................................... 11 2.7 Routes of Exposure to Mercury .................................................................................. 11 2.8 Effects of Mercury on Human Health ........................................................................ 12 2.9 Populations Susceptible to Mercury Toxicity ............................................................ 13
2.10 Mercury Reference Levels ...................................................................................... 15 CHAPTER THREE .................................................................................................................. 17
MATERIALS AND METHODS .............................................................................................. 17
Page 6
vi
3.1 Ethical Considerations ................................................................................................ 17 3.2 Pre-treatment of equipment and sample bottles ......................................................... 17 3.3 Study Area and Sampling Sites .................................................................................. 18 3.4 Sediment Sampling ..................................................................................................... 21
3.5 Water Sampling .......................................................................................................... 21 3.6 Collection of Fish Samples ......................................................................................... 23 3.7 Reagents...................................................................................................................... 24 3.8 Equipment and Apparatus .......................................................................................... 25 3.9 Sample Preparation and Digestion ............................................................................. 26
3.10 Analytical Quality Control ...................................................................................... 28 3.11 Analysis of Mercury in Collected Samples ............................................................ 28
3.12 Evaluation of the Degree of Sediment Contamination ........................................... 29
3.13 Risk‑based consumption limits .............................................................................. 30
3.14 Statistical Analysis .................................................................................................. 31 CHAPTER FOUR ..................................................................................................................... 32
RESULTS AND DISCUSSION ............................................................................................... 32
4.1 RESULTS ................................................................................................................... 32 4.1.1 Mean T-Hg levels in the Nile tilapia tissue samples ........................................................ 32
4.1.2 Comparison of the mean T-Hg levels in Nile tilapia tissues across the sample sites with
the WHO critical values for T-Hg in fish .......................................................................................... 33
4.1.3 Comparison of the mean T-Hg levels in Nile tilapia brain samples across the sites ....... 34
4.1.4 Comparison of the mean T-Hg levels in the Nile tilapia muscle samples across the sites
35
4.1.5 Comparison of the mean T-Hg levels in Nile tilapia liver tissues across the sample sites
37
4.1.6 Mean T-Hg levels in fish pond sediments samples across the sites ............................... 38
4.1.6 The relationship between mean T-Hg levels in fish pond soil sediments and Nile tilapia
fish tissues ....................................................................................................................................... 39
4.1.7 Mean T-Hg levels in fish pond water samples across the sites ....................................... 40
4.1.8 Comparison of the mean T-Hg levels in pond water samples across the sites with the FAO
critical values for T-Hg in unpolluted surface water ....................................................................... 41
4.1.9 The relationship between mean T-Hg levels in water and fish tissues ........................... 41
4.1.10 Risk-based consumption limits ....................................................................................... 42
Page 7
vii
4.1.11 Miscellaneous study findings: the relationships between pond water pH, pond water
temperature, tilapia samples’ weights and age and the mean T-Hg levels in tilapia samples ....... 44
4.2 DISCUSSION ............................................................................................................. 46 4.2.1 Mean T-Hg levels in the Nile tilapia brain, liver and muscle tissues ............................... 46
4.2.2 Levels of mercury in pond soil sediments and geo-accumulation analysis .................... 48
4.2.3 The relationship between mean T-Hg levels in pond soil sediments and Nile tilapia
tissues 49
4.2.4 Mean T-Hg levels in pond water samples ....................................................................... 50
4.2.5 The relationship between mean T-Hg levels in water and Nile tilapia fish tissues ........ 50
4.2.6 Risk-based consumption limits for Nile tilapia from the sample sites ............................ 51
4.2.7 The relationship between pond water pH, and temperature, fish weight and age, type
of fish-culture and the mean T-Hg levels in tilapia samples ........................................................... 51
4.3 LIMITATIONS OF THE STUDY ............................................................................. 53
4.4 CONCLUSIONS ........................................................................................................ 54 4.5 RECOMMENDATIONS............................................................................................ 56
REFERENCES ......................................................................................................................... 57
APPENDICES .......................................................................................................................... 67
LIST OF TABLES
Table 1: Total number of sediment, water and Nile tilapia tissue samples from the ten sites in the
study area. ..................................................................................................................... 21
Page 8
viii
Table 2: Mean T-Hg levels (in µg/g ww) in Nile tilapia tissues across the sites ........................ 33
Table 3: T-Test of mean T-Hg content in fish tissues and critical values of 0.2 and 0.5 µg/g ww
...................................................................................................................................... 34
Table 4: One Way ANOVA of mean T-Hg levels in Nile tilapia brain tissues across the sites .. 34
Table 5: Tukey‟s HSD results showing homogeneous subsets for mean T-Hg levels in Nile
tilapia brain tissues across the sample sites .................................................................................. 35
Table 6: One Way ANOVA of mean T-Hg levels in Nile tilapia muscle tissues across the sample
sites ............................................................................................................................... 36
Table 7: Tukey HSD results showing homogeneous subsets for mean T-Hg levels in Nile tilapia
muscle tissues across the sample sites .......................................................................................... 36
Table 8: One Way ANOVA of mean T-Hg levels in Nile tilapia liver tissues across the sample
sites ............................................................................................................................. 37
Table 9: Tukey HSD results showing homogeneous subsets for mean T-Hg levels in Nile tilapia
liver tissues across the sample sites .............................................................................................. 38
Table 10: Mean T-Hg levels in fish pond sediments and geo-accumulation analysis ................. 39
Table 11: Bivariate correlation between mean T-Hg levels in pond sediment and tilapia tissues
.................................................................................................................................. 40
Table 12: Mean T-Hg levels in fish pond water sampled from different sites in the study area . 40
Table 13: T-Test of mean T-Hg content in water samples and critical values of 0.0001µg/ml .. 41
Table 14: Bivariate correlation between mean T-Hg levels in water and tilapia tissues ............. 41
Table 15: Risk‑based consumption parameters for Nile tilapia from the sample sites ............... 43
Table 16: Bivariate correlation between water pH, water temperature, the weight of fish, and
fish age with T-Hg content in tilapia fish tissues ........................................................ 44
Page 9
ix
Table 17: Independent two-sample t-test of mean T-Hg in fish tissues and fish-culture practised
..................................................................................................................................... 45
LIST OF FIGURES
Figure 1: Use of mercury to extract gold during panning in Migori County................................. 4
Figure 2: Sub-counties in Migori County, Kenya........................................................................ 18
Page 10
x
Figure 3: Major gold mining sites within Migori County, Kenya ............................................... 19
Figure 4: Map of Migori County showing the sampling sites ..................................................... 20
Figure 5: shows (a) fish sampling using gill nets, (b) water sampling and filtering, (c) measuring
pond water pH and temperature and (d) labelled Nile tilapia brain samples .............. 23
Figure 6: The Varian Model Spectr AA 220Z atomic absorption spectrometer fitted with Varian
Model vapour generation accessory (VGA) 77 used for the analysis. ....................... 26
LIST OF APPENDICES
Appendix 1: Approval of study proposal by the Graduate School of the University of Nairobi 67
Page 11
xi
Appendix 2: Approval of study proposal by the Biosafety, Animal Use and Ethics Committee 68
Appendix 3: Physico-chemical and biotic characteristics of the ecosystem of the sites of sample
collection ................................................................................................................ 69
Appendix 4: Thesis Plagiarism Report ........................................................................................ 70
Appendix 5: Policy Brief Published from the study ..................... Error! Bookmark not defined.
Appendix 6: Paper Published from the study ............................... Error! Bookmark not defined.
LIST OF ABBREVIATIONS
ANOVA Analysis of Variance
Page 12
xii
BCR Community Bureau of Reference
CRM Certified Reference Material
CRmw Consumption Rate in meals/week
EDIm Estimated Daily Intake per meal
FAO Food and Agriculture Organization
Hg Mercury
IGeo Geo accumulation index
JECFA Joint FAO/WHO Expert Committee on Food Additives
KEMFRI Kenya Marine and Fisheries Research Institute
PTWI Provisional Tolerable Weekly Intake
RfDo Reference Doses
THQ Target Hazard Quotient
T-Hg Total Mercury
USEPA the United States Environmental Protection Agency
VGA Vapour Generation Accessory
ww Wet weight
ABSTRACT
Page 13
xiii
Mercury is a well-known toxicant with a myriad of ill effects on human health. It occurs
naturally in the environment at basal levels. Human activities, such as mercury use in artisanal
and small scale gold mining is one of the major sources of environmental mercury pollution.
Migori is renowned for artisanal gold mining. Inland fish farming is also practised in this area
with Nile tilapia (Oreochromis niloticus niloticus) is the main fish reared. Studies have shown
that up to 90% of the mercury used during gold panning in Migori is lost to the environment.
Consequently, the mine tailings, soils and waters in these areas are heavily contaminated with
mercury. Mercury is washed off to the nearby streams and rivers by run-water, thus extending
the pollution farther to the water system. Inland fish farms and Lake Victoria draw their waters
from these polluted streams and rivers with mercury being deposited in soil sediments, water and
eventually taken up by planktons, insects and other lower organisms which form a major part of
the diet for the tilapia fish. Mercury gets absorbed into the fish through feeds, skin and gills. In
fish, the mercury is partitioned differently across various tissues depending on the partition
coefficients of the tissues to the different mercury forms. Tilapia brain, liver and muscle tissues
were selected for this study. Tilapia brain and liver have high-fat content hence are likely to
concentrate high amounts of methyl- and other organic forms of mercury which are lipophilic.
The liver is also the main organ for metabolism and elimination of the mercury from the fish.
Tilapia fish muscle is the major part of consumed by man. Thus it is a tissue of interest in this
study since its contamination poses a risk to human health. This study assessed the levels of total
mercury (T-Hg) in fish pond sediments, water and tissues of farmed and wild-caught Nile tilapia
(Oreochromis niloticus niloticus) in the Migori gold mining belt. The correlation between the
mean T-Hg levels in the tilapia fish tissues and the mean T-Hg in pond water and sediments was
evaluated. The potential risk to human health from the consumption of the fish was also
Page 14
xiv
determined. Ten locations in Rongo and Nyatike sub-counties in Migori with known artisanal
gold mining and inland fish farming activities were conveniently selected for the study. Five
tilapia fish (irrespective of sex) were sampled from each site except Minyenya (where four fish
were sampled). Two replicate samples of pond water and sediment were collected from each site
except for the lake (soil and sediment not sampled). Each fish sample yielded one sample of
brain, liver and muscle tissues. A 0.3 - 0.5g portions of the samples were homogenised and acid-
digested to reduce all the mercury forms to mercury metal (this yield is referred to as total
mercury (T-Hg) which was analysed using cold vapour atomic absorption spectroscopy and the
mean T-Hg levels recorded in µg/g wet weight. All the data generated were organised,
aggregated and mean measures established. Microsoft Excel (2016) and Statistical Package for
the Social Sciences (SPSS, version 20.0) were used for statistical analysis. Data for mercury
analysis was expressed as the mean± standard deviation. One-Way Analysis of Variance
(ANOVA) was used to analyse the levels of T-Hg in fish tissues across the sites. Tukey's HSD
test was used as a post-hoc test. Pearson's rank correlation and the t-test were used to determine
whether there were any relationships between the various parameters in the study. Values of
p≤0.05 were considered significant in all cases. Sediment quality was evaluated using a geo-
accumulation index (IGEO) while the estimated daily intake of fish per meal (EDIm), target
hazard quotient (THQ), and the maximum allowable fish consumption rate (CRmw) were used
as human health risk indices. Concentrations of mean T-Hg in sediments ranged from
0.208±0.000 to 1.113±0.008 µg/g wet weight (n=8, 95% CI); with six of the eight sites sampled
being moderately polluted (1≤IGeo˂2), whereas two sites (Minyenya and Kokaka) being strongly
polluted (3≤IGeo˂4). Mean T-Hg in the water samples ranged from 0.002±0.000 to 0.004±0.001
µg/ml wet weight (n=8, 95% CI) with all the sites having higher values (up to 40 times higher)
Page 15
xv
for T-Hg than the maximum contaminant level of 0.0001 μg/ml allowable for mean T-Hg in
unpolluted surface water set by the Food and Agriculture Organization (FAO). The
concentrations of mean T-Hg were highest in the tilapia brain tissues, ranging from 0.128±0.021
to 3.798±1.421 µg/g wet weight (n= 49, 95% CI); with the highest proportion (78%, 38/49
samples) having mean T-Hg levels above (up to eight times higher) the limits of 0.5 µg/g wet
weight recommended as safe by WHO for consumption by the general human population. The
mean T-Hg in tilapia muscle tissues ranged from 0.179±0.020 to 0.595±0.065 µg/g wet weight
(n= 49, 95% CI) with 31% (15/49) of fish muscle tissues tested having the levels above 0.5 µg/g
wet weight. Mean T-Hg levels were lowest in tilapia liver tissues, ranging from 0.103±0.118 to
0.588±0.374 µg/g wet weight (n= 49, 95% CI) with only 27% (13/49) of fish liver tissues tested
having the levels above 0.5 µg/g wet weight. However, most of the tilapia fish samples (87.8%
(43/49) of brain, 69.4% (34/49) of liver and (68.7% 34/49) of muscle tissues respectively had
mean T-Hg above the 0.2 µg/g (wet weight) level recommended by WHO for at-risk populations
(frequent fish eaters, people with renal and liver diseases, pregnant mothers and developing
children). There were positive correlations between mean T-Hg levels in tilapia brain and muscle
tissues and the mean T-Hg levels in fish pond sediments (r=0.528, p<0.05 and r=0.524, p<0.05
respectively). However, there was no significant correlation between the mean T-Hg content in
soil sediments and the mean T-Hg level in fish liver tissues. There was a positive correlation
between mean T-Hg levels in tilapia brain tissues and mean T-Hg levels in pond water (r=0.402,
p<0.05) as well as between mean T-Hg levels in tilapia muscle tissues and mean T-Hg levels in
pond water (r=0.616, p<0.05). However, there was no significant correlation between the mean
T-Hg content in pond water and the mean T-Hg level in fish liver tissues. The estimated daily
intake of fish per meal (EDIm) and target hazard quotient (THQ) for human consumption ranged
Page 16
xvi
from 2.43-15.84 µg/g and 24.3-158.4 µg/g respectively while the maximum allowable fish
consumption rate for humans in meals/week (CRmw) ranged from 1-4 whole fish. These
findings show that the levels of mean T-Hg in tissues of Nile Tilapia in the Migori gold mining
belt are above-recommended limits. Consumption of Nile tilapia, therefore, bears a significant
risk of mercury exposure in frequent fish-eaters, pregnant women and children of developmental
age in the Migori gold mining belt, but is safe for the general human population.
Page 17
1
CHAPTER ONE
INTRODUCTION
1.1 Background Information and Justification
Mercury is a well-known toxicant with a myriad of ill effects on human health. It occurs
naturally in the environment at basal levels (UNEP, 2002; 2013abc). Human activities, such
as mercury use in artisanal and small scale gold mining is one of the significant sources of
environmental mercury pollution (Gibb and O‟Leary, 2014). Migori is renowned for small-
scale gold mining. Inland fish farming is also practised in this area with Nile tilapia
(Oreochromis niloticus niloticus) being the main fish reared (Githukia et al., 2014). Studies
have shown that up to 90% of the mercury used during gold panning in Migori is lost to the
environment (Maroa, 2009). Consequently, the mine tailings, soils and waters in these areas
are heavily contaminated with mercury (Mangati, 2005; Odumo et al., 2011, Ngure et al.,
2014, Ogendi et al., 2014, Odumo and Carbonell, 2014). The mercury is washed off to the
nearby streams and rivers by runoff water, thus extending the pollution farther to the water
system in the area. Inland fish farms and Lake Victoria draw their waters from these polluted
streams and rivers with mercury being deposited in the soil sediments, water and eventually
taken up by planktons, insects and other lower organisms which form a significant part of the
diet for the tilapia fish (Boischio and Henschel, 2000; Gibb and O‟Leary, 2014). Mercury
gets absorbed into the fish through feeds, skin and gills where it is partitioned differently
across various tissues depending on the partition coefficients of the tissues to the different
mercury forms (Boeining, 2000; Park and Zheng, 2012). Tilapia brain, liver and muscle
tissues were selected for this study. Tilapia brain and liver have high-fat content hence are
likely to concentrate high amounts of methyl- and other organic forms of mercury, which are
lipophilic (Park and Zheng, 2012). The liver is also the primary organ for metabolism and
elimination of the mercury from the fish. Tilapia fish muscle is the major part of consumed
Page 18
2
by man. Thus it is a tissue of interest in this study since its contamination poses a risk to
human health (Boischio and Henschel, 2000).
Over the course of the last two decades, several studies have evaluated the environmental
effects of heavy metals in water, sediment and aquatic life in Kenya (Ogola et al., 2002;
Campbell et al., 2003; Mangati, 2005; Odumo et al., 2011; Odumo and Carbonell, 2014;
Ngure et al., 2014 and Ogendi et al., 2014). Ogola et al. (2002) reported that the
concentration of mercury (Hg), lead and arsenic in soil and water samples collected from 11
mine sites along the Migori gold mining belt were above acceptable limits. Campbell et al.
(2003) evaluated mercury content in several forms of fish from three rift valley lakes
(Turkana, Naivasha and Baringo). They reported that with the sole exception of two
Hydrocynus forsakhlii (elongate tiger) fish, the contents of mercury in several other forms of
fish were above the WHO recommended levels.
In 2011, Odumo and other workers reported high levels of arsenic (As), copper (Cu), lead
(Pb) and zinc (Zn) in 4 sites within the Migori gold mining belt (Odumo et al., 2011). Later
on, Odumo and Carbonell (2014) evaluated mercury concentrations in soil, lichens, and
mosses within the Migori gold mining belt and reported that they exceeded critical values.
Ngure et al. (2014) evaluated the distribution of arsenic (As), cadmium (Cd), mercury (Hg)
and lead (Pb) in the soil, stream water and whole samples of Rastrineobola argentea (silver
cyprinid) fish in gold mining areas of the Lake Victoria basin. They reported that the
concentration of arsenic (As), cadmium (Cd), lead (Pb) and mercury (Hg) in the fish
exceeded the joint WHO/FAO (JECFA) maximum allowable concentration. In contrast,
Ogendi et al. (2014) reported that the levels of cadmium (Cd), copper (Cu) and lead (Pb) in
water and common carp (Cyprinus carpio) fish from Lake Naivasha in Kenya were
significantly lower than the WHO/USEPA guidelines. However, with continued artisanal
Page 19
3
gold mining in Migori County over the years, there is increased pollution of the area with
mercury thus there was a need to undertake this study.
Artisanal mining in Kenya is a significant contributor to socioeconomic development in areas
where it is practised (Ngure et al., 2014). Nonetheless, it is considered a major source of
pollution, second only to Agriculture (Ngure et al., 2014). Migori County is home to a
vibrant small-scale artisanal mining community where mercury (Hg) is used to extract gold
(Au), as shown in Figure 1 below. However, this process generates large volumes of mine
waste, tailings, and effluents which contain potentially harmful elements such as arsenic (As),
lead (Pb) and mercury (Hg) (Ngure et al., 2014; Gibb and O‟Leary, 2014). These elements
have the potential to bioaccumulate in aquatic ecosystems and may be subsequently
transferred to humans via the food chain (Fallah et al., 2011).
Over the last decade, aquaculture has proliferated in Kenya, mainly due to the Economic
Stimulus Programme according to the report by Kenya Marine and Fisheries Research
Institute (KEMFRI, 2017). About 160 constituencies, including many within the Migori gold
mining belt, have benefited from this programme (Mwamuye et al., 2012). The programme is
mostly dependent on fast-growing forms of fish, such as the Nile tilapia (KEMFRI, 2017).
However, little is known on the consequences of gold mining using mercury on the
contamination levels of mercury in pond sediment, water and farmed as well as captured Nile
tilapia in the region. It is against this background that the present study was aimed to assess
the levels of total mercury on Nile tilapia reared in fish farms in gold mining areas of Migori
County as well as the levels in pond water and sediment, and subsequently assess the
potential risk to human health from consumption of the fish.
Page 20
4
Figure 1: Use of mercury to extract gold during panning in Migori County.
1.2 Research Objectives
1.2.1 General Objective
The broad objective of this study was to assess the levels of total mercury in pond sediments,
water and Oreochromis niloticus niloticus (Nile tilapia) tissues from gold mining areas of
Migori County, Kenya and subsequently assess the potential risk to human health from
consumption of the fish.
1.2.2 Specific Objectives
i. To assess the T-Hg contamination in tissues (brain, liver and muscle) of farmed Nile
tilapia fish from the Migori gold mining belt as well as captured Nile tilapia from
Lake Victoria in Kenya.
ii. To determine the T-Hg contamination in pond water and sediment collected from the
Migori gold mining belt and assess how this contamination relates to pollution in the
fish tissues
Page 21
5
iii. To assess the risk to human health following dietary exposure to T-Hg in different
tissues of Nile tilapia.
1.3. Hypotheses
1.3.1 Null Hypotheses
This study hypothesises that the mean T-Hg levels in the Nile tilapia fish tissues are equal to
or below 0.5µg/g and 0.2µg/g wet weights for the general human population and at-risk
populations, respectively. These are the maximum T-Hg concentration levels in fish tissues
recommended as safe for human consumption by WHO (2016).
Thus the null hypotheses;
H0; T-Hg ≤0.5µg/g wet weight and H0; T-Hg ≤0.2µg/g wet weight for tilapia fish
tissues
Additionally, this study hypothesises that the fish pond soil sediments and waters from the
area are not polluted with mercury. That is, the mean T-Hg values are below the maximum
allowable levels for T-Hg in sediments and water. Sediment contamination levels are
evaluated using a geo-accumulation index (IGEO).
Thus, the null hypotheses;
H0; IGeo≤0 (unpolluted/class 0) for soil sediments (Müller, 1969)
H0; T-Hg ≤0.0001 μg/g for unpolluted surface water (FAO, 1993)
1.3.1 Alternate Hypotheses
The alternate hypotheses for this study are the converse of all the above stated null
hypotheses, suggesting high contamination levels above maximum allowable limits of T-Hg
in all the Nile tilapia tissues, pond sediment and water in the area.
Thus, the alternate hypotheses are;
Page 22
6
Ha; T-Hg ˃0.5µg/g wet weight and Ha; T-Hg ˃ 0.2µg/g wet weight for tilapia fish
tissues for the general and at-risk human populations respectively (WHO, 2016)
Ha; IGeo ˃ 0 (polluted/class 1- 6) for soil sediments (Müller, 1969)
Ha; T-Hg ˃ 0.0001 μg/g for unpolluted surface water (FAO, 1993)
Page 23
7
CHAPTER TWO
LITERATURE REVIEW
2.1 Chemical Forms of Mercury
Mercury exists in several forms. It is a heavy metal and a component element of the earth. In
its pure form, it is also called "metallic" or "elemental" mercury. Mercury is hardly ever
found in nature in its elemental form but rather often in compounds and inorganic salts
(UNEP, 2002). Naturally, Mercury occurs in the environment at deficient concentrations
(UNEP, 2002; Göthberg and Greger, 2006) and exists in many forms, designated "forms"
(UNEP, 2002). Inorganic mercuric compounds, also known as Hg salts, include mercuric
sulphide, mercuric oxide and mercuric chloride. Most mercury salts are in powder or
crystalline form (UNEP, 2002; 2013abc).
Compounds formed from a combination of mercury and carbon are called “organic” mercury
compounds (organomercurials). The number of organic Hg compounds is potentially
significant and includes dimethylmercury, methylmercury, ethylmercury and phenylmercury,
the most common being methylmercury (UNEP, 2002; 2013abc). Both phenylmercury and
methylmercury exist as salts (such as phenylmercuric acetate and methylmercuric chloride).
In this study, all the mercury forms in the sample analytes were reduced to elemental
(metallic) mercury before being swept into the absorption cell for analysis. The resulting
mercury yield referred to as total mercury (T-Hg) therefore gives the total concentration of all
chemical mercury forms in the samples (USEPA, 1998a; USEPA, 1998b; Perkin-Elmer,
2011).
2.2 Mercury Transformation in the Environment
There are several natural forms of mercury in the environment (Ki-Hyun et al., 2016). The
most common natural forms are methylmercury, metallic Hg, mercuric chloride and mercuric
Page 24
8
sulphide. Microorganisms and natural processes can convert environmental Hg from one type
to another (Driscoll et al., 2013; Zheng et al., 2012).
Elemental Hg in the environment can be converted into inorganic Hg forms, making way for
deposition of emitted elemental mercury Hg (Driscoll et al., 2013; Zheng et al., 2012).
Methylmercury is the organic form of Hg most frequently generated by microorganisms and
natural processes (USEPA, 2001a). Edible mammals living in fresh water, salt water and
marine bodies have natural mechanisms to build up (bioaccumulate/biomagnify)
methylmercury levels to levels up to a thousand times greater than that of the surrounding
water which raises a major health hazard concern (Heath, 1987; Whalin et al., 2007).
It is impossible to break down or degrade Hg into a harmless substance for even in its
simplest form, elemental Hg, it still poses a risk of causing harm to both humans and the
environment. Mercury, once released from the earth‟s crust, mineral deposits or fossil fuels
into the biosphere, has high mobility, cycling between the surface of the earth and the
atmosphere (UNEP, 2002; 2013abc). The primary natural reservoirs for Hg are the soils,
water bodies and bottom sediments.
2.3 Significance of Mercury Chemical Forms and Transformation
The different chemical forms Hg exists in plays a critical influence in the toxicity and
exposure of Hg to living organisms (Heath, 1987; UNEP, 2002; 2013abc). For instance, the
forms affect the physical availability of exposure – Hg that is bound tightly to in-absorbable
material cannot be taken up readily (e.g. into the organism's bloodstream). Likewise, it affects
the transport inside the organism to the target tissues – for example, the crossing the blood-
brain barrier or intestinal mucosa; its toxicity; its accumulation, biomodification,
detoxification in tissues and excretion from tissues; its biomagnification as it goes up the
trophic levels of the food chain (particularly for methylmercury) (Park and Zheng, 2012).
Page 25
9
The chemical forms of Hg also determine its transportation within and between
environmental compartments, including the atmosphere and oceans, to mention but a few
(Ki-Hyun et al., 2015). For example, how far Hg emitted from the source is transported in the
air is determined by its chemical form. Moreover, the controllability of Hg emissions to the
atmosphere highly depends on its form. For instance, some control devices (e.g., wet
scrubbers) capture inorganic mercuric compounds emissions (such as mercuric chloride)
reasonably well, while most emission control devices tend to be slow (Ki-Hyun et al., 2016).
2.4 Sources and Toxicology of Mercury
Different chemical forms of Hg have different levels of toxicity – thus, elemental Hg, organic
mercuric compounds and inorganic mercuric compounds exhibit varying symptoms and signs
following exposure (Rice et al., 2014). The different forms of Hg also have various sources
of exposure.
Exposure to alkylmercury compounds, majorly methylmercury, is mainly dietary, especially
via fish and other seafood (Evans et al., 1993; Dorea, 2003, Ki-Hyun et al., 2016). Exposure
to elemental Hg vapour is majorly from dental amalgams for the general population, but
exposure in the line of work in some cases may exceed this by a great deal. Exposure to
inorganic mercurics is mainly dietary (Gibb and O‟Leary, 2014). However, a proportion of
the population gets exposed to inorganic or elemental Hg from using cosmetics containing
mercury, and ritualistic/ cultural use mercury or use in traditional medicine (Ki-Hyun et al.,
2016).
Methylmercury is a neurotoxicant (Davidson et al., 1998; Debes et al., 2006; Davidson et al.
2011). Dietary exposure of methylmercury to pregnant women can lead to subtle, long-term
effects on the developing brain (Myers et al., 2003). It readily crosses the blood-brain barrier
and the placental barrier, resulting in adverse effects on the developing brain. The foetus,
Page 26
10
new-born and young children are considered at-risk populations (ARPs) since they are more
susceptible to mercury exposure due to their developing nervous system. Small increases in
methylmercury exposure could also have adversely affected the cardiovascular system (Park
and Zheng, 2012; Rice et al., 2014; Gibb and O‟Leary, 2014; Ki-Hyun et al., 2016).
Exposure to elemental mercury is mainly through vapour inhalation. Up to 80% of inhaled
vapours are absorbed in the lungs (Ki-Hyun et al., 2016). The vapour readily crosses the
blood-brain barrier causing toxicity to the nervous system. It, however, does not readily
penetrate intestinal membranes. Elemental Hg can undergo oxidation in body tissues to the
inorganic divalent form (Park and Zheng, 2012).
Inhalation of mercury vapours has been shown to cause neurological and behavioural
disorders in humans with symptoms such as tremors, insomnia, neuromuscular changes,
emotional lability, headaches and memory loss (Park and Zheng, 2012). It also causes effects
on the thyroid and kidney and death in cases of high exposure. Metallic mercury and
inorganic mercury salts classified as carcinogenic compounds, but methylmercury is
considered potentially carcinogenic to humans (Rice et al., 2014).
2.5 Uses of Mercury
Despite its potential risks, Hg is still useful in various products and processes worldwide.
Elemental mercury is used in the mining of silver and gold, especially in artisanal and small-
scale setups (UNEP, 2002; 2013abc) such as in Migori gold mining belt; production of vinyl
chloride monomer and chlor-alkali; and in various products such as manometers, electrical
switches, thermometers, dental amalgams and fluorescent lamp bulbs. Compounds of
mercury are also used in making some pharmaceuticals, paints, batteries, as a preservative in
vaccines, pharmaceuticals as well as industrial catalysts and laboratory reagents (UNEP,
2002; 2013abc).
Page 27
11
2.6 Mercury Release to the Environment
Globally, the major sources (up to 50%) of mercury released to the environment are through
natural processes such as volcanic activity and release from leaching from certain soils
(UNEP, 2002; 2013ab). Anthropogenic activities account for the remaining 50% of mercury
released to the environment. This release occurs during production, use or after disposal of
products and wastes containing mercury. The mercury is released through various industrial
sources that result in the release of mercury impurities in input materials such as fuels
(UNEP, 2002; WHO, 2016). Examples of such sources include metal smelters, coal plants,
and cement factories; these are classified as among the sources with the highest emissions of
mercury. The environment is thus contaminated from such discharges, resulting in human
exposures. Emission and exposure levels from a given facility are dependent on several
factors, including levels of mercury in the inputs (such as fuel or feedstock).
In Migori County, human activities such as the use of mercury during artisanal and small-
scale gold mining are the major source of mercury contamination to the environment.
Possible deposition of mercury from the air and dust re-mobilised from far off sources of
contamination cannot be ruled out since mercury can be carried in the air over long distances
of up to 880 kilometres from the contamination sourced (UNEP, 2002). Agricultural inputs
and feeds are also possible sources of mercury contamination in the area.
2.7 Routes of Exposure to Mercury
Mercury bioaccumulates and biomagnifies up the food chain, and human beings are majorly
exposed to methylmercury through diet, primarily through the consumption of fish and other
fish-consuming animals (e.g. marine mammals) (Dorea, 2003, WHO, 2007, 2008; Park and
Zheng, 2012; UNEP 2013ab; Gibb and O‟Leary, 2014; Rice et al., 2014; Ki-Hyun et al.,
2016). The main route of exposure to elemental mercury is through inhalation of air during
industrial activities and from dental amalgams (WHO, 2007). Occupational exposures may
Page 28
12
occur where mercury or its compounds are produced, used in production processes, or
incorporated in final products (WHO, 2008). Such occupational exposures have been
reported from mercury mines, thermometer and sphygmomanometer factories, mercury
refineries, mercury-based small-scale gold and silver mining, chlor-alkali plants, dental
clinics which poorly handle mercury and production of mercury-based chemicals.
Additionally, exposures to elemental mercury may also occur following the use of mercury in
rituals and cultural practices, mercury-containing skin-lightening cosmetics, mercury-
containing traditional medicines, and accidental mercury spillage. Likewise, there are minor
exposures to other forms of organic mercury from the use of thimerosal (ethylmercury
thiosalicylate), which is usually used as a preservative in some vaccines and other
pharmaceuticals (UNEP, 2013abc).
In the Migori gold mining belt, human beings are majorly exposed to methylmercury through
diet, primarily through the consumption of contaminated fish (WHO, 20077; Park and Zheng,
2012; UNEP 2013ab; Gibb and O‟Leary, 2014; Rice et al., 2014; Ki-Hyun et al., 2016). The
main route of exposure to elemental mercury is through inhalation of air during artisanal gold
mining using mercury (where the mercury-gold amalgam is heated to vaporize the mercury
and leave the gold nuggets) (Ogola et al., 2002; Campbell et al., 2003; Mangati, 2005;
Odumo et al., 2011; Odumo and Carbonell, 2014; Ngure et al., 2014 and Ogendi et al.,
2014). There is also a risk of mercury exposure through the skin of the mine workers in the
region as they stir the mercury-gold amalgam with their naked hands during panning as
shown in Figure 1 (page 19).
2.8 Effects of Mercury on Human Health
Every human being is naturally exposed to low mercury levels, but the occurrence and
severity of resulting adverse health effects depend on many factors (Kariuki, 2002). These
Page 29
13
include the chemical form of mercury; the developmental stage of the person exposed (the
foetus being the most susceptible); the duration, dose and route of exposure. Dietary patterns
are also key; a fish-eating population is generally at a higher risk of exposure (Gibb and
O‟Leary, 2014; Rice et al., 2014; Ki-Hyun et al., 2016).
Primarily, mercury and its compounds‟ toxicity targets the nervous system, the
cardiovascular system and the renal system. In overall, developing organ systems such as the
developing foetal nervous system are most susceptible to mercury toxicity. Other systems
may also be affected; the circulatory, gastrointestinal, respiratory, immune, and reproductive
systems (Rice et al., 2014; Ki-Hyun et al., 2016).
Neurotoxicity, especially of the developing nervous system appears to be the most serious
toxicological endpoint caused by exposure to elemental mercury and methylmercury
(Davidson et al., 1998; Debes et al., 2006; Davidson et al. 2011), whereas kidneys‟ damage
is the main result in exposure to inorganic mercury compounds (UNEP, 2002; WHO, 2016).
Several media reports have been made on the toxicity and effects of mercury on the people in
the Migori gold mining belt. Media outlets such as Reuters (2018), Citizen online (2018) and
the Star Newspaper (2019) have reported cases of mercury toxicity amongst the mine
workers. These include health problems, such as weight loss, body weakness, trembling
hands, cancer and even death.
2.9 Populations Susceptible to Mercury Toxicity
Susceptible populations can be divided into two, namely, those who are more sensitive to
toxic mercury effects and those who are more exposed to higher mercury levels (UNEP,
2002). The foetus, the new-born and children, are susceptible due to the sensitivity of their
developing nervous system. On top of in utero exposure, neonates can be further be exposed
through contamination in breast milk. Thus, it is paramount to enhance awareness of the
Page 30
14
potential risks of methylmercury to women who might become pregnant, pregnant women
and new mothers. Individuals with liver, kidney, nervous system and lung diseases are also
susceptible to mercury toxicity (UNEP, 2002).
The other subpopulation that may be highly susceptible is those exposed to higher levels of
methylmercury in the diet. This exposure is due to fish and seafood consumption, especially
if consumed in large quantities and regularly (Rice et al., 2014; Ki-Hyun et al., 2016).
Individuals with dental amalgams are generally more exposed to elemental mercury than
those without. High exposure levels can also be found in studies with high occupational
exposure, and those who use products containing mercury (such as some skin lightening
creams and soaps), mercury-containing traditional medications, or use mercury for cultural
and religious purposes (WHO, 2007; UNEP, 2002; UNEP 2013a).
In the Migori gold mining belt, there are several at-risk populations (ARPs) to mercury
toxicity (Kariuki, 2002). Most notably, pregnant mothers, foetuses and children of
developmental age form a major proportion of the ARPs in this area. From the demographic
records, pregnant women and children below five years are 4.4% and 19.4% respectively of
the general human population in the area (MCG-AWP, 2018). Moreover, the mine workers,
who mostly handle the mercury with their naked hands (as shown in Figure 1 - page 19) are
also at risk to mercury exposure (Ngure et al., 2014 and Ogendi et al., 2014). Since fish
consumption is popular in the area (Githukia et al., 2014), a major part of the community are
frequent fish eaters and are thus at increased risk to exposure to mercury in contaminated fish
(Rice et al., 2014; Ki-Hyun et al., 2016). Other subpopulations that may be at risk in the area
are those with kidney, liver nervous system and lung diseases (UNEP, 2002).
Page 31
15
2.10 Mercury Reference Levels
Various countries and international organisations have come up with reference levels for
daily or weekly mercury exposure. Based on Available data and research, these levels of
exposure are estimated to be without notable risk to human health. Reference levels set
methylmercury intake range from 0.7 to 2 μg/kg body weight per week (UNEP, 2002; WHO,
2007; UNEP 2013a). There are also reference levels set to protect against adverse effects of
inhaling elemental mercury and ingesting inorganic mercurics.
The Joint Food and Agricultural Organization (FAO)/World Health Organization (WHO)
Expert Committee on Food Additives (JECFA), established provisional tolerable weekly
intakes (PTWIs) at 5 μg/kg body weight (for total mercury ) and 1.6 μg/kg body weight (for
methylmercury) (UNEP, 2002; UNEP 2013a; WHO, 2016). The PTWI is defined as the
amount that can be consumed every week throughout one‟s lifetime without significant
effects on health. Its represents admissible human exposure every week while ensuring
protection to the most susceptible subpopulations, to contaminants that cannot be avoided
through the consumption of otherwise wholesome and nutritious foods.
Since fish is the main route of exposure to methylmercury in human, Governments usually
set legal limits for the maximum allowable mercury or methylmercury levels in marketed
fish. For instance, Codex Alimentarius sets guideline levels of 0.5 mg/kg of methylmercury
in non-predatory fish and 1 mg/kg in predatory fish. The US FDA has set a limit of 1 mg/kg
methylmercury in finfish and shellfish (USEPA, 1997). The European Community states a
threshold of 0.5 mg/kg mercury in fish products (with a few exceptions), and Japan allows up
to 0.4 mg/kg total mercury (or 0.3 mg/kg methylmercury) in fish in its market (UNEP, 2002;
2013a).
Page 32
16
Moreover, some Governments and international organisations provide advice on diet to guide
the consumption of certain types and amounts of fish. These guidelines aim to help limit
mercury exposures, and both the benefits and risks of consuming the given fish to the
particular population is considered. This advice serves to guide on the amounts, types and
frequency of fish consumption that is deemed safe or potentially least harmful to the
susceptible population (UNEP, 2002; 2013ab)
For this study, the maximum allowable T-Hg concentration levels in the Nile tilapia fish
tissues were taken as 0.5µg/g and 0.2µg/g wet weights for the general and at-risk human
populations, respectively. These are the maximum T-Hg concentration levels in fish tissues
recommended as safe for human consumption by WHO (2016). Additionally, the mean T-Hg
levels in fish pond sediments were analysed based on their geochemical accumulation
indices, as previously described by Müller (1969) and classified accordingly in classes from
class 0 (unpolluted) to class 6 (extremely polluted). The maximum allowable values for mean
T-Hg in pond water was taken at 0.0001μg/g for unpolluted surface water as set by FAO
(1993).
Page 33
17
CHAPTER THREE
MATERIALS AND METHODS
3.1 Ethical Considerations
Approval to undertake the study was approved by the Graduate School of the University of
Nairobi (Appendix 1). Ethical approval was obtained from the Biosafety, Animal Care, and
Use Committee of the Faculty of Veterinary Medicine, University of Nairobi; REF: FVM
BAUEC/2018/148 (Appendix 2). Extreme caution was exercised in handling concentrated
mercury reagents and acids. Good laboratory practices (GLPs) were observed (use of gloves,
gas masks, overalls and fume chamber) at all times. The working condition of the fume
extraction system within the laboratory was ascertained before the commencement of the
study through the laboratory‟s standard operating procedures (SoP) for fume extraction
system. The thesis write-up was subjected to a plagiarism screening and the report is as
shown in Appendix 4. A manuscript has been developed from the study and submitted for
publication (Appendix 5).
3.2 Pre-treatment of equipment and sample bottles
Precautionary steps, as described by Shafer et al. (1997), were taken before using the
equipment or sample collection bottles. Briefly, all equipment used for sample collection and
storage of sediment, water, and fish samples were pre-cleaned using high-purity nitric acid
and rinsed with sufficient quantities of reagent water. This cleaning was done to ensure that
they were free of trace metals. After cleaning, the bottles were stored in double-bagged zip-
lock polyethene bags to ensure that no detectable metal contaminants were present in the
sampling equipment.
Page 34
18
3.3 Study Area and Sampling Sites
The Migori gold mining belt covers five sub-counties, namely Suna West, Nyatike, Rongo,
Kuria West, and Kuria East within Migori County (Figure 2).
Figure 2: Sub-counties in Migori County, Kenya
The main gold mining sites within the County are situated in Rongo and Nyatike sub-
counties: Macalder, Osiri, Mikei, Masara, Kitere, and Namba, as shown in Figure 3.
Page 35
19
Figure 3: Major gold mining sites within Migori County, Kenya
Adapted from Ogola et al. (2002)
Apart from mining, other economic activities undertaken in the region include livestock
farming, maize, tobacco, and sugar cane farming. The main rivers that drain the region are
Mara, Kuja and Migori (Odumo and Carbonell, 2014).
Page 36
20
Rongo and Nyatike sub-counties were selected for sampling. These regions were chosen
because, in addition to being within the gold mining belt, inland fish farming is widely
practised in the region (Figure 3 and 4). Ten sites namely Minyenya, Kamagambo North,
Masara, Nyabisawa, Ndiwa, Kokaka, Luanda Nyira, Kamagambo South, Siginga beach and
Sori beach located within the two sub-counties (Figure 4) and bearing coordinates between
0°6‟11.16‟‟0°52‟51.6‟‟S and 34°7‟8.434°37‟55.2‟‟E were purposively selected based on
proximity to active gold mining areas.
Figure 4: Map of Migori County showing the sampling sites
Eight sites within the gold mining belt (four sites in Rongo and Nyatike sub-counties
respectively) and two fish landing sites on Lake Victoria (Siginga beach and Sori beach) were
conveniently selected for sampling (Figure 3 above). Samples were collected in November
and December 2015. A total of 163 samples (147 fish, eight water and eight sediment
samples) were obtained, as shown in Table 1.
Page 37
21
Table 1: Total number of sediment, water and Nile tilapia tissue samples from the ten sites in
the study area.
Type of
sample
Samples from
sites in Rongo
Samples from
sites in Nyatike
Samples from sites on
Lake Victoria
Total number
of samples
Sediment 4 4 8
Water 4 4 8
Fish muscle 19 20 10 49
Fish liver 19 20 10 49
Fish brain 19 20 10 49
Total 65 68 30 163
3.4 Sediment Sampling
By use of plastic trowels, near-surface (the top 5 cm) of fish pond sediments weighing
approximately 1000g was taken from each of the selected sites as previously described by
Campbell et al. in 2003. These were then packed in plastic Biological Oxygen Demand
(BOD) bottles and labelled (location, sample type and the date of collection). They were then
kept on ice and transported to the laboratory and stored at 20° C for 11 months until the time
of analysis. Sediment sampling was not done from Lake Victoria due to resource limitations
and sampling complexity involved since the lake has a massive area from which to sample. A
total of 8 pond soil sediment samples were taken for analysis (Table 1).
3.5 Water Sampling
A total of 8 fish pond water samples were obtained from the study area; water samples were
not obtained from the lake (Table 1) due to the complexity of the sampling protocol involved
when taking samples from the lake and resource limitations during the study. Trace metal
clean procedures as described by Shafer et al. (1997) and Shelton and Capel (1994) were
used to collect water samples. Briefly, water samples were collected in 250 ml metal-free
Page 38
22
plastic bottles. They were then acidified to a pH below 2 using ultrapure nitric acid (HNO3)
to prevent adsorption of potentially harmful elements onto the interior walls of the storage
bottles as well as to minimize microbial activity (Figure 5b). Upon arrival at the laboratory,
they were filtered through a 0.45µm pore paper filter (Whatman) and stored in 125 ml metal-
free plastic sample bottles and frozen at -20° C until the time of analysis. Mercury in the
filtrate, also referred to as “dissolved” mercury was of particular interest in this study since it
is more likely to have measurable biological effects on aquatic organisms (Shafer et al.,
1997).
Page 39
23
3.6 Collection of Fish Samples
By use of gillnets (as shown in Figure 5a), five tilapia fish (regardless of their sex) were taken
from each site except the site at Minyenya where four fish were sampled (Table 1).
a) b)
c) d)
Figure 5: shows (a) fish sampling using gill nets, (b) water sampling and filtering, (c)
measuring pond water pH and temperature and (d) labelled Nile tilapia brain samples
Guidelines on the humane harvesting of fish as earlier described by Hill (2014) were used to
euthanize the collected fish. A two-step process involving electro-narcosis and asphyxiation
was used. Fish were initially stunned in an electric field of 2.5V/cm at 1000 Hz to make them
insensible to pain. The absence of eye-roll reflex when the fish were moved from side to side
was used as a confirmation that insensibility had been achieved. Death was then induced by
asphyxiation in the air for 10 seconds and was confirmed by the lack of movement of the
Page 40
24
operculum. A 10 cm2 sample of muscle tissue was taken from each fish using methods earlier
described by Campbell et al. (2003). Liver and brain tissues were similarly harvested. The
collected samples were then transferred to plastic sample bottles which were labelled (Figure
5d above), and packed in self-zipping polyethene bags, frozen and transferred to a -20° C
freezer where they were stored awaiting analysis.
Other physicochemical characteristics of the ecosystem where these inland fish ponds were
located were also described and noted (Appendix 2). These include the fish pond pH, and
temperature (Figure 5c above), the water source for the fish ponds, frequency of water top-up
for the fish ponds, type of fish culture practised in the ponds, mean weight, age and length of
the sampled tilapia fish. These are some of the parameters that are postulated in this study to
directly/indirectly affect the levels of mercury in fish tissues and may form the basis of
further research.
3.7 Reagents
All chemicals and reagents used were of analytical grade (Merck, Germany; Sigma-Aldrich,
France; Central Drug House, India; Fisher Scientific, UK). Double distilled, de-ionised water
was used for preparing working solutions and for all analytical work. Standard stock
solutions of mercury were made from a high purity standard stock solution with a
concentration of 1000 parts per billion (ppb) and were diluted to the corresponding mercury
working standard solutions (i.e.10 ppb, 20 ppb, and 30 ppb). These working solutions were
freshly prepared daily by diluting an appropriate aliquot of the stock solution using 1M
hydrochloric acid (HCl; Sigma-Aldrich) and diluting the resulting solution to 100 ml with
reagent water. Standard reference material for mercury in fish, i.e. the Community Bureau of
Reference (BCR) – 463 (European Commission), was analysed to ascertain the accuracy and
precision of the experimental procedure. Alkaline solutions of sodium borohydride (NaBH4)
Page 41
25
were freshly prepared daily by dissolving 1.0 g of NaBH4 (Merck), and 0.25g of sodium
hydroxide (NaOH) pellets (Merck) in 500 ml of distilled water. 3% v/v of HCl (Sigma-
Aldrich) was used in the preparation of the carrier gas (Argon C45). Stannous chloride
(SnCl2) was freshly prepared by dissolving 62.5 g in 50 ml of 6 M HCl, the solution boiled
for about 5 minutes, cooled, and nitrogen bubbled through it to expel any impurities of
mercury. For sample digestion, 11 M nitric acid (HNO3; Merck), 18 M perchloric acid
(HClO4; Merck) and HCl (Sigma-Aldrich) were used. Fused alumina anti-bumping granules
(Merck) were used to avoid foam formation during sample digestion.
3.8 Equipment and Apparatus
All glassware used in the analysis were soaked overnight in 10 % (v/v) nitric acid (HNO3),
followed by washing with 10% (v/v) hydrochloric acid (HCl). They were then rinsed with
double-distilled water and dried before use. Samples were weighed on an analytical balance,
and sample digestion was carried out in a steam bath (DK Heating Digester from Velp
Scientifica) in the confines of a fume hood. A Varian Model Spectr AA 220Z atomic
absorption spectrometer (Figure 6 below) equipped with a mercury hollow cathode lamp was
used for the analysis of the total mercury content of samples. Flow injection and cold vapour
generation were done via a Varian model vapour generation accessory (VGA) 77. The
analytical wavelength and slit widths were 253.7 nm and 0.5 nm, respectively. The Varian
model, Spectr AA 220Z software, was used to monitor the output.
Page 42
26
Figure 6: The Varian Model Spectr AA 220Z atomic absorption spectrometer fitted with
Varian Model vapour generation accessory (VGA) 77 used for the analysis.
3.9 Sample Preparation and Digestion
All samples, certified reference materials, standards, reagent blanks, and spiked samples were
processed using methods of the United States Environmental Protection Agency (USEPA)
and analytical methods for atomic absorption spectroscopy by Perkin-Elmer (USEPA, 1998a;
USEPA, 1998b; Perkin-Elmer, 2011) with minor modifications. Briefly, a top pan analytical
balance was calibrated before weighing a batch of samples. Samples were removed from the
freezer and allowed to thaw for about an hour. A batch of samples (approximately 20 in
number) was digested simultaneously. A 0.3 - 0.5 g aliquots of well-homogenised samples
were weighed and placed at the bottom of glass digestion tubes. For samples that were less
than 0.5 g (particularly the brain and liver tissues), the whole sample was processed. Nine
millilitres of concentrated nitric acid (HNO3), 3 ml perchloric acid (HClO4) and 1 ml of HCl
(to stabilise the pH of the matrix) was slowly added to the glass digestion tubes in a fume
Page 43
27
hood. The tubes were allowed to stand at room temperature (in the fume hood) until the
initial reaction subsided (about 15 minutes). Spoon scoops of fused alumina anti-bumping
granules (Merck) were added to the solutions to prevent them from bumping and spilling
over. Glass (Soselex) columns were fixed on top of the glass digestion tubes to prevent
spilling over in the event of frothing. The tubes were then placed on top of a steam bath unit
(DK Heating Digester; Velp Scientifica) which was programmed to heat gradually to 150 °C
over 10 minutes. This heating was maintained for 120 minutes to complete dissolution. The
tubes were then removed from the steam bath, and the solutions allowed to cool to room
temperature over 30 minutes. The solutions were then carefully transferred into 100 ml flat-
bottomed volumetric flasks, the tubes and columns rinsed thoroughly with small amounts of
distilled water and the resultant contents transferred into the flat-bottomed volumetric flasks.
Six millilitres of saturated potassium persulfate (K2S2O8) and 30ml of potassium
permanganate (KMnO4) was added to each solution and slightly shaken to mix. The resultant
solutions were left to stand for 40 minutes. Additional portions of the KMnO4 solution were
gradually added until the resulting purple colour persisted for at least 15 minutes. After
thorough mixing, six mL of sodium chloride-hydroxylamine sulphate was added to each
solution to reduce the excess permanganate (this was confirmed by the colour change from
purple to colourless). Reagent water was then added to the mixtures up to the 100 ml mark,
and treated samples were then filtered through grade 541 (diameter 110 µm) filter paper
(Whatman). Five millilitres of stannous sulphate was then added to each of the treated
samples. After that, each sample bottle was attached immediately to the aeration apparatus
(one at a time) of the cold vapour atomic absorption spectrophotometer ready for analysis
(USEPA, 1998a; USEPA, 1998b and Perkin-Elmer, 2011).
Page 44
28
3.10 Analytical Quality Control
Precautionary steps were taken to rule out any interference that may have arisen in the course
of running the analyses. Briefly, blanks were analysed in order to ensure that all the materials
(solvents, reagents, glassware, and other sample processing hardware) were free from
artefacts or interferences which may have had the potential to compromise the integrity of the
analysis. Interference from sulphide was minimised by the use of potassium permanganate
(KMnO4). Excess hydroxylamine sulphate reagent (about 25 mL) was used to ensure that
free chlorine was absent in the mixture before the mercury was reduced and swept into the
cell (USEPA, 1998a; USEPA, 1998b) since chlorine gas absorbs light at 253.7nm, which is
close to 253nm - the wavelength at which mercury absorbs light. Also, the dead air space in
the BOD bottle was purged before adding stannous sulphate. A preliminary run using reagent
water was also used to rule out interference by volatile organic materials which absorb at
wavelengths close to the wavelength at which mercury absorbs. Moreover, the accuracy of
the procedure was determined by analysing three certified reference materials (CRMs)
namely; Tuna fish muscle fapas CRM, BCR 463 from Community Bureau of Reference -
European Commission, vegetable puree CRM (EU) and fish CRM (EU). Recovery studies
were performed by adding a known amount of standard solution of mercury chloride to
spiked samples, which were then taken through the digestion procedure. The concentration of
mercury in the resulting solutions was then analysed in order to assess the mercury
concentrations in the tilapia tissue samples, factoring in the dilution factors in the sample
mixtures (USEPA, 1998a; USEPA, 1998b and Perkin-Elmer, 2011).
3.11 Analysis of Mercury in Collected Samples
The optimum operating temperature of the Cold Vapour Atomic Absorption Spectrometer
(CVAAS) instrument was set at 18 °C, and the circulating pump was adjusted to pump at the
rate of 1 L/min continuously (Perkin-Elmer, 2011). Maximum absorbance was noted within
Page 45
29
30 seconds. The bypass valve was then opened, and aeration continued until absorbance
returned to the minimum value. The bypass valve was then closed, the fritted tubing removed
from the BOD bottle, and aeration continued. The measurement time was set at 5 seconds,
with a pre-reading delay of 45 seconds in between readings. Aliquots of 1.0, 2.0 and 3.0 mL
of the mercury working standard (containing 0.1 mg/L or 1000 ppb) of mercury and 1ml of
hydrochloric acid (HCl) solution was transferred to a series of 100 mL volumetric flasks and
made up to the mark with reagent water. The standards had 10, 20 and 30 ppb of mercury,
respectively. A calibration curve was automatically generated from the instrument's software,
plotting the absorbance of the standard versus parts per billion (ppb) of mercury (USEPA,
1998a; USEPA, 1998b and Perkin-Elmer, 2011). The absorbance of the samples and
standards were determined from the recording device and corresponding mercury
concentrations tabulated.
3.12 Evaluation of the Degree of Sediment Contamination
The quantitative geochemical accumulation index (IGeo) was used to evaluate the level of
mercury contamination in fish pond sediments collected from different sampling sites. This
method follows the formula proposed by Müller (1969) to calculate the degree to which
sediment is contaminated by mercury. Thus, IGeo= log2 (Cn/1.5×Bn),
Where IGeo = the geochemical accumulation index
Cn = sediment metal concentration
Bn = geochemical background value of the metal
In this study, the global mercury background value of 0.05 μg/g wet weight, as described by
Reimann and de-Caritat (1998) was used. Accordingly, mercury pollution in collected
sediments is classified into seven categories (0 - 6) by Müller (1969) as:
class 0 (unpolluted; IGeo≤0)
Page 46
30
class 1 (unpolluted to moderately polluted; 0≤IGeo≤1)
class 2 (moderately polluted; 1≤IGeo≤2)
class 3 (moderately to strongly polluted; 2≤IGeo≤3),
class 4 (strongly polluted; 3≤IGeo≤4)
class 5 (strongly to extremely polluted; 4≤IGeo≤5)
class 6 (extremely polluted; IGeo>5)
3.13 Risk‑ based consumption limits
Guidelines set by the United States Environmental Protection Agency (USEPA, 1989; 2000)
were used to calculate the potential health risk from consumption of Nile Tilapia sampled in
the region. An assumption was made that the ingestion dose was equal to the absorbed dose
of Hg as has been described previously by Chien et al. (2002). Calculations on mercury
consumption limits were based on the USEPA reference dose (RfDo). The ratio between
exposure and the reference dose indicated by the target hazard quotient (THQ), were
calculated on the assumption of an integrated USEPA risk analysis model. The methods
described by Copat et al. (2013a, 2013b) were used to estimate the daily intake per meal
(EDIm) and the target hazard quotient (THQ) as shown below;
EDIm = MS × C
BW
THQ = EDIm
Rf Do
Where EDIm is the estimated daily intake of mercury per meal size;
MS is the standard weight portion of fish (230 g) for adults (Hosseini et al., 2013);
C refers to the concentration of mercury in mg/kg wet weight (Marrugo-Negrete et al.
(2008);
Page 47
31
BW is the body weight of (taken as 70 kg for an adult human being) (Copat et al.,
2013a);
RfDo for T-Hg is 0.1 μg/g/day (USEPA, 2000).
For non-carcinogenic effects, the maximum allowable fish consumption rate in meals/week
(CRmw) according to the USEPA (2000) that would not be expected to cause any chronic
systemic effects were calculated as below;
CRmw = 49
C × MS
Where MS is the standard weight portion of fish taken as 230 g for adults (Hosseini et al.,
2013) C is the concentration of mercury in mg/kg wet weight (Marrugo-Negrete et
al., 2008).
3.14 Statistical Analysis
Data for mercury analysis was expressed as the mean ± standard deviation. One-Way
Analysis of Variance (ANOVA) was used to analyse the levels of mean T-Hg in fish tissues
across the sites. Tukey's HSD test was used as a post-hoc test. Pearson's rank correlation was
used to determine whether there were any relationships between mercury levels in water and
those in fish tissues, levels of mercury in sediment and those in fish tissues, and the levels of
mercury in fish tissues and the pH of the pond water. The same test was also used to
determine relationships between the levels of mercury in fish tissues and pond water pH,
temperature, weight, and age of the fish. The t-test was used to analyse the relationship
between the level of mercury and the type of fish culture practised. Contamination levels in
the soil and water samples from the different sites were also analysed. Microsoft Excel
(2016) and Statistical Package for the Social Sciences (SPSS, version 20.0) were used for
statistical analysis. p≤0.05 was considered significant in all cases.
Page 48
32
CHAPTER FOUR
RESULTS AND DISCUSSION
4.1 RESULTS
4.1.1 Mean T-Hg levels in the Nile tilapia tissue samples
In brief, mercury contamination was established across all the sampling sites, but the degree
of mercury contamination varied from one site to another and from one tissue to another.
Table 2 shows the levels of mean T-Hg in Nile tilapia brain, liver and muscle tissues across
the sites. All mean T-Hg measures are in µg/g wet weight (ww). The concentrations of mean
T-Hg were highest in the tilapia brain, ranging from 0.128±0.021 µg/g ww (n= 5, 95% CI) at
Nyabisawa in Nyatike to 3.798±1.421 µg/g ww (n= 4, 95% CI) at Minyenya in Rongo. The
mean T-Hg in tilapia muscle ranged from 0.179±0.020 µg/g ww (n= 5, 95% CI) at
Kamagambo south in Rongo to 0.595±0.065 µg/g ww (n= 5, 95% CI) at Masara in Nyatike.
Mean T-Hg levels were lowest in tilapia liver; ranging from 0.103±0.118 µg/g ww (n= 5,
95% CI) at Kamagambo South in Rongo to 0.588±0.374 µg/g ww (n= 5, 95% CI) at Kokaka
in Rongo.
Page 49
33
Table 2: Mean T-Hg levels (in µg/g ww) in Nile tilapia tissues across the sites
Site
Location
Site name Brain
(n = 5, 95%CI)
Liver
(n = 5, 95%CI)
Muscle
(n = 5, 95%CI)
Nyatike
Nyatike
L. Victoria
L. Victoria
Nyatike
Nyatike
Rongo
Rongo
Rongo
Rongo
Luanda Nyira
Ndiwa
Siginga beach
Sori beach
Masara
Nyabisawa
Kamagambo
South
Kamagambo
North
Minyenya*
Kokaka
2.543±1.095 f
1.994±0.678def
1.436±0.588cde
0.501±0.09 ab
0.865±0.281abc
0.128±0.021 a
0.476±0.171ab
1.186±0.847bcd
3.798±1.421* g
2.161±0.635f
0.298±0.096 abcd
0.176±0.090 ab
0.563±0.338 d
0.445±0.105 bcd
0.483±0.134 cd
0.226±0.038 abc
0.103±0.118 a
0.447±0.594 bcd
0.108±0.038* a
0.588±0.374d
0.301±0.069 bc
0.374±0.056 c
0.488±0.061 de
0.545±0.159 e
0.595±0.065 e
0.385±0.103 cd
0.179±0.020 a
0.261±0.155 ab
0.917±0.099* f
0.349±0.015b
* n = 4
a, b, c, d, e, f, g mean T-Hg levels with different letters are significantly different
4.1.2 Comparison of the mean T-Hg levels in Nile tilapia tissues across the sample sites
with the WHO critical values for T-Hg in fish
The WHO (2016) has set the critical values of 0.2 µg/g ww and 0.5 µg/g ww as the maximum
allowable levels of T-Hg in fish that are deemed safe for human consumption by the ARPs
and the general human population respectively. In this study, the levels of mean T-Hg in all
the Nile tilapia tissues (brain, liver, muscle) across the sites were found to be significantly
greater than the critical value of 0.2 µg/g ww (n=49, 95%CI) as shown in Table 3. However,
only the Nile tilapia brain tissues were found to have mean T-Hg levels which were
significantly greater than the critical value of 0.5 µg/g ww (n=49, 95%CI).
Page 50
34
Table 3: T-Test of mean T-Hg content in fish tissues and critical values of 0.2 and 0.5 µg/g
ww
*significant values
4.1.3 Comparison of the mean T-Hg levels in Nile tilapia brain samples across the sites
The mean T-Hg levels in the Nile tilapia brain tissues across the sites ranged from
0.128±0.021 µg/g ww (n= 5, 95% CI) at Nyabisawa in Nyatike to 3.798±1.421 µg/g ww (n=
4, 95% CI) at Minyenya in Rongo (Table 2), with the brain tissues showing the highest levels
of mean T-Hg compared to the muscle and liver tissues across all the sites.
Table 4 is a summary of the results of the analysis of the mean T-Hg (µg/g ww) in levels in
tilapia brain tissues across the sites showing that the mean T-Hg levels in the brain tissues are
significantly different from one site to another (sig. = 0.000 at 95%CI).
Table 4: One Way ANOVA of mean T-Hg levels in Nile tilapia brain tissues across the sites
Sum of Squares Degrees of freedom Square F Sig.
Between Groups 38.864 9 4.318 12.018 0.000
Within Groups 14.013 39 0.359
Total 52.877 48
Fish Tissues Sample size (n) Critical Value
(µg/g ww)
Mean THg
(µg/g ww)
Std. Err t -values Sig.
Brain 49 0.2 1.353 0.150 7.687 0.000*
0.5 1.353 0.150 5.686 0.000*
Liver 49 0.2 0.294 0.028 3.341 0.001*
0.5 0.294 0.028 - 7.300 1.000
Muscle 49 0.2 0.413 0.031 6.773 0.000*
0.5 0.413 0.031 - 2.787 0.996
Page 51
35
Further analysis of the variation revealed that there was no significant difference (at 95% CI)
in the mean T-Hg levels in the tilapia fish brain from the different sampling locations (Rongo,
Nyatike and Lake Victoria) as shown in Table 5.
Table 5: Tukey‟s HSD results showing homogeneous subsets for mean T-Hg levels in Nile
tilapia brain tissues across the sample sites
Site of Data Collection
Subsets’ Mean THg (µg/g ww)
Location 1 2 3 4
Nyabisawa Nyatike 0.128
Kamagambo South Rongo 0.475
Sori Beach Lake Victoria 0.500
Masara Pond Nyatike 0.864 0.864
Siginga Beach Lake Victoria 1.114 1.114 1.114
Kamagambo North Rongo 1.210 1.210 1.210
Luanda Nyira Nyatike 2.084 2.084 2.084
Kokaka Rongo 2.165 2.165
Ndiwa Nyatike 2.215 2.215
Minyenya Rongo 3.128
Sig. 0.165 0.076 0.149 0.201
4.1.4 Comparison of the mean T-Hg levels in the Nile tilapia muscle samples across the
sites
The mean T-Hg levels in the Nile tilapia muscle tissues across the sites ranged from
0.179±0.020 µg/g ww (n= 5, 95% CI) at Kamagambo south in Rongo to 0.595±0.065 µg/g
ww (n= 5, 95% CI) at Masara in Nyatike (Table 2).
Table 6 is a summary of the results of the analysis of the mean T-Hg levels in tilapia muscle
tissues across the sites showing that the mean T-Hg levels in the muscle tissues are
significantly different from one site to another (sig. = 0.000 at 95%CI).
Page 52
36
Table 6: One Way ANOVA of mean T-Hg levels in Nile tilapia muscle tissues across the
sample sites
Sum of Squares Df Square F Sig.
Between Groups 1.998 9 0.222 27.239 0.000
Within Groups 0.318 39 0.008
Total 2.316 48
Further analysis of the variation revealed that there was no significant difference (at 95% CI)
in the mean T-Hg levels in the tilapia muscle tissues from the different sampling locations
(Rongo, Nyatike and Lake Victoria) as shown in Table 7.
Table 7: Tukey HSD results showing homogeneous subsets for mean T-Hg levels in Nile
tilapia muscle tissues across the sample sites
Site of Data Collection
Subsets’ Mean THg (µg/g ww)
Location 1 2 3 4 5
Kamagambo South Rongo 0.109
Kamagambo North Rongo 0.182 0.182
Luanda Nyira Nyatike 0.306
Kokaka Rongo 0.349 0.349
Nyabisawa Nyatike 0.370 0.370
Ndiwa Nyatike 0.373 0.373
Masara Pond Nyatike 0.513 0.513
Siginga Beach Lake Victoria 0.532 0.532
Sori Beach Lake Victoria 0.603
Minyenya Rongo 0.880
Sig. 0.957 0.057 0.079 0.859 1
Page 53
37
4.1.5 Comparison of the mean T-Hg levels in Nile tilapia liver tissues across the
sample sites
The mean T-Hg levels in the Nile tilapia liver tissues across the sites ranged from
0.103±0.118 µg/g ww (n= 5, 95% CI) at Kamagambo South in Rongo to 0.588±0.374 µg/g
ww (n= 5, 95% CI) at Kokaka in Rongo (Table 2), with the liver tissues showing the lowest
levels of mean T-Hg compared to the muscle and brain tissues across all the sites.
Table 8 is a summary of the results of the analysis of the mean T-Hg levels in tilapia liver
tissues across the sites showing that the mean T-Hg levels in the brain tissues are
significantly different from one site to another (sig. = 0.000 at 95%CI).
Table 8: One Way ANOVA of mean T-Hg levels in Nile tilapia liver tissues across the
sample sites
Sum of Squares Df Square F Sig.
Between Groups 0.959 9 0.107 4.568 0.000
Within Groups 0.91 39 0.023
Total 1.87 48
Further analysis of the variation revealed that there was no significant difference (at 95% CI)
in the mean T-Hg levels in the tilapia liver from the different sampling locations (Rongo,
Nyatike and Lake Victoria) as shown in Table 9.
Page 54
38
Table 9: Tukey HSD results showing homogeneous subsets for mean T-Hg levels in Nile
tilapia liver tissues across the sample sites
Site of Data Collection
Subsets’ Mean THg (µg/g ww)
Location 1 2 3
Kamagambo South Rongo 0.0815
Minyenya Rongo 0.1128
Ndiwa Nyatike 0.1928 0.1928
Nyabisawa Nyatike 0.2187 0.2187 0.2187
Kamagambo North Rongo 0.2278 0.2278 0.2278
Luanda Nyira Nyatike 0.3041 0.3041 0.3041
Kokaka Rongo 0.3916 0.3916 0.3916
Siginga Beach Lake Victoria 0.3959 0.3959 0.3959
Sori Beach Lake Victoria 0.4505 0.4505
Masara Pond Nyatike 0.5299
Sig. 0.07 0.236 0.075
4.1.6 Mean T-Hg levels in fish pond sediments samples across the sites
As shown in Table 10, concentrations of mean T-Hg in pond sediments ranged from
0.208±0.000 to 1.113±0.008 µg/g ww (n= 8, 95% CI). Six of the eight sample sites were
moderately polluted (1≤IGeo˂2). Two sites (Minyenya and Kokaka – both from Rongo) were
strongly polluted (3≤IGeo˂4). The geochemical accumulation indices were calculated as
explained in section 3.12 of materials and methods (chapter three – page 31) and the sites
classified based on the degree of T-Hg contamination. The normal geo-accumulation index of
unpolluted soil sediment should be below or equal to 0 (class 0; unpolluted; IGeo≤0) as
proposed by Müller (1969).
Page 55
39
Table 10: Mean T-Hg levels in fish pond sediments and geo-accumulation analysis
Site
Location
T-Hg (µg/g)
(n=8, 95%CI)
Geo
accumulation
index (IGeo)
Sediment
quality
Luanda Nyira Nyatike 0.208±0.000 1.472 Moderately
polluted
Ndiwa Nyatike 0.211±0.001 1.492 Moderately
polluted
Kamagambo
South
Rongo 0.240±0.002 1.678 Moderately
polluted
Masara Nyatike 0.249±0.001 1.731 Moderately
polluted
Nyabisawa Nyatike 0.258±0.001 1.782 Moderately
polluted
Kamagambo
North
Rongo 0.282±0.001 1.911 Moderately
polluted
Kokaka Rongo 1.102±0.013 3.877 Strongly
polluted
Minyenya Rongo 1.113±0.008 3.891 Strongly
polluted
4.1.6 The relationship between mean T-Hg levels in fish pond soil sediments and Nile
tilapia fish tissues
The mean T-Hg content in the soil sediments at the various sampling sites were compared
with the corresponding levels in tilapia tissues from the same sites, as shown in Table 11.
The findings show that an increase in mean T-Hg content in the pond soil sediment coincided
with increase in the mean T-Hg content in tilapia brain tissues (r= 0.528, sig. = 0.001, 95%
CI) and increased in mean T-Hg content in the tilapia muscle tissues (r= 0.524, sig. =0.001,
95% CI). However, there was no significant correlation between the mean T-Hg levels in
pond sediments and tilapia liver tissues (sig. =0.923, 95% CI).
Page 56
40
Table 11: Bivariate correlation between mean T-Hg levels in pond sediment and tilapia
tissues
Mean T-Hg Content in
Soil Sediment
Brain
Tissues
Liver
Tissues
Muscle
Tissues
Pearson Correlation
Coefficient
0.528 0.016 0.524
Sig. (2tailed) 0.001* 0.923 0.001
*
N 39 39 39
*significant correlation
4.1.7 Mean T-Hg levels in fish pond water samples across the sites
Mean T-Hg in the water samples ranged from 0.002±0.000 to 0.004±0.001 µg/ml (n=8, 95%
CI) with all the sites having higher values (up to 40 times higher) for T-Hg than the
maximum contaminant level of 0.0001 μg/ml allowable for mean T-Hg in unpolluted surface
water set by FAO (1993) as shown in Table 12.
Table 12: Mean T-Hg levels in fish pond water sampled from different sites in the study area
Site Location Mean T-Hg (μg/ml)
Minyenya Rongo 0.002
Kokaka Rongo 0.002
Masara Nyatike 0.003
Kamagambo North Rongo 0.004
Nyabisawa Nyatike 0.004
Ndiwa Nyatike 0.004
Luanda Nyira Nyatike 0.004
Kamagambo South Rongo 0.004
Page 57
41
4.1.8 Comparison of the mean T-Hg levels in pond water samples across the sites with
the FAO critical values for T-Hg in unpolluted surface water
The water samples from all the sites were found to have mean T-Hg levels that were
significantly greater than the critical value of 0.0001µg/ml (n=8, sig. = 0.000 at 95% CI) set
by FAO (1993) for unpolluted surface waters as shown in Table 13.
Table 13: T-Test of mean T-Hg content in water samples and critical values of 0.0001µg/ml
Samples Sample
size (n)
Critical
Value
(µg/ml)
Mean
T-Hg
(µg/ml)
Std. Err t -values Sig.
Water 8 0.0001 .003375 .0003239 10.111 0.000
4.1.9 The relationship between mean T-Hg levels in water and fish tissues
The relationships between the mean T-Hg content in water and fish samples across the sites
were analysed, as shown in Table 14. The results show that an increase in mean T-Hg content
in the pond water coincided with decrease in the mean T-Hg content in tilapia brain (r= -
0.402, sig. = 0.011, 95% CI) and muscle tissues (r= - 0.616, sig. =0.000, 95% CI). However,
there was no significant correlation between the mean T-Hg levels in pond water and tilapia
liver samples (sig. =0.874, 95% CI).
Table 14: Bivariate correlation between mean T-Hg levels in water and tilapia tissues
Levels of T-Hg in
Water
Brain
Tissues
Liver
Tissues
Muscle
Tissues
Pearson Correlation
Coefficient (r)
- 0.402 - 0.026 - 0.616
Sig. (2tailed) 0.011* 0.874 0.000
*
n 39 39 39
*significant correlation
Page 58
42
4.1.10 Risk-based consumption limits
Table 15 is a summary of the risk-based consumption limits calculated across the sites, as per
the guidelines earlier described in section 3.13 of materials methods (pages 31 and 32), using
an integrated USEPA risk analysis model described by Copat et al. (2013a, 2013b) and
USEPA (1989; 2000). There was no particular pattern of the safety of the Nile tilapia to
human consumption across the sites but, from the findings, Nile tilapia reared in Kamagambo
South in Rongo was deemed safest.
Page 59
43
Table 15: Risk‑ based consumption parameters for Nile tilapia from the sample sites
Sampling
site
Location
Nile tilapia
Tissue
T-Hg ± SD
(µg/g), n= 49
EDIm
(µg/g)
THQ
CRmw
(Meals
per week)
Kamagambo
South
Rongo
Brain
Liver
Muscle
0.476±0.171
0.103±0.118
0.179±0.020
1.56
0.34
0.59
15.6
3.4
5.9
4
Nyabisawa
Nyatike
Brain
Liver
Muscle
0.128±0.021
0.226±0.038
0.385±0.103
0.42
0.74
1.27
4.2
7.4
12.7
3
Minyenya
Rongo
Brain
Liver
Muscle
3.798±1.421
0.108±0.038
0.917±0.099
12.48
0.35
3.01
124.8
3.5
30.1
2
Kamagambo
North
Rongo
Brain
Liver
Muscle
1.186±0.847
0.447±0.594
0.261±0.155
3.90
1.47
0.86
39
14.7
8.6
2
Ndiwa
Nyatike
Brain
Liver
Muscle
1.994±0.678
0.176±0.090
0.374±0.056
6.55
0.58
1.23
65.5
5.8
12.3
2
Luanda
Nyira
Nyatike
Brain
Liver
Muscle
2.543±1.095
0.298±0.096
0.301±0.069
8.36
0.98
0.99
83.6
9.8
9.9
2
Sori beach
Lake
Victoria
Brain
Liver
Muscle
0.501±0.09
0.445±0.105
0.545±0.159
1.65
1.46
1.79
16.5
14.6
17.9
1
Masara
Nyatike
Brain
Liver
Muscle
0.865±0.281
0.483±0.134
0.595±0.065
2.84
1.59
1.96
28.4
15.9
19.6
1
Siginga
beach
Lake
Victoria
Brain
Liver
Muscle
1.436±0.588
0.563±0.338
0.488±0.061
4.72
1.85
1.60
47.2
18.5
16.0
1
Kokaka
Rongo
Brain
Liver
Muscle
2.161±0.635
0.588±0.374
0.349±0.015
7.10
1.93
1.15
71
19.3
11.5
1
Page 60
44
4.1.11 Miscellaneous study findings: the relationships between pond water pH, pond water
temperature, tilapia samples’ weights and age and the mean T-Hg levels in tilapia samples
The physicochemical and biotic characteristics of the ecosystems of the sites of sample
collection were noted and summarised in Appendix 3. These parameters included the pond water
pH and temperature at the time of samples‟ collection, the weight, age and length of the tilapia
fish collected, source of water for the fish ponds and frequency of water top-up for the fish ponds
and the type of fish-culture practised in the farms. Although it was not part of the objectives of
this study, some of these parameters were analysed to gauge their effect on T-Hg in the tilapia
tissues sampled. The findings of this analysis are shown in Table 16 and 17.
Table 16: Bivariate correlation between water pH, water temperature, the weight of fish, and fish
age with T-Hg content in tilapia fish tissues
Fish
Brain
Fish
Liver
Fish
Muscle
Water pH
Pearson Correlation
Coefficient
0.48 0.113 0.21
Sig. (2 tailed) 0.000* 0.44 0.149
n 49 49 49
Water
Temperature
(°F)
Pearson Correlation
Coefficient
0.404 0.041 0.232
Sig. (2 tailed) 0.004* 0.778 0.109
n 49 49 49
Weight of the
Fish (g)
Pearson Correlation
Coefficient
- 0.623 - 0.033 0.104
Sig. (2 tailed) 0.000* 0.822 0.476
n 49 49 49
Fish Age
(Months)
Pearson Correlation
Coefficient
- 0.154 - 0.196 - 0.221
Sig. (2 tailed) 0.348 0.231 0.177
n 39 39 39 *significant correlation
Page 61
45
Table 17: Independent two-sample t-test of mean T-Hg in fish tissues and fish-culture practised
Fish Tissue Group Observations (n) t-values Std. Err Sig.
Brain
Monoculture 20 1.246
0.588
0.240
0.559
Polyculture 29 1.426 0.194
Diff 0.181
Liver
Monoculture 20 0.300
2.239
0.030
0.002*
Polyculture 29 0.490 0.044
Diff 0.189
Muscles
Monoculture 20 0.221
3.248
0.036
0.030* Polyculture 29 0.345 0.038
Diff 0.123 0.240
*significant values
Water pH and the mean T-Hg levels in tilapia tissues
A positive correlation was identified (r=0.48, sig. =0.000, p<0.05) implying that as the pH of the
water increases, the level of mercury in fish brain tissues also increases (Table 16). However,
there was no relationship noted between water pH and the levels of T-Hg in the liver and muscle
tissues of the tilapia fish samples.
Water temperature and the mean T-Hg levels in tilapia tissues
There was a positive correlation (r=0.404, sig. =0.004, p<0.05) between the water temperature
and the T-Hg level in fish brain tissues (Table 16) which means that high water temperature was
associated with higher T-Hg levels in fish brain tissues. There was no relationship noted between
the water temperature and the T-Hg levels in tilapia liver and muscle tissues.
Weight of the tilapia fish and the mean T-Hg levels in the tissues
The weight of the fish was found to have a negative correlation (r = -0.623; sig. =0.000, p<0.05)
to T-Hg levels in the tilapia brain tissues (Table 16) implying that the larger the fish, the lower
the level of mercury in fish brain tissues. No correlation between the weights of the tilapia fish
Page 62
46
and the T-Hg levels in the liver and muscle samples was established from the results in this
study.
Age of the tilapia fish and the mean T-Hg levels in tissues
The study established that there was no correlation between the age of the fish and the level of
mercury in the brain, liver and muscle tissues of fish (Table 16).
Type of fish culture practised and the mean T-Hg levels in tilapia tissues
There was no significant difference in the mean T-Hg levels in tilapia brain tissues regardless of
the type of fish culture practised (Table 17), but there was a significant difference in the mean T-
Hg levels in fish liver and muscle tissues across the two cultures.
4.2 DISCUSSION
4.2.1 Mean T-Hg levels in the Nile tilapia brain, liver and muscle tissues
Mercury is a global environmental pollutant that poses a significant risk to human and animal
health. It is transferred through trophic levels and biomagnification in the food chain (Jinadasa et
al., 2013). Fish have been identified as the primary source of mercury in the human diet (Evans
et al., 1993; Dorea, 2003). Oreochromis niloticus niloticus (Nile Tilapia) is an omnivore with an
extensive food web that includes plants, phytoplankton, insects, diatoms, algae, and mosquito
larvae (Mwamuye et al., 2012; BBC NEWS, 2007). It has a lifespan of about nine years and is
the fish of choice for fish farmers in the Migori gold mining belt (Mwamuye et al., 2012;
Githukia et al., 2014). It was therefore ideal for use in monitoring the bioaccumulation of T-Hg
in the region. Fish can take up mercury from their environment and store it in relatively high
concentrations in their tissues (Giblin and Massaro, 1973; Park and Zheng, 2012; Zheng et al.,
2012).
Page 63
47
As shown in Table 2, the levels of T-Hg recorded in the Nile tilapia brain tissues were highest in
Minyenya – Rongo with the mean T-Hg content of 3.798±1.421µg/g ww (n=4, 95% CI). This
value is eight times higher than the WHO/FAO JECFA critical reference guideline value for the
general human population of 0.5µg/g ww (WHO, 2007, 2008, 2016) and 19 times higher than the
WHO/FAO JECFA critical reference values of 0.2µg/g ww for at-risk populations. The at-risk
populations include pregnant women, children under five years, frequent fish eaters and people
with lung, kidney and liver diseases (Campbell et al., 2003b). The study findings contradict those
of Campbell et al. (2003) who had reported that the levels of mercury in several forms of fish
captured from African Lakes including Lake Victoria had mercury levels that were within WHO
limits. Given that up to 90% of the mercury used in gold mining in the area is lost to the
environment (Maroa, 2009), increased contamination of the area with mercury over time, may
have led to these higher contamination levels.
Ogola et al. (2002) evaluated the impact of gold mining on the environment and human health in
the Migori gold mining belt and made several recommendations. Among the recommendations,
was the need to accord technical and professional assistance to artisan miners to improve their
skills in gold mining and gold processing. The need for the formation of strong mining
committees tasked with planning and managing gold mining sites and need for mine owners to
collaborate with Government agencies to control pollution were the other recommendations of
their study. However, this study‟s observations of high levels of mercury in fish tissues in the
region suggest that these recommendations are yet to be implemented.
In this study, the levels of total mercury in the fish tissues were highest in the brain, followed by
liver and lowest in the muscle tissues suggesting that brain tissues of Nile tilapia in the region
release mercury at a slower rate than liver and muscle tissues. It may also indicate that the
Page 64
48
distribution and accumulation of mercury in tissues of Nile tilapia seems to be biased towards the
brain tissue since it is rich in fats and oils and methyl- and other organic forms of mercury which
are highly lipophilic partition better in the brain tissues (Park and Zheng, 2012). The role of
metabolism on mercury bioaccumulation in the different tissues cannot be ruled out either
(Giblin and Massaro, 1973; Park and Zheng, 2012; Zheng et al., 2012). Hypothetically, the
metabolic rate in the brain tissues of Nile tilapia within the region was higher than the other
tissues, and this may have predisposed fish brain tissues to a higher assimilation efficiency for
methylmercury than other tissues. Methylmercury has a strong affinity for sulfhydryl groups in
tissues and accumulates to a higher concentration in brain, muscle, and kidney tissues (Grieb et
al., 1990).
It is widely accepted that the muscle is the most edible and palatable part of fish. However,
among the local community that resides in the region (particularly the Luo), eating the fish brain
is an age-old tradition that is widely popular (Githukia et al., 2014). The local folk hypothesise
that eating the fish brain improves the intelligence quotient of the consumer significantly. From
this study, this may be the most dangerous part of the fish to eat as methylmercury (a significant
contributor of total mercury) is not eliminated from fish tissues by any practical cooking method
(Grieb et al., 1990).
4.2.2 Levels of mercury in pond soil sediments and geo-accumulation analysis
There were mixed findings, with mercury pollution noted in pond soil sediment samples across
all the study sites, as shown in Table 10. In brief, Concentrations of mean T-Hg in sediments
ranged from 0.208±0.000 to 1.113±0.008 µg/g ww (n= 3, 95% CI) with six of the eight sample
sites being moderately polluted (1≤IGeo˂2), whereas two sites (Minyenya and Kokaka – both
Page 65
49
from Rongo) being strongly polluted (3≤IGeo˂4). However, the levels reported in this study were
significantly lower than those reported by related studies in Africa (Donkor et al., 2006; Asare-
Donkor and Adimado, 2016). Notwithstanding, in the context of the Hg threshold of 0.2 µg/g for
sediments suggested by Salomons and Förstner (2012) and the geo-accumulation indices
realised, on average, all the sample sites in the Migori gold mining belt may be considered to be
moderately to highly polluted with mercury.
4.2.3 The relationship between mean T-Hg levels in pond soil sediments and Nile tilapia
tissues
There is a consensus that heavy metal uptake by aquatic organisms occurs via water, food and
sediment (Kalay et al., 1996; Boischio and Henschel, 2000; Fallah et al., 2011; Park and Zheng,
2012; Gibb and O‟Leary, 2014). However, the rate of heavy metal uptake from these sources
may be dependent on the ecological needs, metabolic patterns of aquatic organisms and other
factors such as salinity, temperature and interacting agents (Health AG, 1987; Roesijadi, 1994;
Langston, 2017). As shown in Table 14, this study revealed that the higher the levels of T-Hg in
soil sediments, the higher the levels of T-Hg in tilapia fish tissues (notably brain and muscle with
r= 0.528, sig. = 0.001, 95% CI and r= 0.524, sig. =0.001, 95% CI respectively). According to
Gupta et al. (2009), sediments are the most important reservoir of metals and other pollutants in
the aquatic environment. The fact that heavy metal contamination in sediment has been shown to
affect bioaccumulation of metals in marine organisms may partially explain why tilapia brain
and muscle tissues in this study had high levels of mercury (Evans et al., 1993). However, it is
unclear why there was no association between the levels of mercury in soil sediments and the
levels of mercury in fish liver tissues. More studies are needed to explore this phenomenon
further.
Page 66
50
4.2.4 Mean T-Hg levels in pond water samples
The study findings (Table 12) showed that all the sites had significant T-Hg pollution in the pond
water, with mean T-Hg levels ranging from 0.002±0.000 to 0.004±0.001 µg/ml (n=3, 95% CI).
These mean T-Hg levels were higher (in some places up to 40 times higher like in Nyabisawa,
Luanda Nyira and Ndiwa in Nyatike and Kamagambo South in Rongo) than the maximum
contaminant level of 0.0001 μg/ml allowable for mean T-Hg in unpolluted surface water as set
by FAO (1993) as shown in Table 13.
Levels of T-Hg in water are affected by the pH of the water, the presence of suspended solids in
the ponds, as well as adsorption and precipitation processes. These factors have been shown to
have the potential to remove metals such as mercury from solutions in the form of sulphides
under anoxic conditions (Asare-Donkor and Adimado, 2016). Lamborg et al., (2004) have also
reported on the tendency of inorganic mercury and methylmercury (components of total
mercury) to form complexes with naturally occurring dissolved organic carbon, thereby reducing
the amount of mercury available in the water. These may explain the relatively low T-Hg content
detected in the pond water samples in comparison to the tilapia tissues and pond sediment
samples.
4.2.5 The relationship between mean T-Hg levels in water and Nile tilapia fish tissues
The study results (Table 14) show that an increase in mean T-Hg content in the pond water
coincided with decrease in the mean T-Hg content in tilapia brain (r= - 0.402, sig. = 0.011, 95%
CI) and muscle tissues (r= - 0.616, sig. =0.000, 95% CI). As per previous studies (Wang and
Wong, 2003; Pickhardt et al., 2006), most of the mercury that accumulates in higher trophic
level forms originate from consumed food rather than direct aqueous accumulation. However,
this does not explain why there was a decrease in the quantity of mercury in fish tissues (brain
Page 67
51
and muscle) as the level of mercury increased in the water, a phenomenon that warrants further
research. Moreover, there was no significant correlation between the mean T-Hg levels in pond
water and tilapia liver samples (sig. =0.874, 95% CI) which needs further investigations too.
4.2.6 Risk-based consumption limits for Nile tilapia from the sample sites
Fish is a rich source of nutrients. However, it is essential to regulate the dietary intake of fish to
avoid the possible accumulation of mercury in the human body. Accordingly, the WHO, in
conjunction with FAO, has developed guidelines on the maximum mercury intake per week in
human (JECFA, 2003). This study‟s findings on risk-based consumption limits were specific for
each Nile tilapia tissue (brain, liver, and muscle) as shown in Table 15. In reality, however,
humans usually consume the whole fish. This study‟s findings indicate that Kamagambo South
(with a CRmw of 4) and Nyabisawa (CRmw of 3) are the areas where up to four and three fish
respectively can be consumed with a low risk to human health. Conversely, Masara, Kokaka,
Siginga beach, and Sori beach (each with a CRmw of 1) are the areas where the threat to human
health from consuming fish is the highest.
4.2.7 The relationship between pond water pH, and temperature, fish weight and age,
type of fish-culture and the mean T-Hg levels in tilapia samples
Several physicochemical and biotic parameters of the ecosystem of the fish ponds that in this
study‟s opinion is thought to influence the levels of T-Hg in the tilapia fish tissues were noted
(Appendix 3) and analysed as shown in Table 16. However, as a precaution, these parameters
would need further investigations to ascertain if they do impact on the T-Hg levels in the tilapia
fish and the extent to which they do so.
This study noted that as the pond water increased, so did the level of T-Hg in fish brain tissues
(but not liver and muscle). Previous studies indicate that once fish assimilate mercury, it is
Page 68
52
distributed via the blood and stored in various tissues (Boudou and Ribeyre, 1983). Thus, in the
process of excretion, there is a transfer of mercury between „donor‟ and „receiver‟ organs,
thereby implying that fish tissues are bound to have varying concentrations of mercury. Based on
this, it can be hypothesised that alterations in the pH of fish pond water within the Migori gold
mining belt may have favoured bioaccumulation and distribution of mercury to the brain tissue
as a receiver organ relative to liver and muscle tissues. Additionally, alterations in pH may also
have influenced the release of mercury from brain tissues of Nile tilapia relative to liver and
muscle tissues. The lack of a relationship between pH and mercury levels in liver and muscle
tissues of Nile tilapia seems to suggest that the rate of bioaccumulation, distribution, and release
from these tissues may not be dependent on changes in the pH of water in fish ponds within the
Migori gold mining belt.
The study also found that higher water temperatures were associated with higher levels of
mercury in fish brain tissues (but not liver and muscle tissues). Mechanistically, rising
temperature in water may lead to an increase in the feeding rates of fish in response to higher
metabolic demand (Dijkstra et al., 2013). Such an increase in food consumption could result in
greater methylmercury uptake and accumulation (Dijkstra et al., 2013). Thus, hypothetically,
there may be a temperature dependent distribution and release of mercury from tissues of Nile
tilapia.
Further study findings showed that the larger the fish, the lower the levels of T-Hg in fish brain
tissues. Controversy abounds over the relationship between the weight of fish and the levels of
mercury in fish tissues. Some studies have reported positive correlations between the two
variables (Snyder et al., 1998), while others have reported negative correlations (Sedláèková et
Page 69
53
al., 2015). These conflicting findings, hypothetically, may be dependent on the type and species
of fish.
The study suggests that the type of culture practised in the Migori gold mining belt has some
effect on the bioaccumulation and distribution of mercury in tissues of the Nile tilapia
(particularly in liver and muscle tissues). The polyculture system appears to be associated with
higher levels of mercury in fish tissues. It may be that polyculture practised in fish ponds within
the Migori gold mining belt may expose Nile tilapia to unique physiological stressors that
increase the rate of metabolism in the fish tissues. Consequently, the rate of consumption of food
among these fish rises, resulting in a more pronounced uptake of mercury from food as well as a
diminished elimination from the tissues. There is a need for studies to investigate these findings
further.
4.3 LIMITATIONS OF THE STUDY
Several factors may limit the interpretation of this study's results. First, although the study
showed widespread contamination of the Migori gold mining belt with mercury, there was no
clear pattern of mercury pollution. The statistical approach adopted may have ignored spatial
correlations and drainage patterns between sampling points and thus may have missed relevant
information. Secondly, the diet has been reported by other studies to be one of the major
pathways for the overall accumulation of mercury. In this study, the levels of mercury in feed
and how potentially this would have translated to bioaccumulation in fish tissues were not
investigated. Furthermore, this study used a single species of fish as a bio-indicator of pollution.
Multi-species‟ comparisons covering different feeding habitats of fish and a wide range of age
categories may provide data that may facilitate stakeholders to distinguish recent exposure from
the long-term load. Finally, this study did not explore the seasonal variation of mercury
Page 70
54
concentrations and what effect this might have had on bioaccumulation of mercury in the tilapia
fish.
4.4 CONCLUSIONS
The study findings show that there is widespread mercury pollution across all the inland study
sites. For instance, the mean T-Hg levels in sediments ranged from 0.208±0.000 to 1.113±0.008
µg/g ww (n=8, 95% CI); with six of the eight sites sampled being moderately polluted
(1≤IGeo˂2), whereas two sites (Minyenya and Kokaka) being strongly polluted (3≤IGeo˂4).
Likewise, the pond waters had high mercury pollution with the mean T-Hg in the water samples
ranging from 0.002±0.000 to 0.004±0.001 µg/ml (n=8, 95% CI). All the sites had higher mean T-
Hg levels (up to 40 times higher) than the maximum allowable limit for T-Hg of 0.0001 μg/ml in
unpolluted surface water set by FAO (1993).
There was also the presence of mercury contamination in the Nile tilapia tissues. Concentrations
of mean T-Hg were highest in the tilapia brain tissues with values ranging from 0.128±0.021 to
3.798±1.421 µg/g ww (n= 49, 95% CI); with the highest proportion (78%, 38/49 samples)
having mean T-Hg levels above (up to eight times higher) the limits of 0.5 µg/g ww
recommended as safe by WHO (2016) for consumption by the general human population. The
mean T-Hg in tilapia muscle tissues ranged from 0.179±0.020 to 0.595±0.065 µg/g ww (n= 49,
95% CI) with 31% (15/49) of fish muscle tissues tested having the levels above the critical value
of 0.5 µg/g ww. Mean T-Hg levels were lowest in tilapia liver tissues with values ranging from
0.103±0.118 to 0.588±0.374 µg/g wet weight (n= 49, 95% CI) with only 27% (13/49) of fish
liver tissues tested having the levels above the critical value of 0.5 µg/g ww. However, most of
the tilapia fish samples (87.8% (43/49) of brain, 69.4% (34/49) of liver and (68.7% 34/49) of
muscle tissues respectively had mean T-Hg above the 0.2 µg/g (wet weight) level recommended
Page 71
55
by WHO for at-risk populations (frequent fish eaters, people with renal and liver diseases,
pregnant mothers and developing children).
There were positive correlations between the mean T-Hg levels in tilapia brain and muscle
tissues and the mean T-Hg levels in fish pond sediments (r=0.528, p<0.05 and r=0.524, p<0.05
respectively). However, there was no significant correlation noted between the mean T-Hg
content in soil sediments and the mean T-Hg level in fish liver tissues. There were negative
correlations between mean T-Hg levels in tilapia brain tissues and mean T-Hg levels in pond
water (r= -0.402, p<0.05) as well as between mean T-Hg levels in tilapia muscle tissues and
mean T-Hg levels in pond water (r= -0.616, p<0.05). However, there was no significant
correlation noted between the mean T-Hg content in pond water and the mean T-Hg level in fish
liver tissues.
The estimated daily intake of T-Hg in fish per meal (EDIm) and target hazard quotient (THQ) for
human consumption ranged from 2.43-15.84 µg/g and 24.3-158.4, respectively. The maximum
allowable fish consumption rate for humans in meals/week (CRmw) ranged from 1- 4 whole fish
with Kamagambo South (with a CRmw of 4) and Nyabisawa (CRmw of 3) being the areas where
up to 4 and 3 fish respectively can be consumed with a low risk to human health. Conversely,
Masara, Kokaka, Siginga beach, and Sori beach (each with a CRmw of 1) are the areas where the
threat to human health from consuming fish is the highest.
In summary, this study‟s findings show that the levels of mean T-Hg in tissues of Nile Tilapia in
the Migori gold mining belt are above-recommended limits for mean T-Hg levels allowable in
fish for human consumption to the at-risk human populations (frequent fish-eaters, pregnant
women and children of developmental age). However, the fish is safe for consumption by the
Page 72
56
general human population as long as they don‟t exceed the recommended consumption rate of 4
tilapia meals per week. Thus, there is a need for advisories from the Government on human
consumption of the tilapia fish reared in the Migori gold mining belt.
4.5 RECOMMENDATIONS
From the findings in this study, there is a need for food advisories from the Government on
human consumption of the tilapia fish reared in the Migori gold mining belt. Additionally, there
is a need to enforce safe mining practices to minimize environmental mercury pollution in the
area as proposed by Ogola et al. (2002), Mangati (2005), Ngure et al. (2014), Odumo et al.
(2011) and Odumo and Carbonell (2014) as well as enforce the ban on the use of mercury in gold
mining as per the Kenyan mining act (2016). The community members in the gold belt in the
area of study also need to be followed up for assessment of possible mercury intoxication which
may present in myriad ill-health effects and subsequently they should be given appropriate
medical attention.
Page 73
57
REFERENCES
Asare-Donkor N.K. and Adimado A.A. (2016): Influence of mining-related activities on levels
of mercury in water, sediment and fish from the Ankobra and Tano River basins in
South
Western Ghana. Environmental Systems Research; 5:5. doi:10.1.186/s4006801600554.
BBC NEWS (8th
Aug 2007): | Health | Fish can fight malaria mosquitoes. Accessed on
21/05/2018 from http://news.bbc.co.uk/2/hi/health/6937270.stm
Boeining, D.W. (2000): Ecological effects, transport, and the fate of mercury; a general review.
Chemosphere; 40, 12 pp. 1335 – 1351.
Boischio, A.A.P. and Henschel, D. (2000): Fish consumption, fish lore, and mercury pollution
Risk communication for the Madeira River People. Environmental Research:
84(2): 108 - 126
Boudou A., and Ribeyre F. (1983): Contamination of aquatic bi-ocenoses by mercury
Compounds: an experimental eco-toxicological approach. Advances in Environmental
Science and Technology (USA). 1983. Accessed on 30th
June 2018, from
http://news.bbc.co.uk/2/hi/health/6937270.stm. Accessed on 20 Sep 2018.
Campbell L., Dixon, D.G. and Hecky R.E. (2003): A review of mercury in Lake Victoria, East
Africa: implications for human and ecosystem health. Journal of Toxicology and
Environmental Health, Part B; 6:325–56.
Campbell, L.M., Osano O., Hecky R.E. and Dixon, E.G. (2003): Mercury in fish from three
Rift valley lakes (Turkana, Naivasha and Baringo), Kenya, East Africa. J. Environmental
Pollution: 125: 281286.
Chien L.C., Hung T.C., Choang K.Y., Yeh C.Y., Meng P.J., Shieh M.J. (2002): Daily
Page 74
58
Intake of TBT, Cu, Zn, Cd and As for fishermen in Taiwan. Science of the total
environment; 285:177–85.
Citizen Digital (2018): By Reuters for Citizen Digital; March 28th
, 2018; Mercury Rising: Gold
mining takes a toxic toll on Kenyan women Gold mining takes a toxic toll on Kenyan
women.
Copat C., Arena G., Fiore M., Ledda C., Fallico R., Sciacca S., et al. (2013a): Heavy metals
Concentrations in fish and shellfish from the eastern Mediterranean Sea: consumption
advisories. Food and Chemical Toxicology; 53:33–7.
Copat C., Conti G.O., Signorelli C., Marmiroli S., Sciacca S., Vinceti M. (2013b): Risk
Assessment for metals and PAHs by Mediterranean seafood. Food and Nutrition
Sciences; 4:10.
Davidson, P. W., Cory-Slechta, D. A., Thurston, S. W., Huang, L. S., Shamlaye, C. F.,
Gunzler, D., Watson, G., van Wijngaarden, E., Zareba, G., Klein, J. D., Clarkson, T.
W., Strain, J. J. and Myers, G. J. (2011): Fish consumption and prenatal methylmercury
Exposure: Cognitive and behavioural outcomes in the main cohort at 17 years from the
Seychelles child development study. Neurotoxicology; 32 (6), 711−717.
Davidson, P. W., Myers, G. J., Cox, C., Axtell, C., Shamlaye, C., SloaneReeves, J.,
Cernichiari, E., Needham, L., Choi, A., Wang, Y.; Berlin, M. and Clarkson, T. W.
(1998): Effects of prenatal and postnatal methylmercury exposure from fish consumption
on neurodevelopment development study. JAMA, J. Am. Med. Assoc.; 280, 701−707.
Debes, F., BudtzJørgensen, E., Weihe, P., White, R. F. and Grandjean, P. (2006): Impact of
Prenatal ethylmercury exposure on neurobehavioral function at age 14 years.
Neurotoxol.Teratol. 28 (5), 536−547.
Page 75
59
Dijkstra J.A., Buckman K.L., Ward D., Evans D.W., Dionne M. and Chen C.Y. (2013):
Experimental and Natural Warming Elevates Mercury Concentrations in Estuarine
Fish. PLoS ONE; 8: 19
Donkor A.K., Bonzongo J.C., Nartey V.K. and Adotey D.K. (2006): Mercury in different
Environmental compartments of the Pra River Basin, Ghana. Science of the Total
Environment; 368: 164–76.
Dorea, J.G. (2003): Fish are central in the diet of Amazonian riparians: Should we worry about
their mercury concentrations? Environ. Res., 92: 23244.
Driscoll C.T., Mason R.P., Chan L.H.M. and Pirrone N. (2013): Mercury as a Global
Pollutant: Sources, Pathways, and Effects. Article in Environmental Science and
Technology; DOI: 10.1021/es305071v · Source: PubMed
Evans D.W., Dodoo D.K. and Hanson P.J. (1993): Trace element concentrations in fish livers:
Implications of variations with fish size in pollution monitoring. Marine Pollution
Bulletin; 26: 329–34.
Fallah A.A., Saei-Dehkordi S.S., Nematollahi A. and Jafari T. (2011): Comparative study of
Heavy metal and trace element accumulation in edible tissues of farmed and wild
rainbow trout (Oncorhynchus mykiss) using ICPOES technique. Microchemical Journal;
98: 275–9. doi:10.1016/j.microc.2011.02.007.
FAO (1993): Water quality and fish health. EIFAC TECHNICAL PAPER 54; 29
Retrieved from URI: http://hdl.handle.net/11295/70618 on 23/08/2015
Gibb H. and O’Leary K.G. (2014): Mercury exposure and health impacts among individuals in
the artisanal and small-scale gold mining community: a comprehensive review, Environ.
Health Perspect. 122; 667–672, http://dx.doi.org/10.1289/ehp.1307864.
Page 76
60
Giblin F.J. and Massaro E.J. (1973): Pharmacodynamics of Methyl Mercury in the Rainbow
Trout (Salmo gairdneri): Tissue Up-take, Distribution have estimated that the daily
Consumption of fish containing 56 ppm of mercury may be lethal to humans.
Experimental distribution studies of mercury. Toxicology and applied pharmacology.
91:81–91 http://www.sciencedirect.com.ep.fjernadgang.kb.dk/science/article/
Githukia C.M., Obiero, K.O., Manyala, J.O., Ngugi, C.C. and Quagrainie K.K. (2014):
Consumer Perceptions and Preferences of Wild and Farmed Nile Tilapia
(Oreochromis niloticus L.) and African Catfish (Clariasgariepinus Burchell 1822) in
Urban Centres in Kenya
Göthberg A. and Greger M. (2006): Formation of methyl mercury in an aquatic macrophyte.
Chemosphere 65:2096–2105
Grieb, T.M., Bowie, G.L., Driscoll, C.T., Gloss, S.P., Schofield, C.L. and Porcella, D.B.
(1990): Factors affecting mercury accumulation in fish in the upper Michigan peninsula.
Environmental Toxicology and Chemistry; 9: 919–30.
Gupta A., Rai D.K., Pandey, R.S. and Sharma, B. (2009): Analysis of some heavy metals in
the riverine water, sediments and fish from river Ganges at Allahabad. Environmental
Monitoring and Assessment; 157: 449.
Heath A.G. (1987): Behaviour and nervous system function. Water pollution and fish
Physiology. Pg. 181–96.
Hill B. (2014): Humane Harvesting of Fish, 44
Hosseini, S.M., Mirghaffari, N., Sufiani, N.M., Hosseini, S.V. and Ghasemi, A.F. (2013):
Risk Assessment of the total mercury in Golden grey mullet (Liza aurata) from Caspian
Sea. International Journal of Aquatic Biology; 1: 258–65.
Page 77
61
Jinadasa, B., Edirisinghe, E. and Wickramasinghe, I. (2013): Total mercury content, weight
and length relationship in swordfish (Xiphias gladius) in Sri Lanka. Food Additives
Kalay M., Ay Ö. and Canli M. (1996): Heavy Metal Concentrations in Fish Tissues from the
Northeast Mediterranean Sea. Bull Environ Contam Toxicol. Vol. 63: 673–81.
doi:10.1007/s001289901033.
Kariuki, D.K. (2002): Environmental and Health Impact of Mercury in Small Scale Gold
Miners in Western Kenya. Health and Environmental Effects of Mercury – Impacts of
Mercury from Artisan Gold Mining in Africa.
KEMFRI (2017): Kenya‟s Aquaculture brief. 2017; 12. Accessed on 29/08/2018 from
http://www.kmfri.co.ke/images/pdf/Kenya_Aquaculture_Brief_2017.pdf.
Ki-Hyun K., Ehsanul K. and Shamin, A.J. (2016): A review on the distribution of Hg in the
Environment and its human health impacts. Journal of Hazardous Materials; DOI:
10.1016/j.jhazmat.2015.11.031
Lamborg, C.H., Fitzgerald, W.F., Skoog, A. and Visscher, P.T. (2004): The abundance and
Source of mercury binding organic ligands in Long Island Sound. Marine Chemistry.
90: 151–63.
Langston, W.J. (2017): Toxic effects of metals and the incidence of metal pollution in marine
ecosystems. In: Heavy metals in the marine environment. CRC Press; P.101–20.
Mangati, S. E. (2005): Investigation of the heavy metal concentrations in the waters of
Macalder mine area, Migori district, Kenya. Retrieved on 10/10/2018 from URI:
http://erepository.uonbi.ac.ke:8080/xmlui/handle/123456789/57092 on 22/08/2015.
Maroa G. (2009): Safe Gold Mine Development and Mining Methods in Migori County, Kenya.
Marrugo-Negrete, J., Benitez, L.N. and Olivero-Verbel, J. (2008): Distribution of mercury in
Page 78
62
several environmental compartments in an aquatic ecosystem impacted by gold
mining in northern Colombia. Archives of Environmental Contamination and
Toxicology. 2008; 55: 305–16.
MCG-AWP 2018/19 (2018): Migori County Health Department, Annual Work Plan; Pg. 11 - 12
Müller G. (1969): Index of geo-accumulation in sediments of the Rhine River. Geojournal; 2:
108–18.
Mwamuye, M.K., Cherutich, B.K. and Nyamu, H.M. (2012): Performance of Commercial
Aquaculture under the Economic Stimulus Programme in Kenya. International Journal of
Business and Commerce Vol. 2012; 2: 1–20.
Myers, G.J., Davidson P.W., Cox C., Shamlaye C.F., Palumbo D., Cernichiari E., Sloane J.,
Reeves, Wilding G.E., Kost J., Huang L.S. and Clakson, T.W. (2003): Prenatal
Methylmercury exposure from ocean fish consumption in the Seychelles child
Development study. Lancet. 361: 168692.
Ngure, V., Davies, T., Kinuthia, G., Sitati, N., Shisia, S. and Oyoo-Okoth, E. (2014):
Concentration levels of potentially harmful elements from gold mining in Lake
Victoria Region, Kenya: Environmental and health implications. Journal of
Geochemical Exploration; doi:10.1016/j.gexplo.2014.04.004.
Odumo, B.O. and Carbonell, G. (2014): Impact of gold mining associated with mercury
Contamination in soil, biota sediments and tailings in Kenya.
Odumo, O.B., Mustapha, A.O., Patel, J.P. and Angeyo, H.K. (2011): Multi-elemental
Analysis of Migori (Southwest, Kenya) Artisanal Gold Mine Ores and Sediments by
EDX-ray Fluorescence Technique: Implications of Occupational Exposure and
Page 79
63
Environmental Impact. Retrieved on 24/08/2018 from URL:
http://link.springer.com/article/10.1007/s001280110242y
Ogendi, G.M., Maina, G.M., Mbuthia, J.W., Koech, H.K., Ratemo, C.M. and Koskey, J.C.
(2014). Heavy Metal Concentrations in Water, Sediments and Common Carp
(Cyprinus carpio) Fish Forms from Lake Naivasha, Kenya. Research Journal of
Environmental and Earth Sciences; 6: 416–23.
Ogola, J.S., Mitullah, W.V. and Omulo, M.A. (2002). Impact of Gold mining on the
Environment and Human Health: A Case Study in the Migori Gold Belt, Kenya.
Retrieved on 22/08/2015 from URI:
http://link.springer.com/article/10.1023/A%3A1014207832471
Park, J.D. and Zheng, W. (2012): Human exposure and health effects of inorganic and
Elemental mercury, J. Prev. Med. Public Health 45; 344–352.
Perkin-Elmer (2011): Atomic Spectroscopy; a Guide to Selecting the Appropriate Technique
and Syst: 16.
Pickhardt, P.C., Stepanova, M. and Fisher, N.S. (2006): Contrasting uptake routes and tissue
distributions of inorganic and methylmercury in mosquitofish (Gambusia affinis) and
red-ear sunfish (Lepomis microlophus). Environmental Toxicology and Chemistry:
An International Journal; 25: 2132–42.
Reimann, C. and de-Caritat, P. (1998): Getting More Out of the Factsheets. In: Chemical
Elements in the Environment. Springer; p. 11–6.
Reuters (2018): 10th
March 2018; Mercury Rising: Gold mining takes a toxic toll on Kenyan
Women. Accessed on 25/05/2019 from
Page 80
64
https://www.reuters.com/article/us-kenya-women-goldmining/mercury-rising-gold-
mining-takes-a-toxic-toll-on-kenyan-women-idUSKBN1H33C9
Rice, K.M., Walker Jr., E.M., Wu, M., Gillette, C. and Blough, E.R. (2014): Environmental
Mercury and its toxic effects, J. Prev. Med. Public Health 47 (2); 74–83.
Roesijadi G. (1994): Metal regulation in aquatic animals: Mechanism of uptake, accumulation
and release. Molecular mechanisms in aquatic toxicology; 387–420.
Salomons, W. and Förstner, U. (2012): Metals in the Hydrocycle. Springer Science and
Business Media.
Sedláèková, L., Jarkovský, J., Kalina, J., Poleszczuk, G. and Svobodová, Z. (2015): A
negative correlation between mercury content in muscle and body weight in carp from
uncontaminated ponds. Czech Journal of Food Sciences; 33: 204–9.
Shafer, M.M., Overdier, J.T., Hurley, J.P., Armstrong D. and Webb, D. (1997): The
Influence of dissolved organic carbon, suspended particulates and hydrology on the
concentration, partitioning and variability of trace metals in two contrasting Wisconsin
watersheds (U.S.A.). Chem. Geol., 136: 7197.
Shelton, L.R. and Capel P.D. (1994): Guidelines for collecting and processing samples of
streambed sediment for analysis of trace elements and organic contaminants of the
national water quality assessment programme. Open-file Report 940166, US Geological
Survey.
Snyder, D.M., Parker, C.R. and Kiyoko, Y. (1998): Total mercury concentration in fish tissue
relative to length and weight.
The Mining act (2016); Government of Kenya
The Star Newspaper (2019): 1st Feb 2019; Migori gold rush wrecks lives and destroys the land.
Page 81
65
Retrieved on 24/05/2019 from
https://www.the-star.co.ke/counties/nyanza/2019-02-01-migori-gold-rush-wrecks
lives-and-destroys-land/
USEPA (1989): ABD. Risk Assessment Guidance for Superfund. Volume I: Human Health
Evaluation Manual (Part A). EPA/540/189/002.
USEPA (1997): Mercury Study Report to Congress (3). Washington, D.C.
USEPA (1998a): Method 7471B. Mercury in Solid or Semisolid Waste (Manual
Cold Vapour Technique). Revision 2 September: 1–8.
USEPA (1998b): USEPA Method 7471B. 1998; January: 1–8. Retrieved on 25/09/2015 from
https://www.epa.gov/sites/production/files/201507/documents/epa7471b.pdf.
USEPA (2000): Guidance for assessing chemical contaminant data for use in fish advisories.
Volume 1: Risk assessment and fish consumption limits, 3rd edition. 1:823B00008.
USEPA (2001): Mercury update; Impact on fish advisories. EPA Fact sheet, June 2001.
Retrieved on 25/09/2015 from http://www.epa.gov/ost/fish/
UNEP (2002): Chemicals. Global Mercury Assessment
UNEP (2012): Reducing Mercury Use in Artisanal and Small-scale Gold Mining: A Practical
Guide. Accessed on 5/06/2017 from
http://www.unep.org/hazardoussubstances/Portals/9/Mercury/Documents/ASGM/Tec
doc/UNEP%20Tech%20Doc%20APRIL%202012_120608b_web.pdf.
UNEP (2013a): Global Mercury Assessment 2013: Sources, Emissions, Releases and
Envronmental Transport. UNEP Chemicals Branch, Geneva, Switzerland
UNEP (2013b): Technical Background Report for the Global Mercury Assessment 2013.
Page 82
66
Accessed 5/06/2017 from
http://www.unep.org/hazardoussubstances/Mercury/Informationmaterials/ReportsandPub
lications/tabid/3593/Default.aspx.
UNEP (2013c): Mercury – Time to Act. Available at
http://www.unep.org/hazardoussubstances/Mercury/Informationmaterials/Reportsandpubl
icationsns/tabid/3593/Default.aspx. Accessed 5/06/2017
Wang, W.X. and Wong, R.S.K. (2003): Bioaccumulation kinetics and exposure pathways of
inorganic mercury and methylmercury in a marine fish, the sweetlips Plectorhinchus
gibbosus. Marine Ecology Progress Series; 261: 257–68.
Whalin, L., Kim, E.H. and Mason, R. (2007): Factors influencing the oxidation, reduction,
Methylation and de-methylation of mercury forms in coastal waters. Mar. Chem; 107 (3),
278−294.
WHO (2007): Exposure to Mercury: A Major Public Health Concern. Available at:
http://www.who.int/ipcs/features/mercury.pdfAccessed 5/06/2017
WHO (2008): Assessing the burden of disease at national and local levels. Environmental
Burden of Disease Series No. 16. Accessed on 5/06/2017
WHO (2016): Environmental and occupational health hazards associated with artisanal and
Small-scale gold mining; ISBN 978 92 4 151027 1 (NLM classification: WA 485),
Zheng, T., Kim, B., Leyard, C., Reinsch, B.C., Lowry, G.V., Deschusses, M.A. and Hsu-
Kim, H. (2012): Methylation of mercury by bacteria exposed to dissolved, nano-
particulate, and micro-particulate mercury sulphides. Environ. Sci. Technology; 46,
6950−6958.
Page 83
67
APPENDICES
Appendix 1: Approval of study proposal by the Graduate School of the University of
Nairobi
Page 84
68
Appendix 2: Approval of study proposal by the Biosafety, Animal Use and Ethics
Committee
Page 85
69
Appendix 3: Physico-chemical and biotic characteristics of the ecosystem of the sites of sample collection
Site Water
pH
Water
temp
(°F)
Pond
type
Water source Water top-up
frequency
Type of fish
culture
Estimated
age
(months)
of the fish
weight of
fish (g)
length of
fish (cm)
Minyenya 7.8 86.2 Earthen Mining wastewater Occasionally Polyculture 7 80 ± 8.164 14.75 ± 2.5
Kamagambo
N
7.2 85.3 Earthen Spring Weekly Polyculture 7 128 ±
33.466
18.2 ±
1.483
Masara 7.8 83.1 Earthen Stream/underground Occasionally Polyculture 5 84 ± 8.944 14.2 ±
1.095
Nyabisawa 7.0 82.0 Earthen Spring Weekly Monoculture 8 364 ±
32.863
26.2 ±
0.447
Ndiwa 8.2 80.2 Liner Spring Weekly Monoculture 5 112 ±
4.472
16.6 ±
0.894
Kokaka 7.4 83.4 Earthen Underground Monthly Monoculture 9 92 ±
10.954
15 ± 1.225
Luanda
Nyira
8.6 86.1 Earthen Underground Never Polyculture 6 114 ±
16.733
16.8 ±
0.837
Kamagambo
S
7.3 80.9 Earthen Spring Occasionally Monoculture 8 332 ±
83.187
24.4 ± 2.30
Siginga 7.3 82.5 Lake Lake N/A Polyculture Unknown 344 ±
55.498
25 ± 1.225
Sori 7.6 82.2 Lake Lake N/A Polyculture Unknown 364 ±
69.857
25.2 ±
2.280
Page 86
70
Appendix 4: Thesis Plagiarism Report


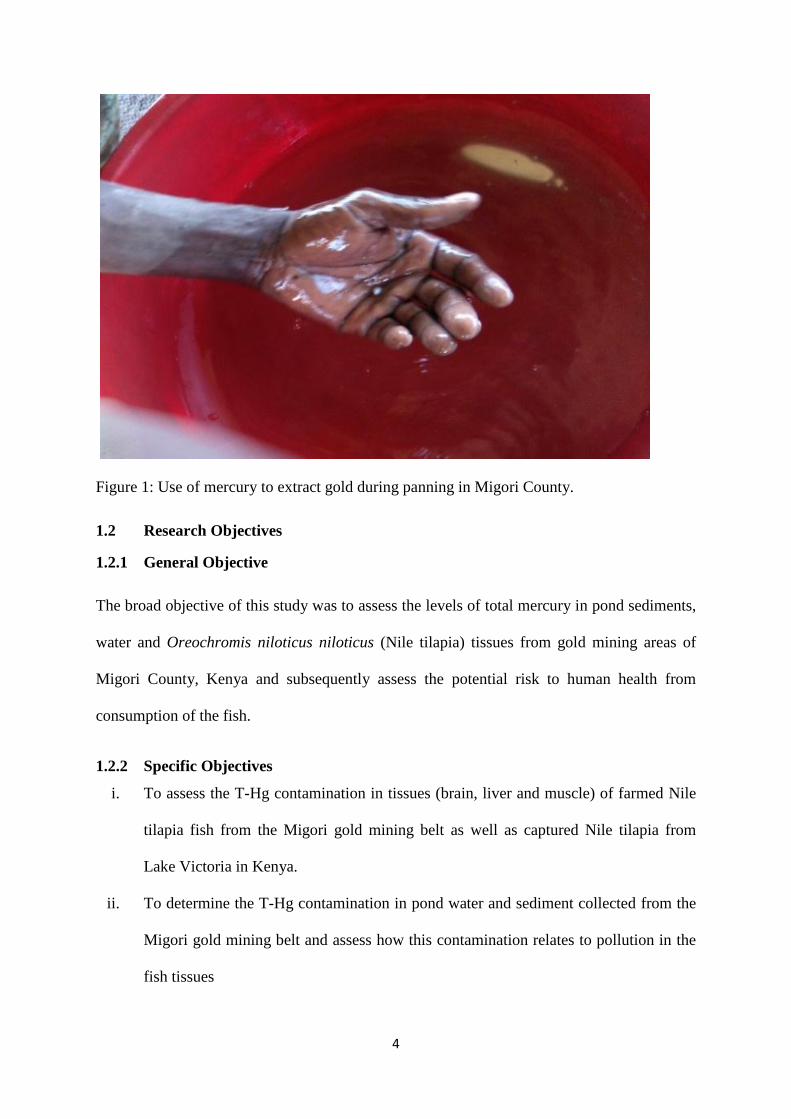


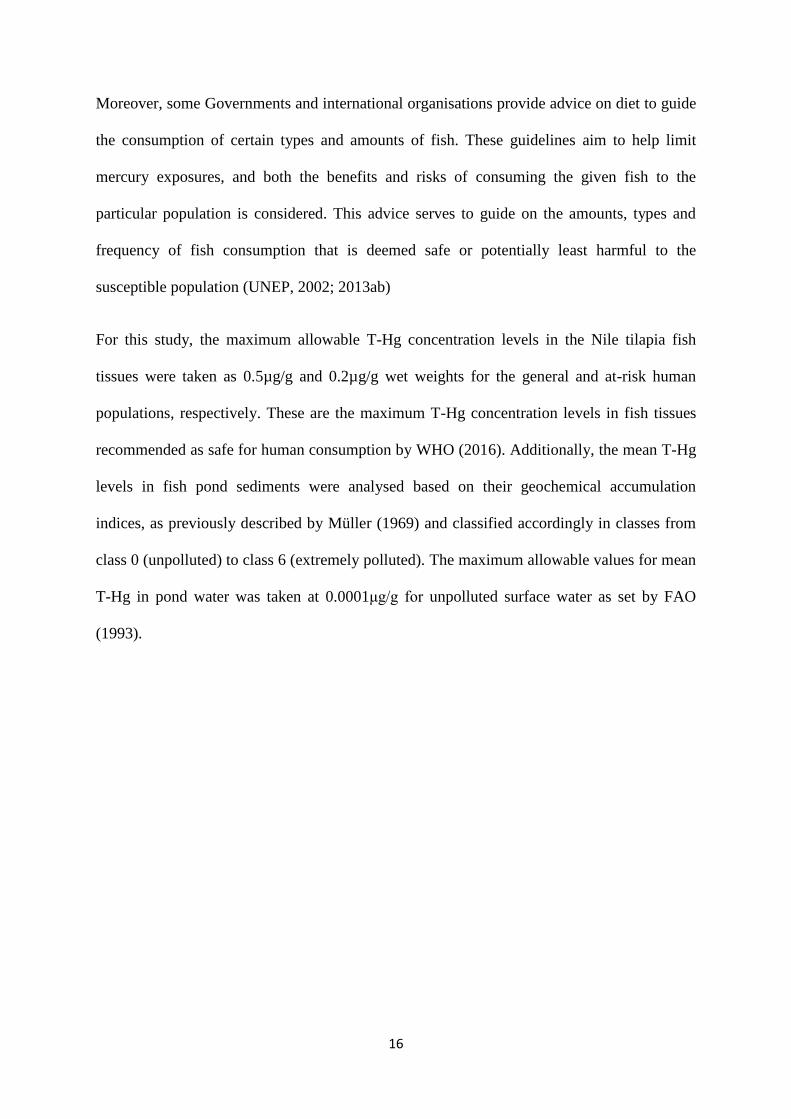

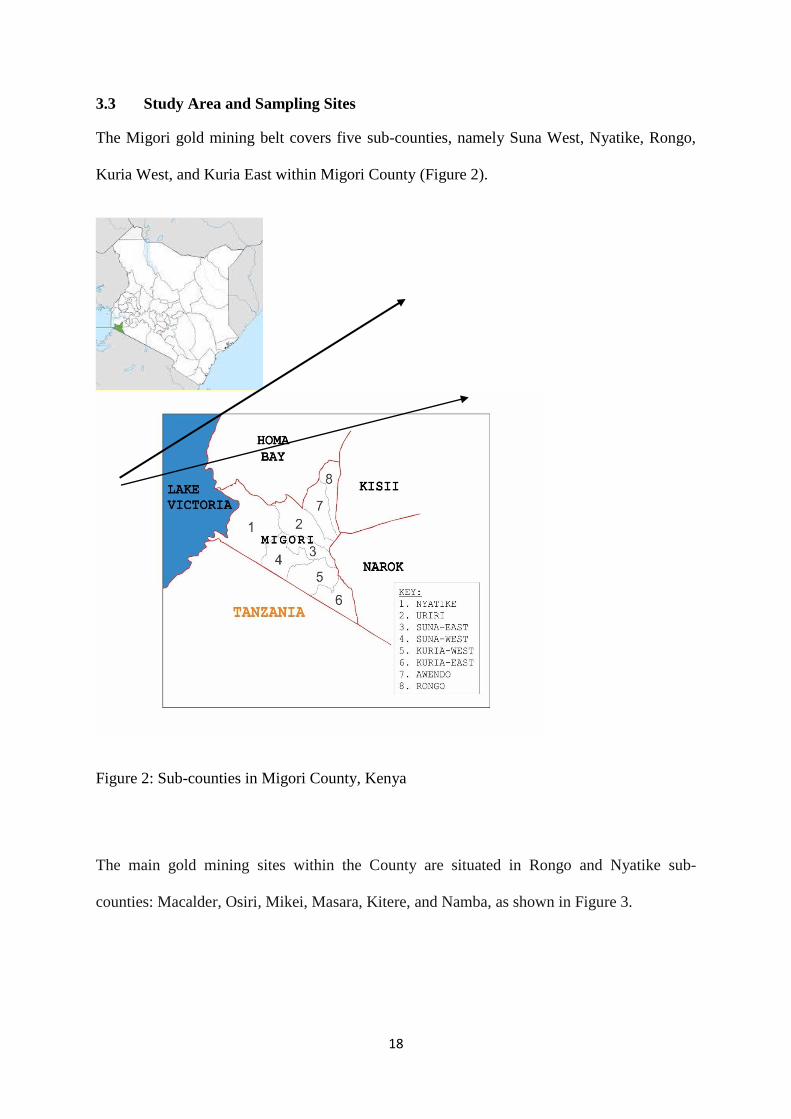

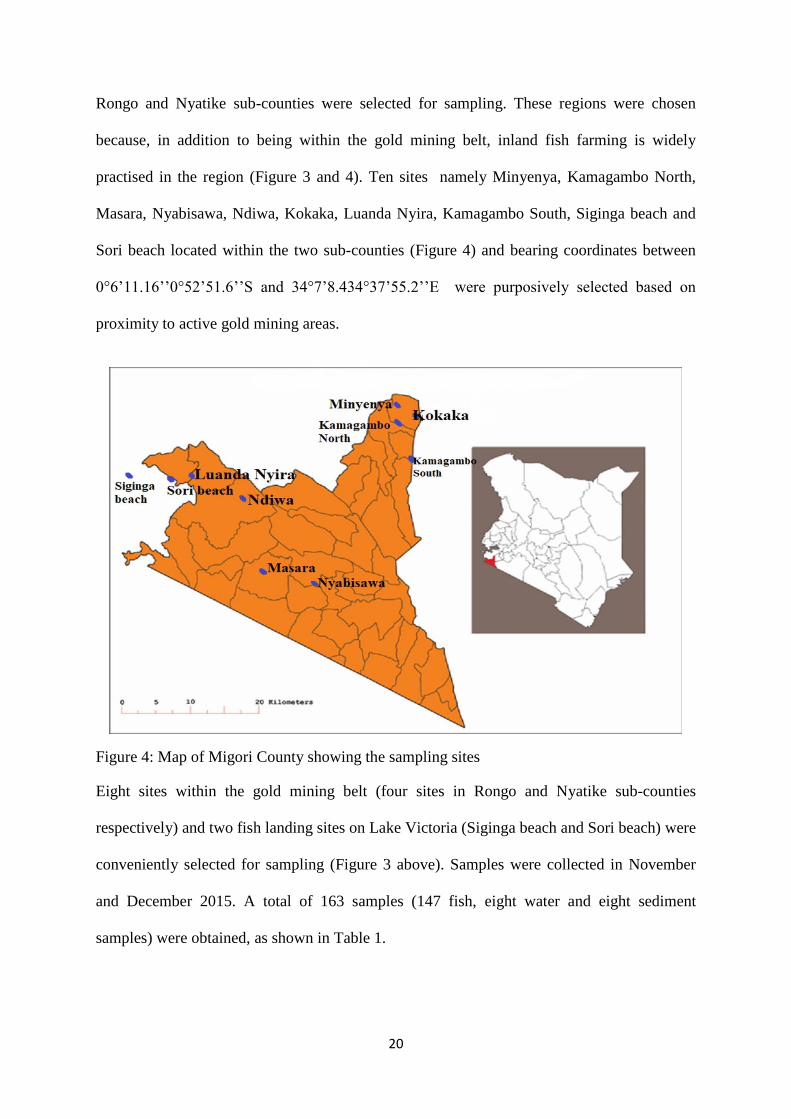


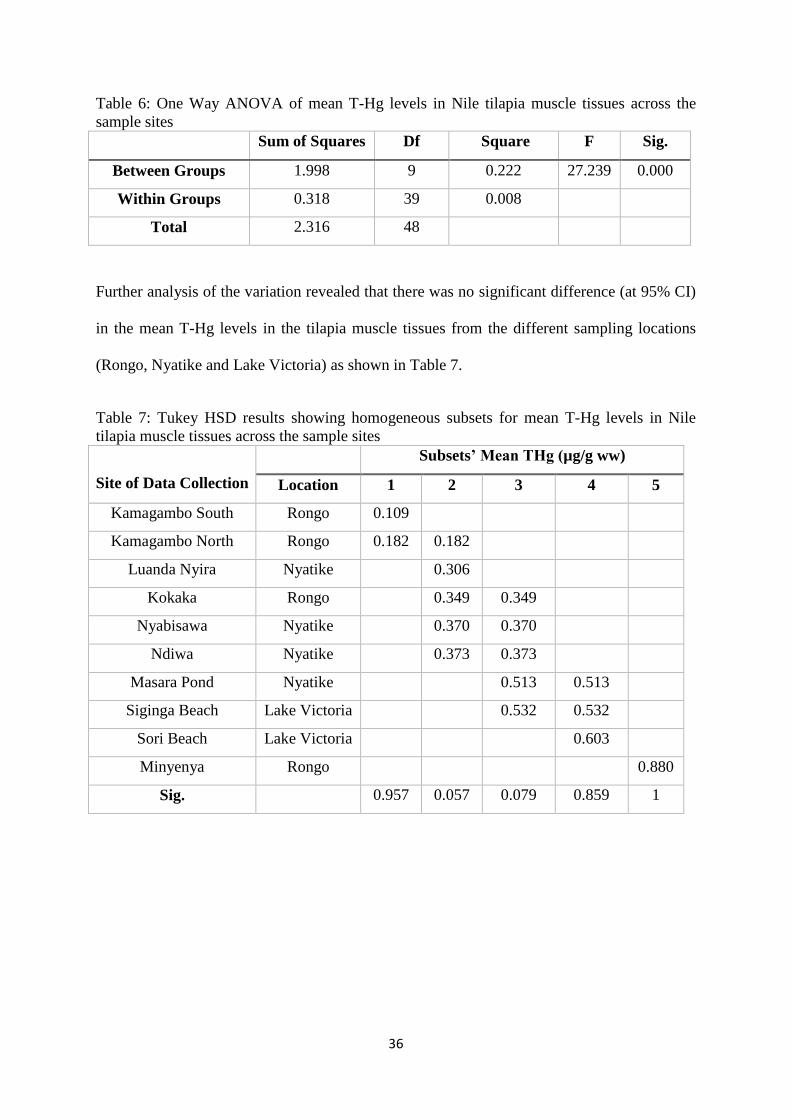


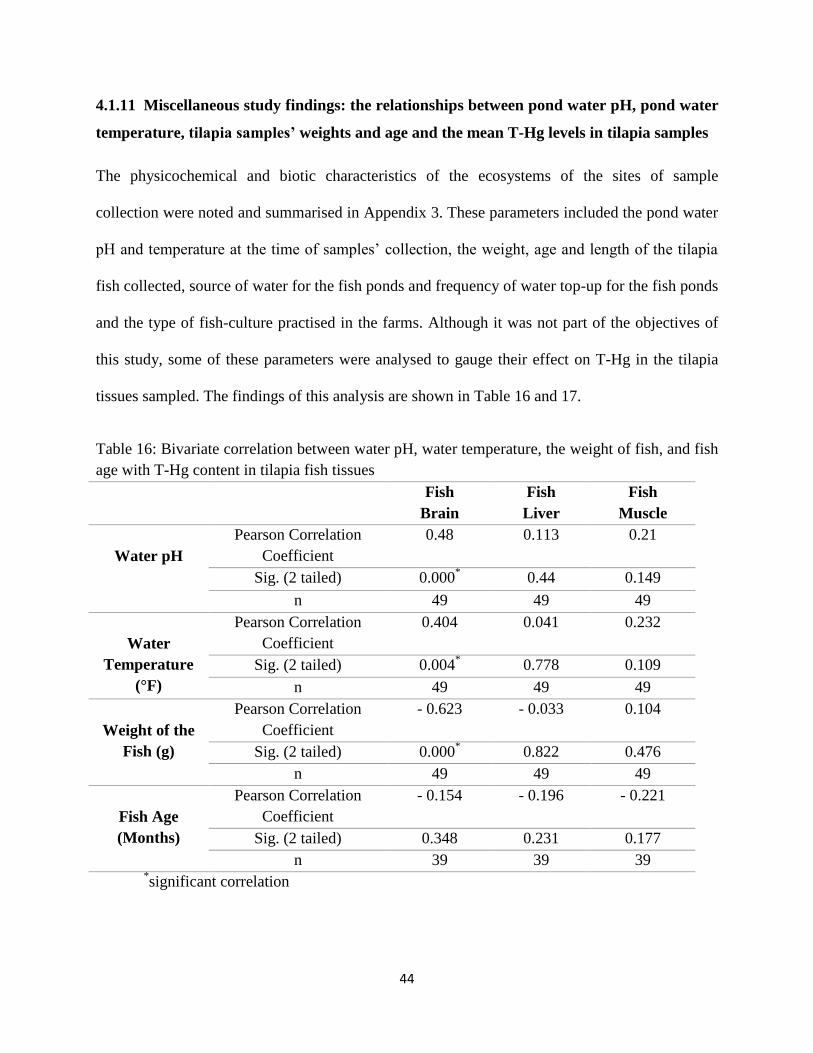


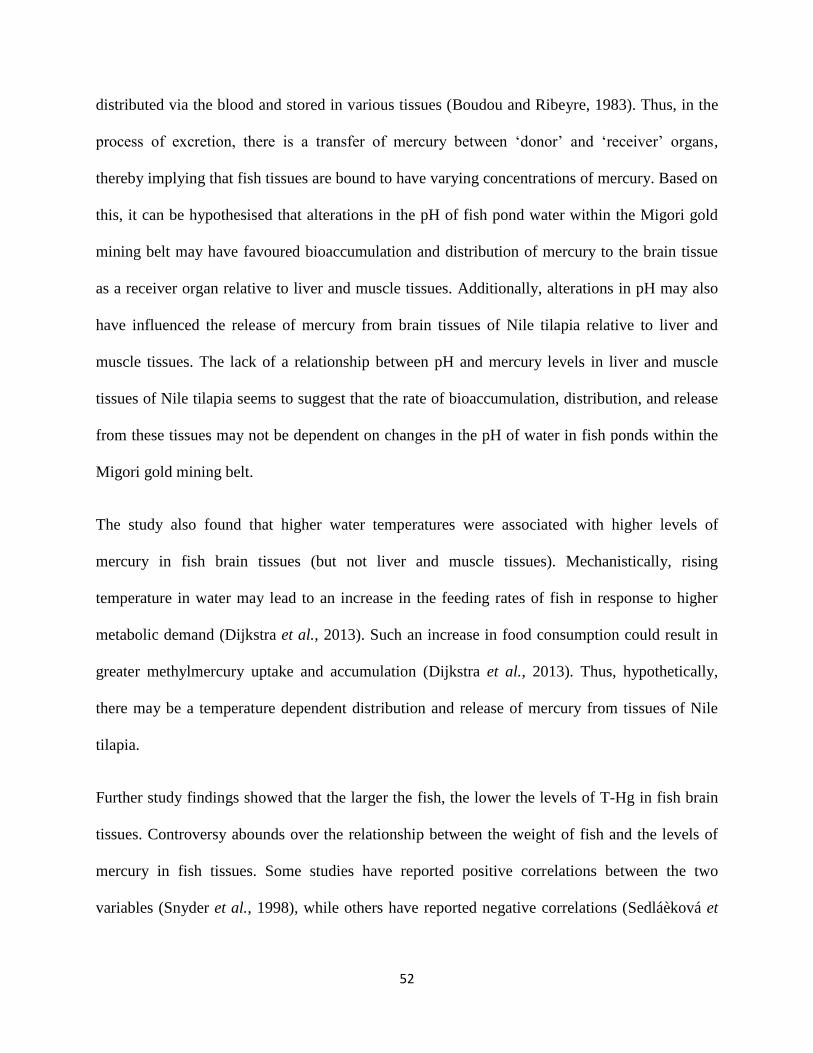


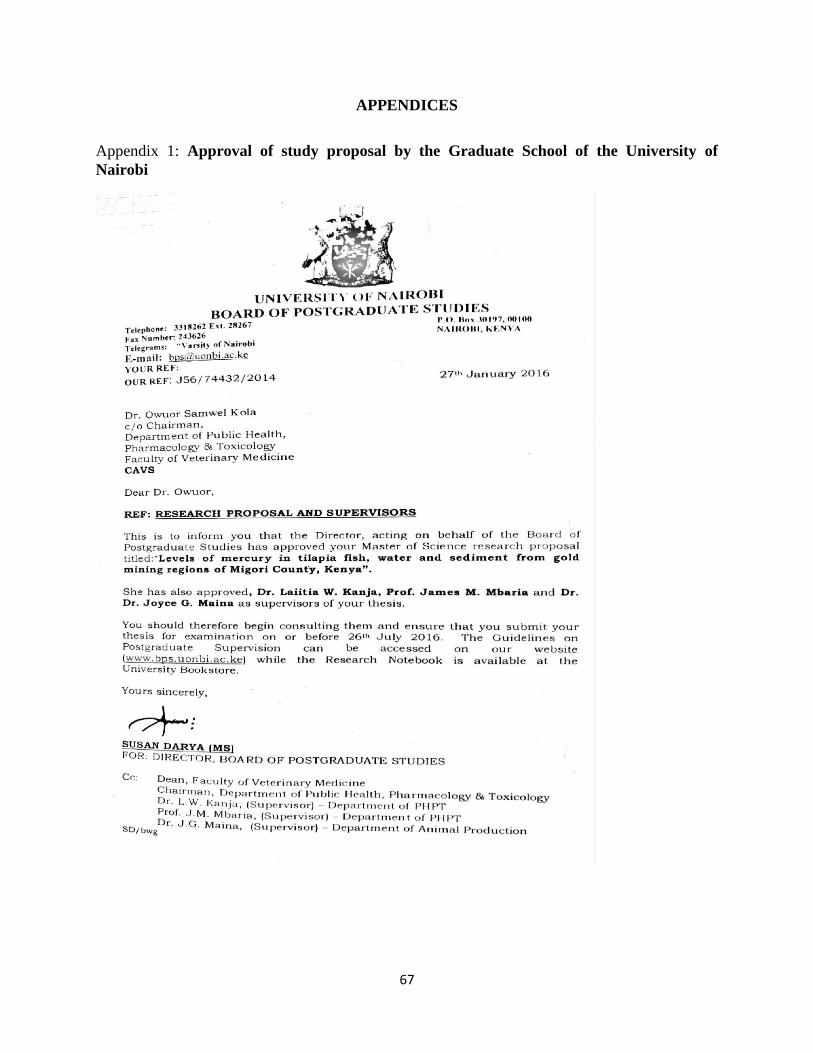


![Lesson 3 Seafood: Wild and Farmed · Lesson 3: Seafood: Wild and Farmed | [1] 2016 Johns Hopkins University Lesson 3 Seafood: Wild and Farmed [Lesson Duration: 45 minutes, plus 15](https://static.documents.pub/doc/80x56/5f6dcd508293d73bc7753858/lesson-3-seafood-wild-and-farmed-lesson-3-seafood-wild-and-farmed-1-2016.jpg)


