Page 1
i
LFL or LEL Control for the Ovens*
* LEL - Lower Explosion Limit, LFL - Lower Flammability Limit.
Prepared for California Energy Commission (CEC)
Prepared By:
Southern California Gas Company
(A Sempra Energy Utility)
E3M Inc.
May 2012
Page 2
ii
Disclaimer
The CEC and its contractor, Southern California Gas Company and subcontractor E3M Inc. has
made reasonable efforts to ensure all information is correct. However, neither The CEC’s,
Southern California Gas Company’s or E3M Inc.’s publication nor verbal representations thereof
constitutes any statement, recommendation, endorsement, approval or guaranty (either express or
implied) of any product or service. Moreover, The CEC, Southern California Gas Company, or
E3M Inc. shall not be responsible for errors or omissions in this publication, for claims or
damages relating to the use thereof, even if it has been advised of the possibility of such
damages.
Executive Summary
Process heating applications that involve flammable solvent removal consume large amounts of
energy to maintain solvent concentrations within safe lower flammable limits (LFL) or lower
Explosion limits (LEL) in the exhaust air. National Fire Protection Association (NFPA)
guidelines require that significant amounts of exhaust air be removed to maintain a safe solvent
concentration. The NFPA safety ventilation requirements are significantly lower when LFL
monitoring equipment is used compared to the absence of such equipment. This lowers the
process energy requirement due to reduced ventilation requirements (Reference 1).
Flammable solvents used in industrial production processes are typically evaporated within
industrial ovens. The elevated oven temperatures evaporate solvent vapors more quickly and
allow for faster production. Because the vapors are flammable, the exhaust air is discharged
(along with the heat) to prevent the accumulation of the vapors in the oven. As the solvent
evaporation rate increases, it is necessary to maintain higher ventilation rates to reduce the
solvent vapor concentration levels below the respective LFL.
Using LFL monitoring equipment can reduce energy consumed during solvent removal. The
equipment continuously tracks the solvent concentration and can be used to adjust or control the
rate of ventilation air based on real needs, thereby maintaining a safe ratio throughout the
process. LFL monitoring equipment can employ several technologies including catalytic
systems, infrared sensors, ionization systems, and combustion sensors. LFL monitoring
equipment has self-check functions and uses a calibrated test gas for periodic self-calibration.
Because the vaporization process depends on the intake and exhaust air, linking the LFL
controller to an adjustable speed drive on the exhaust system fan can improve process efficiency
even further (damper adjustments can also be used).
This LFL control calculator tool can be used to estimate annual energy savings and the
associated money (US dollars) savings, and reductions in CO2 emissions through monitoring
and/or control of LFL in an oven. The user is required to measure operational LFL levels and use
it as current value. Savings resulting from increasing the LFL concentration in the oven through
the use of reliable and proven LFL monitoring equipment can be calculated by entering the
allowable LFL limit for a given solvent.
The primary objective of this calculator is to identify energy savings potential in industrial
heating operations to make a go / no go decision on further detailed engineering and economics
analysis. The user is required to give data for several operating parameters that can be measured
or estimated from normal operating conditions using available records. All data should be
collected at average unit operating conditions.
Page 3
iii
This calculator estimates the annual expected energy savings in terms of million British thermal
units per year (MMBtu/year) by using the given cost of fuel for the industrial application and the
number of operating hours per year. This calculator also gives the reduction of CO2 emissions
that result from the combustion of natural gas. The results from this calculator should be
considered preliminary and a starting point for more detailed technical and economic analysis
and is expected to be within plus or minus 5 percent of actual results.
Note to the user of this calculator tool
Use of this tool requires knowledge of combustion and operation of heating systems such as a
furnace, oven, heater, boiler, kiln, dryer etc. The user is referred to several training programs
and references quoted at the end of his document for further information on the available
resources for getting trainings that would provide additional knowledge for the subject matters
discussed in this document.
Page 5
v
TABLE OF CONTENTS
Disclaimer ..................................................................................................................................... ii
Executive Summary ...................................................................................................................... ii
Note to the user of this calculator tool ......................................................................................... iii
1. Description of the subject area ............................................................................................................ 1
2. Impact of LFL control on energy savings and CO2 emissions ..................................................... 2
3. Discussion on the technical approach and the calculations .......................................................... 3
4. Instruction on use of the calculator ................................................................................................... 8
5. References and Resources ...................................................................................................................... 15
Appendix 1 ......................................................................................................................................................... I
Page 6
vi
LIST OF EXHIBITS
Exhibit 1: Typical drying oven schematic ...................................................................................... 4
Exhibit 2: Composition of natural gas used for calculations. ......................................................... 7
Exhibit 3: Required information for the calculator user ................................................................. 9
Exhibit 4: Example of calculator inputs and results ..................................................................... 11
Page 7
LFL or LEL Control of the Ovens
1
1. Description of the subject area
This work paper describes a calculator tool that will allow a user to estimate annual energy (fuel)
savings, reductions in CO2 emissions, and energy cost savings ($/year) of implementing Lower
Flammability Limit (LFL) or Lower Explosion Limit (LEL) monitoring and control systems in
an oven where flammable solvent vapors are present during process heating operation. Such
systems are used in industries such as metal finishing, coating, plastics, rubber parts, and food
processing.
National Fire Protection Association (NFPA) guidelines require that concentration of flammable
vapors present in drying ovens must be maintained below 25% of the LFL for the type of solvent
vapors or flammable gases if LFL levels are not monitored. This mandates that ventilation (or
make-up) air be used to dilute flammable vapors. The introduction of ventilation air into the oven
occurs due to negative oven pressure and is often uncontrolled. In some cases, a separate air
blower is used to supply specified amount of air for either make up air or for combustion of fuel
in the burners. This air has to be heated to the exhaust air temperature and can account for a
large percentage (in some cases as high as 75%) of the total heat required for the oven.
Installing LFL monitoring equipment allows the LFL limit to be raised from 25% to as high as
50% of the LFL per NFPA guidelines. This allows for a reduction in the exhaust gas that is
required to be removed from the unit. Hence, use of LFL monitoring equipment can help reduce
the energy used for ventilation or make up air and improve the efficiency of the oven.
This LFL control calculator tool can be used to estimate annual energy savings and the
associated money (US dollars) savings, and reductions in CO2 emissions through monitoring
and/or control of LFL in an oven. The estimated annual expected energy savings are in terms of
million British thermal units per year (MMBtu/year). It also estimates the energy cost reduction
by using the given cost of fuel for the oven and the number of operating hours per year. The user
is required to measure the current LFL levels for use with the tool. Savings resulting from using
a higher LFL level through the use of reliable and proven LFL monitoring equipment can be
calculated by entering the allowable LFL limit for a given solvent.
The focus of this tool is on the reduction of natural gas consumption used for industrial processes
by controlling LFL levels or the amount of ventilation air used by the ovens. Several methods
are available to accomplish this goal.
Use a LFL probe to monitor LFL in the oven – This method allows for the monitoring of
LFLs within an oven and/or its exhaust air. Most probe designs combine an indicator for LFL
levels and an output signal that can be used for remote displays and for integration with
additional control technologies to meet desired LFL levels. The user is advised to discuss their
specific application with their supplier and oven manufacturer before making a final decision.
Probes can be obtained from several suppliers.
Control or reduction of ventilation – makeup air – This method involves controlling
ventilation or makeup air for the oven to meet the required LFL requirements. The degree of
control over the amount of makeup air depends on the oven heating system and the process itself.
The oven supplier should be contacted to determine the best strategy that would allow finer
control over makeup air to meet the desired LFL levels. Possible methods of control include, but
are not limited to:
Control over the speed of the induced draft (ID) fan located on the exhaust stack
Page 8
LFL or LEL Control of the Ovens
2
Oven pressure controls to reduce air leakage into the oven
Control over the openings at the inlet and outlet of the oven
Customized methods specific to the particular process design
Control of Make Up Air – This method limits the amount of uncontrolled makeup air through
seal leaks and provides the required amount of makeup air to meet the LFL requirements.
Below is a brief summary of important calculation parameters:
LFL or LEL reading for the exhaust air – This parameter is measured inside the oven or
within the exhaust stack. A LFL probe should be used to obtain this reading. If a probe is not
available, it is necessary to go through calculations to determine the LFL level. This is performed
using solvent evaporation rates, rate of natural gas consumption, and measurements of the
contents and flow rates of the unit’s flue gases. The desired LFL level is required before and
after implementation of the efficiency measure.
Exhaust air (flue gas) temperature – The temperature of the exhaust gas exiting the oven
before and after implementation of the efficiency measure.
Oxygen content of exhaust air from the oven – The percentage of oxygen in the exhaust air
(measured on a dry basis) before and after implementation of the energy efficiency measure.
Combustion air temperature – The temperature of the combustion air (which is the air mixed
with fuel in the burner) before and after implementation of the energy efficiency measure.
Fuel consumption or current firing rate per hour (MM Btu/hour) – The estimated hourly
average consumption of natural gas (or other type of fuel) of the equipment’s combustion
system. This value should be based on the most recent 12-month period of natural gas
consumption (MM Btu/year) and number of hours for the heating system.
Number of operating hours (hours/year) – The number of hours for which the equipment is
operated. This should be based on the most recent 12-month period of natural gas consumption.
Cost of fuel - The average historical fuel cost ($/MM Btu) and, if possible, future projected cost
based on contracts with the energy supplier.
2. Impact of LFL control on energy savings and CO2 emissions
Controlling LFL levels within an oven where solvent vapors or other flammable gases are
present can result in both energy savings and CO2 emission reduction. All commonly used fossil
fuels (such as natural gas) when combusted result in the formation of CO2. The reduction in CO2
emissions is directly proportional to the reduction in natural gas use.
The actual savings in energy consumption and the associated costs vary according to several
operating parameters. These include:
Current and future (modified conditions) values of LFL as measured in the exhaust air for
the oven
Fuel energy content
Type of solvent(s) that would result in presence of flammable vapors in the oven (this
determines amount of ventilation air required for the oven at a given LFL level)
Page 9
LFL or LEL Control of the Ovens
3
Average firing rate (energy consumption per hour) Amount of excess air used for the
burners
Number of operating hours per year
Temperature of exhaust air leaving the oven
Average temperature of the combustion and excess air entering the heating system.
Cost of fuel in terms of $/MMBtu
The energy savings can vary from 10% for well run ovens to as high as 40% in case where the
ovens have little monitoring and operational control of LFL levels. The exact value of savings
(expressed as US dollars per MMBtu) can be estimated by using this calculator.
Energy savings resulting from an efficiency project directly correlate to CO2 savings. According
to U.S. Environmental Protection Agency (EPA) estimates (Reference 5), the combustion of
natural gas used in USA produces 116.39 lbs. of CO2 per MM Btu heat input. For convenience,
most calculations use 117 lbs. CO2 emission per MM Btu heat input from natural gas. If the
natural gas composition is available, it is advisable to carry out detailed combustion calculations
to estimate value that is more accurate for the CO2 produced by the combustion of natural gas.
Reduction in CO2 emissions is calculated by using the value of reduction in energy (fuel) used
for the furnace.
3. Discussion on the technical approach and the calculations
Obtaining greater control of LFL concentrations in drying ovens will result in energy savings
while maintaining the desired safety and productivity of the oven. The annual energy savings is
the difference between the annual energy use by the baseline system and the annual energy use
by the oven after steps are taken to control of LFL in exhaust air. In all cases involving LFL
level control, it is essential to measure value of LFL level before and after implementation of
LFL level controls. LFL levels within the exhaust air can be measured using a LFL probe or
through detailed calculations that require superior knowledge of the equipment and process. In
most cases, the detail calculations are difficult and unreliable.
For the operation of driers involving flammable solvent emissions, there is a required amount of
air or inert gas or combustion products (all referred to as air in the following discussion) to
maintain a specified safe operating conditions within the equipment (varying depending on the
solvent). A table given in the NFPA publication “NFPA 68 Standard for Ovens and Furnaces”
gives the required amount of dilution air per gallon of the solvent (completely evaporated). This
table can be used to determine the amount of air required to achieve the desired LFL level in an
oven or, alternatively, to determine the amount of air mixed with solvents for a given level of
LFL.
Page 10
LFL or LEL Control of the Ovens
4
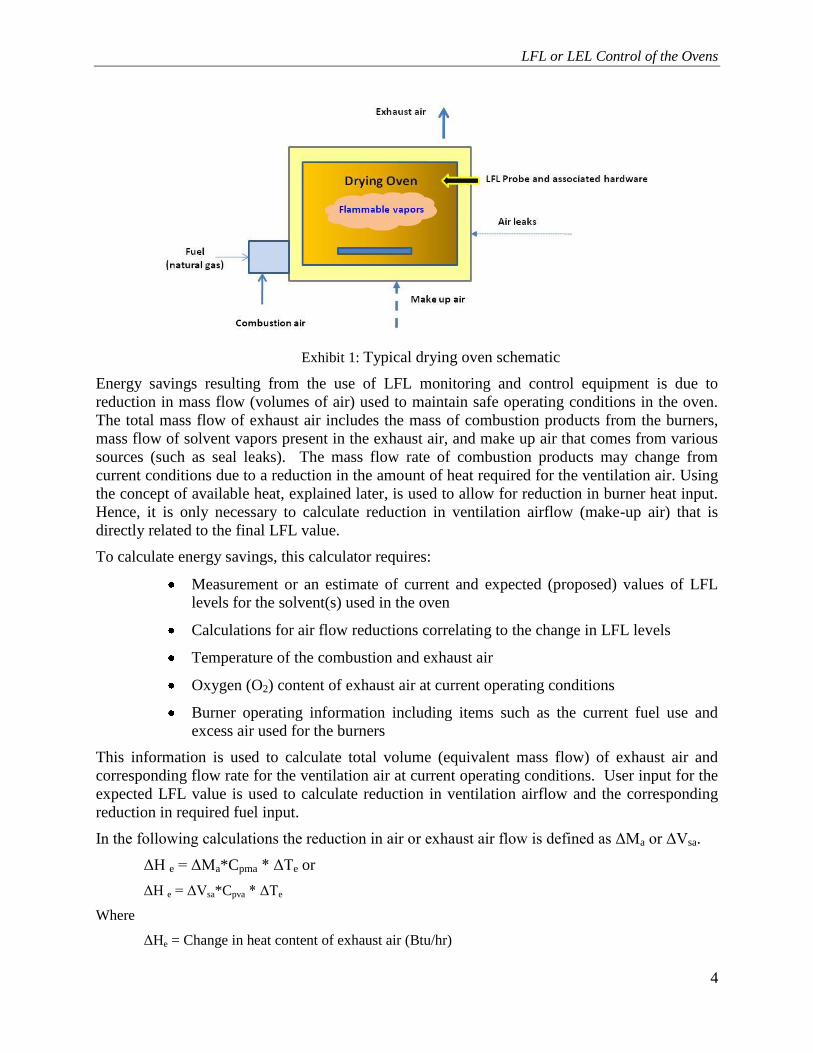
Exhibit 1: Typical drying oven schematic
Energy savings resulting from the use of LFL monitoring and control equipment is due to
reduction in mass flow (volumes of air) used to maintain safe operating conditions in the oven.
The total mass flow of exhaust air includes the mass of combustion products from the burners,
mass flow of solvent vapors present in the exhaust air, and make up air that comes from various
sources (such as seal leaks). The mass flow rate of combustion products may change from
current conditions due to a reduction in the amount of heat required for the ventilation air. Using
the concept of available heat, explained later, is used to allow for reduction in burner heat input.
Hence, it is only necessary to calculate reduction in ventilation airflow (make-up air) that is
directly related to the final LFL value.
To calculate energy savings, this calculator requires:
Measurement or an estimate of current and expected (proposed) values of LFL
levels for the solvent(s) used in the oven
Calculations for air flow reductions correlating to the change in LFL levels
Temperature of the combustion and exhaust air
Oxygen (O2) content of exhaust air at current operating conditions
Burner operating information including items such as the current fuel use and
excess air used for the burners
This information is used to calculate total volume (equivalent mass flow) of exhaust air and
corresponding flow rate for the ventilation air at current operating conditions. User input for the
expected LFL value is used to calculate reduction in ventilation airflow and the corresponding
reduction in required fuel input.
In the following calculations the reduction in air or exhaust air flow is defined as ΔMa or ΔVsa.
ΔH e = ΔMa*Cpma * ΔTe or
ΔH e = ΔVsa*Cpva * ΔTe
Where
ΔHe = Change in heat content of exhaust air (Btu/hr)
Page 11
LFL or LEL Control of the Ovens
5
ΔMa = Change in mass flow rate (lbs/hr) of air calculated based on change in LFL value.
Cpma = Specific heat of exhaust air in terms of Btu/(lb. OF)
ΔVsa = Change in volume flow rate [Standard cubic feet (SCF)/hr.] of air calculated based on
change in LFL value.
Cpva = Specific heat of exhaust air in terms of Btu/(scf. OF)
ΔTe = Increase or change in temperature of exhaust air (OF)
Reduction in the heat requirement (ΔHe) for the air is used to calculate the actual reduction in
burner heat input for the oven. This calculation requires knowledge of the available heat (often
known as combustion efficiency) of the burners used in the oven.
The term “available heat” is defined as difference in heat input and the heat content of exhaust
air leaving the furnace system. It is usually expressed as percentage (%) and represents the
amount of heat remaining within an oven as a fraction of the heat input to the oven.
The following symbols are used in the equations below:
Hf = Oven or furnace heat demand (Btu/hr)
Hav = Available heat (Btu/hr)
Hin = Heat input in the oven (Btu/hr)
Hex = Heat content of exhaust air leaving the heating system or oven (Btu/hr)
Avht(%) = Percent available heat
The total heat input is defined as Hin = Hf + Hex
Hav = Hin – Hex.
Hex = Hin – Hf
Hav = Hf
Available heat expressed as a percentage is used as a good indication of performance of a heating
system and it is given as
Avht(%) = 100% * Hf / Hin
Therefore
Page 12
LFL or LEL Control of the Ovens
6
Hin = 100%* Hf / Avht(%) (Note that this value is still is expressed as Btu/hr.)
The oven or heat demand includes the amount of heat required to raise temperature of the
ventilation air as reflected in change in heat contained in the exhaust air. This can be used to
calculate reduction in the burner heat input or heat required for the oven.
The energy savings (Hsaving) would be equal to change in exhaust air heat content divided by the
available heat for the burner combustion products.
Hsaving = ΔHe / Avht(%)
Avht(%),depends on the following variables:
- Fuel composition
- Exhaust gas temperature
- Combustion air temperature
- Percent oxygen (dry) in the combustion products for the burners.
Available heat can be calculated by using combustion calculations for a given fuel. For this
excess air calculator tool, the calculations use a typical natural gas composition as found in
California.
The natural gas composition used for calculations in this tool is given below. Note that the user
gives the composition in the column marked “By Volume”. If the values in column “By
Volume” do not add up to 100% the program will adjust the percentages under column
“Adjusted by Volume” to add up to 100% by changing the value of each component %
proportionately. In most cases, the total under column “By Volume” is not equal to 100% due to
rounding error.
For this calculator, the “higher heating value” or “gross heating value” for the fuel is used. The
higher or gross heating value for natural gas with the composition shown in Exhibit 2 is 1,020
Btu per standard cubic foot (scf). The heating value of natural gas varies from 970 Btu/scf to as
high as 1,200 Btu/scf. However, in many situations 1,000 Btu/scf is considered a good
approximation. Minor changes in the heating value have very little effect on the savings achieved
with changes (usually reduction) in excess air.
It is recognized that natural gas composition may vary somewhat during the year or from
location to location. However, a series of calculations shows that the variation in natural gas
composition has very small effect on the available heat as a percentage of the heating value.
Hence, available heat changes are within a narrow range and the error for this value is relatively
small and within plus or minus 5%. Thus, we advise users of this calculator that the accuracy of
its estimates will be in the same range of variation, i.e. plus or minus 5%. A separate calculator
is available to calculate the exact value of available heat when the fuel composition is known or
when the natural gas composition is significantly different from that stated in Exhibit 2.
Page 13
LFL or LEL Control of the Ovens
7
Further discussion on available heat and the effect of fuel composition is discussed in references
1 and 2.
Exhibit 2: Composition of natural gas used for calculations.
We define Hannual as the annual energy savings in Btu/year. Then
Annual savings can be expressed in terms of Btu/year, Therms/year or millionBtu/year
(MMBtu/year) by using the appropriate equations given below.
Gas composition By volumeAdjusted by
volume
CH4 94.10% 94.241%
C2H6 2.40% 2.404%
N2 and other inert 1.41% 1.412%
H2 0.03% 0.030%
C3H8 0.49% 0.491%
C4H10 + CnH2n 0.29% 0.290%
H2O 0.00% 0.000%
CO 0.42% 0.421%
CO2 0.71% 0.711%
SO2 0.00% 0.000%
O2 0.00% 0.000%
Total of fuel
components 99.85% 100.000%
Difference 0.15% 0.00%
Note: The fuel gas composition is in volume %. The
higher hydrocarbons in fuel are treated as same as
C4H10 and all other inert gases are treated as N2.
Fuel Gas Analysis (See note below)
Page 14
LFL or LEL Control of the Ovens
8
(Dividing by 1,000,000 is necessary if Hannual is measured in Btu/hr instead of MMBtu/hr)
The CO2 savings can be calculated by using the fuel combustion calculations or by using the
EPA guidelines for CO2 generation calculations. Reference 5 gives details of US EPA
guidelines.
4. Instruction on use of the calculator
The following list summarizes the user inputs that are required. The user should collect this
information before using this calculator tool.
Company name, plant location and address
Customer name and contact information
Heating equipment description (where the energy-saving measure is applied)
Equipment type (furnace, oven, kiln, heater, boiler)
Equipment use (e.g., textile drying, aluminum melting, food processing)
Note: The preceding information may be optional for the web-based calculators due to users’
concerns about privacy.
LFL reading – current reading or value (%)
Current firing rate (Btu/hr)
Excess air used for the burners (%)
Temperature of exhaust air or flue gases (OF)
Combustion air temperature (OF).
Ambient air temperature (OF).
Oxygen (% O2) in exhaust air or flue gas (%, dry basis)
SCF air required per gallon of solvent (scf) from the table given as Appendix 1
New suggested value for LFL or LEL (%)
Fuel (energy cost) in terms of $ per MMBtu
Number of operating hours per year
The calculator gives following results:
Available heat for the burners (%)
Page 15
LFL or LEL Control of the Ovens
9
Estimated makeup air or air leaks (scfh)
Heat used in the oven (Btu/hr)
Total volume of exhaust air (scfh)
Gallons of solvents used per hour
New volume of exhaust air required (scfh)
Reduction in exhaust air volume (scfh)
Net heat savings (Btu/hr)
Total or gross heat savings (Btu/hr)
Annual fuel cost savings ($/year)
Reduction in CO2 emissions (tons/year)
Note that the CO2 savings are based on natural gas as the fuel for the heating equipment. A
correction factor must be applied if any other fuel is used.
The LFL control calculator requires the following input parameters describing the heating
process in order to estimate the savings. Exhibit 3 shows the user information screen and Exhibit
4 shows the calculator screen.
Exhibit 4 shows the required data for the calculator. The calculator cells are color coded. The
white cells are used for data input by the user while the colored (yellow and light blue or green)
cells are protected and give results of the calculations. The user is not allowed change numbers
shown in the colored cells.
The first section requires information about the user, equipment, and process.
Exhibit 3: Required information for the calculator user
Line 1 – Name of the company.
Line 2 – Name or known designation such as “main plant” or “secondary plant” if
applicable.
Line 3 – Plant address.
Page 16
LFL or LEL Control of the Ovens
10
Line 4 – Contact name for the plant – This individual is main contact and is responsible
for collecting and providing the required information.
Line 5 – Address for the contact person.
Line 6 – Contact phone number and e-mail to be used for all future communications.
Line 7 – Date when the calculations are carried out.
Line 8 – Type of heating equipment – This can be an oven, furnace, boiler, heater, etc.
This is the heating equipment where data is collected and the given energy
saving measure is to be applied.
Line 9 – Process or function for which the heating equipment is used – This can be name
of the process such as drying, melting, water heating, etc.
Line 10 – Any additional information that can be useful in application of the results –The
second section of the calculator is used for collecting the necessary data and
reporting the estimated savings.
Line 11 – LFL reading – current reading or value – Give measured or estimated value of
LFL in percentages. The most accurate values can be obtained by using an
LFL measuring instrument. In case where such an instrument is not available,
it may be possible to get approximate value of the LFL level by using volume
of exhaust air measured by using a Pitot tube or other similar flow measuring
device with temperature corrections and the quantity of solvent or flammable
liquid vaporized in the oven. This will be an approximate and perhaps higher
in value.
Line 12 – Current average hourly fuel consumption (MM Btu/hr) – This is the value of
current fuel consumption or burner heat input expressed in MMBtu/hour. This
should be an average value based on measurements of fuel use over a period of
time or at “average” operating conditions. It is possible to get this value if the
fuel consumption data is available for a certain period of time (monthly,
annually etc.) for the furnace being considered. Note that the meter data, if
used to calculate the fuel use, must be corrected for the pressure and
temperature at the meter and the heat input should be calculated using the
heating value of the fuel. For the most commonly used or average-quality
natural gas in California, a heating value of 1020 per standard cubic foot (scf)
will be a good approximation.
Line 13 – Excess air used for burners (%) – This is obtained by measuring air and fuel
(natural gas) flow for the burners. Note that the O2 reading for the exhaust air
is NOT a good indication of the burner excess air. If it is not possible to get
flow readings use a value suggested by the oven supplier or by the burner
supplier. If no further information is available, use 10% excess air as a default
number. In most low temperature ovens with exhaust air temperature in the
range of 300 deg/ F. to 600 deg. F. this would give tolerable (plus or minus)
error.
Page 17
LFL or LEL Control of the Ovens
11
Exhibit 4: Example of calculator inputs and results
Line 14 – Temperature of flue gases (deg. F.) – Give the exhaust air or flue gas
temperature measured as close to the exit of the oven as possible. The
temperature should be taken when the oven is operating at normal (“average”)
operating conditions. Readings taken at non-average production or operating
conditions can give unreliable results. Exhaust gases should not be mixed with
cold air at the point where the temperature is measured for the measurement to
be valid. Care should be taken to locate the thermocouple or temperature
measurement sensor in the middle of the stack or area from where the flue
gases are discharged. Measuring the temperature at the top of the stack or very
close to the wall of the discharge duct can give erroneous reading. In almost
all cases, the flue gas temperature does not change by any significant value
with the use of preheated combustion air or make up air, since the oven zone
temperatures are controlled to meet the required process conditions.
Page 18
LFL or LEL Control of the Ovens
12
Line 15 – Combustion air temperature (OF.) – The measured value of the temperature of
combustion air entering the burners. In many cases, it is not possible to get the
exact air temperature at the burner, and it is common to use the temperature of
air entering the combustion air blower or the ambient temperature around the
air blower. For a case where preheated combustion air is used it is necessary to
use combustion air temperature at the burner or at the exit of the air preheating
equipment such as a recuperator, regenerator or regenerative burners.
Line 16 – Ambient temperature (OF) – The ambient temperature at or near location of the
oven.
Line 17 – Available heat for burners (%)– This is a calculated value based on the data
given above. The calculation uses the “Available Heat” tool developed as part
of this tool set and assumes natural gas as fuel. The natural gas composition
used for this calculation is same as that given in Exhibit 4 above.
Line 18 – % O2 in exhaust air or flue gases – obtained from flue gas analysis using
commonly available combustion or flue gas analyzers. These analyzers give
the flue gas analysis on dry basis. The sample for the gas analysis should be
taken when the furnace is operating at normal operating conditions. Readings
taken at non-average production or operating conditions can give unreliable
results. It is necessary to make sure that the flue gases are NOT mixed with
cold air before the gas is measured. Care should be taken to locate the
sampling probe in the middle of the stack or area from where the flue gases are
discharged. Collecting the sample at the top of the stack or very close to the
wall of the discharge duct can give erroneous reading. It is also necessary to
make sure that there is no air leakage through the sampling port when the
sampling probe is inserted in the stack or sampling location.
Line 19 – Estimated make up air or air leaks (scfh) – This is calculated using available
information on the O2 content of exhaust air or flue gas, burner heat input, heat
input data for the excess air and combustion air temperature at the current
operating conditions.
Line 20 – SCF air required at LFL per gallon of solvent – This value can be obtained
from the solvent properties data given as Appendix 1. The user selects the
solvent or flammable liquid vapors used for the process and then the
corresponding value of standard cu. ft. of air required at LEL or LFL condition.
If the solvent or flammable vapors are a mixture of several materials then it is
necessary to get an average value based on the mass fraction of each liquid and
corresponding value of LFL.
For example if there are two liquids with mass fraction of x% and y% and their
corresponding volumes for the LFL values are Vax and Vay then the average
volume will be equal to:
The value Vav (scf/gallon) is used as input for this cell.
Page 19
LFL or LEL Control of the Ovens
13
In this case x% + y% = 100%
It is not necessary to know the exact value of gallons of solvents present or
used in the oven since this will be calculated later in this calculator (Line 23).
Line 21 – Heat used in the oven (Btu/hr) – This is a calculated value and it represents
heat used in the oven for all other heat loads (such as heating the material and
liquids being processed, wall loss, and other losses). It is calculated by
deducting heat used in exhaust air from the burner heat input. It is assumed that
the heat load remains constant when the ventilation air is changed.
Line 22 – Total volume of exhaust air (scfh) – This term is calculated using burner heat
input, excess air used for burners, and ventilation air volume calculated above.
This represents current volume of exhaust air discharged from the oven.
Line 23 – Gallons of solvent used (per hour) – This value is calculated using exhaust gas
volume (Line 22), measured value of LEL (Line 11) and SCF air at LFL per
gallon of the solvent (Line 20).
Line 24 – New suggested value of LFL or LEL (%) – The user is required to give this
value. For cases where the LFL is continuously monitored, this value can
approach but not exceed 50% of the LFL. The energy savings are based on
this value and in many cases the user may want to be conservative and may
select lower than 50% as a starting point.
Line 25 – Estimated new volume of exhaust air required (scfh) – This is a calculated
value based on gallons of solvent used (Line 23), new suggested value of LFL
(Line 24) and the required air volume at the solvent LFL (Line 20.
Line 26 – Reduction in exhaust air volume (scfh) – This is a calculated value based on
the current exhaust gas volume (Line 22) and new volume of exhaust air (Line
25).
Line 27 – Net heat savings (Btu/hr) – This is a calculated value based on reduction in
exhaust air volume, average specific heat exhaust air and temperature of flue
gases or exhaust air.
Line 28 – Total or gross heat savings @ burner tip (Btu/hr) – This is the value calculated
using net heat savings and available heat for the burner combustion or
combustion efficiency.
Line 29 – Fuel cost ($/MM Btu) – The user gives cost of fuel expressed in terms of
$/MM Btu. The cost should include all charges related to use of fuel at “the
burner tip”. This value can be obtained directly from monthly or annual gas
bills. It is often stated as a line item on the bill. If the bill does not specifically
mention the gas cost then it is necessary to calculate average cost of fuel by
using values of total fuel cost and annual fuel used.
Page 20
LFL or LEL Control of the Ovens
14
If necessary, contact the fuel (natural gas) supplier or distributor for more
information.
Line 30 – Number of operating hours (per year) – This represents annual operating hours
at the average firing conditions given above.
Line 31 – Annual fuel cost savings ($/year) – This is the difference between cost of
energy (heat input) used per year with the current operating conditions and cost
after implementation LFL monitoring and control system for the oven.
Line 32 – Reduction in CO2 emissions (tons/year) – These savings are calculated based
on annual fuel savings, assuming the fuel used is natural gas. The savings are
in Short (US) tons, not in Metric tons.
Line 33 – Annual fuel savings (MM Btu/year) – This is the total about of energy saved
over the course of one year.
Page 21
LFL or LEL Control of the Ovens
15
5. References and Resources
1. Hans L. Melgaard, “Substantial Energy Savings are Often Realized by Monitoring Process Oven
Exhausts,” Plant Engineering, November 1980
2. North American Combustion Handbook, Third Edition, 1986. Published by North American
Mfg. Company, Cleveland, OH.
3. Combustion Technology Manual, Fifth Edition, 1994. Published by Industrial Heating
Equipment Association, Cincinnati, OH.
4. Improving Process Heating System Performance: A Sourcebook for Industry, U.S.
Department of Energy and Industrial Heating Equipment Association. Available online at
http://www1.eere.energy.gov/industry/bestpractices/pdfs/process_heating_sourcebook2.pdf
5. Unit Conversions, Emission Factors and Other Reference Data, published by the U.S. EPA,
November 2004. Available online at http://www.epa.gov/cpd/pdf/brochure.pdf
6. Tip sheets and Technical Briefs, published by The U.S. Department of Energy. Available
online at
http://www1.eere.energy.gov/industry/utilities/steam_tools.html
7. Training opportunities for process heating technology
The U. S. Department of Energy (DOE), Energy Efficiency and Renewable Energy (EERE) Office of
Industrial Technologies (ITP) web site. http://www1.eere.energy.gov/industry/
Sempra Energy – Southern California Gas Company web site. www.socalgas.com
California Energy Commission web site
www.energy.ca.gov
Page 22
LFL or LEL Control of the Ovens
I
Appendix 1
Data for commonly used solvents
Page 1 of 2
Solvent Name
Mo
lecu
lar
We
igh
t
Flas
h P
oin
t °F
Au
to-i
gnit
ion
°F LEL
% b
y
Vo
lum
e
UEL
% b
y
Vo
lum
e
Spe
cifi
c
Gra
vity
Wat
er
=1
Vap
or
De
nsi
ty
Air
= 1
Bo
ilin
g P
oin
t
°F lb p
er
Gal
scf
Vap
or
pe
r
gal
scf
Vap
or
pe
rlb
scf
Air
at
LEL
pe
r ga
l
Acetone 58 -4 869 2.5 12.8 0.79 2 133 6.58 43.9 6.67 1712
n-Amyl Acetate 130 60 680 1.1 7.5 0.88 4.5 300 7.33 21.8 2.98 1961
sec-Amyl Acetate 130 89 1 7.5 0.88 4.5 249 7.33 21.8 2.98 2159
Amyl Alcohol 88 91 572
1.2 at
212°F
10.0 at
212°F 0.82 3 280 6.83 30 4.4 2472
Benzene 78 12 928 1.2 7.8 0.88 2.8 176 7.33 35 4.78 2885
Benzine Mix 0 550 1.1 5.9 0.64 2.5 5.33 28.5 5.35 2566
n-Butyl Acetate 116 72 797 1.7 7.6 0.88 4 260 7.33 24.4 3.34 1413
n-Butyl Alcohol 74 98 650 1.4 11.2 0.81 2.6 243 6.75 35.3 5.23 2484
sec-Butyl Alcohol 74 75 761
1.7 at
212°F
9.8 at
212°F 0.81 2.6 201 6.75 35.3 5.23 2039
Butyl Cellosolve 118 148 472
1.1 at
200°F
12.7 at
275°F 0.9 4.1 340 7.5 24.6 3.28 2209
Butyl Propionate 130 90 799 0.88 4.5 295 7.33 21.8 2.98
Camphor 152 150 871 0.6 3.5 0.99 5.2 399 8.24 21.1 2.55 3489
Carbon Disulfide 76 -22 194 1.3 50 1.26 2.6 115 10.49 53.4 5.09 4056
Cellosolve 90 110 455
1.7 at
200°F
15.6 at
200°F 0.93 3 275 7.75 34.6 4.46 1998
Cellosolve Acetate 132 124 715 1.7 13 0.98 4.7 313 8.16 23.1 2.84 1338
Chlorobenzene 113 82 1099 1.3 9.6 1.11 3.9 270 9.24 31.6 3.42 2403
Corn Oil Mix 490 740 0.9 7.5
Cottonseed Oil Mix 486 650 0.9 7.5
m-Cresol or p-Cresol 108 187 1038
1.1 at
302°F 1.03 3.7 395 8.58 30.7 3.58 2763
Cyclohexane 84 -4 473 1.3 8 0.78 2.9 179 6.5 29.9 4.61 2271
Cycloheanone 98 111 788
1.1 at
302°F 9.4 0.95 3.4 313 7.91 31.2 3.95 2808
p-Cymene 134 117 817
0.7 at
212°F 5.6 0.86 4.6 349 7.16 20.7 2.93 2933
Dibutyl Phthalate 278 315 757
0.5 at
456°F 1.04 9.6 644 8.66 12.1 1.41 2399
o-Dichlorobenzene 147 151 1198 2.2 9.2 1.31 5.1 356 10.91 28.7 2.67 1276
Diethyl Ketone 86 55 842 1.6 0.81 3 217 6.75 30.3 4.56 1866
n-Dimethyl Formamide 73 136 833
2.2 at
212°F 15.2 0.94 2.5 307 7.83 41.5 5.37 1844
p-Dioxane 88 54 356 2 22 1.03 3 214 8.58 37.7 4.45 1848
Ethyl Acetate 88 24 800 2 11.5 0.9 3 171 7.5 33 4.45 1615
Ethyl Alcohol 46 55 685 3.3 19 0.79 1.6 173 6.58 55.3 8.52 1621
Ethylbenzene 106 59 810 0.8 6.7 0.87 3.7 277 7.25 26.4 3.7 3279
Ethyl Ether 74 -49 356 1.9 36 0.71 2.6 95 5.91 30.9 5.3 1596
Page 23
LFL or LEL Control of the Ovens
II
Appendix 1
Data for commonly used solvents
Page 2 of 2
Solvent Name
Mo
lecu
lar
We
igh
t
Flas
h P
oin
t °F
Au
to-i
gnit
ion
°F
LEL
% b
y V
olu
me
UEL
% b
y V
olu
me
Spe
cifi
c G
ravi
ty
Wat
er
=1
Vap
or
De
nsi
ty A
ir
= 1
Bo
ilin
g P
oin
t °
F
lb p
er
Gal
scf
Vap
or
pe
r ga
l
scf
Vap
or
pe
rlb
scf
Air
at
LEL
pe
r
gal
Ethyl Lactate 118 115 752
1.5 at
212°F 1.04 4.1 309 8.66 28.4 3.32 1865
Ethyl Methyl Ether 60 -35 374 2 10.1 0.7 2.1 51 5.8 37.6 6.53 1842
Ethyl Propionate 102 54 824 1.9 11 0.89 3.5 210 7.4 28.1 3.84 1452
Ethylene Dicholride 99 56 775 6.2 16 1.3 3.4 183 10.8 42.3 3.96 640
Gasoline Mix -45 536 1.4 7.6 0.8 3.0- 4.0 6.7 29.7 4.46 2094
n-Heptane 100 25 399 1 6.7 0.68 3.5 209 5.7 21.9 3.92 2169
n-Hexane 86 -7 427 1.1 7.5 0.66 3 156 5.5 24.7 4.56 2223
Kerosene (Fuel Oil #1) Mix 100- 162 410 0.7 5 0.83 6.9
Linseed Oil - Raw Mix 432 650 0.93 600 7.7
Magiesol 47 203 215 428 0.5 0.8 7 464 6.7 12.7 1.91 2527
Magisol 52 236 265 428 0.5 0.81 8.2 518 6.7 11.1 1.64 2201
Methyl Acetate 74 14 850 3.1 16 0.93 2.8 140 7.7 37 5.3 1157
Methyl Alcohol 32 52 725 6 36 0.79 1.1 147 6.6 79.5 12.25 1246
Methyl Carbitol 120 205 465 1.4 22.7 1.01 4.1 389 8.4 27.2 3.27 1945
Methyl Cellosolve 76 102 545 1.8 14 0.96 2.6 255 8 40.7 5.16 2220
Methyl Celloosolve Acetate 118 111 1.7 8.2 1.01 4.1 292 8.4 27.6 3.32 1595
Methyl Ethyl Ketone 72 16 759
1.4 at
200°F
11.4 at
200°F 0.8 2.5 176 6.7 35.8 5.44 2521
Methyl Lactate 104 121 725
2.2 at
212°F 1.1 3.6 293 9.2 34.1 3.77 1515
Mineral Spirites #10 Mix 104 473
1.8 at
212°F 6 0.8 3.9 300 6.7 22.9 3.43 2836
Naphtha (VM&P Regular) Mix 28 450 0.9 5.9 203-320
Naphthalene 128 174 979 0.9 1.1 4.4 424 9.2 27.7 3.06 3049
Nitrobenzene 123 190 900 1.8 at 200°F 1.25 4.3 412 10.4 32.7 3.19 1786
Nitroethane 75 82 778 3.4 1.04 2.6 237 8.7 44.7 5.23 1269
Nirtromethane 61 95 785 7.3 1.13 2.1 214 9.4 59.7 6.43 758
Nitropropane-1 89 96 789 2.2 1 3.1 268 8.3 36.2 4.4 1609
Nitropropane-2 89 75 802 2.6 11 0.99 3.1 248 8.2 35.8 4.4 1343
Paraffin Oil Mix 444 0.83- 0.91
Peanut Oil Mix 540 833 0.9 7.5
Perchloroethylene 166 None None None 1.62 5.8 250 13.5 31.1 2.36
Petroleum Ether Mix <0 550 1.1 5.9 0.66 2.5 5.5 29.4 5.35 2646
Propyl Acetate 102 55 842
1.7 at
100°F 8 0.89 3.5 215 7.4 38.1 3.84 1626
n-Propyl Alcohol 60 74 775 2.2 13.7 0.8 2.1 207 6.7 43 6.53 1910
i-propyl Alcohol 60 53 750 2
12.7 at
200°F 0.78 2.1 181 6.5 41.9 6.53 2052
n-pPropyl Ether 102 70 370 1.3 7 0.75 3.5 194 6.2 23.7 3.84 1798
Pryridine 79 68 900 1.8 12.4 0.98 2.7 239 8.2 40 4.96 2180
Rosin Oil Mix 266 648 1 680 8.3
Soy Bean Oil Mix 540 833 0.9 7.5
Tetrahydrofuran 72 6 610 2 11.8 0.89 2.5 151 7.4 39.8 5.44 1952
Toluene 92 40 896 1.1 7.1 0.87 3.1 231 7.2 31.1 4.26 2800
Turpentine 136 95 488 0.8 0.87 4.7 300 7.2 20.6 2.88 2556
Vinyl Acetate 86 18 756 2.6 13.4 0.93 3 161 7.7 34.8 4.56 1305
o-Xylene 106 88 867 0.9 6.7 0.88 3.7 292 7.3 26.7 3.7 2945