Electronic Systems Support Cooling Measurements Report Geraldine Thomas 08/08/02 - 1 - LHC Rack Cooling Measurements Abstract We report on a project to determine whether the rack cooling system developed for the LEP experiments is suitable for the cooling of LHC electronics. In addition, we have investigated the performance of a new heat exchanger design which is a single unit high; the temperature distribution within the subracks; and the possibility of cooling electronics without the use of fan-trays. The results of the project indicate that the system is suitable: using 2U high heat exchangers, 10kW of power may be dissipated within the rack with less than 2% losses to the surroundings. 1U heat exchangers do not perform as well as the 2U version, losing almost 10% of the power to the surroundings (but these units were also shorter than the 2U version and this point requires further consideration). The system may also be run without fan-trays up to power dissipation levels of approximately 5kW. Temperatures within the subracks were generally no higher than 35 O C in all of these configurations. Report Author: Geraldine Thomas Project Team: Geraldine Thomas, Philippe Vive Roux Fontaine, Vincent Pittin
Transcript
Electronic Systems Support Cooling Measurements Report
Geraldine Thomas 08/08/02 - 1 -
LHC Rack Cooling Measurements
Abstract
We report on a project to determine whether the rack cooling system developed for the LEP experiments is suitable for the cooling of LHC electronics. In addition, we have investigated the performance of a new heat exchanger design which is a single unit high; the temperature distribution within the subracks; and the possibility of cooling electronics without the use of fan-trays. The results of the project indicate that the system is suitable: using 2U high heat exchangers, 10kW of power may be dissipated within the rack with less than 2% losses to the surroundings. 1U heat exchangers do not perform as well as the 2U version, losing almost 10% of the power to the surroundings (but these units were also shorter than the 2U version and this point requires further consideration). The system may also be run without fan-trays up to power dissipation levels of approximately 5kW. Temperatures within the subracks were generally no higher than 35OC in all of these configurations.
Report Author: Geraldine Thomas
Project Team: Geraldine Thomas, Philippe Vive Roux Fontaine, Vincent Pittin
Electronic Systems Support Cooling Measurements Report
Geraldine Thomas 08/08/02 - 2 -
1 Introduction and project aims A rack cooling system was developed for the LEP experiments based on a closed circulating air flow within the rack with air/water heat exchangers between the subracks (crates) to remove the heat dissipated by the electronics. In this system a pair of tangential turbines was used to drive the air flow, and each electronics subrack (principally FASTBUS) was equipped with a fan-tray to offset the pressure drops caused by the impedance of the electronics and the heat exchangers.
Once initial problems of condensation (due to too low a temperature for the cooling water) were solved, the system worked without problem for over ten years. The principle aim of this project was to determine whether this same system could be used for the LHC experiments. We have assembled a rack system together with the cooling system and 9U load cards in VME64x subracks to simulate as closely as possible the type of electronics infrastructure we expect at the LHC experiments. This system was instrumented to measure the power supplied to the rack, the power removed by the cooling system, and the temperatures within the rack.
The LHC experimental caverns must be air conditioned to remove the heat which escapes from the racks into the environment, thus an important quantity to measure is the fraction of the power supplied to the rack which is not removed by the cooling system. The performance of the cooling system depends on a number of parameters, e.g. temperature of the incoming cooling water and its flow rate. We have set the values of these parameters to be as close as possible to what is expected in the experimental caverns.
The results in this report were presented at the “Joint Cooling and Ventilation” (JCOV) working group meeting of 21st March 2002. In summary these tests investigated the following:
• Performance of the standard configuration: three VME64x 9U subracks with loads and fan-trays,
three 2U heat exchangers (manufactured by CIAT [1]), cooling water at 6 Bar input pressure, 0.5 l/s flow rate and input temperature of 16°C.
• Comparison of the new 1U heat exchangers with the original 2U. • Difference between “long” and “short” fan-trays. • Performance of the system with no fan-trays. • Investigation of the need for a profiled air deflector. • Effect of reducing the cooling water input temperature.
2 General description
2.1 Rack set-up The rack frame used for the tests was recuperated from the ALEPH experiment. It is 56U (2.56m) high and 900mm deep. A 10cm extension was added to the rack with a hinged door.
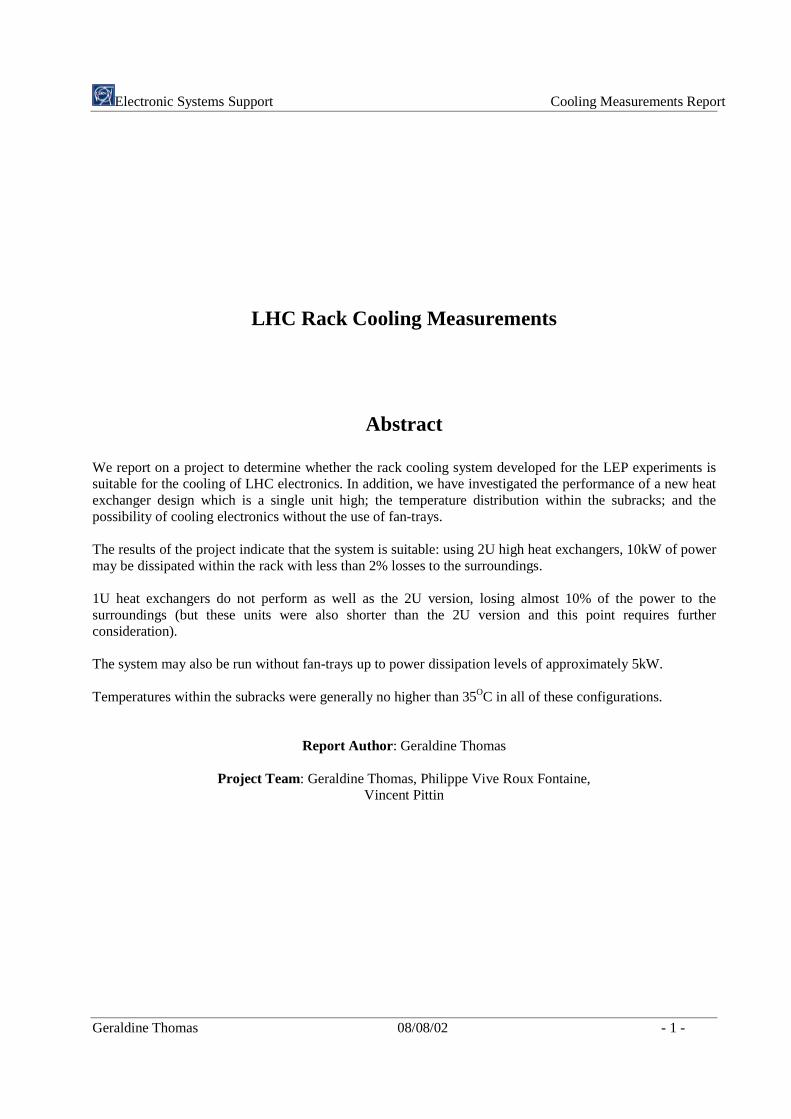
In the standard configuration, it was equipped as follows (see Figure 1 and Figure 2):
• The uppermost 2U housed the prototype rack control system developed in another project [2]. Mains power is supplied to this unit (or in a later version to a companion unit mounted behind it) and then distributed to the equipment in the rack.
• Below the control unit were the tangential turbines [3] which drive the air circulation. These occupied a height of 4U in the test system but in the actual LHC racks will probably be only 3U high.
• Below this a 2U heat exchanger – 9U subrack – 2U fan-tray arrangement was repeated three times. Each subrack housed 21 9U load cards (described in section 2.2). The subracks are powered by
Electronic Systems Support Cooling Measurements Report
Geraldine Thomas 08/08/02 - 3 -
Wiener UEP6021 power supplies [4] capable of delivering up to 2.6kW. The power supplies were mounted within the rear of the subrack. Additionally in order to simulate as closely as possible the likely LHC electronics, the rear of the subrack was fully populated with 6U (160mm depth) VME load modules. These modules were not powered as they did not have the correct pin-out to be rear-mounted.
• At the bottom, the air was deflected upwards by a 3U deflector.
4U
Figure 1- Layout of the rack for
the standard configuration.
Figure 2- Front view of rack fully equipped with 9U
load cards.
The rack was kept as air-tight as possible in order to maximise the efficiency of the air cooling
system. The front of the subrack was closed by the front panels of the loads; and the panels of the 6U transition modules close the air flow at the back of the subrack. Air flow between the front of the backplane and the rear of the backplane was limited by the presence of the backplane itself, though there was some air flow as the back-plane does not have the full height of the subrack (see Figure 4). When the system was running without fan-trays front panels were used to cover the holes to keep the air circulating correctly. Two types of fan-trays were used for the cooling measurements as described in Table 1.
Table 1- Fan-tray specifications.
Fan-tray Type UEL6020A
Wiener “SHORT”
Wiener “LONG”
Size (mm) 2U, depth 600 2U, depth 690
No of inner blowers 6 blowers (“Pabst 7214N”)
9 blowers (“Wiener 1135574”)
Electronic Systems Support Cooling Measurements Report
Geraldine Thomas 08/08/02 - 4 -
Blower speed range 1200->3000 RPM 1200->3000 RPM
Blower power consumption 12 W 9.5 W
Air-flow (m3/h) 200 100
Operating temperature -25 to +72 (°C) -20 to +70 (°C)
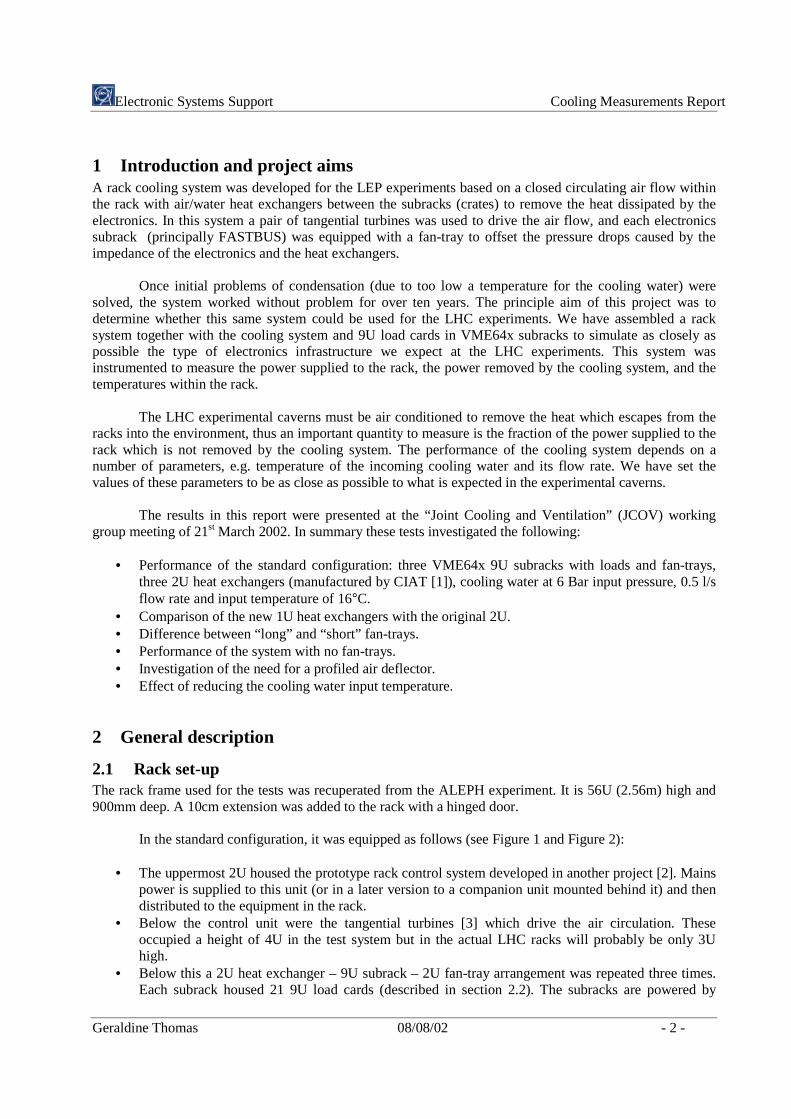
Figure 3- Horizontal cross section
through the rack showing the coverage of the 2U heat exchanger and the space available for passing cables
(“free-space”). The air recirculates down the sides of the rack in the
volume marked “air-space .”
21 Slots9U/400mm
Fan-Tray 2U/690mm(9 blowers)
3U Power-supplyup to 3kW
Transition21 Slots6U/120mm
Heat Exchanger 2U/650mm
Rear
Heat Exchanger 1U/550mm
859mm
1000mm
PF
C
3U Deflector
Backplane
Figure 4- Partial vertical cross section through the rack showing the lowest sub rack, heat
exchanger and air deflector.
The standard configuration, with three heat exchangers, had the heat exchangers positioned above the subracks. The rationale was that in this way cold air is passed down the side of the racks, whereas if hot air was passed the quantity of heat lost to the surroundings would increase. This argument is fairly marginal since in any case racks are generally placed in rows and thus do not have their sides open to the environment (apart from those racks on the end of a row).
The air circulation is shown in Figure 1. Figure 3 shows the rack in horizontal cross section. Here the side channels down which the air is recirculated by the turbines can be seen. This diagram also shows the spaces available for cabling (labelled “free space”) at the sides and rear of the rack.
The cooling system used water from the CERN chilled water network and a small mixing plant which has been regulated to supply water at 16°C. Inside the rack there were two 12mm (internal diameter) vertical distribution pipes with six connection points each. The heat exchangers were connected in parallel to the vertical feeder pipes by 10mm diameter flexible tubing of approximately 50cm length. The temperature of the incoming cooling water was measured where the pipe passed through the side of the rack (see Figure
Electronic Systems Support Cooling Measurements Report
Geraldine Thomas 08/08/02 - 5 -
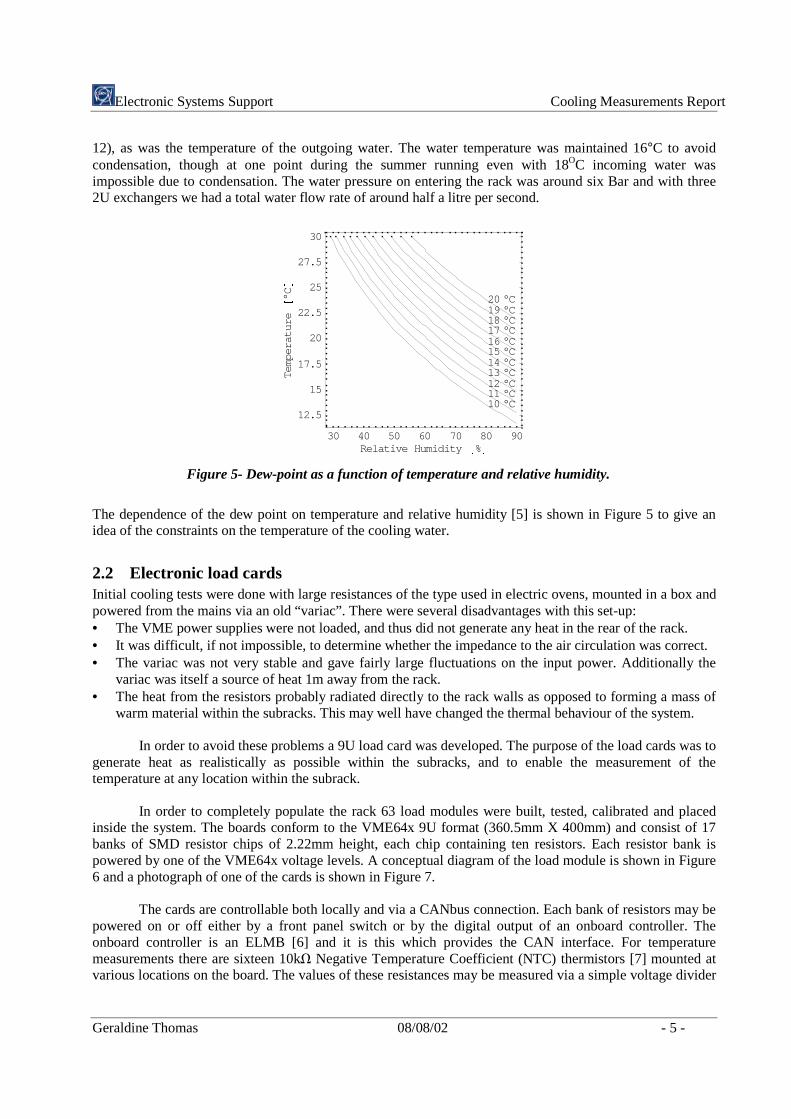
12), as was the temperature of the outgoing water. The water temperature was maintained 16°C to avoid condensation, though at one point during the summer running even with 18OC incoming water was impossible due to condensation. The water pressure on entering the rack was around six Bar and with three 2U exchangers we had a total water flow rate of around half a litre per second.
Figure 5- Dew-point as a function of temperature and relative humidity.
The dependence of the dew point on temperature and relative humidity [5] is shown in Figure 5 to give an idea of the constraints on the temperature of the cooling water.
2.2 Electronic load cards Initial cooling tests were done with large resistances of the type used in electric ovens, mounted in a box and powered from the mains via an old “variac”. There were several disadvantages with this set-up: • The VME power supplies were not loaded, and thus did not generate any heat in the rear of the rack. • It was difficult, if not impossible, to determine whether the impedance to the air circulation was correct. • The variac was not very stable and gave fairly large fluctuations on the input power. Additionally the
variac was itself a source of heat 1m away from the rack. • The heat from the resistors probably radiated directly to the rack walls as opposed to forming a mass of
warm material within the subracks. This may well have changed the thermal behaviour of the system.
In order to avoid these problems a 9U load card was developed. The purpose of the load cards was to generate heat as realistically as possible within the subracks, and to enable the measurement of the temperature at any location within the subrack.
In order to completely populate the rack 63 load modules were built, tested, calibrated and placed
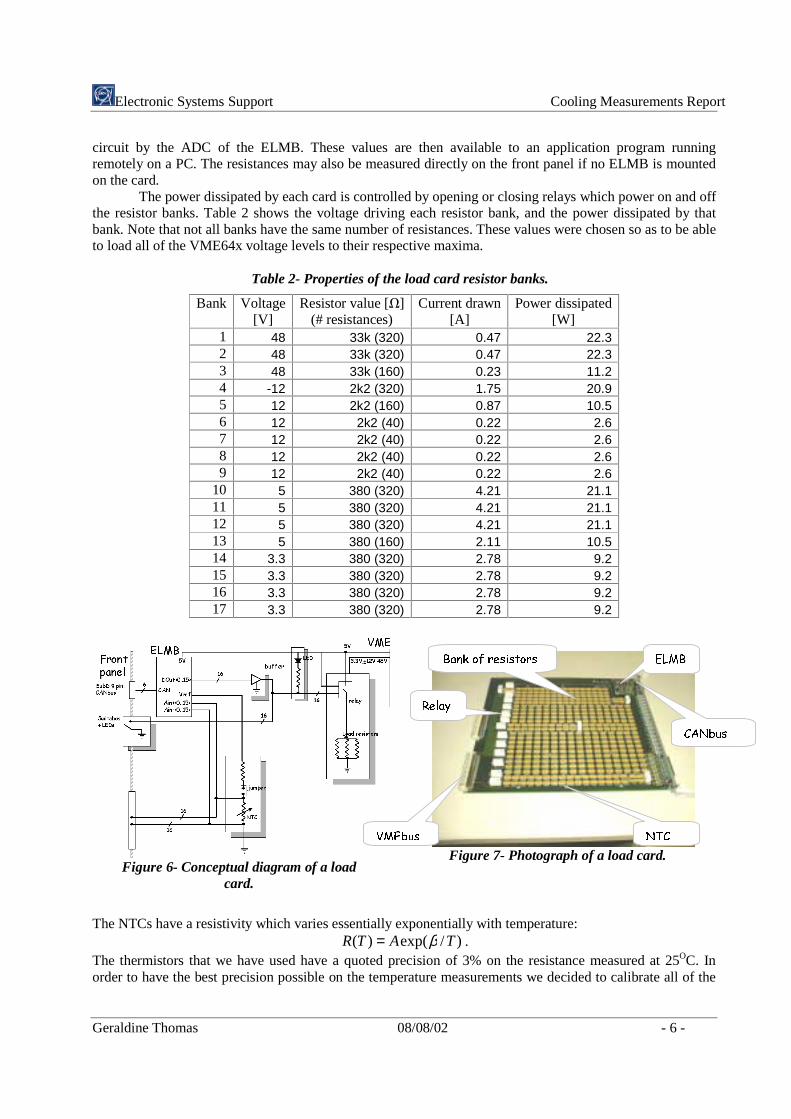
inside the system. The boards conform to the VME64x 9U format (360.5mm X 400mm) and consist of 17 banks of SMD resistor chips of 2.22mm height, each chip containing ten resistors. Each resistor bank is powered by one of the VME64x voltage levels. A conceptual diagram of the load module is shown in Figure 6 and a photograph of one of the cards is shown in Figure 7.
The cards are controllable both locally and via a CANbus connection. Each bank of resistors may be
powered on or off either by a front panel switch or by the digital output of an onboard controller. The onboard controller is an ELMB [6] and it is this which provides the CAN interface. For temperature measurements there are sixteen 10k� Negative Temperature Coefficient (NTC) thermistors [7] mounted at various locations on the board. The values of these resistances may be measured via a simple voltage divider
Electronic Systems Support Cooling Measurements Report
Geraldine Thomas 08/08/02 - 6 -
circuit by the ADC of the ELMB. These values are then available to an application program running remotely on a PC. The resistances may also be measured directly on the front panel if no ELMB is mounted on the card.
The power dissipated by each card is controlled by opening or closing relays which power on and off the resistor banks. Table 2 shows the voltage driving each resistor bank, and the power dissipated by that bank. Note that not all banks have the same number of resistances. These values were chosen so as to be able to load all of the VME64x voltage levels to their respective maxima.
Table 2- Properties of the load card resistor banks.
The NTCs have a resistivity which varies essentially exponentially with temperature:
)/exp()( TATR β= . The thermistors that we have used have a quoted precision of 3% on the resistance measured at 25OC. In order to have the best precision possible on the temperature measurements we decided to calibrate all of the
(/0%�
17&
%DQN�RI�UHVLVWRUV
5HOD\�
90(EXV
&$1EXV�
Electronic Systems Support Cooling Measurements Report
Geraldine Thomas 08/08/02 - 7 -
load cards, thus reducing the systematic variations due to the tolerance of the NTCs and the tolerances of the standard resistors forming the voltage divider circuit.
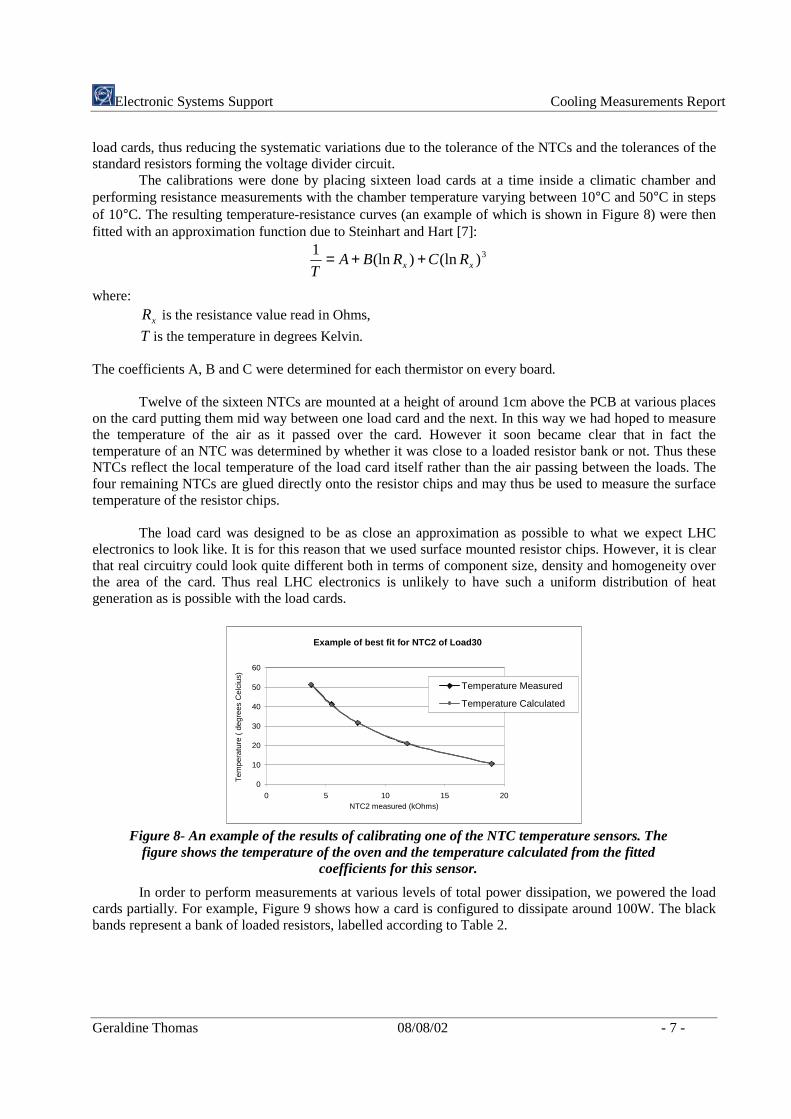
The calibrations were done by placing sixteen load cards at a time inside a climatic chamber and performing resistance measurements with the chamber temperature varying between 10°C and 50°C in steps of 10°C. The resulting temperature-resistance curves (an example of which is shown in Figure 8) were then fitted with an approximation function due to Steinhart and Hart [7]:
3)(ln)(ln1
xx RCRBAT
++=
where:
xR is the resistance value read in Ohms,
T is the temperature in degrees Kelvin. The coefficients A, B and C were determined for each thermistor on every board.
Twelve of the sixteen NTCs are mounted at a height of around 1cm above the PCB at various places on the card putting them mid way between one load card and the next. In this way we had hoped to measure the temperature of the air as it passed over the card. However it soon became clear that in fact the temperature of an NTC was determined by whether it was close to a loaded resistor bank or not. Thus these NTCs reflect the local temperature of the load card itself rather than the air passing between the loads. The four remaining NTCs are glued directly onto the resistor chips and may thus be used to measure the surface temperature of the resistor chips.
The load card was designed to be as close an approximation as possible to what we expect LHC electronics to look like. It is for this reason that we used surface mounted resistor chips. However, it is clear that real circuitry could look quite different both in terms of component size, density and homogeneity over the area of the card. Thus real LHC electronics is unlikely to have such a uniform distribution of heat generation as is possible with the load cards.
Example of best fit for NTC2 of Load30
0
10
20
30
40
50
60
0 5 10 15 20NTC2 measured (kOhms)
Tem
pera
ture
( d
egre
es C
elci
us)
Temperature Measured
Temperature Calculated
Figure 8- An example of the results of calibrating one of the NTC temperature sensors. The
figure shows the temperature of the oven and the temperature calculated from the fitted coefficients for this sensor.
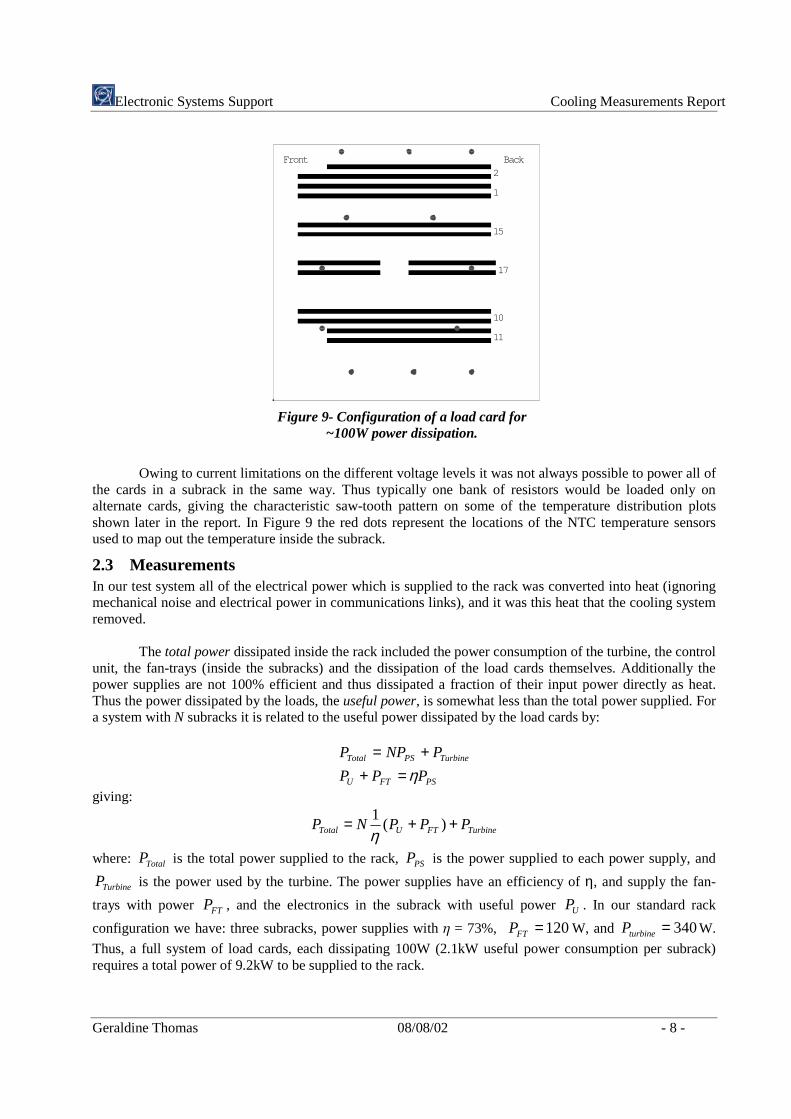
In order to perform measurements at various levels of total power dissipation, we powered the load cards partially. For example, Figure 9 shows how a card is configured to dissipate around 100W. The black bands represent a bank of loaded resistors, labelled according to Table 2.
Electronic Systems Support Cooling Measurements Report
Geraldine Thomas 08/08/02 - 8 -
1
15
17
10
11
2
Front Back
Figure 9- Configuration of a load card for
~100W power dissipation.
Owing to current limitations on the different voltage levels it was not always possible to power all of
the cards in a subrack in the same way. Thus typically one bank of resistors would be loaded only on alternate cards, giving the characteristic saw-tooth pattern on some of the temperature distribution plots shown later in the report. In Figure 9 the red dots represent the locations of the NTC temperature sensors used to map out the temperature inside the subrack.
2.3 Measurements In our test system all of the electrical power which is supplied to the rack was converted into heat (ignoring mechanical noise and electrical power in communications links), and it was this heat that the cooling system removed.
The total power dissipated inside the rack included the power consumption of the turbine, the control unit, the fan-trays (inside the subracks) and the dissipation of the load cards themselves. Additionally the power supplies are not 100% efficient and thus dissipated a fraction of their input power directly as heat. Thus the power dissipated by the loads, the useful power, is somewhat less than the total power supplied. For a system with N subracks it is related to the useful power dissipated by the load cards by:
PSFTU
TurbinePSTotal
PPP
PNPP
η=++=
giving:
TurbineFTUTotal PPPNP ++= )(1
η
where: TotalP is the total power supplied to the rack, PSP is the power supplied to each power supply, and
TurbineP is the power used by the turbine. The power supplies have an efficiency of η, and supply the fan-
trays with power FTP , and the electronics in the subrack with useful power UP . In our standard rack
configuration we have: three subracks, power supplies with � = 73%, 120=FTP W, and 340=turbineP W.
Thus, a full system of load cards, each dissipating 100W (2.1kW useful power consumption per subrack) requires a total power of 9.2kW to be supplied to the rack.
Electronic Systems Support Cooling Measurements Report
Geraldine Thomas 08/08/02 - 9 -
Rack in thermalequilibrum
Input Electrical powerHeat removed by water
Heat lost to the environment
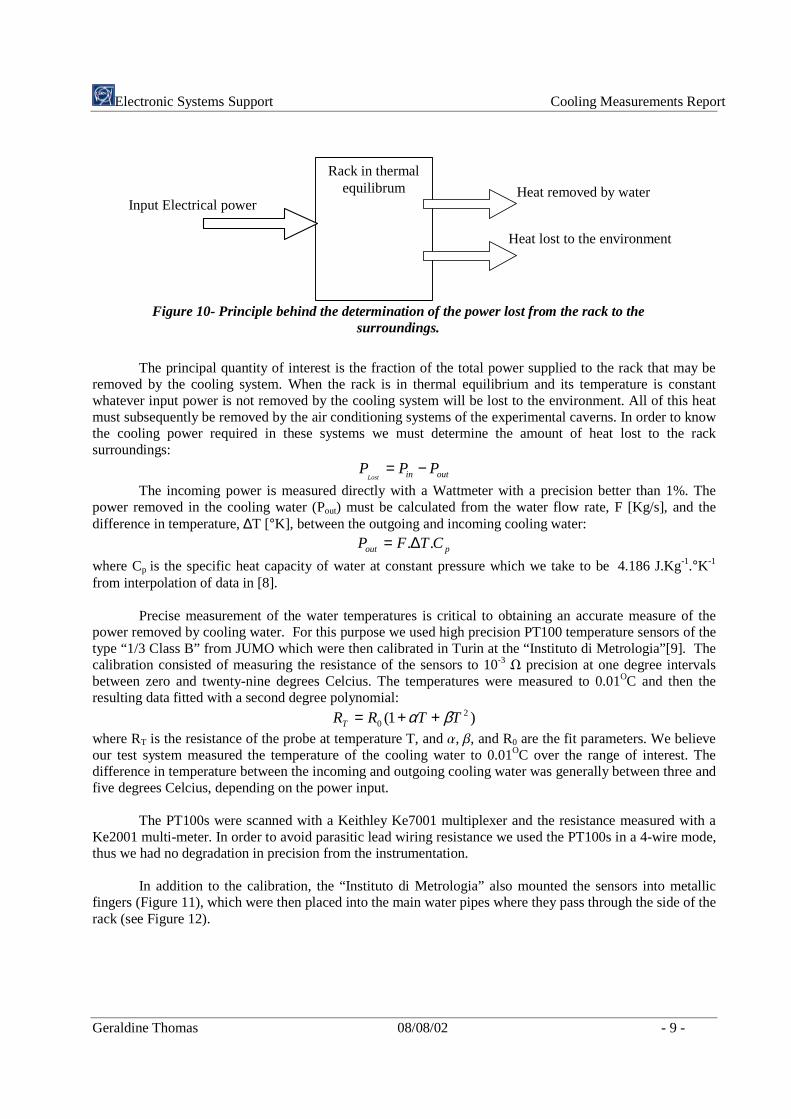
Figure 10- Principle behind the determination of the power lost from the rack to the
surroundings.
The principal quantity of interest is the fraction of the total power supplied to the rack that may be
removed by the cooling system. When the rack is in thermal equilibrium and its temperature is constant whatever input power is not removed by the cooling system will be lost to the environment. All of this heat must subsequently be removed by the air conditioning systems of the experimental caverns. In order to know the cooling power required in these systems we must determine the amount of heat lost to the rack surroundings:
outin PPPLost
−=
The incoming power is measured directly with a Wattmeter with a precision better than 1%. The power removed in the cooling water (Pout) must be calculated from the water flow rate, F [Kg/s], and the difference in temperature, ∆T [°K], between the outgoing and incoming cooling water:
pout CTFP ..∆=
where Cp is the specific heat capacity of water at constant pressure which we take to be 4.186 J.Kg-1.°K-1 from interpolation of data in [8].
Precise measurement of the water temperatures is critical to obtaining an accurate measure of the power removed by cooling water. For this purpose we used high precision PT100 temperature sensors of the type “1/3 Class B” from JUMO which were then calibrated in Turin at the “Instituto di Metrologia”[9]. The calibration consisted of measuring the resistance of the sensors to 10-3 � precision at one degree intervals between zero and twenty-nine degrees Celcius. The temperatures were measured to 0.01OC and then the resulting data fitted with a second degree polynomial:
)1( 20 TTRRT βα ++=
where RT is the resistance of the probe at temperature T, and �, �, and R0 are the fit parameters. We believe our test system measured the temperature of the cooling water to 0.01OC over the range of interest. The difference in temperature between the incoming and outgoing cooling water was generally between three and five degrees Celcius, depending on the power input.
The PT100s were scanned with a Keithley Ke7001 multiplexer and the resistance measured with a Ke2001 multi-meter. In order to avoid parasitic lead wiring resistance we used the PT100s in a 4-wire mode, thus we had no degradation in precision from the instrumentation.
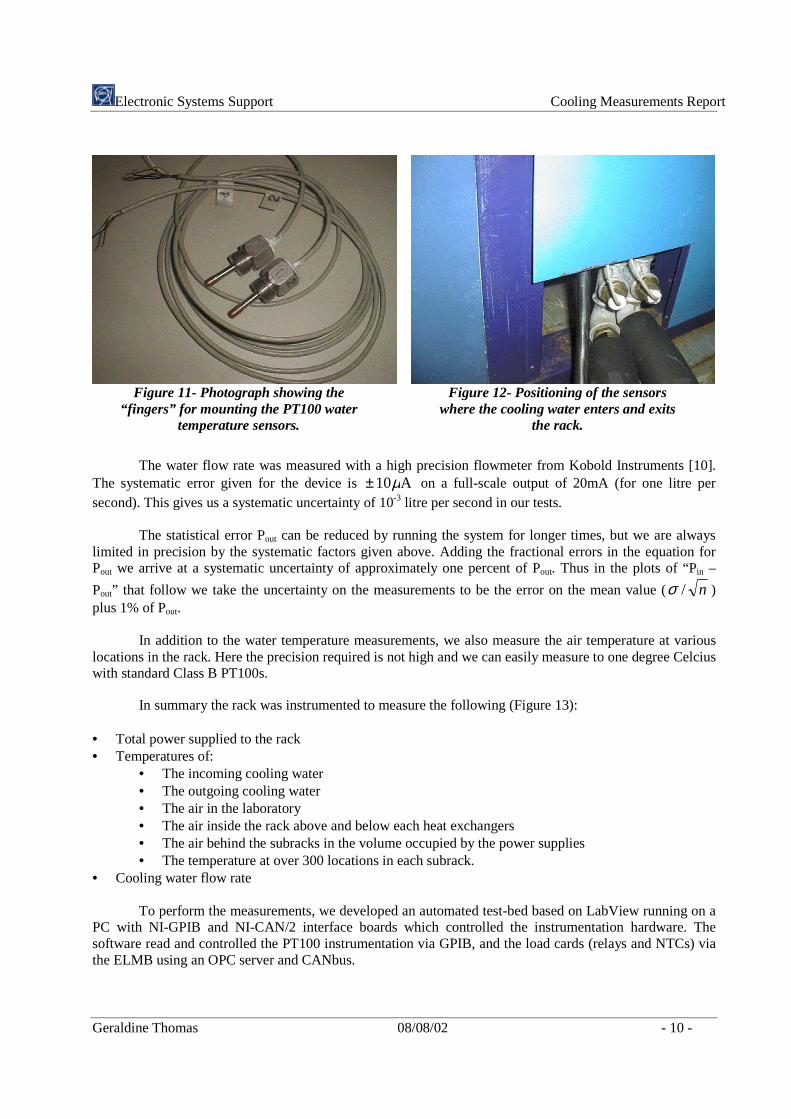
In addition to the calibration, the “Instituto di Metrologia” also mounted the sensors into metallic
fingers (Figure 11), which were then placed into the main water pipes where they pass through the side of the rack (see Figure 12).
Electronic Systems Support Cooling Measurements Report
Geraldine Thomas 08/08/02 - 10 -
Figure 11- Photograph showing the
“fingers” for mounting the PT100 water temperature sensors.
Figure 12- Positioning of the sensors
where the cooling water enters and exits the rack.
The water flow rate was measured with a high precision flowmeter from Kobold Instruments [10].
The systematic error given for the device is A10µ± on a full-scale output of 20mA (for one litre per second). This gives us a systematic uncertainty of 10-3 litre per second in our tests.
The statistical error Pout can be reduced by running the system for longer times, but we are always limited in precision by the systematic factors given above. Adding the fractional errors in the equation for Pout we arrive at a systematic uncertainty of approximately one percent of Pout. Thus in the plots of “Pin –
Pout” that follow we take the uncertainty on the measurements to be the error on the mean value ( n/σ ) plus 1% of Pout.
In addition to the water temperature measurements, we also measure the air temperature at various locations in the rack. Here the precision required is not high and we can easily measure to one degree Celcius with standard Class B PT100s.
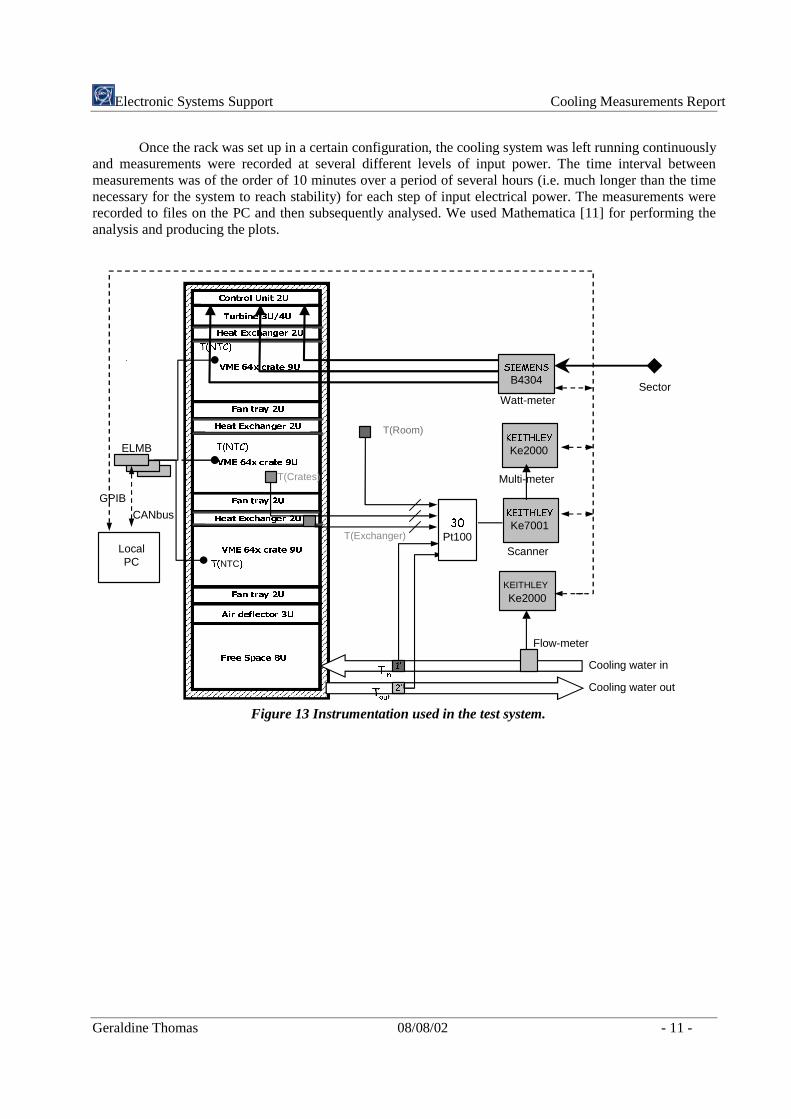
In summary the rack was instrumented to measure the following (Figure 13):
• Total power supplied to the rack • Temperatures of:
• The incoming cooling water • The outgoing cooling water • The air in the laboratory • The air inside the rack above and below each heat exchangers • The air behind the subracks in the volume occupied by the power supplies • The temperature at over 300 locations in each subrack.
• Cooling water flow rate
To perform the measurements, we developed an automated test-bed based on LabView running on a PC with NI-GPIB and NI-CAN/2 interface boards which controlled the instrumentation hardware. The software read and controlled the PT100 instrumentation via GPIB, and the load cards (relays and NTCs) via the ELMB using an OPC server and CANbus.
Electronic Systems Support Cooling Measurements Report
Geraldine Thomas 08/08/02 - 11 -
Once the rack was set up in a certain configuration, the cooling system was left running continuously and measurements were recorded at several different levels of input power. The time interval between measurements was of the order of 10 minutes over a period of several hours (i.e. much longer than the time necessary for the system to reach stability) for each step of input electrical power. The measurements were recorded to files on the PC and then subsequently analysed. We used Mathematica [11] for performing the analysis and producing the plots.
)UHH�6SDFH��8
&RQWURO�8QLW��8
7XUELQH��8��8
+HDW�([FKDQJHU��8
90(���[�FUDWH��8
90(���[�FUDWH��8
90(���[�FUDWH��8
+HDW�([FKDQJHU��8
)DQ�WUD\��8
)DQ�WUD\��8
)DQ�WUD\��8
+HDW�([FKDQJHU��8
$LU�GHIOHFWRU��8
�·
�·
KEITHLEY�
Ke2000
7LQ
7RXW
Flow-meter
Cooling water in
Cooling water out
Watt-meter
LocalPC
ELMB
CANbus
GPIB
Sector
T(Crates)
T(Room)
Multi-meter
Scanner
��
Pt100
.(,7+/(<
Ke2000
.(,7+/(<
Ke7001
7�17&�
T(Exchanger)
7�17&�
7�NTC�
6,(0(16
B4304
Figure 13 Instrumentation used in the test system.
Electronic Systems Support Cooling Measurements Report
Geraldine Thomas 08/08/02 - 12 -
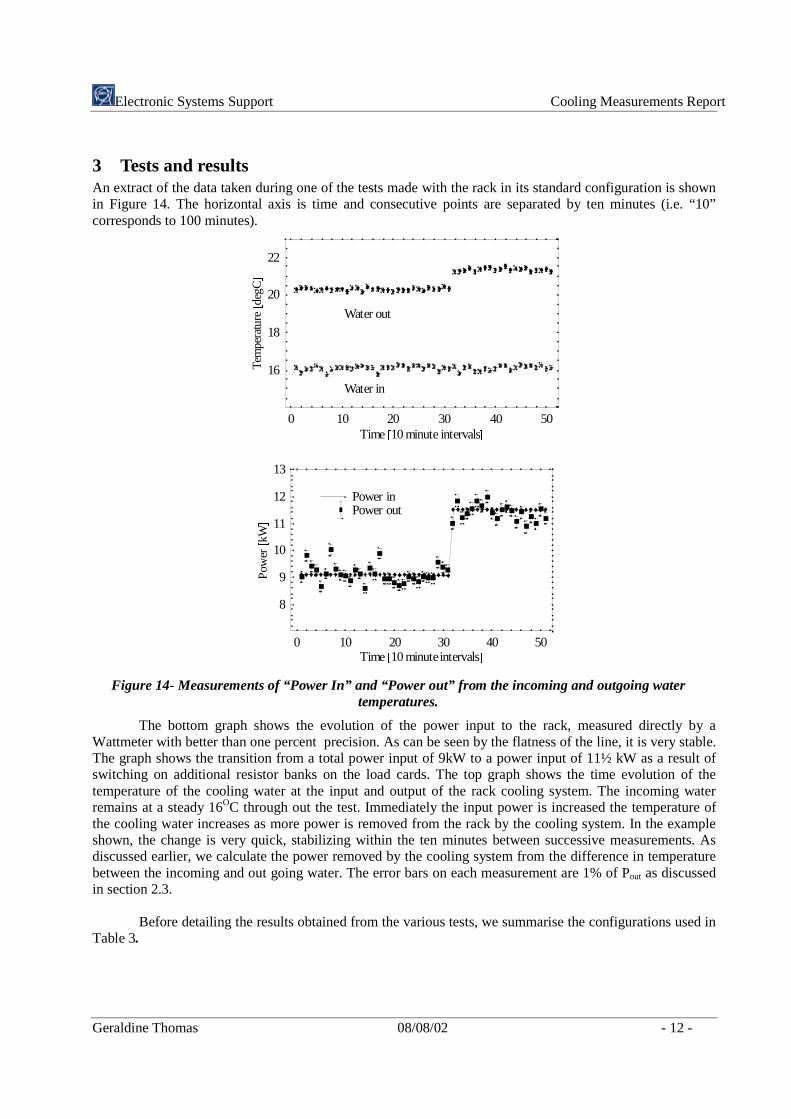
3 Tests and results An extract of the data taken during one of the tests made with the rack in its standard configuration is shown in Figure 14. The horizontal axis is time and consecutive points are separated by ten minutes (i.e. “10” corresponds to 100 minutes).
0 10 20 30 40 50Time #10 minuteintervals'
8
9
10
11
12
13
rewo
P
#
Wk
'
Power inPower out
0 10 20 30 40 50Time #10 minute intervals'
16
18
20
22erutarep
meT
#
Cged
'
Water in
Water out
Figure 14- Measurements of “Power In” and “Power out” from the incoming and outgoing water
temperatures.
The bottom graph shows the evolution of the power input to the rack, measured directly by a Wattmeter with better than one percent precision. As can be seen by the flatness of the line, it is very stable. The graph shows the transition from a total power input of 9kW to a power input of 11½ kW as a result of switching on additional resistor banks on the load cards. The top graph shows the time evolution of the temperature of the cooling water at the input and output of the rack cooling system. The incoming water remains at a steady 16OC through out the test. Immediately the input power is increased the temperature of the cooling water increases as more power is removed from the rack by the cooling system. In the example shown, the change is very quick, stabilizing within the ten minutes between successive measurements. As discussed earlier, we calculate the power removed by the cooling system from the difference in temperature between the incoming and out going water. The error bars on each measurement are 1% of Pout as discussed in section 2.3.
Before detailing the results obtained from the various tests, we summarise the configurations used in Table 3.
Electronic Systems Support Cooling Measurements Report
Geraldine Thomas 08/08/02 - 13 -
Table 3- Summary of the configurations covered in the report.
Figure No.(s)
No of subracks
Heat exchangers
Type
Fan-trays Type
Water flow rate (l/s)
Water In Temp (�C)
Max. power Dissipation
in rack (kW)
15,17 3 3x2U Long 0.52 16 11 19 3 3x2U Short 0.52 16 11
3.1 Comparison between 1U and 2U heat exchangers The heat exchangers used in LEP are 2U high and it is these that we took for our standard system. However, some of the LHC experiments have very tight space constraints and thus would like, if possible, to use a 1U high heat exchanger. In order to investigate this, we made measurements with the standard configuration of three subracks, fan-trays and turbine with the cooling water at the same temperature and entrance pressure, with both types of exchanger.
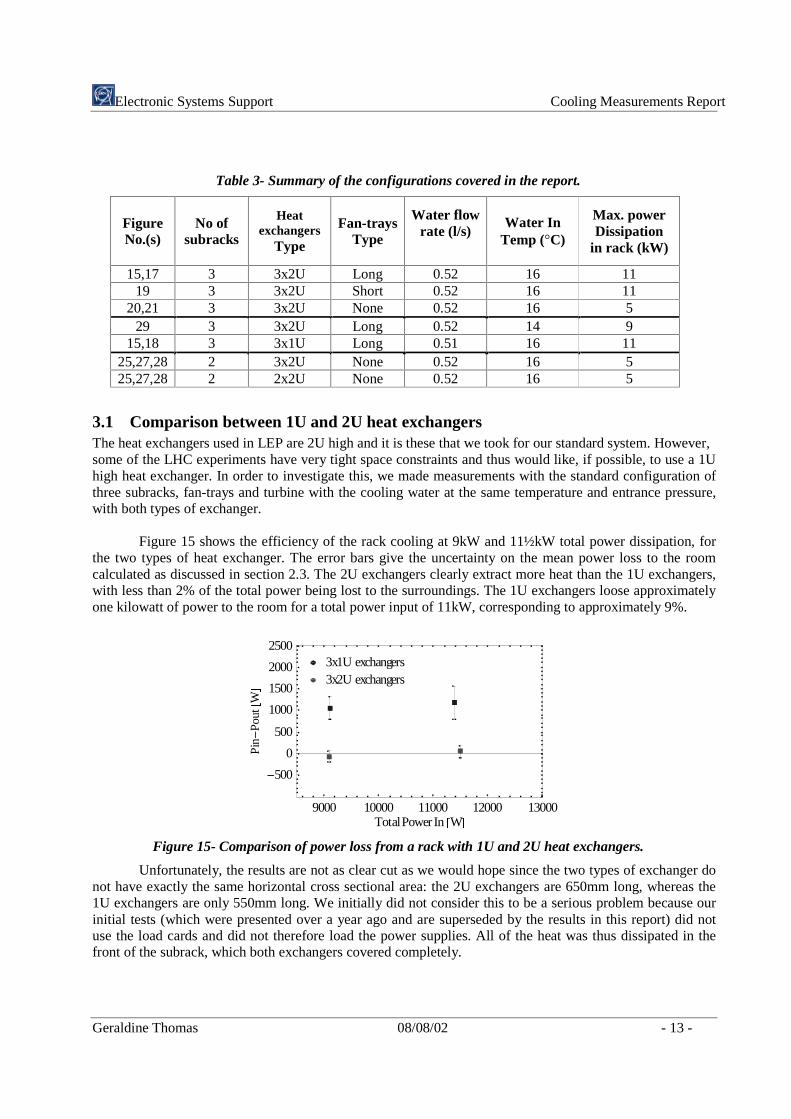
Figure 15 shows the efficiency of the rack cooling at 9kW and 11½kW total power dissipation, for the two types of heat exchanger. The error bars give the uncertainty on the mean power loss to the room calculated as discussed in section 2.3. The 2U exchangers clearly extract more heat than the 1U exchangers, with less than 2% of the total power being lost to the surroundings. The 1U exchangers loose approximately one kilowatt of power to the room for a total power input of 11kW, corresponding to approximately 9%.
9000 10000 11000 12000 13000TotalPower In #W'
�500
0
500
1000
1500
2000
2500
niP
�tuoP
#
W
'
3x1U exchangers3x2U exchangers
Figure 15- Comparison of power loss from a rack with 1U and 2U heat exchangers.
Unfortunately, the results are not as clear cut as we would hope since the two types of exchanger do not have exactly the same horizontal cross sectional area: the 2U exchangers are 650mm long, whereas the 1U exchangers are only 550mm long. We initially did not consider this to be a serious problem because our initial tests (which were presented over a year ago and are superseded by the results in this report) did not use the load cards and did not therefore load the power supplies. All of the heat was thus dissipated in the front of the subrack, which both exchangers covered completely.
Electronic Systems Support Cooling Measurements Report
Geraldine Thomas 08/08/02 - 14 -
The tests which we report here used the load cards (for a more realistic system) and the fact that the 2U exchangers covered more of the power supply than the 1U exchangers may become important. The inefficiency of the power supply is of the order of 25% and this power is dissipated in the power supply itself. The extra length of the 2U exchangers and their increased coverage of the power supply may be the reason for their better performance. The manufacturer [1] claims that theoretically the 1U should be at least as good as the 2U. We will return to this point in the report conclusions.
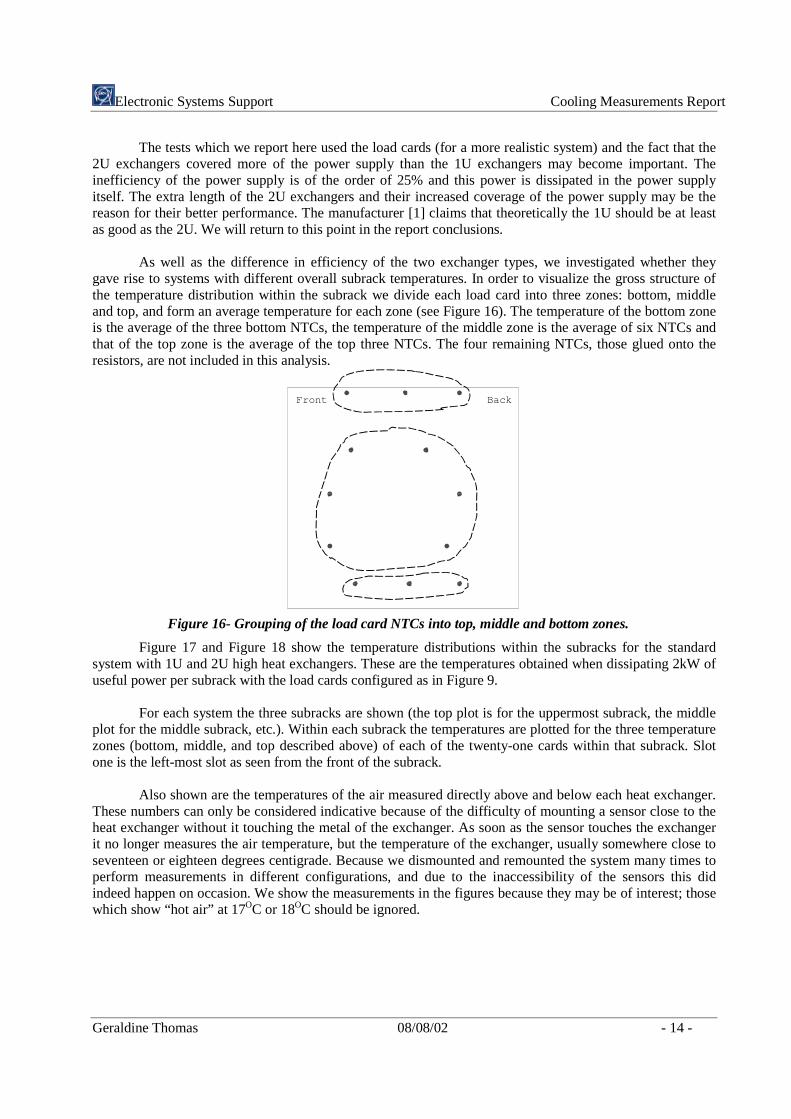
As well as the difference in efficiency of the two exchanger types, we investigated whether they gave rise to systems with different overall subrack temperatures. In order to visualize the gross structure of the temperature distribution within the subrack we divide each load card into three zones: bottom, middle and top, and form an average temperature for each zone (see Figure 16). The temperature of the bottom zone is the average of the three bottom NTCs, the temperature of the middle zone is the average of six NTCs and that of the top zone is the average of the top three NTCs. The four remaining NTCs, those glued onto the resistors, are not included in this analysis.
Front Back
Figure 16- Grouping of the load card NTCs into top, middle and bottom zones.
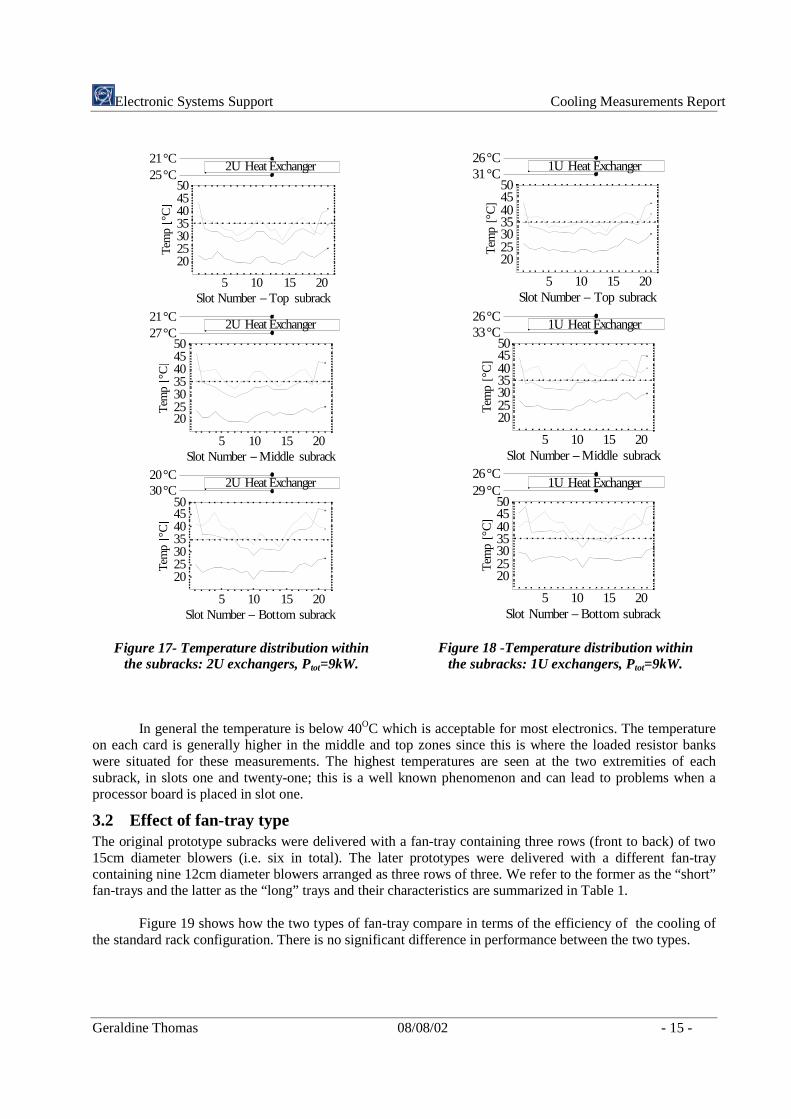
Figure 17 and Figure 18 show the temperature distributions within the subracks for the standard system with 1U and 2U high heat exchangers. These are the temperatures obtained when dissipating 2kW of useful power per subrack with the load cards configured as in Figure 9.
For each system the three subracks are shown (the top plot is for the uppermost subrack, the middle plot for the middle subrack, etc.). Within each subrack the temperatures are plotted for the three temperature zones (bottom, middle, and top described above) of each of the twenty-one cards within that subrack. Slot one is the left-most slot as seen from the front of the subrack.
Also shown are the temperatures of the air measured directly above and below each heat exchanger. These numbers can only be considered indicative because of the difficulty of mounting a sensor close to the heat exchanger without it touching the metal of the exchanger. As soon as the sensor touches the exchanger it no longer measures the air temperature, but the temperature of the exchanger, usually somewhere close to seventeen or eighteen degrees centigrade. Because we dismounted and remounted the system many times to perform measurements in different configurations, and due to the inaccessibility of the sensors this did indeed happen on occasion. We show the measurements in the figures because they may be of interest; those which show “hot air” at 17OC or 18OC should be ignored.
Electronic Systems Support Cooling Measurements Report
Geraldine Thomas 08/08/02 - 15 -
5 10 15 20Slot Number� Bottom subrack
20253035404550
pmeT
#
°C
'
2U Heat Exchanger20°C30°C
5 10 15 20Slot Number �Middle subrack
20253035404550
pme
T
#
°C
'
2U Heat Exchanger21°C27°C
5 10 15 20Slot Number �Top subrack
20253035404550
pmeT
#
°C
'
2U Heat Exchanger21°C25°C
Figure 17- Temperature distribution within
the subracks: 2U exchangers, Ptot=9kW.
5 10 15 20Slot Number �Bottom subrack
20253035404550
pmeT
�°C�
1U Heat Exchanger26°C29°C
5 10 15 20Slot Number �Middle subrack
20253035404550
pmeT
�°C�
1U Heat Exchanger26°C33°C
5 10 15 20Slot Number � Top subrack
20253035404550
pmeT
�°C�
1U Heat Exchanger26°C31°C
Figure 18 -Temperature distribution within
the subracks: 1U exchangers, Ptot=9kW.
In general the temperature is below 40OC which is acceptable for most electronics. The temperature
on each card is generally higher in the middle and top zones since this is where the loaded resistor banks were situated for these measurements. The highest temperatures are seen at the two extremities of each subrack, in slots one and twenty-one; this is a well known phenomenon and can lead to problems when a processor board is placed in slot one.
3.2 Effect of fan-tray type The original prototype subracks were delivered with a fan-tray containing three rows (front to back) of two 15cm diameter blowers (i.e. six in total). The later prototypes were delivered with a different fan-tray containing nine 12cm diameter blowers arranged as three rows of three. We refer to the former as the “short” fan-trays and the latter as the “long” trays and their characteristics are summarized in Table 1.
Figure 19 shows how the two types of fan-tray compare in terms of the efficiency of the cooling of the standard rack configuration. There is no significant difference in performance between the two types.
Electronic Systems Support Cooling Measurements Report
Geraldine Thomas 08/08/02 - 16 -
9000 10000 11000 12000 13000TotalPower In #W'
�400
�200
0
200
400
niP�
tuoP#
W
'
Short fantraysLong fantrays
Figure 19- Comparison of the “short” and “long” fan-trays.
3.3 Cooling the rack without fan-trays
3.3.1 Three subrack system The fan-trays are required to overcome the impedance introduced by the heat exchangers and to help the tangential turbines push the air around the cooling circuit. Unfortunately these fans will not work in the UX zones of the experiments because of the substantial (few hundreds of Gauss) stray magnetic fields. The measurements we describe here establish under what conditions it is possible to cool a rack that has no fan-trays. We use the standard configuration of three 9U subracks, and three 2U heat exchangers, but with no fan-trays. Front panels are used to keep the air circulating vertically.
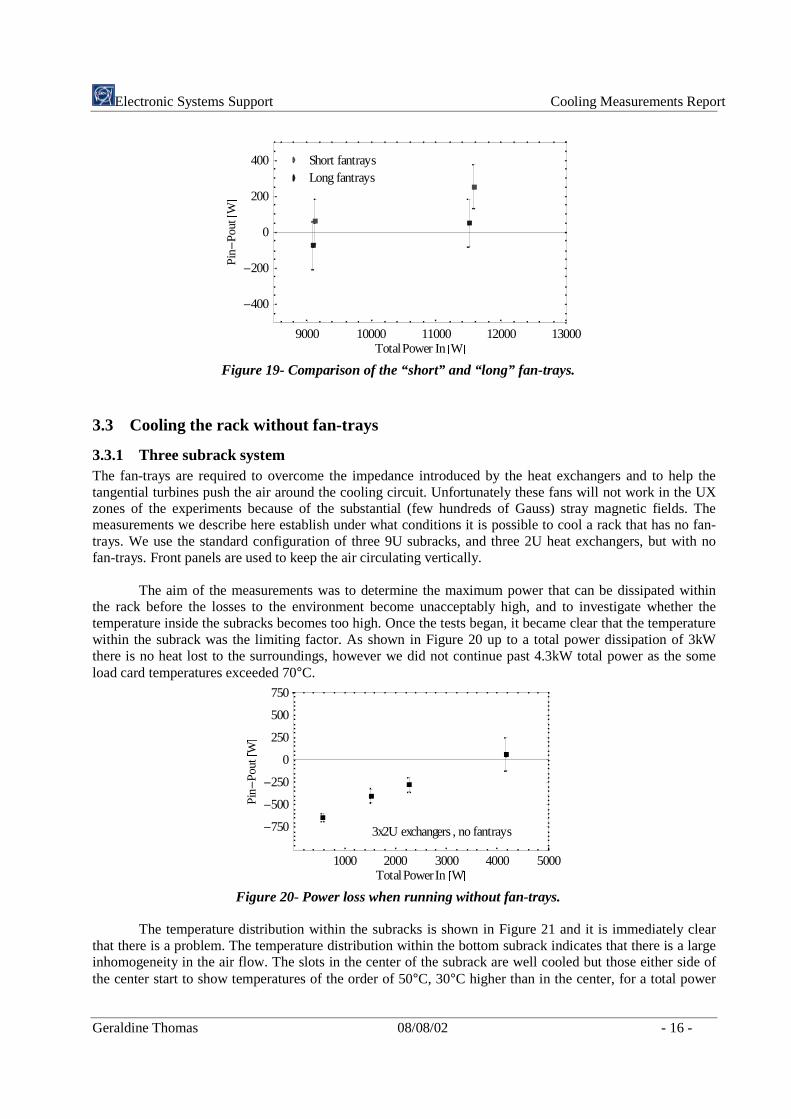
The aim of the measurements was to determine the maximum power that can be dissipated within the rack before the losses to the environment become unacceptably high, and to investigate whether the temperature inside the subracks becomes too high. Once the tests began, it became clear that the temperature within the subrack was the limiting factor. As shown in Figure 20 up to a total power dissipation of 3kW there is no heat lost to the surroundings, however we did not continue past 4.3kW total power as the some load card temperatures exceeded 70°C.
1000 2000 3000 4000 5000TotalPowerIn #W'
�750
�500
�250
0
250
500
750
niP�
tuoP
#
W
'
3x2U exchangers , no fantrays
Figure 20- Power loss when running without fan-trays.
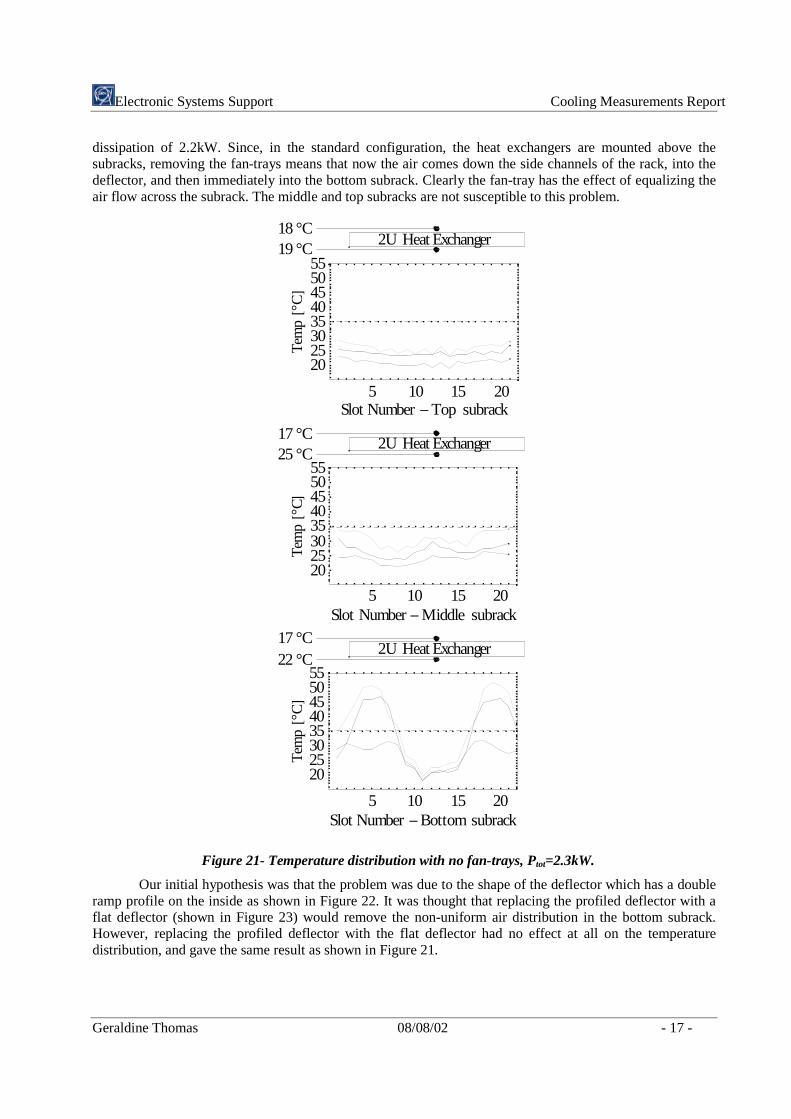
The temperature distribution within the subracks is shown in Figure 21 and it is immediately clear
that there is a problem. The temperature distribution within the bottom subrack indicates that there is a large inhomogeneity in the air flow. The slots in the center of the subrack are well cooled but those either side of the center start to show temperatures of the order of 50°C, 30°C higher than in the center, for a total power
Electronic Systems Support Cooling Measurements Report
Geraldine Thomas 08/08/02 - 17 -
dissipation of 2.2kW. Since, in the standard configuration, the heat exchangers are mounted above the subracks, removing the fan-trays means that now the air comes down the side channels of the rack, into the deflector, and then immediately into the bottom subrack. Clearly the fan-tray has the effect of equalizing the air flow across the subrack. The middle and top subracks are not susceptible to this problem.
5 10 15 20Slot Number �Bottom subrack
2025303540455055
pmeT
�°C�
2U Heat Exchanger17 °C22 °C
5 10 15 20Slot Number�Middle subrack
2025303540455055
pmeT
�°C�
2U Heat Exchanger17 °C25 °C
5 10 15 20Slot Number �Top subrack
2025303540455055
pmeT
�°C�
2U Heat Exchanger18 °C19 °C
Figure 21- Temperature distribution with no fan-trays, Ptot=2.3kW.
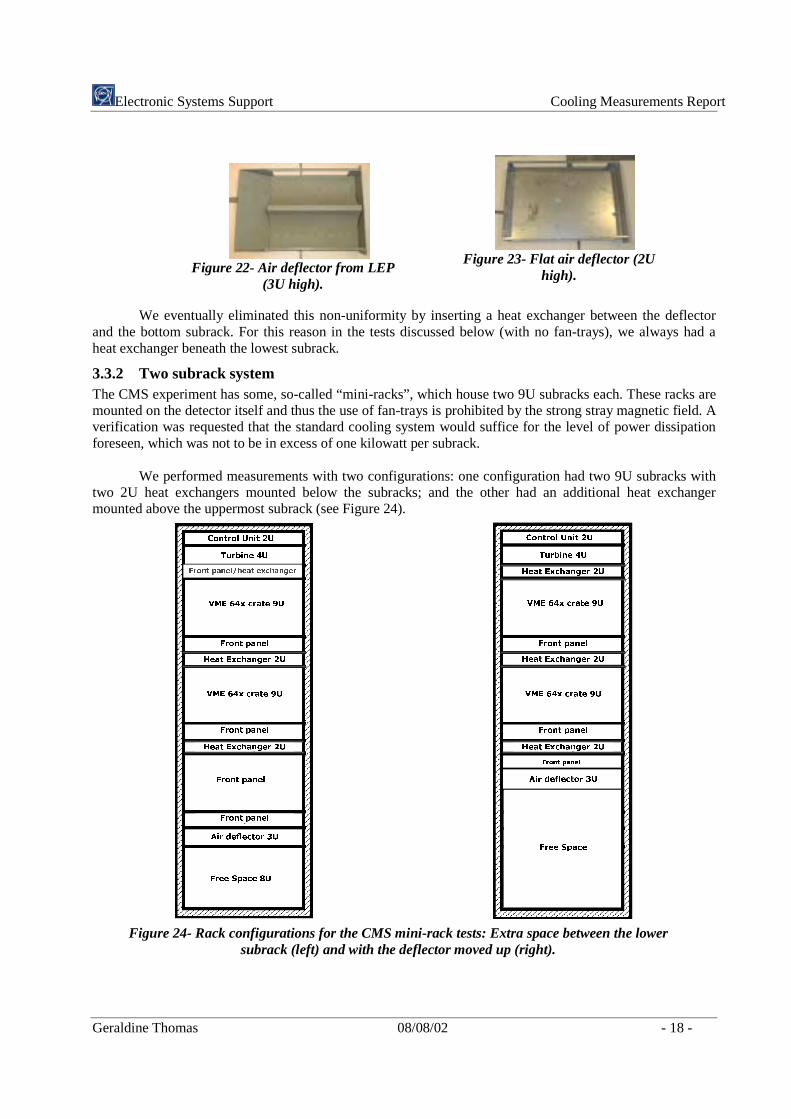
Our initial hypothesis was that the problem was due to the shape of the deflector which has a double ramp profile on the inside as shown in Figure 22. It was thought that replacing the profiled deflector with a flat deflector (shown in Figure 23) would remove the non-uniform air distribution in the bottom subrack. However, replacing the profiled deflector with the flat deflector had no effect at all on the temperature distribution, and gave the same result as shown in Figure 21.
Electronic Systems Support Cooling Measurements Report
Geraldine Thomas 08/08/02 - 18 -
Figure 22- Air deflector from LEP
(3U high).
Figure 23- Flat air deflector (2U
high).
We eventually eliminated this non-uniformity by inserting a heat exchanger between the deflector
and the bottom subrack. For this reason in the tests discussed below (with no fan-trays), we always had a heat exchanger beneath the lowest subrack.
3.3.2 Two subrack system The CMS experiment has some, so-called “mini-racks”, which house two 9U subracks each. These racks are mounted on the detector itself and thus the use of fan-trays is prohibited by the strong stray magnetic field. A verification was requested that the standard cooling system would suffice for the level of power dissipation foreseen, which was not to be in excess of one kilowatt per subrack.
We performed measurements with two configurations: one configuration had two 9U subracks with two 2U heat exchangers mounted below the subracks; and the other had an additional heat exchanger mounted above the uppermost subrack (see Figure 24).
)UHH�6SDFH��8
&RQWURO�8QLW��8
7XUELQH��8
)URQW�SDQHO�KHDW�H[FKDQJHU
90(���[�FUDWH��8
90(���[�FUDWH��8
+HDW�([FKDQJHU��8
)URQW�SDQHO
)URQW�SDQHO
)URQW�SDQHO
+HDW�([FKDQJHU��8
$LU�GHIOHFWRU��8
)URQW�SDQHO
)UHH�6SDFH��8
&RQWURO�8QLW��8
7XUELQH��8
90(���[�FUDWH��8
90(���[�FUDWH��8
+HDW�([FKDQJHU��8
)URQW�SDQHO
)URQW�SDQHO
)URQW�SDQHO
+HDW�([FKDQJHU��8
$LU�GHIOHFWRU��8
)UHH�6SDFH
+HDW�([FKDQJHU��8
Figure 24- Rack configurations for the CMS mini-rack tests: Extra space between the lower
subrack (left) and with the deflector moved up (right).
Electronic Systems Support Cooling Measurements Report
Geraldine Thomas 08/08/02 - 19 -
The construction of an exact mini-rack system necessitated the complete dismounting of the rack and the cutting of the internal side panels to the correct length. The internal side panels constrain the air to move vertically down the sides of the rack and extend from the turbine to the deflector.
In order to save some time, we initially removed the lowest subrack leaving a large empty volume which we blocked front and back with panels to keep the air flow correct. Later, to check that this large air volume did not have any unexpected effect, we did cut the side panels and move the deflector upwards to just below the heat exchanger but observed no change in the results.
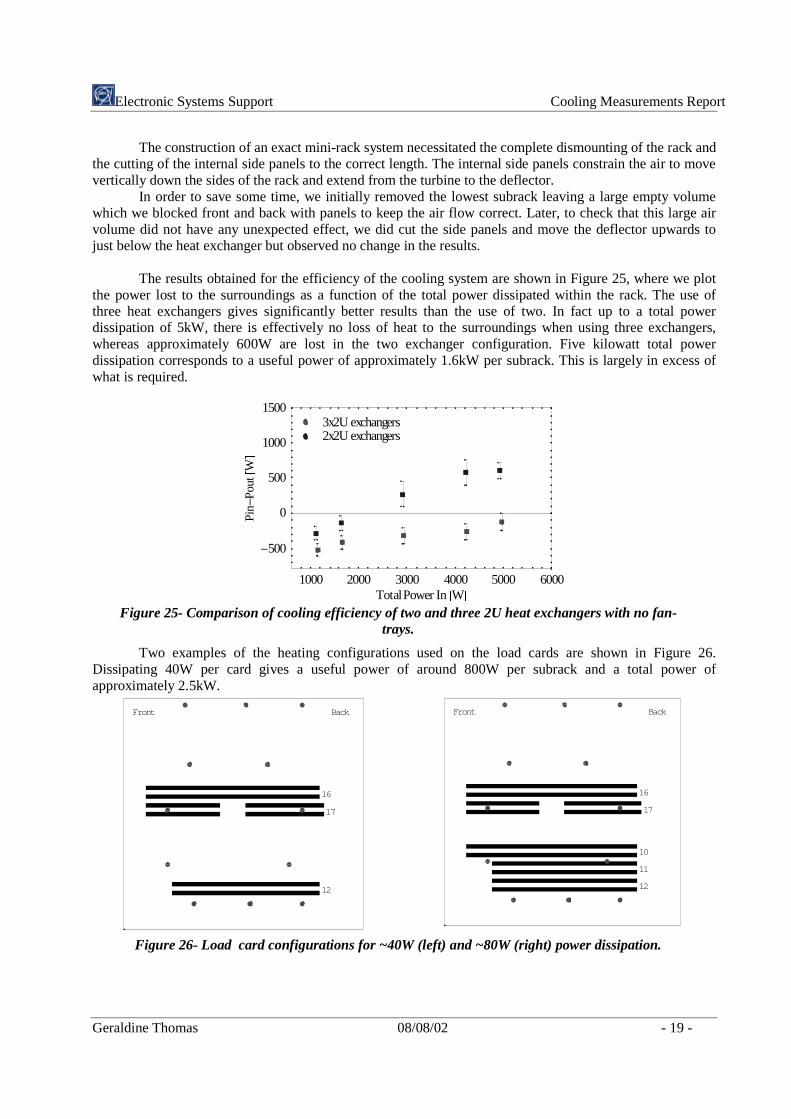
The results obtained for the efficiency of the cooling system are shown in Figure 25, where we plot the power lost to the surroundings as a function of the total power dissipated within the rack. The use of three heat exchangers gives significantly better results than the use of two. In fact up to a total power dissipation of 5kW, there is effectively no loss of heat to the surroundings when using three exchangers, whereas approximately 600W are lost in the two exchanger configuration. Five kilowatt total power dissipation corresponds to a useful power of approximately 1.6kW per subrack. This is largely in excess of what is required.
1000 2000 3000 4000 5000 6000TotalPower In #W'
�500
0
500
1000
1500
niP�
tuoP
#
W
'
3x2U exchangers2x2U exchangers
Figure 25- Comparison of cooling efficiency of two and three 2U heat exchangers with no fan-
trays.
Two examples of the heating configurations used on the load cards are shown in Figure 26. Dissipating 40W per card gives a useful power of around 800W per subrack and a total power of approximately 2.5kW.
16
17
12
Front Back
16
17
10
11
12
Front Back
Figure 26- Load card configurations for ~40W (left) and ~80W (right) power dissipation.
Electronic Systems Support Cooling Measurements Report
Geraldine Thomas 08/08/02 - 20 -
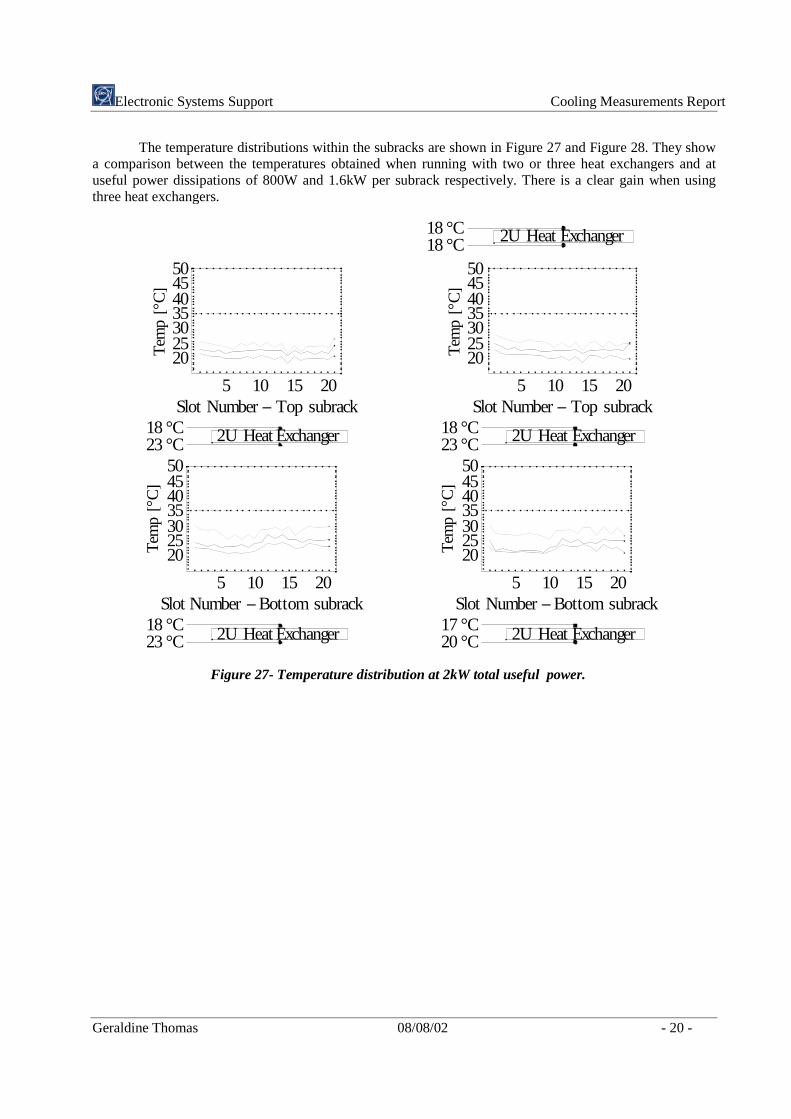
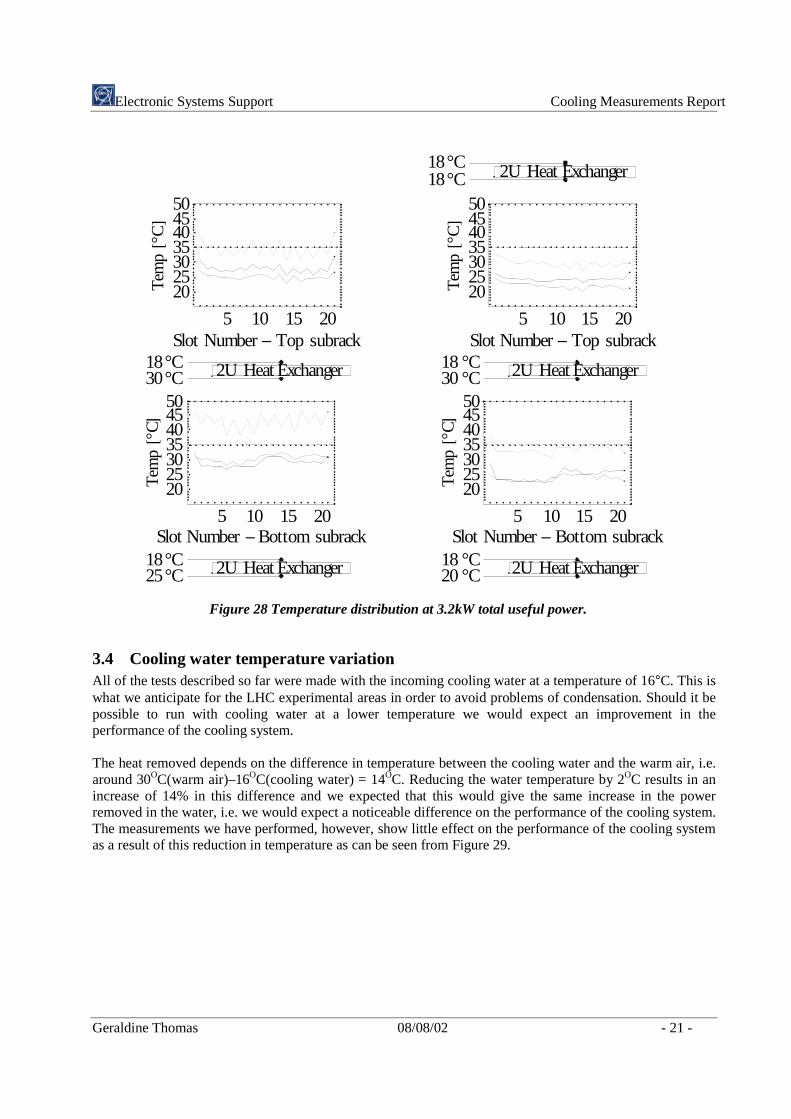
The temperature distributions within the subracks are shown in Figure 27 and Figure 28. They show a comparison between the temperatures obtained when running with two or three heat exchangers and at useful power dissipations of 800W and 1.6kW per subrack respectively. There is a clear gain when using three heat exchangers.
5 10 15 20Slot Number �Bottom subrack
20253035404550
pme
T�°
C�
2U Heat Exchanger18 °C23 °C
5 10 15 20Slot Number� Top subrack
20253035404550
pme
T�°
C�
2U Heat Exchanger18 °C23 °C
2U Heat Exchanger18 °C18 °C
5 10 15 20Slot Number �Bottom subrack
20253035404550
pme
T�°
C�
2U Heat Exchanger17 °C20 °C
5 10 15 20Slot Number� Top subrack
20253035404550
pme
T�°
C�
2U Heat Exchanger18 °C23 °C
Figure 27- Temperature distribution at 2kW total useful power.
Electronic Systems Support Cooling Measurements Report
Geraldine Thomas 08/08/02 - 21 -
5 10 15 20Slot Number �Bottom subrack
20253035404550
pmeT
�°C�
2U Heat Exchanger18°C25°C
5 10 15 20Slot Number� Top subrack
20253035404550
pmeT
�°C�
2U Heat Exchanger18°C30°C
2U Heat Exchanger18°C18°C
5 10 15 20Slot Number � Bottom subrack
20253035404550
pmeT
�°C�
2U Heat Exchanger18 °C20 °C
5 10 15 20Slot Number � Top subrack
20253035404550
pmeT
�°C�
2U Heat Exchanger18 °C30 °C
Figure 28 Temperature distribution at 3.2kW total useful power.
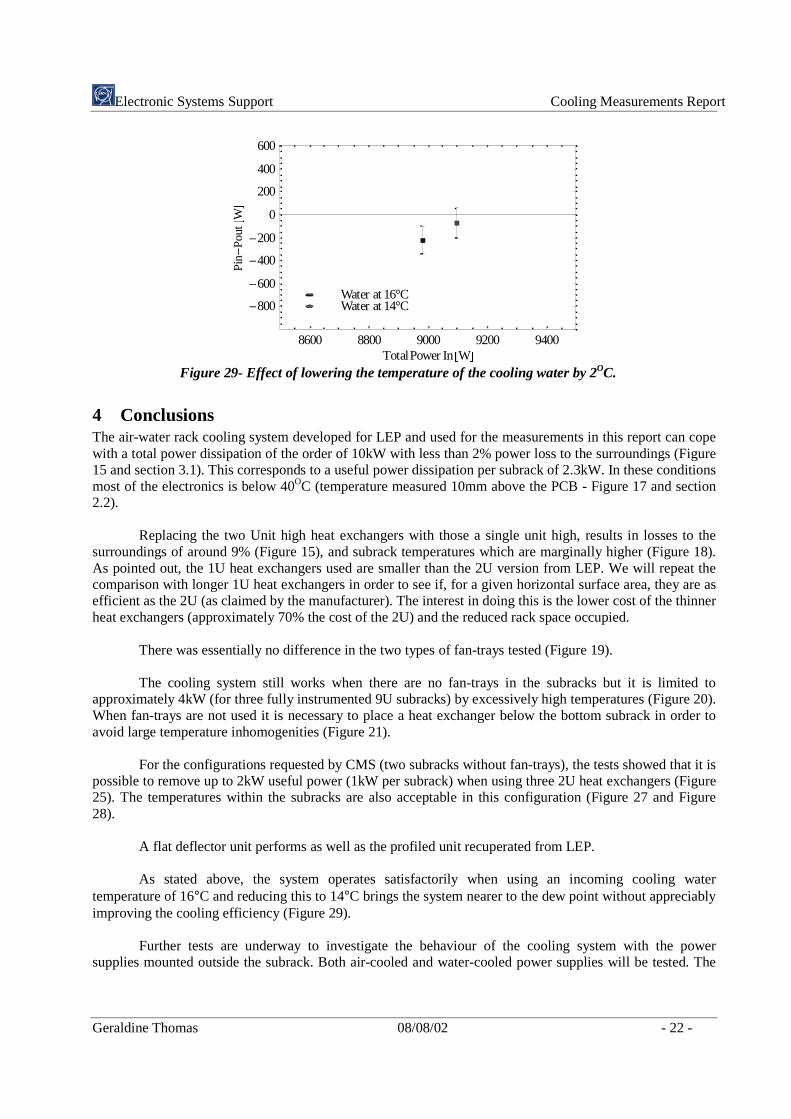
3.4 Cooling water temperature variation All of the tests described so far were made with the incoming cooling water at a temperature of 16°C. This is what we anticipate for the LHC experimental areas in order to avoid problems of condensation. Should it be possible to run with cooling water at a lower temperature we would expect an improvement in the performance of the cooling system. The heat removed depends on the difference in temperature between the cooling water and the warm air, i.e. around 30OC(warm air)–16OC(cooling water) = 14OC. Reducing the water temperature by 2OC results in an increase of 14% in this difference and we expected that this would give the same increase in the power removed in the water, i.e. we would expect a noticeable difference on the performance of the cooling system. The measurements we have performed, however, show little effect on the performance of the cooling system as a result of this reduction in temperature as can be seen from Figure 29.
Electronic Systems Support Cooling Measurements Report
Geraldine Thomas 08/08/02 - 22 -
8600 8800 9000 9200 9400TotalPower In #W'
�800
�600
�400
�200
0
200
400
600
niP�
tuoP
#
W
'
Water at 16°CWater at 14°C
Figure 29- Effect of lowering the temperature of the cooling water by 2OC.
4 Conclusions The air-water rack cooling system developed for LEP and used for the measurements in this report can cope with a total power dissipation of the order of 10kW with less than 2% power loss to the surroundings (Figure 15 and section 3.1). This corresponds to a useful power dissipation per subrack of 2.3kW. In these conditions most of the electronics is below 40OC (temperature measured 10mm above the PCB - Figure 17 and section 2.2).
Replacing the two Unit high heat exchangers with those a single unit high, results in losses to the surroundings of around 9% (Figure 15), and subrack temperatures which are marginally higher (Figure 18). As pointed out, the 1U heat exchangers used are smaller than the 2U version from LEP. We will repeat the comparison with longer 1U heat exchangers in order to see if, for a given horizontal surface area, they are as efficient as the 2U (as claimed by the manufacturer). The interest in doing this is the lower cost of the thinner heat exchangers (approximately 70% the cost of the 2U) and the reduced rack space occupied.
There was essentially no difference in the two types of fan-trays tested (Figure 19).
The cooling system still works when there are no fan-trays in the subracks but it is limited to approximately 4kW (for three fully instrumented 9U subracks) by excessively high temperatures (Figure 20). When fan-trays are not used it is necessary to place a heat exchanger below the bottom subrack in order to avoid large temperature inhomogenities (Figure 21).
For the configurations requested by CMS (two subracks without fan-trays), the tests showed that it is possible to remove up to 2kW useful power (1kW per subrack) when using three 2U heat exchangers (Figure 25). The temperatures within the subracks are also acceptable in this configuration (Figure 27 and Figure 28).
A flat deflector unit performs as well as the profiled unit recuperated from LEP.
As stated above, the system operates satisfactorily when using an incoming cooling water
temperature of 16°C and reducing this to 14°C brings the system nearer to the dew point without appreciably improving the cooling efficiency (Figure 29).
Further tests are underway to investigate the behaviour of the cooling system with the power supplies mounted outside the subrack. Both air-cooled and water-cooled power supplies will be tested. The
Electronic Systems Support Cooling Measurements Report
Geraldine Thomas 08/08/02 - 23 -
water-cooled supplies are a continuation of from earlier work done in collaboration between EP/ESS and Wiener[12].
5 Acknowledgements We would like to acknowledge the help of the following people: Gilbert Dumont, Adolfo Fucci, Paul Maley, Luciano Periale, and Bruno Righini.
6 References
[1] CIAT: http://www.ciat.com. [2] Rack Control System project: http://ess.web.cern.ch/ESS/projects.htm#projects. [3] A.Widmer AG, Turbines, Types: EOK-8-50-2 B. [4] Wiener VME 6021 CERN, User Manual. And see http://www.wiener-d.com. [5] We use formulae from: http://www.agsci.kvl.dk/~bek/relhum.htm. [6] ELMB Documentation, J.Cook & Geraldine Thomas, November 2001:
http://atlas.web.cern.ch/Atlas/GROUPS/DAQTRIG/DCS/ELMB/ElmbUserGuide.pdf. [7] See for example: http://www.betatherm.com/stein.html. [8] CRC Handbook of Chemistry and Physics, CRC PRESS (USA)-2001. [9] The calibration was performed at the “Instituto di Metrologia” G.Colonnetti-Turin (Italy). [10] KOBOLD Instruments AG, Flowmeter,Type: PMG-AT152DA1121. [11] Wolfram Research, Mathematica-4: http://www.wolfram.com. [12] Water-cooled electronics, G.Dumont, Ph. Fontaine Vive Roux, B.Righini, Nuclear Instruments and
Methods in Physics Research. A 440 (2000) 213-223.