Okanagan College Association of Research Libraries / Texas A&M University www.libqual.org Language: Institution Type: Consortium: User Group: American English Community College LibQUAL Canada All Language: Institution Type: Consortium: User Group: American English Community College LibQUAL Canada All
Transcript
Okanagan College
Association of Research Libraries / Texas A&M University
www.libqual.org
Language:
Institution Type:
Consortium:
User Group:
American English
Community College
LibQUAL Canada
All
Language:
Institution Type:
Consortium:
User Group:
American English
Community College
LibQUAL Canada
All
Okanagan College
Association of Research Libraries / Texas A&M University
www.libqual.org
Contributors
Colleen Cook Martha KyrillidouTexas A&M University Association of Research Libraries
Fred Heath MaShana DavisUniversity of Texas Association of Research Libraries
BruceThompson Duane WebsterTexas A&M University Association of Research Libraries
Cook, C. (Guest Ed.). (2002b). Library decision-makers speak to their uses of their LibQUAL+® data: Some
LibQUAL+® case studies. Performance Measurement and Metrics, 3.
Cook, C., & Heath, F. (2001). Users' perceptions of library service quality: A "LibQUAL+®" qualitative study.
Library Trends, 49: 548-584.
Cook, C., Heath, F. & Thompson, B. (2002). Score norms for improving library service quality: A LibQUAL+®
study. portal: Libraries and the Academy, 2: 13-26.
Cook, C., Heath, F. & Thompson, B. (2003). "Zones of tolerance" in perceptions of library service quality: A
LibQUAL+® study. portal: Libraries and the Academy, 3: 113-123.
Cook, C., Heath, F., & Thompson, R.L. (2000). A meta-analysis of response rates in Web- or Internet-based surveys.
Educational and Psychological Measurement, 60: 821-836.
Cook, C., & Thompson, B. (2001). Psychometric properties of scores from the Web-based LibQUAL+® study of
perceptions of library service quality. Library Trends, 49: 585-604.
Language:
Institution Type:
Consortium:
User Group:
American English
Community College
LibQUAL Canada
All
Language:
Institution Type:
Consortium:
User Group:
American English
Community College
LibQUAL Canada
All
Page 18 of 82 LibQUAL+® 2007 Survey Results - OC
Cullen, R. (2001). Perspectives on user satisfaction surveys. Library Trends, 49: 662-686.
Heath, F., Kyrillidou, M. & Askew, C.A. (Guest Eds.). (2004). Libraries report on their LibQUAL+® findings: From
Data to Action. Journal of Library Administration (40) 3/4 (2004).
Heath, F., Cook, C., Kyrillidou, M., & Thompson, B. (2002). ARL Index and other validity correlates of
LibQUAL+® scores. portal: Libraries and the Academy, 2: 27-42.
Kyrillidou, M. (2005). The globalization of library assessment and the role of LibQUAL+®. From library science to
information science: studies in honor of G. Kakouri (Athens, Greece: Tipothito-Giorgos Dardanos, 2005).
[in Greek]
Kyrillidou, M. (2005/2006). Library assessment as a collaborative enterprise. Resource Sharing and Information
Networks, 18 ½: 73-87.
Kyrillidou, M. (2006). Measuring library service quality: A perceived outcome for libraries. In Peter Hernon (Ed.),
Robert E. Dugan (Ed.), and Candy Schwartz (Ed.), Revisiting Outcomes Assessment in Higher Education
(pp. 351-366). Westport, CT: Library Unlimited.
Kyrillidou, M., Olshen, T., Heath, F., Bonnelly, C., and Cote, J. P. Cross-cultural implementation of LibQUAL+®:
the French language experience. 5th Northumbria International Conference Proceedings, Durham, UK, July,
2003.
Kyrillidou, M. and Young, M. (2005). ARL Statistics 2003-04. Washington, DC: Association of Research Libraries.
Nitecki, D.A. (1996). Changing the concept and measure of service quality in academic libraries. The Journal of
Academic Librarianship, 22: 181-190.
Parasuraman, A., Berry, L.L., and Zeithaml, V.A. (1991). Refinement and reassessment of the SERVQUAL scale.
Journal of Retailing, 67: 420-450.
Thompson, B. (2000, October). Representativeness versus response rate: It ain't the response rate!. Paper presented at
the Association of Research Libraries (ARL) Measuring Service Quality Symposium on the New Culture of
Assessment: Measuring Service Quality, Washington, DC.
Thompson, B., Cook, C., & Heath, F. (2000). The LibQUAL+® gap measurement model: The bad, the ugly, and the
good of gap measurement. Performance Measurement and Metrics, 1: 165-178.
Thompson, B., Cook, C., & Heath, F. (2003). Structure of perceptions of service quality in libraries: A LibQUAL+®
study. Structural Equation Modeling, 10: 456-464.
Thompson, B., Cook, C., & Thompson, R.L. (2002). Reliability and structure of LibQUAL+® scores: Measuring
perceived library service quality. portal: Libraries and the Academy, 2: 3-12.
Thompson, B., Cook, C., & Kyrillidou, M. (2005). Concurrent validity of LibQUAL+® scores: What do
LibQUAL+® scores measure? Journal of Academic Librarianship, 31: 517-522.
Thompson, B., Cook, C., & Kyrillidou, M. (2006). Using localized survey items to augment standardized
Language:
Institution Type:
Consortium:
User Group:
American English
Community College
LibQUAL Canada
All
Language:
Institution Type:
Consortium:
User Group:
American English
Community College
LibQUAL Canada
All
LibQUAL+® 2007 Survey Results - OC Page 19 of 82
benchmarking measures: A LibQUAL+® study. portal: Libraries and the Academy, 6(2): 219-230.
Thompson, B., Cook, C., & Kyrillidou, M. (2006). Stability of library service quality benchmarking norms across
time and cohorts: A LibQUAL+® study. Paper presented at the Asia-Pacific Conference of Library and
Information Education and Practice (A-LIEP), Singapore.
Thompson, B., Cook, C., Kyrillidou, M. (2006). How can you evaluate the integrity of your library assessment data:
Intercontinental LibQUAL+® analysis used as concrete heuristic examples. Paper presented at the Library
Assessment Conference: Building Effective, Sustainable, and Practical Assessment, Charlottesville, VA.
Zeithaml, V.A., Parasuraman, A., Berry, L.L. (1990). Delivering quality service: Balancing customer perceptions and
expectations. New York: Free Press.
Language:
Institution Type:
Consortium:
User Group:
American English
Community College
LibQUAL Canada
All
Language:
Institution Type:
Consortium:
User Group:
American English
Community College
LibQUAL Canada
All
Page 20 of 82 LibQUAL+® 2007 Survey Results - OC
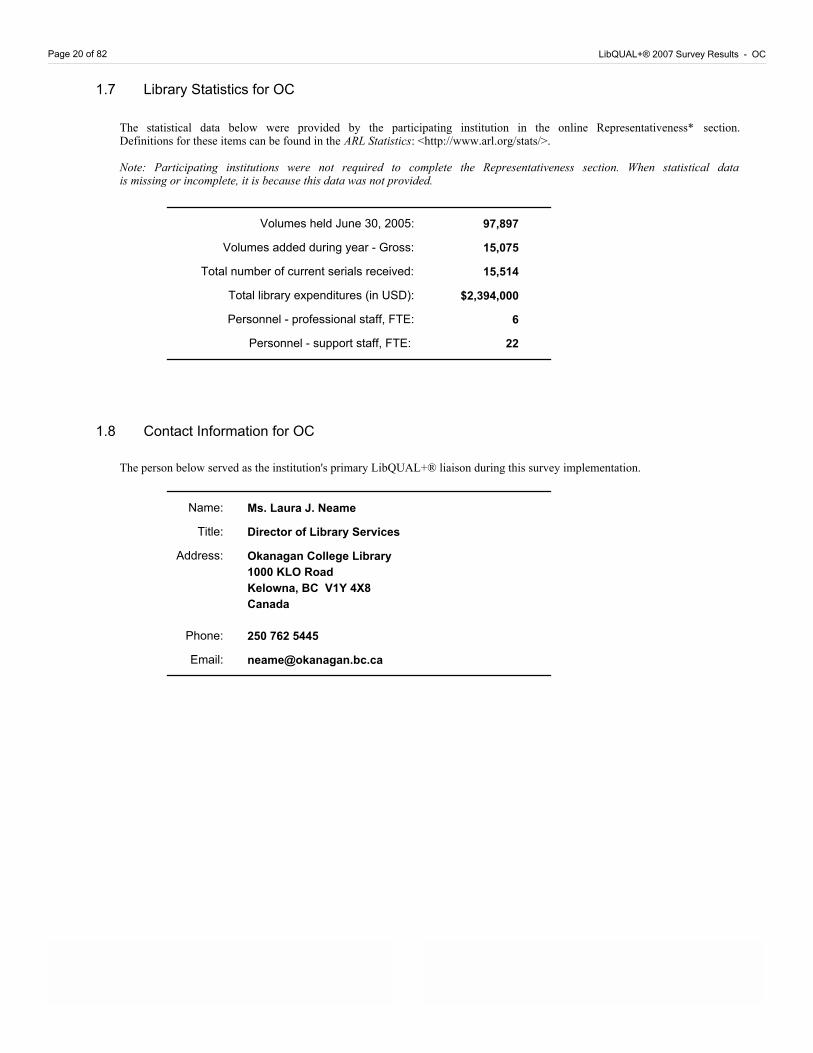
1.7 Library Statistics for OC
The statistical data below were provided by the participating institution in the online Representativeness* section. Definitions for these items can be found in the ARL Statistics: <http://www.arl.org/stats/>.
Note: Participating institutions were not required to complete the Representativeness section. When statistical data is missing or incomplete, it is because this data was not provided.
97,897
15,075
15,514
6
22
Volumes held June 30, 2005:
Volumes added during year - Gross:
Total number of current serials received:
Total library expenditures (in USD):
Personnel - professional staff, FTE:
Personnel - support staff, FTE:
$2,394,000
1.8 Contact Information for OC
The person below served as the institution's primary LibQUAL+® liaison during this survey implementation.
10 2.82%To take courses necessary for transferring to another 2-year college
109 30.70%To take courses necessary for transferring to a 4-year college or university
25 7.04%To complete a vocational/technical program
26 7.32%To obtain or maintain a certification
78 21.97%To obtain an Associates degree
25 7.04%Other
Sub Total: 80.56% 286
Faculty
6 1.69%Part-time
42 11.83%Full-time
Sub Total: 13.52% 48
Library Staff
0 0.00%Administrator
0 0.00%Manager, Head of Unit
8 2.25%Public Services
0 0.00%Systems
0 0.00%Technical Services
1 0.28%Other
Sub Total: 2.54% 9
Staff
5 1.41%Administrator/Manager
7 1.97%Other staff positions
Sub Total: 3.38% 12
Total: 355 100.00%
Language:
Institution Type:
Consortium:
User Group:
American English
Community College
LibQUAL Canada
All
Language:
Institution Type:
Consortium:
User Group:
American English
Community College
LibQUAL Canada
All
Page 22 of 82 LibQUAL+® 2007 Survey Results - OC
2.2 Population and Respondents by User Sub-Group
The chart and table below show a breakdown of survey respondents by sub-group (e.g. First year, Masters, Professor), based on user responses to the demographic questions at the end of the survey instrument and the demographic data provided by institutions in the online Representativeness section*.
The chart maps the percentage of respondents for each user subgroup in red. Population percentages for each user subgroup are mapped in blue. The table shows the number and percentage for each user sub-group for the general population (N) and for survey respondents (n).
*Note: Participating institutions were not required to complete the Representativeness section. When population data is missing or incomplete, it is because this data was not provided.
0
5
10
15
20
25
30
35
No definite purpose in mind (Student)
To take a few courses for self-improvement (Student)
To take a few job-related courses (Student)
To take courses necessary for transferring to another 2-year
college (Student)
To take courses necessary for transferring to a 4-year
college or university (Student)
To complete a vocational/technical program (Student)
To obtain or maintain a certification (Student)
To obtain an Associates degree (Student)
Other (Student)
Part-time (Faculty)
Full-time (Faculty)
Percentage Respondent Profile by User Sub-Group
Us
er
Su
b-G
rou
p
Language:
Institution Type:
Consortium:
User Group:
American English
Community College
LibQUAL Canada
All (Excluding Library Staff, Staff)
Language:
Institution Type:
Consortium:
User Group:
American English
Community College
LibQUAL Canada
All (Excluding Library Staff, Staff)
LibQUAL+® 2007 Survey Results - OC Page 23 of 82
Respondents
nUser Sub-Group
Respondents
% %N - %n
6 1.80%No definite purpose in mind (Student) -1.80%
3 0.90%To take a few courses for self-improvement
(Student)
-0.90%
4 1.20%To take a few job-related courses (Student) -1.20%
10 2.99%To take courses necessary for transferring to
another 2-year college (Student)
-2.99%
109 32.63%To take courses necessary for transferring to a
4-year college or university (Student)
-32.63%
25 7.49%To complete a vocational/technical program
(Student)
-7.49%
26 7.78%To obtain or maintain a certification (Student) -7.78%
78 23.35%To obtain an Associates degree (Student) -23.35%
25 7.49%Other (Student) -7.49%
6 1.80%Part-time (Faculty) -1.80%
42 12.57%Full-time (Faculty) -12.57%
Total: 334 100.00% 0.00%
Language:
Institution Type:
Consortium:
User Group:
American English
Community College
LibQUAL Canada
All (Excluding Library Staff, Staff)
Language:
Institution Type:
Consortium:
User Group:
American English
Community College
LibQUAL Canada
All (Excluding Library Staff, Staff)
Page 24 of 82 LibQUAL+® 2007 Survey Results - OC
The chart and table below show a breakdown of survey respondents by discipline, based on user responses to the demographic questions and the demographic data provided by institutions in the online Representativeness section*.
This section shows survey respondents broken down based on the LibQUAL+® standard discipline categories. The chart maps percentage of respondents for each discipline in red. Population percentages for each discipline are mapped in blue . The table shows the number and percentage for each discipline, for the general population (N) and for survey respondents (n).
*Note: Participating institutions were not required to complete the Representativeness section. When population data is missing or incomplete, it is because this data was not provided.
2.3 Population and Respondents by Standard Discipline
Personal Improvement / Leisure 0 0.00% 0 0.00% 0.00%
Science / Math 55 16.47% 325 5.51% -10.96%
Social Sciences / Psychology 0 0.00% 0 0.00% 0.00%
Undecided 1 0.30% 0 0.00% -0.30%
Total: 100.00% 5,901 334 100.00% 0.00%
Language:
Institution Type:
Consortium:
User Group:
American English
Community College
LibQUAL Canada
All (Excluding Library Staff, Staff)
Language:
Institution Type:
Consortium:
User Group:
American English
Community College
LibQUAL Canada
All (Excluding Library Staff, Staff)
RHTyner
Text Box
Page 25 is intentionally blank.
RHTyner
Sticky Note
MigrationConfirmed set by RHTyner
RHTyner
Sticky Note
Accepted set by RHTyner
Page 26 of 82 LibQUAL+® 2007 Survey Results - OC
2.4 Population and Respondents by Customized Discipline
The chart and table below show a breakdown of survey respondents by discipline, based on user responses to the demographic questions and the demographic data provided by institutions in the online Representativeness section*.
This section shows survey respondents broken down based on the customized discipline categories supplied by the participating library. The chart maps percentage of respondents for each discipline in red. Population percentages for each discipline are mapped in blue. The table shows the number and percentage for each discipline, for the general population (N) and for survey respondents (n).
*Note: Participating institutions were not required to complete the Representativeness section. When population data is missing or incomplete, it is because this data was not provided.
0
5
10
15
20
25
30
35
Adult Academic and Career Prep
Adult Special Education
Arts
Business Administration
Commercial Aviation
Continuing Studies
Engineering Technology
English as a Second Language (ESL)
Health & Social Development
Office Administration
Science
Trades and Apprenticehip
Unapplicable
Undecided
D
iscip
lin
e
Percentage
Population Profile by Discipline
Respondent Profile by Discipline
Language:
Institution Type:
Consortium:
User Group:
American English
Community College
LibQUAL Canada
All (Excluding Library Staff, Staff)
Language:
Institution Type:
Consortium:
User Group:
American English
Community College
LibQUAL Canada
All (Excluding Library Staff, Staff)
LibQUAL+® 2007 Survey Results - OC Page 27 of 82
Respondents
nDiscipline
Respondents
%
Population
N
Population
% %N - %n
Adult Academic and Career Prep 15 4.49% 766 12.98% 8.49%
Adult Special Education 1 0.30% 149 2.52% 2.23%
Arts 81 24.25% 1,153 19.54% -4.71%
Business Administration 113 33.83% 1,334 22.61% -11.23%
Commercial Aviation 2 0.60% 31 0.53% -0.07%
Continuing Studies 6 1.80% 432 7.32% 5.52%
Engineering Technology 13 3.89% 330 5.59% 1.70%
English as a Second Language (ESL) 3 0.90% 218 3.69% 2.80%
Health & Social Development 31 9.28% 276 4.68% -4.60%
Office Administration 3 0.90% 98 1.66% 0.76%
Science 55 16.47% 325 5.51% -10.96%
Trades and Apprenticehip 5 1.50% 743 12.59% 11.09%
Unapplicable 5 1.50% 46 0.78% -0.72%
Undecided 1 0.30% 0 0.00% -0.30%
Total: 100.00% 5,901 334 100.00% 0.00%
Language:
Institution Type:
Consortium:
User Group:
American English
Community College
LibQUAL Canada
All (Excluding Library Staff, Staff)
Language:
Institution Type:
Consortium:
User Group:
American English
Community College
LibQUAL Canada
All (Excluding Library Staff, Staff)
Page 28 of 82 LibQUAL+® 2007 Survey Results - OC
2.5 Respondent Profile by Age
This table shows a breakdown of survey respondents by age; both the number of respondents (n) and the percentage of the total number of respondents represented by each age group are displayed.
Age
Respondents
%
Respondents
n
Under 18 2 0.58%
18 - 22 157 45.51%
23 - 30 81 23.48%
31 - 45 61 17.68%
46 - 65 43 12.46%
Over 65 1 0.29%
Total: 100.00% 345
2.6 Population and Respondent Profiles by Sex
The table below shows a breakdown of survey respondents by sex, based on user responses to the demographic questions and the demographic data provided by institutions in the online Representativeness section*. The number and percentage for each sex are given for the general population and for survey respondents.
*Note: Participating institutions were not required to complete the Representativeness section. When population data is missing or incomplete, it is because this data was not provided.
Sex
Respondents
%
Respondents
n
Population
N
Population
%
Male 126 36.52%47.21% 2,406
Female 219 63.48%52.79% 2,690
Total: 100.00% 345100.00% 5,096
Language:
Institution Type:
Consortium:
User Group:
American English
Community College
LibQUAL Canada
All (Excluding Library Staff)
Language:
Institution Type:
Consortium:
User Group:
American English
Community College
LibQUAL Canada
All (Excluding Library Staff)
LibQUAL+® 2007 Survey Results - OC Page 29 of 82
This radar chart shows the aggregate results for the core survey questions. Each axis represents one question. A code to identify each question is displayed at the outer point of each axis. While questions for each dimension of library service quality are scattered randomly throughout the survey, on this chart they are grouped into sections: Affect of Service , Information Control, and Library as Place.
On each axis, respondents' minimum, desired, and perceived levels of service quality are plotted, and the resulting "gaps" between the three levels (representing service adequacy or service superiority) are shaded in blue, yellow, green, and red.
The following two tables show mean scores and standard deviations for each question, where n is the number of respondents for each particular question. (For a more detailed explanation of the headings, see the Introduction to this notebook.)
3.1 Core Questions Summary
3 Survey Item Summary for OC
3
4
5
6
7
8
9
AS-1
AS-2
AS-3
AS-4
AS-5AS-6
AS-7
AS-8
AS-9
IC-1
IC-2
IC-3
IC-4
IC-5
IC-6
IC-7IC-8
LP-1
LP-2
LP-3
LP-4
LP-5
Affect of Service
Information Control
Library as Place
Perceived Less Than Minimum
Perceived Greater Than Minimum
Perceived Less Than Desired
Perceived Greater Than Desired
Language:
Institution Type:
Consortium:
User Group:
American English
Community College
LibQUAL Canada
All (Excluding Library Staff)
Language:
Institution Type:
Consortium:
User Group:
American English
Community College
LibQUAL Canada
All (Excluding Library Staff)
Page 30 of 82 LibQUAL+® 2007 Survey Results - OC
Adequacy
Mean
Perceived
Mean
Desired
MeanQuestion TextID
Minimum
Mean n
Superiority
Mean
Affect of Service
Employees who instill confidence in users 5.74 7.48 6.99 1.25AS-1 338-0.49
Employees who are consistently courteousAS-3 343 1.65 1.48 1.64 1.47 1.24
Readiness to respond to users' questionsAS-4 335 1.60 1.40 1.57 1.43 1.26
Employees who have the knowledge to answer
user questions
AS-5 341 1.55 1.26 1.53 1.33 1.30
Employees who deal with users in a caring
fashion
AS-6 344 1.72 1.31 1.59 1.41 1.30
Employees who understand the needs of their
users
AS-7 340 1.64 1.41 1.55 1.34 1.35
Willingness to help usersAS-8 340 1.63 1.26 1.49 1.38 1.32
Dependability in handling users' service problemsAS-9 295 1.59 1.39 1.55 1.35 1.35
Information Control
Making electronic resources accessible from my
home or office
IC-1 337 1.69 1.76 1.94 1.70 1.28
A library Web site enabling me to locate
information on my own
IC-2 338 1.63 1.77 1.91 1.64 1.31
The printed library materials I need for my workIC-3 327 1.76 1.67 1.93 1.71 1.44
The electronic information resources I needIC-4 335 1.52 1.55 1.65 1.45 1.26
Modern equipment that lets me easily access
needed information
IC-5 339 1.53 1.36 1.77 1.24 1.14
Easy-to-use access tools that allow me to find
things on my own
IC-6 341 1.51 1.49 1.77 1.37 1.21
Making information easily accessible for
independent use
IC-7 341 1.47 1.33 1.49 1.25 1.14
Print and/or electronic journal collections I require
for my work
IC-8 322 1.65 1.66 1.98 1.60 1.29
Library as Place
Library space that inspires study and learningLP-1 343 1.71 2.52 2.58 2.05 1.37
Quiet space for individual activitiesLP-2 338 1.75 2.69 2.92 2.20 1.35
A comfortable and inviting locationLP-3 344 1.72 2.05 2.27 1.80 1.32
A getaway for study, learning, or researchLP-4 336 1.66 2.08 2.33 1.83 1.22
Community space for group learning and group
study
LP-5 324 1.87 2.59 2.75 2.11 1.69
346Overall: 1.22 1.09 1.27 1.10 0.92
Language:
Institution Type:
Consortium:
User Group:
American English
Community College
LibQUAL Canada
All (Excluding Library Staff)
Language:
Institution Type:
Consortium:
User Group:
American English
Community College
LibQUAL Canada
All (Excluding Library Staff)
Page 32 of 82 LibQUAL+® 2007 Survey Results - OC
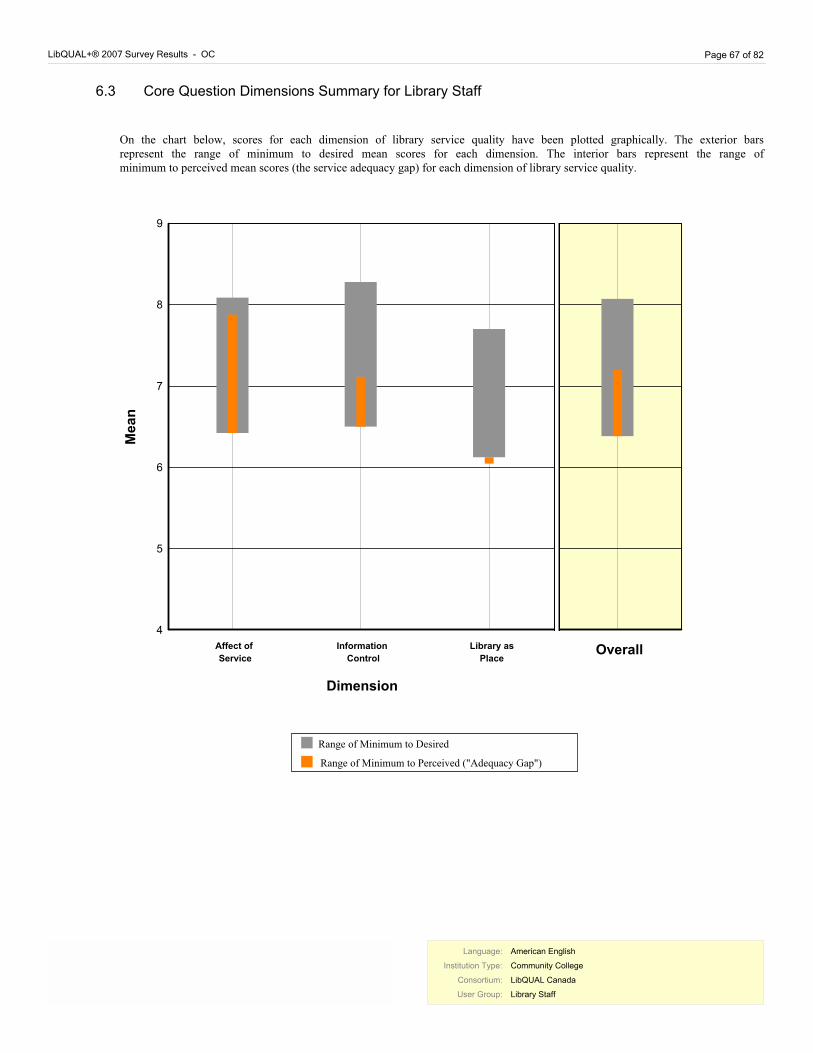
On the chart below, scores for each dimension of library service quality have been plotted graphically. The exterior bars represent the range of minimum to desired mean scores for each dimension. The interior bars represent the range of minimum to perceived mean scores (the service adequacy gap) for each dimension of library service quality.
3.2 Core Question Dimensions Summary
4
5
6
7
8
9
Information
Control
Affect of
Service
Library as
Place
Range of Minimum to Perceived ("Adequacy Gap")
Range of Minimum to Desired
Me
an
Dimension
Overall
Language:
Institution Type:
Consortium:
User Group:
American English
Community College
LibQUAL Canada
All (Excluding Library Staff)
Language:
Institution Type:
Consortium:
User Group:
American English
Community College
LibQUAL Canada
All (Excluding Library Staff)
LibQUAL+® 2007 Survey Results - OC Page 33 of 82
The following table displays mean scores for each dimension of library service quality measured by the LibQUAL+® survey, where n is the number of respondents for each particular dimension. (For a more detailed explanation of the headings, see the Introduction to this notebook.) A complete listing of the survey questions and their dimensions can be found in Appendix A.
Adequacy
Mean
Perceived
Mean
Desired
MeanDimension
Minimum
Mean n
Superiority
Mean
Affect of Service 6.45 7.71 7.38 0.94 346-0.33
Information Control 6.60 7.91 7.15 0.55 346-0.76
Library as Place 6.45 7.85 6.19 -0.26 346-1.67
6.51 7.82 7.02 0.52 346-0.80Overall:
Adequacy
SD
Perceived
SD
Desired
SDDimension
Minimum
SD n
Superiority
SD
Affect of Service 346 1.34 1.06 1.20 1.17 1.05
Information Control 346 1.23 1.14 1.35 1.13 0.94
Library as Place 346 1.42 1.96 2.16 1.65 1.08
The following table displays standard deviation for each dimension of library service quality measured by the
LibQUAL+® survey, where n is the number of respondents for each particular dimension. (For a more detailed
explanation of the headings, see the Introduction to this notebook.) A complete listing of the survey questions and their
dimensions can be found in Appendix A.
346Overall: 1.22 1.09 1.27 1.10 0.92
Language:
Institution Type:
Consortium:
User Group:
American English
Community College
LibQUAL Canada
All (Excluding Library Staff)
Language:
Institution Type:
Consortium:
User Group:
American English
Community College
LibQUAL Canada
All (Excluding Library Staff)
Page 34 of 82 LibQUAL+® 2007 Survey Results - OC
This table shows mean scores for each of the local questions added by the individual library or consortium, where n is the number of respondents for each particular question. (For a more detailed explanation of the headings, see the Introduction to this notebook.)
3.3 Local Questions Summary
Adequacy
Mean
Perceived
Mean
Desired
MeanQuestion Text
Minimum
Mean n
Superiority
Mean
Teaching me how to access, evaluate, and use
information
6.07 7.42 6.92 0.86 337-0.50
Making me aware of library resources and services 5.88 7.29 6.70 0.83 343-0.58
Ability to navigate library Web pages easily 6.67 7.91 6.94 0.27 335-0.97
Adequate hours of service 6.88 8.03 7.46 0.58 342-0.57
Ease and timeliness in getting materials from other
libraries
6.29 7.58 7.12 0.83 277-0.46
This table displays the standard deviations for each of the local questions added by the individual library or consortium , where n is the number of respondents for each question. (For a more detailed explanation of the headings, see the Introduction to this notebook.)
Adequacy
SD
Perceived
SD
Desired
SDQuestion Text
Minimum
SD n
Superiority
SD
Teaching me how to access, evaluate, and use
information
337 1.76 1.61 1.66 1.60 1.55
Making me aware of library resources and services 343 1.70 1.86 1.79 1.68 1.49
Ability to navigate library Web pages easily 335 1.62 1.83 2.01 1.63 1.31
Adequate hours of service 342 1.64 1.84 2.22 1.69 1.25
Ease and timeliness in getting materials from other
libraries
277 1.70 1.74 1.92 1.67 1.53
Language:
Institution Type:
Consortium:
User Group:
American English
Community College
LibQUAL Canada
All (Excluding Library Staff)
Language:
Institution Type:
Consortium:
User Group:
American English
Community College
LibQUAL Canada
All (Excluding Library Staff)
LibQUAL+® 2007 Survey Results - OC Page 35 of 82
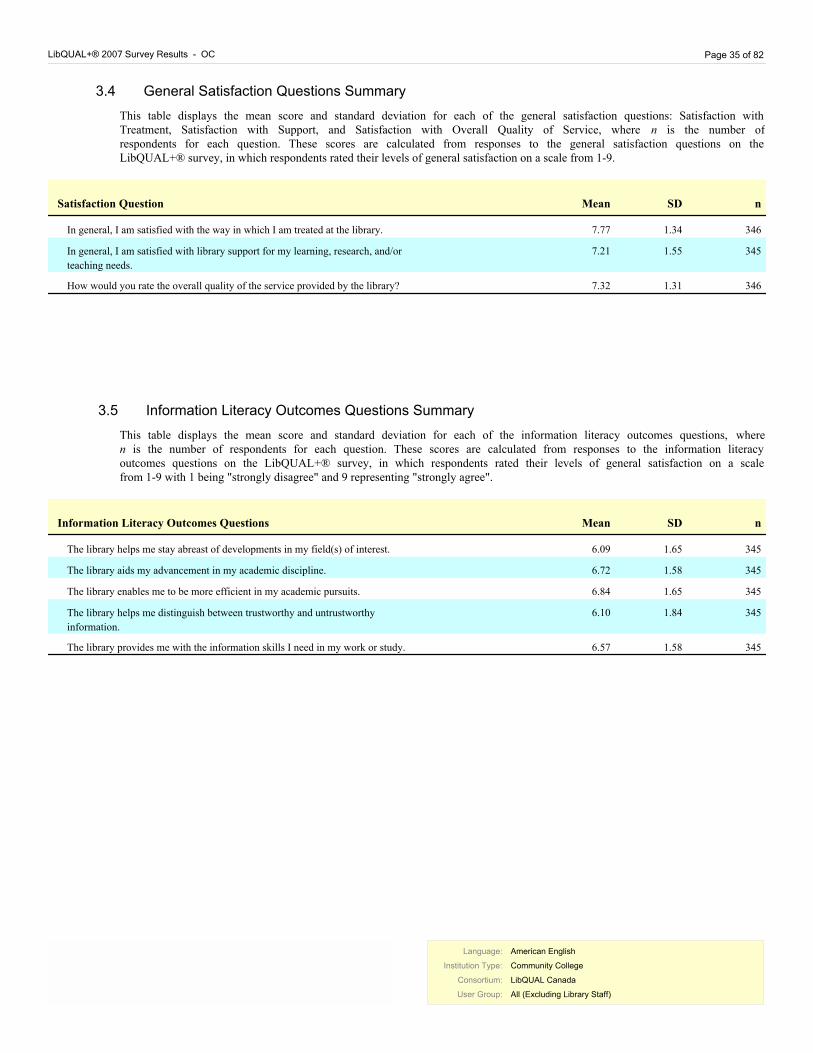
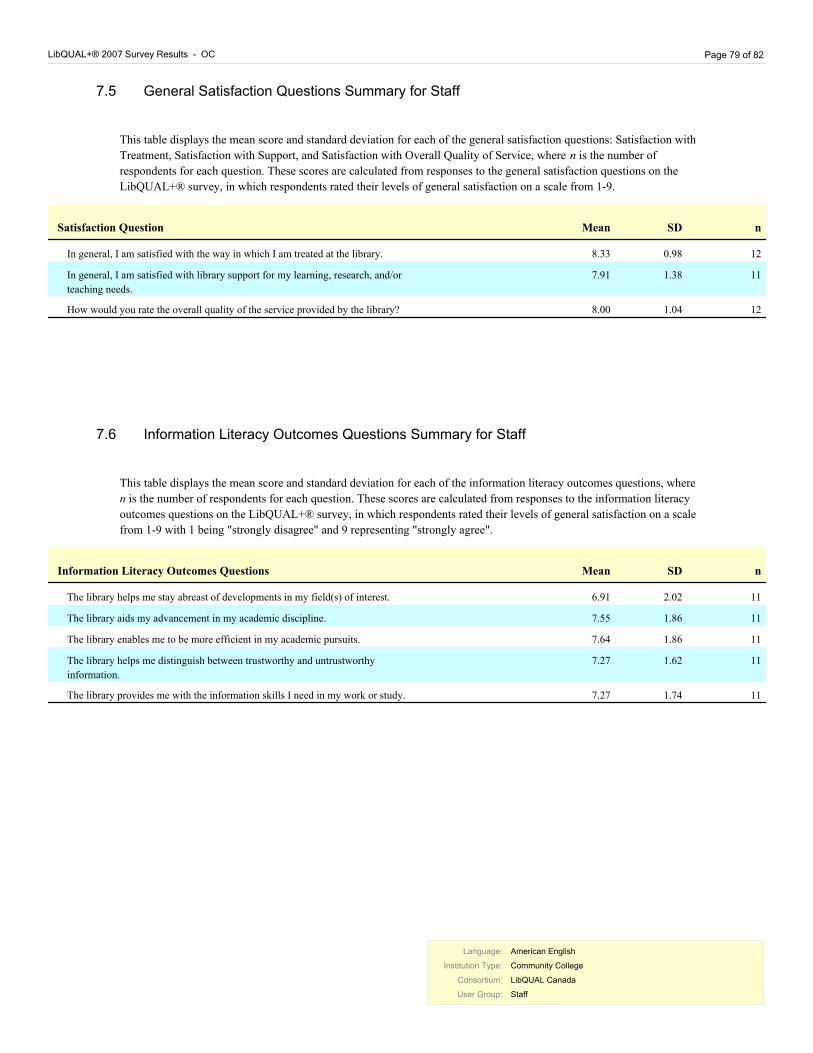
This table displays the mean score and standard deviation for each of the general satisfaction questions: Satisfaction with Treatment, Satisfaction with Support, and Satisfaction with Overall Quality of Service, where n is the number of respondents for each question. These scores are calculated from responses to the general satisfaction questions on the LibQUAL+® survey, in which respondents rated their levels of general satisfaction on a scale from 1-9.
3.4 General Satisfaction Questions Summary
MeanSatisfaction Question nSD
In general, I am satisfied with the way in which I am treated at the library. 7.77 346 1.34
In general, I am satisfied with library support for my learning, research, and/or
teaching needs.
7.21 345 1.55
How would you rate the overall quality of the service provided by the library? 7.32 346 1.31
This table displays the mean score and standard deviation for each of the information literacy outcomes questions, where n is the number of respondents for each question. These scores are calculated from responses to the information literacy outcomes questions on the LibQUAL+® survey, in which respondents rated their levels of general satisfaction on a scale from 1-9 with 1 being "strongly disagree" and 9 representing "strongly agree".
3.5 Information Literacy Outcomes Questions Summary
MeanInformation Literacy Outcomes Questions nSD
The library helps me stay abreast of developments in my field(s) of interest. 6.09 345 1.65
The library aids my advancement in my academic discipline. 6.72 345 1.58
The library enables me to be more efficient in my academic pursuits. 6.84 345 1.65
The library helps me distinguish between trustworthy and untrustworthy
information.
6.10 345 1.84
The library provides me with the information skills I need in my work or study. 6.57 345 1.58
Language:
Institution Type:
Consortium:
User Group:
American English
Community College
LibQUAL Canada
All (Excluding Library Staff)
Language:
Institution Type:
Consortium:
User Group:
American English
Community College
LibQUAL Canada
All (Excluding Library Staff)
Page 36 of 82 LibQUAL+® 2007 Survey Results - OC
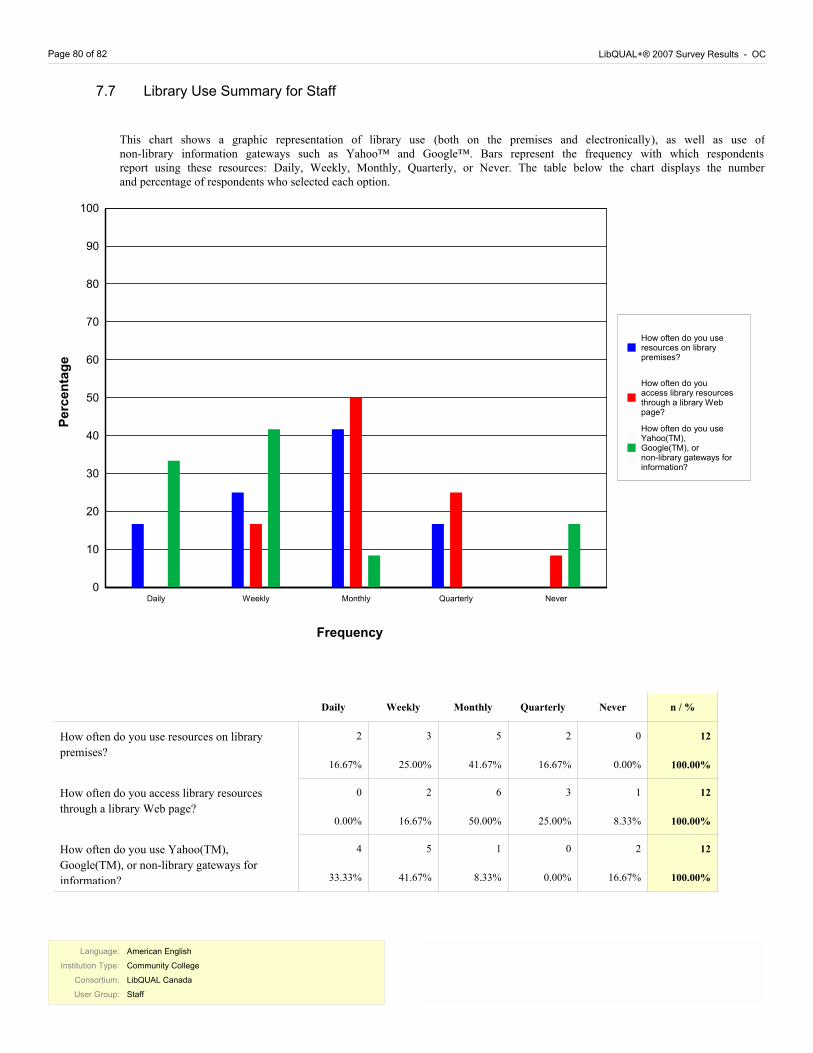
This chart shows a graphic representation of library use (both on the premises and electronically), as well as use of non-library information gateways such as Yahoo™ and Google™. Bars represent the frequency with which respondents report using these resources: Daily, Weekly, Monthly, Quarterly, or Never. The table below the chart displays the number and percentage of respondents who selected each option.
3.6 Library Use Summary
0
10
20
30
40
50
60
70
80
90
100
Daily
Weekly
Monthly
Quarterly
Never
How often do you use
resources on library
premises?
How often do you
access library resources
through a library Web
page?
How often do you use
Yahoo(TM),
Google(TM), or
non-library gateways for
information?
Frequency
P
erc
en
tag
e
Daily Weekly Monthly Quarterly Never n / %
How often do you use resources on library
premises?
124
35.84%
136
39.31%
59
17.05%
21
6.07%
6
1.73%
346
100.00%
How often do you access library resources
through a library Web page?
64
18.50%
150
43.35%
79
22.83%
29
8.38%
24
6.94%
346
100.00%
How often do you use Yahoo(TM),
Google(TM), or non-library gateways for
information?
230
66.47%
82
23.70%
25
7.23%
4
1.16%
5
1.45%
346
100.00%
Language:
Institution Type:
Consortium:
User Group:
American English
Community College
LibQUAL Canada
All (Excluding Library Staff)
Language:
Institution Type:
Consortium:
User Group:
American English
Community College
LibQUAL Canada
All (Excluding Library Staff)
LibQUAL+® 2007 Survey Results - OC Page 37 of 82
4 Student Summary
4.1 Demographic Summary for Student
4.1.Th1 Population and Respondent Profiles for Student by Standard Discipline
The chart and table below show a breakdown of survey respondents by discipline, based on user responses to the demographic questions and the demographic data provided by institutions in the online Representativeness section.
This section shows survey respondents broken down based on the LibQUAL+® standard discipline categories. The chart
maps percentage of respondents for each discipline in red. Population percentages for each discipline are mapped in blue.
The table shows the number and percentage for each discipline, for the general population (N) and for survey respondents
(n).
0
5
10
15
20
25
30
35
40
Agriculture / Environmental Studies
Applied Technologies & Trades
Architecture
Business
Communications / Journalism
Education
Engineering / Computer Science
General Studies
Health Sciences
Humanities
Law
Military / Naval Science
Other
Performing & Fine Arts
Personal Improvement / Leisure
Science / Math
Social Sciences / Psychology
Undecided
D
iscip
lin
e
Percentage
Population Profile by Discipline
Respondent Profile by Discipline
Language:
Institution Type:
Consortium:
User Group:
American English
Community College
LibQUAL Canada
Student
Language:
Institution Type:
Consortium:
User Group:
American English
Community College
LibQUAL Canada
Student
RHTyner
Text Box
The remainder of this page is intentionally blank.
Personal Improvement / Leisure 0 0.00% 0 0.00% 0.00%
Science / Math 45 15.73% 273 4.96% -10.77%
Social Sciences / Psychology 0 0.00% 0 0.00% 0.00%
Undecided 1 0.35% 0 0.00% -0.35%
Total: 100.00% 5,499 286 100.00% 0.00%
Language:
Institution Type:
Consortium:
User Group:
American English
Community College
LibQUAL Canada
Student
Language:
Institution Type:
Consortium:
User Group:
American English
Community College
LibQUAL Canada
Student
RHTyner
Text Box
Page 38 is intentionally blank.
RHTyner
Sticky Note
MigrationConfirmed set by RHTyner
RHTyner
Sticky Note
Accepted set by RHTyner
LibQUAL+® 2007 Survey Results - OC Page 39 of 82
4.1.2 Population and Respondent Profiles for Student by Customized Discipline
The chart and table below show a breakdown of survey respondents by discipline, based on user responses to the demographic questions and the demographic data provided by institutions in the online Representativeness section.
This section shows survey respondents broken down based on the customized discipline categories supplied by the participating library. The chart maps percentage of respondents for each discipline in red. Population percentages for each discipline are mapped in blue. The table shows the number and percentage for each discipline, for the general population (N) and for survey respondents (n).
0
5
10
15
20
25
30
35
40
Adult Academic and Career Prep
Adult Special Education
Arts
Business Administration
Commercial Aviation
Continuing Studies
Engineering Technology
English as a Second Language (ESL)
Health & Social Development
Office Administration
Science
Trades and Apprenticehip
Unapplicable
Undecided
D
iscip
lin
e
Percentage
Population Profile by Discipline
Respondent Profile by Discipline
Language:
Institution Type:
Consortium:
User Group:
American English
Community College
LibQUAL Canada
Student
Language:
Institution Type:
Consortium:
User Group:
American English
Community College
LibQUAL Canada
Student
Page 40 of 82 LibQUAL+® 2007 Survey Results - OC
Respondents
nDiscipline
Respondents
%
Population
N
Population
% %N - %n
Adult Academic and Career Prep 8 2.80% 720 13.09% 10.30%
Adult Special Education 1 0.35% 143 2.60% 2.25%
Arts 72 25.17% 1,085 19.73% -5.44%
Business Administration 105 36.71% 1,282 23.31% -13.40%
Commercial Aviation 1 0.35% 31 0.56% 0.21%
Continuing Studies 6 2.10% 403 7.33% 5.23%
Engineering Technology 9 3.15% 306 5.56% 2.42%
English as a Second Language (ESL) 1 0.35% 209 3.80% 3.45%
Health & Social Development 27 9.44% 242 4.40% -5.04%
Office Administration 3 1.05% 90 1.64% 0.59%
Science 45 15.73% 273 4.96% -10.77%
Trades and Apprenticehip 4 1.40% 689 12.53% 11.13%
Unapplicable 3 1.05% 26 0.47% -0.58%
Undecided 1 0.35% 0 0.00% -0.35%
Total: 100.00% 5,499 286 100.00% 0.00%
Language:
Institution Type:
Consortium:
User Group:
American English
Community College
LibQUAL Canada
Student
Language:
Institution Type:
Consortium:
User Group:
American English
Community College
LibQUAL Canada
Student
LibQUAL+® 2007 Survey Results - OC Page 41 of 82
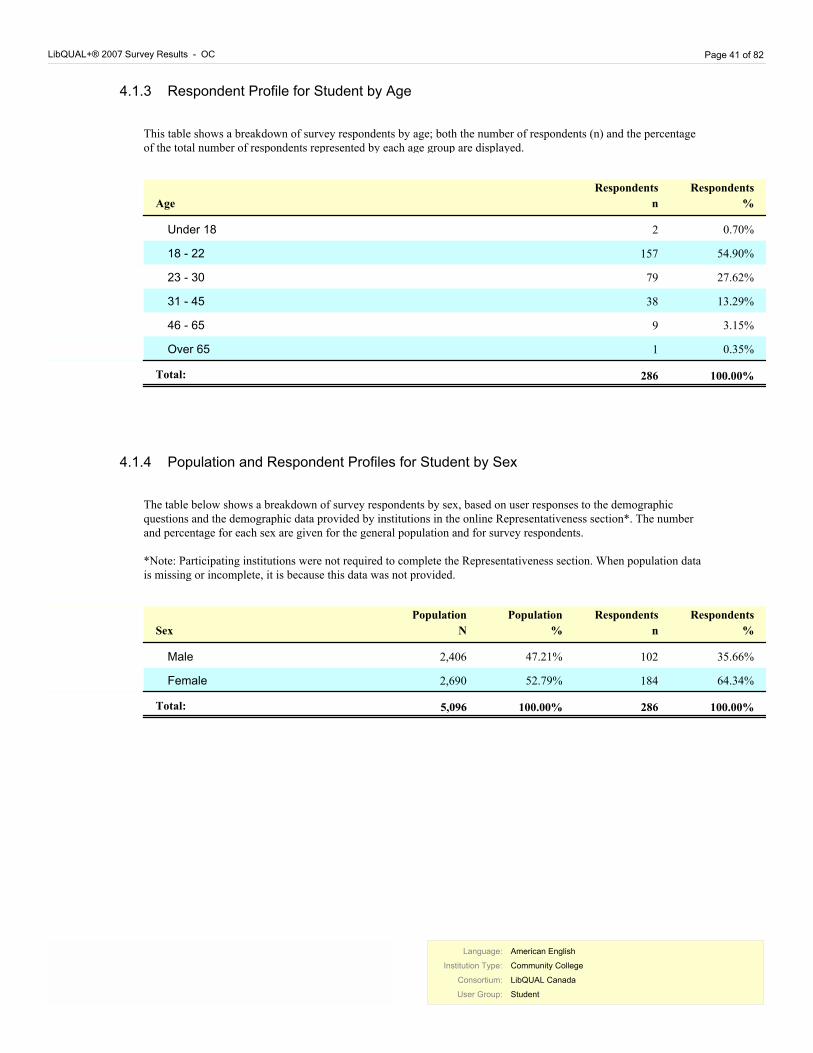
4.1.3 Respondent Profile for Student by Age
This table shows a breakdown of survey respondents by age; both the number of respondents (n) and the percentage of the total number of respondents represented by each age group are displayed.
Respondents
%
Respondents
nAge
Under 18 2 0.70%
18 - 22 157 54.90%
23 - 30 79 27.62%
31 - 45 38 13.29%
46 - 65 9 3.15%
Over 65 1 0.35%
Total: 100.00% 286
4.1.4 Population and Respondent Profiles for Student by Sex
The table below shows a breakdown of survey respondents by sex, based on user responses to the demographic questions and the demographic data provided by institutions in the online Representativeness section*. The number and percentage for each sex are given for the general population and for survey respondents.
*Note: Participating institutions were not required to complete the Representativeness section. When population data is missing or incomplete, it is because this data was not provided.
Respondents
%
Respondents
n
Population
%
Population
NSex
Male 102 35.66%47.21% 2,406
Female 184 64.34%52.79% 2,690
Total: 100.00% 286 5,096 100.00%
Language:
Institution Type:
Consortium:
User Group:
American English
Community College
LibQUAL Canada
Student
Language:
Institution Type:
Consortium:
User Group:
American English
Community College
LibQUAL Canada
Student
Page 42 of 82 LibQUAL+® 2007 Survey Results - OC
4.2 Core Questions Summary for Student
This radar chart shows aggregate results for the core survey questions. Each axis represents one question. A code to identify each question is displayed at the outer point of each axis. While questions for each dimension of library service quality are scattered randomly throughout the survey, on this chart they are grouped into sections: Affect of Service , Library as Place, and Information Control.
On each axis, respondents' minimum, desired, and perceived levels of service quality are plotted, and the resulting "gaps" between the three levels (representing service adequacy or service superiority) are shaded in blue, yellow, green, and red.
The two following tables show mean scores and standard deviations for each question, where n is the number of respondents for each particular question. (For a more detailed explanation of the headings, see the Introduction to this notebook.)
3
4
5
6
7
8
9
AS-1
AS-2
AS-3
AS-4
AS-5AS-6
AS-7
AS-8
AS-9
IC-1
IC-2
IC-3
IC-4
IC-5
IC-6
IC-7IC-8
LP-1
LP-2
LP-3
LP-4
LP-5
Affect of Service
Information Control
Library as Place
Perceived Less Than Minimum
Perceived Greater Than Minimum
Perceived Less Than Desired
Perceived Greater Than Desired
Language:
Institution Type:
Consortium:
User Group:
American English
Community College
LibQUAL Canada
Student
Language:
Institution Type:
Consortium:
User Group:
American English
Community College
LibQUAL Canada
Student
LibQUAL+® 2007 Survey Results - OC Page 43 of 82
Adequacy
Mean
Perceived
Mean
Desired
MeanQuestion TextID
Minimum
Mean n
Superiority
Mean
Affect of Service
Employees who instill confidence in users 5.51 7.42 6.76 1.25AS-1 279-0.66
Employees who are consistently courteousAS-3 284 1.67 1.48 1.67 1.49 1.29
Readiness to respond to users' questionsAS-4 276 1.61 1.43 1.61 1.44 1.33
Employees who have the knowledge to answer
user questions
AS-5 282 1.56 1.28 1.56 1.37 1.34
Employees who deal with users in a caring
fashion
AS-6 285 1.75 1.31 1.60 1.42 1.35
Employees who understand the needs of their
users
AS-7 280 1.63 1.40 1.57 1.36 1.38
Willingness to help usersAS-8 281 1.66 1.25 1.51 1.40 1.36
Dependability in handling users' service problemsAS-9 244 1.62 1.39 1.57 1.37 1.41
Information Control
Making electronic resources accessible from my
home or office
IC-1 281 1.69 1.69 1.91 1.71 1.23
A library Web site enabling me to locate
information on my own
IC-2 280 1.59 1.70 1.84 1.66 1.30
The printed library materials I need for my workIC-3 272 1.78 1.63 1.91 1.71 1.47
The electronic information resources I needIC-4 277 1.52 1.53 1.60 1.46 1.29
Modern equipment that lets me easily access
needed information
IC-5 282 1.56 1.36 1.81 1.26 1.18
Easy-to-use access tools that allow me to find
things on my own
IC-6 281 1.55 1.47 1.78 1.35 1.25
Making information easily accessible for
independent use
IC-7 283 1.49 1.33 1.48 1.25 1.18
Print and/or electronic journal collections I require
for my work
IC-8 268 1.69 1.55 1.86 1.53 1.33
Library as Place
Library space that inspires study and learningLP-1 286 1.71 2.52 2.59 2.09 1.37
Quiet space for individual activitiesLP-2 285 1.73 2.69 2.97 2.24 1.28
A comfortable and inviting locationLP-3 285 1.73 2.06 2.28 1.84 1.34
A getaway for study, learning, or researchLP-4 282 1.67 2.07 2.35 1.84 1.20
Community space for group learning and group
study
LP-5 275 1.86 2.61 2.81 2.16 1.65
286Overall: 1.21 1.07 1.26 1.10 0.95
Language:
Institution Type:
Consortium:
User Group:
American English
Community College
LibQUAL Canada
Student
Language:
Institution Type:
Consortium:
User Group:
American English
Community College
LibQUAL Canada
Student
LibQUAL+® 2007 Survey Results - OC Page 45 of 82
4.3 Core Question Dimensions Summary for Student
On the chart below, scores for each dimension of library service quality have been plotted graphically. The exterior bars represent the range of minimum to desired mean scores for each dimension. The interior bars represent the range of minimum to perceived mean scores (the service adequacy gap) for each dimension of library service quality.
4
5
6
7
8
9
Information
Control
Affect of
Service
Library as
Place
Range of Minimum to Perceived ("Adequacy Gap")
Range of Minimum to Desired
Me
an
Dimension
Overall
Language:
Institution Type:
Consortium:
User Group:
American English
Community College
LibQUAL Canada
Student
Language:
Institution Type:
Consortium:
User Group:
American English
Community College
LibQUAL Canada
Student
Page 46 of 82 LibQUAL+® 2007 Survey Results - OC
The following table displays mean scores for each dimension of library service quality measured by the LibQUAL+™ survey, where n is the number of respondents for each particular dimension. (For a more detailed explanation of the headings, see the Introduction to this notebook.) A complete listing of the survey questions and their dimensions can be found in Appendix A.
Adequacy
Mean
Perceived
Mean
Desired
MeanDimension
Minimum
Mean n
Superiority
Mean
Affect of Service 6.28 7.67 7.22 0.94 286-0.45
Information Control 6.49 7.90 7.12 0.63 286-0.78
Library as Place 6.42 7.93 6.12 -0.30 286-1.81
6.39 7.82 6.93 0.54 286-0.89Overall:
Adequacy
SD
Perceived
SD
Desired
SDDimension
Minimum
SD n
Superiority
SD
Affect of Service 286 1.32 1.03 1.18 1.16 1.09
Information Control 286 1.24 1.07 1.29 1.11 0.97
Library as Place 286 1.38 1.96 2.17 1.69 1.04
The following table displays standard deviation for each dimension of library service quality measured by the
LibQUAL+® survey, where n is the number of respondents for each particular dimension. (For a more detailed
explanation of the headings, see the Introduction to this notebook.) A complete listing of the survey questions and their
dimensions can be found in Appendix A.
286Overall: 1.21 1.07 1.26 1.10 0.95
Language:
Institution Type:
Consortium:
User Group:
American English
Community College
LibQUAL Canada
Student
Language:
Institution Type:
Consortium:
User Group:
American English
Community College
LibQUAL Canada
Student
LibQUAL+® 2007 Survey Results - OC Page 47 of 82
4.4 Local Questions Summary for Student
Adequacy
Mean
Perceived
Mean
Desired
MeanQuestion Text
Minimum
Mean n
Superiority
Mean
Teaching me how to access, evaluate, and use
information
5.95 7.39 6.81 0.86 280-0.58
Making me aware of library resources and services 5.78 7.28 6.63 0.85 283-0.65
Ability to navigate library Web pages easily 6.57 7.90 6.95 0.38 277-0.95
Adequate hours of service 6.81 8.05 7.42 0.61 285-0.63
Ease and timeliness in getting materials from other
libraries
6.16 7.50 7.00 0.85 224-0.50
This table shows mean scores for each of the local questions added by the individual library or consortium, where n is the number of respondents for each particular question. (For a more detailed explanation of the headings, see the Introduction to this notebook.)
Adequacy
SD
Perceived
SD
Desired
SDQuestion Text
Minimum
SD n
Superiority
SD
Teaching me how to access, evaluate, and use
information
280 1.77 1.61 1.64 1.62 1.62
Making me aware of library resources and services 283 1.68 1.86 1.75 1.67 1.50
Ability to navigate library Web pages easily 277 1.66 1.76 1.97 1.60 1.33
Adequate hours of service 285 1.67 1.85 2.25 1.72 1.27
Ease and timeliness in getting materials from other
libraries
224 1.69 1.79 1.98 1.72 1.58
This table displays the standard deviations for each of the local questions added by the individual library or consortium , where n is the number of respondents for each particular question. (For a more detailed explanation of the headings, see the Introduction to this notebook.)
Language:
Institution Type:
Consortium:
User Group:
American English
Community College
LibQUAL Canada
Student
Language:
Institution Type:
Consortium:
User Group:
American English
Community College
LibQUAL Canada
Student
Page 48 of 82 LibQUAL+® 2007 Survey Results - OC
4.5 General Satisfaction Questions Summary for Student
MeanSatisfaction Question nSD
In general, I am satisfied with the way in which I am treated at the library. 7.65 286 1.34
In general, I am satisfied with library support for my learning, research, and/or
teaching needs.
7.12 286 1.54
How would you rate the overall quality of the service provided by the library? 7.23 286 1.28
This table displays the mean score and standard deviation for each of the general satisfaction questions: Satisfaction with
Treatment, Satisfaction with Support, and Satisfaction with Overall Quality of Service, where n is the number of
respondents for each question. These scores are calculated from responses to the general satisfaction questions on the
LibQUAL+® survey, in which respondents rated their levels of general satisfaction on a scale from 1-9.
4.6 Information Literacy Outcomes Questions Summary for Student
MeanInformation Literacy Outcomes Questions nSD
The library helps me stay abreast of developments in my field(s) of interest. 6.00 286 1.59
The library aids my advancement in my academic discipline. 6.69 286 1.53
The library enables me to be more efficient in my academic pursuits. 6.81 286 1.61
The library helps me distinguish between trustworthy and untrustworthy
information.
6.08 286 1.86
The library provides me with the information skills I need in my work or study. 6.58 286 1.53
This table displays the mean score and standard deviation for each of the information literacy outcomes questions, where
n is the number of respondents for each question. These scores are calculated from responses to the information literacy
outcomes questions on the LibQUAL+® survey, in which respondents rated their levels of general satisfaction on a scale
from 1-9 with 1 being "strongly disagree" and 9 representing "strongly agree".
Language:
Institution Type:
Consortium:
User Group:
American English
Community College
LibQUAL Canada
Student
Language:
Institution Type:
Consortium:
User Group:
American English
Community College
LibQUAL Canada
Student
LibQUAL+® 2007 Survey Results - OC Page 49 of 82
4.7 Library Use Summary for Student
This chart shows a graphic representation of library use (both on the premises and electronically), as well as use of non-library information gateways such as Yahoo™ and Google™. Bars represent the frequency with which respondents report using these resources: Daily, Weekly, Monthly, Quarterly, or Never. The table below the chart displays the number and percentage of respondents who selected each option.
0
10
20
30
40
50
60
70
80
90
100
Daily
Weekly
Monthly
Quarterly
Never
How often do you use
resources on library
premises?
How often do you
access library resources
through a library Web
page?
How often do you use
Yahoo(TM),
Google(TM), or
non-library gateways for
information?
Frequency
P
erc
en
tag
e
Daily Weekly Monthly Quarterly Never n / %
How often do you use resources on library
premises?
116
40.56%
111
38.81%
42
14.69%
12
4.20%
5
1.75%
286
100.00%
How often do you access library resources
through a library Web page?
56
19.58%
127
44.41%
59
20.63%
23
8.04%
21
7.34%
286
100.00%
How often do you use Yahoo(TM),
Google(TM), or non-library gateways for
information?
197
68.88%
62
21.68%
23
8.04%
3
1.05%
1
0.35%
286
100.00%
Language:
Institution Type:
Consortium:
User Group:
American English
Community College
LibQUAL Canada
Student
Language:
Institution Type:
Consortium:
User Group:
American English
Community College
LibQUAL Canada
Student
Page 50 of 82 LibQUAL+® 2007 Survey Results - OC
5 Faculty Summary
5.1 Demographic Summary for Faculty
5.1.1 Population and Respondent Profiles for Faculty by Standard Discipline
The chart and table below show a breakdown of survey respondents by discipline, based on user responses to the demographic questions and the demographic data provided by institutions in the online Representativeness section.
This section shows survey respondents broken down based on the LibQUAL+® standard discipline categories. The chart
maps percentage of respondents for each discipline in red. Population percentages for each discipline are mapped in blue.
The table shows the number and percentage for each discipline, for the general population (N) and for survey respondents
(n).
0
4
8
12
16
20
24
Agriculture / Environmental Studies
Applied Technologies & Trades
Architecture
Business
Communications / Journalism
Education
Engineering / Computer Science
General Studies
Health Sciences
Humanities
Law
Military / Naval Science
Other
Performing & Fine Arts
Personal Improvement / Leisure
Science / Math
Social Sciences / Psychology
Undecided
D
iscip
lin
e
Percentage
Population Profile by Discipline
Respondent Profile by Discipline
Language:
Institution Type:
Consortium:
User Group:
American English
Community College
LibQUAL Canada
Faculty
Language:
Institution Type:
Consortium:
User Group:
American English
Community College
LibQUAL Canada
Faculty
RHTyner
Text Box
The remainder of this page is intentionally blank.
Personal Improvement / Leisure 0 0.00% 0 0.00% 0.00%
Science / Math 10 20.83% 52 12.94% -7.90%
Social Sciences / Psychology 0 0.00% 0 0.00% 0.00%
Undecided 0 0.00% 0 0.00% 0.00%
Total: 100.00% 402 48 100.00% 0.00%
Language:
Institution Type:
Consortium:
User Group:
American English
Community College
LibQUAL Canada
Faculty
Language:
Institution Type:
Consortium:
User Group:
American English
Community College
LibQUAL Canada
Faculty
RHTyner
Text Box
Page 51 is intentionally blank.
RHTyner
Sticky Note
MigrationConfirmed set by RHTyner
RHTyner
Sticky Note
Accepted set by RHTyner
Page 52 of 82 LibQUAL+® 2007 Survey Results - OC
5.1.2 Population and Respondent Profiles for Faculty by Customized Discipline
The chart and table below show a breakdown of survey respondents by discipline, based on user responses to the demographic questions and the demographic data provided by institutions in the online Representativeness section.
This section shows survey respondents broken down based on the customized discipline categories supplied by the participating library. The chart maps percentage of respondents for each discipline in red. Population percentages for each discipline are mapped in blue. The table shows the number and percentage for each discipline, for the general population (N) and for survey respondents (n).
0
4
8
12
16
20
24
Adult Academic and Career Prep
Adult Special Education
Arts
Business Administration
Commercial Aviation
Continuing Studies
Engineering Technology
English as a Second Language (ESL)
Health & Social Development
Office Administration
Science
Trades and Apprenticehip
Unapplicable
Undecided
D
iscip
lin
e
Percentage
Population Profile by Discipline
Respondent Profile by Discipline
Language:
Institution Type:
Consortium:
User Group:
American English
Community College
LibQUAL Canada
Faculty
Language:
Institution Type:
Consortium:
User Group:
American English
Community College
LibQUAL Canada
Faculty
LibQUAL+® 2007 Survey Results - OC Page 53 of 82
Respondents
nDiscipline
Respondents
%
Population
N
Population
% %N - %n
Adult Academic and Career Prep 7 14.58% 46 11.44% -3.14%
Adult Special Education 0 0.00% 6 1.49% 1.49%
Arts 9 18.75% 68 16.92% -1.83%
Business Administration 8 16.67% 52 12.94% -3.73%
Commercial Aviation 1 2.08% 0 0.00% -2.08%
Continuing Studies 0 0.00% 29 7.21% 7.21%
Engineering Technology 4 8.33% 24 5.97% -2.36%
English as a Second Language (ESL) 2 4.17% 9 2.24% -1.93%
Health & Social Development 4 8.33% 34 8.46% 0.12%
Office Administration 0 0.00% 8 1.99% 1.99%
Science 10 20.83% 52 12.94% -7.90%
Trades and Apprenticehip 1 2.08% 54 13.43% 11.35%
Unapplicable 2 4.17% 20 4.98% 0.81%
Undecided 0 0.00% 0 0.00% 0.00%
Total: 100.00% 402 48 100.00% 0.00%
Language:
Institution Type:
Consortium:
User Group:
American English
Community College
LibQUAL Canada
Faculty
Language:
Institution Type:
Consortium:
User Group:
American English
Community College
LibQUAL Canada
Faculty
Page 54 of 82 LibQUAL+® 2007 Survey Results - OC
5.1.3 Respondent Profile for Faculty by Age
This table shows a breakdown of survey respondents by age; both the number of respondents (n) and the percentage of the total number of respondents represented by each age group are displayed.
Respondents
%
Respondents
nAge
Under 18 0 0.00%
18 - 22 0 0.00%
23 - 30 2 4.26%
31 - 45 18 38.30%
46 - 65 27 57.45%
Over 65 0 0.00%
Total: 100.00% 47
5.1.4 Respondent Profile for Faculty by Sex
The table below shows a breakdown of survey respondents by sex, based on user responses to the demographic questions and the demographic data provided by institutions in the online Representativeness section*. The number and percentage for each sex are given for the general population and for survey respondents.
*Note: Participating institutions were not required to complete the Representativeness section. When population data is missing or incomplete, it is because this data was not provided.
Respondents
%
Respondents
nSex
Male 23 48.94%
Female 24 51.06%
Total: 100.00% 47
Language:
Institution Type:
Consortium:
User Group:
American English
Community College
LibQUAL Canada
Faculty
Language:
Institution Type:
Consortium:
User Group:
American English
Community College
LibQUAL Canada
Faculty
LibQUAL+® 2007 Survey Results - OC Page 55 of 82
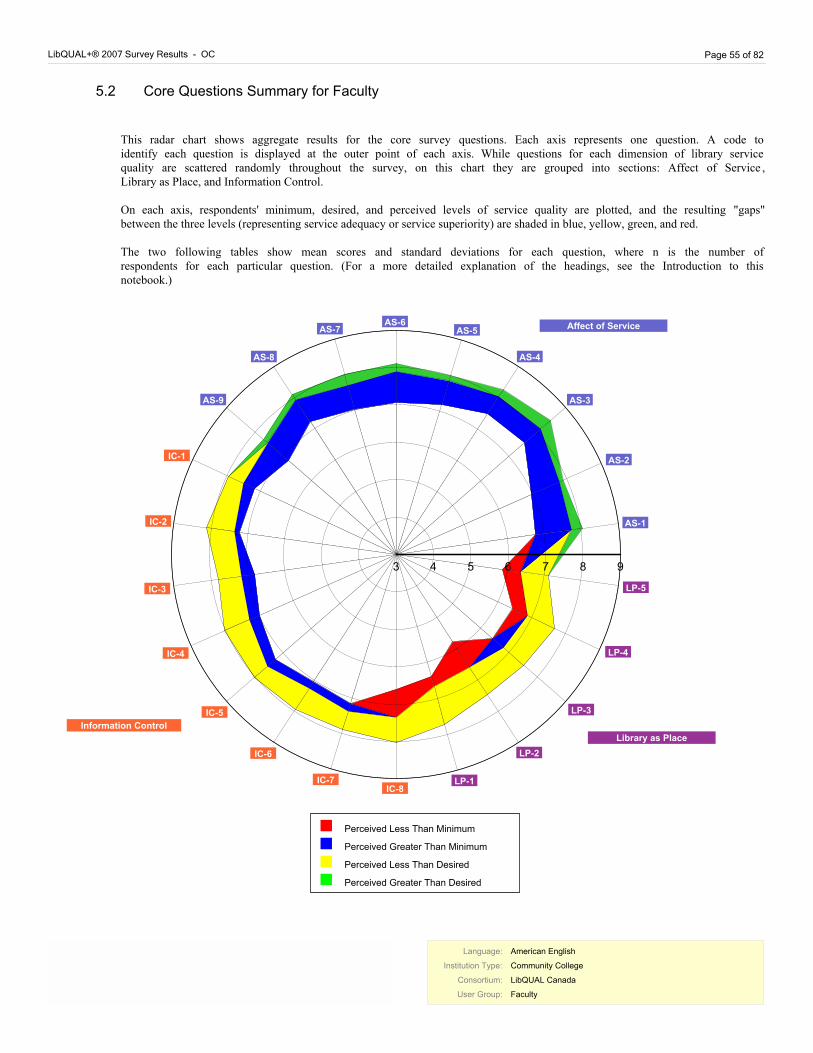
5.2 Core Questions Summary for Faculty
This radar chart shows aggregate results for the core survey questions. Each axis represents one question. A code to identify each question is displayed at the outer point of each axis. While questions for each dimension of library service quality are scattered randomly throughout the survey, on this chart they are grouped into sections: Affect of Service , Library as Place, and Information Control.
On each axis, respondents' minimum, desired, and perceived levels of service quality are plotted, and the resulting "gaps" between the three levels (representing service adequacy or service superiority) are shaded in blue, yellow, green, and red.
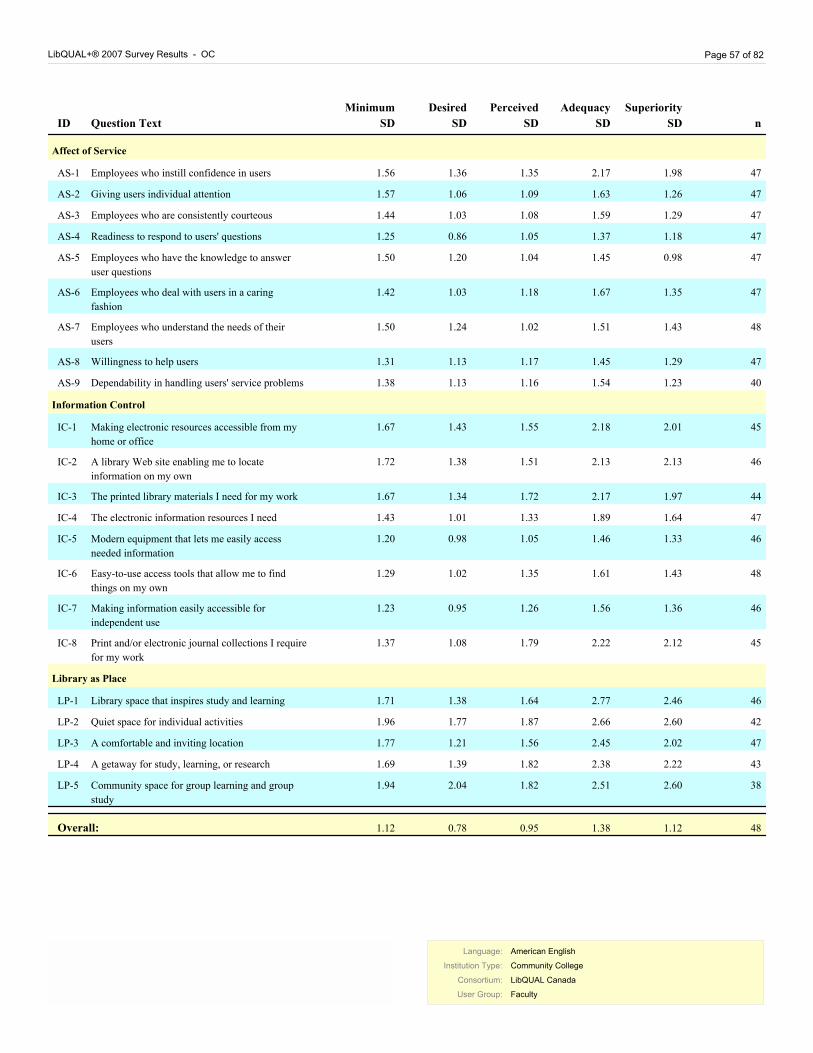
The two following tables show mean scores and standard deviations for each question, where n is the number of respondents for each particular question. (For a more detailed explanation of the headings, see the Introduction to this notebook.)
3
4
5
6
7
8
9
AS-1
AS-2
AS-3
AS-4
AS-5AS-6
AS-7
AS-8
AS-9
IC-1
IC-2
IC-3
IC-4
IC-5
IC-6
IC-7IC-8
LP-1
LP-2
LP-3
LP-4
LP-5
Affect of Service
Information Control
Library as Place
Perceived Less Than Minimum
Perceived Greater Than Minimum
Perceived Less Than Desired
Perceived Greater Than Desired
Language:
Institution Type:
Consortium:
User Group:
American English
Community College
LibQUAL Canada
Faculty
Language:
Institution Type:
Consortium:
User Group:
American English
Community College
LibQUAL Canada
Faculty
Page 56 of 82 LibQUAL+® 2007 Survey Results - OC
Adequacy
Mean
Perceived
Mean
Desired
MeanQuestion TextID
Minimum
Mean n
Superiority
Mean
Affect of Service
Employees who instill confidence in users 6.77 7.74 8.04 1.28AS-1 47 0.30
Employees who are consistently courteousAS-3 47 1.44 1.29 1.59 1.08 1.03
Readiness to respond to users' questionsAS-4 47 1.25 1.18 1.37 1.05 0.86
Employees who have the knowledge to answer
user questions
AS-5 47 1.50 0.98 1.45 1.04 1.20
Employees who deal with users in a caring
fashion
AS-6 47 1.42 1.35 1.67 1.18 1.03
Employees who understand the needs of their
users
AS-7 48 1.50 1.43 1.51 1.02 1.24
Willingness to help usersAS-8 47 1.31 1.29 1.45 1.17 1.13
Dependability in handling users' service problemsAS-9 40 1.38 1.23 1.54 1.16 1.13
Information Control
Making electronic resources accessible from my
home or office
IC-1 45 1.67 2.01 2.18 1.55 1.43
A library Web site enabling me to locate
information on my own
IC-2 46 1.72 2.13 2.13 1.51 1.38
The printed library materials I need for my workIC-3 44 1.67 1.97 2.17 1.72 1.34
The electronic information resources I needIC-4 47 1.43 1.64 1.89 1.33 1.01
Modern equipment that lets me easily access
needed information
IC-5 46 1.20 1.33 1.46 1.05 0.98
Easy-to-use access tools that allow me to find
things on my own
IC-6 48 1.29 1.43 1.61 1.35 1.02
Making information easily accessible for
independent use
IC-7 46 1.23 1.36 1.56 1.26 0.95
Print and/or electronic journal collections I require
for my work
IC-8 45 1.37 2.12 2.22 1.79 1.08
Library as Place
Library space that inspires study and learningLP-1 46 1.71 2.46 2.77 1.64 1.38
Quiet space for individual activitiesLP-2 42 1.96 2.60 2.66 1.87 1.77
A comfortable and inviting locationLP-3 47 1.77 2.02 2.45 1.56 1.21
A getaway for study, learning, or researchLP-4 43 1.69 2.22 2.38 1.82 1.39
Community space for group learning and group
study
LP-5 38 1.94 2.60 2.51 1.82 2.04
48Overall: 1.12 1.12 1.38 0.95 0.78
Language:
Institution Type:
Consortium:
User Group:
American English
Community College
LibQUAL Canada
Faculty
Language:
Institution Type:
Consortium:
User Group:
American English
Community College
LibQUAL Canada
Faculty
Page 58 of 82 LibQUAL+® 2007 Survey Results - OC
5.3 Core Question Dimensions Summary for Faculty
On the chart below, scores for each dimension of library service quality have been plotted graphically. The exterior bars represent the range of minimum to desired mean scores for each dimension. The interior bars represent the range of minimum to perceived mean scores (the service adequacy gap) for each dimension of library service quality.
4
5
6
7
8
9
Information
Control
Affect of
Service
Library as
Place
Range of Minimum to Perceived ("Adequacy Gap")
Range of Minimum to Desired
Me
an
Dimension
Overall
Language:
Institution Type:
Consortium:
User Group:
American English
Community College
LibQUAL Canada
Faculty
Language:
Institution Type:
Consortium:
User Group:
American English
Community College
LibQUAL Canada
Faculty
LibQUAL+® 2007 Survey Results - OC Page 59 of 82
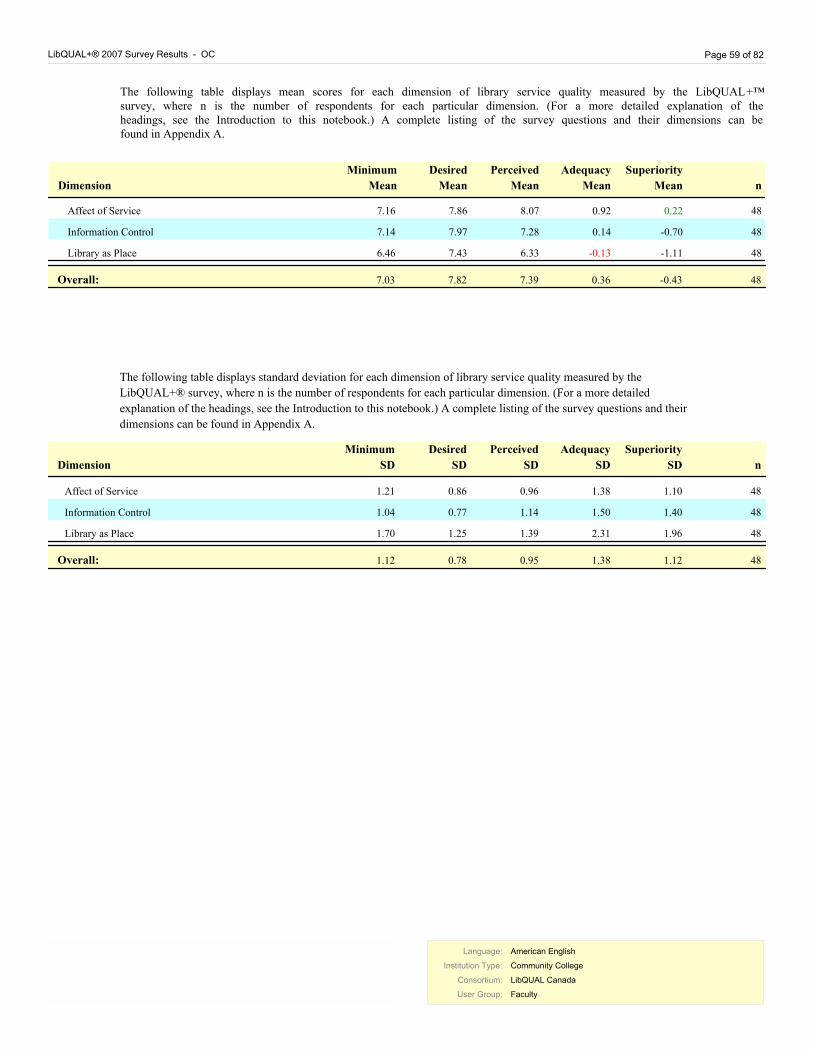
The following table displays mean scores for each dimension of library service quality measured by the LibQUAL+™ survey, where n is the number of respondents for each particular dimension. (For a more detailed explanation of the headings, see the Introduction to this notebook.) A complete listing of the survey questions and their dimensions can be found in Appendix A.
Adequacy
Mean
Perceived
Mean
Desired
MeanDimension
Minimum
Mean n
Superiority
Mean
Affect of Service 7.16 7.86 8.07 0.92 48 0.22
Information Control 7.14 7.97 7.28 0.14 48-0.70
Library as Place 6.46 7.43 6.33 -0.13 48-1.11
7.03 7.82 7.39 0.36 48-0.43Overall:
Adequacy
SD
Perceived
SD
Desired
SDDimension
Minimum
SD n
Superiority
SD
Affect of Service 48 1.21 1.10 1.38 0.96 0.86
Information Control 48 1.04 1.40 1.50 1.14 0.77
Library as Place 48 1.70 1.96 2.31 1.39 1.25
The following table displays standard deviation for each dimension of library service quality measured by the
LibQUAL+® survey, where n is the number of respondents for each particular dimension. (For a more detailed
explanation of the headings, see the Introduction to this notebook.) A complete listing of the survey questions and their
dimensions can be found in Appendix A.
48Overall: 1.12 1.12 1.38 0.95 0.78
Language:
Institution Type:
Consortium:
User Group:
American English
Community College
LibQUAL Canada
Faculty
Language:
Institution Type:
Consortium:
User Group:
American English
Community College
LibQUAL Canada
Faculty
Page 60 of 82 LibQUAL+® 2007 Survey Results - OC
5.4 Local Questions Summary for Faculty
Adequacy
Mean
Perceived
Mean
Desired
MeanQuestion Text
Minimum
Mean n
Superiority
Mean
Teaching me how to access, evaluate, and use
information
6.49 7.51 7.42 0.93 45-0.09
Making me aware of library resources and services 6.23 7.21 6.94 0.71 48-0.27
Ability to navigate library Web pages easily 7.11 7.93 6.76 -0.35 46-1.17
Adequate hours of service 7.24 7.89 7.58 0.33 45-0.31
Ease and timeliness in getting materials from other
libraries
6.76 7.86 7.60 0.83 42-0.26
This table shows mean scores for each of the local questions added by the individual library or consortium, where n is the number of respondents for each particular question. (For a more detailed explanation of the headings, see the Introduction to this notebook.)
Adequacy
SD
Perceived
SD
Desired
SDQuestion Text
Minimum
SD n
Superiority
SD
Teaching me how to access, evaluate, and use
information
45 1.65 1.62 1.86 1.37 1.27
Making me aware of library resources and services 48 1.85 1.89 2.11 1.73 1.54
Ability to navigate library Web pages easily 46 1.37 2.25 2.19 1.75 1.36
Adequate hours of service 45 1.51 1.82 2.15 1.50 1.23
Ease and timeliness in getting materials from other
libraries
42 1.71 1.52 1.71 1.38 1.37
This table displays the standard deviations for each of the local questions added by the individual library or consortium , where n is the number of respondents for each particular question. (For a more detailed explanation of the headings, see the Introduction to this notebook.)
Language:
Institution Type:
Consortium:
User Group:
American English
Community College
LibQUAL Canada
Faculty
Language:
Institution Type:
Consortium:
User Group:
American English
Community College
LibQUAL Canada
Faculty
LibQUAL+® 2007 Survey Results - OC Page 61 of 82
5.5 General Satisfaction Questions Summary for Faculty
MeanSatisfaction Question nSD
In general, I am satisfied with the way in which I am treated at the library. 8.40 48 1.16
In general, I am satisfied with library support for my learning, research, and/or
teaching needs.
7.56 48 1.58
How would you rate the overall quality of the service provided by the library? 7.65 48 1.44
This table displays the mean score and standard deviation for each of the general satisfaction questions: Satisfaction with
Treatment, Satisfaction with Support, and Satisfaction with Overall Quality of Service, where n is the number of
respondents for each question. These scores are calculated from responses to the general satisfaction questions on the
LibQUAL+® survey, in which respondents rated their levels of general satisfaction on a scale from 1-9.
5.6 Information Literacy Outcomes Questions Summary for Faculty
MeanInformation Literacy Outcomes Questions nSD
The library helps me stay abreast of developments in my field(s) of interest. 6.46 48 1.79
The library aids my advancement in my academic discipline. 6.69 48 1.76
The library enables me to be more efficient in my academic pursuits. 6.81 48 1.82
The library helps me distinguish between trustworthy and untrustworthy
information.
5.98 48 1.68
The library provides me with the information skills I need in my work or study. 6.38 48 1.82
This table displays the mean score and standard deviation for each of the information literacy outcomes questions, where
n is the number of respondents for each question. These scores are calculated from responses to the information literacy
outcomes questions on the LibQUAL+® survey, in which respondents rated their levels of general satisfaction on a scale
from 1-9 with 1 being "strongly disagree" and 9 representing "strongly agree".
Language:
Institution Type:
Consortium:
User Group:
American English
Community College
LibQUAL Canada
Faculty
Language:
Institution Type:
Consortium:
User Group:
American English
Community College
LibQUAL Canada
Faculty
Page 62 of 82 LibQUAL+® 2007 Survey Results - OC
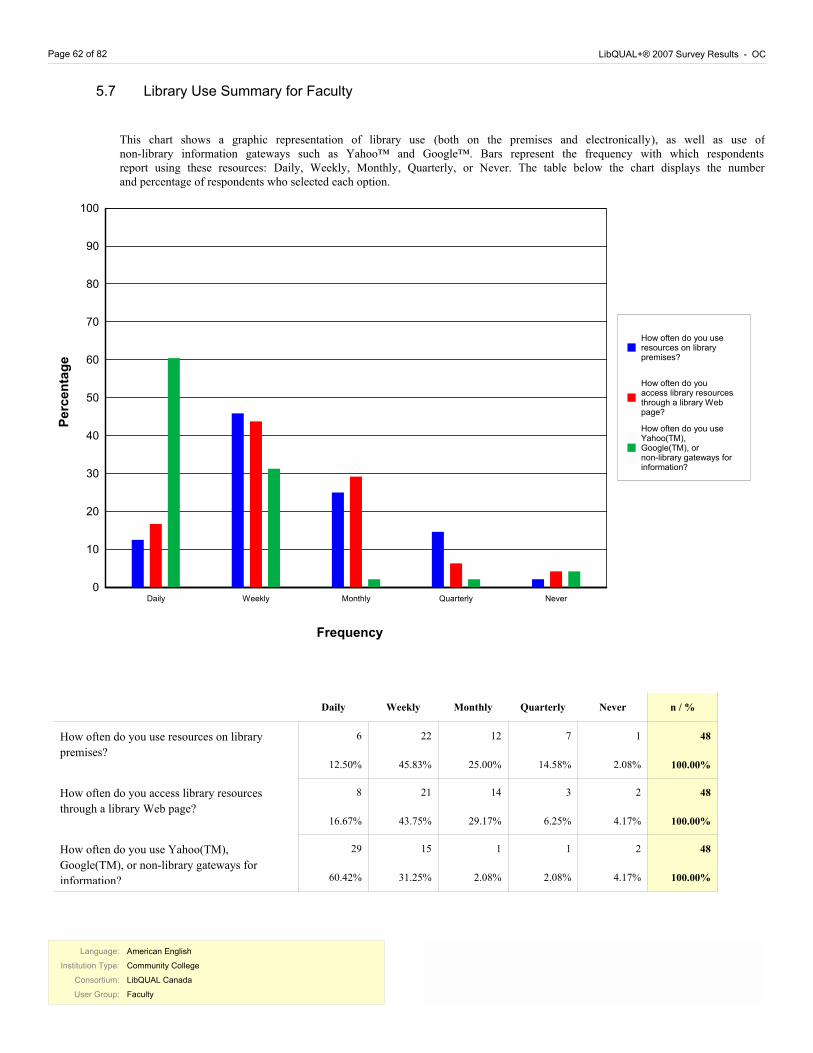
5.7 Library Use Summary for Faculty
This chart shows a graphic representation of library use (both on the premises and electronically), as well as use of non-library information gateways such as Yahoo™ and Google™. Bars represent the frequency with which respondents report using these resources: Daily, Weekly, Monthly, Quarterly, or Never. The table below the chart displays the number and percentage of respondents who selected each option.
0
10
20
30
40
50
60
70
80
90
100
Daily
Weekly
Monthly
Quarterly
Never
How often do you use
resources on library
premises?
How often do you
access library resources
through a library Web
page?
How often do you use
Yahoo(TM),
Google(TM), or
non-library gateways for
information?
Frequency
P
erc
en
tag
e
Daily Weekly Monthly Quarterly Never n / %
How often do you use resources on library
premises?
6
12.50%
22
45.83%
12
25.00%
7
14.58%
1
2.08%
48
100.00%
How often do you access library resources
through a library Web page?
8
16.67%
21
43.75%
14
29.17%
3
6.25%
2
4.17%
48
100.00%
How often do you use Yahoo(TM),
Google(TM), or non-library gateways for
information?
29
60.42%
15
31.25%
1
2.08%
1
2.08%
2
4.17%
48
100.00%
Language:
Institution Type:
Consortium:
User Group:
American English
Community College
LibQUAL Canada
Faculty
Language:
Institution Type:
Consortium:
User Group:
American English
Community College
LibQUAL Canada
Faculty
LibQUAL+® 2007 Survey Results - OC Page 63 of 82
6 Library Staff Summary
6.1 Demographic Summary for Library Staff
6.1.1 Respondent Profile for Library Staff by Age
This table shows a breakdown of survey respondents by age; both the number of respondents (n) and the percentage of the total number of respondents represented by each age group are displayed.
Respondents
%
Respondents
nAge
Under 18 0 0.00%
18 - 22 0 0.00%
23 - 30 0 0.00%
31 - 45 2 22.22%
46 - 65 7 77.78%
Over 65 0 0.00%
Total: 100.00% 9
6.1.2 Respondent Profile for Library Staff by Sex
The table below shows a breakdown of survey respondents by sex, based on user responses to the demographic questions and the demographic data provided by institutions in the online Representativeness section*. The number and percentage for each sex are given for the general population and for survey respondents.
*Note: Participating institutions were not required to complete the Representativeness section. When population data is missing or incomplete, it is because this data was not provided.
Respondents
%
Respondents
nSex
Male 3 33.33%
Female 6 66.67%
Total: 100.00% 9
Language:
Institution Type:
Consortium:
User Group:
American English
Community College
LibQUAL Canada
Library Staff
Language:
Institution Type:
Consortium:
User Group:
American English
Community College
LibQUAL Canada
Library Staff
Page 64 of 82 LibQUAL+® 2007 Survey Results - OC
6.2 Core Questions Summary for Library Staff
This radar chart shows aggregate results for the core survey questions. Each axis represents one question. A code to identify each question is displayed at the outer point of each axis. While questions for each dimension of library service quality are scattered randomly throughout the survey, on this chart they are grouped into sections: Affect of Service , Library as Place, and Information Control.
On each axis, respondents' minimum, desired, and perceived levels of service quality are plotted, and the resulting "gaps" between the three levels (representing service adequacy or service superiority) are shaded in blue, yellow, green, and red.
The two following tables show mean scores and standard deviations for each question, where n is the number of respondents for each particular question. (For a more detailed explanation of the headings, see the Introduction to this notebook.)
3
4
5
6
7
8
9
AS-1
AS-2
AS-3
AS-4
AS-5AS-6
AS-7
AS-8
AS-9
IC-1
IC-2
IC-3
IC-4
IC-5
IC-6
IC-7IC-8
LP-1
LP-2
LP-3
LP-4
LP-5
Affect of Service
Information Control
Library as Place
Perceived Less Than Minimum
Perceived Greater Than Minimum
Perceived Less Than Desired
Perceived Greater Than Desired
Language:
Institution Type:
Consortium:
User Group:
American English
Community College
LibQUAL Canada
Library Staff
Language:
Institution Type:
Consortium:
User Group:
American English
Community College
LibQUAL Canada
Library Staff
LibQUAL+® 2007 Survey Results - OC Page 65 of 82
Adequacy
Mean
Perceived
Mean
Desired
MeanQuestion TextID
Minimum
Mean n
Superiority
Mean
Affect of Service
Employees who instill confidence in users 6.11 7.89 7.56 1.44AS-1 9-0.33
Employees who are consistently courteousAS-3 9 1.83 0.88 1.54 0.87 0.73
Readiness to respond to users' questionsAS-4 9 1.74 1.00 1.41 0.78 1.36
Employees who have the knowledge to answer
user questions
AS-5 9 2.00 0.88 1.00 1.22 1.36
Employees who deal with users in a caring
fashion
AS-6 9 1.58 1.05 1.32 0.87 1.05
Employees who understand the needs of their
users
AS-7 9 1.67 1.22 1.30 1.20 1.39
Willingness to help usersAS-8 9 1.50 0.83 0.88 0.83 0.73
Dependability in handling users' service problemsAS-9 9 1.86 1.13 1.12 1.01 1.22
Information Control
Making electronic resources accessible from my
home or office
IC-1 9 1.59 1.09 1.90 1.22 1.17
A library Web site enabling me to locate
information on my own
IC-2 9 1.41 0.87 2.05 1.24 0.97
The printed library materials I need for my workIC-3 9 1.56 1.59 2.07 1.58 0.78
The electronic information resources I needIC-4 9 1.73 1.22 1.66 1.32 0.87
Modern equipment that lets me easily access
needed information
IC-5 9 1.42 1.17 1.30 0.87 0.73
Easy-to-use access tools that allow me to find
things on my own
IC-6 9 1.72 0.67 1.66 0.73 0.71
Making information easily accessible for
independent use
IC-7 9 1.56 0.87 1.22 0.88 0.73
Print and/or electronic journal collections I require
for my work
IC-8 9 1.56 1.09 1.42 1.41 0.73
Library as Place
Library space that inspires study and learningLP-1 9 1.24 1.90 1.58 1.92 1.27
Quiet space for individual activitiesLP-2 9 1.48 2.92 2.92 2.24 0.87
A comfortable and inviting locationLP-3 9 1.36 1.94 1.94 1.72 1.05
A getaway for study, learning, or researchLP-4 8 1.69 1.19 1.31 1.51 2.00
Community space for group learning and group
study
LP-5 9 2.60 3.67 2.98 2.12 2.96
9Overall: 1.41 0.83 0.99 0.77 0.91
Language:
Institution Type:
Consortium:
User Group:
American English
Community College
LibQUAL Canada
Library Staff
Language:
Institution Type:
Consortium:
User Group:
American English
Community College
LibQUAL Canada
Library Staff
LibQUAL+® 2007 Survey Results - OC Page 67 of 82
6.3 Core Question Dimensions Summary for Library Staff
On the chart below, scores for each dimension of library service quality have been plotted graphically. The exterior bars represent the range of minimum to desired mean scores for each dimension. The interior bars represent the range of minimum to perceived mean scores (the service adequacy gap) for each dimension of library service quality.
4
5
6
7
8
9
Information
Control
Affect of
Service
Library as
Place
Range of Minimum to Perceived ("Adequacy Gap")
Range of Minimum to Desired
Me
an
Dimension
Overall
Language:
Institution Type:
Consortium:
User Group:
American English
Community College
LibQUAL Canada
Library Staff
Language:
Institution Type:
Consortium:
User Group:
American English
Community College
LibQUAL Canada
Library Staff
Page 68 of 82 LibQUAL+® 2007 Survey Results - OC
The following table displays mean scores for each dimension of library service quality measured by the LibQUAL+™ survey, where n is the number of respondents for each particular dimension. (For a more detailed explanation of the headings, see the Introduction to this notebook.) A complete listing of the survey questions and their dimensions can be found in Appendix A.
Adequacy
Mean
Perceived
Mean
Desired
MeanDimension
Minimum
Mean n
Superiority
Mean
Affect of Service 6.42 8.09 7.88 1.46 9-0.21
Information Control 6.50 8.28 7.11 0.61 9-1.17
Library as Place 6.12 7.70 6.04 -0.08 9-1.66
6.38 8.07 7.20 0.82 9-0.87Overall:
Adequacy
SD
Perceived
SD
Desired
SDDimension
Minimum
SD n
Superiority
SD
Affect of Service 9 1.58 0.89 0.94 0.83 1.09
Information Control 9 1.38 0.68 1.17 0.75 0.71
Library as Place 9 1.37 1.89 1.78 1.79 1.21
The following table displays standard deviation for each dimension of library service quality measured by the
LibQUAL+® survey, where n is the number of respondents for each particular dimension. (For a more detailed
explanation of the headings, see the Introduction to this notebook.) A complete listing of the survey questions and their
dimensions can be found in Appendix A.
9Overall: 1.41 0.83 0.99 0.77 0.91
Language:
Institution Type:
Consortium:
User Group:
American English
Community College
LibQUAL Canada
Library Staff
Language:
Institution Type:
Consortium:
User Group:
American English
Community College
LibQUAL Canada
Library Staff
LibQUAL+® 2007 Survey Results - OC Page 69 of 82
6.4 Local Questions Summary for Library Staff
Adequacy
Mean
Perceived
Mean
Desired
MeanQuestion Text
Minimum
Mean n
Superiority
Mean
Teaching me how to access, evaluate, and use
information
5.67 7.89 7.56 1.89 9-0.33
Making me aware of library resources and services 5.78 7.67 6.89 1.11 9-0.78
Ability to navigate library Web pages easily 6.44 8.44 6.67 0.22 9-1.78
Adequate hours of service 6.44 8.11 7.67 1.22 9-0.44
Ease and timeliness in getting materials from other
libraries
6.11 7.78 7.22 1.11 9-0.56
This table shows mean scores for each of the local questions added by the individual library or consortium, where n is the number of respondents for each particular question. (For a more detailed explanation of the headings, see the Introduction to this notebook.)
Adequacy
SD
Perceived
SD
Desired
SDQuestion Text
Minimum
SD n
Superiority
SD
Teaching me how to access, evaluate, and use
information
9 1.80 1.73 1.90 1.01 1.36
Making me aware of library resources and services 9 1.86 2.05 1.62 1.54 1.66
Ability to navigate library Web pages easily 9 1.59 0.83 1.39 0.71 0.73
Adequate hours of service 9 1.42 1.24 1.30 0.71 1.36
Ease and timeliness in getting materials from other
libraries
9 1.90 1.13 1.17 1.09 1.39
This table displays the standard deviations for each of the local questions added by the individual library or consortium , where n is the number of respondents for each particular question. (For a more detailed explanation of the headings, see the Introduction to this notebook.)
Language:
Institution Type:
Consortium:
User Group:
American English
Community College
LibQUAL Canada
Library Staff
Language:
Institution Type:
Consortium:
User Group:
American English
Community College
LibQUAL Canada
Library Staff
Page 70 of 82 LibQUAL+® 2007 Survey Results - OC
6.5 General Satisfaction Questions Summary for Library Staff
MeanSatisfaction Question nSD
In general, I am satisfied with the way in which I am treated at the library. 7.67 9 1.22
In general, I am satisfied with library support for my learning, research, and/or
teaching needs.
7.44 9 1.33
How would you rate the overall quality of the service provided by the library? 7.33 9 1.00
This table displays the mean score and standard deviation for each of the general satisfaction questions: Satisfaction with
Treatment, Satisfaction with Support, and Satisfaction with Overall Quality of Service, where n is the number of
respondents for each question. These scores are calculated from responses to the general satisfaction questions on the
LibQUAL+® survey, in which respondents rated their levels of general satisfaction on a scale from 1-9.
6.6 Information Literacy Outcomes Questions Summary for Library Staff
MeanInformation Literacy Outcomes Questions nSD
The library helps me stay abreast of developments in my field(s) of interest. 6.11 9 1.90
The library aids my advancement in my academic discipline. 6.67 9 1.50
The library enables me to be more efficient in my academic pursuits. 7.00 9 1.12
The library helps me distinguish between trustworthy and untrustworthy
information.
6.33 9 1.58
The library provides me with the information skills I need in my work or study. 6.56 9 1.01
This table displays the mean score and standard deviation for each of the information literacy outcomes questions, where
n is the number of respondents for each question. These scores are calculated from responses to the information literacy
outcomes questions on the LibQUAL+® survey, in which respondents rated their levels of general satisfaction on a scale
from 1-9 with 1 being "strongly disagree" and 9 representing "strongly agree".
Language:
Institution Type:
Consortium:
User Group:
American English
Community College
LibQUAL Canada
Library Staff
Language:
Institution Type:
Consortium:
User Group:
American English
Community College
LibQUAL Canada
Library Staff
LibQUAL+® 2007 Survey Results - OC Page 71 of 82
6.7 Library Use Summary for Library Staff
This chart shows a graphic representation of library use (both on the premises and electronically), as well as use of non-library information gateways such as Yahoo™ and Google™. Bars represent the frequency with which respondents report using these resources: Daily, Weekly, Monthly, Quarterly, or Never. The table below the chart displays the number and percentage of respondents who selected each option.
0
10
20
30
40
50
60
70
80
90
100
Daily
Weekly
Monthly
Quarterly
Never
How often do you use
resources on library
premises?
How often do you
access library resources
through a library Web
page?
How often do you use
Yahoo(TM),
Google(TM), or
non-library gateways for
information?
Frequency
P
erc
en
tag
e
Daily Weekly Monthly Quarterly Never n / %
How often do you use resources on library
premises?
6
66.67%
3
33.33%
0
0.00%
0
0.00%
0
0.00%
9
100.00%
How often do you access library resources
through a library Web page?
6
66.67%
2
22.22%
1
11.11%
0
0.00%
0
0.00%
9
100.00%
How often do you use Yahoo(TM),
Google(TM), or non-library gateways for
information?
7
77.78%
1
11.11%
1
11.11%
0
0.00%
0
0.00%
9
100.00%
Language:
Institution Type:
Consortium:
User Group:
American English
Community College
LibQUAL Canada
Library Staff
Language:
Institution Type:
Consortium:
User Group:
American English
Community College
LibQUAL Canada
Library Staff
Page 72 of 82 LibQUAL+® 2007 Survey Results - OC
7 Staff Summary
7.1 Demographic Summary for Staff
7.1.1 Respondent Profile for Staff by Age
This table shows a breakdown of survey respondents by age; both the number of respondents (n) and the percentage of the total number of respondents represented by each age group are displayed.
Respondents
%
Respondents
nAge
Under 18 0 0.00%
18 - 22 0 0.00%
23 - 30 0 0.00%
31 - 45 5 41.67%
46 - 65 7 58.33%
Over 65 0 0.00%
Total: 100.00% 12
7.1.2 Respondent Profile for Staff by Sex
The table below shows a breakdown of survey respondents by sex, based on user responses to the demographic questions and the demographic data provided by institutions in the online Representativeness section*. The number and percentage for each sex are given for the general population and for survey respondents.
*Note: Participating institutions were not required to complete the Representativeness section. When population data is missing or incomplete, it is because this data was not provided.
Respondents
%
Respondents
nSex
Male 1 8.33%
Female 11 91.67%
Total: 100.00% 12
Language:
Institution Type:
Consortium:
User Group:
American English
Community College
LibQUAL Canada
Staff
Language:
Institution Type:
Consortium:
User Group:
American English
Community College
LibQUAL Canada
Staff
LibQUAL+® 2007 Survey Results - OC Page 73 of 82
7.2 Core Questions Summary for Staff
This radar chart shows aggregate results for the core survey questions. Each axis represents one question. A code to identify each question is displayed at the outer point of each axis. While questions for each dimension of library service quality are scattered randomly throughout the survey, on this chart they are grouped into sections: Affect of Service , Library as Place, and Information Control.
On each axis, respondents' minimum, desired, and perceived levels of service quality are plotted, and the resulting "gaps" between the three levels (representing service adequacy or service superiority) are shaded in blue, yellow, green, and red.
The two following tables show mean scores and standard deviations for each question, where n is the number of respondents for each particular question. (For a more detailed explanation of the headings, see the Introduction to this notebook.)
3
4
5
6
7
8
9
AS-1
AS-2
AS-3
AS-4
AS-5AS-6
AS-7
AS-8
AS-9
IC-1
IC-2
IC-3
IC-4
IC-5
IC-6
IC-7IC-8
LP-1
LP-2
LP-3
LP-4
LP-5
Affect of Service
Information Control
Library as Place
Perceived Less Than Minimum
Perceived Greater Than Minimum
Perceived Less Than Desired
Perceived Greater Than Desired
Language:
Institution Type:
Consortium:
User Group:
American English
Community College
LibQUAL Canada
Staff
Language:
Institution Type:
Consortium:
User Group:
American English
Community College
LibQUAL Canada
Staff
Page 74 of 82 LibQUAL+® 2007 Survey Results - OC
Adequacy
Mean
Perceived
Mean
Desired
MeanQuestion TextID
Minimum
Mean n
Superiority
Mean
Affect of Service
Employees who instill confidence in users 7.08 7.83 8.17 1.08AS-1 12 0.33
Employees who are consistently courteousAS-3 12 1.13 0.90 1.14 0.62 0.78
Readiness to respond to users' questionsAS-4 12 1.15 0.79 1.22 0.67 0.72
Employees who have the knowledge to answer
user questions
AS-5 12 1.17 1.38 1.30 1.03 0.67
Employees who deal with users in a caring
fashion
AS-6 12 1.38 0.83 1.00 0.79 0.87
Employees who understand the needs of their
users
AS-7 12 1.50 0.83 1.22 0.79 0.87
Willingness to help usersAS-8 12 1.27 1.00 1.23 0.90 0.67
Dependability in handling users' service problemsAS-9 11 0.92 1.27 1.22 0.90 0.77
Information Control
Making electronic resources accessible from my
home or office
IC-1 11 1.38 2.14 1.73 1.92 1.74
A library Web site enabling me to locate
information on my own
IC-2 12 1.29 2.15 2.38 1.62 1.16
The printed library materials I need for my workIC-3 11 1.08 1.26 1.19 1.51 1.04
The electronic information resources I needIC-4 11 1.30 1.74 1.91 1.44 1.42
Modern equipment that lets me easily access
needed information
IC-5 11 1.62 1.41 1.84 1.49 0.90
Easy-to-use access tools that allow me to find
things on my own
IC-6 12 1.04 1.99 2.14 1.86 0.79
Making information easily accessible for
independent use
IC-7 12 1.15 1.17 1.16 1.06 0.62
Print and/or electronic journal collections I require
for my work
IC-8 9 1.58 1.94 2.52 2.01 1.36
Library as Place
Library space that inspires study and learningLP-1 11 1.57 1.21 1.30 1.29 1.22
Quiet space for individual activitiesLP-2 11 1.19 2.02 2.27 1.58 0.92
A comfortable and inviting locationLP-3 12 1.08 1.61 1.22 1.56 0.95
A getaway for study, learning, or researchLP-4 11 1.25 1.26 1.38 1.35 1.01
Community space for group learning and group
study
LP-5 11 1.97 1.36 1.69 1.67 1.29
12Overall: 1.06 1.02 1.19 0.93 0.68
Language:
Institution Type:
Consortium:
User Group:
American English
Community College
LibQUAL Canada
Staff
Language:
Institution Type:
Consortium:
User Group:
American English
Community College
LibQUAL Canada
Staff
Page 76 of 82 LibQUAL+® 2007 Survey Results - OC
7.3 Core Question Dimensions Summary for Staff
On the chart below, scores for each dimension of library service quality have been plotted graphically. The exterior bars represent the range of minimum to desired mean scores for each dimension. The interior bars represent the range of minimum to perceived mean scores (the service adequacy gap) for each dimension of library service quality.
4
5
6
7
8
9
Information
Control
Affect of
Service
Library as
Place
Range of Minimum to Perceived ("Adequacy Gap")
Range of Minimum to Desired
Me
an
Dimension
Overall
Language:
Institution Type:
Consortium:
User Group:
American English
Community College
LibQUAL Canada
Staff
Language:
Institution Type:
Consortium:
User Group:
American English
Community College
LibQUAL Canada
Staff
LibQUAL+® 2007 Survey Results - OC Page 77 of 82
The following table displays mean scores for each dimension of library service quality measured by the LibQUAL+™ survey, where n is the number of respondents for each particular dimension. (For a more detailed explanation of the headings, see the Introduction to this notebook.) A complete listing of the survey questions and their dimensions can be found in Appendix A.
Adequacy
Mean
Perceived
Mean
Desired
MeanDimension
Minimum
Mean n
Superiority
Mean
Affect of Service 7.49 8.16 8.40 0.91 12 0.24
Information Control 7.12 7.88 7.39 0.27 12-0.49
Library as Place 7.07 7.75 7.30 0.23 12-0.45
7.28 7.98 7.84 0.56 12-0.14Overall:
Adequacy
SD
Perceived
SD
Desired
SDDimension
Minimum
SD n
Superiority
SD
Affect of Service 12 1.05 0.80 1.01 0.71 0.54
Information Control 12 1.13 1.57 1.76 1.45 0.94
Library as Place 12 1.23 1.19 1.27 1.23 0.89
The following table displays standard deviation for each dimension of library service quality measured by the
LibQUAL+® survey, where n is the number of respondents for each particular dimension. (For a more detailed
explanation of the headings, see the Introduction to this notebook.) A complete listing of the survey questions and their
dimensions can be found in Appendix A.
12Overall: 1.06 1.02 1.19 0.93 0.68
Language:
Institution Type:
Consortium:
User Group:
American English
Community College
LibQUAL Canada
Staff
Language:
Institution Type:
Consortium:
User Group:
American English
Community College
LibQUAL Canada
Staff
Page 78 of 82 LibQUAL+® 2007 Survey Results - OC
7.4 Local Questions Summary for Staff
Adequacy
Mean
Perceived
Mean
Desired
MeanQuestion Text
Minimum
Mean n
Superiority
Mean
Teaching me how to access, evaluate, and use
information
7.08 7.67 7.58 0.50 12-0.08
Making me aware of library resources and services 6.83 7.75 7.58 0.75 12-0.17
Ability to navigate library Web pages easily 7.08 8.00 7.33 0.25 12-0.67
Adequate hours of service 7.08 8.00 7.75 0.67 12-0.25
Ease and timeliness in getting materials from other
libraries
7.27 8.09 7.73 0.45 11-0.36
This table shows mean scores for each of the local questions added by the individual library or consortium, where n is the number of respondents for each particular question. (For a more detailed explanation of the headings, see the Introduction to this notebook.)
Adequacy
SD
Perceived
SD
Desired
SDQuestion Text
Minimum
SD n
Superiority
SD
Teaching me how to access, evaluate, and use
information
12 1.31 1.51 1.51 1.51 0.89
Making me aware of library resources and services 12 0.83 1.53 1.48 1.51 0.87
Ability to navigate library Web pages easily 12 1.24 1.87 2.01 1.72 0.74
Adequate hours of service 12 1.24 1.66 1.78 1.71 0.74
Ease and timeliness in getting materials from other
libraries
11 1.19 1.43 1.57 1.10 0.83
This table displays the standard deviations for each of the local questions added by the individual library or consortium , where n is the number of respondents for each particular question. (For a more detailed explanation of the headings, see the Introduction to this notebook.)
Language:
Institution Type:
Consortium:
User Group:
American English
Community College
LibQUAL Canada
Staff
Language:
Institution Type:
Consortium:
User Group:
American English
Community College
LibQUAL Canada
Staff
LibQUAL+® 2007 Survey Results - OC Page 79 of 82
7.5 General Satisfaction Questions Summary for Staff
MeanSatisfaction Question nSD
In general, I am satisfied with the way in which I am treated at the library. 8.33 12 0.98
In general, I am satisfied with library support for my learning, research, and/or
teaching needs.
7.91 11 1.38
How would you rate the overall quality of the service provided by the library? 8.00 12 1.04
This table displays the mean score and standard deviation for each of the general satisfaction questions: Satisfaction with
Treatment, Satisfaction with Support, and Satisfaction with Overall Quality of Service, where n is the number of
respondents for each question. These scores are calculated from responses to the general satisfaction questions on the
LibQUAL+® survey, in which respondents rated their levels of general satisfaction on a scale from 1-9.
7.6 Information Literacy Outcomes Questions Summary for Staff
MeanInformation Literacy Outcomes Questions nSD
The library helps me stay abreast of developments in my field(s) of interest. 6.91 11 2.02
The library aids my advancement in my academic discipline. 7.55 11 1.86
The library enables me to be more efficient in my academic pursuits. 7.64 11 1.86
The library helps me distinguish between trustworthy and untrustworthy
information.
7.27 11 1.62
The library provides me with the information skills I need in my work or study. 7.27 11 1.74
This table displays the mean score and standard deviation for each of the information literacy outcomes questions, where
n is the number of respondents for each question. These scores are calculated from responses to the information literacy
outcomes questions on the LibQUAL+® survey, in which respondents rated their levels of general satisfaction on a scale
from 1-9 with 1 being "strongly disagree" and 9 representing "strongly agree".
Language:
Institution Type:
Consortium:
User Group:
American English
Community College
LibQUAL Canada
Staff
Language:
Institution Type:
Consortium:
User Group:
American English
Community College
LibQUAL Canada
Staff
Page 80 of 82 LibQUAL+® 2007 Survey Results - OC
7.7 Library Use Summary for Staff
This chart shows a graphic representation of library use (both on the premises and electronically), as well as use of non-library information gateways such as Yahoo™ and Google™. Bars represent the frequency with which respondents report using these resources: Daily, Weekly, Monthly, Quarterly, or Never. The table below the chart displays the number and percentage of respondents who selected each option.
0
10
20
30
40
50
60
70
80
90
100
Daily
Weekly
Monthly
Quarterly
Never
How often do you use
resources on library
premises?
How often do you
access library resources
through a library Web
page?
How often do you use
Yahoo(TM),
Google(TM), or
non-library gateways for
information?
Frequency
P
erc
en
tag
e
Daily Weekly Monthly Quarterly Never n / %
How often do you use resources on library
premises?
2
16.67%
3
25.00%
5
41.67%
2
16.67%
0
0.00%
12
100.00%
How often do you access library resources
through a library Web page?
0
0.00%
2
16.67%
6
50.00%
3
25.00%
1
8.33%
12
100.00%
How often do you use Yahoo(TM),
Google(TM), or non-library gateways for
information?
4
33.33%
5
41.67%
1
8.33%
0
0.00%
2
16.67%
12
100.00%
Language:
Institution Type:
Consortium:
User Group:
American English
Community College
LibQUAL Canada
Staff
Language:
Institution Type:
Consortium:
User Group:
American English
Community College
LibQUAL Canada
Staff
LibQUAL+® 2007 Survey Results - OC Page 81 of 82
8 Appendix A: LibQUAL+® Dimensions
LibQUAL+® measures dimensions of perceived library quality---that is, each survey question is part of a broader
category (a dimension), and scores within those categories are analyzed in order to derive more general information
about library users' perceptions of service. These dimensions were first based on the original SERVQUAL survey
instrument (the framework for the LibQUAL+® survey tool; for more information on the origins of LibQUAL+®, go
to <http://www.libqual.org/Publications/>). The LibQUAL+® survey dimensions have evolved with each iteration,
becoming more refined and focused for application to the library context. Dimensions for each iteration of the
LibQUAL+® survey are outlined below.
LibQUAL+® 2000 Dimensions
The 2000 iteration of the LibQUAL+® survey, which had 41 questions, measured eight separate dimensions:
· Assurance (the knowledge and courtesy of employees, and their ability to convey trust and confidence)
· Empathy (caring, individual attention)
· Library as Place (library as a sanctuary/haven or site for learning and contemplation)
· Reliability (ability to perform the promised service dependably and accurately)
· Responsiveness (willingness to help customers and provide prompt service)
· Tangibles (appearance of physical facilities, equipment, personnel and communications materials)
· Instructions/Custom Items
· Self-Reliance
LibQUAL+® 2001 Dimensions
After careful analysis of the results from the 2000 survey, the dimensions were further refined to re-ground the
SERVQUAL items in the library context. Four sub-dimensions resulted for the 2001 iteration:
· Service Affect (nine items, such as “willingness to help users”)
· Library as Place (five items, such as “a haven for quiet and solitude”)
· Personal Control (six items, such as “website enabling me to locate information on my own”), and
· Information Access (five items, such as “comprehensive print collections” and “convenient business hours”)
LibQUAL+® 2002 and 2003 Dimensions
For the 2002 iteration of the LibQUAL+® survey, the dimensions were once again refined based on analysis of the
previous year's results. While the four dimensions were retained, their titles were changed slightly to more clearly
represent the questions and data. The same four dimensions were also used on the 2003 survey:
· Access to Information
· Affect of Service
· Library as Place
· Personal Control
LibQUAL+® 2004 - 2007 Dimensions
After the 2003 survey was completed, factor and reliability analyses on the resulting data revealed that two of the
Language:
Institution Type:
Consortium:
User Group:
American English
Community College
LibQUAL Canada
All
Language:
Institution Type:
Consortium:
User Group:
American English
Community College
LibQUAL Canada
All
Page 82 of 82 LibQUAL+® 2007 Survey Results - OC
dimensions measured by the survey-Access to Information and Personal Control-had collapsed into one. The
following three dimensions have been measured since then: Affect of Service, Information Control, and Library as
Place. In addition, three core items were eliminated from the 2003 version of the survey, leaving 22 core items on the
final survey instrument.
The list below displays the dimensions used to present the results in the 2007 notebooks, along with the questions
that relate to each dimension. (Note: The questions below are those used in the College and University
implementation of the survey, American English version.)
Affect of Service
[AS-1] Employees who instill confidence in users
[AS-2] Giving users individual attention
[AS-3] Employees who are consistently courteous
[AS-4] Readiness to respond to users’ questions
[AS-5] Employees who have the knowledge to answer user questions
[AS-6] Employees who deal with users in a caring fashion
[AS-7] Employees who understand the needs of their users
[AS-8] Willingness to help users
[AS-9] Dependability in handling users’ service problems
Information Control
[IC-1] Making electronic resources accessible from my home or office
[IC-2] A library Web site enabling me to locate information on my own
[IC-3] The printed library materials I need for my work
[IC-4] The electronic information resources I need
[IC-5] Modern equipment that lets me easily access needed information
[IC-6] Easy-to-use access tools that allow me to find things on my own
[IC-7] Making information easily accessible for independent use
[IC-8] Print and/or electronic journal collections I require for my work
Library as Place
[LP-1] Library space that inspires study and learning
[LP-2] Quiet space for individual activities
[LP-3] A comfortable and inviting location
[LP-4] A getaway for study, learning or research
[LP-5] Community space for group learning and group study