41
pcgplus.com Library Budget Predictions for 2015
pcgplus.com
Library Budget Predictions for 2015
© 2015 Publishers Communication Group | pcgplus.com | Reproduction strictly prohibited Page 2 of 41
Contents List of Tables ....................................................................................................................................................................... 3
Executive Summary ............................................................................................................................................................ 4
What was done ................................................................................................................................................................. 4
Summary of Results ......................................................................................................................................................... 4
Who was surveyed .............................................................................................................................................................. 7
Sample Frame .................................................................................................................................................................. 9
Overall Library Expenditure ............................................................................................................................................. 10
Overall Library Budget Broken Down .............................................................................................................................. 10
Overall Library Budget Change for 2015 ........................................................................................................................ 11
Materials Expenditure ....................................................................................................................................................... 13
Materials Budget Change for 2015 ................................................................................................................................. 13
Materials Budget Change to 2018 .................................................................................................................................. 16
Materials expenditure on electronic resources ............................................................................................................... 18
Serials Budget Change for 2015 ..................................................................................................................................... 20
Reasons for Decrease in Serials Budget ........................................................................................................................ 22
Reasons for Increase in Serials Budget .......................................................................................................................... 22
Plans for Serial Additions and Cancellations .................................................................................................................. 22
Electronic Journals and Breakdown of Serial Subscription into Format Type ................................................................. 24
Expenditure on Electronic Serials ................................................................................................................................... 26
E-Journal Budgets .......................................................................................................................................................... 27
Abstracting and Indexing Services ................................................................................................................................. 27
Books Expenditure ........................................................................................................................................................... 28
Books Budget Change for 2015 ...................................................................................................................................... 28
Books print and electronic budget change for 2015 ........................................................................................................ 30
New Books in 2014 ......................................................................................................................................................... 33
Percentage of Books Budget Spent on Electronic Books in 2014 .................................................................................. 33
Proportion of front list books ........................................................................................................................................... 34
Major Reference Works .................................................................................................................................................... 35
Major Reference Works – Predicted Change for 2015 ................................................................................................... 35
Reasons Why the Number of MRWs is Likely to Change in 2015 .................................................................................. 35
Major Reference Works Formats Being Purchased ........................................................................................................ 37
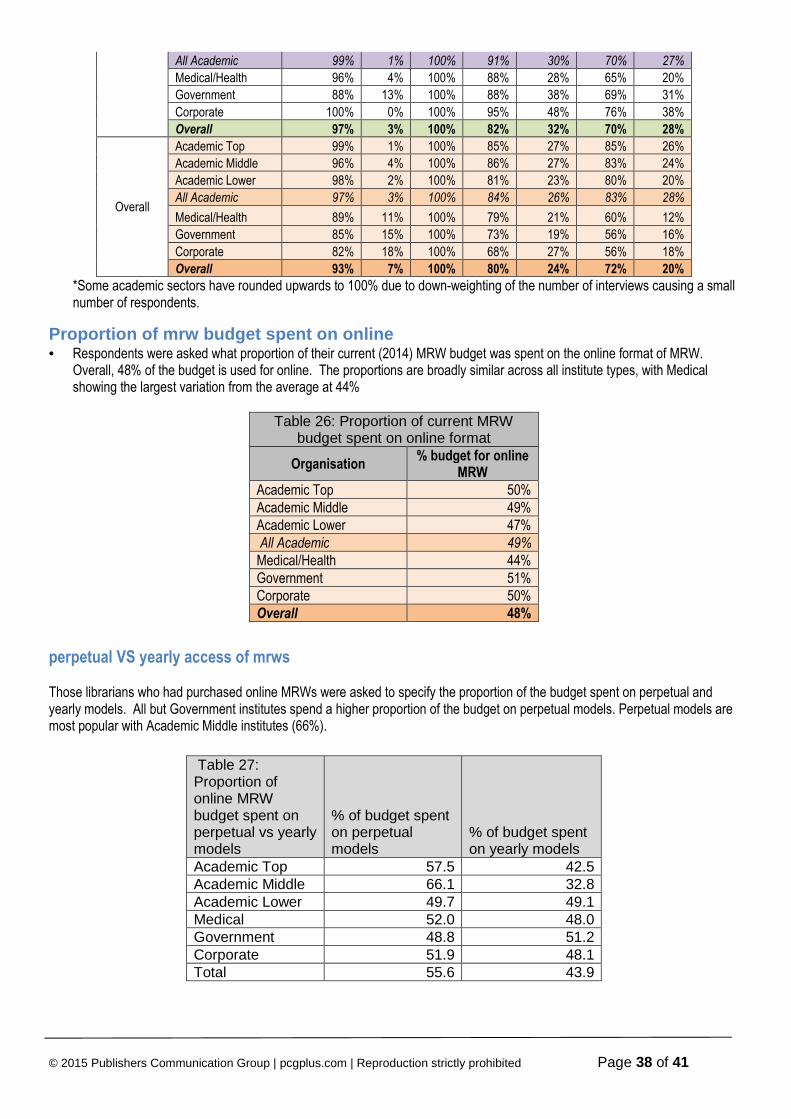
Proportion of mrw budget spent on online ...................................................................................................................... 38
perpetual VS yearly access of mrws ............................................................................................................................... 38
Institutional Repositories ................................................................................................................................................. 39
How Information in Repositories is Stored ...................................................................................................................... 39
How Information in Repostiories is Maintained ............................................................................................................... 40
Growth of Institutional Repositories ................................................................................................................................ 40
Plans for a data repository .............................................................................................................................................. 41
© 2015 Publishers Communication Group | pcgplus.com | Reproduction strictly prohibited Page 3 of 41
List of Tables Table 1: Budget % Change by Type of Institute .................................................................................................................... 5
Table 2: Average number of Members and Students by type of Institute .............................................................................. 7
Table 3: Belong to a consortium............................................................................................................................................ 8
Table 4: Spending change on consortia deals ...................................................................................................................... 8
Table 5: Have an institutional repository ............................................................................................................................... 8
Table 6: Breakdown of sample by country and type of institute ............................................................................................ 9
Table 8: Library Budget change for 2015 - Overall Library Budget ..................................................................................... 12
Table 9: Materials Budget change for 2015 ........................................................................................................................ 15
Table 10: Materials Budget change 2018 ............................................................................................................................ 17
Table 11 Percentage expenditure on electronic information resources .............................................................................. 19
Table 12: Serials Budget Change for 2015 ......................................................................................................................... 21
Table 13: Serials Additions in 2015 ..................................................................................................................................... 23
Table 14: Breakdown of serials subscriptions into format type in 2014 ............................................................................... 25
Table 15: Percentage of serials expenditure on electronic serials .................................................................................... P26
Table 16: Electronic resource spending in 2015 ................................................................................................................. 27
Table 19: Abstracting & Indexing Budget Predictions for 2015 ........................................................................................... 27
Table 21: Books Budget Change for 2015 .......................................................................................................................... 29
Table 22: Print Books Budget Change for 2015 .................................................................................................................. 31
Table 23: Electronic Books Budget Change for 2015.......................................................................................................... 32
Table 24: Book purchasing in 2014 compared to 2013 ....................................................................................................... 33
Table 25: Average Number of books in 2014 per institute type ........................................................................................... 33
Table 26: Library Book Budget - % spent on electronic books ............................................................................................ 33
Table 29: Proportion of front list books ................................................................................................................................ 34
Table 30: MRW Budget change for 2015 ............................................................................................................................ 36
Table 31: Purchasing patterns for MRWs by region and organisation (up to current year) ................................................. 37
Table 32: Proportion of current MRW budget spent on online format ................................................................................. 38
Table 34: Proportion of online MRW budget spent on perpetual vs yearly models ............................................................. 38
Table 36: Usage of Institutional Repositories ...................................................................................................................... 39
Table 37: Usage of Institutional Repositories ...................................................................................................................... 39
Table 38: Usage of Institutional Repositories ...................................................................................................................... 40
Table 39: Who maintains the repository .............................................................................................................................. 40
Table 40: Availability of repository ....................................................................................................................................... 40
Table 41: Growth of Institutional Repositories ..................................................................................................................... 40
Table 42: Growth of Institutional Repositories ..................................................................................................................... 41
Table 43: Plans to set up a data repository ......................................................................................................................... 41
© 2015 Publishers Communication Group | pcgplus.com | Reproduction strictly prohibited Page 4 of 41
Executive Summary What was done
• A global telephone survey was carried out at 683 institutional libraries. Institutes in North America, South America, Europe and Asia Pacific Region were contacted. For the first time, we have extended the reach of the study into the Middle East and Africa region. Institutions in Turkey, South Africa and Saudi Arabia were added to the research. Israel will now be counted as part of this group rather than Europe, where it has appeared in previous reports.
• Senior librarians with control over and knowledge of library budgets for 2015 were contacted. • Academic institutions were split into categories reflecting the size of their institute. • The data in this study has been weighted to reflect the global contribution of each country to library spend. All counts
in the report are based on the weighted number of responses, rather than the actual number.
Summary of Results
As the global financial recovery continues, there are some mixed tidings. While the OECD global growth projection for 2014 has been downgraded to 2.2%, some countries have bucked the trend and posted unexpected upturns (UK, Canada, Germany, Spain). Conversely, some countries saw unanticipated downturns (USA, China and Russia).1 At present, the 2015 projection for growth globally is 2.8%. GDP growth, the health of an economy impacts library budget growth.
The results of the Library Budget Survey show a certain parity with the global OECD forecast – a steady improvement over previous years. Overall library budgets are predicted to rise 1.2% and we also see increases across all regions in 2015, albeit modestly in some.
When you look across all the forecasts North America has the lowest level of change across the four main budget lines tracked in this survey. Asia Pacific, which has shown some strong increases in previous reports is showing a slower pace of growth for 2015 (1.7% for the overall budget)
Both Materials and Serials budgets are expected to rise by 1.5% in 2015. Books are forecast to increase 0.7%.
Looking further ahead, librarians expect the materials budget to show a year on year growth of 1.8% between 2015 and 2018.
When asked for the reasons for budget rises on the materials budget, price increase is a major reason. This indicates that although the budget may rise, they expect this to just cover the costs of existing holdings as inflation and/or currency fluctuation affects the price of materials. Although we see a projected rise in the serials budgets, institutes are set to cancel a greater number of journals than they plan to add meaning that librarians have to carefully manage their holdings. When it comes to justifying their spend librarians and information specialists put a lot of stock in usage statistics: 86% use them to prove the value of their purchases, second most important is feedback from users (77%).
We continue to see a shift from print to electronic on the books budget. The proportions of format type are shifting accordingly, e-books continues to rise and now stands at 26.7%. As the uneven recovery continues, countries face their own individual challenges. Geopolitical issues continue to affect the economies of several regions, whilst other countries are still facing default. Librarians seem set for another challenging year as these external influences continue to disrupt.
1 Source: http://www.oecd.org/eco/economicoutlook.htm Economic Outlook Update, May 2014
© 2015 Publishers Communication Group | pcgplus.com | Reproduction strictly prohibited Page 5 of 41
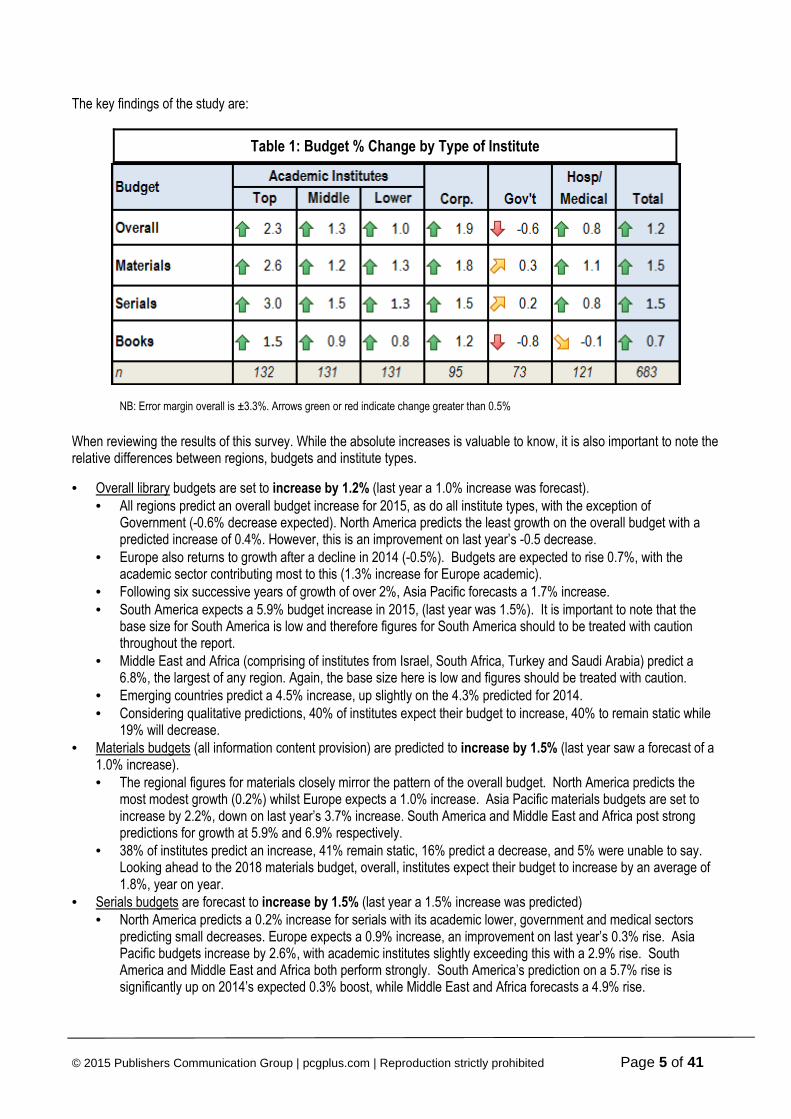
The key findings of the study are:
Table 1: Budget % Change by Type of Institute
NB: Error margin overall is ±3.3%. Arrows green or red indicate change greater than 0.5%
When reviewing the results of this survey. While the absolute increases is valuable to know, it is also important to note the relative differences between regions, budgets and institute types.
• Overall library budgets are set to increase by 1.2% (last year a 1.0% increase was forecast). • All regions predict an overall budget increase for 2015, as do all institute types, with the exception of
Government (-0.6% decrease expected). North America predicts the least growth on the overall budget with a predicted increase of 0.4%. However, this is an improvement on last year’s -0.5 decrease.
• Europe also returns to growth after a decline in 2014 (-0.5%). Budgets are expected to rise 0.7%, with the academic sector contributing most to this (1.3% increase for Europe academic).
• Following six successive years of growth of over 2%, Asia Pacific forecasts a 1.7% increase. • South America expects a 5.9% budget increase in 2015, (last year was 1.5%). It is important to note that the
base size for South America is low and therefore figures for South America should to be treated with caution throughout the report.
• Middle East and Africa (comprising of institutes from Israel, South Africa, Turkey and Saudi Arabia) predict a 6.8%, the largest of any region. Again, the base size here is low and figures should be treated with caution.
• Emerging countries predict a 4.5% increase, up slightly on the 4.3% predicted for 2014. • Considering qualitative predictions, 40% of institutes expect their budget to increase, 40% to remain static while
19% will decrease. • Materials budgets (all information content provision) are predicted to increase by 1.5% (last year saw a forecast of a
1.0% increase). • The regional figures for materials closely mirror the pattern of the overall budget. North America predicts the
most modest growth (0.2%) whilst Europe expects a 1.0% increase. Asia Pacific materials budgets are set to increase by 2.2%, down on last year’s 3.7% increase. South America and Middle East and Africa post strong predictions for growth at 5.9% and 6.9% respectively.
• 38% of institutes predict an increase, 41% remain static, 16% predict a decrease, and 5% were unable to say. Looking ahead to the 2018 materials budget, overall, institutes expect their budget to increase by an average of 1.8%, year on year.
• Serials budgets are forecast to increase by 1.5% (last year a 1.5% increase was predicted) • North America predicts a 0.2% increase for serials with its academic lower, government and medical sectors
predicting small decreases. Europe expects a 0.9% increase, an improvement on last year’s 0.3% rise. Asia Pacific budgets increase by 2.6%, with academic institutes slightly exceeding this with a 2.9% rise. South America and Middle East and Africa both perform strongly. South America’s prediction on a 5.7% rise is significantly up on 2014’s expected 0.3% boost, while Middle East and Africa forecasts a 4.9% rise.
© 2015 Publishers Communication Group | pcgplus.com | Reproduction strictly prohibited Page 6 of 41
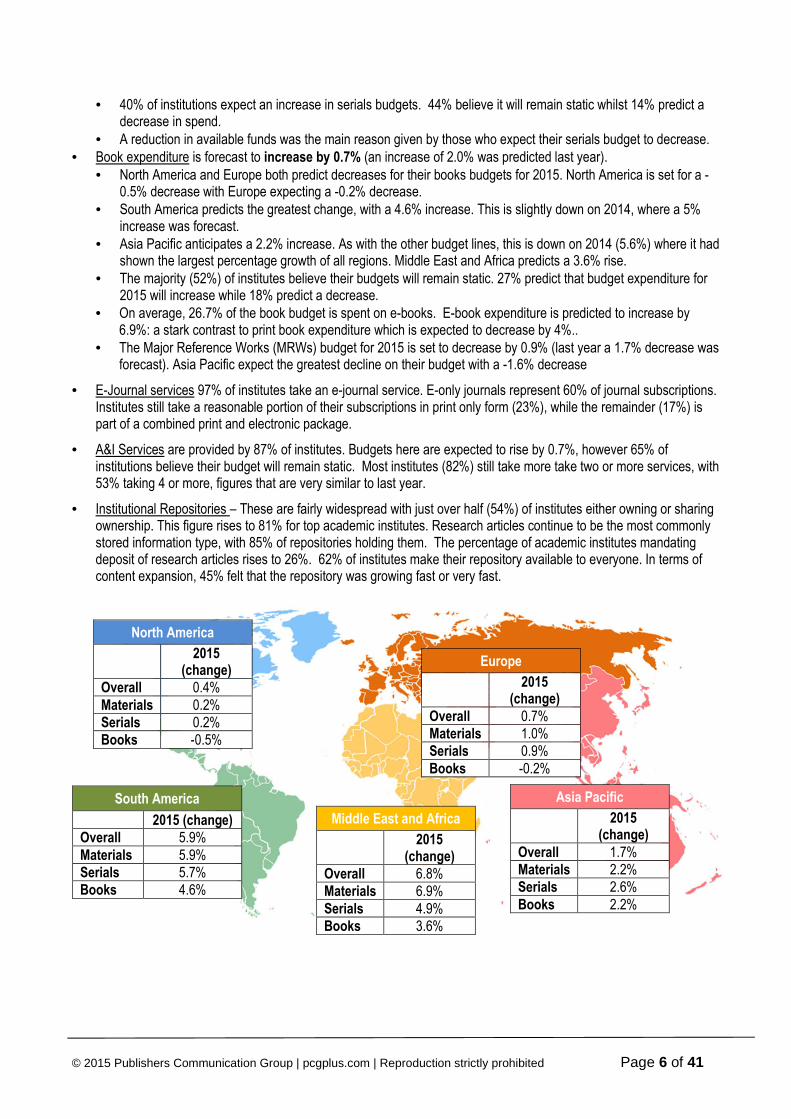
• 40% of institutions expect an increase in serials budgets. 44% believe it will remain static whilst 14% predict a decrease in spend.
• A reduction in available funds was the main reason given by those who expect their serials budget to decrease. • Book expenditure is forecast to increase by 0.7% (an increase of 2.0% was predicted last year).
• North America and Europe both predict decreases for their books budgets for 2015. North America is set for a -0.5% decrease with Europe expecting a -0.2% decrease.
• South America predicts the greatest change, with a 4.6% increase. This is slightly down on 2014, where a 5% increase was forecast.
• Asia Pacific anticipates a 2.2% increase. As with the other budget lines, this is down on 2014 (5.6%) where it had shown the largest percentage growth of all regions. Middle East and Africa predicts a 3.6% rise.
• The majority (52%) of institutes believe their budgets will remain static. 27% predict that budget expenditure for 2015 will increase while 18% predict a decrease.
• On average, 26.7% of the book budget is spent on e-books. E-book expenditure is predicted to increase by 6.9%: a stark contrast to print book expenditure which is expected to decrease by 4%..
• The Major Reference Works (MRWs) budget for 2015 is set to decrease by 0.9% (last year a 1.7% decrease was forecast). Asia Pacific expect the greatest decline on their budget with a -1.6% decrease
• E-Journal services 97% of institutes take an e-journal service. E-only journals represent 60% of journal subscriptions. Institutes still take a reasonable portion of their subscriptions in print only form (23%), while the remainder (17%) is part of a combined print and electronic package.
• A&I Services are provided by 87% of institutes. Budgets here are expected to rise by 0.7%, however 65% of institutions believe their budget will remain static. Most institutes (82%) still take more take two or more services, with 53% taking 4 or more, figures that are very similar to last year.
• Institutional Repositories – These are fairly widespread with just over half (54%) of institutes either owning or sharing ownership. This figure rises to 81% for top academic institutes. Research articles continue to be the most commonly stored information type, with 85% of repositories holding them. The percentage of academic institutes mandating deposit of research articles rises to 26%. 62% of institutes make their repository available to everyone. In terms of content expansion, 45% felt that the repository was growing fast or very fast.
Europe
2015 (change)
Overall 0.7% Materials 1.0% Serials 0.9% Books -0.2%
North America
2015 (change)
Overall 0.4% Materials 0.2% Serials 0.2% Books -0.5%
Middle East and Africa
2015 (change)
Overall 6.8% Materials 6.9% Serials 4.9% Books 3.6%
Asia Pacific
2015 (change)
Overall 1.7% Materials 2.2% Serials 2.6% Books 2.2%
South America
2015 (change)
Overall 5.9% Materials 5.9% Serials 5.7% Books 4.6%
© 2015 Publishers Communication Group | pcgplus.com | Reproduction strictly prohibited Page 7 of 41
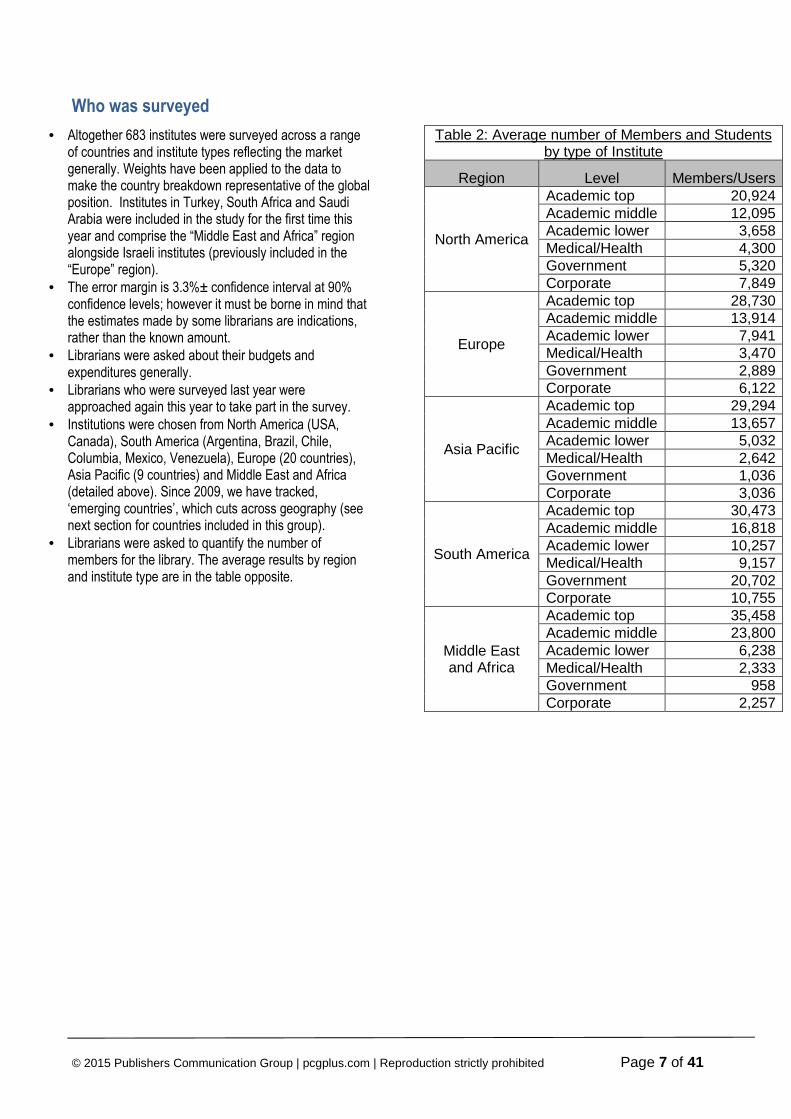
Who was surveyed
• Altogether 683 institutes were surveyed across a range of countries and institute types reflecting the market generally. Weights have been applied to the data to make the country breakdown representative of the global position. Institutes in Turkey, South Africa and Saudi Arabia were included in the study for the first time this year and comprise the “Middle East and Africa” region alongside Israeli institutes (previously included in the “Europe” region).
• The error margin is 3.3%± confidence interval at 90% confidence levels; however it must be borne in mind that the estimates made by some librarians are indications, rather than the known amount.
• Librarians were asked about their budgets and expenditures generally.
• Librarians who were surveyed last year were approached again this year to take part in the survey.
• Institutions were chosen from North America (USA, Canada), South America (Argentina, Brazil, Chile, Columbia, Mexico, Venezuela), Europe (20 countries), Asia Pacific (9 countries) and Middle East and Africa (detailed above). Since 2009, we have tracked, ‘emerging countries’, which cuts across geography (see next section for countries included in this group).
• Librarians were asked to quantify the number of members for the library. The average results by region and institute type are in the table opposite.
Table 2: Average number of Members and Students by type of Institute
Region Level Members/Users
North America
Academic top 20,924 Academic middle 12,095 Academic lower 3,658 Medical/Health 4,300 Government 5,320 Corporate 7,849
Europe
Academic top 28,730 Academic middle 13,914 Academic lower 7,941 Medical/Health 3,470 Government 2,889 Corporate 6,122
Asia Pacific
Academic top 29,294 Academic middle 13,657 Academic lower 5,032 Medical/Health 2,642 Government 1,036 Corporate 3,036
South America
Academic top 30,473 Academic middle 16,818 Academic lower 10,257 Medical/Health 9,157 Government 20,702 Corporate 10,755
Middle East and Africa
Academic top 35,458 Academic middle 23,800 Academic lower 6,238 Medical/Health 2,333 Government 958 Corporate 2,257
© 2015 Publishers Communication Group | pcgplus.com | Reproduction strictly prohibited Page 8 of 41
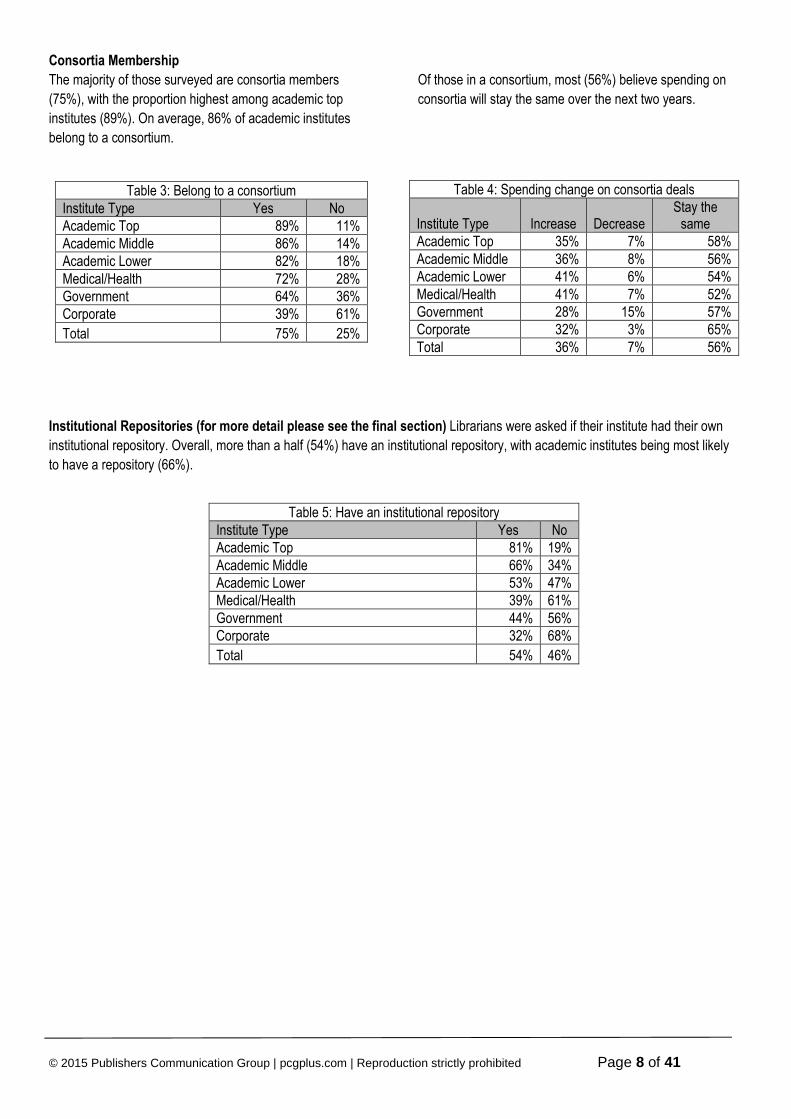
Consortia Membership
The majority of those surveyed are consortia members
(75%), with the proportion highest among academic top
institutes (89%). On average, 86% of academic institutes
belong to a consortium.
Of those in a consortium, most (56%) believe spending on
consortia will stay the same over the next two years.
Table 3: Belong to a consortium Institute Type Yes No Academic Top 89% 11% Academic Middle 86% 14% Academic Lower 82% 18% Medical/Health 72% 28% Government 64% 36% Corporate 39% 61%
Total 75% 25%
Institutional Repositories (for more detail please see the final section) Librarians were asked if their institute had their own
institutional repository. Overall, more than a half (54%) have an institutional repository, with academic institutes being most likely
to have a repository (66%).
Table 5: Have an institutional repository Institute Type Yes No Academic Top 81% 19% Academic Middle 66% 34% Academic Lower 53% 47% Medical/Health 39% 61% Government 44% 56% Corporate 32% 68%
Total 54% 46%
Table 4: Spending change on consortia deals
Institute Type Increase Decrease Stay the
same Academic Top 35% 7% 58% Academic Middle 36% 8% 56% Academic Lower 41% 6% 54% Medical/Health 41% 7% 52% Government 28% 15% 57% Corporate 32% 3% 65% Total 36% 7% 56%
© 2015 Publishers Communication Group | pcgplus.com | Reproduction strictly prohibited Page 9 of 41
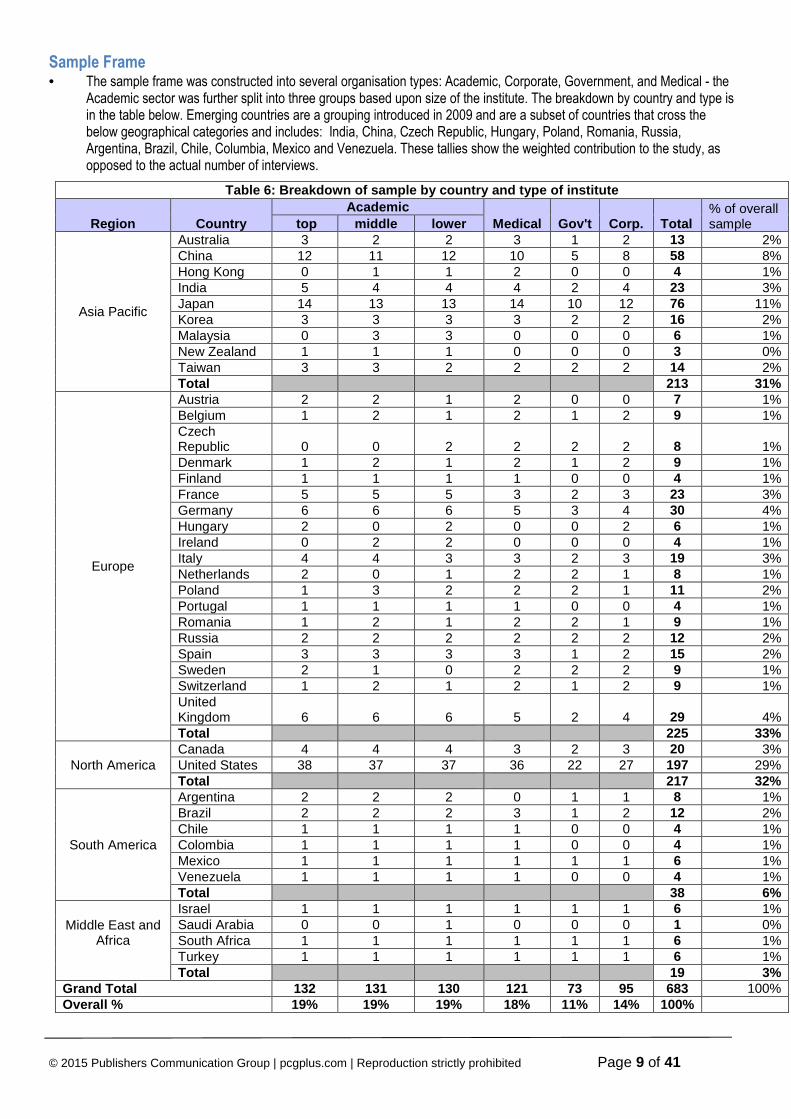
Sample Frame • The sample frame was constructed into several organisation types: Academic, Corporate, Government, and Medical - the
Academic sector was further split into three groups based upon size of the institute. The breakdown by country and type is in the table below. Emerging countries are a grouping introduced in 2009 and are a subset of countries that cross the below geographical categories and includes: India, China, Czech Republic, Hungary, Poland, Romania, Russia, Argentina, Brazil, Chile, Columbia, Mexico and Venezuela. These tallies show the weighted contribution to the study, as opposed to the actual number of interviews.
Table 6: Breakdown of sample by country and type of institute
Region Country Academic
Medical Gov't Corp. Total % of overall sample top middle lower
Asia Pacific
Australia 3 2 2 3 1 2 13 2% China 12 11 12 10 5 8 58 8% Hong Kong 0 1 1 2 0 0 4 1% India 5 4 4 4 2 4 23 3% Japan 14 13 13 14 10 12 76 11% Korea 3 3 3 3 2 2 16 2% Malaysia 0 3 3 0 0 0 6 1% New Zealand 1 1 1 0 0 0 3 0% Taiwan 3 3 2 2 2 2 14 2% Total 213 31%
Europe
Austria 2 2 1 2 0 0 7 1% Belgium 1 2 1 2 1 2 9 1% Czech Republic 0 0 2 2 2 2 8 1% Denmark 1 2 1 2 1 2 9 1% Finland 1 1 1 1 0 0 4 1% France 5 5 5 3 2 3 23 3% Germany 6 6 6 5 3 4 30 4% Hungary 2 0 2 0 0 2 6 1% Ireland 0 2 2 0 0 0 4 1% Italy 4 4 3 3 2 3 19 3% Netherlands 2 0 1 2 2 1 8 1% Poland 1 3 2 2 2 1 11 2% Portugal 1 1 1 1 0 0 4 1% Romania 1 2 1 2 2 1 9 1% Russia 2 2 2 2 2 2 12 2% Spain 3 3 3 3 1 2 15 2% Sweden 2 1 0 2 2 2 9 1% Switzerland 1 2 1 2 1 2 9 1% United Kingdom 6 6 6 5 2 4 29 4% Total 225 33%
North America Canada 4 4 4 3 2 3 20 3% United States 38 37 37 36 22 27 197 29% Total 217 32%
South America
Argentina 2 2 2 0 1 1 8 1% Brazil 2 2 2 3 1 2 12 2% Chile 1 1 1 1 0 0 4 1% Colombia 1 1 1 1 0 0 4 1% Mexico 1 1 1 1 1 1 6 1% Venezuela 1 1 1 1 0 0 4 1% Total 38 6%
Middle East and Africa
Israel 1 1 1 1 1 1 6 1% Saudi Arabia 0 0 1 0 0 0 1 0% South Africa 1 1 1 1 1 1 6 1% Turkey 1 1 1 1 1 1 6 1%
Total 19 3% Grand Total 132 131 130 121 73 95 683 100% Overall % 19% 19% 19% 18% 11% 14% 100%
© 2015 Publishers Communication Group | pcgplus.com | Reproduction strictly prohibited Page 10 of 41
Overall Library Expenditure
Overall Library Budget Broken Down
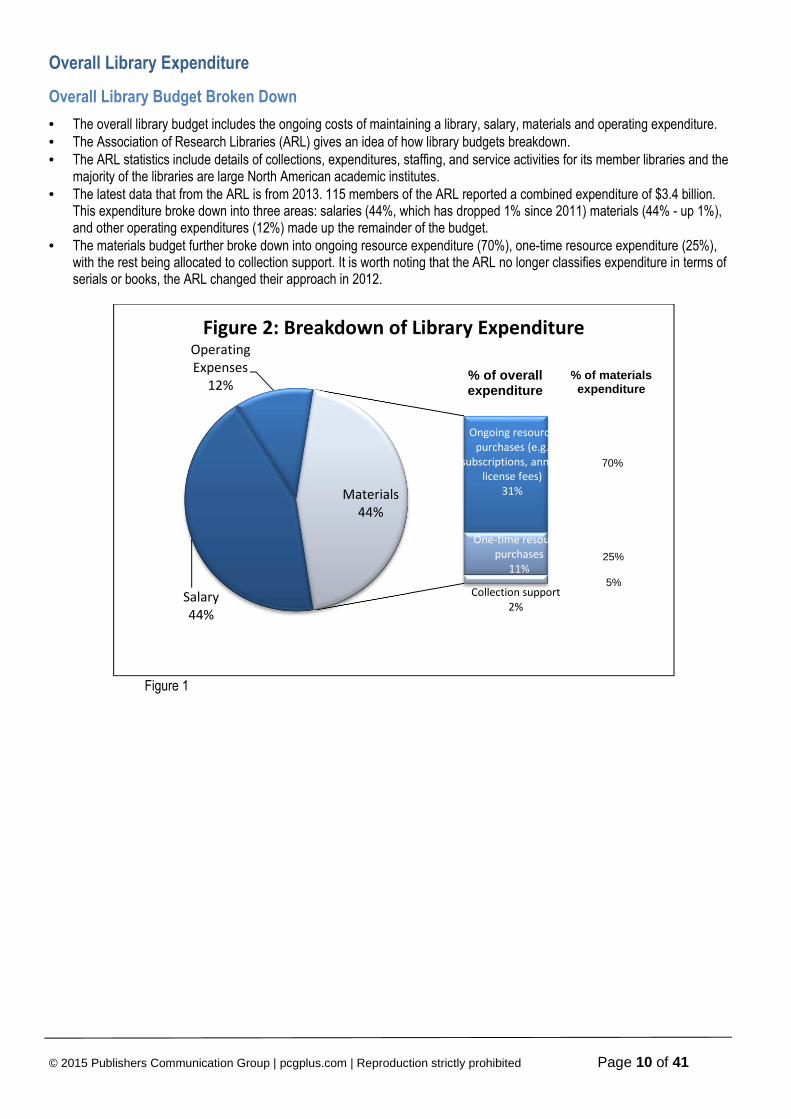
• The overall library budget includes the ongoing costs of maintaining a library, salary, materials and operating expenditure. • The Association of Research Libraries (ARL) gives an idea of how library budgets breakdown. • The ARL statistics include details of collections, expenditures, staffing, and service activities for its member libraries and the
majority of the libraries are large North American academic institutes. • The latest data that from the ARL is from 2013. 115 members of the ARL reported a combined expenditure of $3.4 billion.
This expenditure broke down into three areas: salaries (44%, which has dropped 1% since 2011) materials (44% - up 1%), and other operating expenditures (12%) made up the remainder of the budget.
• The materials budget further broke down into ongoing resource expenditure (70%), one-time resource expenditure (25%), with the rest being allocated to collection support. It is worth noting that the ARL no longer classifies expenditure in terms of serials or books, the ARL changed their approach in 2012.
Figure 1
Salary
44%
Operating
Expenses
12%
Ongoing resource
purchases (e.g.
subscriptions, annual
license fees)
31%
One-time resource
purchases
11%
Collection support
2%
Materials
44%
Figure 2: Breakdown of Library Expenditure
% of overall expenditure
% of materials expenditure
70%
25%
5%
© 2015 Publishers Communication Group | pcgplus.com | Reproduction strictly prohibited Page 11 of 41
Overall Library Budget Change for 2015
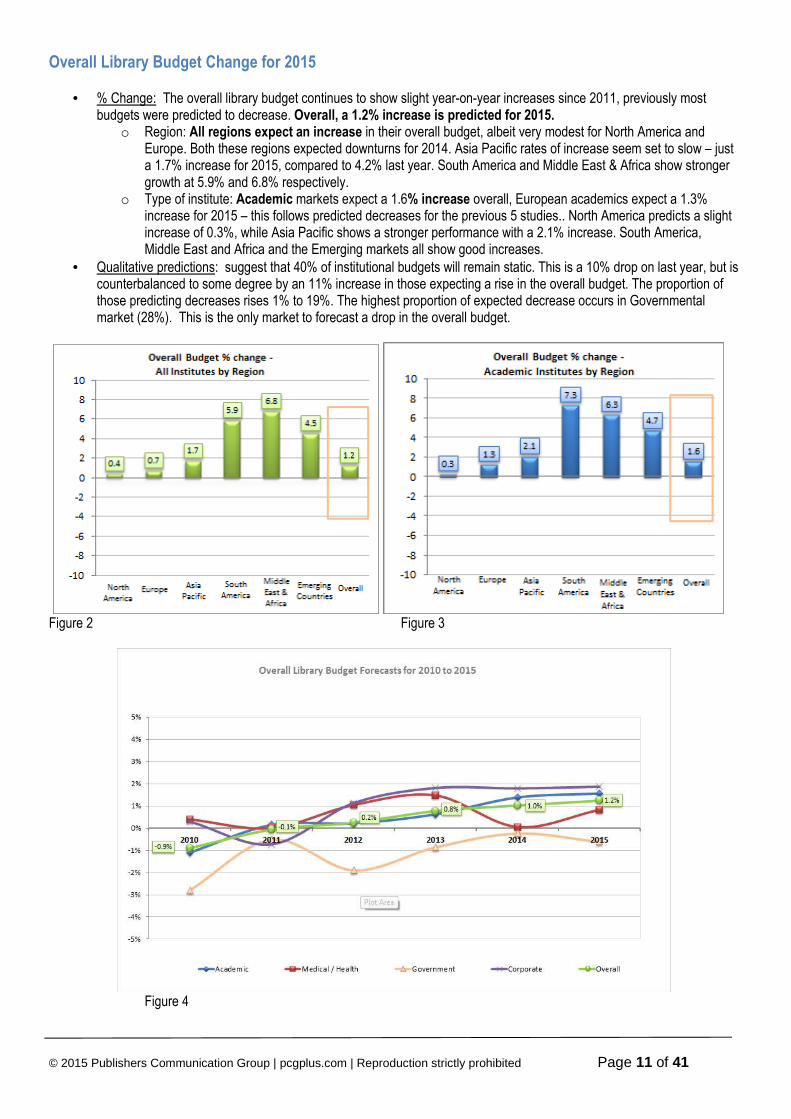
• % Change: The overall library budget continues to show slight year-on-year increases since 2011, previously most budgets were predicted to decrease. Overall, a 1.2% increase is predicted for 2015.
o Region: All regions expect an increase in their overall budget, albeit very modest for North America and Europe. Both these regions expected downturns for 2014. Asia Pacific rates of increase seem set to slow – just a 1.7% increase for 2015, compared to 4.2% last year. South America and Middle East & Africa show stronger growth at 5.9% and 6.8% respectively.
o Type of institute: Academic markets expect a 1.6% increase overall, European academics expect a 1.3% increase for 2015 – this follows predicted decreases for the previous 5 studies.. North America predicts a slight increase of 0.3%, while Asia Pacific shows a stronger performance with a 2.1% increase. South America, Middle East and Africa and the Emerging markets all show good increases.
• Qualitative predictions: suggest that 40% of institutional budgets will remain static. This is a 10% drop on last year, but is counterbalanced to some degree by an 11% increase in those expecting a rise in the overall budget. The proportion of those predicting decreases rises 1% to 19%. The highest proportion of expected decrease occurs in Governmental market (28%). This is the only market to forecast a drop in the overall budget.
Figure 2 Figure 3
Figure 4
© 2015 Publishers Communication Group | pcgplus.com | Reproduction strictly prohibited Page 12 of 41
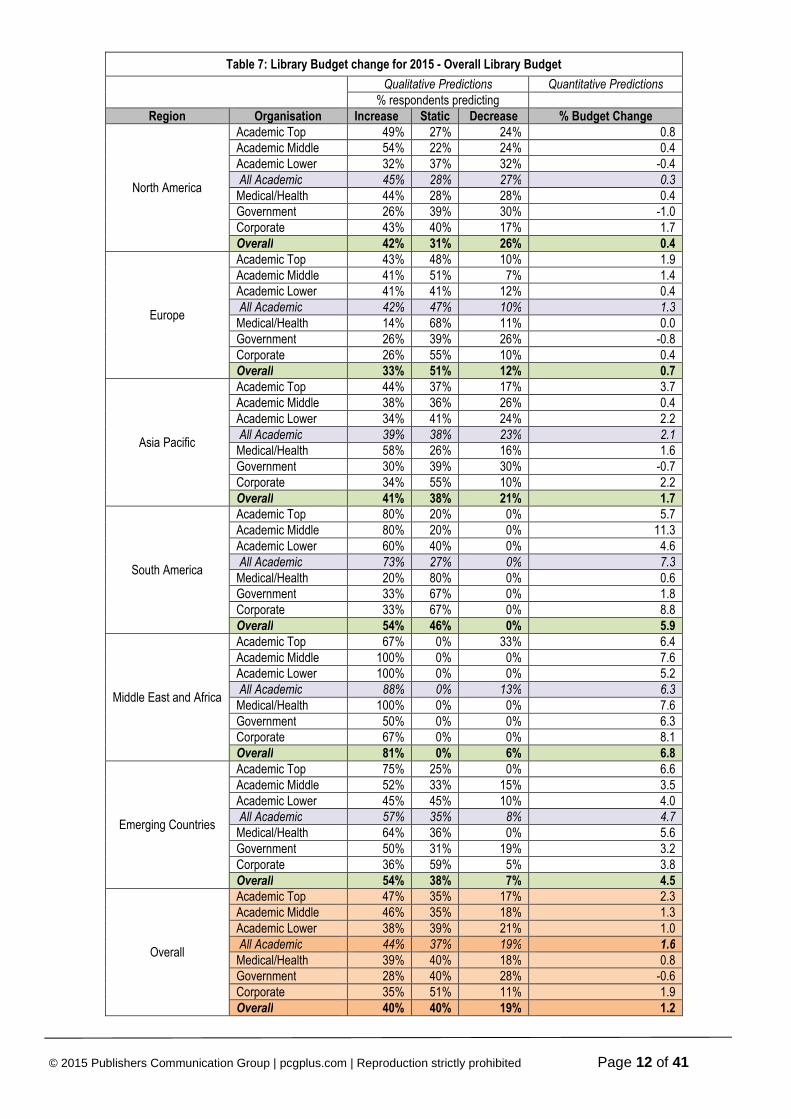
Table 7: Library Budget change for 2015 - Overall Library Budget
Qualitative Predictions Quantitative Predictions
% respondents predicting Region Organisation Increase Static Decrease % Budget Change
North America
Academic Top 49% 27% 24% 0.8 Academic Middle 54% 22% 24% 0.4 Academic Lower 32% 37% 32% -0.4 All Academic 45% 28% 27% 0.3
Medical/Health 44% 28% 28% 0.4 Government 26% 39% 30% -1.0 Corporate 43% 40% 17% 1.7 Overall 42% 31% 26% 0.4
Europe
Academic Top 43% 48% 10% 1.9 Academic Middle 41% 51% 7% 1.4 Academic Lower 41% 41% 12% 0.4 All Academic 42% 47% 10% 1.3
Medical/Health 14% 68% 11% 0.0 Government 26% 39% 26% -0.8 Corporate 26% 55% 10% 0.4 Overall 33% 51% 12% 0.7
Asia Pacific
Academic Top 44% 37% 17% 3.7 Academic Middle 38% 36% 26% 0.4 Academic Lower 34% 41% 24% 2.2 All Academic 39% 38% 23% 2.1
Medical/Health 58% 26% 16% 1.6 Government 30% 39% 30% -0.7 Corporate 34% 55% 10% 2.2 Overall 41% 38% 21% 1.7
South America
Academic Top 80% 20% 0% 5.7 Academic Middle 80% 20% 0% 11.3 Academic Lower 60% 40% 0% 4.6 All Academic 73% 27% 0% 7.3
Medical/Health 20% 80% 0% 0.6 Government 33% 67% 0% 1.8 Corporate 33% 67% 0% 8.8 Overall 54% 46% 0% 5.9
Middle East and Africa
Academic Top 67% 0% 33% 6.4 Academic Middle 100% 0% 0% 7.6 Academic Lower 100% 0% 0% 5.2 All Academic 88% 0% 13% 6.3
Medical/Health 100% 0% 0% 7.6 Government 50% 0% 0% 6.3 Corporate 67% 0% 0% 8.1 Overall 81% 0% 6% 6.8
Emerging Countries
Academic Top 75% 25% 0% 6.6 Academic Middle 52% 33% 15% 3.5 Academic Lower 45% 45% 10% 4.0 All Academic 57% 35% 8% 4.7
Medical/Health 64% 36% 0% 5.6 Government 50% 31% 19% 3.2 Corporate 36% 59% 5% 3.8 Overall 54% 38% 7% 4.5
Overall
Academic Top 47% 35% 17% 2.3 Academic Middle 46% 35% 18% 1.3 Academic Lower 38% 39% 21% 1.0 All Academic 44% 37% 19% 1.6
Medical/Health 39% 40% 18% 0.8 Government 28% 40% 28% -0.6 Corporate 35% 51% 11% 1.9 Overall 40% 40% 19% 1.2
© 2015 Publishers Communication Group | pcgplus.com | Reproduction strictly prohibited Page 13 of 41
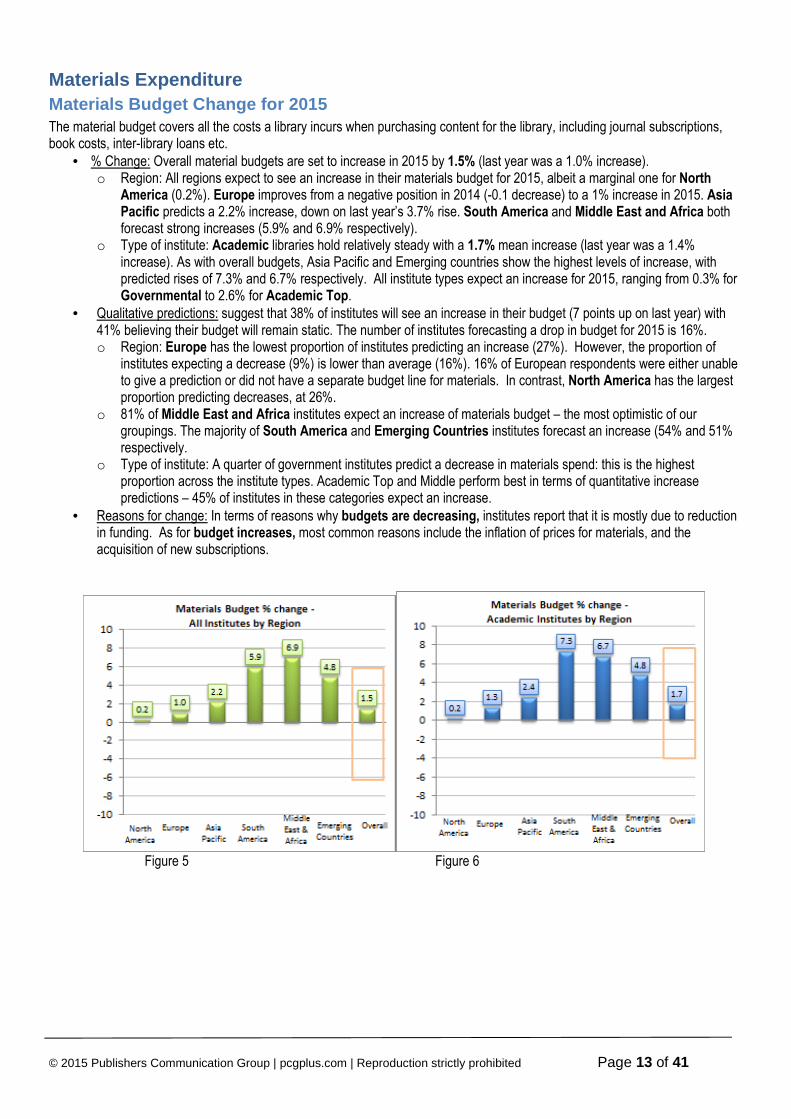
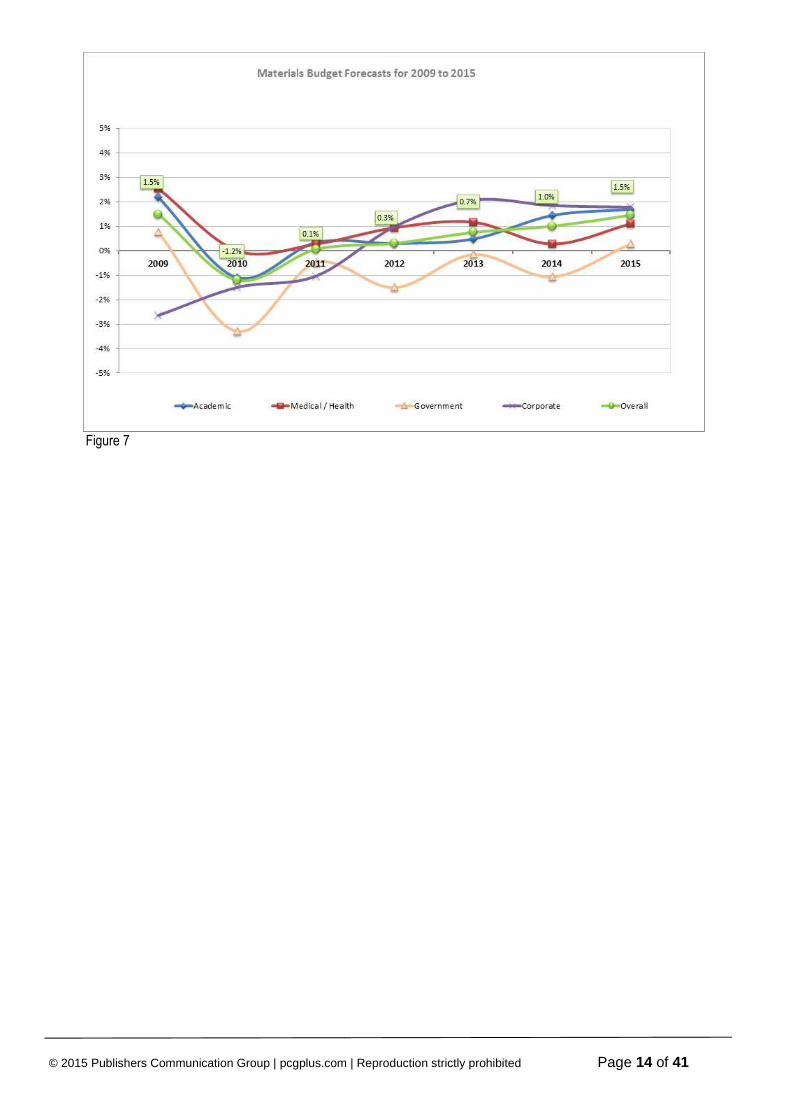
Materials Expenditure Materials Budget Change for 2015 The material budget covers all the costs a library incurs when purchasing content for the library, including journal subscriptions, book costs, inter-library loans etc.
• % Change: Overall material budgets are set to increase in 2015 by 1.5% (last year was a 1.0% increase). o Region: All regions expect to see an increase in their materials budget for 2015, albeit a marginal one for North
America (0.2%). Europe improves from a negative position in 2014 (-0.1 decrease) to a 1% increase in 2015. Asia Pacific predicts a 2.2% increase, down on last year’s 3.7% rise. South America and Middle East and Africa both forecast strong increases (5.9% and 6.9% respectively).
o Type of institute: Academic libraries hold relatively steady with a 1.7% mean increase (last year was a 1.4% increase). As with overall budgets, Asia Pacific and Emerging countries show the highest levels of increase, with predicted rises of 7.3% and 6.7% respectively. All institute types expect an increase for 2015, ranging from 0.3% for Governmental to 2.6% for Academic Top.
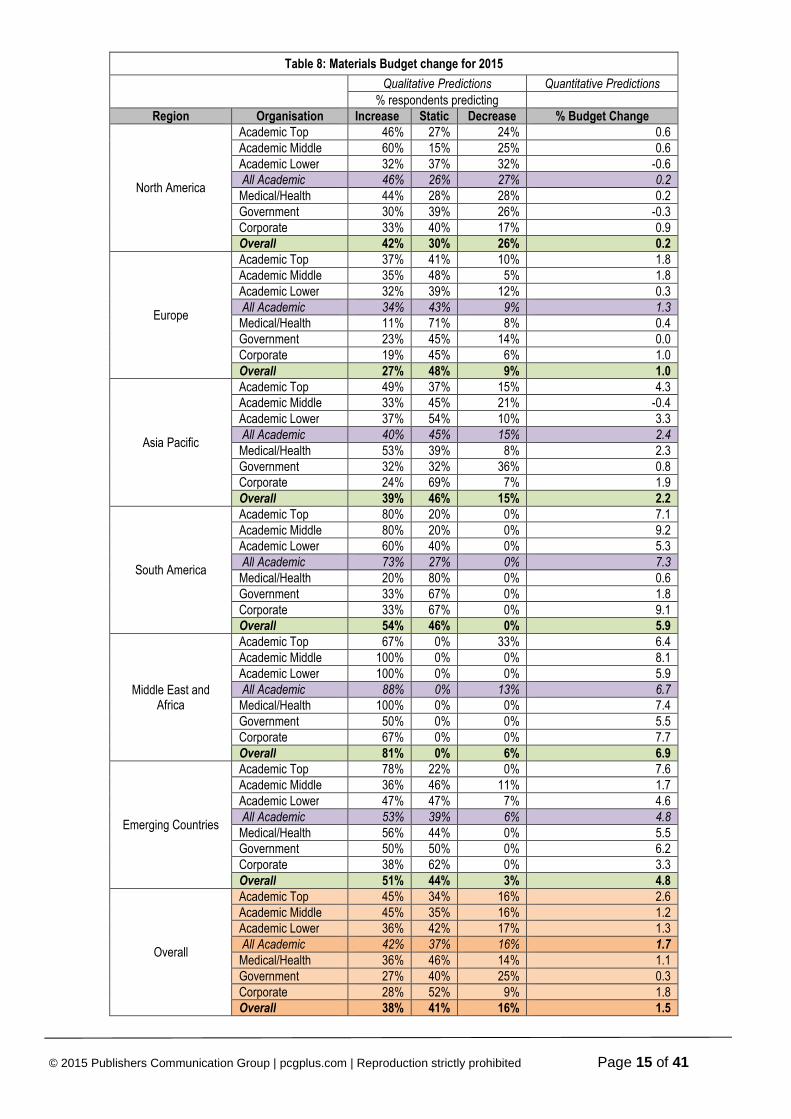
• Qualitative predictions: suggest that 38% of institutes will see an increase in their budget (7 points up on last year) with 41% believing their budget will remain static. The number of institutes forecasting a drop in budget for 2015 is 16%. o Region: Europe has the lowest proportion of institutes predicting an increase (27%). However, the proportion of
institutes expecting a decrease (9%) is lower than average (16%). 16% of European respondents were either unable to give a prediction or did not have a separate budget line for materials. In contrast, North America has the largest proportion predicting decreases, at 26%.
o 81% of Middle East and Africa institutes expect an increase of materials budget – the most optimistic of our groupings. The majority of South America and Emerging Countries institutes forecast an increase (54% and 51% respectively.
o Type of institute: A quarter of government institutes predict a decrease in materials spend: this is the highest proportion across the institute types. Academic Top and Middle perform best in terms of quantitative increase predictions – 45% of institutes in these categories expect an increase.
• Reasons for change: In terms of reasons why budgets are decreasing, institutes report that it is mostly due to reduction in funding. As for budget increases, most common reasons include the inflation of prices for materials, and the acquisition of new subscriptions.
Figure 5 Figure 6
© 2015 Publishers Communication Group | pcgplus.com | Reproduction strictly prohibited Page 14 of 41
Figure 7
© 2015 Publishers Communication Group | pcgplus.com | Reproduction strictly prohibited Page 15 of 41
Table 8: Materials Budget change for 2015
Qualitative Predictions Quantitative Predictions
% respondents predicting Region Organisation Increase Static Decrease % Budget Change
North America
Academic Top 46% 27% 24% 0.6 Academic Middle 60% 15% 25% 0.6 Academic Lower 32% 37% 32% -0.6 All Academic 46% 26% 27% 0.2
Medical/Health 44% 28% 28% 0.2 Government 30% 39% 26% -0.3 Corporate 33% 40% 17% 0.9 Overall 42% 30% 26% 0.2
Europe
Academic Top 37% 41% 10% 1.8 Academic Middle 35% 48% 5% 1.8 Academic Lower 32% 39% 12% 0.3 All Academic 34% 43% 9% 1.3
Medical/Health 11% 71% 8% 0.4 Government 23% 45% 14% 0.0 Corporate 19% 45% 6% 1.0 Overall 27% 48% 9% 1.0
Asia Pacific
Academic Top 49% 37% 15% 4.3 Academic Middle 33% 45% 21% -0.4 Academic Lower 37% 54% 10% 3.3 All Academic 40% 45% 15% 2.4
Medical/Health 53% 39% 8% 2.3 Government 32% 32% 36% 0.8 Corporate 24% 69% 7% 1.9 Overall 39% 46% 15% 2.2
South America
Academic Top 80% 20% 0% 7.1 Academic Middle 80% 20% 0% 9.2 Academic Lower 60% 40% 0% 5.3 All Academic 73% 27% 0% 7.3
Medical/Health 20% 80% 0% 0.6 Government 33% 67% 0% 1.8 Corporate 33% 67% 0% 9.1 Overall 54% 46% 0% 5.9
Middle East and Africa
Academic Top 67% 0% 33% 6.4 Academic Middle 100% 0% 0% 8.1 Academic Lower 100% 0% 0% 5.9 All Academic 88% 0% 13% 6.7
Medical/Health 100% 0% 0% 7.4 Government 50% 0% 0% 5.5 Corporate 67% 0% 0% 7.7 Overall 81% 0% 6% 6.9
Emerging Countries
Academic Top 78% 22% 0% 7.6 Academic Middle 36% 46% 11% 1.7 Academic Lower 47% 47% 7% 4.6 All Academic 53% 39% 6% 4.8
Medical/Health 56% 44% 0% 5.5 Government 50% 50% 0% 6.2 Corporate 38% 62% 0% 3.3 Overall 51% 44% 3% 4.8
Overall
Academic Top 45% 34% 16% 2.6 Academic Middle 45% 35% 16% 1.2 Academic Lower 36% 42% 17% 1.3 All Academic 42% 37% 16% 1.7
Medical/Health 36% 46% 14% 1.1 Government 27% 40% 25% 0.3 Corporate 28% 52% 9% 1.8 Overall 38% 41% 16% 1.5
© 2015 Publishers Communication Group | pcgplus.com | Reproduction strictly prohibited Page 16 of 41
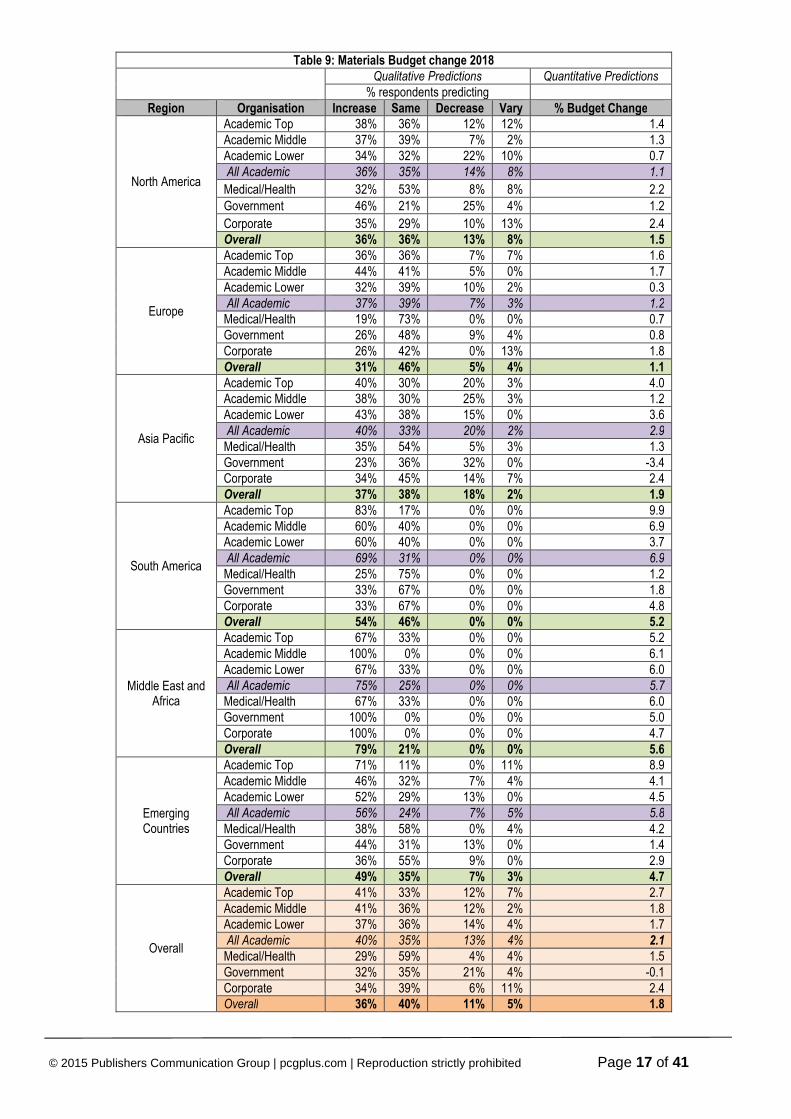
Materials Budget Change to 2018
Respondents were asked to think ahead to 2018, in order to predict whether their budget was likely to increase, remain static or decrease year on year or vary (i.e. increase one year, but decrease the following year) and by how much the materials budget would change year on year. It is important to note that this question was difficult to answer for many librarians and while figures have been quoted they are likely to be indicative. • All regions expect to see an increase across the four year period, with the overall average yearly change to be 1.8% • Middle East and Africa predict the largest year on year increase of 5.6%.
© 2015 Publishers Communication Group | pcgplus.com | Reproduction strictly prohibited Page 17 of 41
Table 9: Materials Budget change 2018
Qualitative Predictions Quantitative Predictions
% respondents predicting Region Organisation Increase Same Decrease Vary % Budget Change
North America
Academic Top 38% 36% 12% 12% 1.4 Academic Middle 37% 39% 7% 2% 1.3 Academic Lower 34% 32% 22% 10% 0.7 All Academic 36% 35% 14% 8% 1.1
Medical/Health 32% 53% 8% 8% 2.2
Government 46% 21% 25% 4% 1.2
Corporate 35% 29% 10% 13% 2.4 Overall 36% 36% 13% 8% 1.5
Europe
Academic Top 36% 36% 7% 7% 1.6 Academic Middle 44% 41% 5% 0% 1.7 Academic Lower 32% 39% 10% 2% 0.3 All Academic 37% 39% 7% 3% 1.2
Medical/Health 19% 73% 0% 0% 0.7 Government 26% 48% 9% 4% 0.8 Corporate 26% 42% 0% 13% 1.8 Overall 31% 46% 5% 4% 1.1
Asia Pacific
Academic Top 40% 30% 20% 3% 4.0 Academic Middle 38% 30% 25% 3% 1.2 Academic Lower 43% 38% 15% 0% 3.6 All Academic 40% 33% 20% 2% 2.9
Medical/Health 35% 54% 5% 3% 1.3 Government 23% 36% 32% 0% -3.4 Corporate 34% 45% 14% 7% 2.4 Overall 37% 38% 18% 2% 1.9
South America
Academic Top 83% 17% 0% 0% 9.9 Academic Middle 60% 40% 0% 0% 6.9 Academic Lower 60% 40% 0% 0% 3.7 All Academic 69% 31% 0% 0% 6.9
Medical/Health 25% 75% 0% 0% 1.2 Government 33% 67% 0% 0% 1.8 Corporate 33% 67% 0% 0% 4.8 Overall 54% 46% 0% 0% 5.2
Middle East and Africa
Academic Top 67% 33% 0% 0% 5.2 Academic Middle 100% 0% 0% 0% 6.1 Academic Lower 67% 33% 0% 0% 6.0 All Academic 75% 25% 0% 0% 5.7
Medical/Health 67% 33% 0% 0% 6.0 Government 100% 0% 0% 0% 5.0 Corporate 100% 0% 0% 0% 4.7 Overall 79% 21% 0% 0% 5.6
Emerging Countries
Academic Top 71% 11% 0% 11% 8.9 Academic Middle 46% 32% 7% 4% 4.1 Academic Lower 52% 29% 13% 0% 4.5 All Academic 56% 24% 7% 5% 5.8
Medical/Health 38% 58% 0% 4% 4.2 Government 44% 31% 13% 0% 1.4 Corporate 36% 55% 9% 0% 2.9 Overall 49% 35% 7% 3% 4.7
Overall
Academic Top 41% 33% 12% 7% 2.7 Academic Middle 41% 36% 12% 2% 1.8 Academic Lower 37% 36% 14% 4% 1.7 All Academic 40% 35% 13% 4% 2.1
Medical/Health 29% 59% 4% 4% 1.5 Government 32% 35% 21% 4% -0.1 Corporate 34% 39% 6% 11% 2.4 Overall 36% 40% 11% 5% 1.8
© 2015 Publishers Communication Group | pcgplus.com | Reproduction strictly prohibited Page 18 of 41
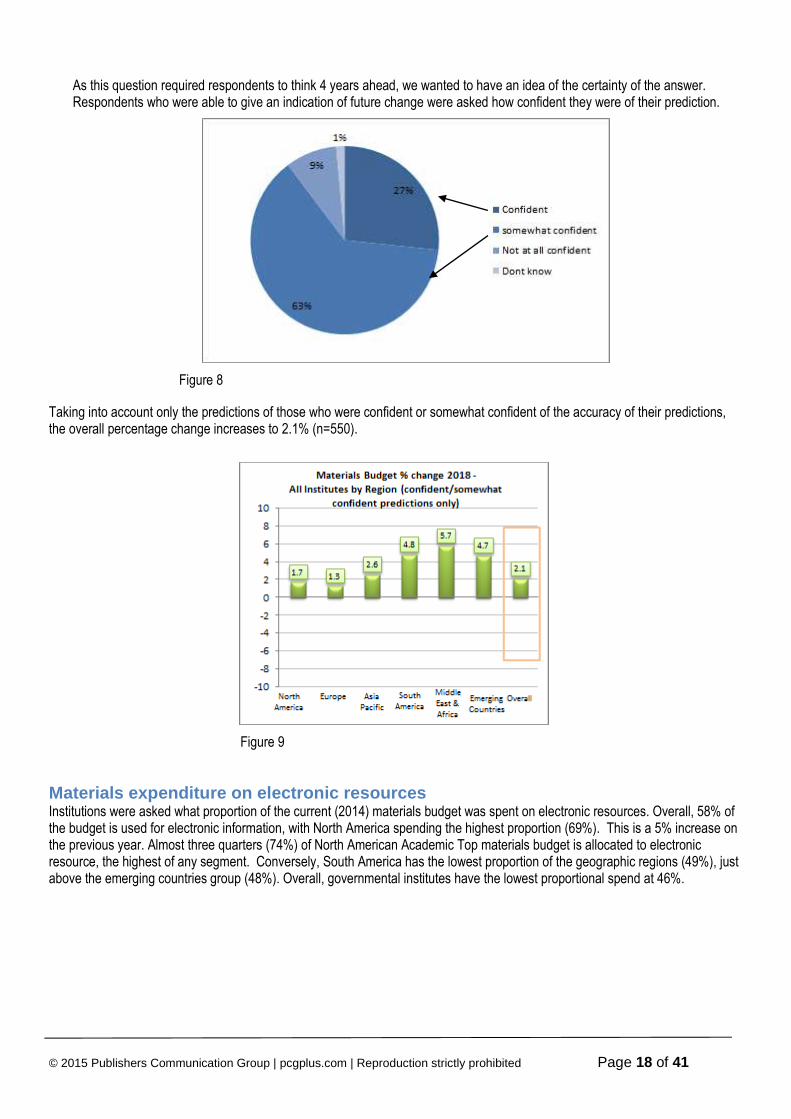
As this question required respondents to think 4 years ahead, we wanted to have an idea of the certainty of the answer. Respondents who were able to give an indication of future change were asked how confident they were of their prediction.
Figure 8
Taking into account only the predictions of those who were confident or somewhat confident of the accuracy of their predictions, the overall percentage change increases to 2.1% (n=550).
Figure 9
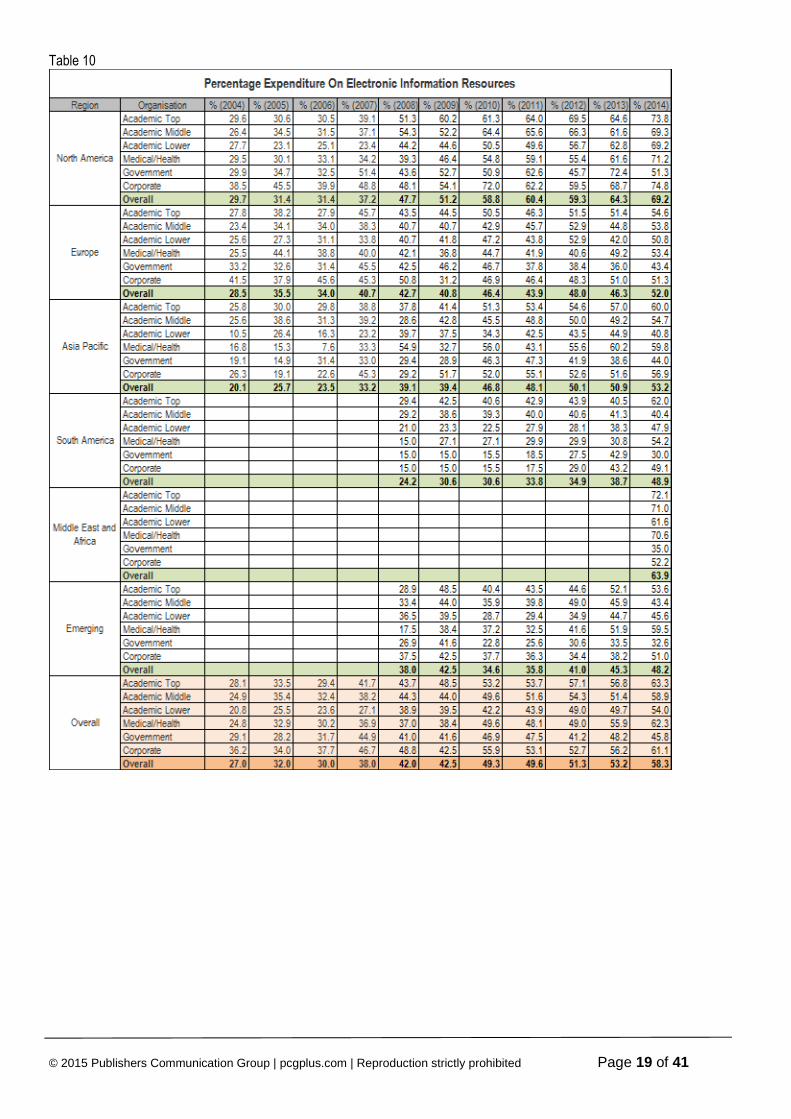
Materials expenditure on electronic resources Institutions were asked what proportion of the current (2014) materials budget was spent on electronic resources. Overall, 58% of the budget is used for electronic information, with North America spending the highest proportion (69%). This is a 5% increase on the previous year. Almost three quarters (74%) of North American Academic Top materials budget is allocated to electronic resource, the highest of any segment. Conversely, South America has the lowest proportion of the geographic regions (49%), just above the emerging countries group (48%). Overall, governmental institutes have the lowest proportional spend at 46%.
© 2015 Publishers Communication Group | pcgplus.com | Reproduction strictly prohibited Page 19 of 41
Table 10
© 2015 Publishers Communication Group | pcgplus.com | Reproduction strictly prohibited Page 20 of 41
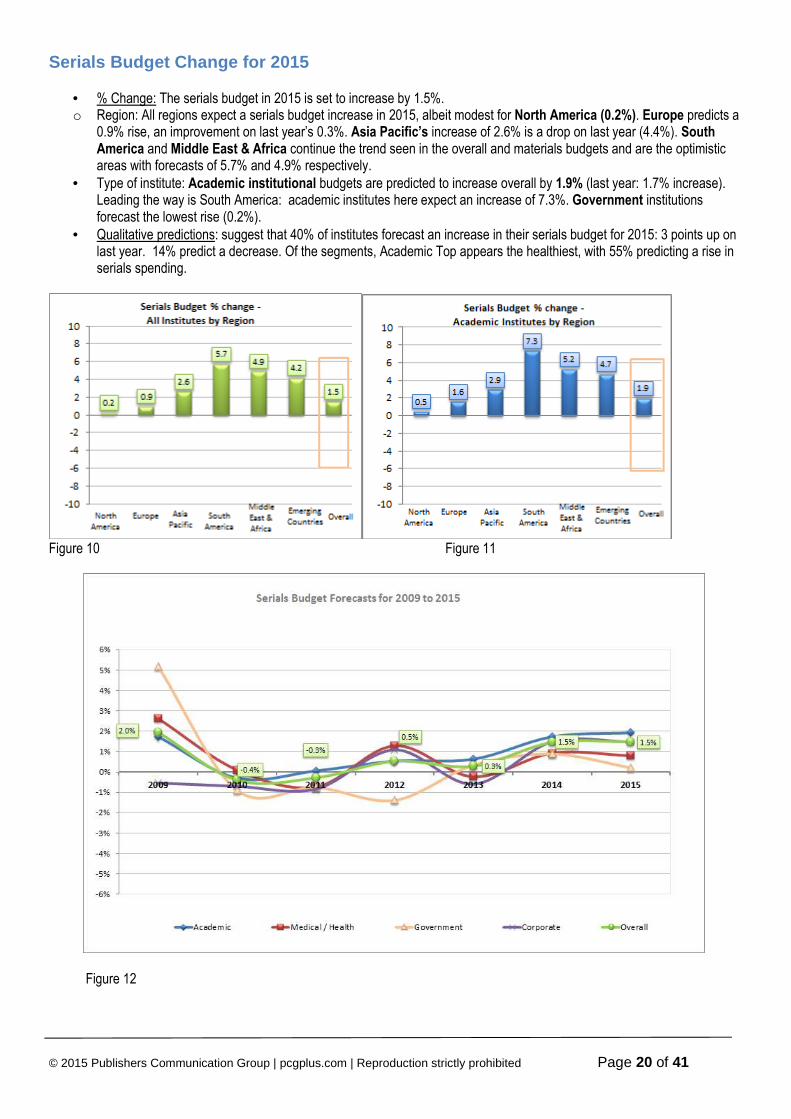
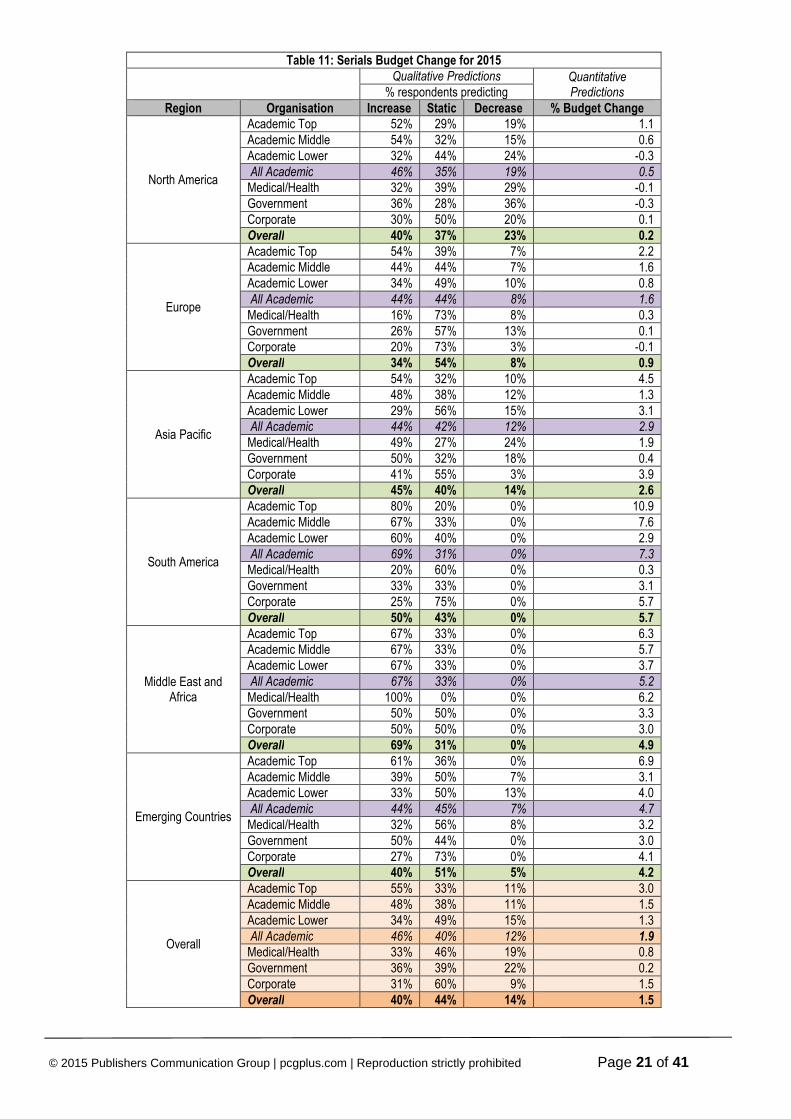
Serials Budget Change for 2015 • % Change: The serials budget in 2015 is set to increase by 1.5%. o Region: All regions expect a serials budget increase in 2015, albeit modest for North America (0.2%). Europe predicts a
0.9% rise, an improvement on last year’s 0.3%. Asia Pacific’s increase of 2.6% is a drop on last year (4.4%). South America and Middle East & Africa continue the trend seen in the overall and materials budgets and are the optimistic areas with forecasts of 5.7% and 4.9% respectively.
• Type of institute: Academic institutional budgets are predicted to increase overall by 1.9% (last year: 1.7% increase). Leading the way is South America: academic institutes here expect an increase of 7.3%. Government institutions forecast the lowest rise (0.2%).
• Qualitative predictions: suggest that 40% of institutes forecast an increase in their serials budget for 2015: 3 points up on last year. 14% predict a decrease. Of the segments, Academic Top appears the healthiest, with 55% predicting a rise in serials spending.
Figure 10 Figure 11
Figure 12
© 2015 Publishers Communication Group | pcgplus.com | Reproduction strictly prohibited Page 21 of 41
Table 11: Serials Budget Change for 2015
Qualitative Predictions Quantitative
Predictions % respondents predicting Region Organisation Increase Static Decrease % Budget Change
North America
Academic Top 52% 29% 19% 1.1 Academic Middle 54% 32% 15% 0.6 Academic Lower 32% 44% 24% -0.3 All Academic 46% 35% 19% 0.5
Medical/Health 32% 39% 29% -0.1 Government 36% 28% 36% -0.3 Corporate 30% 50% 20% 0.1 Overall 40% 37% 23% 0.2
Europe
Academic Top 54% 39% 7% 2.2 Academic Middle 44% 44% 7% 1.6 Academic Lower 34% 49% 10% 0.8 All Academic 44% 44% 8% 1.6
Medical/Health 16% 73% 8% 0.3 Government 26% 57% 13% 0.1 Corporate 20% 73% 3% -0.1 Overall 34% 54% 8% 0.9
Asia Pacific
Academic Top 54% 32% 10% 4.5 Academic Middle 48% 38% 12% 1.3 Academic Lower 29% 56% 15% 3.1 All Academic 44% 42% 12% 2.9
Medical/Health 49% 27% 24% 1.9 Government 50% 32% 18% 0.4 Corporate 41% 55% 3% 3.9 Overall 45% 40% 14% 2.6
South America
Academic Top 80% 20% 0% 10.9 Academic Middle 67% 33% 0% 7.6 Academic Lower 60% 40% 0% 2.9 All Academic 69% 31% 0% 7.3
Medical/Health 20% 60% 0% 0.3 Government 33% 33% 0% 3.1 Corporate 25% 75% 0% 5.7 Overall 50% 43% 0% 5.7
Middle East and Africa
Academic Top 67% 33% 0% 6.3 Academic Middle 67% 33% 0% 5.7 Academic Lower 67% 33% 0% 3.7 All Academic 67% 33% 0% 5.2
Medical/Health 100% 0% 0% 6.2 Government 50% 50% 0% 3.3 Corporate 50% 50% 0% 3.0 Overall 69% 31% 0% 4.9
Emerging Countries
Academic Top 61% 36% 0% 6.9 Academic Middle 39% 50% 7% 3.1 Academic Lower 33% 50% 13% 4.0 All Academic 44% 45% 7% 4.7
Medical/Health 32% 56% 8% 3.2 Government 50% 44% 0% 3.0 Corporate 27% 73% 0% 4.1 Overall 40% 51% 5% 4.2
Overall
Academic Top 55% 33% 11% 3.0 Academic Middle 48% 38% 11% 1.5 Academic Lower 34% 49% 15% 1.3 All Academic 46% 40% 12% 1.9
Medical/Health 33% 46% 19% 0.8 Government 36% 39% 22% 0.2 Corporate 31% 60% 9% 1.5 Overall 40% 44% 14% 1.5
© 2015 Publishers Communication Group | pcgplus.com | Reproduction strictly prohibited Page 22 of 41
Reasons for Decrease in Serials Budget Librarians were asked why they believed their budgets had changed.
• Altogether 95 librarians gave reasons as to why they thought it had decreased. Reduction in available funds stays as the top reason (51%). 26% ascribe the decrease to consequence of the shift from print to electronic. This year 26% indicate that it is due to cancellation of unneeded serials.
Reasons for Increase in Serials Budget
• 276 librarians were able to specify why their budget had increased. The most often stated reason (57%) was due to price increase and new subscriptions, followed by price inflation (46%)
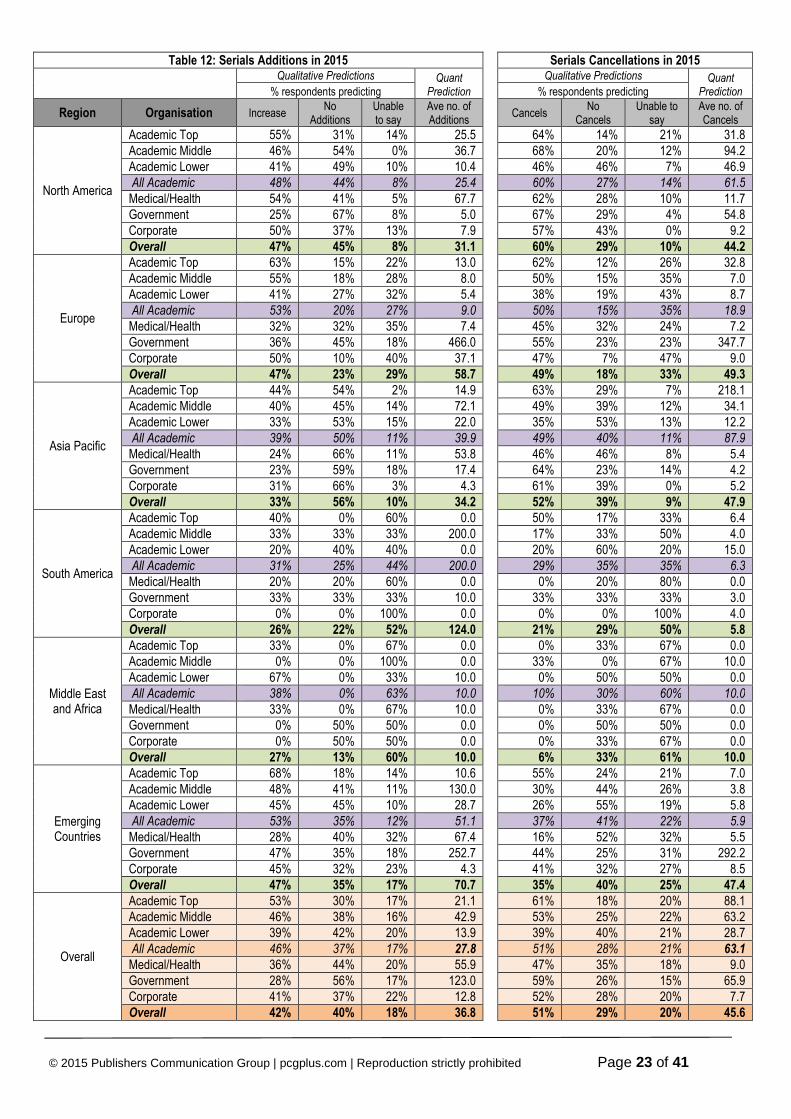
Plans for Serial Additions and Cancellations Many libraries manage their budgets by cancelling and subscribing to different journals in order to minimize costs. It is quite feasible for an institute to see a decrease in their serials budget, but an increase in the number of journals purchased (through the acquisition of more inexpensive titles). Change is often based upon usage data, a desire to streamline particular subjects, or simply cancelling the most expensive titles. • The percentage of institutes cancelling (51%) is higher than those adding (42%). This is reflected in the average number of
cancellations (45.6) outstripping the number of additions (36.8). • One Russian government organization plans to cancel 2000 but add 2000. This has caused some skew in the Europe,
Emerging and Overall government figures. • It should be noted that many librarians, whilst aware of the likelihood of cancellations/additions, were unable to give a
quantitative figure. Therefore, some figures in the following section are based on low numbers of responses. • Academic institutes plan to cancel 63 journals on average and add only 28. Medical institutes will add 56 whilst cancelling 9. Those cancelling titles were asked to give the reason(s) behind the cancellation decisions. 65% stated that cancellations were made on journals that were no longer relevant or had low usage statistics. 41% indicated a lack of funds, whilst 36% mentioned the price of the journal (n.b. respondents were able to choose more than one reason for cancellation)
© 2015 Publishers Communication Group | pcgplus.com | Reproduction strictly prohibited Page 23 of 41
Table 12: Serials Additions in 2015 Serials Cancellations in 2015
Qualitative Predictions Quant
Prediction
Qualitative Predictions Quant Prediction % respondents predicting % respondents predicting
Region Organisation Increase No
Additions Unable to say
Ave no. of Additions Cancels
No Cancels
Unable to say
Ave no. of Cancels
North America
Academic Top 55% 31% 14% 25.5 64% 14% 21% 31.8 Academic Middle 46% 54% 0% 36.7 68% 20% 12% 94.2 Academic Lower 41% 49% 10% 10.4 46% 46% 7% 46.9 All Academic 48% 44% 8% 25.4 60% 27% 14% 61.5
Medical/Health 54% 41% 5% 67.7 62% 28% 10% 11.7 Government 25% 67% 8% 5.0 67% 29% 4% 54.8 Corporate 50% 37% 13% 7.9 57% 43% 0% 9.2 Overall 47% 45% 8% 31.1 60% 29% 10% 44.2
Europe
Academic Top 63% 15% 22% 13.0 62% 12% 26% 32.8 Academic Middle 55% 18% 28% 8.0 50% 15% 35% 7.0 Academic Lower 41% 27% 32% 5.4 38% 19% 43% 8.7 All Academic 53% 20% 27% 9.0 50% 15% 35% 18.9
Medical/Health 32% 32% 35% 7.4 45% 32% 24% 7.2 Government 36% 45% 18% 466.0 55% 23% 23% 347.7 Corporate 50% 10% 40% 37.1 47% 7% 47% 9.0 Overall 47% 23% 29% 58.7 49% 18% 33% 49.3
Asia Pacific
Academic Top 44% 54% 2% 14.9 63% 29% 7% 218.1 Academic Middle 40% 45% 14% 72.1 49% 39% 12% 34.1 Academic Lower 33% 53% 15% 22.0 35% 53% 13% 12.2 All Academic 39% 50% 11% 39.9 49% 40% 11% 87.9
Medical/Health 24% 66% 11% 53.8 46% 46% 8% 5.4 Government 23% 59% 18% 17.4 64% 23% 14% 4.2 Corporate 31% 66% 3% 4.3 61% 39% 0% 5.2 Overall 33% 56% 10% 34.2 52% 39% 9% 47.9
South America
Academic Top 40% 0% 60% 0.0 50% 17% 33% 6.4 Academic Middle 33% 33% 33% 200.0 17% 33% 50% 4.0 Academic Lower 20% 40% 40% 0.0 20% 60% 20% 15.0 All Academic 31% 25% 44% 200.0 29% 35% 35% 6.3
Medical/Health 20% 20% 60% 0.0 0% 20% 80% 0.0 Government 33% 33% 33% 10.0 33% 33% 33% 3.0 Corporate 0% 0% 100% 0.0 0% 0% 100% 4.0 Overall 26% 22% 52% 124.0 21% 29% 50% 5.8
Middle East and Africa
Academic Top 33% 0% 67% 0.0 0% 33% 67% 0.0 Academic Middle 0% 0% 100% 0.0 33% 0% 67% 10.0 Academic Lower 67% 0% 33% 10.0 0% 50% 50% 0.0 All Academic 38% 0% 63% 10.0 10% 30% 60% 10.0
Medical/Health 33% 0% 67% 10.0 0% 33% 67% 0.0 Government 0% 50% 50% 0.0 0% 50% 50% 0.0 Corporate 0% 50% 50% 0.0 0% 33% 67% 0.0 Overall 27% 13% 60% 10.0 6% 33% 61% 10.0
Emerging Countries
Academic Top 68% 18% 14% 10.6 55% 24% 21% 7.0 Academic Middle 48% 41% 11% 130.0 30% 44% 26% 3.8 Academic Lower 45% 45% 10% 28.7 26% 55% 19% 5.8 All Academic 53% 35% 12% 51.1 37% 41% 22% 5.9
Medical/Health 28% 40% 32% 67.4 16% 52% 32% 5.5 Government 47% 35% 18% 252.7 44% 25% 31% 292.2 Corporate 45% 32% 23% 4.3 41% 32% 27% 8.5 Overall 47% 35% 17% 70.7 35% 40% 25% 47.4
Overall
Academic Top 53% 30% 17% 21.1 61% 18% 20% 88.1 Academic Middle 46% 38% 16% 42.9 53% 25% 22% 63.2 Academic Lower 39% 42% 20% 13.9 39% 40% 21% 28.7 All Academic 46% 37% 17% 27.8 51% 28% 21% 63.1
Medical/Health 36% 44% 20% 55.9 47% 35% 18% 9.0 Government 28% 56% 17% 123.0 59% 26% 15% 65.9 Corporate 41% 37% 22% 12.8 52% 28% 20% 7.7 Overall 42% 40% 18% 36.8 51% 29% 20% 45.6
© 2015 Publishers Communication Group | pcgplus.com | Reproduction strictly prohibited Page 24 of 41
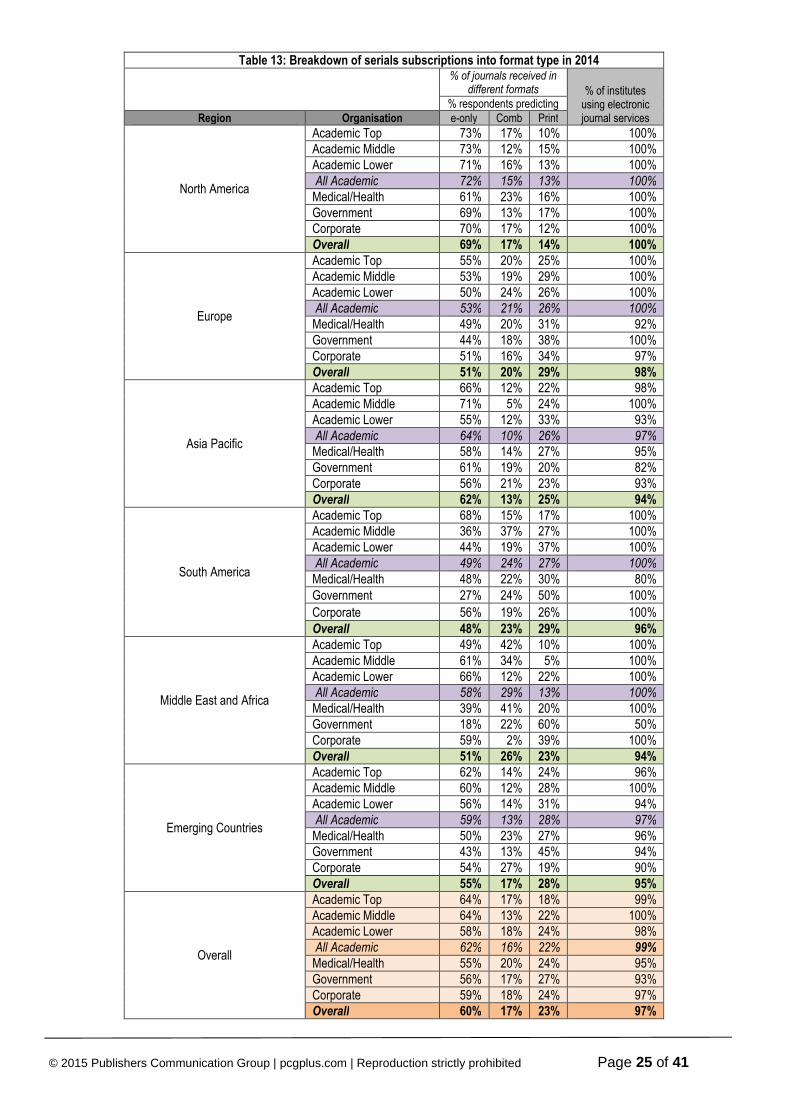
Electronic Journals and Breakdown of Serial Subscription into Format Type
Librarians were asked if they took an e-journal service and if they did what proportion of their subscriptions were received in electronic form. • 97% of institutes surveyed currently use e-journal service providers. • The proportion of journals taken in e-only format is 60% while the subscription in combined format rises one point to 17%.
Just under a quarter of subscriptions are taken in the print only format (23%). • North America has both the highest proportion of e-only subscriptions (69%). Just 14% of North American subscriptions are
to print only journals. • South America has the lowest take up of e-only subscriptions (48%), although this has increased by 4% on last year), • Academic institutes are more likely to take e-only subscriptions (62%) than other types, and the take-up for Academic Top
and Middle reached 64% in 2014. • Only North America have 100% take up on provision of electronic journal services.
© 2015 Publishers Communication Group | pcgplus.com | Reproduction strictly prohibited Page 25 of 41
Table 13: Breakdown of serials subscriptions into format type in 2014
% of journals received in different formats % of institutes
using electronic journal services
% respondents predicting Region Organisation e-only Comb Print
North America
Academic Top 73% 17% 10% 100% Academic Middle 73% 12% 15% 100% Academic Lower 71% 16% 13% 100% All Academic 72% 15% 13% 100%
Medical/Health 61% 23% 16% 100% Government 69% 13% 17% 100% Corporate 70% 17% 12% 100% Overall 69% 17% 14% 100%
Europe
Academic Top 55% 20% 25% 100% Academic Middle 53% 19% 29% 100% Academic Lower 50% 24% 26% 100% All Academic 53% 21% 26% 100%
Medical/Health 49% 20% 31% 92% Government 44% 18% 38% 100% Corporate 51% 16% 34% 97% Overall 51% 20% 29% 98%
Asia Pacific
Academic Top 66% 12% 22% 98% Academic Middle 71% 5% 24% 100% Academic Lower 55% 12% 33% 93% All Academic 64% 10% 26% 97%
Medical/Health 58% 14% 27% 95% Government 61% 19% 20% 82% Corporate 56% 21% 23% 93% Overall 62% 13% 25% 94%
South America
Academic Top 68% 15% 17% 100% Academic Middle 36% 37% 27% 100% Academic Lower 44% 19% 37% 100% All Academic 49% 24% 27% 100%
Medical/Health 48% 22% 30% 80% Government 27% 24% 50% 100%
Corporate 56% 19% 26% 100% Overall 48% 23% 29% 96%
Middle East and Africa
Academic Top 49% 42% 10% 100% Academic Middle 61% 34% 5% 100% Academic Lower 66% 12% 22% 100% All Academic 58% 29% 13% 100%
Medical/Health 39% 41% 20% 100% Government 18% 22% 60% 50% Corporate 59% 2% 39% 100% Overall 51% 26% 23% 94%
Emerging Countries
Academic Top 62% 14% 24% 96% Academic Middle 60% 12% 28% 100% Academic Lower 56% 14% 31% 94% All Academic 59% 13% 28% 97%
Medical/Health 50% 23% 27% 96% Government 43% 13% 45% 94% Corporate 54% 27% 19% 90% Overall 55% 17% 28% 95%
Overall
Academic Top 64% 17% 18% 99% Academic Middle 64% 13% 22% 100% Academic Lower 58% 18% 24% 98% All Academic 62% 16% 22% 99%
Medical/Health 55% 20% 24% 95% Government 56% 17% 27% 93% Corporate 59% 18% 24% 97% Overall 60% 17% 23% 97%
© 2015 Publishers Communication Group | pcgplus.com | Reproduction strictly prohibited Page 26 of 41
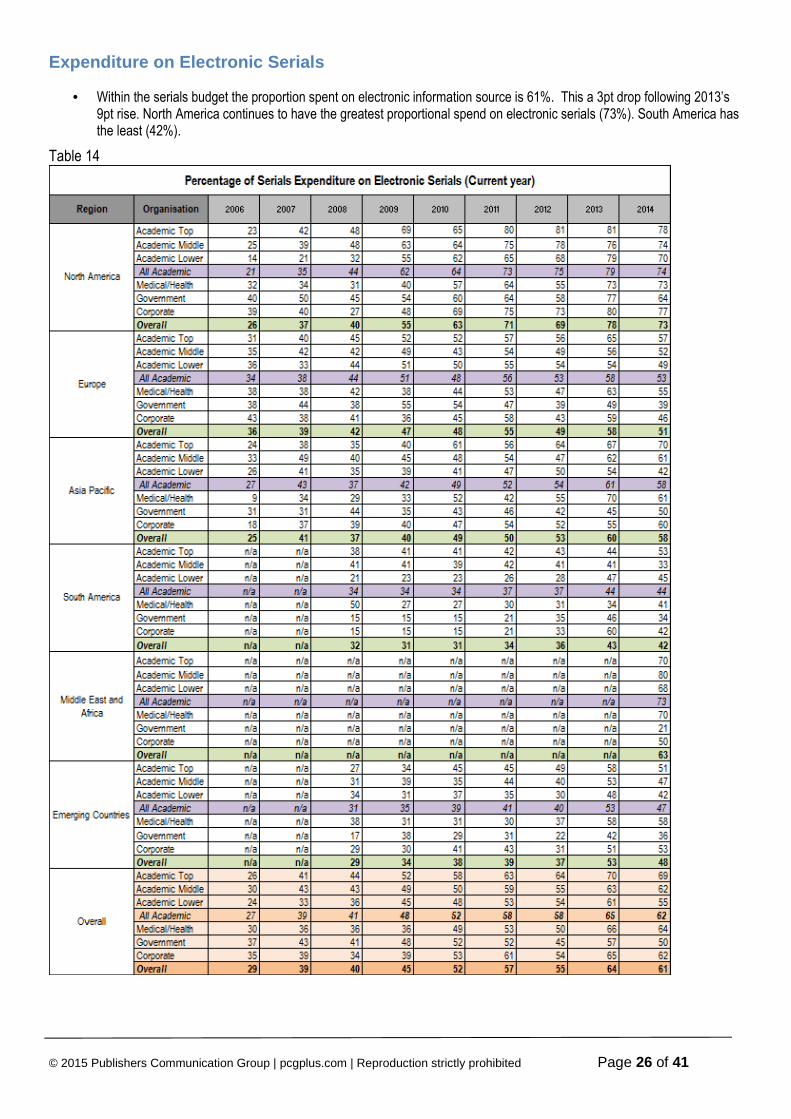
Expenditure on Electronic Serials
• Within the serials budget the proportion spent on electronic information source is 61%. This a 3pt drop following 2013’s 9pt rise. North America continues to have the greatest proportional spend on electronic serials (73%). South America has the least (42%).
Table 14
© 2015 Publishers Communication Group | pcgplus.com | Reproduction strictly prohibited Page 27 of 41
E-Journal Budgets • 55% of institutions expect their spending on electronic resources to increase in 2015. Overall, spending on electronic
resources is set to rise by 3.7%. • Two thirds (64%) of North American institutes expect an increase in electronic resource funding. Just 41% of European
institutes expect a rise, with 45% believing it will remain static.
Table 15: Electronic resource spending in 2015
Qualitative predictions Quantitative predictions
Region Increase Remain the
same Decrease % change North America 64% 27% 8% 3.3% Europe 41% 45% 1% 2.5% Asia 59% 30% 9% 4.6%
South America 48% 44% 0% 7.0% Middle East and Africa 87% 13% 0% 7.7%
Emerging Countries 58% 37% 1% 7.5% Total 55% 34% 6% 3.7%
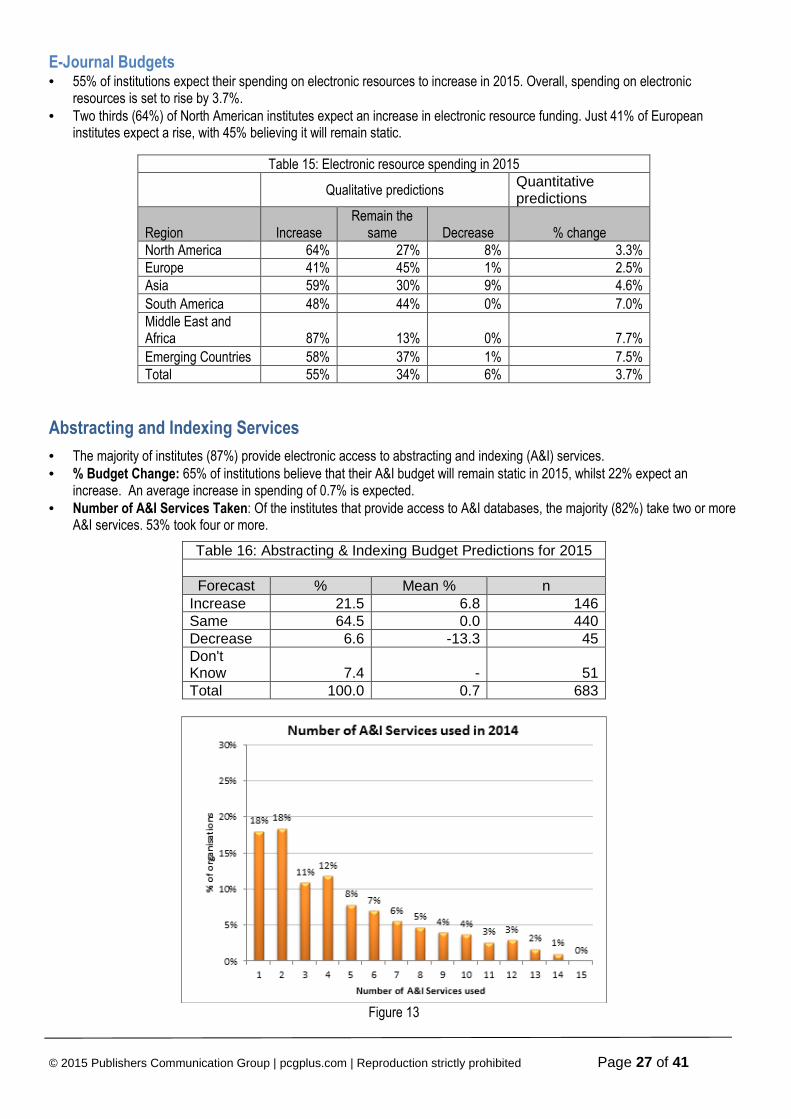
Abstracting and Indexing Services
• The majority of institutes (87%) provide electronic access to abstracting and indexing (A&I) services. • % Budget Change: 65% of institutions believe that their A&I budget will remain static in 2015, whilst 22% expect an
increase. An average increase in spending of 0.7% is expected. • Number of A&I Services Taken: Of the institutes that provide access to A&I databases, the majority (82%) take two or more
A&I services. 53% took four or more.
Table 16: Abstracting & Indexing Budget Predictions for 2015
Forecast % Mean % n Increase 21.5 6.8 146 Same 64.5 0.0 440 Decrease 6.6 -13.3 45 Don't Know 7.4 - 51 Total 100.0 0.7 683
Figure 13

© 2015 Publishers Communication Group | pcgplus.com | Reproduction strictly prohibited Page 28 of 41
Books Expenditure
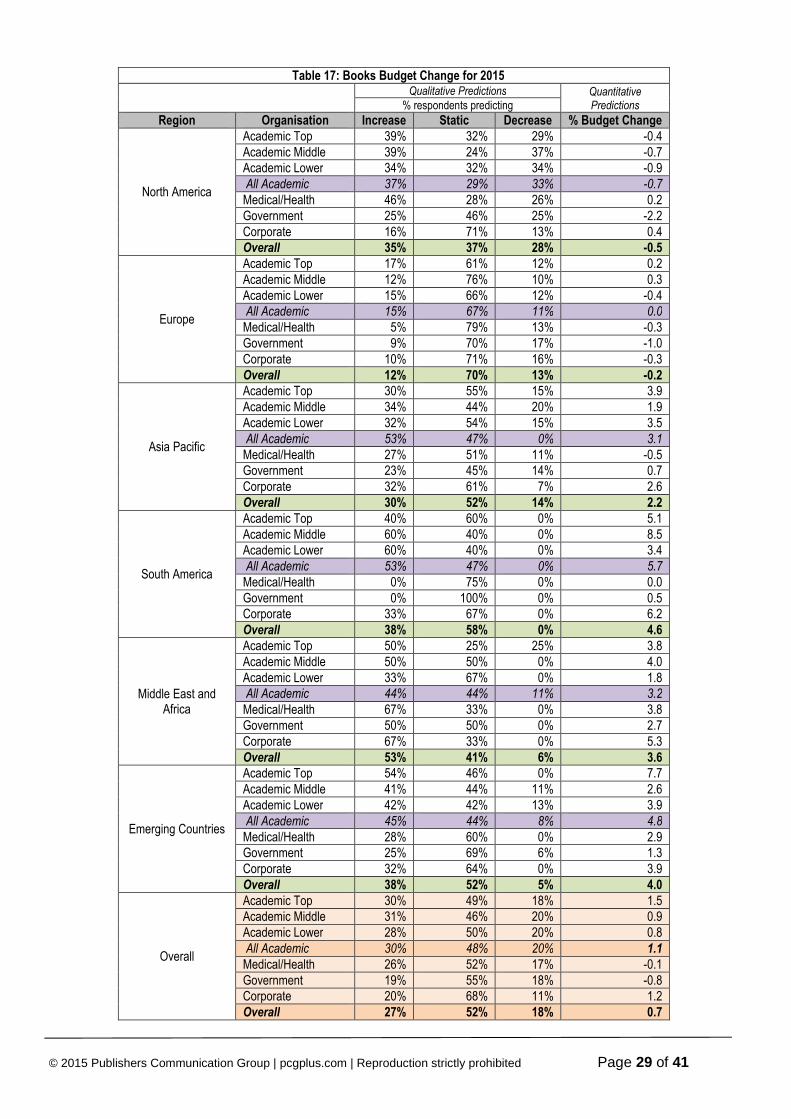
Books Budget Change for 2015
• Books budgets, which includes electronic books, are predicted to increase by 0.7% in 2015 (last year was 2.0%). o Regions: North America and Europe both predict a decrease (-0.5% and -0.2% respectively. This is the 6th successive
year that North America has expected a decrease, but the cut is less severe than last year (-1.1% decrease). o As with other budgetary areas, Asia Pacific predicts an increase (2.2%), but this is below the higher levels forecast in
previous years (a 5.6% increase was predicted for 2014 budgets). o South America and Middle East and Africa both post higher levels of increases than the other regions at 4.6% and
3.6% respectively. South America’s figures are down slightly on last year (was a 5% increase) and are also proportionally smaller than the changes predicted for the other main budgetary areas.
o Emerging countries predict a 4% increase, a decrease on last year (5.6%) o Amongst the academic budgets, only North America expects a downturn (-0.7%). European Academic institutes expect
a static budget, whilst the other regions predict increases. Overall, Academic institutes predict a 1.1% rise. Corporate is the only other sector to forecast an increase (1.2%)
• Qualitative forecasts indicate that the majority (52%) of institutes believe their budgets will remain static. 27% of institutes predict that their budget expenditure for 2015 will increase, 18% are predicting a decrease.
Figure 14 Figure 15
Figure 16
© 2015 Publishers Communication Group | pcgplus.com | Reproduction strictly prohibited Page 29 of 41
Table 17: Books Budget Change for 2015
Qualitative Predictions Quantitative
Predictions % respondents predicting Region Organisation Increase Static Decrease % Budget Change
North America
Academic Top 39% 32% 29% -0.4 Academic Middle 39% 24% 37% -0.7 Academic Lower 34% 32% 34% -0.9 All Academic 37% 29% 33% -0.7
Medical/Health 46% 28% 26% 0.2 Government 25% 46% 25% -2.2 Corporate 16% 71% 13% 0.4 Overall 35% 37% 28% -0.5
Europe
Academic Top 17% 61% 12% 0.2 Academic Middle 12% 76% 10% 0.3 Academic Lower 15% 66% 12% -0.4 All Academic 15% 67% 11% 0.0
Medical/Health 5% 79% 13% -0.3 Government 9% 70% 17% -1.0 Corporate 10% 71% 16% -0.3 Overall 12% 70% 13% -0.2
Asia Pacific
Academic Top 30% 55% 15% 3.9 Academic Middle 34% 44% 20% 1.9 Academic Lower 32% 54% 15% 3.5 All Academic 53% 47% 0% 3.1
Medical/Health 27% 51% 11% -0.5 Government 23% 45% 14% 0.7 Corporate 32% 61% 7% 2.6 Overall 30% 52% 14% 2.2
South America
Academic Top 40% 60% 0% 5.1 Academic Middle 60% 40% 0% 8.5 Academic Lower 60% 40% 0% 3.4 All Academic 53% 47% 0% 5.7
Medical/Health 0% 75% 0% 0.0 Government 0% 100% 0% 0.5 Corporate 33% 67% 0% 6.2 Overall 38% 58% 0% 4.6
Middle East and Africa
Academic Top 50% 25% 25% 3.8 Academic Middle 50% 50% 0% 4.0 Academic Lower 33% 67% 0% 1.8 All Academic 44% 44% 11% 3.2
Medical/Health 67% 33% 0% 3.8 Government 50% 50% 0% 2.7 Corporate 67% 33% 0% 5.3 Overall 53% 41% 6% 3.6
Emerging Countries
Academic Top 54% 46% 0% 7.7 Academic Middle 41% 44% 11% 2.6 Academic Lower 42% 42% 13% 3.9 All Academic 45% 44% 8% 4.8
Medical/Health 28% 60% 0% 2.9 Government 25% 69% 6% 1.3 Corporate 32% 64% 0% 3.9 Overall 38% 52% 5% 4.0
Overall
Academic Top 30% 49% 18% 1.5 Academic Middle 31% 46% 20% 0.9 Academic Lower 28% 50% 20% 0.8 All Academic 30% 48% 20% 1.1
Medical/Health 26% 52% 17% -0.1 Government 19% 55% 18% -0.8 Corporate 20% 68% 11% 1.2 Overall 27% 52% 18% 0.7
© 2015 Publishers Communication Group | pcgplus.com | Reproduction strictly prohibited Page 30 of 41
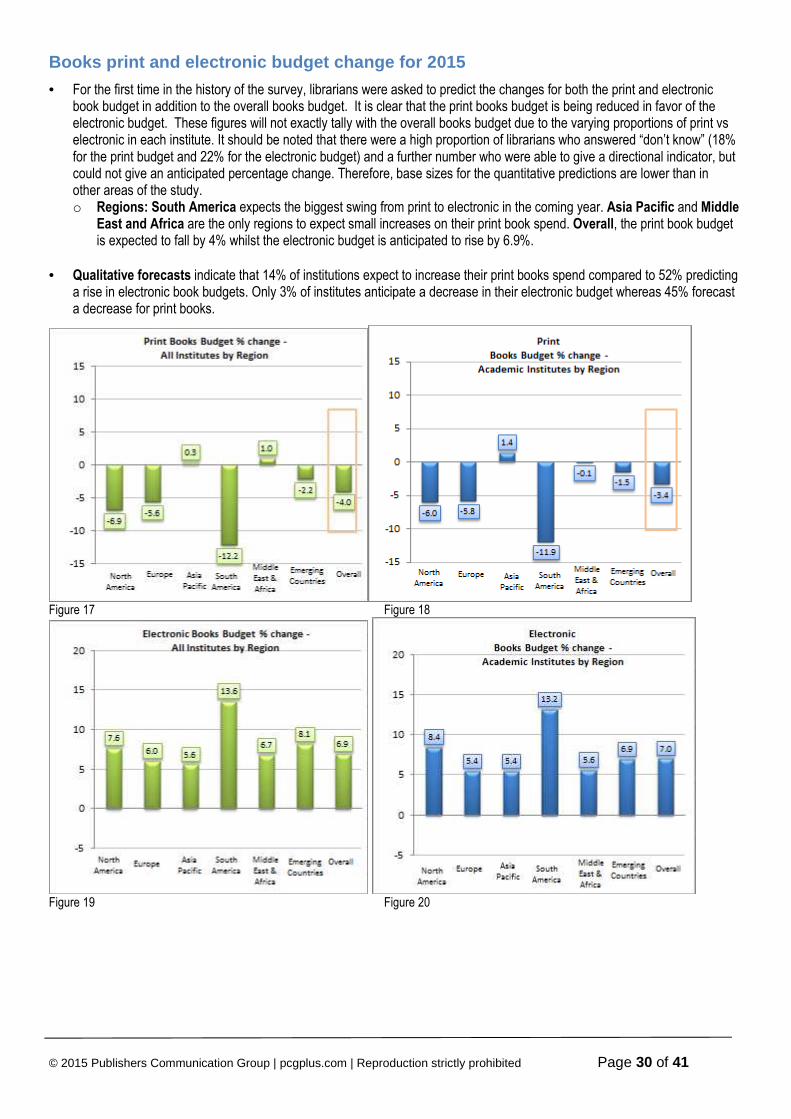
Books print and electronic budget change for 2015
• For the first time in the history of the survey, librarians were asked to predict the changes for both the print and electronic book budget in addition to the overall books budget. It is clear that the print books budget is being reduced in favor of the electronic budget. These figures will not exactly tally with the overall books budget due to the varying proportions of print vs electronic in each institute. It should be noted that there were a high proportion of librarians who answered “don’t know” (18% for the print budget and 22% for the electronic budget) and a further number who were able to give a directional indicator, but could not give an anticipated percentage change. Therefore, base sizes for the quantitative predictions are lower than in other areas of the study. o Regions: South America expects the biggest swing from print to electronic in the coming year. Asia Pacific and Middle
East and Africa are the only regions to expect small increases on their print book spend. Overall, the print book budget is expected to fall by 4% whilst the electronic budget is anticipated to rise by 6.9%.
• Qualitative forecasts indicate that 14% of institutions expect to increase their print books spend compared to 52% predicting a rise in electronic book budgets. Only 3% of institutes anticipate a decrease in their electronic budget whereas 45% forecast a decrease for print books.
Figure 17 Figure 18
Figure 19 Figure 20
© 2015 Publishers Communication Group | pcgplus.com | Reproduction strictly prohibited Page 31 of 41
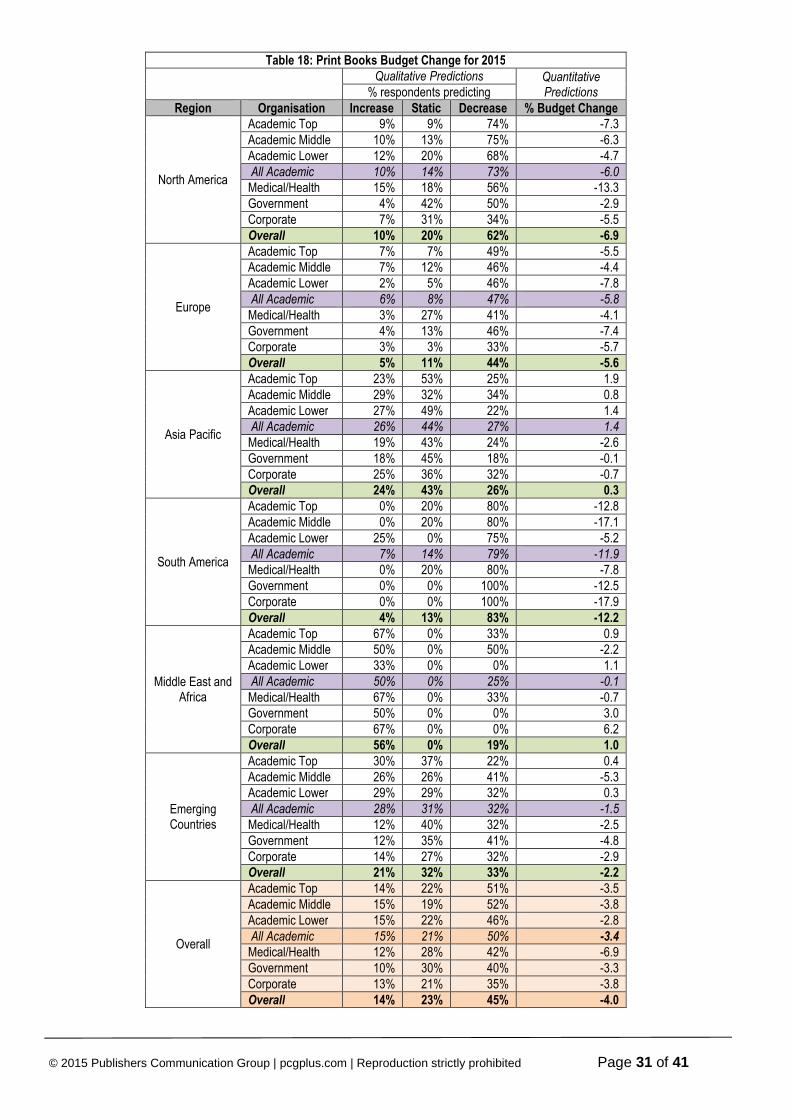
Table 18: Print Books Budget Change for 2015
Qualitative Predictions Quantitative
Predictions % respondents predicting Region Organisation Increase Static Decrease % Budget Change
North America
Academic Top 9% 9% 74% -7.3 Academic Middle 10% 13% 75% -6.3 Academic Lower 12% 20% 68% -4.7 All Academic 10% 14% 73% -6.0
Medical/Health 15% 18% 56% -13.3 Government 4% 42% 50% -2.9 Corporate 7% 31% 34% -5.5 Overall 10% 20% 62% -6.9
Europe
Academic Top 7% 7% 49% -5.5 Academic Middle 7% 12% 46% -4.4 Academic Lower 2% 5% 46% -7.8 All Academic 6% 8% 47% -5.8
Medical/Health 3% 27% 41% -4.1 Government 4% 13% 46% -7.4 Corporate 3% 3% 33% -5.7 Overall 5% 11% 44% -5.6
Asia Pacific
Academic Top 23% 53% 25% 1.9 Academic Middle 29% 32% 34% 0.8 Academic Lower 27% 49% 22% 1.4 All Academic 26% 44% 27% 1.4
Medical/Health 19% 43% 24% -2.6 Government 18% 45% 18% -0.1 Corporate 25% 36% 32% -0.7 Overall 24% 43% 26% 0.3
South America
Academic Top 0% 20% 80% -12.8 Academic Middle 0% 20% 80% -17.1 Academic Lower 25% 0% 75% -5.2 All Academic 7% 14% 79% -11.9
Medical/Health 0% 20% 80% -7.8 Government 0% 0% 100% -12.5 Corporate 0% 0% 100% -17.9 Overall 4% 13% 83% -12.2
Middle East and Africa
Academic Top 67% 0% 33% 0.9 Academic Middle 50% 0% 50% -2.2 Academic Lower 33% 0% 0% 1.1 All Academic 50% 0% 25% -0.1
Medical/Health 67% 0% 33% -0.7 Government 50% 0% 0% 3.0 Corporate 67% 0% 0% 6.2 Overall 56% 0% 19% 1.0
Emerging Countries
Academic Top 30% 37% 22% 0.4 Academic Middle 26% 26% 41% -5.3 Academic Lower 29% 29% 32% 0.3 All Academic 28% 31% 32% -1.5
Medical/Health 12% 40% 32% -2.5 Government 12% 35% 41% -4.8 Corporate 14% 27% 32% -2.9 Overall 21% 32% 33% -2.2
Overall
Academic Top 14% 22% 51% -3.5 Academic Middle 15% 19% 52% -3.8 Academic Lower 15% 22% 46% -2.8 All Academic 15% 21% 50% -3.4
Medical/Health 12% 28% 42% -6.9 Government 10% 30% 40% -3.3 Corporate 13% 21% 35% -3.8 Overall 14% 23% 45% -4.0
© 2015 Publishers Communication Group | pcgplus.com | Reproduction strictly prohibited Page 32 of 41
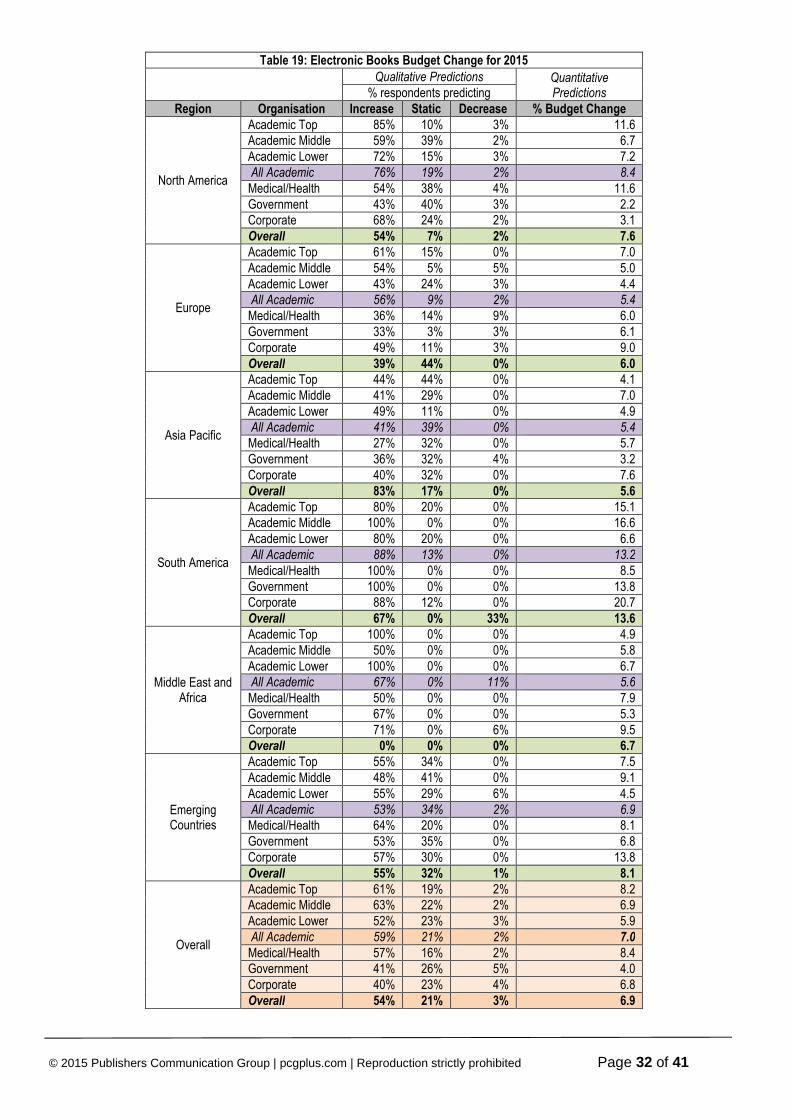
Table 19: Electronic Books Budget Change for 2015
Qualitative Predictions Quantitative
Predictions % respondents predicting Region Organisation Increase Static Decrease % Budget Change
North America
Academic Top 85% 10% 3% 11.6 Academic Middle 59% 39% 2% 6.7 Academic Lower 72% 15% 3% 7.2 All Academic 76% 19% 2% 8.4
Medical/Health 54% 38% 4% 11.6 Government 43% 40% 3% 2.2 Corporate 68% 24% 2% 3.1 Overall 54% 7% 2% 7.6
Europe
Academic Top 61% 15% 0% 7.0 Academic Middle 54% 5% 5% 5.0 Academic Lower 43% 24% 3% 4.4 All Academic 56% 9% 2% 5.4
Medical/Health 36% 14% 9% 6.0 Government 33% 3% 3% 6.1 Corporate 49% 11% 3% 9.0 Overall 39% 44% 0% 6.0
Asia Pacific
Academic Top 44% 44% 0% 4.1 Academic Middle 41% 29% 0% 7.0 Academic Lower 49% 11% 0% 4.9 All Academic 41% 39% 0% 5.4
Medical/Health 27% 32% 0% 5.7 Government 36% 32% 4% 3.2 Corporate 40% 32% 0% 7.6 Overall 83% 17% 0% 5.6
South America
Academic Top 80% 20% 0% 15.1 Academic Middle 100% 0% 0% 16.6 Academic Lower 80% 20% 0% 6.6 All Academic 88% 13% 0% 13.2
Medical/Health 100% 0% 0% 8.5 Government 100% 0% 0% 13.8 Corporate 88% 12% 0% 20.7 Overall 67% 0% 33% 13.6
Middle East and Africa
Academic Top 100% 0% 0% 4.9 Academic Middle 50% 0% 0% 5.8 Academic Lower 100% 0% 0% 6.7 All Academic 67% 0% 11% 5.6
Medical/Health 50% 0% 0% 7.9 Government 67% 0% 0% 5.3 Corporate 71% 0% 6% 9.5 Overall 0% 0% 0% 6.7
Emerging Countries
Academic Top 55% 34% 0% 7.5 Academic Middle 48% 41% 0% 9.1 Academic Lower 55% 29% 6% 4.5 All Academic 53% 34% 2% 6.9
Medical/Health 64% 20% 0% 8.1 Government 53% 35% 0% 6.8 Corporate 57% 30% 0% 13.8 Overall 55% 32% 1% 8.1
Overall
Academic Top 61% 19% 2% 8.2 Academic Middle 63% 22% 2% 6.9 Academic Lower 52% 23% 3% 5.9 All Academic 59% 21% 2% 7.0
Medical/Health 57% 16% 2% 8.4 Government 41% 26% 5% 4.0 Corporate 40% 23% 4% 6.8 Overall 54% 21% 3% 6.9
© 2015 Publishers Communication Group | pcgplus.com | Reproduction strictly prohibited Page 33 of 41
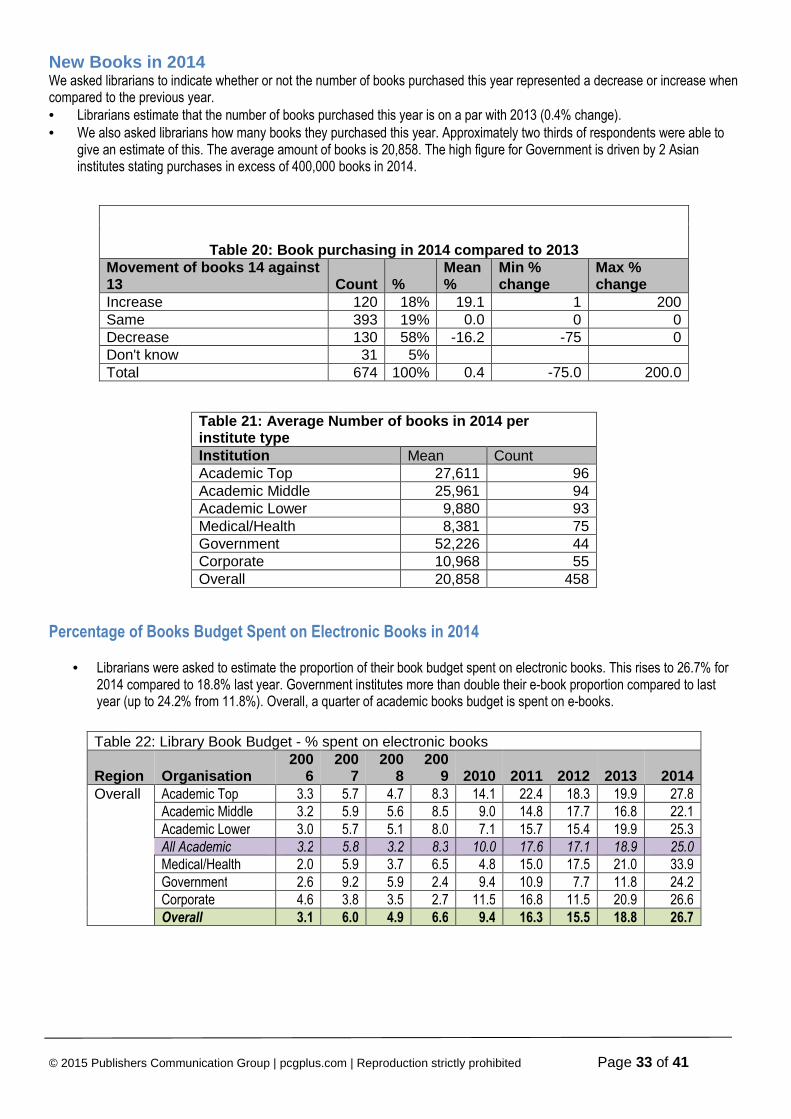
New Books in 2014 We asked librarians to indicate whether or not the number of books purchased this year represented a decrease or increase when compared to the previous year. • Librarians estimate that the number of books purchased this year is on a par with 2013 (0.4% change). • We also asked librarians how many books they purchased this year. Approximately two thirds of respondents were able to
give an estimate of this. The average amount of books is 20,858. The high figure for Government is driven by 2 Asian institutes stating purchases in excess of 400,000 books in 2014.
Table 20: Book purchasing in 2014 compared to 2013 Movement of books 14 against 13 Count %
Mean %
Min % change
Max % change
Increase 120 18% 19.1 1 200 Same 393 19% 0.0 0 0 Decrease 130 58% -16.2 -75 0 Don't know 31 5% Total 674 100% 0.4 -75.0 200.0
Table 21: Average N umber of books in 2014 per institute type Institution Mean Count Academic Top 27,611 96 Academic Middle 25,961 94 Academic Lower 9,880 93 Medical/Health 8,381 75 Government 52,226 44 Corporate 10,968 55 Overall 20,858 458
Percentage of Books Budget Spent on Electronic Books in 2014
• Librarians were asked to estimate the proportion of their book budget spent on electronic books. This rises to 26.7% for 2014 compared to 18.8% last year. Government institutes more than double their e-book proportion compared to last year (up to 24.2% from 11.8%). Overall, a quarter of academic books budget is spent on e-books.
Table 22: Library Book Budget - % spent on electronic books
Region Organisation 200
6 200
7 200
8 200
9 2010 2011 2012 2013 2014 Overall Academic Top 3.3 5.7 4.7 8.3 14.1 22.4 18.3 19.9 27.8 Academic Middle 3.2 5.9 5.6 8.5 9.0 14.8 17.7 16.8 22.1 Academic Lower 3.0 5.7 5.1 8.0 7.1 15.7 15.4 19.9 25.3 All Academic 3.2 5.8 3.2 8.3 10.0 17.6 17.1 18.9 25.0
Medical/Health 2.0 5.9 3.7 6.5 4.8 15.0 17.5 21.0 33.9 Government 2.6 9.2 5.9 2.4 9.4 10.9 7.7 11.8 24.2 Corporate 4.6 3.8 3.5 2.7 11.5 16.8 11.5 20.9 26.6 Overall 3.1 6.0 4.9 6.6 9.4 16.3 15.5 18.8 26.7
© 2015 Publishers Communication Group | pcgplus.com | Reproduction strictly prohibited Page 34 of 41
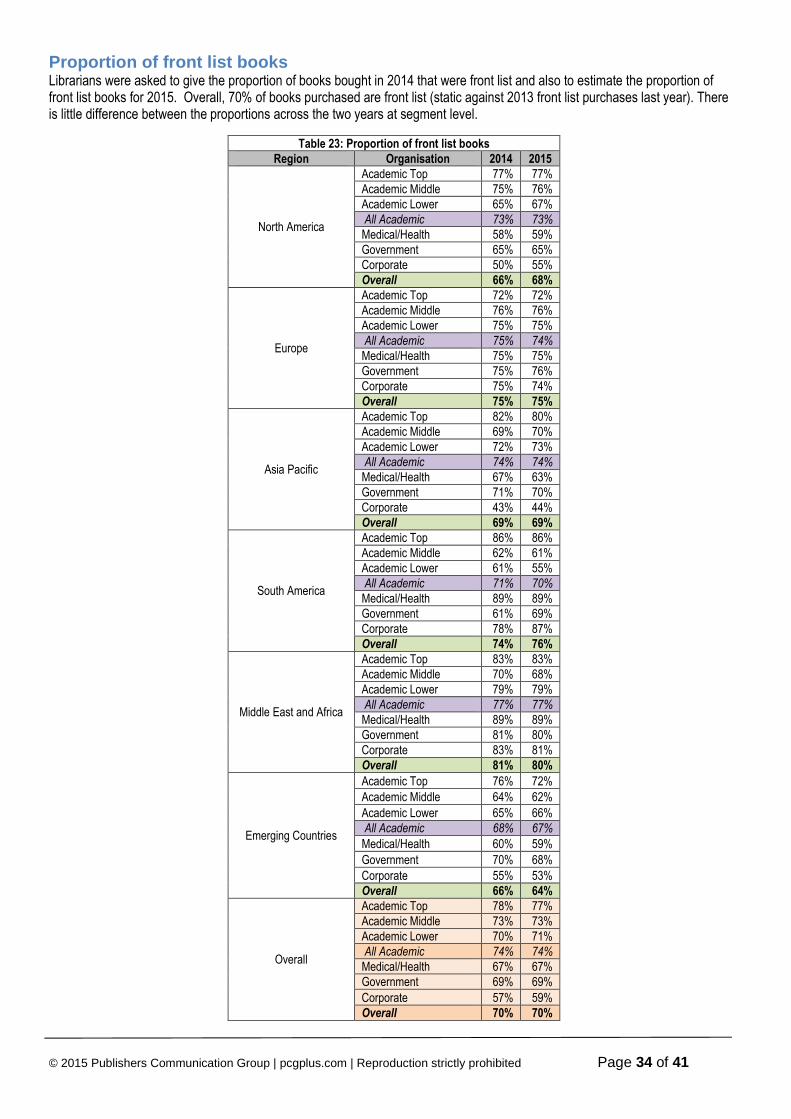
Proportion of front list books Librarians were asked to give the proportion of books bought in 2014 that were front list and also to estimate the proportion of front list books for 2015. Overall, 70% of books purchased are front list (static against 2013 front list purchases last year). There is little difference between the proportions across the two years at segment level.
Table 23: Proportion of front list books
Region Organisation 2014 2015
North America
Academic Top 77% 77% Academic Middle 75% 76% Academic Lower 65% 67% All Academic 73% 73%
Medical/Health 58% 59% Government 65% 65% Corporate 50% 55% Overall 66% 68%
Europe
Academic Top 72% 72% Academic Middle 76% 76% Academic Lower 75% 75% All Academic 75% 74%
Medical/Health 75% 75% Government 75% 76% Corporate 75% 74% Overall 75% 75%
Asia Pacific
Academic Top 82% 80% Academic Middle 69% 70% Academic Lower 72% 73% All Academic 74% 74%
Medical/Health 67% 63% Government 71% 70% Corporate 43% 44% Overall 69% 69%
South America
Academic Top 86% 86% Academic Middle 62% 61% Academic Lower 61% 55% All Academic 71% 70%
Medical/Health 89% 89% Government 61% 69% Corporate 78% 87% Overall 74% 76%
Middle East and Africa
Academic Top 83% 83% Academic Middle 70% 68% Academic Lower 79% 79% All Academic 77% 77%
Medical/Health 89% 89% Government 81% 80% Corporate 83% 81% Overall 81% 80%
Emerging Countries
Academic Top 76% 72%
Academic Middle 64% 62%
Academic Lower 65% 66% All Academic 68% 67%
Medical/Health 60% 59%
Government 70% 68%
Corporate 55% 53% Overall 66% 64%
Overall
Academic Top 78% 77% Academic Middle 73% 73% Academic Lower 70% 71% All Academic 74% 74%
Medical/Health 67% 67% Government 69% 69%
Corporate 57% 59% Overall 70% 70%
© 2015 Publishers Communication Group | pcgplus.com | Reproduction strictly prohibited Page 35 of 41
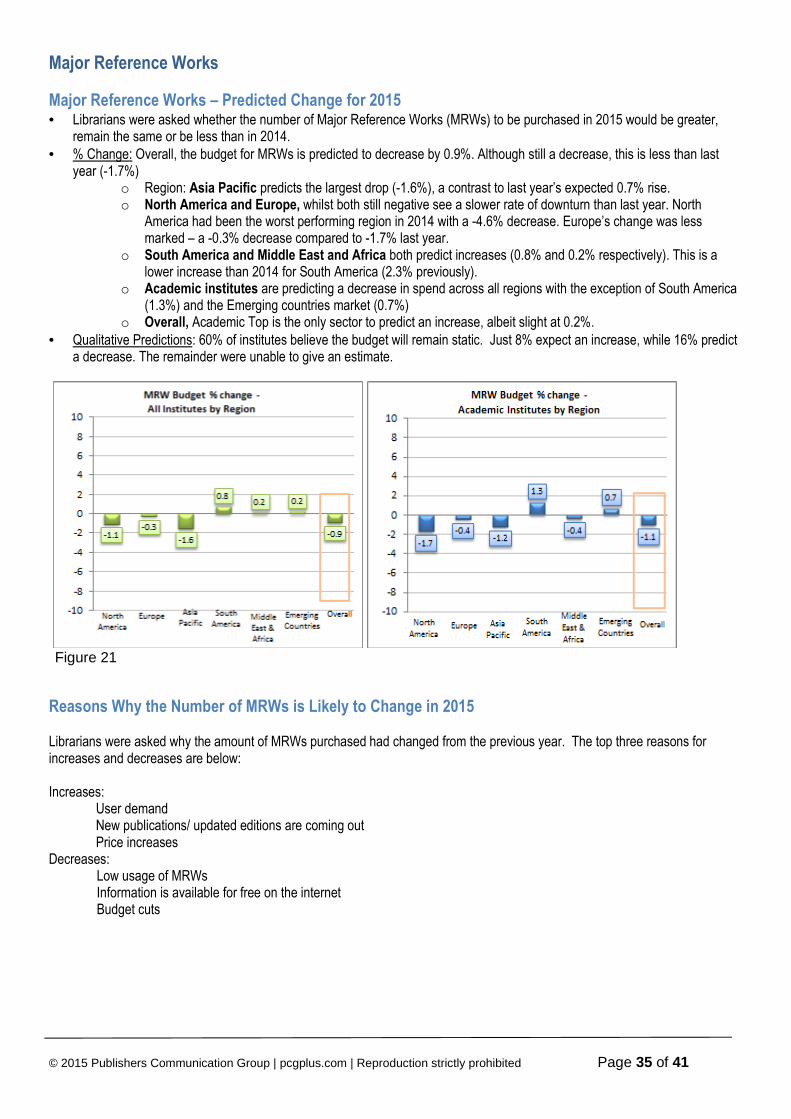
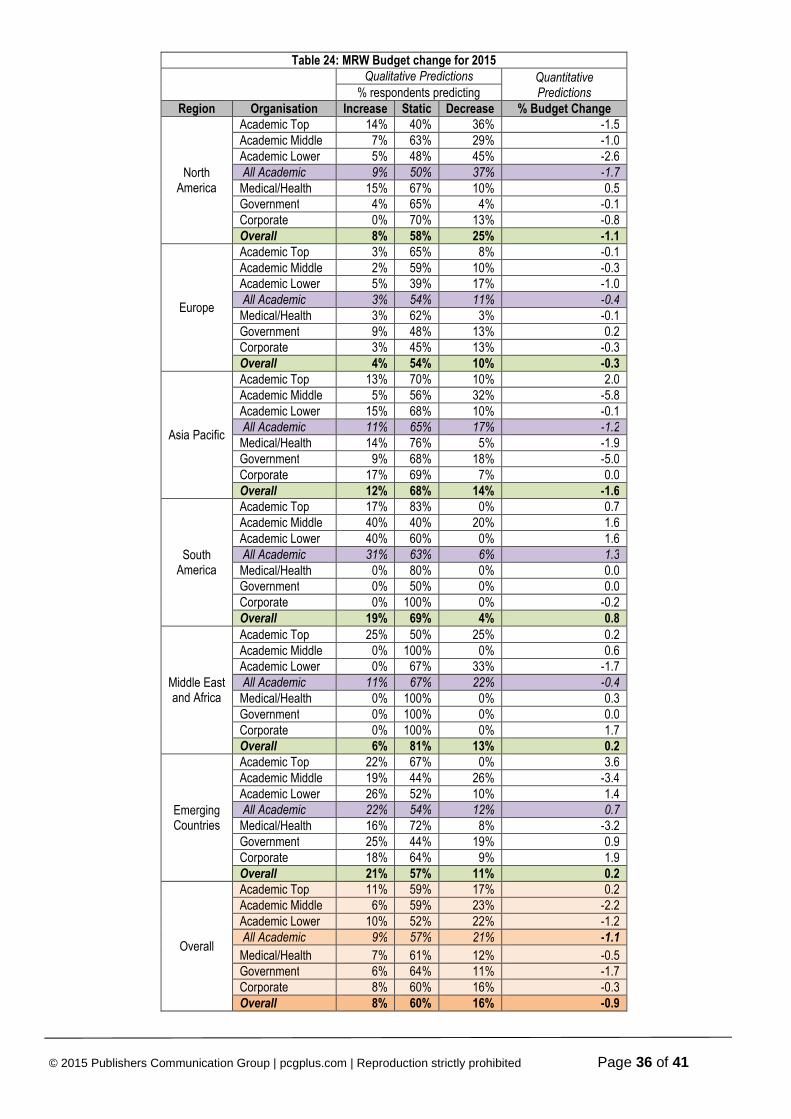
Major Reference Works Major Reference Works – Predicted Change for 2015 • Librarians were asked whether the number of Major Reference Works (MRWs) to be purchased in 2015 would be greater,
remain the same or be less than in 2014. • % Change: Overall, the budget for MRWs is predicted to decrease by 0.9%. Although still a decrease, this is less than last
year (-1.7%) o Region: Asia Pacific predicts the largest drop (-1.6%), a contrast to last year’s expected 0.7% rise. o North America and Europe, whilst both still negative see a slower rate of downturn than last year. North
America had been the worst performing region in 2014 with a -4.6% decrease. Europe’s change was less marked – a -0.3% decrease compared to -1.7% last year.
o South America and Middle East and Africa both predict increases (0.8% and 0.2% respectively). This is a lower increase than 2014 for South America (2.3% previously).
o Academic institutes are predicting a decrease in spend across all regions with the exception of South America (1.3%) and the Emerging countries market (0.7%)
o Overall, Academic Top is the only sector to predict an increase, albeit slight at 0.2%. • Qualitative Predictions: 60% of institutes believe the budget will remain static. Just 8% expect an increase, while 16% predict
a decrease. The remainder were unable to give an estimate.
Figure 21
Reasons Why the Number of MRWs is Likely to Change in 2015 Librarians were asked why the amount of MRWs purchased had changed from the previous year. The top three reasons for increases and decreases are below: Increases:
User demand New publications/ updated editions are coming out Price increases
Decreases: Low usage of MRWs Information is available for free on the internet Budget cuts
© 2015 Publishers Communication Group | pcgplus.com | Reproduction strictly prohibited Page 36 of 41
Table 24: MRW Budget change for 2015
Qualitative Predictions Quantitative Predictions % respondents predicting
Region Organisation Increase Static Decrease % Budget Change
North America
Academic Top 14% 40% 36% -1.5 Academic Middle 7% 63% 29% -1.0 Academic Lower 5% 48% 45% -2.6 All Academic 9% 50% 37% -1.7
Medical/Health 15% 67% 10% 0.5 Government 4% 65% 4% -0.1 Corporate 0% 70% 13% -0.8 Overall 8% 58% 25% -1.1
Europe
Academic Top 3% 65% 8% -0.1 Academic Middle 2% 59% 10% -0.3 Academic Lower 5% 39% 17% -1.0 All Academic 3% 54% 11% -0.4
Medical/Health 3% 62% 3% -0.1 Government 9% 48% 13% 0.2 Corporate 3% 45% 13% -0.3 Overall 4% 54% 10% -0.3
Asia Pacific
Academic Top 13% 70% 10% 2.0 Academic Middle 5% 56% 32% -5.8 Academic Lower 15% 68% 10% -0.1 All Academic 11% 65% 17% -1.2
Medical/Health 14% 76% 5% -1.9 Government 9% 68% 18% -5.0 Corporate 17% 69% 7% 0.0 Overall 12% 68% 14% -1.6
South America
Academic Top 17% 83% 0% 0.7 Academic Middle 40% 40% 20% 1.6 Academic Lower 40% 60% 0% 1.6 All Academic 31% 63% 6% 1.3
Medical/Health 0% 80% 0% 0.0 Government 0% 50% 0% 0.0 Corporate 0% 100% 0% -0.2 Overall 19% 69% 4% 0.8
Middle East and Africa
Academic Top 25% 50% 25% 0.2 Academic Middle 0% 100% 0% 0.6 Academic Lower 0% 67% 33% -1.7 All Academic 11% 67% 22% -0.4
Medical/Health 0% 100% 0% 0.3 Government 0% 100% 0% 0.0 Corporate 0% 100% 0% 1.7 Overall 6% 81% 13% 0.2
Emerging Countries
Academic Top 22% 67% 0% 3.6 Academic Middle 19% 44% 26% -3.4 Academic Lower 26% 52% 10% 1.4 All Academic 22% 54% 12% 0.7
Medical/Health 16% 72% 8% -3.2 Government 25% 44% 19% 0.9 Corporate 18% 64% 9% 1.9 Overall 21% 57% 11% 0.2
Overall
Academic Top 11% 59% 17% 0.2 Academic Middle 6% 59% 23% -2.2 Academic Lower 10% 52% 22% -1.2 All Academic 9% 57% 21% -1.1
Medical/Health 7% 61% 12% -0.5 Government 6% 64% 11% -1.7 Corporate 8% 60% 16% -0.3 Overall 8% 60% 16% -0.9
© 2015 Publishers Communication Group | pcgplus.com | Reproduction strictly prohibited Page 37 of 41
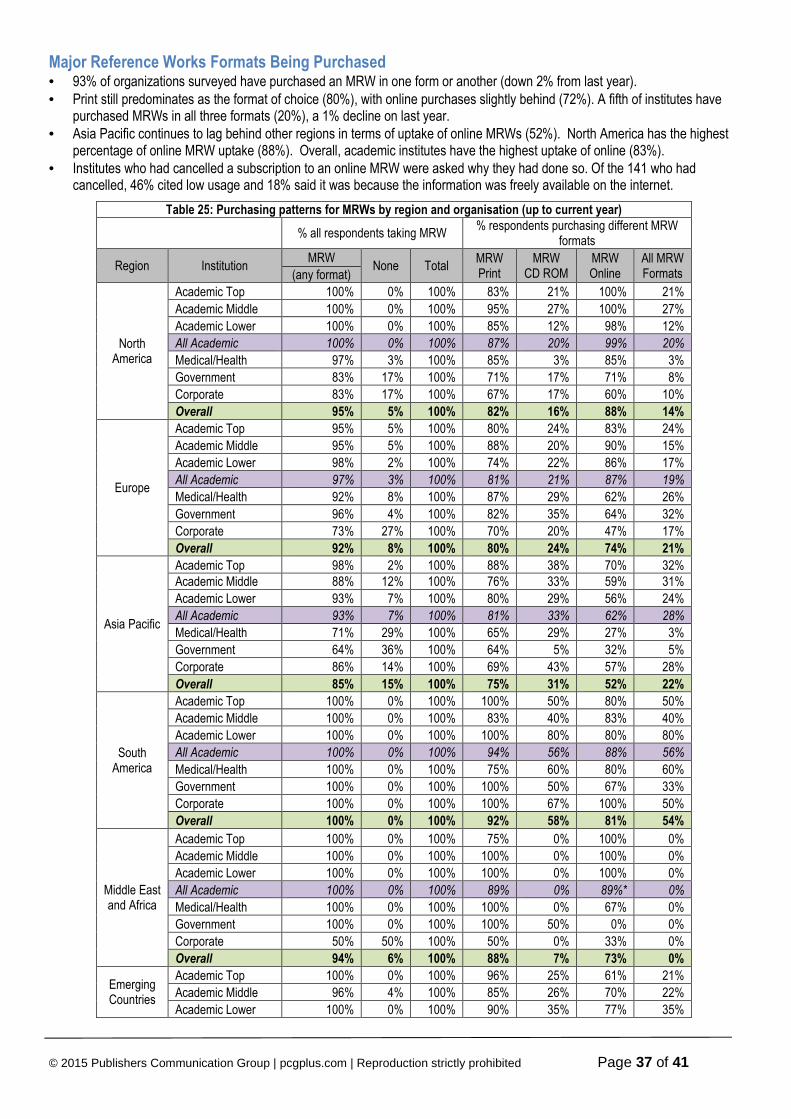
Major Reference Works Formats Being Purchased • 93% of organizations surveyed have purchased an MRW in one form or another (down 2% from last year). • Print still predominates as the format of choice (80%), with online purchases slightly behind (72%). A fifth of institutes have
purchased MRWs in all three formats (20%), a 1% decline on last year. • Asia Pacific continues to lag behind other regions in terms of uptake of online MRWs (52%). North America has the highest
percentage of online MRW uptake (88%). Overall, academic institutes have the highest uptake of online (83%). • Institutes who had cancelled a subscription to an online MRW were asked why they had done so. Of the 141 who had
cancelled, 46% cited low usage and 18% said it was because the information was freely available on the internet.
Table 25: Purchasing patterns for MRWs by region and organisation (up to current year)
% all respondents taking MRW % respondents purchasing different MRW
formats
Region Institution MRW
None Total MRW Print
MRW CD ROM
MRW Online
All MRW Formats (any format)
North America
Academic Top 100% 0% 100% 83% 21% 100% 21%
Academic Middle 100% 0% 100% 95% 27% 100% 27%
Academic Lower 100% 0% 100% 85% 12% 98% 12%
All Academic 100% 0% 100% 87% 20% 99% 20%
Medical/Health 97% 3% 100% 85% 3% 85% 3%
Government 83% 17% 100% 71% 17% 71% 8%
Corporate 83% 17% 100% 67% 17% 60% 10%
Overall 95% 5% 100% 82% 16% 88% 14%
Europe
Academic Top 95% 5% 100% 80% 24% 83% 24%
Academic Middle 95% 5% 100% 88% 20% 90% 15%
Academic Lower 98% 2% 100% 74% 22% 86% 17%
All Academic 97% 3% 100% 81% 21% 87% 19%
Medical/Health 92% 8% 100% 87% 29% 62% 26%
Government 96% 4% 100% 82% 35% 64% 32%
Corporate 73% 27% 100% 70% 20% 47% 17%
Overall 92% 8% 100% 80% 24% 74% 21%
Asia Pacific
Academic Top 98% 2% 100% 88% 38% 70% 32% Academic Middle 88% 12% 100% 76% 33% 59% 31%
Academic Lower 93% 7% 100% 80% 29% 56% 24%
All Academic 93% 7% 100% 81% 33% 62% 28%
Medical/Health 71% 29% 100% 65% 29% 27% 3%
Government 64% 36% 100% 64% 5% 32% 5%
Corporate 86% 14% 100% 69% 43% 57% 28%
Overall 85% 15% 100% 75% 31% 52% 22%
South America
Academic Top 100% 0% 100% 100% 50% 80% 50%
Academic Middle 100% 0% 100% 83% 40% 83% 40%
Academic Lower 100% 0% 100% 100% 80% 80% 80%
All Academic 100% 0% 100% 94% 56% 88% 56%
Medical/Health 100% 0% 100% 75% 60% 80% 60%
Government 100% 0% 100% 100% 50% 67% 33%
Corporate 100% 0% 100% 100% 67% 100% 50%
Overall 100% 0% 100% 92% 58% 81% 54%
Middle East and Africa
Academic Top 100% 0% 100% 75% 0% 100% 0%
Academic Middle 100% 0% 100% 100% 0% 100% 0%
Academic Lower 100% 0% 100% 100% 0% 100% 0%
All Academic 100% 0% 100% 89% 0% 89%* 0%
Medical/Health 100% 0% 100% 100% 0% 67% 0%
Government 100% 0% 100% 100% 50% 0% 0%
Corporate 50% 50% 100% 50% 0% 33% 0%
Overall 94% 6% 100% 88% 7% 73% 0%
Emerging Countries
Academic Top 100% 0% 100% 96% 25% 61% 21%
Academic Middle 96% 4% 100% 85% 26% 70% 22%
Academic Lower 100% 0% 100% 90% 35% 77% 35%
© 2015 Publishers Communication Group | pcgplus.com | Reproduction strictly prohibited Page 38 of 41
All Academic 99% 1% 100% 91% 30% 70% 27%
Medical/Health 96% 4% 100% 88% 28% 65% 20%
Government 88% 13% 100% 88% 38% 69% 31%
Corporate 100% 0% 100% 95% 48% 76% 38%
Overall 97% 3% 100% 82% 32% 70% 28%
Overall
Academic Top 99% 1% 100% 85% 27% 85% 26%
Academic Middle 96% 4% 100% 86% 27% 83% 24%
Academic Lower 98% 2% 100% 81% 23% 80% 20%
All Academic 97% 3% 100% 84% 26% 83% 28%
Medical/Health 89% 11% 100% 79% 21% 60% 12%
Government 85% 15% 100% 73% 19% 56% 16%
Corporate 82% 18% 100% 68% 27% 56% 18%
Overall 93% 7% 100% 80% 24% 72% 20%
*Some academic sectors have rounded upwards to 100% due to down-weighting of the number of interviews causing a small number of respondents.
Proportion of mrw budget spent on online • Respondents were asked what proportion of their current (2014) MRW budget was spent on the online format of MRW.
Overall, 48% of the budget is used for online. The proportions are broadly similar across all institute types, with Medical showing the largest variation from the average at 44%
Table 26: Proportion of current MRW budget spent on online format
Organisation % budget for online
MRW
Academic Top 50% Academic Middle 49% Academic Lower 47% All Academic 49%
Medical/Health 44% Government 51% Corporate 50% Overall 48%
perpetual VS yearly access of mrws Those librarians who had purchased online MRWs were asked to specify the proportion of the budget spent on perpetual and yearly models. All but Government institutes spend a higher proportion of the budget on perpetual models. Perpetual models are most popular with Academic Middle institutes (66%).
Table 27: Proportion of online MRW budget spent on perpetual vs yearly models
% of budget spent on perpetual models
% of budget spent on yearly models
Academic Top 57.5 42.5 Academic Middle 66.1 32.8 Academic Lower 49.7 49.1 Medical 52.0 48.0 Government 48.8 51.2 Corporate 51.9 48.1 Total 55.6 43.9
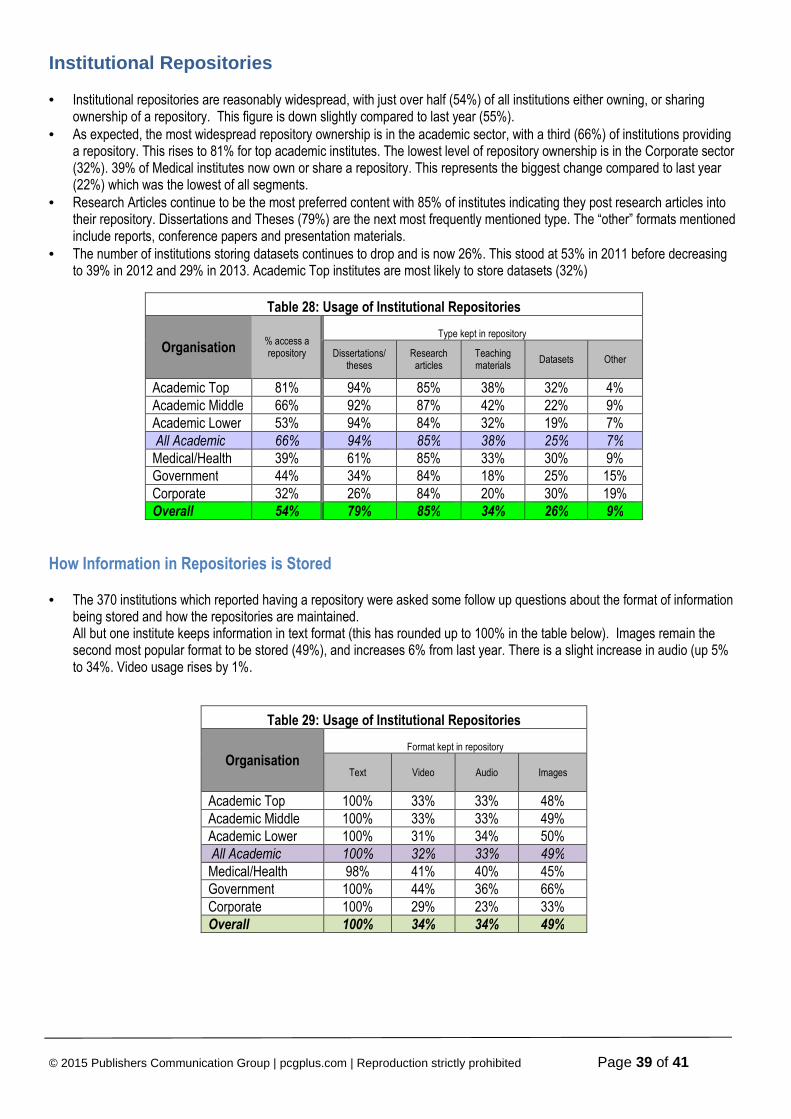
© 2015 Publishers Communication Group | pcgplus.com | Reproduction strictly prohibited Page 39 of 41
Institutional Repositories • Institutional repositories are reasonably widespread, with just over half (54%) of all institutions either owning, or sharing
ownership of a repository. This figure is down slightly compared to last year (55%). • As expected, the most widespread repository ownership is in the academic sector, with a third (66%) of institutions providing
a repository. This rises to 81% for top academic institutes. The lowest level of repository ownership is in the Corporate sector (32%). 39% of Medical institutes now own or share a repository. This represents the biggest change compared to last year (22%) which was the lowest of all segments.
• Research Articles continue to be the most preferred content with 85% of institutes indicating they post research articles into their repository. Dissertations and Theses (79%) are the next most frequently mentioned type. The “other” formats mentioned include reports, conference papers and presentation materials.
• The number of institutions storing datasets continues to drop and is now 26%. This stood at 53% in 2011 before decreasing to 39% in 2012 and 29% in 2013. Academic Top institutes are most likely to store datasets (32%)
Table 28: Usage of Institutional Repositories
Organisation % access a repository
Type kept in repository
Dissertations/ theses
Research articles
Teaching materials
Datasets Other
Academic Top 81% 94% 85% 38% 32% 4% Academic Middle 66% 92% 87% 42% 22% 9% Academic Lower 53% 94% 84% 32% 19% 7% All Academic 66% 94% 85% 38% 25% 7%
Medical/Health 39% 61% 85% 33% 30% 9% Government 44% 34% 84% 18% 25% 15% Corporate 32% 26% 84% 20% 30% 19% Overall 54% 79% 85% 34% 26% 9%
How Information in Repositories is Stored • The 370 institutions which reported having a repository were asked some follow up questions about the format of information
being stored and how the repositories are maintained. All but one institute keeps information in text format (this has rounded up to 100% in the table below). Images remain the second most popular format to be stored (49%), and increases 6% from last year. There is a slight increase in audio (up 5% to 34%. Video usage rises by 1%.
Table 29: Usage of Institutional Repositories
Organisation Format kept in repository
Text Video Audio Images
Academic Top 100% 33% 33% 48% Academic Middle 100% 33% 33% 49% Academic Lower 100% 31% 34% 50% All Academic 100% 32% 33% 49%
Medical/Health 98% 41% 40% 45% Government 100% 44% 36% 66% Corporate 100% 29% 23% 33% Overall 100% 34% 34% 49%
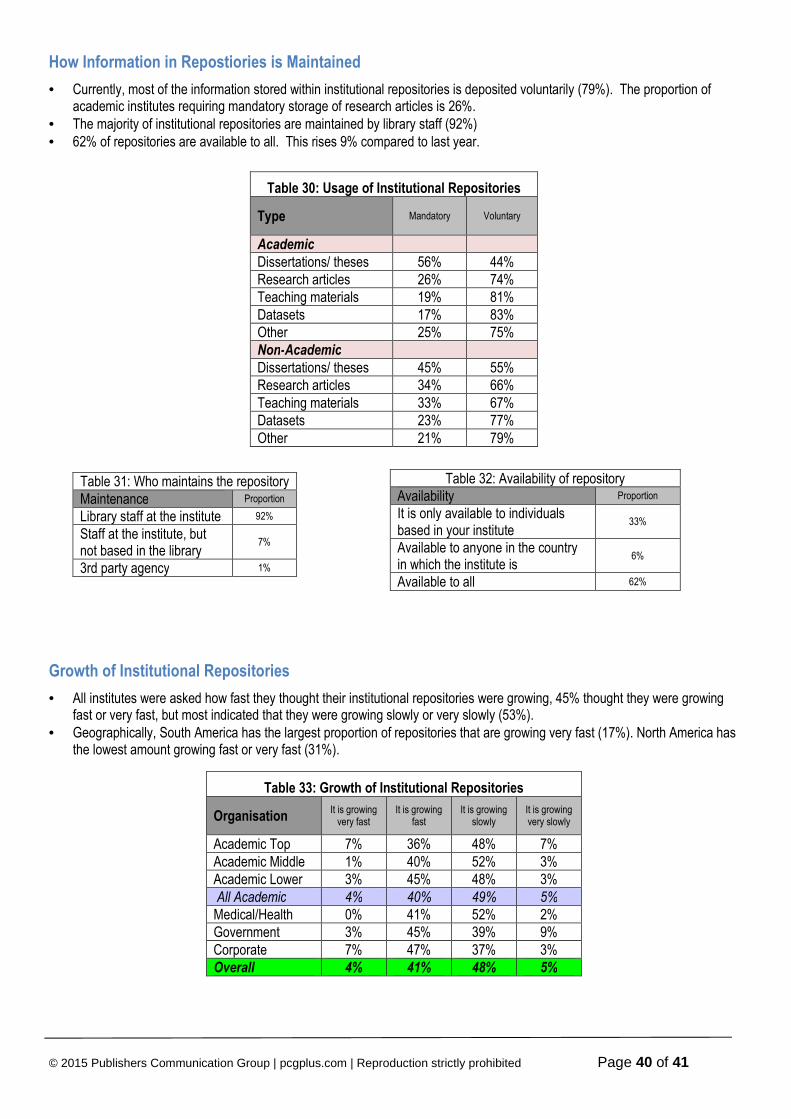
© 2015 Publishers Communication Group | pcgplus.com | Reproduction strictly prohibited Page 40 of 41
How Information in Repostiories is Maintained
• Currently, most of the information stored within institutional repositories is deposited voluntarily (79%). The proportion of academic institutes requiring mandatory storage of research articles is 26%.
• The majority of institutional repositories are maintained by library staff (92%) • 62% of repositories are available to all. This rises 9% compared to last year.
Table 30: Usage of Institutional Repositories
Type Mandatory Voluntary
Academic
Dissertations/ theses 56% 44% Research articles 26% 74% Teaching materials 19% 81% Datasets 17% 83% Other 25% 75% Non-Academic
Dissertations/ theses 45% 55% Research articles 34% 66% Teaching materials 33% 67% Datasets 23% 77% Other 21% 79%
Growth of Institutional Repositories
• All institutes were asked how fast they thought their institutional repositories were growing, 45% thought they were growing fast or very fast, but most indicated that they were growing slowly or very slowly (53%).
• Geographically, South America has the largest proportion of repositories that are growing very fast (17%). North America has the lowest amount growing fast or very fast (31%).
Table 33: Growth of Institutional Repositories
Organisation It is growing
very fast It is growing
fast It is growing
slowly It is growing very slowly
Academic Top 7% 36% 48% 7% Academic Middle 1% 40% 52% 3% Academic Lower 3% 45% 48% 3% All Academic 4% 40% 49% 5%
Medical/Health 0% 41% 52% 2% Government 3% 45% 39% 9% Corporate 7% 47% 37% 3% Overall 4% 41% 48% 5%
Table 31: Who maintains the repository Maintenance Proportion
Library staff at the institute 92%
Staff at the institute, but not based in the library
7%
3rd party agency 1%
Table 32: Availability of repository Availability Proportion
It is only available to individuals based in your institute
33%
Available to anyone in the country in which the institute is
6%
Available to all 62%
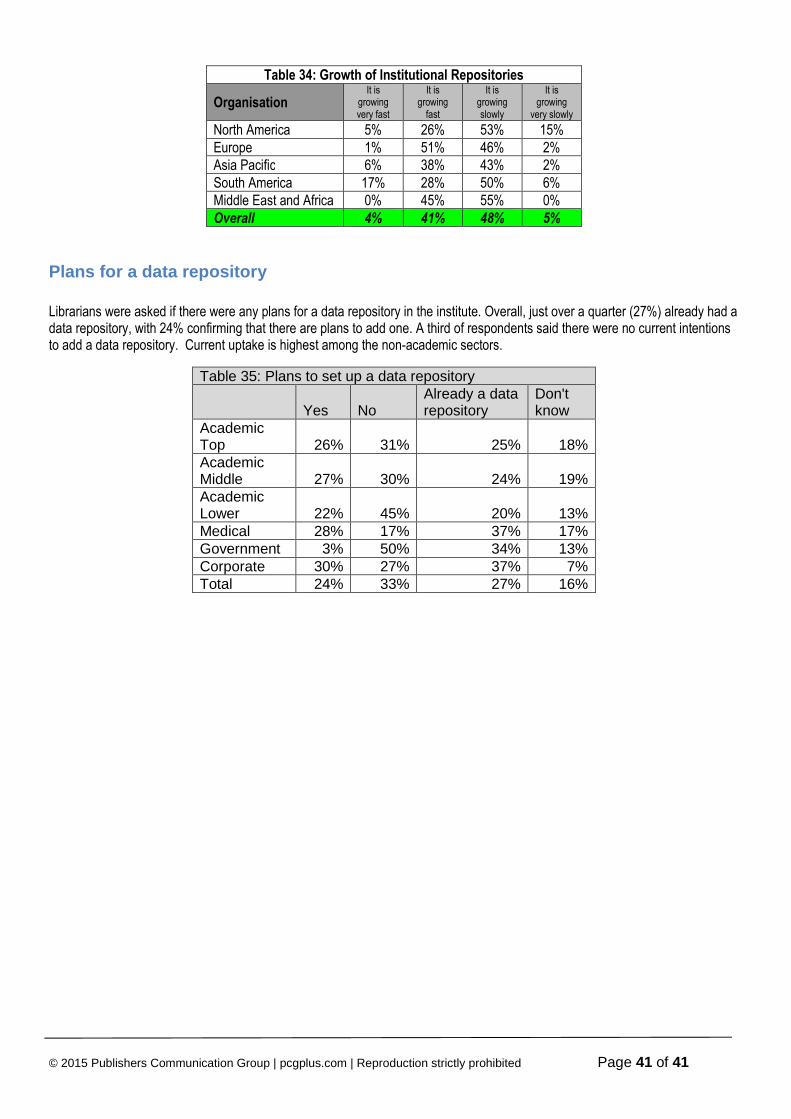
© 2015 Publishers Communication Group | pcgplus.com | Reproduction strictly prohibited Page 41 of 41
Table 34: Growth of Institutional Repositories
Organisation It is
growing very fast
It is growing
fast
It is growing slowly
It is growing
very slowly
North America 5% 26% 53% 15% Europe 1% 51% 46% 2% Asia Pacific 6% 38% 43% 2% South America 17% 28% 50% 6% Middle East and Africa 0% 45% 55% 0% Overall 4% 41% 48% 5%
Plans for a data repository
Librarians were asked if there were any plans for a data repository in the institute. Overall, just over a quarter (27%) already had a data repository, with 24% confirming that there are plans to add one. A third of respondents said there were no current intentions to add a data repository. Current uptake is highest among the non-academic sectors.
Table 35: Plans to set up a data repository
Yes No Already a data repository
Don't know
Academic Top 26% 31% 25% 18% Academic Middle 27% 30% 24% 19% Academic Lower 22% 45% 20% 13% Medical 28% 17% 37% 17% Government 3% 50% 34% 13% Corporate 30% 27% 37% 7% Total 24% 33% 27% 16%


