18
Licence P1930 Block: 103/1 St Georges Channel Basin UKCS Relinquishment Report June 2016

Licence P1930
Block: 103/1
St Georges Channel Basin
UKCS
Relinquishment Report
June 2016

Contents
1.0 Executive Summary ........................................................................................................................... 3
1.1 Licence Information ................................................................................................................ 3
1.2 Introduction ............................................................................................................................ 3
1.3 Licence Synopsis ...................................................................................................................... 3
1.4 P1930 Work Programme Summary ........................................................................................ 6
1.4.1 Additional Technical Work Undertaken .......................................................................... 6
2.0 Database ........................................................................................................................................... 7
2.1 Well Database ............................................................................................................................... 7
2.2 Seismic Database .......................................................................................................................... 8
3.0 Prospectivity Update ................................................................................................................. 11
3.1 Overview ............................................................................................................................... 11
3.4 Interpretation: Top Reservoir Depth Maps .......................................................................... 11
3.5 Seismic amplitude and EEI Anomaly: 2011 vs 2014 Interpretation ............................................ 14
4.0 Resource & Risk ......................................................................................................................... 17
4.1 Volumetrics: 2011 Vs 2015 Volumetric Estimates ...................................................................... 17
4.2 Resource & Risk Summary .......................................................................................................... 18
5.0 Conclusions ............................................................................................................................... 18
1.0 Executive Summary
1.1 Licence Information
Licence number: P1930
Licence Round: Open Round Bid (2012)
Licence Type: Seaward Production Licence
Block Number: 103/1
Please note that all permissions to publish in this report have been obtained.
1.2 Introduction
The Dragon discovery was first drilled by Marathon in 1994 and subsequently appraised in 2005 with
well 103/1-2. On Providence’s interpretation Dragon extends from Irish block 51/1 into UK block
103/1. Providence and its then partner Star Energy Oil & Gas Ltd acquired the Licence for the Dragon
field, P1930 in January 2012 as an out of round application. The previous operator, Marathon, had
Pmean probabilistic volumetrics of circa 100 BCF GIIP in the fault block drilled by 103/1-1. Rock physics
and inversion studies carried out by Providence in the early stages of evaluation suggested an
Extended Elastic Impedance (EEI) anomaly on 3D seismic data which suggested an extension of the
Dragon discovery into down-dip fault blocks. Probabilistic volumetrics over the extended elastic
impedance (EEI) anomaly suggests a P50 of 483 BCF GIIP, with P50 120 BCF being proven in one fault
panel by the 103/3-1 well.
In 2014 the Dragon 3D seismic dataset was re-reprocessed, with the aim of improving data quality to
yield higher confidence depth structure maps and to assess the validity of a hydrocarbon related EEI
anomaly. Data re-processing and subsequent re-interpretation was completed in 2015. The results of
this work yielded improved imaging of the structure of the Dragon field, however quantitative analysis
indicated that no direct-hydrocarbon indicator (DHI) was evident. The presence of apparent DHI on
the older seismic dataset was attributed to lithological effects. Resultant volumetric calculations show
greatly reduced gas-in-place volumetric estimates, and no indication of upside potential as previously
indicated by EEI.
Providence’s technical evaluation of the P1930 licence area illustrates that the Dragon Gas Field
volumetrics are currently non-commercial, and that no other commercially viable exploration target
exists within the licence area to supplement resources. For this reason, Providence has decided not to
progress this licence to its Second Term, and will relinquish the acreage held under Licence P1930.
1.3 Licence Synopsis

Dragon is located in the St. George’s Channel Basin, some 40km of the southeast coast of Ireland and
35km of the coast of Wales (Figure 1). Water depth is 96 meters with a relatively flat seabed
topography.
Marathon Oil was awarded block 103/1 in the UK 14th Round of Licensing in May 1993. Well 103/1-1
was drilled in 1994 to test “Dragon”, a Triassic Sherwood Sandstone prospect in the footwall of the St
Georges Channel fault, as well as a secondary Jurassic Bajocian target in the hanging wall mapped on
2D seismic data. Both targets have extensive sand packages in adjacent wells. The well failed to drill a
large section the primary Triassic Sherwood Sandstone target due to drilling difficulties, however
Lower Triassic siltstones encountered were found to be water wet. The secondary Bajocian Sandstone
target was faulted out. Hydrocarbon was logged in sands of Callovian to Oxfordian age and was tested
at 21 mmscfg/d and 120 bopd 42 deg API liquid hydrocarbons.
A 3D seismic survey was acquired in 1995 and a fault block up-dip of 103/1-1 was identified as a
potential large structural trap. A drilling moratorium prevented the appraisal of Dragon until 2005
when Marathon drilled the 103/1-2 well. The well was deviated significantly to allow for subsequent
sidetrack in the success case. The well encountered the presence of the Callovian-Oxfordian reservoirs
but all sands were water wet.
Providence was awarded a Standard Exploration Licence covering Irish block 51/1 in February 2007
and began discussions with Marathon regarding potential development of the fault block drilled by
the 103/1-1 well.
Marathon’s UK licence became listed as Fallow B and was subsequently relinquished in 2010 on the
basis of commerciality.
Providence submitted an out of round application for block 103/1-1 in 2010 and were awarded the
licence in January 2012. As the structure of the Dragon gas field straddles the Ireland / UK median line,
Providence also hold acreage west of P1930 in Irish waters (SEL1/07, Figure 1).

Figure 1. Location map showing Licences P1930 & SEL 1/07, exploration wells and previsouly mapped extent of the Dragon Gas field

1.4 P1930 Work Programme Summary
The Licence P1930 award document states that the Licensee shall either:
A. Drill a well to 2415m TVCSS or to the top Bathonian Limestone formation, whichever is the
shallower, to evaluate the Oxfordian/Callovian; or
B. Elect to allow the licence to cease and determine automatically pursuant to clauses 3, 4 and
6
Providence, in light of the results of its technical evaluation of the licence area, has elected option B.
and has chosen to allow Licence P1930 to cease.
1.4.1 Additional Technical Work Undertaken
In the course of its technical evaluation of licence P1930, Providence has carried out the following
work items:
Regional well interpretation and correlation
Integration of Gravity data (Smith & Sandwell) with well and seismic datasets
Review of basin petroleum system
Acquisition of Dragon 3D dataset field tapes
3D PreSDM re-processing of Dragon 3D dataset (Down Under Geophysics Ltd, 2014)
Seismic interpretation of Dragon 3D dataset, including mapping of all key reservoir horizons
and structure mapping
Seismic interpretation of existing regional 2D seismic datasets (including PVR 2006, Fugro-TGS
2006 Long offset and MIL93 2D Datasets)
Field development concept study (Production profiles, development well planning, pipeline
route concepts)
Scoping economics studies to assess viability of commercial field development

2.0 Database
2.1 Well Database
In its regional review of the prospectivity of the Dragon Gas Field, Providence purchased and
incorporated data from all relevant available wells. This included wells in both Irish and UK waters in
the St Georges Channel Basins & Cardigan Bay Basin, as well as wells from the North East of the North
Celtic Sea Basin and the Central Irish Sea Basin.
A location map of wells used in Providence technical evaluation is shown below in Figure 2.
Figure 2. Location map of Licence P1930, showing wells incorporated in Providence technical evaluation, and outline of the Dragon Gas Field (2011 interpretation).

2.2 Seismic Database
The primary dataset for the Dragon discovery is a 180 km2 3D seismic survey acquired by Marathon
in 1995 using the Geco-Prakla Seisquest. A 2002 Veritas reprocessed PreSTM data set is available
containing Raw Migration, Near Stack, Far Stack and Final Migration products. A 2004 Marathon
PreSDM product is also available with corresponding relative impedance.
The Marathon PreSDM dataset appears to have more continuous reflectivity, particularly in the
shallow section. However, upon more detailed review, the frequency content is lower and imaging
beneath the faults is poorer than on the Veritas 2002 processing as shown in Figure 4 , similarly the
relative impedance cube is of poor quality and thus unreliable. The Veritas 2002 dataset was inverted
by IKON Science producing two Extended Elastic Impedance cubes. Providence secured access to the
original field data reprocessed the data with Fugro to obtain a High Resolution Short Offset product.
In 2013 Providence commissioned 3D broadband PreSDM re-processing of the Dragon 3D dataset by
Down Under Geophysics (DUG). This work was completed in 2014. The resulting dataset, which
utilised a detailed velocity model, yielded greatly improved fault imaging and increased lower
frequency content (Figure 5), which facilitated higher confidence structural interpretation.
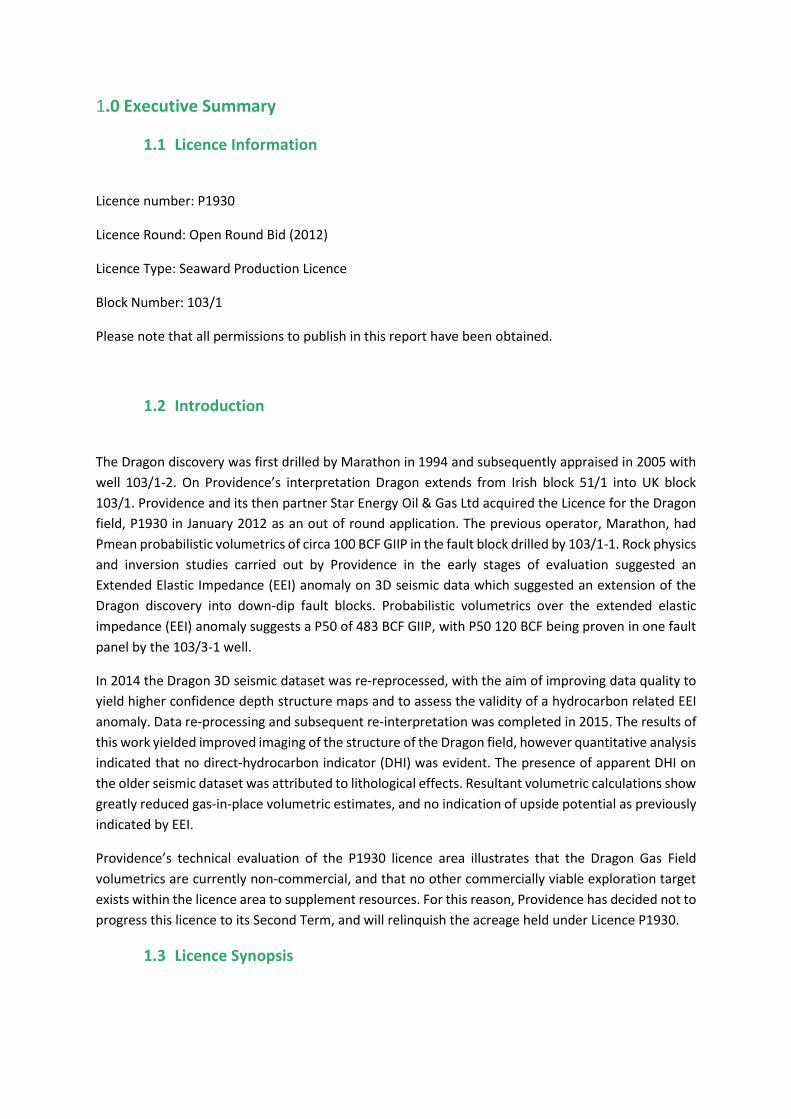
Several vintages of 2D data are available (shown in Figure 3), and were used to place the Dragon
discovery within a regional context. Providence acquired a proprietary 2D seismic survey on the
adjacent Irish acreage in 2006. This data provides an excellent correlation from the Dragon discovery
to the adjacent Irish wells. Providence also underwrote the regional Fugro-TGS SGC06 survey which is
excellent for understanding the regional context as well as identifying the basin extents and tying with
the available Smith & Sandwell 1997 Free Air Gravity data. The Marathon 1995 survey also included a
2D dataset which provides good well ties to the adjacent UK wells.
Note : Maps with UTM geo-reference are in Zone 30.
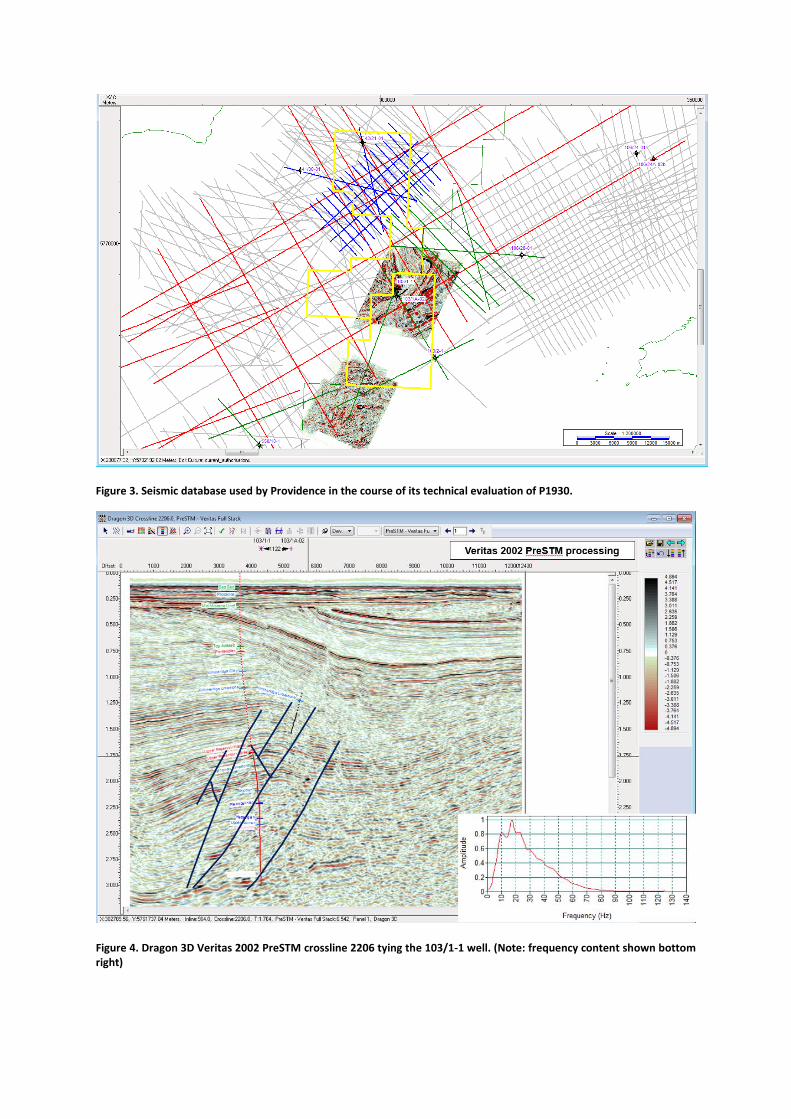
Figure 3. Seismic database used by Providence in the course of its technical evaluation of P1930.
Figure 4. Dragon 3D Veritas 2002 PreSTM crossline 2206 tying the 103/1-1 well. (Note: frequency content shown bottom right)
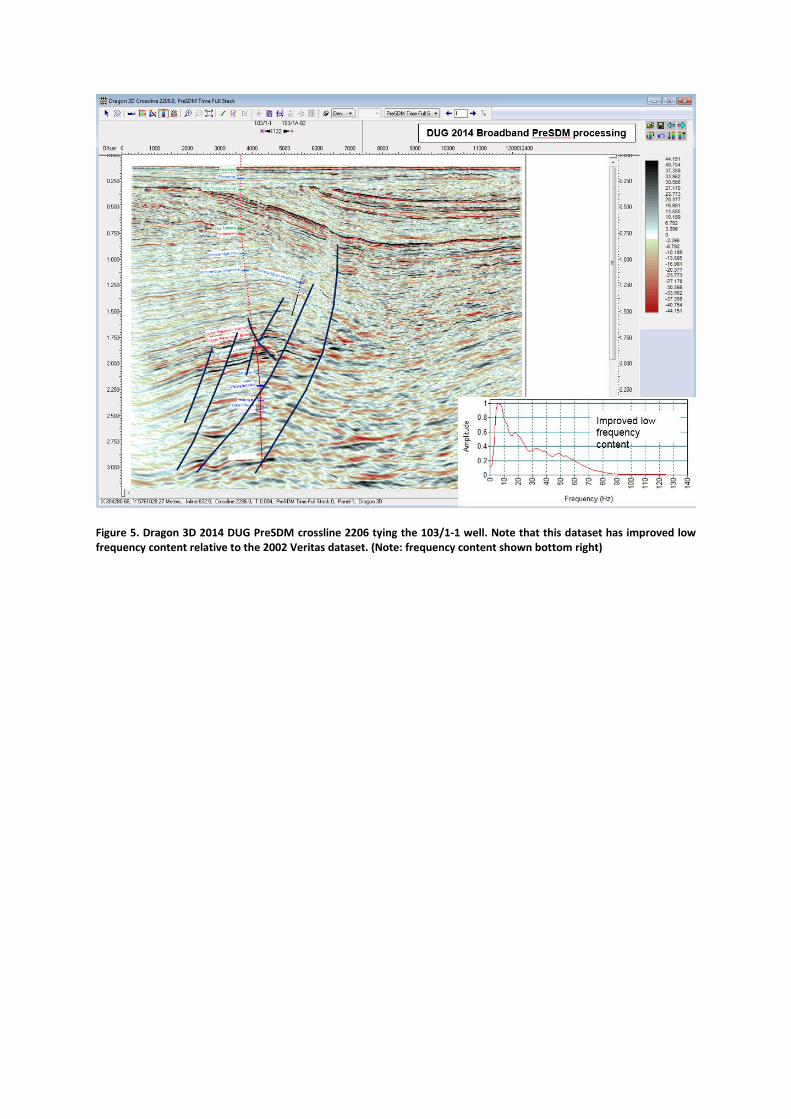
Figure 5. Dragon 3D 2014 DUG PreSDM crossline 2206 tying the 103/1-1 well. Note that this dataset has improved low frequency content relative to the 2002 Veritas dataset. (Note: frequency content shown bottom right)

3.0 Prospectivity Update
3.1 Overview
Given that the Triassic was shown to be water wet (103/1-1 well encountered Triassic water wet
siltstones below Mercia Halite), assessment of prospectivity was limited to the Middle Jurassic.
Review of prospectivity of Dragon Licence P1930 was primarily reliant on interpretation of various
vintages of Dragon 3D datasets, and incorporation with petrophysical data from the 103/1-1 well.
Detailed seismic Interpretation of the Dragon Field was carried out primarily using vintages of the
Dragon 3D dataset. Providence initially interpreted using the 2002 Veritas 3D seismic product, on
which rock physics inversion and EEI studies were carried out by IKON Geoscience on behalf of
Providence. In 2014/2015 Providence used the improved 2014 DUG PreSDM Dragon 3D product to re-
evaluate its appraisal of the Dragon Field. This recent more recent interpretation using a higher quality
modern dataset resulted in higher confidence depth structure maps, which illustrate a different
structural configuration than previously interpreted.
3.4 Interpretation: Top Reservoir Depth Maps
Depth grids for the Callovian Upper and Lower reservoir intervals are shown in Figure 6 & Figure 7,
which illustrates a comparison of the difference between maps generated in 2011 using the 2002
Veritas PreSTM product, and those generated in 2015 using the DUG 2014 PreSDM seismic products.
The more detailed velocity model used in the 2014 DUG re-reprocessing results in a depth grid which
has steeper deeper – effectively shrinking the trap area of the down-dip upside potential relative to
maps generated using the simplified layer cake velocity model in 2011.
The improved low fault imaging and low frequency content in the 2014 data also results in subtly
different fault arrangements compared to the 2011 maps. 2011 mapping indicated the presence of
down-dip seal in the north east of the structure by a continuous sealing fault. However, subsequent
2015 mapping has shown this to be compromised by a break point along this fault, which would
facilitate hydrocarbon migration out the fault compartment. The result of this is such that upside trap
potential is then reliant on the larger fault which bounds the eastern extent of the fault block drilled
by the 103/1-2 well. As this larger fault was shown by the results of the 103/1-2 well to be leaky, it is
not possible conceptually to trap this upside potential. Providence thus determine that trapping in the
Dragon field area is limited only to the small fault panel which has been proven by the 103/1-1 well.

Figure 6. (A). Callovian Upper Reservoir Depth grid (2011), mapped on 2002 Veritas Dragon 3D dataset, depth converted using a simple layer cake velocity model. The potential for an accumulation down dip here is present via a sealing fault in the NE. (B.) Callovian Upper Reservoir Depth grid (2015), mapped on the 2014 DUG PreSDM dataset, depth converted using a detailed velocity model. Note that the fault configuration downdip has changed compared to (A.)

Figure 7. A). Callovian Lower Reservoir Depth grid (2011), mapped on 2002 Veritas Dragon 3D dataset, depth converted using a simple layer cake velocity model. The potential for an accumulation down dip here is present via a sealing fault in the NE. (B.) Callovian Lower Reservoir Depth grid (2015), mapped on the 2014 DUG PreSDM dataset, depth converted using a detailed velocity model. Note that the fault configuration downdip has altered.
3.5 Seismic amplitude and EEI Anomaly: 2011 vs 2014 Interpretation
Providence’s view of the hydrocarbon upside potential in 2011 was driven in large part by observed
amplitude anomalies which showed apparent conformance to structure. Figure 6 shows a Callovian
Upper reservoir inversion extraction map, which shows very bright trough amplitudes which are
limited the fault panel drilled proven to be hydrocarbon bearing by the 1031/1-1 well, as well as fault
panels further down dip. Notably the panel which was proven to be water wet by the 103/1-2 well
exhibits little / no bright soft amplitudes. These 2011 observations suggest the likelihood of
hydrocarbons trapped in fault panels downdip on the Dragon structure. An EEI anomaly map
generated using the same Callovian Upper Reservoir grid (2011) and 2002 Veritas PreSTM Dragon 3D
dataset (Figure 9) shows a similar distribution of amplitudes suggestive of additional hydrocarbon
charge downdip of the 103/1-1 fault panel.
As such, in 2011 there was there was then considerable geophysical evidence for the true extent of
the Dragon gas field to be much larger than that proven by the 103/1-1 well. However, doubts
remained over the veracity of the EEI anomaly due to a lack of full knowledge of, and confidence in,
the processing workflow of the 2002 Veritas dataset. A principal objective of the DUG 2014 Dragon
reprocessing, was to have full control and knowledge of the processing workflow, and also to make
near and far offset products available for AVA analysis. Providence were satisfied that the delivered
DUG 2014 Dragon 3D PreSDM product was of a high standard, and that it was suitable for analysing
fluid anomalies.
Unfortunately, interpretation and analysis of this newer 3D dataset showed that amplitude anomalies
previously identified (2011, Figure 8 & Figure 9) were more likely to be caused by lithological effects,
rather than being representative of hydrocarbon charge. This is illustrated in Figure 10, which shows
a comparison of amplitude extractions on the near and far offset stacks. In Figure 10 (A) a near offset
stack bright soft (trough) amplitudes across all fault blocks is observed, including both those drilled by
the 103/1-1 well (hydrocarbon bearing) and 103/1-2 well (water wet). There is also little no apparent
conformance to structure observed. In Figure 10 (B) a similar amplitude response on the far offset
stack is observed, with brighter amplitudes (although consistently weaker than those observed on the
near offset stack) across all fault blocks, with little/no conformance to structure.
As such, Providence conclude that the 2014 DUG 3D PreSDM dataset strongly suggests that any
amplitude anomalies in the Callovian reservoir interval are related to lithological effects, rather than
representing hydrocarbon charge. Given that Providence have higher confidence in this dataset than
previous version of the Dragon 3D seismic dataset, it must be concluded that there is no geophysical
support for hydrocarbon upside in fault blocks downdip on the Dragon structure.
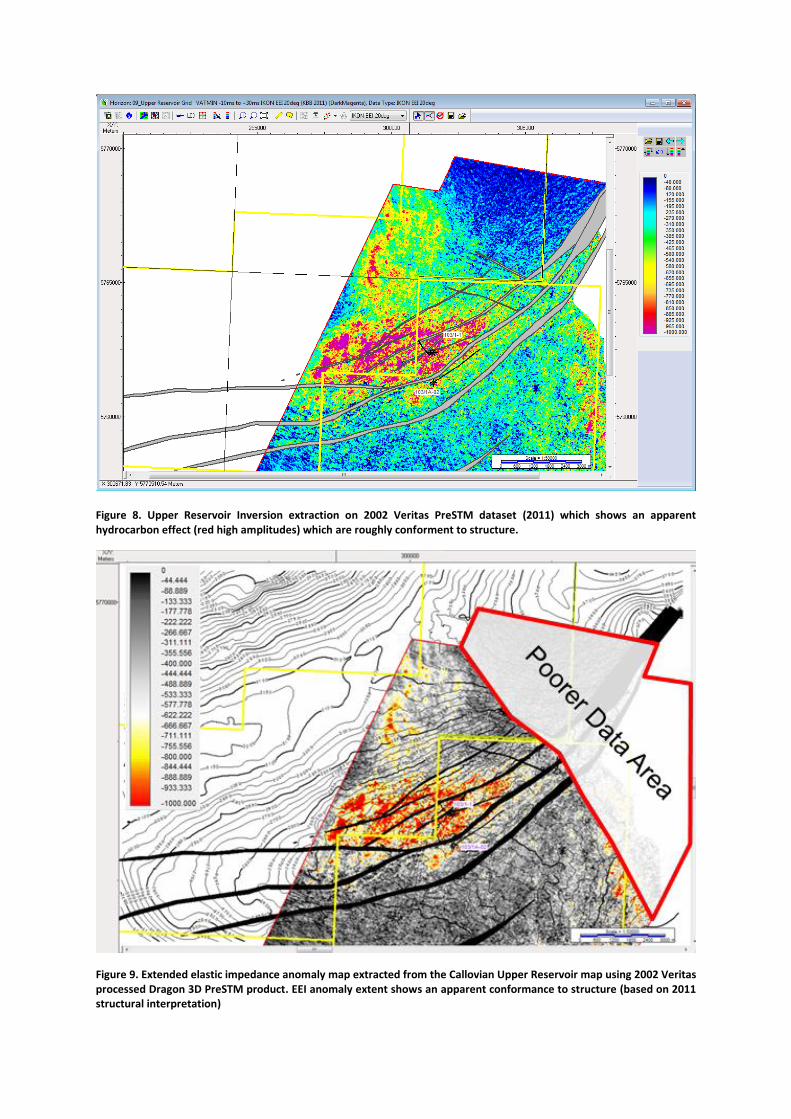
Figure 8. Upper Reservoir Inversion extraction on 2002 Veritas PreSTM dataset (2011) which shows an apparent hydrocarbon effect (red high amplitudes) which are roughly conforment to structure.
Figure 9. Extended elastic impedance anomaly map extracted from the Callovian Upper Reservoir map using 2002 Veritas processed Dragon 3D PreSTM product. EEI anomaly extent shows an apparent conformance to structure (based on 2011 structural interpretation)

Figure 10. (A.) Callovian Upper Reservoir near offset extraction created using 2014 DUG PreSDM dataset. Note very strong amplitudes appear on the nears, with bright amplitudes across all fault blocks. (B.) Callovian Upper Reservoir far offset extraction created using 2014 DUG PreSDM dataset. Note very weak amplitudes on Far offsets relatives to the Near offsets in A.

4.0 Resource & Risk
4.1 Volumetrics: 2011 Vs 2015 Volumetric Estimates
Providence’s view on the volumetric potential has diminished significantly based on interpretation of
the improved reprocessed Dragon 3D dataset (2014). These results have significantly reduced the area
considered for volumetric calculation (Error! Reference source not found.), resulting in greatly
reduced GRV. This ultimately results in a reduction in current P50 volumetrics compared with
previously calculated scenarios. Current volumetric estimates for Callovian Upper and Lower Reservoir
units range from 24 BCF (P90) to 53 BCF (P10).
These volumes are considered to be sub-economic and as such Providence does not wish to convert
Licence P1930 to its Second Term.
A full summary of Dragon Gas Field volumetrics is shown in Figure 11.
Figure 11. Dragon Gas Field volumetrics scenarios. Those in purple are earlier scenarios, completed in 2011, while those in green are current volumetrics estimates which incorporate results of 2015 interpretation of the improved DUG reprocessed Dragon 3D dataset.

4.2 Resource & Risk Summary
Resource and Risk Summary
Discovery Name P / L / D
Unrisked Resources
GIIP
Low Central High GPOS ECOS
Dragon (Callovian/Oxfordian) D 24 37 53 100 0 Figure 12. Resource and risk summary for the Dragon Gas Discovery. Note that the predicted economic chance of success (ECOS) is 0% due to insufficient GIIP even in the high case.
5.0 Conclusions
Following the full completion of a technical evaluation of P1930, Providence determine that the
Dragon Gas discovery does not have any potential for commercial development due to insufficient
volumetric resource estimates. As such, Providence wishes to relinquish the acreage held under
Licence P1930.


