Abstract Many countries are using bridge management systems (BMSs) as the main toll for the effective management of their bridges. Although many BMSs contain some forms of life-cycle cost analysis (LCCA), the use of LCCA in bridge engineering is scarce and LCCA has mainly been applied to support decisions related to existing bridges. This paper discuss the need of a BMS with an integrated LCCA tool that can assist decision makers at all levels and within all phases in selecting the most cost-effective solution from an array of applicable alternatives. The paper introduces the Swedish Bridge and Tunnel Management System (BaTMan). A comprehensive LCCA implementation scheme will be illustrated, taking into account the bridge investment and management process in Sweden. The basic LCCA analysis tools as well as other helpful techniques are addressed. A real case study is presented to demonstrate the recent improvement of BaTMan particularly in the function of specifying the most-cost effective bridge repair strategy. The bridge user cost is included in the LCCA. The parameters that can influence the final decision are addressed and sensitivity analyses to study their impacts are performed.
Keywords Bridge, Life-Cycle Costing, LCCA, LCC, Infrastructure, Management, User Cost, Decision Support Systems, Rehabilitation, Repair
1. Introduction
1.1. General Background
Generally, bridge investment and management decisions are multi-alternative-oriented. Life-cycle Cost (LCC) is the cost of an asset, or of its parts, throughout its life cycle whilst it fulfills the performance requirements. Life-cycle costing, sometime called life-cycle cost analysis (LCCA), is a methodology for systematic economic evaluation of the LCC over a specified period of analysis as defined in the agreed scope (4). In many countries, bridges are mainly managed using bridge management systems (BMSs). Many BMSs
contain some forms of LCCA. However, the use of LCCA in bridge engineering is scarce (3, 7, 5 and14). The missing of a comprehensive framework details the possible applications of LCCA for bridges during their entire life is a major obstacle hinder the implementation of LCCA in bridge engineering. The lack of proper LCCA techniques that satisfy the establish procurement procedures within public agencies is also an obstacle hinder the use of LCCA in bridge engineering. LCCA in many BMSs has mainly been applied to support decisions related to existing bridges. This paper discusses the need of a BMS with integrated comprehensive LCC tools that can assist decision makers at all levels and within all phases in selecting the most cost-effective alternative.
1.2. Aim and Scope
The project presented in this paper is financed by the Swedish Transport Administration (Trafikverket). The project aims at enhancing the bridge investment and management decisions by upgrading and expanding the use of LCC in the Swedish Bridge and Tunnel Management System (BaTMan). This paper broadly demonstrates the possible LCC applications for bridges and mainly focuses on the LCC implementation to specify the most cost-effective bridge repair strategy. A real case study will be presented to demonstrate the recent improvement of BaTMan practically on that LCC application.
1.3. Basic Components of a BMS
A BMS with an integrated comprehensives LCC tool can be defined as a rational and systematic approach to organize and carry out all the activities related to managing a network of bridges, including optimizing the selection of maintenance and improvement actions in order to maximize the benefits while minimizing the life-cycle cost. The development of BMSs with integrated LCC tool has been necessitated by the large imbalance between the need for extensive repairs or replacements in a large bridge stock and the limited budget available to municipalities and agencies
12 Life-Cycle Costing Integration with Bridge Management Systems
for implementing the required repairs. The purpose of a BMS is to combine management, engineering and economic input in order to determine the best actions to take on a network of bridges over time (1). A BMS should include the following basic components: data storage, cost models, deterioration models, and optimization models (1), Figure 1.
The heart of a BMS is a database derived from the field inspections (17). The integrity of a BMS is directly related to the quality and accuracy of the bridge inventory and physical condition data obtained through field inspections. Information such as the bridge name, number, location, drawings, and inspection records are stored in the data base. Considering the updated inspection records, the bridges and their individual structural members are conditionally rated according to specific methodologies.
1.4. Previous Research
BMSs as well as bridge life-cycle cost analysis (LCCA) have been subjects of intense interest long time ago. Several important new research-and-development studies have provided essential tools and resources which previously were unavailable (e.g. those in the references’ list of this article).
Many BMSs have been developed in different countries. Most of them address three aspects of bridge management: assessing bridge conditions, modelling future deterioration behaviour, and the decisions to maintain, repair, or rehabilitate (1, 5 and 10). Many agencies have adopted BMSs that operate at the network level to assist inbudget allocation and prioritization within an agency’s total inventory of bridges (3).NCHRP Report 590 (16) describes the development of methodologies for network- and project-level optimization of multiple, user-specified performance criteria.Several bridge LCC case studies have been presented in different research papers. NCHRP Report 483 (3) describes a great research effort leading to a
recommended methodology and includes a guidance manual for carrying out LCCA. However, the criteria for the project selection are not clear in that report particularlywhen comparing investment projects having unequal life-spans. Techniques that highlight the feasibility of the LCC results are also missing in that report.
An obvious gap between the practice and the theory of LCCA was detected and discussed in (7and 5). Even though BMSs and LCCA are interrelated, many bridge management researches have treated them as separate aspects; therefore, neither may lead to the best usable decision-support tools. Some bridge inventory and inspection systems do not make use of LCC. Current challenges involve making sense of the increasing volume of information and integrating and processing it to help manage bridges through their life cycle as effectively as possible(10).Web-based BMSs with cradle-to-grave, integrated, and comprehensive LCC tools may provide an opportunity to greatly improve this situation.
1.5. The Swedish BMS
Trafikverket is the largest bridge manager in Sweden. The latest update of Trafikverket's BMS is called a Bridge and Tunnel Management system (BaTMan), which was introduced in 2004. Today, BaTMan is handling the management of 29,736 bridges with a total bridge area of 7,562,070 m2 and a total bridge length of 658,986 m. BaTMan is a computerized Internet based system, which means that users can always have access to updated information about the actual bridges on-line (https://batman.vv.se/). Furthermore, the system is furnished by a separate navigation tool (WebHybris) that can easly access the BaTMan’s database and answer any related question for any research or management purposes. BaTMan is recognized as the best-known software-based digital BMS in Europe (8).
Figure 1. the Basic components of a BMS (AASHTO, 2001)
Civil Engineering and Architecture 2(1): 11-23, 2014 13
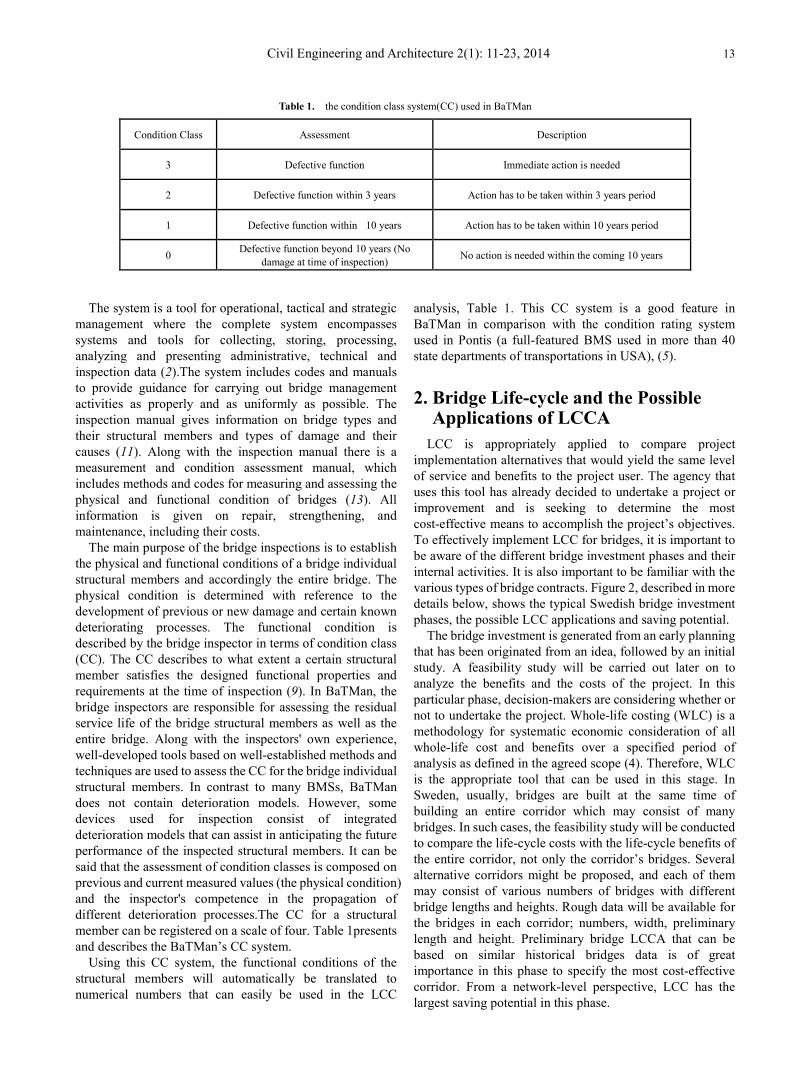
Table 1. the condition class system(CC) used in BaTMan
Condition Class Assessment Description
3 Defective function Immediate action is needed
2 Defective function within 3 years Action has to be taken within 3 years period
1 Defective function within 10 years Action has to be taken within 10 years period
0 Defective function beyond 10 years (No damage at time of inspection) No action is needed within the coming 10 years
The system is a tool for operational, tactical and strategic management where the complete system encompasses systems and tools for collecting, storing, processing, analyzing and presenting administrative, technical and inspection data (2).The system includes codes and manuals to provide guidance for carrying out bridge management activities as properly and as uniformly as possible. The inspection manual gives information on bridge types and their structural members and types of damage and their causes (11). Along with the inspection manual there is a measurement and condition assessment manual, which includes methods and codes for measuring and assessing the physical and functional condition of bridges (13). All information is given on repair, strengthening, and maintenance, including their costs.
The main purpose of the bridge inspections is to establish the physical and functional conditions of a bridge individual structural members and accordingly the entire bridge. The physical condition is determined with reference to the development of previous or new damage and certain known deteriorating processes. The functional condition is described by the bridge inspector in terms of condition class (CC). The CC describes to what extent a certain structural member satisfies the designed functional properties and requirements at the time of inspection (9). In BaTMan, the bridge inspectors are responsible for assessing the residual service life of the bridge structural members as well as the entire bridge. Along with the inspectors' own experience, well-developed tools based on well-established methods and techniques are used to assess the CC for the bridge individual structural members. In contrast to many BMSs, BaTMan does not contain deterioration models. However, some devices used for inspection consist of integrated deterioration models that can assist in anticipating the future performance of the inspected structural members. It can be said that the assessment of condition classes is composed on previous and current measured values (the physical condition) and the inspector's competence in the propagation of different deterioration processes.The CC for a structural member can be registered on a scale of four. Table 1presents and describes the BaTMan’s CC system.
Using this CC system, the functional conditions of the structural members will automatically be translated to numerical numbers that can easily be used in the LCC
analysis, Table 1. This CC system is a good feature in BaTMan in comparison with the condition rating system used in Pontis (a full-featured BMS used in more than 40 state departments of transportations in USA), (5).
2. Bridge Life-cycle and the Possible Applications of LCCA
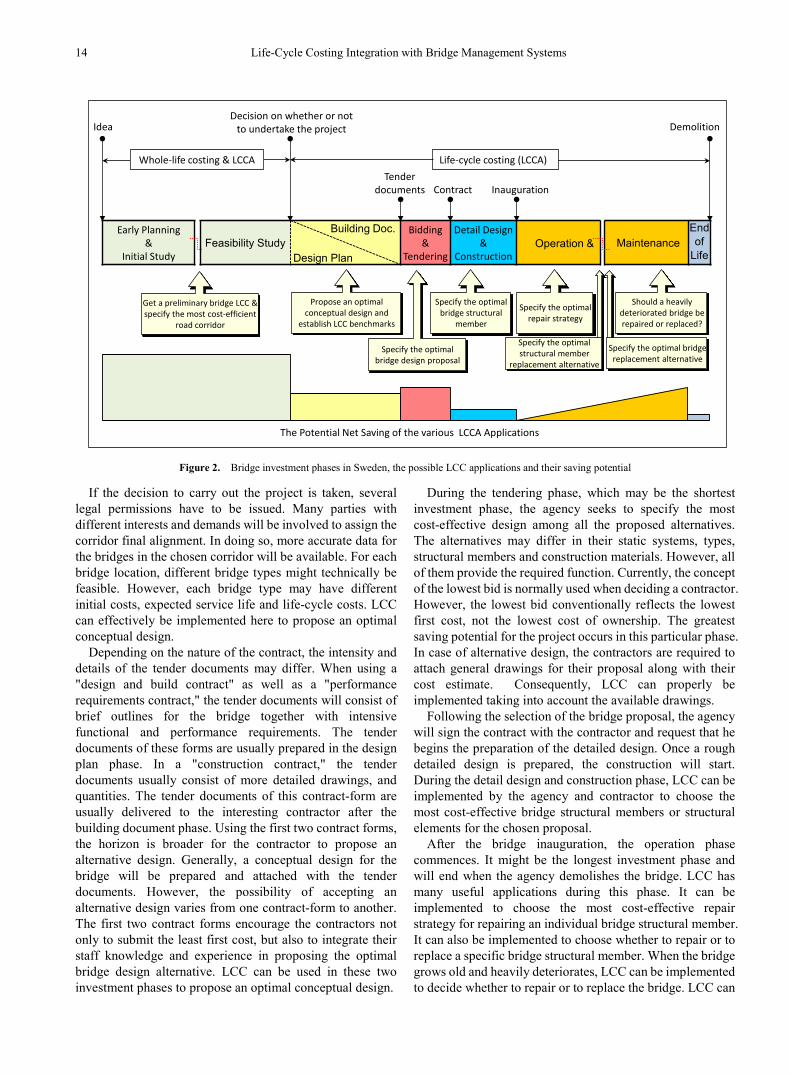
LCC is appropriately applied to compare project implementation alternatives that would yield the same level of service and benefits to the project user. The agency that uses this tool has already decided to undertake a project or improvement and is seeking to determine the most cost-effective means to accomplish the project’s objectives. To effectively implement LCC for bridges, it is important to be aware of the different bridge investment phases and their internal activities. It is also important to be familiar with the various types of bridge contracts. Figure 2, described in more details below, shows the typical Swedish bridge investment phases, the possible LCC applications and saving potential.
The bridge investment is generated from an early planning that has been originated from an idea, followed by an initial study. A feasibility study will be carried out later on to analyze the benefits and the costs of the project. In this particular phase, decision-makers are considering whether or not to undertake the project. Whole-life costing (WLC) is a methodology for systematic economic consideration of all whole-life cost and benefits over a specified period of analysis as defined in the agreed scope (4). Therefore, WLC is the appropriate tool that can be used in this stage. In Sweden, usually, bridges are built at the same time of building an entire corridor which may consist of many bridges. In such cases, the feasibility study will be conducted to compare the life-cycle costs with the life-cycle benefits of the entire corridor, not only the corridor’s bridges. Several alternative corridors might be proposed, and each of them may consist of various numbers of bridges with different bridge lengths and heights. Rough data will be available for the bridges in each corridor; numbers, width, preliminary length and height. Preliminary bridge LCCA that can be based on similar historical bridges data is of great importance in this phase to specify the most cost-effective corridor. From a network-level perspective, LCC has the largest saving potential in this phase.
14 Life-Cycle Costing Integration with Bridge Management Systems
Figure 2. Bridge investment phases in Sweden, the possible LCC applications and their saving potential
If the decision to carry out the project is taken, several legal permissions have to be issued. Many parties with different interests and demands will be involved to assign the corridor final alignment. In doing so, more accurate data for the bridges in the chosen corridor will be available. For each bridge location, different bridge types might technically be feasible. However, each bridge type may have different initial costs, expected service life and life-cycle costs. LCC can effectively be implemented here to propose an optimal conceptual design.
Depending on the nature of the contract, the intensity and details of the tender documents may differ. When using a "design and build contract" as well as a "performance requirements contract," the tender documents will consist of brief outlines for the bridge together with intensive functional and performance requirements. The tender documents of these forms are usually prepared in the design plan phase. In a "construction contract," the tender documents usually consist of more detailed drawings, and quantities. The tender documents of this contract-form are usually delivered to the interesting contractor after the building document phase. Using the first two contract forms, the horizon is broader for the contractor to propose an alternative design. Generally, a conceptual design for the bridge will be prepared and attached with the tender documents. However, the possibility of accepting an alternative design varies from one contract-form to another. The first two contract forms encourage the contractors not only to submit the least first cost, but also to integrate their staff knowledge and experience in proposing the optimal bridge design alternative. LCC can be used in these two investment phases to propose an optimal conceptual design.
During the tendering phase, which may be the shortest investment phase, the agency seeks to specify the most cost-effective design among all the proposed alternatives. The alternatives may differ in their static systems, types, structural members and construction materials. However, all of them provide the required function. Currently, the concept of the lowest bid is normally used when deciding a contractor. However, the lowest bid conventionally reflects the lowest first cost, not the lowest cost of ownership. The greatest saving potential for the project occurs in this particular phase. In case of alternative design, the contractors are required to attach general drawings for their proposal along with their cost estimate. Consequently, LCC can properly be implemented taking into account the available drawings.
Following the selection of the bridge proposal, the agency will sign the contract with the contractor and request that he begins the preparation of the detailed design. Once a rough detailed design is prepared, the construction will start. During the detail design and construction phase, LCC can be implemented by the agency and contractor to choose the most cost-effective bridge structural members or structural elements for the chosen proposal.
After the bridge inauguration, the operation phase commences. It might be the longest investment phase and will end when the agency demolishes the bridge. LCC has many useful applications during this phase. It can be implemented to choose the most cost-effective repair strategy for repairing an individual bridge structural member. It can also be implemented to choose whether to repair or to replace a specific bridge structural member. When the bridge grows old and heavily deteriorates, LCC can be implemented to decide whether to repair or to replace the bridge. LCC can
Early Planning&
Initial StudyFeasibility Study
Building Doc.
Design Plan
Bidding &
Tendering
Detail Design &
ConstructionOperation & Maintenance
Endof
Life
Should a heavily deteriorated bridge be repaired or replaced?
Get a preliminary bridge LCC &specify the most cost-efficient
road corridor
Specify the optimal bridge structural
member
Specify the optimal repair strategy
Specify the optimal structural member
replacement alternative
Propose an optimal conceptual design and
establish LCC benchmarks
Specify the optimal bridge design proposal
Specify the optimal bridge replacement alternative
Demolition
Tender documents Inauguration
Decision on whether or not to undertake the project
Contract
The Potential Net Saving of the various LCCA Applications
Civil Engineering and Architecture 2(1): 11-23, 2014 15
also be used here to investigate the feasibility of installing advance monitoring system that might assist in elongating the bridge residual service life. When deciding to replace a bridge, several replacement options might be available. LCC can be used here to optimize between the available replacement options. Several demolition strategies with different impacts on the traffic might be available for a bridge replacement. LCC can also be used here to specify the most cost-effective bridge demolition strategy.
3. LCCA Tools The time value of money is germane to LCC because the
costs included in the analysis are incurred at varying points in time. For LCC, costs occasioned at different times must be converted to their value at a common point in time (15).
3.1. Net Present Value Method
The commonest method used to compare past, present and future cash flows with those of today is termed the Net Present Value method (NPV). Costs occur at different times, therefore it is necessary to use a discount rate in the calculations to reflect the "time value of money". This can be expressed as the NPV equation (15):
𝑁𝑁𝑁𝑁𝑁𝑁 = ∑ 𝐶𝐶𝑛𝑛(1+𝑟𝑟)𝑛𝑛
𝐿𝐿𝑛𝑛=0 (1)
Where: NPV is the life-cycle cost expressed as a present value, n is the year considered, Cn is the sum of all cash flows in year n, r is the discount rate, and L is the service life-span. The net present value for a future cash flow Co, expected to fall due every year during the service life-span L, e.g. annual operation cost, can be calculated by (15):
𝑁𝑁𝑁𝑁𝑁𝑁 = 𝐶𝐶𝑜𝑜 ∙1−(1+𝑟𝑟)−𝐿𝐿
𝑟𝑟 (2)
3.2. Equivalent Annual Cost Technique
When comparing investment projects of unequal life-spans, it would be improper to simply compare the NPVs of the two projects unless neither project could be repeated to let all projects have the same analysis period.Equivalent Annual Cost (EAC) is often used as a decision support-tool in capital budgeting when comparing investment projects of unequal life-spans. In finance the EAC is the cost per year of owning and operating an asset over its entire life-span. The alternative associated with the lowest annuity cost is the most cost-effective choice. The EAC is calculated by multiplying the NPV by the annuity factor (15):
EAC is the equivalent annuity cost, At,r is the annuity factor,
3.3. Net Saving& Opportunity Loss
The Net Saving (NS) and the Opportunity Loss (OL) are two different techniques developed to highlight the feasibility of the LCCA results from different angles. The NS is the amount of money that could be saved by implementing the most cost-efficient alternative compared with the implementation of the other alternative, while the OL is the amount of money that could be lost by implementing the least cost-efficient alternative compared with the implementation of most cost-efficient one.
When comparing two alternatives having an equal life-span, the NPV could be employed to specify the most cost-efficient alternative. In this case, the NS will be equal to the OL and could be calculated by subtracting the NPV of both alternatives from each other.
When comparing two alternatives having unequal life-span, the EAC could be employed to specify the most cost-efficient alternative. Hence, the NS and the OL could be presented in two ways. Firstly, they could be presented as an annual saving/loss during the life-span of the alternative that will be implemented. This could be computed by subtracting the EAC of both alternatives from each other. The implemented alternative when computing the NS is the most cost-efficient alternative while the implemented alternative when computing the OL is not the most cost-efficient alternative. Secondly, the NS and the OL could be presented as a total saving/loss amount during the life-span of the alternative that will be implemented. This can be calculated by converting the annual NS/OL to a present value. Equation 4 and 5 respectively present the present value of the NS and the OL in case of comparing two alternatives A and B, where alternative B is the most cost-efficient alternative.
𝑁𝑁𝑁𝑁 = (𝐸𝐸𝐸𝐸𝐶𝐶𝐸𝐸 − 𝐸𝐸𝐸𝐸𝐶𝐶𝐵𝐵) ∙ 1−(1+𝑟𝑟)−𝐿𝐿𝐵𝐵
𝑟𝑟 (4)
𝑂𝑂𝐿𝐿 = (𝐸𝐸𝐸𝐸𝐶𝐶𝐸𝐸 − 𝐸𝐸𝐸𝐸𝐶𝐶𝐵𝐵) ∙ 1−(1+𝑟𝑟)−𝐿𝐿𝐸𝐸
𝑟𝑟 (5)
Where: EACX is the equivalent annuity cost associated with alternative (X), LX is the life-span of alternative (X).
3.4. Bridge User Cost
Bridge user costs can mainly be classified into two types; long-term user cost and work zone user cost (WZUC). The long-term user cost is due to permanent characteristics of the bridge. The WZUC are costs incurred by the users of the bridge as a result of deteriorating conditions of the bridge, such as a narrow width or low load capacity, which result from maintenance, repair and rehabilitation activities, leading to an increase in the vehicle trip time. By including the WZUC in the LCC analysis, the importance of avoiding
16 Life-Cycle Costing Integration with Bridge Management Systems
traffic disruptions will be considered. The user costs during a work zone closure are usually evaluated with respect to the traffic delay costs, the additional vehicle operating costs, and the cost of the increased risk of accidents. The main challenge in the WZUC evaluation is in the estimation of the travel delay time to cross the bridge during a work zone condition. The time delay estimation considering the different traffic flow conditions was properly presented by (12). The structural engineering and bridges division at the Royal Institute of Technology, developed a bridge WZUC model adopted for the Swedish bridges similar to the model demonstrated by (12). This model was integrated within a stand-alone bridge LCC program named "BaTMan-LCC". Using this program, the bridge user cost will be estimated for thecase study in this paper.
4. Case Study On some occasions during the bridge operation phase, the
choice has to be made between two or more strategies to repair a specific structural member or structural element in a certain bridge. The choice is directed by numerous factors such the strategy initial cost, the bridge or the bridge structural member residual service life without action, the anticipated service life extension after the repair strategy, user cost, financial prerequisites, etc.
Vårbyvägen Bridge in Sweden was constructed in 1969. The total bridge length is 102 m and the total bridge width is
21 m. The bridge is a Four-Lane Divided, situated in an interstate region and serves an average daily traffic of 9100 vehicles per day with a design speed limit of 90 km/h. The traffic growth rate in the bridge region is expected to be 1.1%. According to BaTMan, the Vårbyvägen Bridge has a number [1-813-1], which refers to [County number-Section/Junction number in the rout-Bridge number in the Section/Junction]. Figure 3 (a) and (b) show the bridge layout and the bridge cross-section, respectively.
4.1. Strategies Specifications
The surfacing of the bridge deck is deemed to be in such a condition that its residual service life is not more than 3 years if no action is taken (BaTMan CC 2). The bridge deck, which is the dominating structural member of the surfacing, is expected to last for at least another 50 years with normal maintenance (BaTMan Condition class 0). The choice now stands between immediately repairing the surfacing or utilizing its residual service life without action and then replacing the entire surfacing. It is estimated that it will cost 1,250 SEK/m2 to repair the bridge deck surfacing: mending the concrete, new waterproofing and paving of the deteriorated parts. Demolishing the old surfacing and placing with a new one, included paving, waterproofing and mending the bridge deck, would cost 2,900 SEK/m2. Table 2 presents the strategies specifications. Figure 4 and Figure 5 show the cash flow for strategy (A) and (B), respectively.
Figure 3 (a). the layout of the bridge, the dimensions are given in millimeters
Figure 3 (b). cross-section of the bridge, the dimensions are given in millimeters
Civil Engineering and Architecture 2(1): 11-23, 2014 17
Table 2. Strategies specifications
Parameter Strategy (A) Strategy (B)
Strategy description Immediate repair and then renew
Utilizing the residual service life without action and then renew
Dominating structural member’s residual service life (years) 50
Residual service life without action (years) 3
Discount rate (%) 4
Service life after a single action (year) 10 35
Initial cost (SEK/m2) 1,250 2,900
Required installation time (hr/m2) 0.75 2
Figure 4. Strategy (A): Immediate repair and then renew
Figure 5. Strategy (B): Utilizing the residual service life without action and then renew
4.2. Analysis excluding the bridge user cost
Based on Table 2, the life-span for strategy (A) will be 45 years and 38 years for strategy (B). In this case both strategies have life-spans less than the residual life-span of dominating structural member which is 50 years. As shown in Table 3, strategy (B) is associated with a NPV less than strategy (A). However, this does not necessarily mean that strategy (B) is the most cost-effective, simply because the strategies have unequal life-span. Therefore, the EAC was calculated for each strategy, shown In Table 3. Using equation 4 and 5, the NS and the OL were calculated. The NS is equal to 912,691SEK/38 years or 47,124 SEK/year for a life span equals to 38 years. The OL is equal to 976,411
SEK/45 years or 47,124 SEK/year for a life span equals to 45 years.
Table 3 LCC analysis results excluding the bridge user cost
Results Strategy (A) Strategy (B)
Net present value (SEK/m2) 3,209 2,578
Equivalent annual cost (SEK/m2) 155 133
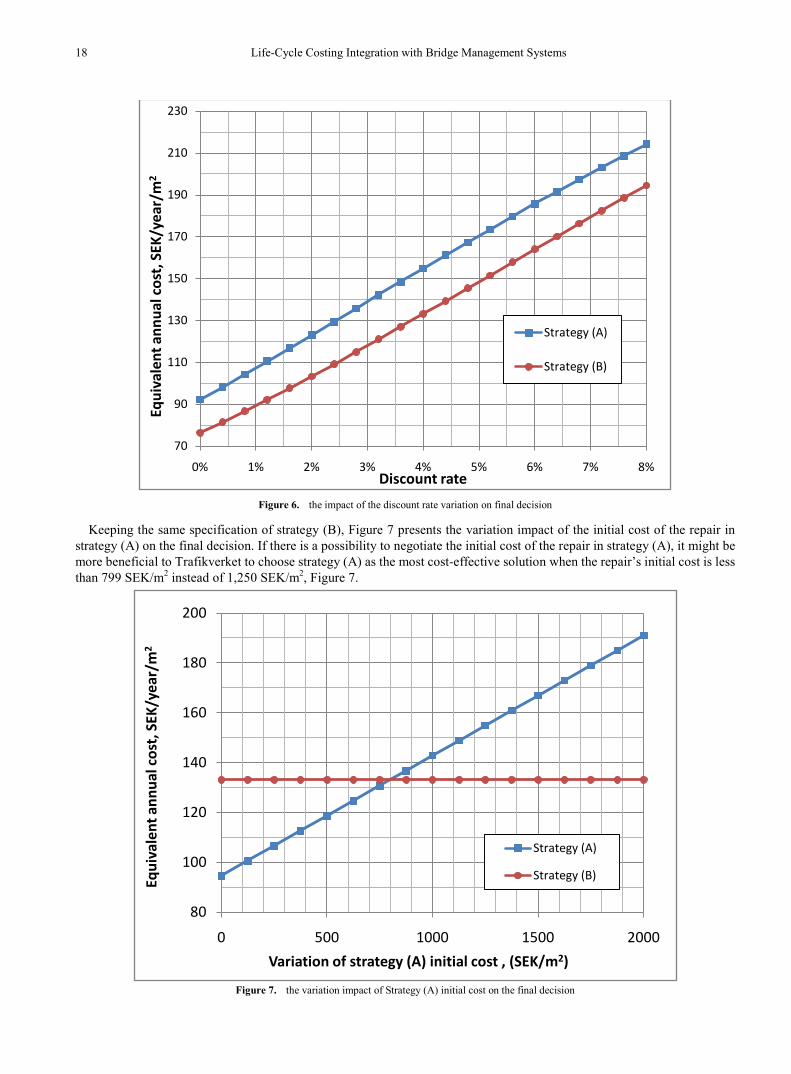
By performing a sensitivity analysis to study the impact of varying the discount rate (r) from zero to 2r, as shown in Figure 6, strategy (B) remains the superior regardless the variation of r.
User Cost
User Cost
Extended Residual Service after Repair
Renewal Cost
Today
Repair Cost
The DominatingStructural Member’s
Service Life
User Cost
Residual Service Life without Action
Renewal Cost
Today The DominatingStructural Member’s
Service Life
18 Life-Cycle Costing Integration with Bridge Management Systems
Figure 6. the impact of the discount rate variation on final decision
Keeping the same specification of strategy (B), Figure 7 presents the variation impact of the initial cost of the repair in strategy (A) on the final decision. If there is a possibility to negotiate the initial cost of the repair in strategy (A), it might be more beneficial to Trafikverket to choose strategy (A) as the most cost-effective solution when the repair’s initial cost is less than 799 SEK/m2 instead of 1,250 SEK/m2, Figure 7.
Figure 7. the variation impact of Strategy (A) initial cost on the final decision
70
90
110
130
150
170
190
210
230
0% 1% 2% 3% 4% 5% 6% 7% 8%
Equi
vale
nt a
nnua
l cos
t, S
EK/y
ear/
m2
Discount rate
Strategy (A)
Strategy (B)
80
100
120
140
160
180
200
0 500 1000 1500 2000
Equi
vale
nt a
nnua
l cos
t, S
EK/y
ear/
m2
Variation of strategy (A) initial cost , (SEK/m2)
Strategy (A)
Strategy (B)
Civil Engineering and Architecture 2(1): 11-23, 2014 19
7. Analysis Including the Bridge User Cost The traffic data on BaTMan is automatically updated each year as BaTMan is directly connected to the Swedish National
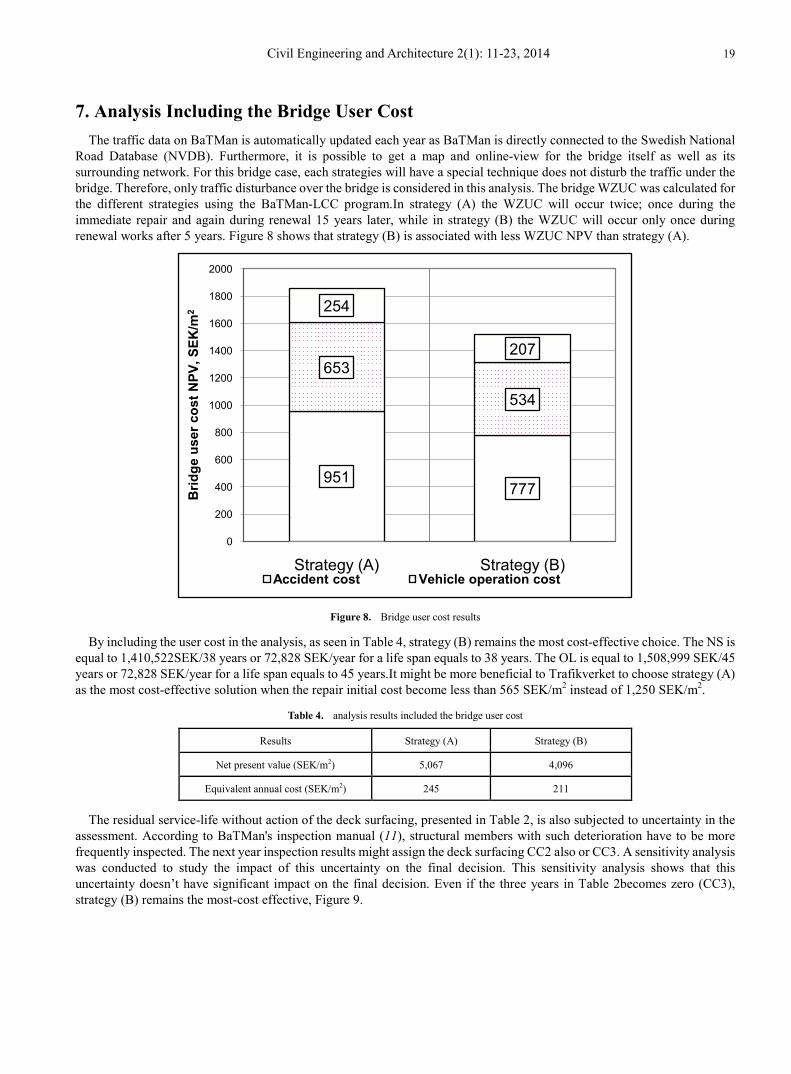
Road Database (NVDB). Furthermore, it is possible to get a map and online-view for the bridge itself as well as its surrounding network. For this bridge case, each strategies will have a special technique does not disturb the traffic under the bridge. Therefore, only traffic disturbance over the bridge is considered in this analysis. The bridge WZUC was calculated for the different strategies using the BaTMan-LCC program.In strategy (A) the WZUC will occur twice; once during the immediate repair and again during renewal 15 years later, while in strategy (B) the WZUC will occur only once during renewal works after 5 years. Figure 8 shows that strategy (B) is associated with less WZUC NPV than strategy (A).
Figure 8. Bridge user cost results
By including the user cost in the analysis, as seen in Table 4, strategy (B) remains the most cost-effective choice. The NS is equal to 1,410,522SEK/38 years or 72,828 SEK/year for a life span equals to 38 years. The OL is equal to 1,508,999 SEK/45 years or 72,828 SEK/year for a life span equals to 45 years.It might be more beneficial to Trafikverket to choose strategy (A) as the most cost-effective solution when the repair initial cost become less than 565 SEK/m2 instead of 1,250 SEK/m2.
Table 4. analysis results included the bridge user cost
Results Strategy (A) Strategy (B)
Net present value (SEK/m2) 5,067 4,096
Equivalent annual cost (SEK/m2) 245 211
The residual service-life without action of the deck surfacing, presented in Table 2, is also subjected to uncertainty in the assessment. According to BaTMan's inspection manual ( 11), structural members with such deterioration have to be more frequently inspected. The next year inspection results might assign the deck surfacing CC2 also or CC3. A sensitivity analysis was conducted to study the impact of this uncertainty on the final decision. This sensitivity analysis shows that this uncertainty doesn’t have significant impact on the final decision. Even if the three years in Table 2becomes zero (CC3), strategy (B) remains the most-cost effective, Figure 9.
951777
653
534
254
207
0
200
400
600
800
1000
1200
1400
1600
1800
2000
Strategy (A) Strategy (B)
Brid
ge u
ser c
ost N
PV, S
EK/m
2
Accident cost Vehicle operation cost
20 Life-Cycle Costing Integration with Bridge Management Systems
Figure 9. The variation impact of the surfcasting residual service life without action on the final decision
Figure 10. The variation impact of the bridge deck residual service life on the final decision
100
125
150
175
200
225
250
0 1 2 3 4 5 6 7 8
Equi
vale
nt a
nnua
l cos
t, S
EK/y
ear/
m2
Residual service life without action, years
Strategy (A), Including user costStrategy (B), Including user costStrategy (A), Excluding user cost
200
240
280
320
360
400
440
480
520
560
600
10 20 30 40 50 60
Equi
vale
nt a
nnua
l cos
tin
clud
ing
CU
ser(S
EK/y
ear/
m2
Dominating structural memebr residual service life, years
Strategy (A)
Strategy (B)
Civil Engineering and Architecture 2(1): 11-23, 2014 21
The service life extension of the structural element after implementing any of the repair strategies should not exceed the residual service life of the dominating structural member. When replacing a structural member, all of its structural elements will be replaced regardless if some of the elements are still functioning well. Therefore, the residual service life of dominating structural member is an important factor in the analysis. However, it is not an easy task to anticipate a long performance of the different bridge structural members. The impact of this uncertainty on the final decision was studied and presented in Figure 10. Strategy (B) remains the most cost-effective choice as long as the residual service life of the dominating structural member is longer than 10 years otherwise strategy (A) becomes the most cost-effective. In this figure, the EAC of strategy (A) sharply drops when the residual service life of dominating structural member is less than 10 years because at this point strategy (A) will comprise of an immediate repair without the later renewal.
Figure 11. the variation impact of the renewal life-span on the final decision
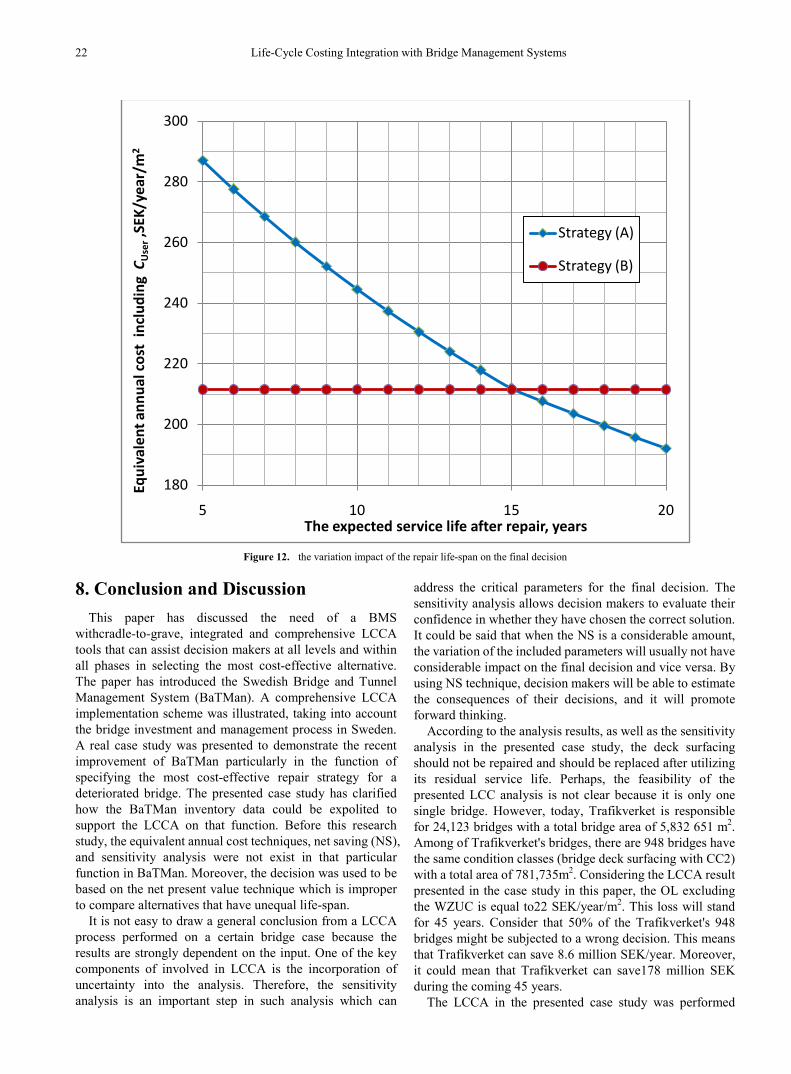
The assessment of the service life extension after implementing strategies was assessed based on statistical treatment of an intensive historical data extracted from BaTMan related to similar actions performed on similar bridges. Therefore, the service life extension after implementing any of the strategies is subjected to uncertainties in the assessment. The impact of this uncertainty on the final decision was studied and presented in presented Figure 11 and Figure 12. Keeping the same expected service life after repair and varying the expected service life after renewal, Strategy (B) remains the most cost-effective where the renewals expected service life is higher than 15 years, Figure 11. Keeping the same expected service life after renewal and varying the expected service life after repair, Strategy (B) remains the most cost-effective as the repair’s expected service life is less than 15 years, Figure 12.
Other way of formulating the repair strategies for this bridge is to consider only one single action in each strategy. In this case, strategy (A) will only comprise an immediate repair without considering the later renewal. From this point of view, strategy (A) will have a life span of 10 years instead of 45 years. Considering this short-term planning for strategy (A) and keeping the same specification of strategy (B), the analysis was performed. The EAC including the WZUC for strategy (A) and (B) are equal to 230 SEK/m2/year and 211 SEK/m2/year respectively. Consequently, strategy (B) remains the most cost-effective choice. The EAC of strategy (A) does not have that considerable variation in comparison with the long-term planning presented in Figure 4. Therefore, it is recommended to only consider one action in each strategy without complicating the analysis by considering long-term planning.
150
200
250
300
350
400
450
10 15 20 25 30 35 40 45 50
Equi
vale
nt a
nnua
l cos
tin
clud
ing
CU
ser ,
SEK/
year
/m2
The expected service life after renewal, years
Strategy (A)
Strategy (B)
22 Life-Cycle Costing Integration with Bridge Management Systems
Figure 12. the variation impact of the repair life-span on the final decision
8. Conclusion and Discussion This paper has discussed the need of a BMS
withcradle-to-grave, integrated and comprehensive LCCA tools that can assist decision makers at all levels and within all phases in selecting the most cost-effective alternative. The paper has introduced the Swedish Bridge and Tunnel Management System (BaTMan). A comprehensive LCCA implementation scheme was illustrated, taking into account the bridge investment and management process in Sweden. A real case study was presented to demonstrate the recent improvement of BaTMan particularly in the function of specifying the most cost-effective repair strategy for a deteriorated bridge. The presented case study has clarified how the BaTMan inventory data could be expolited to support the LCCA on that function. Before this research study, the equivalent annual cost techniques, net saving (NS), and sensitivity analysis were not exist in that particular function in BaTMan. Moreover, the decision was used to be based on the net present value technique which is improper to compare alternatives that have unequal life-span.
It is not easy to draw a general conclusion from a LCCA process performed on a certain bridge case because the results are strongly dependent on the input. One of the key components of involved in LCCA is the incorporation of uncertainty into the analysis. Therefore, the sensitivity analysis is an important step in such analysis which can
address the critical parameters for the final decision. The sensitivity analysis allows decision makers to evaluate their confidence in whether they have chosen the correct solution. It could be said that when the NS is a considerable amount, the variation of the included parameters will usually not have considerable impact on the final decision and vice versa. By using NS technique, decision makers will be able to estimate the consequences of their decisions, and it will promote forward thinking.
According to the analysis results, as well as the sensitivity analysis in the presented case study, the deck surfacing should not be repaired and should be replaced after utilizing its residual service life. Perhaps, the feasibility of the presented LCC analysis is not clear because it is only one single bridge. However, today, Trafikverket is responsible for 24,123 bridges with a total bridge area of 5,832 651 m2. Among of Trafikverket's bridges, there are 948 bridges have the same condition classes (bridge deck surfacing with CC2) with a total area of 781,735m2. Considering the LCCA result presented in the case study in this paper, the OL excluding the WZUC is equal to22 SEK/year/m2. This loss will stand for 45 years. Consider that 50% of the Trafikverket's 948 bridges might be subjected to a wrong decision. This means that Trafikverket can save 8.6 million SEK/year. Moreover, it could mean that Trafikverket can save178 million SEK during the coming 45 years.
The LCCA in the presented case study was performed
180
200
220
240
260
280
300
5 10 15 20
Equi
vale
nt a
nnua
l cos
tin
clud
ing
CU
ser,S
EK/y
ear/
m2
The expected service life after repair, years
Strategy (A)
Strategy (B)
Civil Engineering and Architecture 2(1): 11-23, 2014 23
considering no budget limitations. The analysis was only considered the project-level regardless of the network-level considerations. These factors might significant direct the final decisions in other projects. These aspects are important
to consider but are beyond the scope of this paper. In addition, further researches should be directed toward clarifying how to handle the same activity on a network-level, taking into account the NS from the project-level analysis.
List of Acronyms
REFERENCES [1] AASHTO (2001),Guidelines for Bridge Management
Systems, American Association of State Highway and Transportation Official, AASHTO, Washington, D.C.
[2] Hallberg, D. & Racutanu, G. (2007). Development of the Swedish bridge management system by introducing a LMS concept. Materials and Structures (2007) 40:627–639
[3] Hawk, H. (2003).NCHRP Report 483: Bridge Life-Cycle Cost Analysis. TRB, National Research Board, Washington, D.C.
[4] ISO15686-5. (2008). Building and constructed assets-service-life planning. Part 5: Life-cycle costing. Stockholm: Swedish Standard Institute.
[5] Markow, M. and Hyman, W. (2009). NCHRP Synthesis 397:Bridge Management Systems for Transportation Agency Decision Making.TRB, Transportation Research Board, Washington, D.C.
[6] Mattsson, H. & Sundquist, H. (2007). The Real Service Life of Road Bridges. Proceeding of the Institution of Civil Engineering, Bridge Engineering, 160 (BE4), 173-179.
[7] Ozbay, K., Jawad, D., and Hussain, S. (2004). Life-Cycle Cost Analysis-State of the Practice versus State of the Art.In Transportation ResearchRecord: Journal of the Transportation Research Board, No. 1864, TRB, Washington, D.C., pp. 62–70.
[8] R. Helmerich, E. Niederleithinger, D. Streicher, H. Wiggenhauser, and D. Algernon (2008). Bridge Inspection and Condition Assessment in Europe. Transportation Research Record: Journal of the Transportation Research Board,No. 2044, Transportation Research Board of the National Academies, Washington, D.C., 2008, pp. 31–38.
[9] Racutanu G.The Real Service Life of Swedish Road Bridges –
A case study.TRITA-BKN Bulletin 59, Dept. of Structural Engineering, Royal Institute of Technology, Stockholm, PhD thesis, 2000.
[10] Shirolé, A. (2010). Bridge Management to the Year 2020 and Beyond, Transportation Research Record: Journal of the Transportation Research Board, No. 2202, Transportation Research Board of the National Academies, Washington,D.C., 2010, pp. 159–164.
[12] The State of New Jersey. (2001). Road user cost manual. Department Transportation, New Jersey.
[13] The Swedish Transport Administration (1996) Bridge – Measurement and Condition Assessment. SRA publication 1996:038 (E) Borlange, Sweden.
[14] Thompson, Paul D. (2004).Bridge Life-Cycle Costing in Integrated Environment of Design, Rating, and Management. Transportation Research Record: Journal of the Transportation Research Board,No. 1866, TRB, National Research Council, Washington, D.C., pp. 51–58.
[15] Troive, S. (1998). Structural LCC design of concrete bridges. PhD Thesis, KTH-The Royal Institute of Technology, Department of Structural Engineering, Stockholm.
[16] V. Patidar, S. Labi, K. Sinha and P. Thompson (2007). NCHRP REPORT 590: Multi-Objective Optimization for Bridge Management Systems.TRB,Transportation Research Board, Washington, D.C.
[17] Safi, Mohammed (2012). LCC Applications for Bridges and Integration with BMS. KTH Royal Institute of Technology, Division of Structural Engineering and Bridges, Licentiate thesis