Thesis for the degree of Doctor of Philosophy Life Cycle Primary Energy Use and Carbon Emission of Residential Buildings Ambrose Dodoo Ecotechnology and Environmental Science Department of Engineering and Sustainable Development Mid Sweden University Östersund, Sweden 2011 Mid Sweden University Doctoral Thesis 115
Transcript
Thesis for the degree of Doctor of Philosophy
Life Cycle Primary Energy Use and Carbon Emission
of Residential Buildings
Ambrose Dodoo
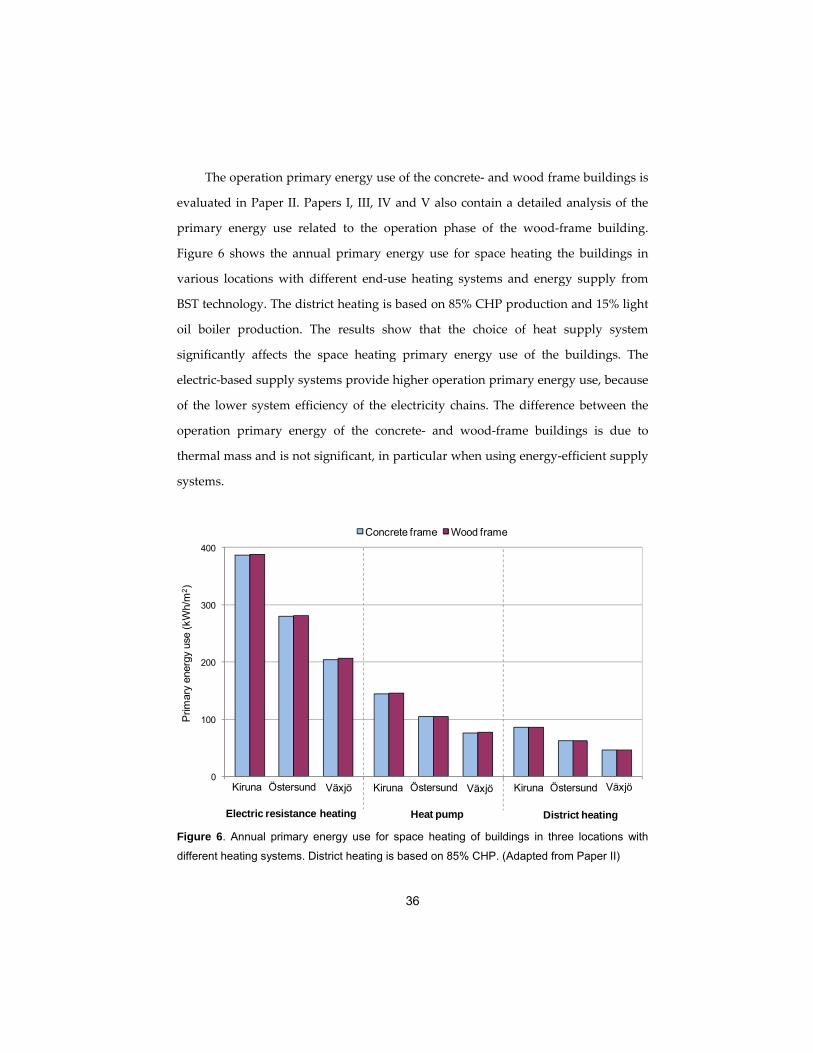
Ecotechnology and Environmental Science
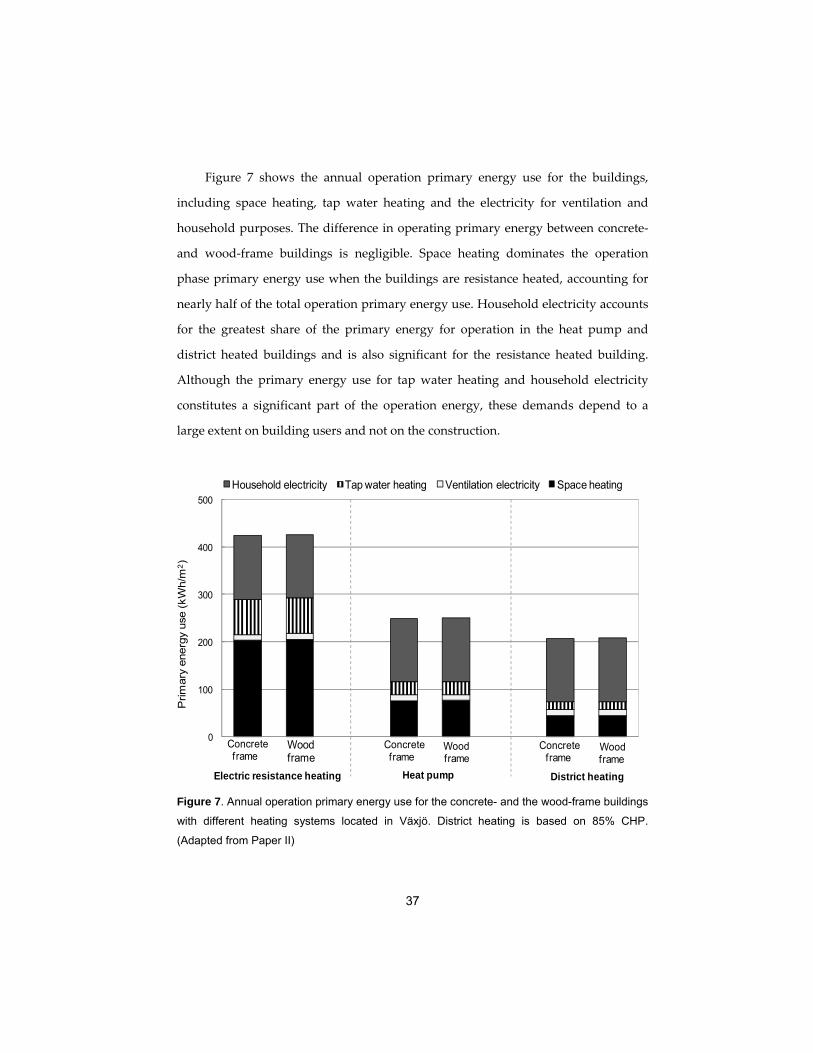
Department of Engineering and Sustainable Development
The Intergovernmental Panel on Climate Change (IPCC) documents the science,
impacts and mitigation options of climate change. In a series of synthesis reports (e.g.
IPCC, 1996; 2001; 2007a) the IPCC reported strong evidence that the increasing
concentration of GHG in the atmosphere is altering the global climate system, and
would cause significant negative impacts to ecological, socio‐economic and
technological systems, unless timely and effective mitigation strategies are
implemented. The IPCC’s conclusion is based on rigorous assessment of climate data
and consensus within the scientific literature. It also highlights the complexity
involved in studies of the global climate system. There has been much discussion in
the scientific literature about the dangerous level of anthropogenic interference with
the global climate system; various reports (e.g., European Commission, 2007; IPCC,
2007b; O’Neill and Oppenheimer, 2002) have suggested a global mean temperature
increase that is likely to be associated with significant negative impacts, including
heat waves, drought, flooding, a rise in sea level, coastal erosion and the failure of
food production systems. The European Union (EU) suggests that limiting
temperature increases to 2° C, relative to pre‐industrial levels, would fulfill the
objective of avoiding dangerous climate change (European Commission, 2007;
European Environmental Agency, 2008). The emissions pathway required to avoid
this climate change is difficult to predict, because of the complexity of the global
carbon system. However, the EU Climate Change Expert Group (2008) suggests that
stabilization of atmospheric GHG concentration levels below 450 ppm CO2‐eq would
be necessary to have a 50% chance of avoiding an increase in temperature above 2° C.
The Stern review on the economics of climate change emphasized the need for strong
and timely action to reduce GHG emission and stabilize atmospheric GHG
concentration (Stern, 2006). However, the review suggested that stabilization at 450
ppm CO2‐eq may be difficult, considering current CO2 emission and concentration
trends in the atmosphere, unless strong and immediate action is pursued. According
to Stern, stabilization of atmospheric GHG concentrations at 550 ppm CO2‐eq is
4
feasible and would cost the global community about 1% of its GDP. Stern’s review
has been the subject of much criticism for several reasons, including the discount rate
used to evaluate the cost of mitigating climate change and its conclusions
(Mendelsohn, 2006; Tol and Yohe, 2006; Nordhaus, 2007). The IPCC has presented a
range of GHG emission scenarios and their likely climatic implications (IPCC, 2000;
2007c). Significant progress toward climate change mitigation can be achieved by
strategies that reduce CO2 emission, such as reducing fossil fuel use, and by
strategies that increase carbon sinks, such as sustainable forestry practices.
Various attempts and initiatives have been made at the global and regional
levels to address climate change over the years. These include the United Nations
Framework Convention on Climate Change treaty (United Nations, 1992) and the
Kyoto protocol (UNFCCC, 1998). The EU (then EU‐15) has ratified the Kyoto
protocol and is obliged to reduce its collective GHG emissions by 8% below 1990
levels between 2008 and 2012 (UNFCCC, 1998). The EU has further set a target of a
GHG emission reduction of 20% by 2020, relative to 1990 levels (European
Commission, 2010). The Swedish society must reduce GHG emissions by 4% as part
of the EU ratification of the Kyoto protocol. Its long‐term goal is to phase out fossil
fuels for heating purposes by 2020 and to reduce GHG emission by 50% by 2050
(Swedish Government, 2006). Governments around the world are seeking effective
strategies to reduce GHG emission. The reduction of GHG emissions will require
concerted effort from all sectors of the economy.
1.2 Buildings and climate change
The role of the building sector in the development of a sustainable built
environment is substantial. Globally, building energy use accounts for 30‐40% of total
primary energy use, and the building sector is expected to play a major role in
reducing CO2 emission to mitigate climate change (UNEP, 2007; IPCC, 2007c). Energy
is used during the life cycle of buildings for material production, transport,
5
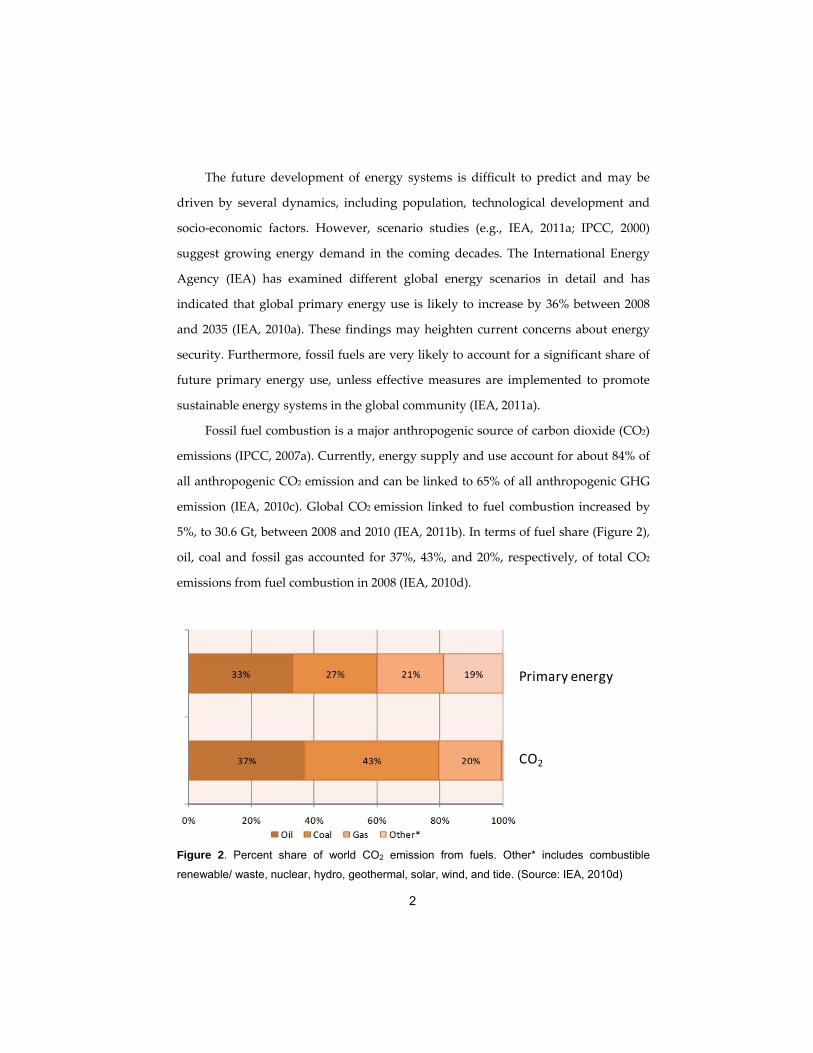
construction, operation, maintenance and demolition. CO2 is emitted by fossil fuel
combustion, land‐use practices and industrial process reactions. Building energy use
accounts for about a third of global total CO2 emission (UNEP, 2007; Price et al., 2006).
About 50% of the total global final energy use in the building sector is used in space
conditioning and tap water heating (IEA, 2011a). There is great potential to improve
the primary energy efficiency of buildings and thereby reduce CO2 emissions (IPCC,
2007c; IEA, 2008). Reducing the energy use of buildings also present the lowest cost
for GHG emission mitigation (IEA, 2008). Several strategies can be used to realize this
potential, including reduced heating demand, increased efficiency in energy supply
chains, greater use of renewables and less carbon‐intensive materials and efficient
post‐use of building materials.
Generally, buildings have long life spans and should be designed and
constructed to have low primary energy use and carbon emission over their entire life
cycle. Energy efficiency measures may be cost effective and may be more feasible
during the construction stage of buildings. Effective building standards may specify
minimum energy use and CO2 emission limits for buildings and can be important
instruments in the development of an energy‐efficient built environment. Currently,
building energy standards have an orientation toward the construction of buildings
with low operation phase impacts. Building to the passive house standard is
increasingly suggested to be a beneficial solution from both energy and economic
perspectives (Passive House Institute, 2007). The construction of new low‐energy
buildings is important in the long term. However, this may have little effect on the
building sector’s overall energy use in the short term, because the rate of addition of
new buildings to the building stock is low (Bell, 2004; Itard et al., 2008). Measures to
improve the energy efficiency of existing buildings offer a significant opportunity to
reduce primary energy use and CO2 emissions in the short term (Harvey, 2009).
Therefore, to address primary energy use and CO2 emissions in the building sector,
both existing and new buildings should be targeted. The IEA has identified measures
6
that can contribute to lower CO2 emissions in new and existing buildings. These
measures include building energy standards and certification schemes, low‐energy
buildings including passive house standard buildings and energy efficiency retrofit
measures for existing buildings (IEA, 2008).
Improved energy efficiency in buildings is a priority in Sweden and the rest of
the EU (European Commission, 2005). In the EU, 40% of total primary energy is used
in the building sector, and a large share of the final energy is used for space and tap
water heating in buildings. About 60% of the total final energy in the Swedish
residential and service sector is used for space and tap water heating (Swedish Energy
Agency, 2010). The EU Directive (2002/91/EC) on Energy Performance of Buildings
requires Member States to implement improved energy efficiency legislation for
buildings. The directive seeks to improve the carbon performance of building stock
through the use of sustainable energy strategies and requires member states to follow
a framework methodology to regulate the energy efficiency and carbon performance
of buildings. Efforts to achieve climate and energy policy goals in many parts of the
EU include instruments such as fees and taxes on landfilling that promote efficient
post‐use of building materials (European Commission, 2001). The Swedish
government, through the Bill on Energy Efficiency and Smart Construction, aims to
reduce total energy use per heated building area by 20% by 2020 and 50% by 2050,
using 1995 as the reference (Swedish Government Bill 2005/06:145). Swedish building
energy regulations have been revised three times between 2006 and 2009 to improve
end‐use energy efficiency of buildings. The Swedish building construction sector aims
to divert about half of its post‐use building materials from landfill (Swedish
Government, 2003). These policy actions are aimed at promoting effective
environmental protection for sustainable built environment and thereby contribute to
mitigate climate change.
Decisions on strategies to reduce primary energy use and CO2 emission in the
building sector may be based on a number of factors. However, detailed information
7
on effective means to improve energetic and climatic impacts of buildings is necessary
to inform policymakers and facilitate effective decision making. This thesis endeavors
to increase understanding of strategies to improve primary energy efficiency and
minimize climatic impacts of new and existing residential buildings.
1.3 Literature review
The oil crises of the late 1970s raised concerns about energy use in buildings
and motivated research to reduce energy for space heating, particularly measures to
reduce transmission loss and to optimize solar gain (Verbeek and Hens, 2007). Since
then, research has further considered strategies to improve operational energy
efficiency and life cycle environmental performance of buildings.
In recent decades, various studies have been conducted to analyze energy and
carbon implications of building and construction systems. The studies differ in
scope, methodology and building life cycle activities analyzed. Most research has
concentrated on the operation phase of buildings, mainly on issues related to space
conditioning and ventilation. Balaras et al. (2005) conducted a comprehensive survey
of buildings across five European countries and assessed the influence of thermal
insulation and heating systems on the energy use and environmental impacts of the
buildings. They found a high degree of variability in heat use of buildings within the
same climate. Jokisalo et al. (2003) simulated the performance of ventilation heat
recovery (VHR) systems in a typical Finnish apartment building using centralized or
decentralized ventilation units. They found that energy performance of
decentralized ventilation units is not significantly improved when VHR is installed.
Sherman and Walker (2007) analyzed the energy impact of different ventilation
norms in typical US buildings. They found that VHR generally increased net energy
use, as the energy used by the blower offset the energy savings from space
conditioning. Karlsson and Moshfegh (2007) conducted a study of the energy use
and CO2 emission of low energy buildings in Sweden. They showed that
8
assumptions about energy supply and electricity mix can have a significant impact
on the calculated energy use and CO2 emission of buildings.
Some studies (e.g., Hamza and Greenwood, 2009; Asdrubali et al., 2008;
Beerepoot and Beerepoot, 2007; Tommerup et al, 2007; Bell and Lowe, 2000) have
analyzed and discussed the energy impacts of building standards, but most focus on
energy use during the operation phase of buildings. Casals (2006) analyzed the
primary energy use of a building constructed to the new Spanish building code and
showed the importance of including production energy in building energy
assessment. Several studies (e.g., Janson, 2008; IEA, 2006; Dascalaki and
Santamouris, 2002; Hestnes and Kofoed, 2002; Balaras et al., 2000) have also analyzed
the impact of energy efficiency retrofitting measures on final energy use during the
operation phase.
Some studies have analyzed the interactions between end‐use energy efficiency
measures and heat supply systems. Gustavsson (1994a,b) analyzed the potential
space and tap water heat savings in district heated buildings and explored the effect
of this on district heating system design and cost. He found cost and energy saving
potential to largely depend on the specific building and district heating system.
Gustavsson and Joelsson (2010) analyzed the primary energy savings in district
heated buildings, including fuel inputs at each stage of the energy chain based on
annual average final energy demand and annual average district heat production.
Gustavsson and Joelsson (2010) also showed that it is essential to consider primary
energy use when analyzing building operation energy, instead of focusing on final
energy. They found that the primary energy use to heat a district heated
conventional building was lower than for an electrically heated passive house, even
though the passive house had substantially lower final energy use.
Various comparative studies have been conducted to assess the effect of the
thermal mass of building frame material on the final energy for space heating and
cooling buildings. Norén et al. (1999) analyzed the effect of thermal mass on the final
9
energy for space heating in Swedish buildings and concluded that the benefit of
thermal mass is less where buildings located in a Nordic climate have ample
insulation with plasterboard cladding. Zhu et al. (2009) compared identical buildings
constructed with wood and concrete frames in a hot US climate where thermal mass
is considered favorable. They found that a wood‐frame building used more space
heating energy but less space cooling energy than the concrete‐frame building.
Kalema et al. (2008) used a quasi‐steady approach to estimate the heat capacity and
time constant associated with the building mass and analyzed the effect of thermal
mass on the space conditioning energy use for a Nordic building. They concluded
that the amount of final energy savings due to the benefit of thermal mass was
significant. However, Josikalo and Kurnitski (2005) used a dynamic analysis
approach and concluded that the amount of final energy savings of thermal mass in
a Finnish apartment building was not significant. The interaction between building
mass configuration and thermal condition is complex, and a detailed dynamic
analysis is needed to accurately determine the impact of thermal mass.
Some life cycle studies have analyzed the energetic and climatic implications of
buildings, including several aspects of the life cycle activities and flows. For
example, Jönsson et al. (1998) conducted a life cycle assessment of concrete and steel
building frames, including energy use and CO2 emissions. Scheuer et al. (2003)
conducted a comprehensive life cycle assessment of the primary energy and
environmental impacts of a new building, including production, operation and end‐
of‐life stages. Ochoa et al. (2002) assessed the total energy use and environmental
impacts of a building using an economic input/output life cycle assessment and
considering system‐wide direct and indirect impacts. Keoleian et al. (2001) analyzed
the life cycle primary energy use and greenhouse gas emissions of two alternative
energy efficiency levels for a building. Junnila et al. (2006) assessed the life cycle
energy use and environmental emissions of one European and one US building,
taking into account material production, construction, operation, maintenance and
10
building demolition. Gustavsson et al. (2010) calculated the primary energy use and
CO2 emissions of a new eight‐story wood‐framed apartment building, considering
the production, operation and end‐of‐life stages, as well as heat supply from
different end‐use systems and energy supply technologies.
Comparative life cycle studies of building systems show that the choice of
building frame material affects primary energy use and greenhouse gas emissions of
buildings. Cole and Kernan (1996) analyzed the total life cycle energy use of a
building constructed with wood, steel, or concrete structural materials. They found
that the concrete and steel buildings used more energy than the wood building. Cole
(1999) investigated the energy use and greenhouse gas emissions due to on‐site
construction activities of buildings made with wood, steel or concrete structural
materials. He found that energy use and greenhouse gas emissions were lowest for
constructing the steel building, slightly higher for the wood building, and
significantly higher for the concrete building. Adalberth (2000) quantified the
primary energy use of functionally equivalent buildings with wood and concrete
frames. She found that the operation energy was slightly lower for the concrete‐
frame building than for the wood‐frame building, but the overall life cycle energy
balance, including the production, operation and end‐of‐life stages, was lower for the
wood‐frame building than for the concrete‐frame building. Gustavsson et al. (2006)
calculated the primary energy and CO2 balances of buildings constructed with wood
or concrete frames, taking into account various life cycle parameters that included
energy available from biomass residues from logging, wood processing,
construction, and demolition. They found that the wood building used less
production energy and emitted significantly less CO2 than the concrete building.
Gustavsson and Sathre (2006) explored the variability in primary energy and CO2
balances of wood and concrete buildings. They found that recovery of biomass
residues has the single greatest effect on the primary energy and carbon balances of
the buildings, followed by land use issues and concrete production parameters.
11
Some studies show the increasing importance of the production phase primary
energy. Sartori and Hestnes (2007) conducted a review of energy use in the life cycle
of buildings. They found that the primary energy for building production becomes
relatively more important as measures are applied to reduce the operation energy
use. Thormark (2002) found the production energy to represent 45% of total life cycle
primary energy use in a low energy building.
1.4 Knowledge gaps
Previous comparative life cycle studies have made significant contributions.
Nevertheless, most existing life cycle studies on energy and carbon implications of
buildings are based on final energy use or do not include the entire life cycle and
energy chains. While thermal mass and carbonation in the post‐use stage of concrete
have been investigated in a few studies, there were no comprehensive research
linking these to comparative life cycle primary energy and carbon analyses of
concrete and wood‐frame buildings, in 2007, when this research began. Current
building energy standards are oriented toward buildings with low space heating
energy. However, there is a lack of research on the complete life cycle implication of
this approach in general, and on current energy efficiency standards. In general, little
work has been done on how different building systems and life cycle activities
interact with various energy supply systems.
1.5 Study objectives
This thesis investigates the primary energy use and carbon emissions of
residential buildings, including different construction and energy supply systems. A
goal of this thesis is to increase understanding of strategies to reduce primary energy
use and minimize carbon emissions over the life cycle of buildings. The specific
objectives of this research are to
12
compare the life cycle primary energy balance of concrete‐ and wood‐frame
buildings and explore the effect of thermal mass on their life cycle primary
energy balance;
analyze the life cycle primary energy implications of different building energy‐
efficiency standards and explore the effectiveness of current standards;
explore the primary energy implications of different building energy efficiency
retrofit measures, focusing on their interaction with different heat supply
systems and their system‐wide impacts;
compare the life cycle carbon balance of concrete‐ and wood‐frame buildings
and explore the effect of carbonation during the post‐use phase of concrete on
the life cycle carbon balance of the buildings.
1.6 Organization of thesis
This thesis is based on six original papers and is organized in two main parts.
The first part provides a broad background of the thesis, and synthesizes and
integrates the papers presented in the second part. The second part contains the six
original papers, which provide detailed accounts of the analyses and findings.
Papers I and II analyze the life cycle primary energy of buildings including the life
cycle activities, energy supply systems and the entire natural resources chain. The
analysis includes a comparison of wood and concrete buildings, the effect of thermal
mass is accounted for, and the effectiveness of different buildings standards to
reduce primary energy use in buildings is explored. Paper III explores the
implications of building retrofitting from a life cycle primary energy perspective.
Papers IV and V present detailed analyses of the impacts of different building energy
efficiency retrofit measures on the operation primary energy use of buildings. The
emphasis is on the complex interaction between the measures and district heating
systems and the implications of VHR when the heat supply is based on different
end‐use heating systems. Paper VI compares the life cycle carbon balance of
13
concrete‐ and wood‐frame buildings and the implications of different post‐use
management options for demolished building materials. The paper includes detailed
analysis of the carbon dynamics of concrete‐based materials, including calcination
and the effect of carbonation on the service life and post‐use phase of concrete
material.
14
2 Methodological issues and approaches
2.1 Life cycle and systems perspectives
A comprehensive analysis of the impacts caused by a building requires a
system‐wide life cycle perspective. The life cycle of a building includes production,
retrofitting, operation and end‐of‐life phases. Life cycle assessment (LCA) is one of
the methods for assessing the environmental implications of a product during its life
cycle. LCA identifies and quantifies the environmental impacts associated with the
flow of energy and materials in a system. The ISO 14040 series of standards provides
a general framework for LCA and suggests that an LCA study should include all
phases and impacts throughout the life cycle of a product (ISO, 1997; 1998; 2000a;
2000b). However, the ISO standards do not provide details of specific flows to be
quantified in a LCA study. LCA methodology comprises four stages: definition of
the goal, inventory assessment, impact assessment, and interpretation of the results.
Impacts often considered in LCA include acidification, global warming,
eutrophication, ozone depletion, human toxicity and abiotic resource depletion.
There is lack of methodological consistency in the assessment of some of these
impacts, e.g., human toxicity (Scheuer et al., 2003).
Different tools developed to facilitate LCA have been applied in the building
and construction sector, for example, in the analysis of the environmental impact of
building materials. There are additional challenges involved in using these tools to
analyze buildings. Buildings are complex systems comprising multiple components;
their life cycle activities are interlinked and interact with energy supply activities.
Furthermore, buildings have a relatively long life span, and their design and
construction conditions are typically heterogeneous, making each building unique
(IEA, 2001). Thus, the traditional LCA methodology is inadequate for a complete
analysis and investigation of activities that must be optimized for the whole building
(Verbeeck and Hens, 2007). Lave et al. (1995) asserted that the detailed focus of LCA
may lead to neglect of potentially important flows.
15
While LCA emphasizes consideration of all life cycle activities, it tends to
ignore the interactions and synergies between these activities. A systems perspective
is essential in order to account for the interaction and complexities between building
life cycle and energy supply activities. A system comprises a set of interrelated
component parts working as a whole toward a goal. Systems analysis approaches
emphasize the importance of considering the interactions and synergies between
systems, their component parts and their environment, because their interactions
produce unique outcomes (Checkland, 1999). Reductionist analytical approaches, in
contrast to the systems approach, separate the component parts of a system and
consider them as isolated entities. This approach may facilitate an in‐depth analysis
of various details but may be inadequate for a thorough understanding of buildings
as energy systems.
Systems analysis methodology with a life cycle perspective is employed in
Papers I, II, III and VI. This methodology is similar to the life cycle inventory
assessment of LCA and accounts for the synergies and interactions between the life‐
cycle and energy supply activities. Papers IV and V analyze the interactions between
energy efficiency measures and heat supply systems and their effect on operation
primary energy using a systems analysis approach.
2.2 Energy systems analysis
Energy systems encompass the various activities and processes along energy
chains, from energy supply to energy end‐use. It begins from extraction of energy
carriers to refining and conversion, transport, conversion to heat and electricity, and
distribution to the end‐user. This is then used to provide various energy services,
including heating or lighting in buildings. The concept of primary energy is used to
denote the total energy needed in order to generate the final energy service,
including inputs and losses along the entire supply chain. Primary energy use, in
contrast to final energy use, determines the natural resource use and the
16
environmental impact of supplying the energy services (Fay et al., 2000). All the
processes along the energy chain can be performed with variable energy efficiency
and with varying emissions. All the energy inputs for these processes need to be
included for a full description of a particular energy system.
Bottom‐up and top‐down approaches are two complementary methods to
model energy systems. A bottom‐up approach begins with detailed disaggregated
information for a system and then generates aggregate system behavior to
characterize the relationship between the individual components of the system
(Sathre, 2007). This approach provides specific information about the individual
processes and systems studied, allowing for detailed comparison of the alternatives.
The top‐down approach begins with the aggregate information for a system and
then proceeds to disaggregate this to characterize the components (Sathre, 2007).
Some top‐down studies assert that a significant share of energy use in the production
phase of a building is indirect and is not recognized when using a bottom‐up
approach, resulting in truncation energy outside of the system boundaries (Lenzen
and Treloar, 2002; Nässén et al., 2007). In this thesis, several alternative systems are
compared and therefore bottom‐up models of mass and energy flows are used to
allow detailed comparison of the alternatives. The significance of truncation
production primary energy arising from using the bottom‐up instead of top‐down
approach is explored in Paper II.
2.2.1 Electricity supply
There are different electricity production systems and these are characterized
by significant variation in their primary energy use and CO2 emission. Two different
approaches to accounting for primary energy use and CO2 emission from electricity
supply and use are the average and marginal methods. There is much discussion in
literature about which method should be employed in an analysis (e.g., Sjödin and
Grönqvist, 2004; Ekvall and Weidema, 2004). In principle, the method employed
17
should reflect the purpose and relevance of a study. In this thesis, the marginal
accounting method is used because it captures the consequences of changes due to
variation in system parameters. The average accounting method is not suitable
because changes do not readily reflect at the average level (Hawkes, 2010). In
addition, this approach does not reflect the technologies and inputs affected by a
variation in a system.
The Swedish electricity production system is dominated by hydro and nuclear
power and is connected to the NordPool, a network where Nordic countries trade
electricity. Changes in electricity production and use in Sweden affect the NordPool.
Sweden imported a net of 2.0 and 4.7 TWh of electricity in 2008 and 2009,
respectively (Swedish Energy Agency, 2010). Coal‐fired condensing plants are the
dominant marginal electricity production plants in the Nordic system today
(Swedish Energy Agency, 2002; Gustavsson et al., 2006). However, this may change
in the future as a result of several factors, including investments, GHG reduction
policies, and strategic and security reasons (Gustavsson et al., 2006). In this thesis,
end‐use electricity for material production is assumed to be produced from a coal‐
fired marginal plant with 40% conversion efficiency and 2% distribution loss for
high‐voltage electricity.
2.2.2 Heat supply
The heat demand of a building can be provided by various types of end‐use
heating systems and energy supply technologies, including electricity‐based
systems. In Sweden, district heating is mostly used in multi‐story apartment
buildings; 82% of such buildings were district heated in 2008 (Swedish Energy
Agency, 2010). Electric heating and heat pumps are more common in detached
houses. In 2008, electric heating and heat pumps were used in 31 and 20% of such
houses, respectively (Swedish Energy Agency, 2010; Swedish Energy Agency, 2009).
In this thesis, end‐use heating with district heating (Papers I‐V), bedrock heat pumps
18
(Papers II, III, V) and electric resistance heating (Paper I‐III, V), in combination with
different energy supply technologies, are studied. For electric resistance heating and
heat pumps, 95% of the electricity was assumed to be supplied from a stand‐alone
base‐load power plant and the remaining from a light‐oil gas turbine plant. Scenarios
where the stand‐alone base‐load plant is based on biomass steam turbine (BST) or
biomass integrated gasification combined cycle (BIGCC) technologies were analyzed.
The district heating system is assumed to be based on combined heat and power
(CHP) plants and oil boilers. The dimensioning of a CHP plant in district heating
systems may affect primary energy use (Joelsson, 2008). To explore this
dimensioning, scenarios where the CHP plant accounted for different shares of the
average district heat production are analyzed. In Papers I and II, scenarios where the
CHP account for 85% of the district heat production and light‐oil boilers account for
the remainder were studied. In Paper III, the CHP plant is assumed to account for
90% or 50% of the heat production, with light‐oil boilers accounting for the
remainder. In Paper IV, the combination of CHP plants and heat‐only boilers that
provide minimum cost district heat production under different taxation scenarios is
explored, using a reference local district heat load. CHP production accounts for 68‐
83% of the total heat production for the minimum cost district heat production
systems and 92% for the reference district heat production system (Paper IV). The
interactions of several combinations of CHP and heat‐only boiler productions and
VHR systems, and their effect on operation primary energy use, are studied in Paper
V.
2.2.3 Allocation in CHP production
District heating systems with CHP production may present allocation issues, as
electricity is co‐produced with heat. Different methods have been suggested to
address allocation in co‐product systems (Ekvall and Finnveden, 2001). A method
that avoids allocation is preferred because allocation can be challenging and
19
subjective (ISO, 1998). In this thesis, the subtraction method of system expansion was
used to avoid allocation. With this method, the cogenerated electricity is assumed to
replace electricity that would instead have been produced in a stand‐alone plant
using the same fuel and technology as the CHP plant (Gustavsson and Karlsson,
2006). The primary energy that would have been used to produce the replaced
electricity in the stand‐alone plant is subtracted from the CHP plant to obtain the
primary energy for the heat.
2.3 Parameters
Buildings produce different environmental impacts during their life cycle and a
considerable share of these are closely connected to energy use (Björklund and
Tillman, 1997). Cumulative primary energy use largely determines the
environmental impacts of material production and energy supply activities
(Huijbregts et al., 2010). Buildings carbon emissions may be connected to energy
activities and non‐energy activities. There is a close link between CO2 emissions and
the current changes in the global climate system (IPCC, 2007a). Here, two
parameters, primary energy use (Papers I‐V) and carbon emission (Paper VI), are
used in a comprehensive evaluation of the climatic impacts of buildings.
2.4 Functional unit
Functional unit provides a reference to which the inputs and outputs of a system
may be related. Different functional units may be used in the energy and carbon
analyses of buildings (Gustavsson and Sathre, 2011). These units include 1 m2 of a
building’s gross or usable floor area, total gross or usable floor area and the complete
building. In this thesis the functional unit is defined at the level of an entire building.
The results also include per usable floor area to readily facilitate comparison.
20
2.5 System boundaries
System boundaries show the activities included in an analysis. In Papers I‐III, the
system boundaries are defined to include the production, (and also retrofitting in
Paper III), operation and end‐of‐life phases, as well as their interaction with energy
supply activities. A schematic diagram of this is shown in Figure 3. In Papers IV and
V the system boundaries were defined to cover the building operation phase and the
entire energy chain, including their interactions.
Figure 3. Building life cycle and energy supply activities modeled. (Paper III)
Paper VI analyzes the life cycle carbon balance of a wood‐frame and a concrete‐
frame building. The system boundary was defined to encompass the processes and
activities outlined in Table 1. The emission in the operation phase was not included
in the analysis because this is expected not to differ significantly between the
buildings (Adalberth, 2000). In comparative life cycle studies activities that are
equivalent may be omitted if it is sufficiently apparent that the activities do not
Production / Retrofitting phases
- Extraction, processing and transport of materials
- Energy recovery from biomass residues
- On-site construction work
Operation phase
- Space heating
- Electricity for ventilation
- Tap water heating
- Electricity for household and facility management
End-of-life phase
- Demolition
- Energy recovery from wood, and recycling of concrete and steel to replace virgin raw material
Energy supply system
- Resistance heating, or heat pump, or district heating
- District heating produced with a biomass-fired CHP plant
- Electricity produced with a biomass-fired condensing plant
- Full energy chain accounting, including conversion / fuel cycle losses
Energy supply system
- Coal-based electricity for material production
- Bioenergy replace coal
- Full energy chain accounting, including conversion / fuel cycle losses
Energy supply system
- Bioenergy replace coal
- Full energy chain accounting, including conversion / fuel cycle losses
21
influence the results of the comparison (Kotaji et al., 2003). Nevertheless, the results
of including emission in the operation phase of the buildings are addressed in
Chapter 6. The energy use for operating conventional buildings clearly dominates
over the energy used for the production of building materials, so lowering the
operating energy is important for reducing life cycle carbon emission.
Table 1. Processes and activities included in the analysis of the life cycle carbon balance.
Description Process considered Carbon implication analyzed
Building construction (Production phase)
Material extraction, processing and transportation;
Building construction;
Forest harvesting.
Fossil fuel use for material production;
Calcination of limestone;
Wood residue replaces fossil fuel;
Carbon stock changes in building and forest.
Service-life (Operation phase)
Reaction of atmospheric CO2 with cement products in building frame;
Forest re-growth.
Carbonation of concrete and cement mortar;
Carbon uptake in re-growing forest.
End-of-life Demolition of building;
Recovery and crushing of concrete;
Recycling of steel;
Energy recovery of wood material;
Reaction of atmospheric CO2 with demolished concrete and cement mortar.
Fossil fuel for end-of-life activities - material demolishing, transportation, recovery;
Benefit from recycling of steel
Wood residue replaces fossil fuel;
Carbonation of demolished and crushed concrete
2.5.1 Studied building systems
The case‐study building analyzed is the Wälludden building constructed in
Växjö, Sweden. This building is a 4‐story residential wood‐frame building with 16
apartments and a total heated floor area of 1190 m2. In Papers II and VI, the wood‐
frame building is compared with a functionally equivalent and identical building
with a concrete frame. Detailed information, including drawings and thermal
properties of the versions of the building with a concrete frame and a wood frame
was reported by Persson (1998). A summary of the construction characteristics of the
22
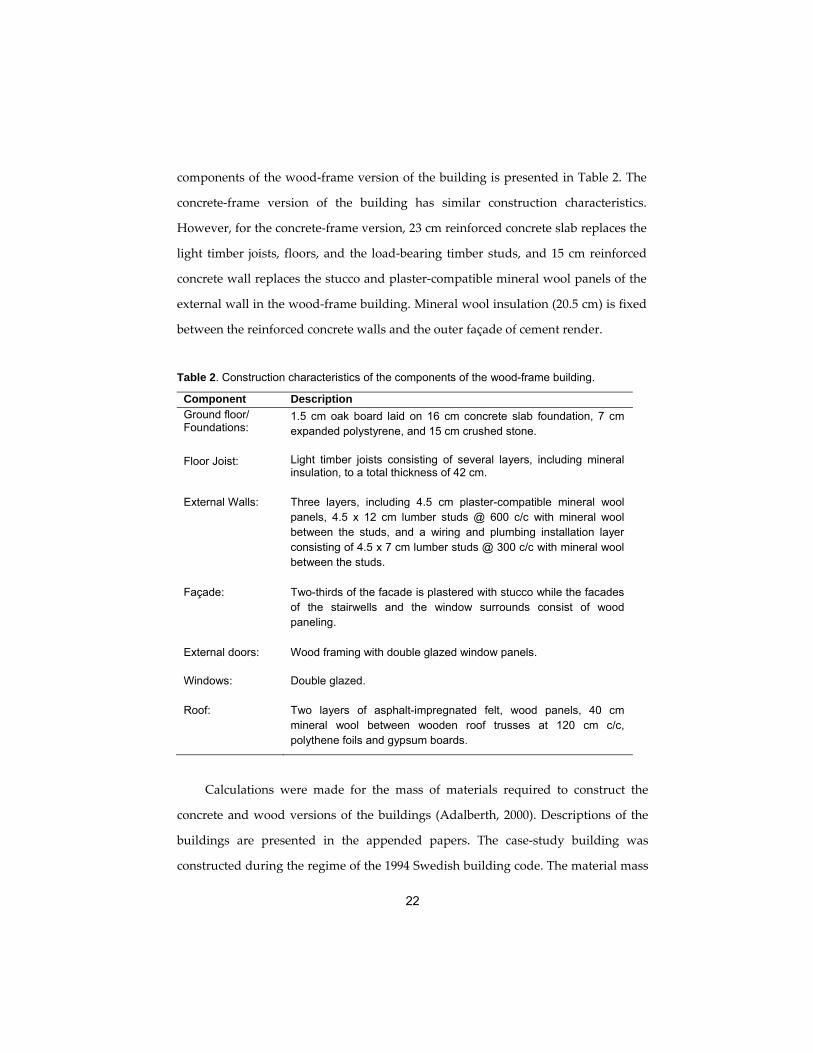
components of the wood‐frame version of the building is presented in Table 2. The
concrete‐frame version of the building has similar construction characteristics.
However, for the concrete‐frame version, 23 cm reinforced concrete slab replaces the
light timber joists, floors, and the load‐bearing timber studs, and 15 cm reinforced
concrete wall replaces the stucco and plaster‐compatible mineral wool panels of the
external wall in the wood‐frame building. Mineral wool insulation (20.5 cm) is fixed
between the reinforced concrete walls and the outer façade of cement render.
Table 2. Construction characteristics of the components of the wood-frame building.
Calculations were made for the mass of materials required to construct the
concrete and wood versions of the buildings (Adalberth, 2000). Descriptions of the
buildings are presented in the appended papers. The case‐study building was
constructed during the regime of the 1994 Swedish building code. The material mass
Component DescriptionGround floor/ Foundations:
1.5 cm oak board laid on 16 cm concrete slab foundation, 7 cm expanded polystyrene, and 15 cm crushed stone.
Floor Joist: Light timber joists consisting of several layers, including mineral insulation, to a total thickness of 42 cm.
External Walls: Three layers, including 4.5 cm plaster-compatible mineral wool panels, 4.5 x 12 cm lumber studs @ 600 c/c with mineral wool between the studs, and a wiring and plumbing installation layer consisting of 4.5 x 7 cm lumber studs @ 300 c/c with mineral wool between the studs.
Façade: Two-thirds of the facade is plastered with stucco while the facades of the stairwells and the window surrounds consist of wood paneling.
External doors:
Windows:
Wood framing with double glazed window panels.
Double glazed.
Roof: Two layers of asphalt-impregnated felt, wood panels, 40 cm mineral wool between wooden roof trusses at 120 cm c/c, polythene foils and gypsum boards.
23
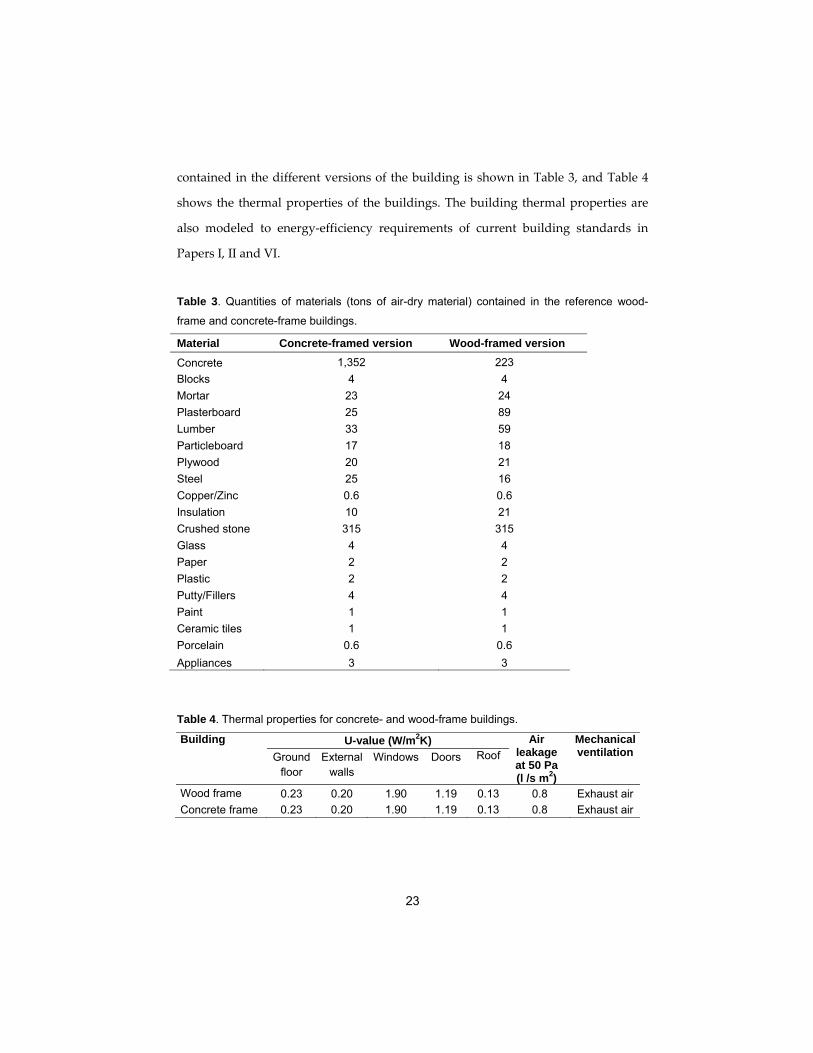
contained in the different versions of the building is shown in Table 3, and Table 4
shows the thermal properties of the buildings. The building thermal properties are
also modeled to energy‐efficiency requirements of current building standards in
Papers I, II and VI.
Table 3. Quantities of materials (tons of air-dry material) contained in the reference wood-
frame and concrete-frame buildings.
Material Concrete-framed version Wood-framed version
Concrete 1,352 223
Blocks 4 4
Mortar 23 24
Plasterboard 25 89
Lumber 33 59
Particleboard 17 18
Plywood 20 21
Steel 25 16
Copper/Zinc 0.6 0.6
Insulation 10 21
Crushed stone 315 315
Glass 4 4
Paper 2 2
Plastic 2 2
Putty/Fillers 4 4
Paint 1 1
Ceramic tiles 1 1
Porcelain 0.6 0.6
Appliances 3 3
Table 4. Thermal properties for concrete- and wood-frame buildings.
Building U-value (W/m2K) Air leakage at 50 Pa (l /s m2)
Mechanical ventilation Ground
floor External
walls Windows Doors Roof
Wood frame 0.23 0.20 1.90 1.19 0.13 0.8 Exhaust air
Concrete frame 0.23 0.20 1.90 1.19 0.13 0.8 Exhaust air
24
2.6 Primary energy calculations
2.6.1 Production/ retrofitting phase
The production/retrofitting phase primary energy balance is calculated as the
primary energy expended for material production and on‐site construction minus
the net energy of by‐products that can be recovered and made available for external
use during the material life cycle (Gustavsson et al., 2006).
Material production primary energy
The material production primary energy balance includes the primary energy
expended to extract, process and transport the materials; this quantity is calculated
as follows:
i k
ii
kkiproduction BL
FE
1,
where Eproduction = total primary energy use for material production (kWh);
i = individual types of materials in the building;
F = end‐use fossil fuel energy used to extract, process and transport the materials
(kWh);
k = fossil fuels: coal, oil, and natural gas;
α = fuel cycle energy requirement of the fossil fuel;
L = end‐use electricity to extract, process, and transport the materials (kWhe);
η = conversion efficiency for electricity production;
B = heat content (lower heating value) of the biofuels used in material processing
(kWh).
The end‐use fossil fuel and electricity used to extract, process and transport the
materials, as well as the heat content of the biofuels used in material processing, was
calculated for each material using data primarily from a Swedish study by Björklund
and Tillman (1997). These data are supplemented by data from closely related
25
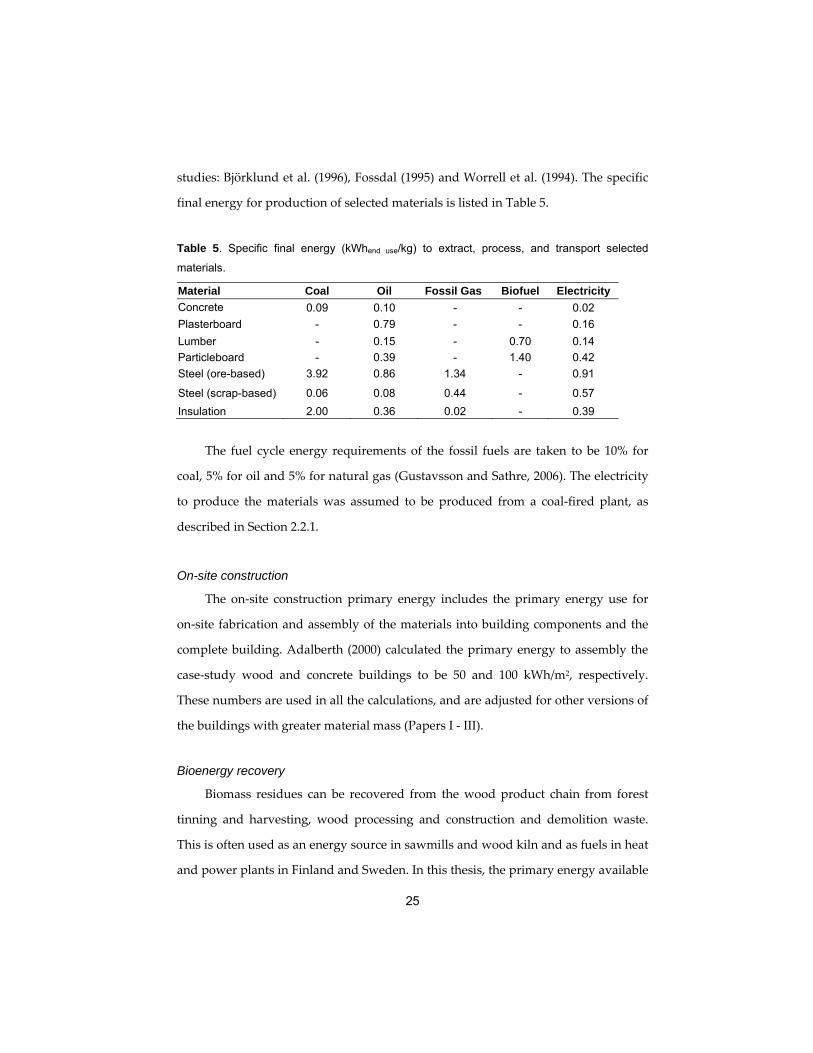
studies: Björklund et al. (1996), Fossdal (1995) and Worrell et al. (1994). The specific
final energy for production of selected materials is listed in Table 5.
Table 5. Specific final energy (kWhend use/kg) to extract, process, and transport selected
materials.
The fuel cycle energy requirements of the fossil fuels are taken to be 10% for
coal, 5% for oil and 5% for natural gas (Gustavsson and Sathre, 2006). The electricity
to produce the materials was assumed to be produced from a coal‐fired plant, as
described in Section 2.2.1.
On-site construction
The on‐site construction primary energy includes the primary energy use for
on‐site fabrication and assembly of the materials into building components and the
complete building. Adalberth (2000) calculated the primary energy to assembly the
case‐study wood and concrete buildings to be 50 and 100 kWh/m2, respectively.
These numbers are used in all the calculations, and are adjusted for other versions of
the buildings with greater material mass (Papers I ‐ III).
Bioenergy recovery
Biomass residues can be recovered from the wood product chain from forest
tinning and harvesting, wood processing and construction and demolition waste.
This is often used as an energy source in sawmills and wood kiln and as fuels in heat
and power plants in Finland and Sweden. In this thesis, the primary energy available
Material Coal Oil Fossil Gas Biofuel Electricity
Concrete 0.09 0.10 - - 0.02
Plasterboard - 0.79 - - 0.16
Lumber - 0.15 - 0.70 0.14
Particleboard - 0.39 - 1.40 0.42
Steel (ore-based) 3.92 0.86 1.34 - 0.91
Steel (scrap-based) 0.06 0.08 0.44 - 0.57
Insulation 2.00 0.36 0.02 - 0.39
26
from recovered biomass residues from forest harvesting, wood processing and
construction activities is calculated as follows:
j
dieseljjjbyproducts HME 11
where E byproducts = net energy from recovered biomass residues (kWh);
j = different types of residues: forest, processing and construction;
M = mass of the recovered residue (oven dry tons);
H = lower heating value of the biomass residue (kWh /oven dry ton);
β = diesel fuel energy required to recover and transport the residue, expressed as a
proportion of the heat energy contained in the residue;
α = fuel cycle energy requirement of the diesel fuel.
The mass of the residue available from the wood product chain was calculated
using biomass expansion factors from Lehtonen et al. (2004). Recovery of 75% of
available forest residues and 100% of processing and construction residues was
assumed (Gustavsson and Sathre, 2006). The lower heating value for the residues
and the diesel fuel used to recover the forest biomass residues are calculated using
data from Gustavsson and Sathre (2006).
2.6.2 Operation phase
The operation phase activities analyzed in this thesis (Papers I‐V) are space
heating, tap water heating, electricity for ventilation fans and pump, and electricity
for household and facility management. The energy simulation software ENORM
(EQUA Simulation AB, 2004) was used to calculate the space heating and ventilation
final energy use in Papers I, III and V. The software calculates the energy and power
demand for a 12‐month period, on a 24‐hour basis. ENORM was also used to
calculate the final energy for tap water heating and electricity for household and
facility management in Paper V. In Papers I and II, the final energy for these
27
activities was calculated with the following standard equations from the Swedish
National Board of Housing, Building and Planning (Boverket, 2003):
Ewater heating = 1800 x number of apartments + 18 x heated area [m2]
Ehousehold electricity = 2200 x number of apartments + 22 x heated area [m2]
where Ewater heating = final heat energy use for domestic hot water (kWh), and
Ehousehold electricity = final electricity for household lighting and appliances (kWh).
The final energy for all the operation activities in Papers II and IV was
calculated with VIP+ software (Strusoft, 2010). The VIP+ is a dynamic energy balance
program that models hourly final energy. The software considers the hourly
variation of heat flux and heat storage capacity of buildings, allowing for analysis of
thermal mass in reducing energy use. The ENSYST program (Karlsson 2003) was
used to calculate the primary energy needed to provide the final energy for space
heating, tap water heating, electricity for ventilation fans and pumps, and electricity
for household and facility management. The program calculates primary energy use
considering the system‐wide energy chain, from natural resources extracted,
transported and refined to produce the delivered energy.
The space heating demand is modeled for different locations in Sweden: Växjö
(Papers I, II, III and V), Östersund (Papers II and IV) and Kiruna (Paper II). Table 6
shows the climate data for the different locations.
Table 6. Climate locations for analysis of the buildings space heating demand.
Location Relative location
Latitude Longitude Annual outdoor temperature ( oC)
Maximum Minimum Average
Växjö South 56 o9 ' N 14 o5' E 28.0 -18.0 6.5
Östersund Middle 63 o2' N 14 o 4' E 24.0 -28.0 2.5
Kiruna North 67 o8' N 20 o 0' E 24.0 -33.0 -1.2
28
An indoor temperature of 22° C was assumed for all the base calculations in the
thesis. In Paper I, the effect of varying the indoor temperature to 20 or 24° C was
explored in a sensitivity analysis. The operation primary energy use was calculated
for a 50‐year building lifespan in the base calculations and also for a 100‐year service
life in the sensitivity analyses in Papers I and II. In Paper III, analyses are made for
operation primary energy use before and after building retrofitting at 15 and 50
years, respectively. In Papers IV and V, calculations are made for building operation
primary energy use for a year.
2.6.3 End-of-life phase
Post‐use concrete, steel and wood materials have high recovery and recycling
rates in many European countries (European Commission, 2001). The analysis
considers the energy use to demolish the buildings and recover and recycle 90% of
the demolished concrete, steel and wood materials. The demolished wood is
assumed to be used for energy (Krook et al., 2008). The demolished concrete is
assumed to be recycled into crushed concrete aggregate, replacing crushed stone for
below‐ground filling applications (Engelsen et al., 2005). The primary energy
implication if the recycled concrete were to replace natural aggregate is discussed in
Paper I. The recovered steel is assumed to be used in place of 100% ore‐based steel
(International Iron and Steel Institute, 2008). Scenarios where the recycled steel
substitutes 50% ore‐based and 50% scrap‐based steel are analyzed in a sensitivity
analysis in Papers I and II.
The primary energy benefit of end‐of‐life concrete or steel is calculated as the
primary energy use avoided due to the recovered concrete or steel minus the
primary energy used to recover the concrete or steel. The primary energy benefit
from end‐of‐life wood is calculated as the bioenergy available for recovery minus the
fossil energy used to recover and transport the wood. The primary energy to
demolish the case‐study wood and concrete buildings was assumed to be 5 and 10
29
kWh/m2, respectively (Adalberth, 2000). These numbers are used as the basis of the
calculations in this thesis. Further details about the assumptions for the end‐of‐life
phase calculations are provided in Papers I‐III.
2.7 Carbon balance calculations
The life cycle carbon balance is calculated as the resultant of material production
carbon emission, the carbon emission avoided by substituting biomass residues in
place of fossil fuels, the net carbon emission from cement reactions, and changes in
carbon stock due to the use of wood building materials.
2.7.1 Material production carbon emission
The material production carbon balance is the emission due to fossil fuel used to
extract, process and transport the material comprising the buildings and is calculated
as:
C production k
Lkk
LCFC
where C production = total CO2 emissions from material production (kg C);
k = the fossil fuels: coal, oil, and fossil gas;
C = the fuel‐cycle carbon intensity of the fossil fuel (kg C/kWh end‐use fuel);
F = the end‐use fossil fuel energy used to extract, process, and transport the
materials (kWh);
CL, = the fuel‐cycle carbon intensity of the reference fossil fuel to produce electricity
(kg C/ kWh fuel);
L = the end‐use electricity to extract, process, and transport the materials (kWh e);
η = the conversion efficiency for electricity production.
The fuel‐cycle carbon intensity of the fossil fuels is assumed to be 0.11, 0.08 and
0.06 kg C/kWh end‐use fuel for coal, oil, and fossil gas, respectively (Gustavsson and
30
Sathre, 2006). Further details about data used to calculate the parameters are
appended in Paper VI.
2.7.2 Substitution of fossil fuel by recovered biofuel
The carbon emission avoided due to replacing fossil fuel with recovered biomass
residues is calculated with the equation:
Cavoided residuesdieselj
ffjj DCCHM
where Cavoided = net CO2 emissions avoided due to replacing fossil fuel with recovered
biomass residues (kg C);
j = the different types of recovered biomass residues
M = the mass of the recovered biomass residues (oven dry tons)
H = lower heating value of the biomass residues (kWh /oven dry ton)
Cf = the fuel‐cycle carbon intensity of the reference fossil fuel replaced by the
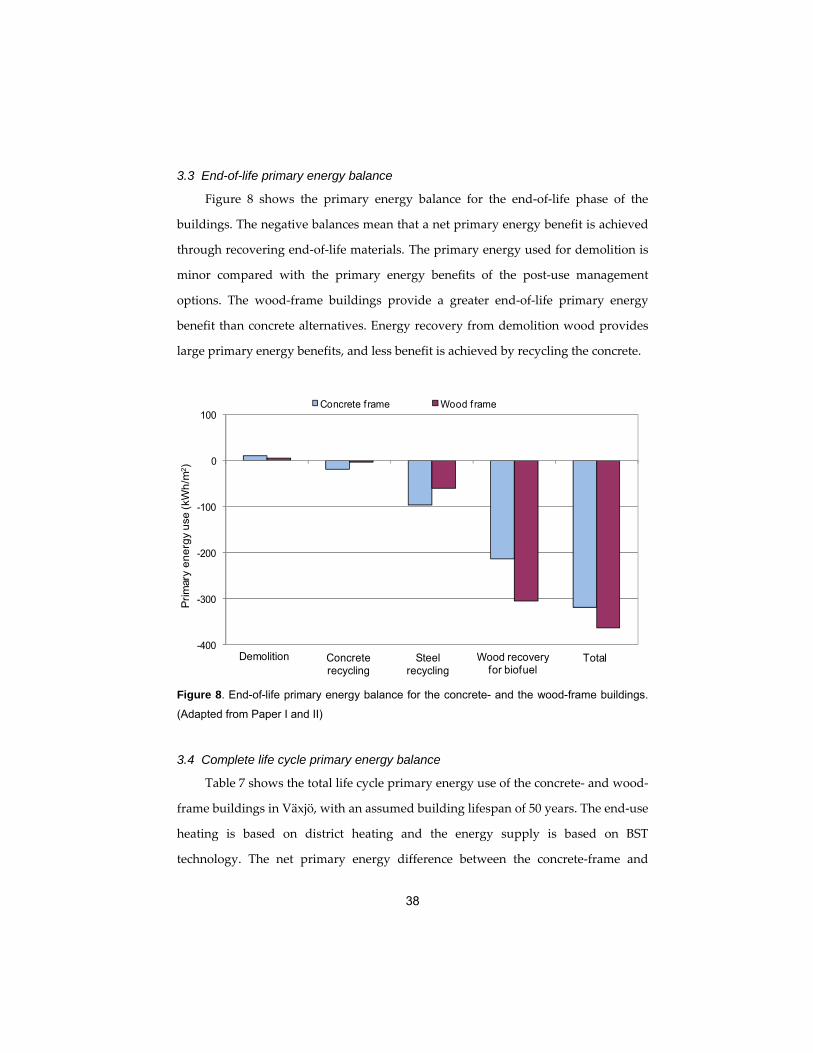
Figure 18 shows the carbon flows from the cement calcination reaction and the
carbonation uptake for the concrete‐ and wood‐frame buildings. The magnitude of
the carbon flows from calcination and carbonation reactions in the concrete‐frame
and wood‐frame buildings reflect the quantities of cement used in each building. At
the end of the service life (after year 100), carbon uptake of the concrete‐frame
building is 23% of the calcination emission. The corresponding figure for the wood‐
frame building is 14%, which is lower than that for the concrete building because the
concrete used in the foundation in the wood building has lower exposure to the air.
The carbon uptake in the buildings increases substantially after crushing of the
demolished concrete (year 100). This result is due to the increase in the exposed
surface area of the concrete. The proportion of total calcination emission absorbed is
43 and 36% for the concrete‐ and wood‐frame buildings, respectively, after the
crushed concrete is exposed for 4 months.
Figure 18. Carbon flows through cement calcination (left) and carbonation of concrete and
cement mortar during the service life and after demolition (right) for the concrete- and wood-
frame buildings, when using CEM II cement. (Paper VI)
0
5
10
15
20
25
0 10 20 30 40 50 60 70 80 90 100 110 120 130 140
Em
issi
on u
pta
ke d
ue t
o c
arb
onatio
n (
tC)
Year
Concrete-frame
Wood-frame
0
5
10
15
20
25
Concrete frame Wood frame
Em
issio
n d
ue t
o c
alc
ination (
tC)
Year of construction (Year 0)
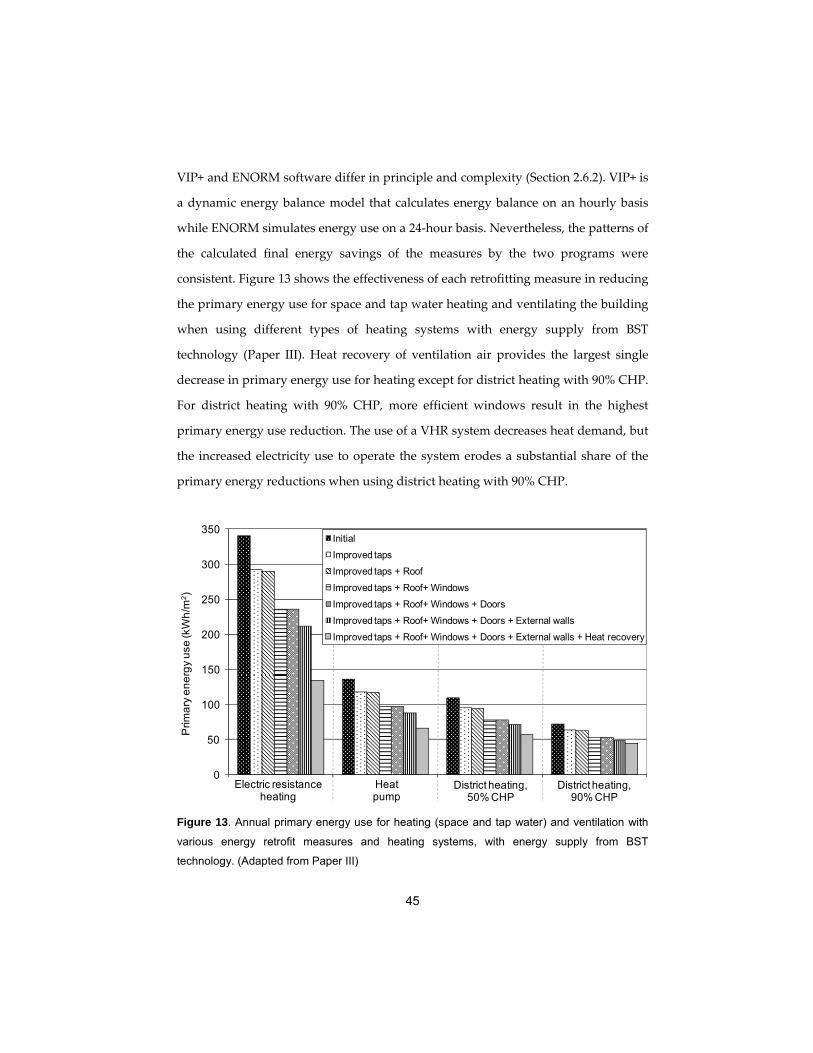
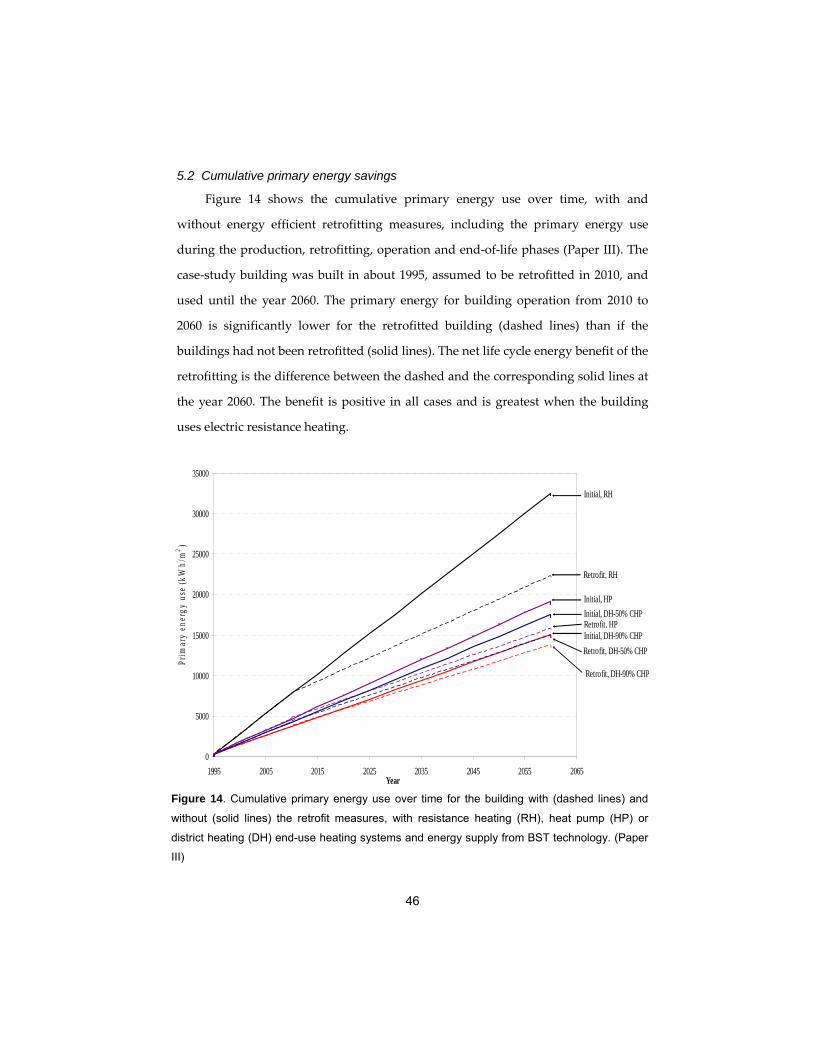
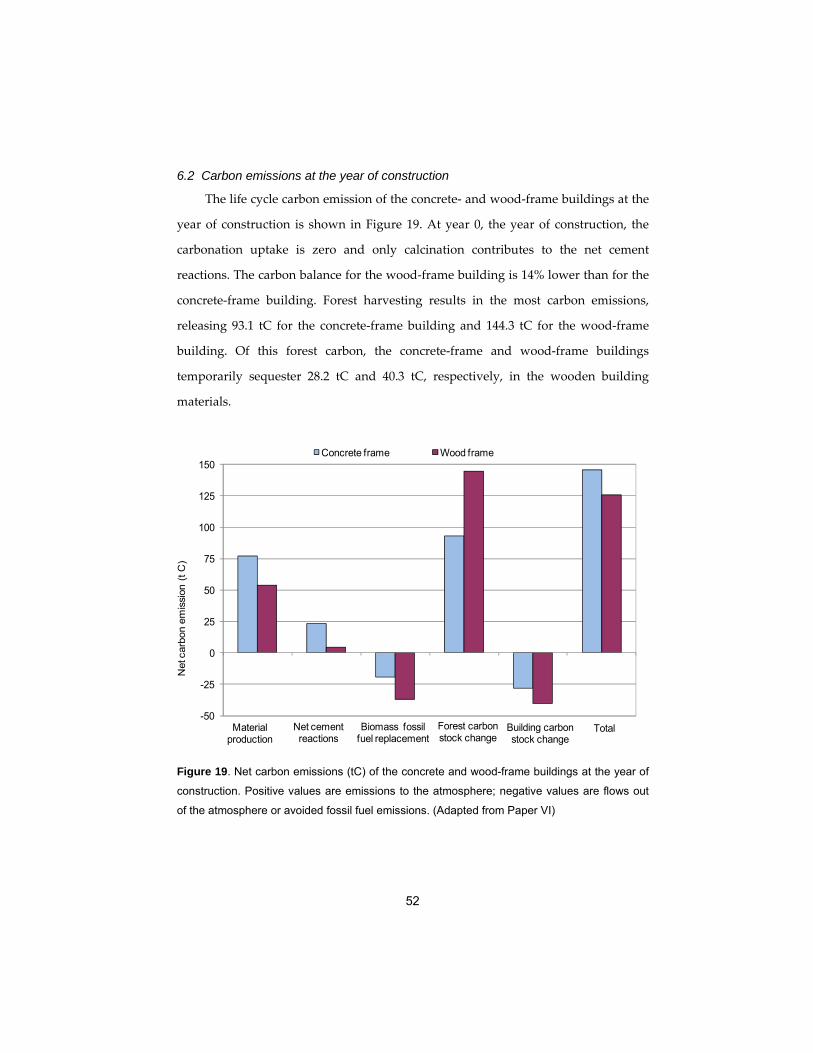
52
6.2 Carbon emissions at the year of construction
The life cycle carbon emission of the concrete‐ and wood‐frame buildings at the
year of construction is shown in Figure 19. At year 0, the year of construction, the
carbonation uptake is zero and only calcination contributes to the net cement
reactions. The carbon balance for the wood‐frame building is 14% lower than for the
concrete‐frame building. Forest harvesting results in the most carbon emissions,
releasing 93.1 tC for the concrete‐frame building and 144.3 tC for the wood‐frame
building. Of this forest carbon, the concrete‐frame and wood‐frame buildings
temporarily sequester 28.2 tC and 40.3 tC, respectively, in the wooden building
materials.
Figure 19. Net carbon emissions (tC) of the concrete and wood-frame buildings at the year of
construction. Positive values are emissions to the atmosphere; negative values are flows out
of the atmosphere or avoided fossil fuel emissions. (Adapted from Paper VI)
-50
-25
0
25
50
75
100
125
150Concrete frame Wood frame
Net
car
bon
emis
sion
(t C
)
Material production
Net cement reactions
Biomass fossil fuel replacement
TotalForest carbon stock change
Building carbonstock change
53
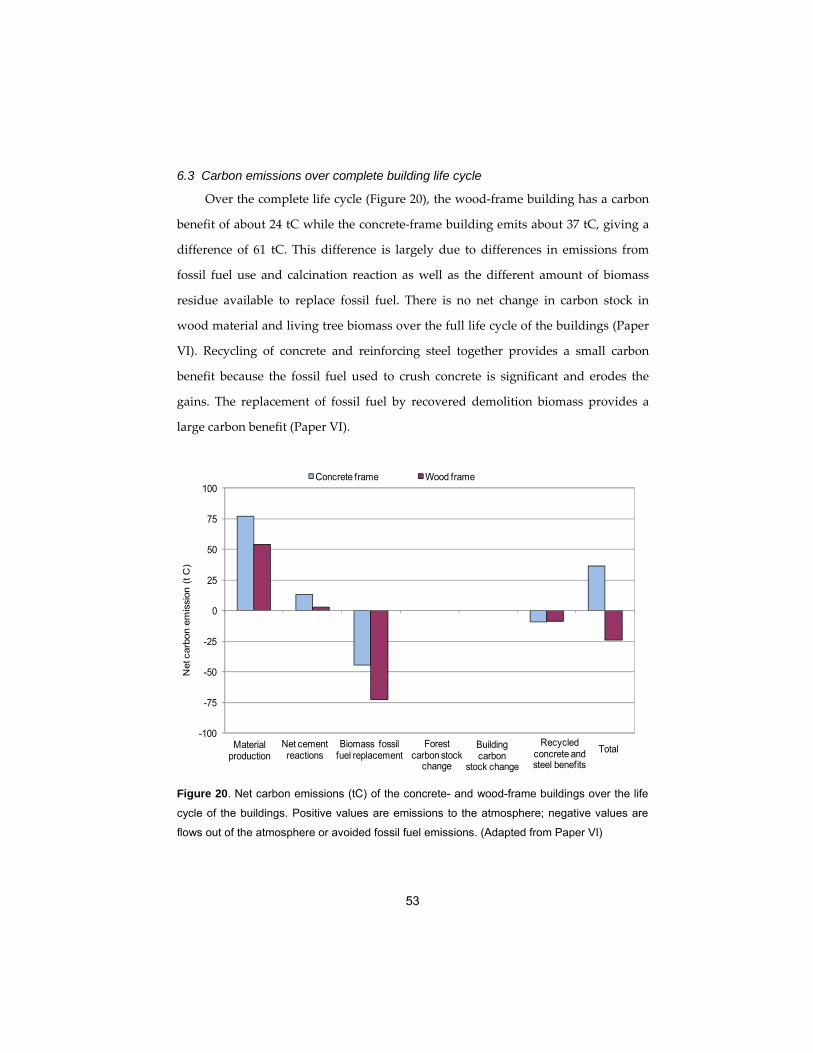
6.3 Carbon emissions over complete building life cycle
Over the complete life cycle (Figure 20), the wood‐frame building has a carbon
benefit of about 24 tC while the concrete‐frame building emits about 37 tC, giving a
difference of 61 tC. This difference is largely due to differences in emissions from
fossil fuel use and calcination reaction as well as the different amount of biomass
residue available to replace fossil fuel. There is no net change in carbon stock in
wood material and living tree biomass over the full life cycle of the buildings (Paper
VI). Recycling of concrete and reinforcing steel together provides a small carbon
benefit because the fossil fuel used to crush concrete is significant and erodes the
gains. The replacement of fossil fuel by recovered demolition biomass provides a
large carbon benefit (Paper VI).
Figure 20. Net carbon emissions (tC) of the concrete- and wood-frame buildings over the life
cycle of the buildings. Positive values are emissions to the atmosphere; negative values are
flows out of the atmosphere or avoided fossil fuel emissions. (Adapted from Paper VI)
-100
-75
-50
-25
0
25
50
75
100Concrete frame Wood frame
Net c
arb
on e
mis
sion (
t C
)
Material production
Net cement reactions
Biomass fossil fuel replacement
TotalForest carbon stock
change
Building carbon
stock change
Recycled concrete and steel benefits
54
The carbon emission from the operation phase of the building is not included in
the analysis in Paper VI (see Section 2.5). The carbon emissions from building
operations largely depend on the primary fuels used in the supply systems (Joelsson,
2008). The calculations in Table 7 show that the difference in building operation
primary energy between the concrete‐ and wood‐frame buildings is 0.4% if a
building lifespan of 100 years and energy supply based on district heating with BST
technology are assumed. According to the analysis in Table 7 and assuming a 100‐
year building lifespan, the total operation carbon emissions (including space heating
with thermal mass benefit, tap water heating, electricity for ventilation and for
household purpose) are 135.6 and 135.8 tC for the concrete‐ and wood‐frame
buildings, respectively. Thus, the total carbon balance of the concrete‐frame
buildings would be about 172.6 tC while that of the wood‐frame would be 111.8 tC,
giving a difference of 60.8 tC. The net life cycle carbon balance of the wood‐frame
building is thus 35% lower than for the concrete‐frame building.
6.4 Impact of parameter variations
Table 10 shows the effect on the carbon balance of the buildings of the following
variations: the duration of exposure of crushed concrete, from the base case of 4
months to 1 or 30 years; the cement type, from the base case of CEM II to CEM I; the
end‐of‐life option for concrete, from the base case of crushing and reuse as aggregate
to landfilling; the allocation of the emissions from concrete crushing, from the
original building to the subsequent use; the production of original steel, from the
base case of ore‐based steel to scrap‐based steel; the substitution of recovered steel,
from the base case of ore‐based steel to scrap‐based steel; the fossil fuel displaced by
the recovered biofuel, from coal to fossil gas; the fuel displaced by the demolition
biomass, from coal to a non‐carbon emitting energy system; the forest land‐use for
concrete construction, from traditional forest management to intensified forest
management where surplus forestland is used for bioenergy or left standing. Most of
55
the parameter variations reduce the emission difference between the wood and
concrete buildings, as most of the values of the parameters have been chosen to
maximize the carbon benefits for concrete. Nevertheless, in all cases, the wood‐frame
building has significantly lower carbon emission than the concrete‐frame building.
The emission difference between the buildings decreases by 50% if the surplus
forestland in the concrete case is used for bioenergy. However, this is very unlikely
to occur due to the low economic added value (Paper VI).
Table 10. Differences in life cycle carbon emission (tC) between the concrete- and wood-
frame buildings in different cases due to variation of parameters. (Adapted from Paper VI) Parameters evaluated Base value Variation Net difference (tC)
(Concrete - Wood)
Base case - - 60.7
Concrete-related
Crushed concrete exposure 4 months 1 year 59.3
Crushed concrete exposure 4 months 30 years 56.1
Allocation of concrete crushing emission
Original building
Next use 58.5
Cement type CEM II CEM I 62.2
Concrete end-of-life option Crush into aggregate
Landfilling 68.1
Best case concrete building
CEM II, 30 years exposure of crushed concrete, crush emission to next use
- - 53.9
Worst case concrete building
CEM I, landfilling of concrete - - 70.0
Steel-related
Original steel production Ore-based Scrap-based 54.3
Recovered steel substitution Replaces iron-ore
Replaces scrap steel
66.6
Fossil fuel-related
Fuel displaced by recovered biofuel Coal Natural gas 50.0
Fuel displaced by demolition biomass Coal Carbon neutral fuel
49.8
Land use-related
Forest management: concrete building
Traditional forest management
Intensive forest management and surplus land used for bioenergy
30.2
56
7 Conclusions
7.1 Life cycle primary energy use and thermal mass effect
In these analyses, a concrete‐frame building has slightly lower space heating
demand than a wood‐frame alternative, because of the benefit of thermal mass in the
concrete‐based system. The energy savings benefit due to thermal mass generally
varies with the climatic location and energy efficiency levels of the buildings.
Overall, the final energy savings benefit due to thermal mass is small, both in
absolute terms and in relation to the final space heating demand. The absolute
primary energy benefit of thermal mass is higher when using less energy efficient
heating systems, but such systems considerably increase the space heating primary
energy use. The life cycle primary energy balance of the studied wood‐frame
building was lower than that of the concrete‐frame alternative, primarily because of
the lower production primary energy use and greater bioenergy recovery when
using wood framing material. These advantages more than outweigh the energy
saving benefits of thermal mass. The production phase primary energy balance
approximately doubles when the buildings are constructed with concrete frames
rather than wood. The recovery of biomass residues during the production and end‐
of‐life phases completely offsets the primary energy used for production of the
buildings. Significant quantities of biomass residues are produced, because of the
use of wood framing material. The operation phase dominates the life cycle primary
energy use, but to a lesser extent when buildings and supply systems are energy‐
efficient; such efficiency increases the relative importance of the other life cycle
phases and the choice of framing material.
7.2 Building energy-efficiency standards
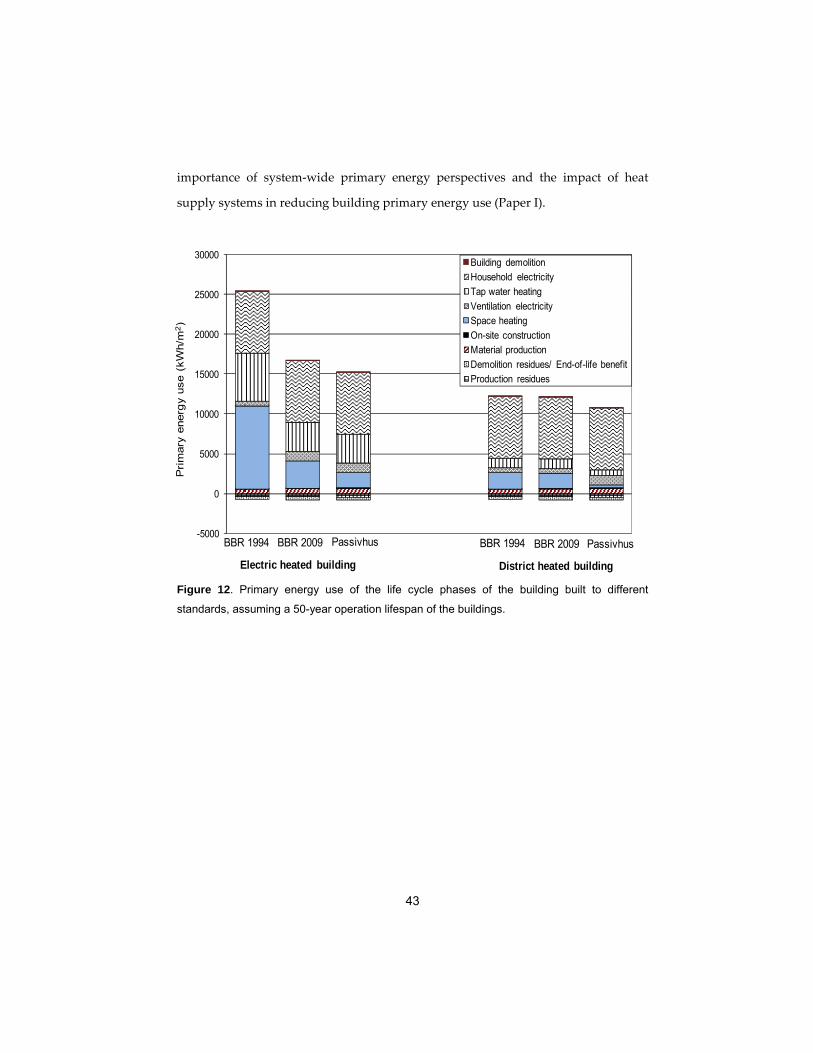
The building energy‐efficiency standards analysis shows the importance of a
life cycle primary energy perspective and the choice of heating system in reducing
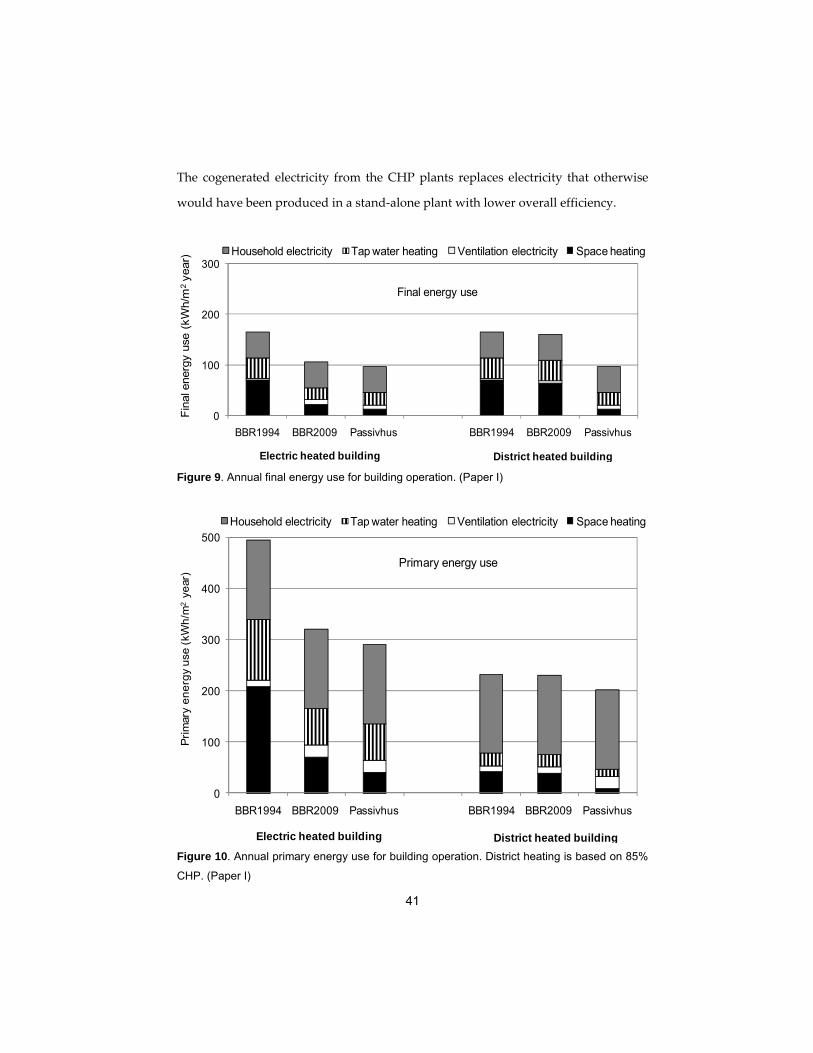
primary energy use in the built environment. The specific final energy use for a
district heated building built during the regime of the BBR 1994 is at least twice as
57
high as that permitted for a new electric heated building built to the BBR 2009 or the
Passivhus. The Passivhus building with district heating achieves 30% lower life cycle
primary energy use than one with electric heating, emphasizing the importance of
heat supply system. The primary energy use of buildings is significantly lower if the
energy supply is based on BIGCC rather than BST technology. This result suggests
that efficient energy supply systems are of great importance for a low energy
building and should be an integral part of the effort to create a low energy built
environment. As building energy‐efficiency standards continue to improve,
strategies to reduce the production primary energy use will become more important.
The primary energy use related to household electricity dominates the operation
primary energy use for the buildings, but the BBR 2009 and Passivhus currently do
not consider household electricity use. In the district heated buildings about two‐
thirds of the primary energy use for operation is due to household electricity.
Incorporation of a household electricity standard in future building energy‐efficiency
standards would further reduce overall primary energy use in the built environment.
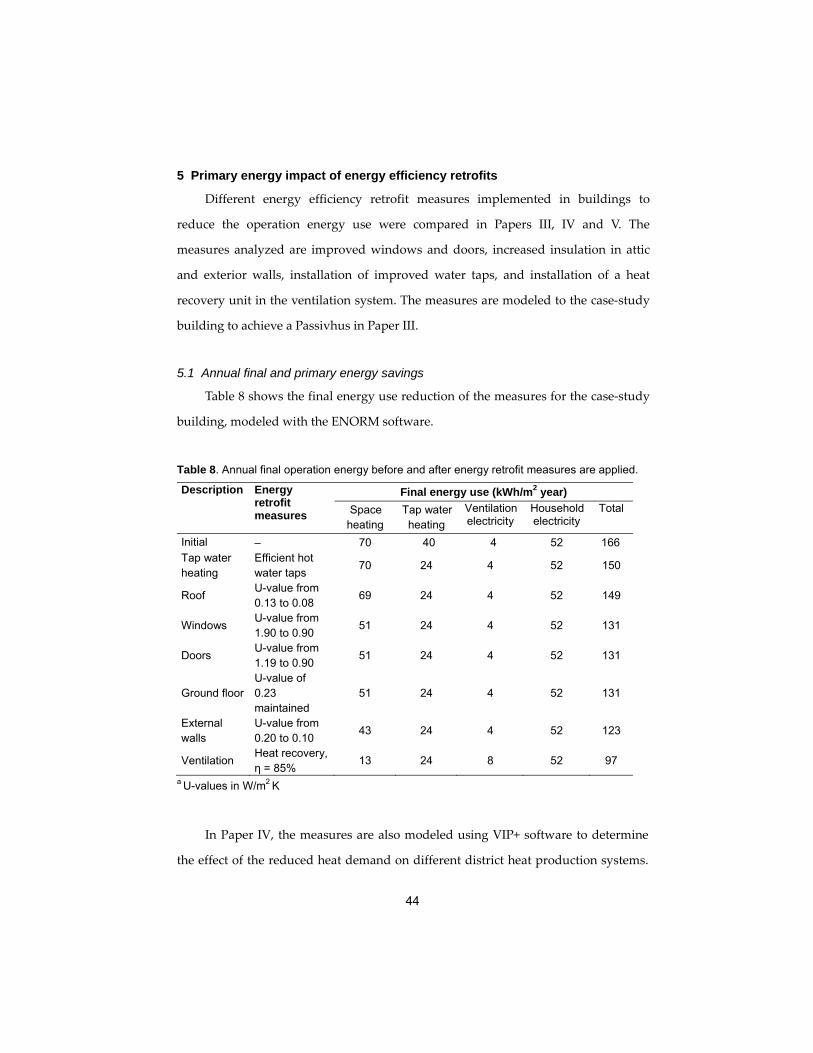
7.3 Energy efficiency retrofit measures
Retrofitting a building to passive house standards reduces final energy use, but
the primary energy significance of this change largely depends on the type of energy
supply system. A significant reduction in life cycle primary energy use is achieved
when an electric resistance heated house is retrofitted to the passive house standard
while retrofitting a district heated house achieves a much lower reduction because of
the high energy efficiency of the district heating supply.
Retrofitting the initial building to passive house standards increases primary
energy use for building production, but the operation primary energy savings have
an energy pay‐back period of less than 4 years. The primary energy used for
building production is largely offset by the recovery of biomass residues during the
production phase and the end‐of‐life recovery of demolition wood and steel.
58
The primary energy savings for the different energy efficiency measures
depend on the energy supply system. Therefore, the interaction between individual
measures and the energy supply system needs to be considered—in particular, the
electricity use for ventilation heat recovery together with district heating with a large
share of CHP production. Both demand and supply sides, as well as their interaction,
need to be analyzed in order to minimize the primary energy use of district heated
buildings.
The primary energy savings of VHR can be very significant, depending on the
type of heat supply system, the airtightness of buildings, and the increased use of
electricity to operate the VHR system. The greatest savings are achieved when VHR
is installed in a resistance heated building. However, less primary energy savings are
achieved when the VHR is installed in CHP‐based district heated buildings. VHR
provides much less primary energy savings for district heated building with large
share of CHP. For district heating systems mainly based on CHP, the reduced heat
demand reduces the potential to cogenerate electricity and is more significant for
efficient energy supply technology.
7.4 Life cycle carbon balance and carbonation
Carbonation uptake during the service life and post‐use phase is less than that
of other carbon flows such as fossil fuel emission from material production and the
replacement of fossil fuel by biomass residues. The carbonation of concrete is
underestimated if the post‐use phase of concrete is not considered. However, carbon
emission from fossil fuels used to recover the post‐use concrete is higher than the
uptake from carbonation during the four months’ exposure of the crushed concrete
to air. The carbon emission during construction is much higher for the concrete‐
frame building than for the wood‐frame building. The post‐use phase of the
buildings gives a carbon benefit, mainly because of replacement of fossil fuel by
recovered demolition wood while the concrete carbonation benefit during the service
59
life is small. In the post‐use phase the wood‐frame building has a slightly higher
carbon benefit compared with the concrete‐frame building.
The carbon benefit in the post‐use phase is substantially greater than the carbon
emissions in the construction stage for the wood‐frame building, giving a life cycle
net carbon benefit to the wood‐frame building, but not the concrete‐frame building.
This is mainly because the wood‐frame building has lower emissions from fossil fuel
and cement calcination and because it provides a greater amount of biofuel to
replace fossil fuel.
The emission difference between the wood and concrete buildings is sensitive
to how forest land‐use is considered in the analysis. The results of this study show
that a wood‐framed building has substantially lower life cycle carbon emissions than
a concrete‐framed building, even if the carbon benefit of end‐of‐life concrete
management is included.
7.5 Uncertainties
Uncertainties in parameters inherent in different life cycle activities may affect
the primary energy and carbon balances of a building. These uncertainties may be
due to lack of precise knowledge about parameter values or to choices at the
methodological, technological or geographical level. For example, the specific
primary energy use for building material production may vary, as different
geographical regions and plant may use different production technologies and
primary fuels. Steel building materials may also be produced from ore or scrap iron,
and recovered steel material may substitute ore or scrap iron. Sensitivity analyses
were performed in Papers I, II, IV and VI to determine the effects of uncertainty and
variability on the results. The parameters explored relate to production of steel,
recycled steel substitution, building life span, indoor air temperature, choice of
energy supply systems, type of fossil fuel to be substituted by recovered biofuel,
land‐use modeling approach, handling options for end‐of‐life materials, exposure
60
conditions of crushed concrete and their influence on carbonation, and potential
truncation errors resulting from a bottom‐up modeling approach. Assumptions
relating to energy supply systems were also varied in Papers III and V to show the
usefulness of the findings. The uncertainty analyses show that the conclusions of the
studies are robust.
61
8. Future works
Increasingly, measures to reduce building envelope heat losses are being
implemented and buildings are becoming more airtight. These measures may be
associated with a potential risk of overheating and increased cooling demand,
particularly in summer periods. Studies using hour‐by‐hour dynamic modeling may
be useful to investigate the implications of this change on operation energy use and
the life cycle environmental impacts of buildings. Emphasis may be placed on the
role of thermal mass in overheating and cooling load reductions. The analysis on the
effect of thermal mass in Paper II could be further expanded to explore how the heat
storage capacity of building systems interacts with heating systems and how quickly
a heating system can respond to temperature variation. More studies could be
conducted to increase understanding of how climate change may affect life cycle
primary energy and environmental performance of buildings.
District heating and cogeneration systems have been recognized as important
parts of an overall strategy to reduce the environmental impact of buildings in
Europe. The economic viability of these systems often depends on heat density, and
therefore, reduced final heat demand in buildings may be a concern for such systems
if there are no capacity constraints. Increasingly, policies are being implemented to
drive buildings with lowest possible energy use and at the same time encourage
increased use of district heating and cogeneration systems. The recast EU Directive
on Energy Performance of Buildings requires all new buildings to be nearly zero‐
energy from 2020 and suggests that the feasibility of alternative energy‐efficient
supply systems including district heating should be considered for buildings. The
EU directive on promotion of cogeneration based on a useful heat demand in the
internal energy market is expected to promote cogeneration systems and may have
significant impacts on the expansion of district heating systems. The results of Paper
IV show that it is important to design district heat and cogeneration production
systems based on long‐term heat demands, in order to avoid unnecessarily high
62
costs and primary energy use. Extensive studies are necessary to explore how district
heat and cogeneration systems may be optimized and made economically
competitive for buildings in the near future. The implementation of energy efficiency
measures in a significant share of the district heated building stock may affect the
heat density and the profile of the heat load duration curve. The methodological
approach used in Paper IV could be further developed to investigate the implications
of this issue.
Research efforts and policy instruments to reduce environmental impact of
buildings have largely focused on final heat reduction measures, and have
encouraged buildings with low space heating energy. Electricity for household
management is becoming increasingly important, and strategies to reduce this may
be a focus of future studies.
The energy used for moisture drying of concrete elements and the resulting CO2
emissions were not analyzed in the comparative analysis of the concrete‐ and the
wood‐frame buildings. This may have resulted in underestimation of the primary
energy use and carbon emission of the concrete building. Nevertheless, the wood
building has lower primary energy use and carbon emissions than the concrete
building. The energy for moisture removal from concrete elements is increasingly
understood to be significant and should be considered in future studies.
Modern wood construction techniques have been developed to design and
construct more energy efficient multi‐story wood‐frame buildings with improved
fire, hygrothermal and structural performances. Recent experience also shows that
wood multi‐story buildings can be economically competitive with alternative
building systems. There are different wood construction systems and it may be of
further interest to explore how these systems may be optimized from life cycle
primary energy, carbon emission and cost perspectives at the same time.
There is a need to update and improve the data on specific energy use for
building material production in Europe. Most comprehensive data on specific energy
63
use for building material production were compiled in the mid‐ and late 1990s. Some
recent data have been reported from individual industrial sectors, but
comprehensive data covering the entire building material industry have not been
reported.
64
References
Adalberth, K. 2000. Energy Use and Environmental Impact of New Residential Buildings. Ph.D. Dissertation, Department of Building Physics, Lund University, Sweden.
Asdrubali, F., Bonaut, M., Battisti, M. and Venegas, M. 2008. Comparative study of energy regulations for buildings in Italy and Spain. Energy and Buildings, 40(10): 1805‐1815.
Balaras, C. A., Droutsa, K., Argiriou, A. A. and Asimakopoulos, D. N. 2000. Potential for energy conservation in apartment buildings. Energy and Buildings, 31(2): 143‐154.
Balaras, C., Droutsa, K., Dascalaki, E. and Kontoyiannidis, S. 2005. Heating energy consumption and resulting environmental impact of environmental of European apartment buildings. Energy and Buildings, 37(5): 429‐442.
BBR (Boverkets Byggregler). 1994. Boverkets Författningssamling (Building and Planning Regulations). The National Board of Housing, Building and planning, Karlskrona, Sweden. (In Swedish)
BBR (Boverkets Byggregler). 2009. Boverkets Författningssamling (Building and Planning Regulations). The National Board of Housing, Building and planning, Karlskrona, Sweden. (In Swedish)
Beerepoot, M. and Beerepoot, N. 2007. Government regulation as an impetus for innovation: Evidence from energy performance regulation in the Dutch residential building sector. Energy Policy, 35(10): 4812‐4825.
Bell, M. 2004. Energy efficiency in existing buildings: the role of building regulations. In COBRA Proc. of the RICS Foundation Construction and Building Research Conference, September 7‐8, Leeds, UK.
Bell, M. and Lowe, R.J. 2000. Building regulation and sustainable housing Part 1: a critique of Part L of the Building Regulations 1995 for England and Wales. Structural Survey, 18 (1): 28‐37.
Björklund, T. and Tillman, A‐M. 1997. LCA of Building Frame Structures: Environmental Impact over the Life Cycle of Wooden and Concrete Frames. Technical Environmental Planning Report 2, Chalmers University of Technology, Gothenburg, Sweden.
Björklund, T., Jönsson, Å. and Tillman, A‐M. 1996. LCA of Building Frame Structures: Environmental Impact of the Life Cycle of Concrete and Steel Frames. Technical Environmental Planning Report 8, Chalmers University of Technology, Gothenburg, Sweden.
Boverket. 2003. Termiska beräkningar (Thermal Calculations). The National Board of Housing, Building and planning, Karlskrona, Sweden. (In Swedish)
Casals, X.G. 2008. Analysis of building energy regulation and certification in Europe: Their role, limitations and differences. Energy and Buildings, 38(5): 381‐392.
Checkland, P. 1999. Systems Thinking, Systems Practice. John Wiley and Sons Limited, Chichester, UK.
65
Cole, R.J. 1999. Energy and greenhouse gas emissions associated with the construction of alternative structural systems. Building and Environment, 34(3): 335‐348.
Cole, R.J. and Kernan, P.C. 1996. Life‐cycle energy use in office buildings. Building and Environment, 31(4): 307‐317.
Dascalaki, E. and Santamouris, M. 2002. On the potential of retrofitting scenarios for offices. Building and Environment, 37(6): 557‐567.
Directive 2002/91/EC. The Energy Performance of Buildings. Official Journal L 001, 04/01/2003 P. 0065 – 0071. European Parliament and of the Council of 16 December 2002. Accessed at eur‐lex.europa.eu on June 15, 2009.
Ekvall, T. and Finnveden, G. 2001. Allocation in ISO 14041‐ A critical review. Journal
of Cleaner Production, 9 (3): 197‐208. Ekvall, T., and Weidema, B. P. 2004. Systems boundaries and input data in
consequential life cycle inventory analysis. Life Cycle Assessment, 9 (3):161 – 171. Engelsen, C.J., Mehus, J., Pade, C. and Sæther, D.H. 2005. CO2 Uptake in Demolished
and Crushed Concrete. Norwegian Building Research Institute. Accessed at www.byggforsk.no on January 28, 2008.
EQUA Simulation AB. 2004. ENORM Version 1000. Stockholm, Sweden. EU Climate Change Expert Group. 2008. Background on Impacts, Emission Pathways,
Mitigation Options and Costs. Accessed at www.ec.europa.eu on July 20, 2011. European Commission. 2001. Task Group 3: Construction and Demolition Waste. Final
report of the construction and demolition waste working group, Brussels. Accessed at ec.europa.eu on March 28, 2008.
European Commission. 2005. Green Paper on Energy Efficiency: Doing More with Less. Accessed at ec.europa.eu on October 16, 2009.
European Commission. 2007. Limiting Global Climate Change to 2 Degrees Celsius: The way ahead for 2020 and beyond. Communication from the Commission to the Council, the European Parliament, the European Economic and Social Committee and the Committee of the Regions. Accessed at www.eur‐lex.europa.eu on July 30, 2011.
European Commission. 2010. The EU Climate and Energy Package. Accessed at www.ec.europa.eu on July 30, 2011.
European Environment Agency. 2008. Climate Change Targets: 350 ppm and the EU Two‐Degree Target. Accessed at www.eea.europa.eu on September 20, 2011.
Fay, R., Treloar, G. and Iyer‐Raniga, U. 2000. Life‐cycle energy analysis of buildings: a case study. Building Research and Information, 28(1): 31–41.
Fossdal, S. 1995. Energi‐ og Miljøregnskap for bygg (Energy and environmental accounts of building construction). Report 173, The Norwegian Institute of Building Research, Oslo. (In Norwegian)
Gajda, J. and Miller, F.M. 2000. Concrete as a Sink for Atmospheric CO2: A Literature Review and Estimation of CO2 Absorption by Portland Cement Concrete. R&D Serial no. 2255, Portland Cement Association, Skokie IL, USA.
66
Gustavsson, L. 1994a. District heating system and energy conservation – Part I. Energy, 9(1): 81‐91.
Gustavsson, L. 1994b. District heating system and energy conservation – Part II. Energy, 9(1): 93‐103.
Gustavsson, L. and Karlsson, Å. 2006. CO2 mitigation: on methods and parameters for comparison of fossil‐fuel and biofuel systems. Mitigation and Adaptation Strategies for Global Change, 11(5‐6): 935‐959.
Gustavsson, L., Pingoud, K. and Sathre, R. 2006. CO2 balance of wood substitution: comparing concrete and wood framed buildings. Mitigation and Adaptation Strategies for Global Change, 11(3): 667‐691.
Gustavsson, L. and Sathre, R. 2006. Variability in energy and CO2 balances of wood and concrete building materials. Building and Environment, 41(7): 940‐951.
Gustavsson, L. and Joelsson, A. 2010. Life cycle primary energy analysis of residential buildings. Energy and Buildings, 42 (2): 210‐220.
Gustavsson, L., Joelsson, A. and Sathre, R. 2010. Life cycle primary energy use and carbon emission of an eight‐storey wood‐framed apartment building. Energy and Buildings, 42(2): 230‐242.
Gustavsson, L. and Sathre R. 2011. Energy and CO2 analysis of wood substitution in construction. Climatic Change, 105(1‐2): 129‐153.
Hamza, N. and Greenwood, D. 2009. Energy conservation regulations: Impacts on design and procurement of low energy buildings. Building and Environment, 44(5): 929‐936.
Harvey, L.D.D. 2009. Reducing energy use in the buildings sector: measures, costs, and examples. Energy Efficiency, 2 (2): 139‐163.
Hawkes, A.D. 2010. Estimating marginal CO2 emissions rates for national electricity systems. Energy Policy, 38(10): 5977‐5987.
Hestnes, A.G. and Kofoed, N.U. 2002. Effective retrofitting scenarios for energy efficiency and comfort: results of the design and evaluation activities within the OFFICE project. Building and Environment, 37(6): 569‐574.
Huijbregts, M.A.J., Hellweg, S., Frischknecht, R., Hendriks H.W.M, Hungerbhler, K. and Hendriks, A. J. 2010. Environmental Science and Technology, 44 (6): 2189–2196.
IEA (International Energy Agency). 2001. LCA Methods for Buildings. IEA Annex 31 Energy‐Related Environmental Impact of Buildings. Accessed at www.ecbcs.org on August 6, 2011.
IEA (International Energy Agency). 2006. High‐Rise Refurbishment: The Energy‐Efficient Upgrade of Multi‐Story Residences in the European Union. IEA information Paper. Accessed at www.iea.org on November 26, 2008.
IEA (International Energy Agency). 2008. Towards a Sustainable Energy Future. IEA Programme of Work on Climate Change, Clean Energy and Sustainable Development. Accessed at www.iea.org on July 30, 2011.
67
IEA (International Energy Agency). 2010a. World Energy Outlook 2010 Factsheet. What Does The Global Energy Outlook To 2035 Look Like? Accessed at www.iea.org on July 30, 2011.
IEA (International Energy Agency). 2010b. Key World Energy Statistics. Accessed at www.iea.org on July 30, 2011.
IEA (International Energy Agency). 2010c. Energy Technology Perspectives: Scenarios and Strategies to 2050. Accessed at www.iea.org on August 30, 2011.
IEA (International Energy Agency). 2010d. CO2 Emissions from Fuel Combustion: Highlights. Accessed at www.iea.org on August 30, 2011.
IEA (International Energy Agency). 2011a. Technology Roadmaps ‐ Energy‐Efficient Buildings: Heating and Cooling Equipment. Accessed at www.iea.org on July 30, 2011.
IEA (International Energy Agency). 2011b. Prospect of Limiting the Global Increase in Temperature to 2° C is Getting Bleaker. Accessed at www.iea.org on August 18, 2011.
International Iron and Steel Institute. 2008. Steel and You: The Life of Steel. Accessed at www.worldsteel.org on November 17, 2009.
IPCC (Intergovernmental Panel on Climate Change). 1996. Climate Change 1995 — Impacts, Adaptations and Mitigation of Climate Change: Scientific‐Technical
Analyses. Cambridge University Press, Cambridge, UK. IPCC (Intergovernmental Panel on Climate Change). 2000. Special Report on Emissions
Scenarios. Cambridge University Press: Cambridge, UK. IPCC (Intergovernmental Panel on Climate Change). 2001. Climate Change 2001: The
Scientific Basis. Contribution of Working Group I to the Third Assessment Report. Cambridge University Press, Cambridge, UK.
IPCC (Intergovernmental Panel on Climate Change). 2007a. Climate Change 2007: The Physical Science Basis. Contribution of Working Group I to the Fourth Assessment Report. Accessed at www.ipcc.ch on July 17, 2011.
IPCC (Intergovernmental Panel on Climate Change). 2007b. Climate Change 2007: Impacts, Adaptation and Vulnerability. Contribution of Working Group II to the Fourth Assessment Report. Accessed at www.ipcc.ch/ on September 20, 2011.
IPCC (Intergovernmental Panel on Climate Change). 2007c. Climate Change 2007: Mitigation of Climate Change. Contribution of Working Group III to the Fourth Assessment Report. Accessed at www.ipcc.ch on July 17, 2011.
ISO (International Organization for Standardization). 1997. ISO 14040:1997 Environmental Management – Life Cycle Assessment – Principles and Framework. ISO, Geneva, Switzerland.
ISO (International Organization for Standardization). 1998. ISO 14041:1998 Environmental Management – Life Cycle Assessment – Goal and Scope Definition
and Inventory Analysis. ISO, Geneva, Switzerland.
68
ISO (International Organization for Standardization). 2000a. ISO 14042:2000 Environmental Management – Life Cycle Assessment – Life Cycle Impact Assessment. ISO, Geneva, Switzerland.
ISO (International Organization for Standardization). 2000b. ISO 14043:2000 Environmental Management – Life Cycle Assessment – Life Cycle Interpretation. ISO, Geneva, Switzerland.
Itard, L., Meijer, F., Vrins, E. and Hoiting, H. 2008. Building Renovation and Modernisation in Europe: State of the Art Review. OTB Research Institute for Housing, Urban and Mobility Studies, Delft University of Technology, Netherlands. Accessed at www.formas.se on May 29, 2009.
Janson, U. 2008. Passive Houses in Sweden‐ Experiences from Design and Construction Phase. Report EBD‐T‐08/9, Department of Architecture and Built Environment, Lund University, Lund, Sweden.
Joelsson, A. 2008. Primary Energy Efficiency and CO2 Mitigation in Swedish Residential Buildings. PhD Dissertation, Department of Engineering and Sustainable Development, Mid Sweden University, Östersund, Sweden.
Jokisalo, J. and Kurnitski, J. 2005. Effect of the Thermal Inertia and Other Building and HVAC Factors on Energy Performance and Thermal Comfort in Finnish Apartment
Buildings. Report B79, Laboratory of Heating, Ventilating and Air‐Conditioning, Helsinki University of Technology, Helsinki, Finland.
Jokisolao, J., Kurnitska, J., Vuolle, M. and Torkki, A. 2003. Performance of balanced ventilation with heat recovery in residential buildings in a cold climate. International Journal of Ventilation, 2 (3): 223‐235.
Jönsson, Å., Björklund, T. and Tillman A‐M. 1998. LCA of concrete and steel building frames ‐ a case study. International Journal of Life Cycle Assessment, 3 (4): 216‐224.
Junnila, S., Horvath, A. and Guggemos, A. 2006. Life‐cycle assessment of office buildings in Europe and the U.S. Journal of Infrastructure systems, 12(1): 10‐17.
Kalema, T. Jóhannesson, G., Pylsy P. and Hagengran, P. 2008. Accuracy of energy enalysis of buildings: A comparison of a monthly energy balance method and simulation methods in calculating the energy consumption and the effect of thermal mass. Journal of Building Physics, 32: 101–130.
Karlsson, Å. 2003. ENSYST Version 1.2. Lund University, Lund, Sweden. Karlsson, J.F. and Moshfegh, B. 2007. A comprehensive investigation of a low‐
energy building in Sweden. Renewable Energy, 32 (11): 1830–1841. Keoleian, G.A., Blanchard, S. and Reppe, P. 2001. Life‐cycle energy, cost and
strategies for improving a single‐family house. Journal of Industrial Ecology, 4(2): 135‐156.
Kotaji, S., Schuurmans A. and Edwards, S. 2003. Life‐Cycle Assessment in Building and Construction: A State‐of‐the‐Art Report. SETAC, Pensacola FL, USA.
Krook, J., Mårtensson, A., Eklund, M. and Libiseller, C. 2008. Swedish recovered wood waste: Linking regulation and contamination. Waste Management, 28(3):638‐648.
69
Lave, L.B., Cobas‐Flores, E., Hendrickson, C.T. and McMichael, F.C. 1995. Using input output analysis to estimate economy‐wide discharges. Environmental Science and Technology, 29: 420‐426.
Lehtonen, A., Mäkipää, R., Heikkinen, J., Sievänen, R. and Liski, J. 2004. Biomass expansion factors (BEFs) for Scots pine, Norway spruce and birch according to stand age for boreal forests. Forest Ecology and Management, 188(1‐3): 211‐224.
Lenzen, M. and Treloar, G. 2002. Embodied energy in buildings: wood versus concrete—reply to Börjesson and Gustavsson. Energy Policy, 30 (3): 249‐255
Mendelsohn, R. O. 2006. A critique of the Stern report. Regulation, 29(4): 42‐46. Nässén, J., Holmberg, J., Wadeskog, A. and Nyman, M. 2007. Direct and indirect
energy use and carbon emissions in the production phase of buildings: An input‐output analysis. Energy, 32 (9): 1593‐1602.
Nordhaus, W.D. 2007. A review of the Stern review on the economics of climate
change. Journal of Economic Literature, 45(3): 686–702. Norén, A., Akander, J., Isfält, E. and Söderström, O. 1999. The effect of thermal
inertia on energy requirement in a Swedish building ‐ results obtained with three calculation models. International Journal of Low Energy and Sustainable Buildings 1: 1‐16.
O’Neill, B.C. and Oppenheimer, M. 2002. Dangerous climate impacts and the Kyoto Protocol. Science, 296(5575): 1971‐1972.
Ochoa, L., Hendrickson, C. and Matthews, H.S. 2002. Economic input and output life‐cycle assessment of U.S. residential buildings. Journal of Infrastructure Systems, 8(4): 132‐138.
Pade, C. and Guimaraes, M. 2007. The CO2 uptake of concrete in a 100 year perspective. Cement and Concrete Research, 37(9): 1348‐1356.
Passive House Institute. 2007. Information on passive houses. Accessed at www.passivhaustagung.de on November 29, 2009.
Persson, S. 1998. Wälludden trähus i fem våningar: Erfarenheter och lärdomar (Wälludden wooden building with five stories: Experiences and knowledge acquired). Report TVBK‐3032, Department of Structural Engineering, Lund Institute of Technology, Sweden. (In Swedish)
Pommer, K. and Pade, C. 2005. Guidelines ‐ Uptake of Carbon Dioxide in the Life Cycle Inventory of Concrete. Danish Technological Institute. Accessed at www.dti.dk on April 16, 2008.
Price, L., De la Rue du Can, S., Sinton, J. and Worrell, E. 2006. Sectoral Trends in Global Energy Use and GHG Emissions. Lawrence Berkeley National Laboratory, California, USA.
Sartori, I. and Hestnes, A.G. 2007. Energy use in the life cycle of conventional and low‐energy buildings: A review article. Energy and Buildings, Volume 39 (3): 249‐257.
70
Sathre, R. 2007. Life‐Cycle Energy and Carbon Implications of Wood‐Based Products and Construction. PhD Dissertation, Department of Engineering, Physics and Mathematics, Mid Sweden University, Östersund, Sweden.
Scheuer, C., Keoleian, G.A. and Reppe, P. 2003. Life cycle energy and environmental performance of a new university building: modeling challenges and design implications. Energy and Buildings, 35(10): 1049‐1064.
Sherman, M. H. and Walker, I. S. 2007. Energy Impact of Residential Ventilation Norms in the United States. Paper LBNL‐62341, Lawrence Berkeley National Laboratory, California, USA.
Sjödin, J. and Grönkvist, S. 2004. Emissions accounting for use and supply of electricity in the Nordic market. Energy Policy, 32(13): 1555‐1564.
Stern, N. 2006. Stern Review on the Economics of Climate Change. Accessed at www.hm‐treasury.gov.uk on February 5, 2010.
Strusoft. 2010. Overview of VIP‐Energy. Accessed at www.strusoft.com on June 13, 2011.
Swedish Energy Agency. 2002. Marginal elproduktion och CO2utsläpp (Marginal electricity production and CO2 emission in Sweden). Report ER14:2002, Eskilstuna, Sweden. (In Swedish)
Swedish Energy Agency. 2009. Swedish Energy Research 2009. Eskilstuna, Sweden. Swedish Energy Agency. 2010. Energy in Sweden 2010. Eskilstuna, Sweden. Swedish Government Bill 2005/06:145. A National Programme for Energy Efficiency and
Energy‐Smart Construction. Accessed at www.regeringen.se on April 20, 2009. Swedish Government. 2003. An Ecoefficient Society: Non‐Toxic, Resource‐Saving
Environmental Life Cycles. Summary of Government Bill2002/03:117. Accessed at www.sweden.gov.se on March 28, 2008.
Swedish Government. 2006. Climate Policy. Government offices of Sweden. Accessed at www.regeringen.se on July 26, 2011.
Thormark, C. 2002. A low energy building in a life cycle‐ its embodied energy, energy need for operation and recycling potential. Building and Environment, 37 (4): 429‐435.
Tol, R. S. J. and Yohe, G. W. 2006. A review of the Stern Review. World Economics, 7 (4): 233–250.
Tommerup H. and Svendsen, S. 2006. Energy savings in Danish residential building stock. Energy and Buildings, 38 (6): 618‐626.
Tommerup, H., Rose, J. and Svendsen, S. 2007. Energy‐efficient houses built according to the energy performance requirements introduced in Denmark in 2006. Energy and Buildings, 39(10): 1123‐1130.
UNEP (United Nations Environment Programme). 2007. Buildings and Climate Change Status, Challenges and Opportunities. Accessed at www.unep.org on September 20, 2011.
71
UNFCCC (United Nations Framework Convention on Climate Change). 1998. Kyoto Protocol to the United Nations Framework Convention on Climate Change.
Accessed at www.unfccc.int on July 29, 2011. United Nations. 1992. United Nations Framework Convention on Climate Change.
Accessed at www.unfccc.int on July 29, 2011. Verbeeck, G. and Hens, H. 2007. Life cycle optimization of extremely low energy
dwellings. Journal of Building Physics, 31(2): 143‐177. WCED (World Commission on Environment and Development). 1987. Our Common
Future. Oxford University Press, Oxford, UK. Worrell, E., van Heijningen, R.J.J., de Castro, J.F.M., Hazewinkel, J.H.O., de Beer, J.G.,
Faaij, A.P.C. and Vringer, K. 1994. New gross energy requirement figures for material production. Energy, 19(6): 627‐640.
Zhu, L., Hurt, R., Correia, D. and Boehm, R. 2009. Detailed energy saving performance analyses on thermal mass walls demonstrated in a zero energy house. Energy and Buildings, 41 (3): 303‐310.