Sot. Sci. Med. Vol. 34, No. 7, pp. 763-768, 1992 Printed in Great Britain. All rights reserved 0277.9536/92 $5.00 + 0.00 Copyright 0 199.2 Pergamon Press plc LIFE EVENTS AND DAILY HASSLES AND UPLIFTS AS PREDICTORS OF HOSPITALIZATION AND OUTPATIENT VISITATION ROBERT WILLIAMS,’ STEPHEN J. ZYZANSKI’ and ANNE L. WRIGH? ‘Department of Family Medicine, Case Western Reserve University, 11001 Cedar Road, Cleveland, OH 44106, U.S.A. *Department of Pediatrics, Arizona Health Sciences Center, Tucson, AZ, U.S.A. Abstract-Increased occurrence of major life events and daily “hassles” and “uplifts” have been shown to be associated with several measures of health status and health care utilization. In order to test for such an association with hospital admission, a prospective study was designed. Navajo Indians presenting for either inpatient or outpatient health care at a U.S. Indian Health Service facility were questioned regarding the occurrence of major life events in the preceding six months and of hassles and uplifts in the preceding week. Two years later the subsequent numbers of outpatient visits and of hospital admissions were determined for each subject. An increased number of either major life events (relative risk 1.66) or daily hassles and uplifts (relative risk 1.87) was found to be associated with an increased risk of hospital admission. The effects of major and daily life events were additive on the risk of admission. In addition, hassles were predictive of subsequent outpatient utilization. While further demonstrating the influence of major and daily life occurrences on health care utilization, this study also shows their importance in an additional cultural setting. Key words-life change events, North American Indians, length of stay, psychological stress INTRODUCITON Over the last twenty years there has been increasing interest in the role of stressful life events in the health and illness relationship. Beginning with the work of Holmes and Rahe [l], life events have been examined as precipitants, as mediators and as expressors of ill health. In the last decade, there has also been recog- nition of the importance of daily irritants (“hassles”) and pleasant experiences (“uplifts”) in explaining some of the variability of expression of disease [2]. These hassles and uplifts have even been shown to have greater predictive value than major life events [2]. Most studies linking life events or hassles and uplifts with health outcomes have looked at outcome measures in one of several categories: mental health [35], self-reported health status [6-121 and outpatient health services utilization [l3-181. Objective physical health measures, while not as commonly reported, have also been shown to be associated to these life stresses [19-221. The current study was designed to test for associations between life events, hassles and uplifts and subsequent hospital admission. At the same time, a prospective examination was made for evidence of an association between these stress measures and outpatient utilization in a cultural setting different from those previously examined. Specifically, four hypotheses were formulated and tested. The first was that increased numbers of life events and daily experiences would be associated with subsequent hospital admission. The second hypothesis was that increased life events and daily experiences would be related to subsequent outpatient utilization in the cultural group examined (i.e. the Navajo) the same as they have been in other groups. Third, it was hypothesized that the association of these stressors and outpatient utilization would persist over time and not be limited to the time immediately following the assessment of the stressful events. Finally, while both categories of experiences (major life events and daily events) were seen as important, it was hypothesized that daily events would be more strongly associated with the outcomes under study. METHODS The study was conducted at the U.S. Public Health Service Indian Health Service Hospital in Crownpoint, New Mexico, a 37 bed community hospital with general medical, pediatric and low risk obstetric services. The hospital and associated clinic serve approximately 14,000 Navajo Indians under economic and geographic circumstances whereby most of the area residents’ health care is at the facility. Subjects for this study were selected from inpatients and outpatients utilizing the facility. All inpatients between the ages of 20 and 59 admitted from 1l/9/84 to 9/30/85 were eligible for inclusion in the study, with the exception of those whose mental status precluded an interview, those admitted for labor or diagnosis of labor, and those transferred from another facility. A patient discharged but readmitted during the study period was eligible for reenrollment. 763
Transcript
Sot. Sci. Med. Vol. 34, No. 7, pp. 763-768, 1992 Printed in Great Britain. All rights reserved
LIFE EVENTS AND DAILY HASSLES AND UPLIFTS AS PREDICTORS OF HOSPITALIZATION AND
OUTPATIENT VISITATION
ROBERT WILLIAMS,’ STEPHEN J. ZYZANSKI’ and ANNE L. WRIGH? ‘Department of Family Medicine, Case Western Reserve University, 11001 Cedar Road, Cleveland,
OH 44106, U.S.A. *Department of Pediatrics, Arizona Health Sciences Center, Tucson, AZ, U.S.A.
Abstract-Increased occurrence of major life events and daily “hassles” and “uplifts” have been shown to be associated with several measures of health status and health care utilization. In order to test for such an association with hospital admission, a prospective study was designed. Navajo Indians presenting for either inpatient or outpatient health care at a U.S. Indian Health Service facility were questioned regarding the occurrence of major life events in the preceding six months and of hassles and uplifts in the preceding week. Two years later the subsequent numbers of outpatient visits and of hospital admissions were determined for each subject. An increased number of either major life events (relative risk 1.66) or daily hassles and uplifts (relative risk 1.87) was found to be associated with an increased risk of hospital admission. The effects of major and daily life events were additive on the risk of admission. In addition, hassles were predictive of subsequent outpatient utilization. While further demonstrating the influence of major and daily life occurrences on health care utilization, this study also shows their importance in an additional cultural setting.
Key words-life change events, North American Indians, length of stay, psychological stress
INTRODUCITON
Over the last twenty years there has been increasing interest in the role of stressful life events in the health and illness relationship. Beginning with the work of Holmes and Rahe [l], life events have been examined as precipitants, as mediators and as expressors of ill health. In the last decade, there has also been recog- nition of the importance of daily irritants (“hassles”) and pleasant experiences (“uplifts”) in explaining some of the variability of expression of disease [2]. These hassles and uplifts have even been shown to have greater predictive value than major life events [2].
Most studies linking life events or hassles and uplifts with health outcomes have looked at outcome measures in one of several categories: mental health [35], self-reported health status [6-121 and outpatient health services utilization [l3-181. Objective physical health measures, while not as commonly reported, have also been shown to be associated to these life stresses [19-221. The current study was designed to test for associations between life events, hassles and uplifts and subsequent hospital admission. At the same time, a prospective examination was made for evidence of an association between these stress measures and outpatient utilization in a cultural setting different from those previously examined.
Specifically, four hypotheses were formulated and tested. The first was that increased numbers of life events and daily experiences would be associated with subsequent hospital admission. The second hypothesis was that increased life events and daily experiences
would be related to subsequent outpatient utilization in the cultural group examined (i.e. the Navajo) the same as they have been in other groups. Third, it was hypothesized that the association of these stressors and outpatient utilization would persist over time and not be limited to the time immediately following the assessment of the stressful events. Finally, while both categories of experiences (major life events and daily events) were seen as important, it was hypothesized that daily events would be more strongly associated with the outcomes under study.
METHODS
The study was conducted at the U.S. Public Health Service Indian Health Service Hospital in Crownpoint, New Mexico, a 37 bed community hospital with general medical, pediatric and low risk obstetric services. The hospital and associated clinic serve approximately 14,000 Navajo Indians under economic and geographic circumstances whereby most of the area residents’ health care is at the facility.
Subjects for this study were selected from inpatients and outpatients utilizing the facility. All inpatients between the ages of 20 and 59 admitted from 1 l/9/84 to 9/30/85 were eligible for inclusion in the study, with the exception of those whose mental status precluded an interview, those admitted for labor or diagnosis of labor, and those transferred from another facility. A patient discharged but readmitted during the study period was eligible for reenrollment.
763
764 ROBERT WILLIAMS er al.
Between 3 13185 and 9 30;85. outpatients aged 20-59 presenting for reasons other than prenatal care were considered for enrollment. Outpatients interviewed were a sample of convenience chosen by sequential reference to a sign-in log at varying times of clinic operation. No outpatients were reenrolled. Persons aged 60 or older were not considered for inclusion because of anticipated difficulties in obtain- ing information from ill elderly patients who because of cultural differences may have had little exposure to the particular information gathering process used. In addition, it has been shown that the importance of specific life change events is age dependent [23]. Inclusion of the older age group would have required design of separate instruments with attendant problems of interpretation.
Following informed consent, subjects were inter- viewed at or shortly after presentation in their language of choice (Navajo or English) about the occurrence of life events in the preceding six months and about hassles and uplifts in the preceding week. The life events scale consisted of twenty nine items (Appendix I), the first twenty two of which were adapted from the Social Readjustment Rating Scale of Holmes and Rahe [24]. A few of these items were modified slightly to improve cultural relevancy. Items 23-25 were taken from Hough ef al. [25] and Paykel et al. [26] with similar minor modification. The remain- ing four items were included to address culturally specific major life events. The hassles and uplifts scale (Appendix 2) had 30 items with the first 23 derived from Kanner et al. [2]. The remaining items were included as culturally relevant important sources of daily irritation or satisfaction. With both scales, scoring was by unweighted tallies of events during the time interval under study for that scale.
Two years later each subject’s chart was reviewed for number of subsequent hospital admissions (not including the original one for those interviewed while inpatients) in the two years starting from the date of the subject’s interview. A note was also made of the number of outpatient visits by the subject in the first year following interview. and of the number of outpatient visits in the second year following inter- view. Subjects who died during the two year followup were excluded from final analysis. Although a few sub- jects had records of hospitalizations at other facilities, the completeness of records of outside hospitalizations could not be determined. As a result, only hospitaliz- ations occurring at the Crownpoint facility were used in the analysis. With this approach it is conceivably possible that a patient with admissions only at another facility would have been classified as not being admitted. Hovvever. under the geographic and economic circumstances referred to above, this was unlikely to have happened, and was-not observed to have occurred.
Analysis of the data was performed in two ways: first by including all enrollments, and second by excluding second or subsequent enrollments of those
subjects who were either reenrolled as inpatients or were enrolled in both the inpatient and outpatient portions. The results showed essentially no differ- ence in significant relationships obtained by either approach. Hypothesis tests reported here use the latter approach.
The analysis of the stress measures was also done in two ways. First the raw scores obtained on each instrument were analyzed with respect to the outcome variables. However, because of concerns that such stress instruments contain health related items which may bias a relationship with health outcomes, a subsequent analysis was done excluding those items which have an element related to health status. Once again the revised analysis showed no differences in the significant relationships obtained. Results of relationships tested are those from the analysis which excluded health related items.
Initial statistical analysis included descriptive statistics for all measures. Given the skewed distribu- tion of the outcome variables, associations between the predictor and outcome variables were assessed with a nonparametric technique, the Spearman rank order correlation coefficient. Univariate associations were examined between each of the predictor variables (life change events, hassles, uplifts, total hassles plus uplifts, and the difference between hassles and uplifts), and each of the response variables (total admissions, total outpatient visits year one, total outpatient visits year two). Tests of significance were computed using an alpha level of 0.01 because of the number of relationships examined. The importance of major versus daily events was then assessed by comparing relative risks for admission of patients with high scores on either scale. Tests of main effects and inter- action were performed using the minimum modified chi-square technique for categorial data analysis (271. This analysis technique takes into account dispropor- tionate cell sizes, and the corresponding chi-square statistic is computed adjusting for the effects of other independent variables.
RESL LTS
Of the total of 191 eligible inpatients admitted during the study period, I61 (84%) completed the interview, 22 declined to participate, and 8 were dis- charged or transferred to another hospital before being interviewed. Ten other inpatients were considered ineligible because their mental status precluded inter- view. During the time periods when the research assistant was conducting interviews in the outpatient clinic, visits were made by II69 eligible patients, and 324 subjects were enrolled in the study. One hundred and seventy of the other outpatients refused enroll- ment (primarily due to the length of the interview process), and 675 visits were by patients who com- pleted their visit before being called for interview. The study sample represents 66% of the outpatients
Daily and major life events and hospitalization 765
Table I. Descriptive statistics for predictor and outcome variables
95% Coefficient Confidence of
Mean interval skewness
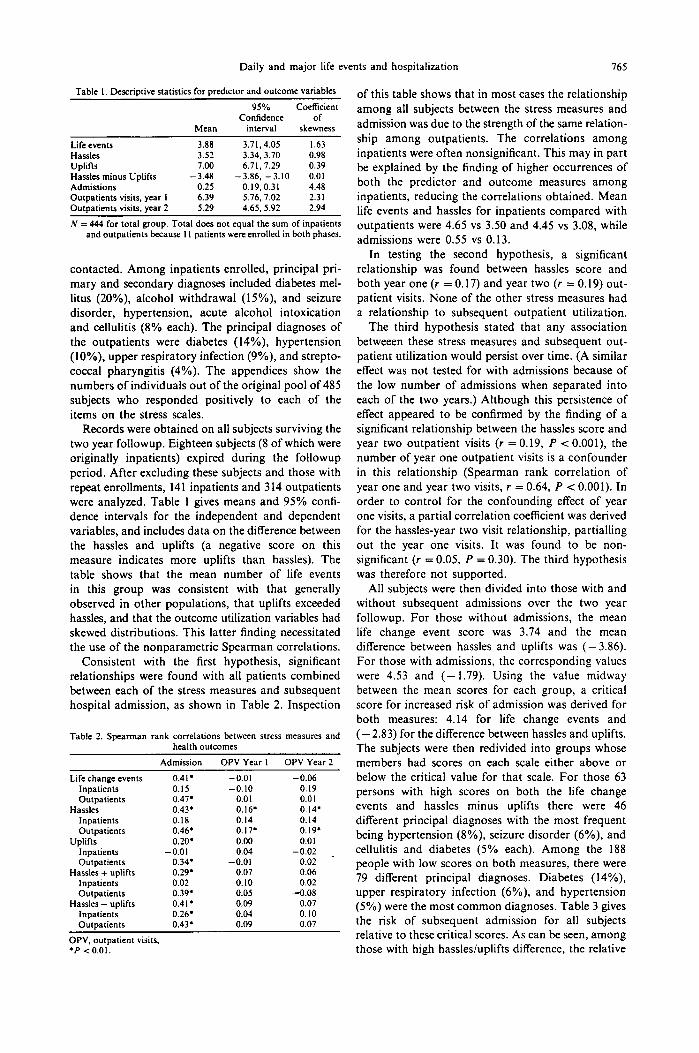
Life events 3.88 3.71.4.05 1.63 Hassles 3.52 3.34, 3.70 0.98 Uplifts 7.00 6.71.7.29 0.39 Hassles minus Uplifts - 3.48 -3.86, -3.10 0.01 Admissions 0.25 0.19.0.31 4.48 Outpatients visits, year I 6.39 5.76, 7.02 2.31 Outaatients visits. Year 2 5.29 4.65.5.92 2.94
N = 444 for total group. Total does not equal the sum of inpatients and outpatients because I I patients were enrolled in both phases.
contacted. Among inpatients enrolled, principal pri- mary and secondary diagnoses included diabetes mel- litus (20%), alcohol withdrawal (IS%), and seizure disorder, hypertension, acute alcohol intoxication and cellulitis (8% each). The principal diagnoses of the outpatients were diabetes (14%), hypertension (lo%), upper respiratory infection (9%), and strepto- coccal pharyngitis (4%). The appendices show the numbers of individuals out of the original pool of 485 subjects who responded positively to each of the items on the stress scales.
Records were obtained on all subjects surviving the two year followup. Eighteen subjects (8 of which were originally inpatients) expired during the followup period. After excluding these subjects and those with repeat enrollments, 141 inpatients and 314 outpatients were analyzed. Table 1 gives means and 95% confi- dence intervals for the independent and dependent variables, and includes data on the difference between the hassles and uplifts (a negative score on this measure indicates more uplifts than hassles). The table shows that the mean number of life events in this group was consistent with that generally observed in other populations, that uplifts exceeded hassles, and that the outcome utilization variables had skewed distributions. This latter finding necessitated the use of the nonparametric Spearman correlations.
Consistent with the first hypothesis, significant relationships were found with all patients combined between each of the stress measures and subsequent hospital admission, as shown in Table 2. Inspection
Table 2. Spearman rank correlations between stress measures and health outcomes
Admission OPV Year I OPV Year 2
Life change events 0.41. -0.01 -0.06 Inpatients 0.15 -0.10 -0.19 Outpatients 0.47’ 0.0 I 0.01
of this table shows that in most cases the relationship among all subjects between the stress measures and admission was due to the strength of the same relation- ship among outpatients. The correlations among inpatients were often nonsignificant. This may in part be explained by the finding of higher occurrences of both the predictor and outcome measures among inpatients, reducing the correlations obtained. Mean life events and hassles for inpatients compared with outpatients were 4.65 vs 3.50 and 4.45 vs 3.08, while admissions were 0.55 vs 0.13.
In testing the second hypothesis, a significant relationship was found between hassles score and both year one (r = 0.17) and year two (r = 0.19) out- patient visits. None of the other stress measures had a relationship to subsequent outpatient utilization.
The third hypothesis stated that any association betweeen these stress measures and subsequent out- patient utilization would persist over time. (A similar effect was not tested for with admissions because of the low number of admissions when separated into each of the two years.) Although this persistence of effect appeared to be confirmed by the finding of a significant relationship between the hassles score and year two outpatient visits (r = 0.19, P < 0.001) the number of year one outpatient visits is a confounder in this relationship (Spearman rank correlation of year one and year two visits, r = 0.64, P c 0.001). In order to control for the confounding effect of year one visits, a partial correlation coefficient was derived for the hassles-year two visit relationship, partialhng out the year one visits. It was found to be non- significant (r = 0.05, P = 0.30). The third hypothesis was therefore not supported.
All subjects were then divided into those with and without subsequent admissions over the two year followup. For those without admissions, the mean life change event score was 3.74 and the mean difference between hassles and uplifts was (- 3.86). For those with admissions, the corresponding values were 4.53 and (- 1.79). Using the value midway between the mean scores for each group, a critical score for increased risk of admission was derived for both measures: 4.14 for life change events and (-2.83) for the difference between hassles and uplifts. The subjects were then redivided into groups whose members had scores on each scale either above or below the critical value for that scale. For those 63 persons with high scores on both the life change events and hassles minus uplifts there were 46 different principal diagnoses with the most frequent being hypertension (8%), seizure disorder (6%), and cellulitis and diabetes (5% each). Among the 188 people with low scores on both measures, there were 79 different principal diagnoses. Diabetes (14%), upper respiratory infection (6%) and hypertension (SO/,) were the most common diagnoses. Table 3 gives the risk of subsequent admission for all subjects relative to these critical scores. As can be seen, among those with high hassles/uplifts difference, the relative
766 ROBERT WILLIAMS et al.
Table 3. Percentages of subjects in each category of critical scores on stress measures who were admitted to the hospital
Life change event score Relative risk of
o-4 5+ Totals admission
c -3 I I% 19% I 3 % Hassles - uplifts (188). (62) score 1.87
p-2 2194 3 2 % 250; (131) (63)
Totals 15% 26% Relative risk 2.92 of admission 1.66
‘Figures in parentheses are numbers of subjects in subgroups.
Effect
Hassles - uplifts Life change Interaction
Minimum modified I’* summary
df l.? P
I 8.26 0.004 I 5.14 0.02 I 0.14 0.71
risk of admission is 1.87. For those with high life events, the relative risk of admission is 1.66. With high scores on both scales, the relative risk of admission is 2.92 over those with low scores on both, implying an additive not multiplicative effect. This lack of multi- plicative interaction was confirmed by a minimum modified chi-square analysis (for the interaction term, Y* = 0.14, P = 0.71). Thus, daily events appear to be a slightly better predictor of subsequent admission than life change events, but the difference is trivial. More importantly, both categories of stressors appear to contribute to risk of subsequent admission.
The attributable risk percent of admission for scores over the critical values is 42% for life change events and 48% for hassles minus uplifts. As a pre- dictor of subsequent admission, the sensitivity of the critical value for life change events was 40% and for hassles and uplifts difference was 59%. The specilic- ities were 74% and 60%, and positive predictive values were 26% and 25%, respectively.
DISCUSSION
The results of this study are consistent with a growing body of literature that has shown the import- ance of daily and major life occurrences in the health-illness process. Among young and middle age adults presenting for health care, increased numbers of major life events, of daily hassles, or of daily uplifts or a relative excess of daily irritants over pleasurable experiences were all associated with an increased risk of hospitalization over the following two years. In addition, excessive daily hassles were related to increased outpatient utilization as has been-shown in other groups.
Previous work has tended to show that persons with increased numbers of life events or daily stressors utilize outpatient health services at increased rates [13-171. Self-reports of symptoms and illnesses have also been shown to be related to these stress measures [6-IO]. Those who make a distinction
between health and illness behavior and physical manifestations of illness, and who are interested in defining potential causative relationships, however, have critized the use of these outcomes (outpatient utilization and self-reported symptoms) as being too vulnerable to reporting biases. This has led to a call for studies with more objective outcome measures. While some investigators have been able to document an association between life events and objective, independent measures of health status [ 19-221, others have had less success in doing so (28-301. Hospital admission as an outcome measure combines elements of both illness behavior and objectively verifiable physical status. Admission requires an assessment by someone (the physician) other than the patient that the physical status is at a level which requires admission. On the other hand, such decision levels are not always reliably established, and the ultimate decision to admit is often the result of a negotiation process between the physician and the patient, a pro- cess which can introduce aspects of illness behavior.
In the only previous study of the relationship between life events and hospital utilization, children in a pediatric community cohort in New Zealand were shown to have increased rates of admission when mothers of the cohort members reported higher numbers of life events [31]. While this may suggest that in this study admission was weighted heavily with illness behaviors, the increased risk of admission was consistent across diagnostic groups. Several of these groups included conditions which are influenced by parental attention to the needs of the child, sug- gesting more of a causative role for parental stress in the child’s illness, mediated through parental inatten- tion to the child. The current study differs from the pediatric one in assessing prospectively the hospital utilization of the subjects whose major and daily life stressors are being measured.
Whether major stressors or daily ones are the more important predictors of health outcomes has been another topic of study. In general, whenever the two have been compared, daily events have had a greater impact [2, 7, 321. In this study, daily stressors had a slightly greater influence on risk of admission, though the additive effects of high life events and relative excess of hassles suggests both categories of stress exert influence independently. However, only daily hassles score was associated in this population with increased outpatient utilization; major life events were unassociated with this outcome. While some may feel it counterintuitive that minor stresses over a two week period should have greater predictive value than major life events over a six month period, the theoretic justification for such a result has been previously presented [2]. In essence, it is felt that the reporting of daily stresses or general background level of stresses may offer greater information about the person’s coping abilities than a listing of major events, and that these adaptational abilities to chronic strain are more predictive of health status.
Daily and major life events and hospitalization 767
Although the design and analysis of this study address some of the methodologic issues which plague this area of research, there remain some
potential limitations of the study. The population in which the study was conducted has many cultural differences from the general U.S. population. Circumstances did not permit pretesting of the stress scales in this population. While this may limit generalizability of the specific findings of the study, the more general finding of a relationship of stressful occurrences to health outcomes has been repeatedly established. Documenting this relationship in yet another cultural group adds to the generalizability of the relationship.
The fact that this was not a community based study may cause some to question the usefulness of the study. In fact, however, one of the most important aspects of this study is that it identifies a subgroup of patients presenting to health care providers who are at increased risk of hospitalization over the following two years. Persons who have interfaced with the health care system are by definition more accessible to health care providers and to potential interventions than persons within the community.
The nature of the relationship between stressful occurrences and health/illness is a complex one which is not fully understood. Clearly in some situations, the relationship is causal as stressful events exert direct effects resulting in illness. In other circumstances, stress may be a cofactor, predisposing the individual to illness when other causative factors are present. Another relationship could be that illness itself causes greater stress throughout a person’s relationships and life experiences. Finally, it is also possible, though less likely, that stress and illness are in fact not related at all, but rather are both expressions of a general vulnerability existing in a person.
The issue of a causative relationship between major or daily stressors and hospital admission is not addressed by this study. Rather, the object has been to establish that such stressors can serve as markers for people interacting with the health care system who are at increased risk of hospitalization. Such early identification may be useful in targeting preventive interventions at those most likely to require health care more frequently, i.e. those presenting for care who admit high levels of daily or major life stress. Targeting interventions would likely improve cost effectiveness and is particularly important given the current environment of cost containment in health care delivery. Whether this identification can indeed lead to effective interventions is the next important question that needs to be addressed by investigators in the stress field.
Acknowledgemenrs-The authors appreciate theassistance of the staff of the Crownpoint Comprehensive Health Care Facility in data collection.
The opinions expressed in this article are those of the authors and do not necessarily represent those of the Indian Health Service.
1.
2.
3.
4.
5.
6.
I.
8.
9.
10.
II.
12.
13
14
15.
16.
17.
18.
19.
20.
21.
22.
23.
REFERENCES
Rahe R. H. Life change measurement clarification. Psychosom. Med. 40, 95, 1978. Kanner A. D., Coyne J. C., Schaefer C. and Lazarus R. S. Comparison of two modes of stress measurement: Daily hassles and uplifts versus major life events. J. Eehav. Med. 4, (I), 1981. Cooke D. J. and Hole D. J. The aetiological importance of stressful life events. Br. J. Psychiaf-143, 397, 1983. Lin N.. Simeone R. S.. Ensel W. M. and Kuo W. Social support, Stressful life events, and illness: A Model and an Empirical Test. J. Hlth Sot. Behau. 20, 108, 1979. Nezu A. M. Effects of stress from current problems: Comparison to major life events. J. clin. Psychol. 42, 847, 1986. Graham N. M. H., Douglas R. M. and Ryan P. Stress and acute respiratory infection. Am. J. Epidemiol. 124, 389, 1986. Jandorf L., Deblinger E., Neale J. M. and Stone A. A. Daily versus major life events as predictors of symptom frequency: A replication study. J. gen. Psycho/. 113,205, 1986. Sarason I. G., Sarason B. R., Potter E. H. and Antoni M. H. Life events, social support and illness. Psychom. Med. 47, 156, 1985. McKay D. A., Blake R. L., Colwill J. M., Brent E. E. ef al. Social supports and stress as predictors of illness. J. Fam. Pracr. 20, 575, 1985. Aro H., Hanninen V. and Paronen 0. Social support, life events and psychosomatic symptoms among -lb-16 year-old adolescents. Sot. Sci. Med. 29. 1051. 1989. Webster A. and Mawer G. E. Seizure’frequency and major life events in epilepsy. Epilepsia 30, 162, 1989. DeLongis A., Folkman S. and Lazarus R. S. The impact of daily stress on health and mood: Psychological and social resources as mediators. J. Pers. Sot. Psychol. 54, 486, 1988. Gortmaker S. L., Eckenrode J. and Gore S. Stress and the utilization of health services: A time series and cross-sectional analysis. J. Hlrh Sot. Behav. 23, 25, 1982. Antoni M. H. Temporal relationship between life events and two illness measures: A cross-lagged panel analysis. J. Hum. Stress 11, 21, 1985. Roghmann K. J. and Haggerty R. J. Daily stress, illness, and use of health services in young families. Pediaf. Res. 7, 520, 1973. Pilisuk M., Boylan R. and Acredolo C. Social support, life stress, and subsequent medical care utilization. Hlth Psychol. 6, 273, 1987. Krause N. Stressful life events and physician utilization. J. Geront. 43, 553, 1988. Horwitz S. M., Morgenstern H. and Berkman L. F. The impact of social stressors and social networks on pediatric medical care use. Med. Care 23, 946, 1985. Boyce W. T.. Jensen E. W.. Cassel J. C.. Collier A. M.. et a/. Influence of life events and family routines on childhood respiratory tract illness. Pediarrics 60, 609, 1977. Williamson H. A., LeFevre M. and Hector M. Association between life stress and serious perinatal complications. J. Fam. Pracr. 29, 489. 1989. Schwartz L. S., Springer J., Flaherty J. A. and Kiani R. The role of recent life events and social support in the control of diabetes mellitus-a pilot study. Gen. Hosp. Psychiaf. 8, 212, 1986. Hardy C. J. and Riehl R. E. An examination of the life stress-injury relationship among noncontact sport participants. Behav. Med. 14, 113, 1988. Hughes D. C., Blazer D. G. and George L. K. Age Differences in Life Events: A Multivariate Controlled Analysis. Int. J. Aging Hum. Derel. 27, 207, 1988.
768 ROBERT WILLIAMS et al.
24.
25.
26.
27.
Holmes T. H. and Rahe R. H. The social readjustment rating scale. J. Pswhosom. Res. 11, 213, 1967. Hough R. L., Fairbank D. T. and Garcia A. M. Problems in the ratio measurement of life stress. J. Hlfh Sot. Behoo. 17, 70, 1976. Paykel E. S., Prusoff B. A., Uhlenhuth E. H. Scaling of life events. Arch. gen. Psychiat. 25, 340, 1971. Grizzle J. E.. Starmer C. F. and Koch G. G. Analysis of categorical data by linear models. Biometrics 25,489. 1969.
28. Kemeny M. E., Cohen F., Zegans L. S. and Conant M. A. Psychological and immunological predictors of genital herpes recurrence. Psychosom. Med. 51, 195, 1989.
29.
30.
31.
Sonino N., Fava G. A., Grandi S., Mantero F. and Boscaro M. Stressful life events in the pathogenesis of Cushing’s syndrome. C/in. Endow. 29, 617, 1988. Angelini C. The role of life events in the myasthenia gravis outcome: A one-year longitudinal study. ACIU Neural. Stand. 79, 288, 1989. Beautrais A. L.. Fergusson D. M. and Shannon F. T. Life events and childhood morbidity: A prospective
_ _ 32.
study. Pediatrics 70, 935, 1982. Wagner B. M.. Comoas B. E. and Howell D. C. Dailv and-major life events: A test of an integrative model df psychosocial stress. Am. J. Commun. Psycho!. 16, 189, 1988.
APPENDIX 1
Life Events Scale*
I. 2. 3. 4. 5.
Marriage (0.4%) Troubles with boss (1.8%) Put in jail (9.4%)
6. 7. 8. 9.
10. 1 I.
Death of spouse/boyfriend/girlfriend (0.2%) Taking on a large loan/difficulty with payments on a loan (9.6%) Death of a close family member (29.2%) Death of a close friend (6.5%) Minor violation of the law (10.5%) Outstanding personal achievement (3%) Pregnancy (5.5%) Major change in the health or behavior of a family member (35.8%)
12. Troubles with parents or in-law (4.1%) 13. Gaining a new family member in household (30.3%) 14. Moving away from parents or family (16.9%) 15. Son/daughter/close relative leaves home (53.6%)
*Figures in parentheses refer to percentage of subjects responding positively to item.
tFigures in parentheses refer to percentage of subjects responding positively to item as (hassle/uplift).
16.
17.
18. 19.
20.
21.
Divorce or separation from spouse or boy/girlfriend (9%) Got back together with spouse or boy/girlfriend after separation (4.5%) Got fired or layed off from work (13.4%) Unable to find a job after a long time looking, or changed jobs (24.7%) Major change in number of arguments with spouse or boy/girlfriend (13.6%) Major change in work hours or responsibilities at work (I 1.9%)
22. Spouse began or stopped work (4.7%) 23. Marked change in household income (44.5%) 24. Engaged or engagement broken (0.2%) 25. Seuaration or trouble with a close friend (3.5%) 26. Ciremony for a family member (25.5%) 27. Ceremon; for self (22.6%) 28. Loss of some of herd (9.4%) 29. Land dispute (8.8%)
APPENDIX 2
Hassles and Uplifts Scalet
1. 2. 3. 4. 5. 6. 7. 8. 9.
10. II. 12.
Children (3.5/74.8%) Parents (1‘.8/45.7%)’ In-laws and other relatives f4.7/24.5%) Spouse/boy/girlfriend (10.3/i 1 .d%) Health of a family member (6.5/18.9%) Family related responsibilities (5.3/51.9%) Friends (5.5,‘41.6%) Fellow workers, clients, customers, etc. (6.3/20.6%) Supervisor or employer (3.7/21.4%) Work load, deadlines on the job (13.6/12.3%) Job security (1.4/21.8%) Check arriving. enough money for necessities (50.1/ 37.3%) -’ - -
Money for extras (88.8/9.6%) Financial care for relatives (1.8/1.6%) Drinking (16.0/0.6%) Physicalappearance (4.9/90. I %) Medical care (3.7/52.9%) Health (63.O/j5.4%) Cooking and housework (15.4/48.6%) Home repairs (7.8/20.8%) Amount of free time C5.3/4.9%) Church or community organizations (1.0/64.9%) Legal matters (I .6/0.6%) Transportation (41.0/57.1%) A family member’s drinking (42.4/0.6%) Work on crafts (0.8/27.2%) Livestock (5.5/16.4%) Time spent waiting on something (23.0/2.4%) Time and money spent getting wood and water (7.0/ 9.8%)