Page 1
(Projects submitting final reports after 1 January 2014 must use this format.)
LIFE Project Number
LIFE12 ENV/FI/597
MIDTERM Report Covering the project activities from 01/08/2013 to 31/12/2014
Reporting Date
31/03/2015
Reduction of wastewater nutrient load: demonstrations and modelling
N-SINK
Project Data
Project location Hämeenlinna, Finland
Project start date: 01/08/2013
Project end date: 31/07/2017
Total Project duration
(in months) 48 months
Total budget 1 118 260€
Total eligible budget 1 118 260€
EU contribution: 594 130€
(%) of total costs 50%
(%) of eligible costs 50%
Beneficiary Data
Name Beneficiary University of Helsinki, Lammi Biological Station
Contact person Mr Jussi Huotari
Postal address Pääjärventie 320, FI-16900 Lammi, FINLAND
Visit address Pääjärventie 320, FI-16900 Lammi, FINLAND
Telephone +358 50 415 4405
Fax: +358 2941 40746
E-mail [email protected]
Project Website http://www.helsinki.fi/lammi/NSINK/index.html
Page 2
2
Instructions:
The final report must be submitted to the Commission no later than 3 months after the project
end date.
One paper and one electronic version of the report is sufficient for the Commission. These
documents must be sent in identical versions also to the monitoring team. The report must
also be sent to the national authority.
Please refer to the Common Provisions annexed to your grant agreement for the contractual
requirements concerning a final report .
1. List of contents
1. List of contents ................................................................................................................... 2 2. Executive Summary (maximum 5 pages) .......................................................................... 3
3. Introduction (1 page) .......................................................................................................... 4 4. Administrative part (maximum 3 pages) ............................................................................ 5
4.1 Description of the management system ........................................................................... 5 4.2 Evaluation of the management system ............................................................................. 6
5. Technical part (maximum 50 pages) .................................................................................. 8 5.1. Technical progress, per task ............................................................................................ 8
5.2 Dissemination actions .................................................................................................... 22 5.3 Evaluation of Project Implementation ............................................................................ 23 5.4 Analysis of long-term benefits ....................................................................................... 23
6. Comments on the financial report .................................................................................... 25 6.1. Summary of Costs Incurred ........................................................................................... 25
6.2. Accounting system ........................................................................................................ 25 6.3. Partnership arrangements (if relevant) .......................................................................... 26
6.4. Auditor's report/declaration ........................................................................................... 26 7. Annexes ................................................................................................................................ 28
7.1 Administrative annexes .................................................................................................. 28 7.2 Technical annexes .......................................................................................................... 28
7.3 Dissemination annexes ................................................................................................... 29 7.4 Final table of indicators .................................................................................................. 29
8. Financial report and annexes ................................................................................................ 30
Page 3
3
2. Executive Summary (maximum 5 pages)
The aim of the project N-SINK is to demonstrate the potential of denitrification by
bacteria of inland water sediments as a cost-efficient solution of reduction of nitrogen (N)
from treated waste waters by spatially optimizing the effluent discharge from waste water
treatment plants (WWTP) to the sediment surface. Another objective is to create a
modelling framework, by combining ecological and economic models, which can be used
to resolve the most cost-effective spatial allocation of nutrient abatement measures within
catchment areas in order to reduce a nutrient loading to inland waters and to the Baltic
Sea. Various abatement measures in waste water treatment and agricultural sector are to
be considered in the modelling. Further, we will also demonstrate how past changes in
waste water treatment practices have influenced recipient waters.
The key deliverables of the project are 1) a description of the water quality changes in
recipient waters due to the application of water purification techniques (D. 3.2
Demonstration of the effects of water protection on water quality in two heavily loaded
river basins in southern Finland, Lake Vanajanselkä and River Porvoonjoki), 2) a
description of new alternative method for nitrogen removal exploiting a natural ecosystem
service (sediment filtering) (D 2.2 New alternative method for nitrogen removal
exploiting a natural ecosystem service), 3) an information on environmental effectiveness
of nitrogen removal using the newest methods in measuring denitrification and N2O
emissions (D 5.1 Environmental effectiveness of nitrogen removal using the newest
methods), 4) a description and scenarios of nitrogen fluxes in watersheds and the role of
nitrogen removal at landscape level (D. 3.4 Implementation for N-removal scenarios for
Finnish river basins) and 5) an information on socio-economical effects of nitrogen
removal at landscape level (D. 4.2 Spatially cost-effective allocation of nutrient abatement
measures at watershed level).
As the main outcomes by the end of the project, we have given suggestions and
recommendations whether, and under what conditions, the spatial optimization of the
waste water flow from WWTPs to a sediment surface is part of the cost-effective set of
abatement measures to reduce the N loading, and how this measure should most
effectively be put into practice. Also model calculations and recommendations of the most
cost-effective combinations of the nutrient abatement measures within our two
demonstration catchments will be ready and description of the modelling framework
available to be applied to other catchments as well.
This report gives a short introduction to the background, environmental problem
addressed and the objectives of the project in Chapter 3. Chapter 4 describes the
organizational structure of the project as well as how the management of the project and
synchronization of the tasks by different teams has been taken care of. Progress of the
project as well as dissemination activity per each task are reported in Chapter 5, showing
for example that the first sediment filtration demonstration has been started, modelling
framework described and the first model results reported. Comments on the financial
report in Chapter 6 summarize the costs incurred and shortly describe the accounting and
time registrations systems of the beneficiaries. Chapters 7 and 8 describe annexes
submitted with this report.
Page 4
4
3. Introduction (1 page)
Directives set by the European Union require improvement of nitrogen removal at
WWTPs for protection of inland waters and the Baltic Sea. This request is highly relevant
to those WWTPs, which discharge their treated waste waters directly to the sea or to
inland waters where limiting nutrient to primary production is nitrogen. However, in most
inland waters primary production is more sensitive to phosphorus and majority of N is
removed by sedimentation or is denitrified and degassed into the atmosphere as
dinitrogen gas (N2) along water routes from WWTPs to the Baltic Sea. Improving a
nitrogen reduction at WWTP would require costly technical investments and there is also
a potential risk of increasing nitrous oxide (N2O) emissions, if the forced denitrification
at WWTPs is used. N2O is highly potent greenhouse gas with radiative forcing 300 times
higher than that of carbon dioxide. Taken into account of the costly investments and
undesirable atmospheric influence one may want to look for the possibility of other
sources for reducing nitrogen load. Agriculture alone is responsible over half of the N
load in Finland.
In order to reduce nutrient loading most effectively with limited financial recourses
various nutrient abatement measures should be allocated wisely within catchment areas.
Measures implemented far from the coastline only have a small effect on the state of the
Baltic Sea because of retention, but might have a large effect on local lakes and rivers.
On the contrary, measures implemented on coast will have a strong effect on the sea but
no effect on inland waters. Therefore, effectiveness of one abatement measure might vary
depending on the location in the catchment. Development of the spatially explicit cost-
efficient abatement strategy is essential for economically efficient water protection.
In project N-SINK, we demonstrate the hypothesis that reduction of waste water N can be
increased in natural denitrification by spatially optimizing the discharge of nitrate rich
treated waste water from WWTPs onto inland water sediment surfaces instead of present
day practise of one point outlet discharge to the water surface. This is done by using
specifically designed perforated sewage outlet, which increases the time and surface area
the treated waste water is in connection with sediment. This way we can enhance the
efficiency of sediment denitrifying bacteria, which optimally results in permanent
removal of N from the system as N2 gas. We also create a modelling framework, where
we combine results from ecological nutrient loading models to produce a cost-effective
allocation of nutrient abatement measures at the catchment level with information about
the effectiveness and costs of abatement measures and using the techniques of a
simulation-optimization model. Model calculations will be produced for two
demonstration areas, namely Lake Vanajanselkä and Porvoonjoki catchments. Scenarios
of abatement measures are based on current agri-environmental programme and different
solutions on point sources including the demonstrated sediment filtration technique.
The baseline scenario is that the purified waste water N load can be reduced by the
sediment filtration approach at least by 30%. The description of the method and the
information on its effectiveness will be reported. For the two demonstration catchment
areas with high loading of agriculture and point-sources model calculations for nutrient
loading estimations and decision support systems will be run to find out the most cost-
efficient strategies for allocation nutrient abatement measures. The modelling framework
will be described to allow analyses to other catchment area as well.
Page 5
5
4. Administrative part (maximum 3 pages)
4.1 Description of the management system
The project consists of four different institutions with independent teams, which are led
by the team leaders responsible for implementing the action plans of the teams (Figure 1).
Lauri Arvola (Team leader of UHEL, LBS) is the project manager who makes the final
decisions in the project. Project Steering and Advisory Board (SAB) will give opinion
and expertise for the decision making of the project, as well as helps in the dissemination
of the results. SAB consists of team leaders and representatives of the invited
stakeholders. LBS has hired project coordinator, who ensures together with the project
manager and team leaders that the coordination of the different action plans will be
optimally synchronized and that the goals of the action plans will be achieved. Project
manager, project coordinator and the team leaders meet at least twice a year in the SAB
meetings and whenever it is necessary. The manager and the coordinator have offices
next to each other ensuring constant communication. Workshops are organized between
the teams for the synchronization of the Actions. Each partner team has been organized in
their own quarters to divide the tasks within the teams.
In addition to hiring the project coordinator, the coordinating beneficiary has organized
the project kick-off meeting (1 November 2013) and invited the most important
stakeholders (Ministry of the Environment, FIWA, HS-Vesi, The Finnish Forest and Park
Service, Regional Council of Häme, MTK, ELY) to participate in the SAB. Each invited
stakeholder nominated a representative to the SAB. All partners and stakeholders
participated in the project kick-off meeting. The project manager and the project
coordinator also participated in LIFE+ kick-off meeting on 14 October 2013. SAB has
assembled three times (12 December 2013, 14 May 2014 and 12 November 2014, Annex
1), according to the project plan. The meetings have been organized in cooperation
between beneficiaries.
Each team has planned and carried out the activities set in the proposal quite
independently taking into account the discussion and ideas changed in the SAB meetings
as well as in other communication. LBS and UJ have planned sediment filtration
demonstration and monitoring together and SYKE and MTT the integration of ecological
and economic models in cost-efficiency analysis of spatial allocation of nutrient
abatement measures.
Partnership agreement was submitted to the Commission as an annex of the Inception
Report. As requested in a letter from Commission, in Annex 2 it is explained with
relevant documentation that N-SINK and ERC-project of Marja Tiirola are independent
projects and ERC-funding is not used by no means in funding of N-SINK.
Page 6
6
Organigramme of the project team and the project management structure
Figure 1. Schematic figure of the project management and team structure. Team blocks
(bottom row) represent also team responsibilities as well as involvement (in parentheses)
of the actions. Team members in parentheses are crucial to the project due to their
expertise but they get their salary from other sources.
4.2 Evaluation of the management system
Communication among partners has been adequate. In addition to SAB meetings twice a
year, team leaders once updated the situation by skype meeting and otherwise
communication have been handled by phone or emails whenever necessary. Financial
information has been collected three times, which has been sufficient due to early phase
of the project but towards the end of the project we will collect the information more
frequently.
Although we have tried to select the times of SAB meetings to be suitable to as many
members as possible by Doodle scheduling, quite many cancellations by the invited SAB
members have occurred, as only 2 to 4 out of the 8 invited SAB members have
participated per meeting and we must think how we can get people to be more involved.
In the next meeting we will arrange a possibility to participate via video connection and
we will discuss whether organizing the meetings different time a year would help.
However, we think the SAB meetings have forwarded the project well and SAB has
Page 7
7
fulfilled its purpose although more diverse views in the meetings could be more
productive to the project.
Communication with our external monitor has been very valuable to the project. Answers
to our sometimes frequent questions have been given in no time keeping the project on
the move.
Activity with regards to other EU-projects will increase as long as the demonstrations
proceed and the project has more to offer.
Page 8
8
5. Technical part (maximum 50 pages)
5.1. Technical progress, per task
5.1.1 ACTION A.1: Preparation of the study sites for the N-SINK demonstration
action
1. Choosing the study and monitoring sites based on the hydrological and technical
survey
We selected Hämeenlinna/Paroinen, Keuruu and Petäjävesi for the sediment filtration
demonstration sites due to their proximity to LBS (Paroinen) and UJ (Keuruu &
Petäjävesi) and based on the interviews with representatives of water utility staff and
authorities (M 1.1). We have collected maps and other documentation needed for
planning a construction of perforated sewage outlet, as well as water chemistry data of
the WWTWs for reference to monitoring in Actions C1 and 2 and for planning the
demonstration for part of the discharge in Hämeenlinna/Paroinen WWTP. In Keuruu and
Petäjävesi demonstration sites, waste water flow direction was estimated with CTD
soundings (Kokkonen et al. 2014 Annex 3), as well as with measuring water quality
parameters. In addition, open source COHERENS modelling software was used to
estimate small-scale flow directions in the northern part of Keurusselkä. CTD soundings
and water quality measurements were done on 5 February 2014 in Keuruu, on 6 February
2014 in Petäjävesi. In Keuruu and in Petäjävesi, Tom Kokkonen (UH), Sanni Aalto (UJ)
and Olli Nousiainen (UJ) were responsible for the field measurements and Janne
Ropponen (SYKE) made the COHERENS modelling. For Paroinen there was previous
survey on waste water flow and Jussi Huotari and Lauri Arvola (LBS) conducted the
additional measurements of water quality to determine the waste water flow in Paroinen
on 4 March 2014. Based on the bathymetric characteristics of the demonstration sites and
field measurements, representative monitoring points were chosen and described in
Deliverable 1.2. (Annex 4). Additional measurements of waste water flow were planned
to take place during demonstrations to make sure the monitoring points are still valid for
the purpose.
2. Drafting the environmental permit for the N-SINK sediment filtration in the medium-
size wastewater treatment
We contacted the Regional State Administrative Agency (AVI Western and Inland
Finland) and found out that we should apply water permit for the demonstrations
conducted in Keuruu and Petäjävesi. Water Protection Association of Kokemäenjoki
(KVVY) was asked to prepare a statement of the influence of the demonstration in
Keuruu for water permit application (Annex 5). Water permit for the first demonstration
site (Keuruu) was applied (Annex 5) from the Regional State Administrative Agency
(AVI) of Western and Inland Finland on 27 February 2014 and permit (Annex 5) was
granted on 10 June 2014. Sanni Aalto (UJ) and Marja Tiirola (UJ) were responsible in
preparation of the water permit application. According to the statement of ELY-Häme we
do not need water permit for demonstration in Paroinen/Hämeenlinna WWTW (Annex
6).
Page 9
9
5.1.2 Action B
ACTION B.1: N-SINK sediment filtration demonstrations
Lake modellers of SYKE attended a discussion with researchers of UJ and LBS of
choosing demonstration areas. To enable measurement of representative monitoring
points and construction plan for extended perforated sewage outlet, scuba diver chased
down, checked the spatial construction of and marked the end of waste water discharge
pipe with buoy in Keuruu and Petäjävesi on 15 November 2013.
We decided to conduct the first demonstration action in Keuruu WWTP in summer 2014
and the second one in Petäjävesi WWTP in summer 2015. The construction plan for the
extended perforated sewage outlet was ordered from Pöyry PLC (section of Waste water
treatment plants, contact persons Antti Harinen and Eeva Ronni) and was delivered at the
end of January 2014. Construction plans of the filtration systems of Keuruu and
Petäjävesi are based on the hydraulic modelling provided by Pöyry PLC (Annex 5).
Construction plan and hydraulic modelling for the filtration system). The first
demonstration was chosen to take place in Keuruu WWTP. The invitation to tender was
opened on 13 June 2014 (sent to three companies: Vapo Oy, Clean Waters; Päijänteen
sukelluspalvelu and Vesieko Oy) and closed on 8 August 2014. Tender was only given by
Clean Waters-project of Vapo Oy, which was chosen to construct, install and disassemble
the filtration system (Annex 5, Decision of procurement). The length of the filtration
system of the first demonstration site Keuruu is 30 meters, since it is more budget
friendly than the originally planned 100 m long system. Filtration system is built from a
PE-pipe (diameter 630 mm), which has 50 holes (diameter 30 mm) on each side (Annex
5. A detailed construction plan for the filtration system of Keuruu WWTP). The
construction and installation of the filtration system (Figure 2) took place between 15 and
16 October 2014. The filtration system was constructed in the shore line of Keurusselkä,
transferred to the demonstration site with a ferry and attached into the end of the current
discharge pipe with ten weights (á 627 kg). A group of scuba divers (Päijänteen
Sukelluspalvelu) took care of the installation. The filtration system will be disassembled
in autumn 2015. In Petäjävesi, the demonstration will start during 2015.
Figure 2. Installation of the filtration system to Keuruu
Page 10
10
Sanni Aalto (UJ) and Marja Tiirola (UJ) were responsible for the ordering of the
construction plans and preparation of the invitation to tender and S. Aalto inspected that
construction and installation of the filtration system followed the conditions defined in
the water permit. The costs of the filtration system are higher than expected in the budget.
Construction materials as well as installation costs were higher than estimated. By the
current filtration system tested in Keuruu we did not interrupt the waste water treatment
processes of the treatment plant. Based on the very first results after the installation it is
yet impossible to make any conclusion on the effectiveness of the filtration system in N
removal because the denitrification measurement results are not ready. We have not
detected phosphorus release from the sediments.
Water discharge from Paroinen WWTP is different from that in Keuruu and Paroinen,
because the treated wastewater is released to a small stream (Rautamonoja) draining into
a shallow bay of Lake Vanajavesi, instead of being led through a discharge pipe deeper in
the lake. As the waste water flow seems to be already spatially optimized on sediment
surface (cf. Deliverable 2.1, Annex 4) it allows us to assess a different approach in the N-
SINK demonstration. Depart from the plan proposed in the Inception report we do not
need to use the filtration fabric but instead we estimate the denitrification as it is at
present at the site. To be able to estimate the effectiveness of this approach we will use
watertight fencing around the sediment and the overlying water, direct a flow of treated
waste water on the sediment surface and measure the difference in chemical constituents
between inlet and outlet water. The detailed demonstration plan is soon to be ready and
resembles those outlined in Deliverable 2.1 delivered on 19 February 2015 (Annex 4).
Land owner under the influence of our demonstration action was found out and contacted
and his attitude was very positive. We will start the demonstration in Paroinen in summer
2015. Lauri Arvola, Jussi Huotari, and Tiina Tulonen (LBS) have been responsible of
planning and preparation of the demonstration in Paroinen.
Page 11
11
ACTION B2. Long term and model demonstrations of catchment scale N retention
Demonstration of long term changes in the water quality due to the protection actions in
heavily loaded river basins in southern Finland. Development of scenarios of nutrient
purification in waste water treatment and in agricultural production to mitigate nutrient
losses to waters and air.
1. Empirical analysis of lake water quality in the Vanajavesi drainage basin
In this task we analysed the reasons for long term changes in lake water quality in eight
lakes in the Vanajavesi drainage basin. The location of the lakes is presented in Figure 1.
We collected water quality data from the Hertta database and point source effluent data
from the Vahti database, which are both maintained in SYKE. Further, we calculated
agricultural nutrient loading to the lakes based on specific export coefficient values and
land use in sub catchments. Land use data was derived from CORINE2000, 2006 and
2012 databases. CORINE2000 land use data was used in analysis between years 1985
and 1999. Thus we have looked averages of five years in the analysis. Export coefficient
values are described in Annex 3 (Rankinen et al. 2014).
The collected water quality data included chlorophyll-α, total nitrogen (tot-N) and total
phosphorus (tot-P) concentrations in the uppermost 3 m depth in the lake (Figure 2). Tot-
P showed decreasing trend in several lakes, but tot-N were relatively stable. Chlorophyll-
α concentrations (chl-α) showed high variability between the periods.
Based on the external loading, lakes were divided into two sub-sets, headwater lakes
(Takajärvi, Renkajärvi, Kaartjärvi and Loppijärvi) and others located along the route of
the Vanajavesi (Pääjärvi, Mommilanjärvi, Kernaalanjärvi and Vanajanselkä). Headwater
lakes received no tot-N input from sewage treatment plants or other point sources. Waste
water input was highest in the early 1990’s and has been steadily decreased since then
(Figure 3). Also agricultural tot-N loading was smaller to the headwater lakes. Total N
concentrations reflected these inputs so that tot-N concentrations were lower in headwater
lakes (Figure 4). On the other hand, even though the median of chlorophyll-α
concentrations were lower in headwater lakes than in the others, the variation was high.
Pearson correlation between tot-N and chl-α was 0.499 at the 0.01 significance level.
Pearson correlation between tot-P and chl-α was even higher, 0.662 at the 0.01
significance level. Agricultural tot-N loading explained 29% of the variance in tot-N
concentrations between the lakes.
According to the preliminary statistical analysis by general linear models (SPSS), 47% of
the variance in tot-N concentrations in route lakes was explained by both agricultural and
waste water tot-N loading at the 0.05 significance level. But 44% of the variance in chl-α
was explained only by tot-N input in waste water at the 0.05 significance level. In the
headwater lakes agricultural tot-N loading explained 52% of the variance in tot-N
concentration at the 0.05 significance level. In headwater lakes agricultural tot-N loading
did not explain chl-α.
According to our preliminary conclusion, agricultural tot-N loading explained tot-N
concentration in lake water. Even though there was a significant relationship between tot-
Page 12
12
N and chl-α, chl-α was explained by tot-N input in waste water and/or some unknown
factors rather than agricultural tot-N loading.
This part of the work was done by Jose Cano Bernal, Marko Järvinen, Irina Bergström
and Katri Rankinen (SYKE).
We produced two deliverables:
• D3.1: Metadata description of available water chemistry and biology data from the
target areas
• D3.2: Demonstration of the effects of water protection on water quality in two heavily
loaded river basins in southern Finland, Lake Vanajanselkä and River Porvoonjoki
Figure 1. Location of the study lakes in the Vanajavesi drainage basin
Page 13
13
Figure 2. Nutrient and chlorophyll-α concentrations in the lakes
Figure 3. Trends in tot-N inputs to the lakes
Figure 4. Trends in tot-N and chlorophyll- concentrations based on lake type
Page 14
14
2. Model demonstrations of the N retention
Process based mathematical modelling is an effective method to give information of
possible future changes (scenarios), which are difficult or impossible to study in other
methods. Typical examples of applications are the study of the effect of a change in
climate or agricultural policy on water quality. On the other hand, these models are very
data demanding. Thus between different research projects is essential to ensure that the
information is available.
We used the semi-distributed catchment scale N model INCA to analyse in detail the
process rates. The INCA models are distributed, dynamic process-based models, which
can take into account in detail the variability of agricultural management practices, soil
types and point sources (see D3.3 and D7.2, Annex 4). Further, the INCA model allows
also running of agricultural and waste water treatment scenarios in connection to an
economical model. This is also essential for a cost-effective allocation of abatement
measures (see D 7.1, Annex 4). The next step then is to upscale INCA model scenario
results as export coefficients to a larger river basin by using the river basin scale model
WSFS-VEMALA in the Kokemäenjoki basin.
We selected one sub-basin (Mustajoki) in the Vanajavesi drainage basin and the whole
Porvoonjoki river basin to be modelled by the INCA model. Model application is based
on CORINE land use data and field parcel data of Mavi, data of point source effluents
from Vahti, and measured discharge and water quality in Hertta databases. We produced
preliminary model applications to both sub-basins (Figure 5a and b). We simulated the
effect of different fertilization levels on crop yield and nutrient leaching on agricultural
fields. That data was provided as input to economical optimization model in Action B3.
Figure 5a. Preliminary model calibration to the Porvoonjoki river basin
Page 15
15
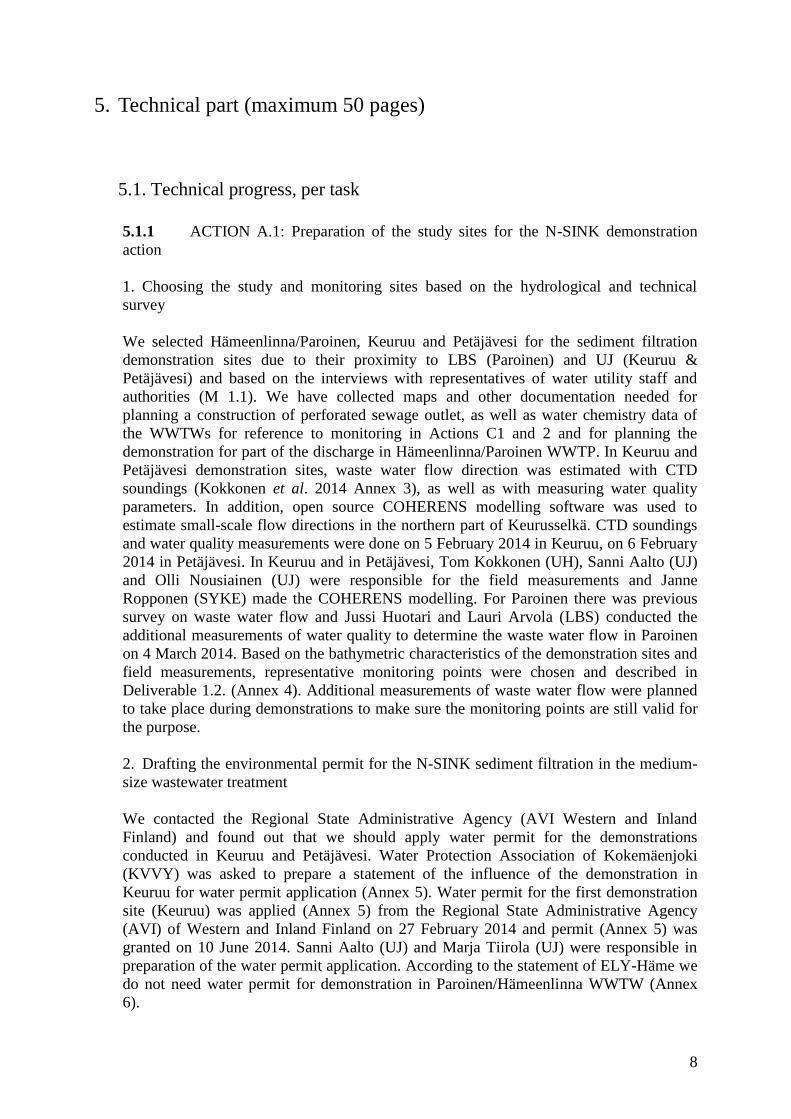
Figure 5b. Preliminary model calibration to the Mustajoki river basin
VEMALA is an operational, national scale nutrient loading model for Finnish
watersheds. It simulates nutrient (nitrogen and phosphorus) processes, leaching and
transport on land, and in rivers and lakes. It includes two main sub-models, the WSFS
hydrological model and the VEMALA water quality model (D3.3, Annex 1).
Within the N-SINK project, a new version of the model, VEMALA v.3, has been
developed to include the differentiation of total nutrients into bioavailable and non-
bioavailable nutrient species (D3.3, Annex 4). This development has been made in
cooperation with the Saaristomeri project (Saaristomeren valuma-alueen
kokonaiskuormitusmallin kehittäminen funded by the Finnish Ministry of the
Environment). The model has been developed into a more process-based model by
describing the biogeochemical processes affecting each nutrient species along its travel
from the headwaters to the Sea. The state variables included in VEMALA v.3 are oxygen,
nutrients (organic nitrogen ammonium and nitrate, phosphate, organic phosphorus and
inorganic particulate phosphorus), suspended sediments, total organic carbon and
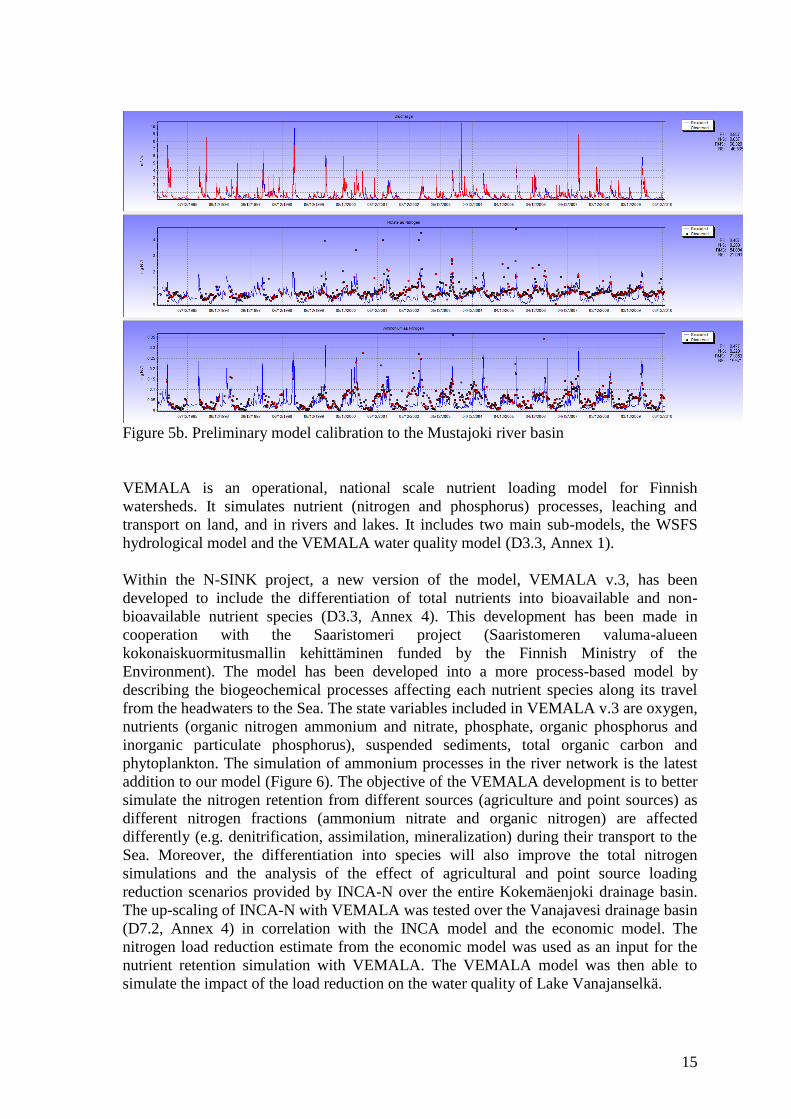
phytoplankton. The simulation of ammonium processes in the river network is the latest
addition to our model (Figure 6). The objective of the VEMALA development is to better
simulate the nitrogen retention from different sources (agriculture and point sources) as
different nitrogen fractions (ammonium nitrate and organic nitrogen) are affected
differently (e.g. denitrification, assimilation, mineralization) during their transport to the
Sea. Moreover, the differentiation into species will also improve the total nitrogen
simulations and the analysis of the effect of agricultural and point source loading
reduction scenarios provided by INCA-N over the entire Kokemäenjoki drainage basin.
The up-scaling of INCA-N with VEMALA was tested over the Vanajavesi drainage basin
(D7.2, Annex 4) in correlation with the INCA model and the economic model. The
nitrogen load reduction estimate from the economic model was used as an input for the
nutrient retention simulation with VEMALA. The VEMALA model was then able to
simulate the impact of the load reduction on the water quality of Lake Vanajanselkä.
Page 16
16
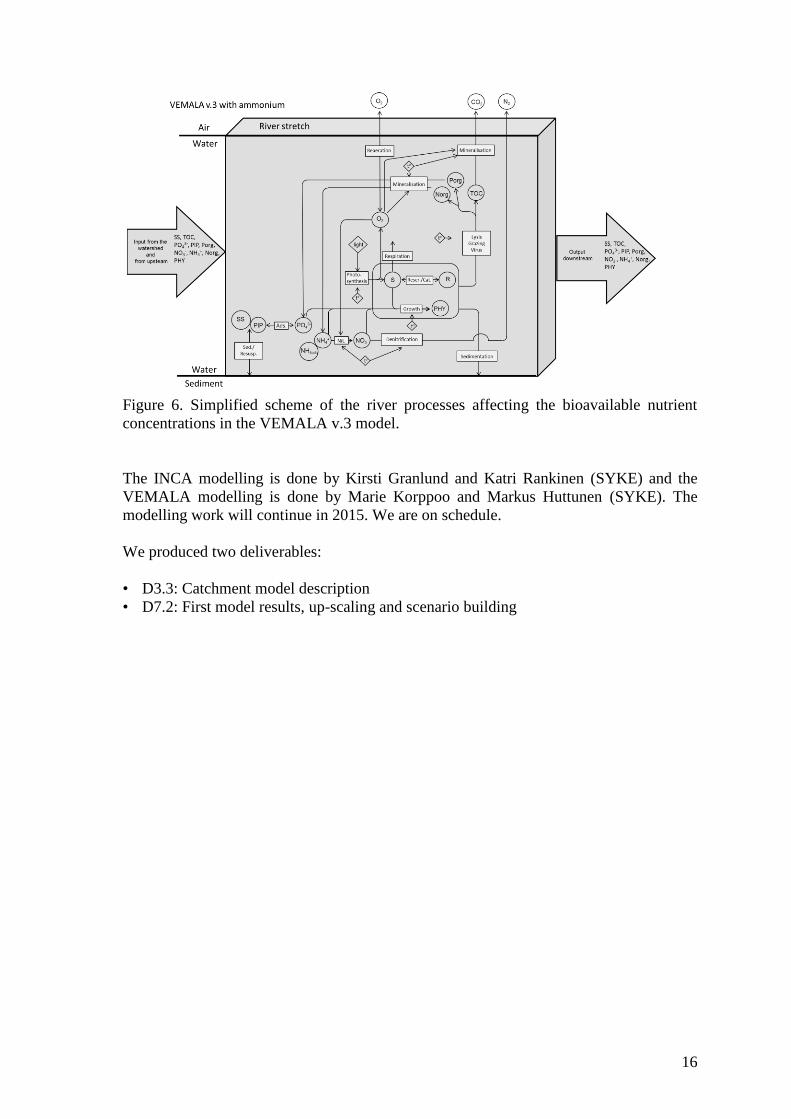
Figure 6. Simplified scheme of the river processes affecting the bioavailable nutrient
concentrations in the VEMALA v.3 model.
The INCA modelling is done by Kirsti Granlund and Katri Rankinen (SYKE) and the
VEMALA modelling is done by Marie Korppoo and Markus Huttunen (SYKE). The
modelling work will continue in 2015. We are on schedule.
We produced two deliverables:
• D3.3: Catchment model description
• D7.2: First model results, up-scaling and scenario building
Page 17
17
ACTION B.3: Demonstration of spatially cost-effective allocation of nutrient abatement
measures at watershed level
The main purpose of Action B.3 is to address the economic viability of sediment filtering
approach relative to other potential nutrient abatement measures that could be
implemented in Finland to protect lakes and the Baltic Sea. To this end, we have built a
model to address cost-efficiency of different abatement measures numerically, the main
attention being on the optimal spatial distribution of abatement measures. We began by
organizing a workshop with experts from the Finnish Environment Institute (M 4.1,
Annex 1), in which we exchanged ideas and started working on the outline of the spatial
model that combines economic and ecological approaches. We agreed on the spatial scale
and how outputs of INCA-N and VEMALA –models (Action B2) could be used as an
input of the economic-ecological model. We started first to work on the model for Lake
Vanajavesi catchment. This model will be later extended to cover Porvoonjoki catchment
according to the project plan. We wrote deliverable (D7.1, Annex 4) where we explain
the model which links economic and ecological approaches. Key point here is to
explicitly model yield function and nutrient losses from agriculture based on INCA-N
model, and combine that with estimates of retention for each sub-catchment, which are
based on VEMALA-model.
In the first modelling phase, we only introduced a single potential abatement measure,
reducing inorganic nitrogen fertilization that could be applied in different sub-catchments
of Lake Vanajavesi. Optimization model quickly becomes complex as the number of
control variables increases. Therefore, our results rely on an indirect approach: we know
that cost-efficiency requires that marginal costs of abatement are equal at the source. Our
algorithm is based on this first-order condition and finds the marginal cost at which the
given abatement targets are reached for a given water body. In this way we can solve the
cost-efficient allocation with several abatement measures that could be applied in each of
the fifty sub-catchments, totaling in several hundreds of choice variables, relatively
quickly. The first model results are introduced in the second deliverable 7.2 (D7.2, Annex
4). After this, we have focused on other abatement measures. In addition to the results of
our sediment filtration demonstrations, our plan is to use previous, published results of
abatement measures that are based on field experiments. We have started a literature
review on costs and effectiveness of new abatement measures, such as restoring wetlands,
improving the level of wastewater treatment in treatment plants, reducing waste from
scattered settlements and introducing reduced tillage. This literature review and the work
to introduce these new abatement measures as a part of the economic model are now
ongoing.
Lassi Ahlvik (MTT) has been responsible for the economic modelling. Tiina Kituniemi
has been the office secretary of the project, responsible for the financial management at
MTT. The first model version is now operation and the project is progressing as
scheduled.
M 4.1 Workshop 1 organized and reported
D7.1: Conceptual model of linking economic and ecological approaches
D7.2: First model results, up-scaling and scenario building
Page 18
18
5.1.3 Action C
UJ, LBS, DPHYS and SYKE had a meeting concerning the monitoring and modelling
actions of the demonstrations on 20 January 2014 in Jyväskylä.
ACTION C.1: Monitoring the ecosystem effects of sediment filtering in Lake
Keurusselkä
C.1.1: Monitoring denitrification and DNRA (unfavoured reduction of NO3 to NH4) rates
in the recipient lakes
In Keuruu and Petäjävesi, sediment samples were taken five times in 2014 (Table 1).
Sanni Aalto (UJ), Ville Juusela (UJ; Nessling Foundation stipendiate), Eveliina Kinnunen
(UJ) and Olli Nousiainen (UJ) were responsible of the field sampling. Sampling was done
from the points described in D1.2 (Annex 4). For measurement of denitrification and
DNRA, 9-17 sediment cores were taken per sampling trip. Cores were incubated with 15
NO3 in laboratory following IPT-method and produced N2 gas was later measured with
isotope ratio mass spectrometer [Isoprime IRMS (Isotope-Ratio Mass Spectrometry)]. To
measure DNRA, additional acid trapping was done, after which the concentrations of
labelled ammonium (15
NH4) were measured with IRMS (Thermo). Sanni Aalto (UJ) and
Marja Tiirola (UJ) have analysed and calculated all N2 results for 2014, except the results
from the last two sampling occasions (14 and 16 October 2014). Sanni Aalto (UJ), Ville
Juusela (UJ; Maj and Tor Nessling Foundation stipendiate) and Eveliina Kinnunen (UJ)
have prepared all DNRA samples and calculated the final results from the first two
sampling occasions (11 and 13 February 2014).
Table 1. Details on the field sampling done in Keuruu and Petäjävesi in 2014.
Date
Number of
sampling points
No of Denitrificati
on samples
No of DNRA sampl
es
No of N2O
samples
No of NO2+3 sampl
es
No of PO4/NH4 samples
Keuruu 11.2.2014 3 15 3 15 3 3
6.5.2014 5 17 5 17 5 5
26.6.2014 9 9 5 9 9 5
4.8.2014 9 9 5 9 9 5
14.10.2014 9 9 5 9 9 5
Petäjävesi 13.2.2014 3 15 3 15 3 3
8.5.2014 5 17 5 17 5 5
11.6.2014 9 9 5 9 9 5
13.8.2014 9 9 5 9 9 5
16.10.2014 9 9 5 9 9 5
C.1.2: Monitoring N2O production rates in the recipient lakes and wastewater treatment
plants
Page 19
19
For Keuruu and Petäjävesi, N2O production rates were measured from the same sediment
core samples than denitrification and DNRA (Table 1). Sanni Aalto, Ville Juusela and
Marja Tiirola (UJ) collected gas samples from IPT-incubations and measured them with
Isoprime IRMS. The amount of samples per sampling was 9-17 (Table 1). All N2O
samples were analysed and results calculated during 2014. Measurements in waste water
treatment plants will be made during years 2015 and 2016. Sanni Aalto participated the
Training days for waste water treatment plant operators and managers on 29 – 30 October
2014, where one of the focus areas was nitrogen removal at waste water treatment plants.
C.1.3: Monitoring other physical and biological parameters in the recipient lake and
wastewater treatment processes
Oxygen, pH, conductivity and temperature were measured at one meter vertical intervals
from each sampling point in every sampling occasion. Nitrate concentration was
measured from each sampling point and phosphate and ammonium from the first 3-5
points (Table 1). Sanni Aalto (UJ), Ville Juusela (UJ; Maj and Tor Nessling foundation
stipendiate), Eveliina Kinnunen (UJ) and Olli Nousiainen (UJ) were responsible of the
monitoring of physical and biological parameters.
Page 20
20
ACTION C.2: Monitoring the ecosystem effects of sediment filtering in Lake Vanajavesi
C.2.1: Monitoring denitrification and DNRA (unfavored reduction of NO3 to NH4) rates
in the recipient lakes
Jussi Huotari (LBS) joined UJ team in Jyväskylä to learn sample preparation for IPT
denitrification measurement on 9 May 2014. We started monitoring in Lake Vanajavesi
on 2 September 2014, somewhat later than foreseen in the proposal but this has no effect
on achieving the objectives. The monitoring points are described in D2.1 (Annex 4).
Denitrification activity was measured two times in 2014 the second time being on 19
November. We ceased denitrification activity measurements during ice covered period
and will start again after the ice-off; also DNRA measurements will be included then.
Jussi Huotari (LBS), Tiina Tulonen (LBS) and Nessling Foundation stipendiate Sari
Uusheimo (LBS) were responsible for denitrification measurements.
C.2.2: Monitoring N2O production rates in the recipient lakes and wastewater treatment
plants
Monitoring started little later than foreseen in the proposal because we waited a new gas
chromatograph for measurements of N2O, CH4 and CO2 to be operational at LBS. This
delay has no effect on other actions or on achieving the objectives of the project. We
started measuring dissolved N2O concentration of water as well as other two main
greenhouse gases, CO2 and CH4 on 2 September 2014 and continued sampling in every
three weeks. Monitoring points are presented in D2.1 (Annex 4). Approximately monthly
sampling was planned during the ice covered seasons continuing with a three weeks
interval after the ice-off. N2O production rate measurements will be started after the ice-
off. Jussi Huotari, Leena Vitie and Lauri Arvola (LBS) have been responsible for the
measurements.
Jussi Huotari (LBS) participated the Training days for waste water treatment plant
operators and managers on 29 – 30 October 2014, where one of the focus areas was
nitrogen removal at waste water treatment plants. We planned to start N2O measurements
at Paroinen WWTP in the beginning of the year 2015 monitoring with interval of three
weeks (started on 19 January 2015).
C.2.3: Monitoring other physical and biological parameters in the recipient lake and
wastewater treatment processes
Water quality measurements are conducted at the same time with the N2O measurements
in Lake Vanajavesi. Monitored parameters include concentrations of nitrite and nitrate,
ammonium, total nitrogen, phosphate, total phosphorus, chl-a, dissolved organic carbon
and dissolved oxygen as well as measurements of pH, conductivity and water
temperature.
We proposed to estimate the CO2 emissions in the project plan. We have been trying to
reduce CO2 emissions of the project by walking, cycling or using public transportation on
way to work as much as possible instead of using private cars. For the present we have
estimated the CO2 emissions only of the travels solely related to the project and presented
in the financial report. We estimate that our carbon footprint has been 3.21 metric tons of
Page 21
21
CO2 due to those travels (Annex 7). These estimates are based on net calculator at:
http://www.carbonfootprint.com/calculator.aspx
Page 22
22
5.2 Dissemination actions
5.2.1 Objectives
Project results have been planned to disseminate as presentations in national and
international seminars, as well as in scientific papers and popular newspaper articles. All
results and other documentation of the project are available through the project webpages.
Many key stakeholders are involved in the project through project steering and advisory
board and will help in disseminating the results.
5.2.2 Dissemination: overview per activity
For communication and dissemination, we opened project www-pages (D8.1;
http://www.helsinki.fi/lammi/NSINK/index.html) on 20 September 2013. All the reports,
instructions, appearances in media etc. documentation are shared among partners,
stakeholders and all other interested individuals in www-pages. Project coordinator
maintains the pages. LIFE+ notice board was given out to partners and SAB members (14
May 2014) as well as delivered to demonstration WWTPs to be put on display to public
at their premises. LIFE logo has been used in project related documents.
So far the dissemination activity has mostly been intended to increase the general
awareness of the project. Presentations have been given in international workshops and
meetings (Beijing, China; Vienna, Austria; Kuching, Malaysia; Olsztyn, Poland) and in
local events (Hausjärvi-Riihimäki Rotary Club event; Pellavamarkkinat, fair in Lammi;
Rowing competition event in Lammi; field course at Lammi Biological Station). Also
two presentations about N-SINK related results have been given (Otepää, Estonia;
Singapore) and one scientific paper published. Five newspaper articles and one in the
customer magazine of Hämeenlinnan Seudun Vesi Oy have been published (Annex 3).
Following list shows the details of the dissemination activity as well as who was
responsible of the activity. In addition to that, Jussi Huotari (LBS) and Sanni Aalto (UJ)
participated in the Training days for waste water treatment plant operators and managers
on 29 – 30 October 2014 and had discussions about the project with other participants.
Workshops and Meetings
- 30 September – 2 October 2013, NordSIR meeting, Otepää, Estonia (Ville Juusela, Maj
and Tor Nessling Foundation stipendiate)
- 24 October 2013, Mid-term Workshop on CAS – AF Cooperative Projects, Beijing,
China. (Lauri Arvola, LBS)
- 18 November 2013, Hausjärvi-Riihimäki rotary club's -"Itämerihanke, valuma-
aluekäsite" event (Lauri Arvola, LBS)
- 28 April 2014, EGU meeting, Vienna, Austria (Sanni Aalto, UJ)
- 14 June 2014, Lammi Pellavamarkkinat, fair (Lauri Arvola, LBS)
- 1 July 2014, Biogeography of Biotransformations for Halogenated Organic Compounds:
A Comparison of the Tropics, Temperate, and Sub-Arctic Environments –course,
Lammi (Jussi Huotari, LBS)
- 19 July 2014, Mommilanjärven soutelu, rowing competition event (Lauri Arvola, LBS)
- 11 – 15 August 2014, IAHR Symposium, Singapore (Tom Kokkonen, DPHYS)
- Annex 3, Kokkonen, Aalto & Leppäranta 2014. Action A1.
- 11 September 2014, ICUD2014, Kuching, Malaysia (Jussi Huotari, LBS)
- Annex 3. Huotari et al. 2014
Page 23
23
- 23 – 24.10.2014, International Joint Conference - History, culture and nature of the
Baltic Sea Region, Olsztyn, Poland (Lauri Arvola, LBS)
Scientific Journal Articles (Annex 3)
- Arvola, L., Einola, E. & Järvinen, M. 2015. Landscape properties and precipitation as
determinants for high summer nitrogen load from boreal catchments. Landscape
Ecology, DOI 10.1007/210980-015-0166-8.
Press cuttings (Annex 3)
- Hämeensanomat 14 August 2013(Lauri Arvola, LBS)
- Vesimittari 1/2013 (Lauri Arvola, LBS)
- Hämeensanomat 17 August 2014 (Jussi Huotari, LBS)
- Suur-Keuruu 25.9.2014 (Sanni Aalto, UJ)
- Suur-Keuruu 20.10.2014 (Sanni Aalto, UJ)
- project web site: http://www.helsinki.fi/lammi/NSINK.html (maintenance: Jussi
Huotari, LBS)
5.3 Evaluation of Project Implementation
To be evaluated in the Final Report.
5.4 Analysis of long-term benefits
To be discussed in the Final Report.
Page 24
24
Table 2. Gantt chart illustrating the proposed and actual progress of the planned actions. Tasks/
Activities
2013 2014 2015 2016 2017
1T 2T 3T 4T 1T 2T 3T 4T 1T 2T 3T 4T 1T 2T 3T 4T 1T 2T 3T 4T
Overall project schedule
Proposed
O
O
X
O
Actual
Action A1 Proposed
Actual
Action B1
Action B2
Proposed
Actual
Action B3
Action C1
Proposed
Actual
Action C2
Action C3
Action D Proposed
Actual
Action E Proposed
Actual
Start date Mid-Term End date
X=Progress reports
Page 25
25
6. Comments on the financial report
6.1. Summary of Costs Incurred
Currently, we do not expect any budget categories to exceed 30,000€ flexibility limit.
The prototype costs were higher than expected in the budget. 25% of the prototype costs
of Keuruu will be paid later after disassembling the filtration system and the budgeted
sum is not enough to build another filtration system in Petäjävesi. However, the filtration
system in Petäjävesi is expected to cost much less due to its smaller size than the one in
Keuruu and total Prototype costs are not expected to exceed 30,000€ flexibility limit.
Costs incurred in ‘Other costs’ consist of e.g. participation costs, which were included in
Travel expenses in the budget but now marked in Other costs.
Only University of Helsinki (LBS, DPHYS) is able to recover VAT. For other
beneficiaries declarations from the tax office are annexed (Annex 8)
PROJECT COSTS INCURRED
Cost category Budget according to the
grant agreement*
Costs incurred within
the project duration
%**
1. Personnel 1,053,941 314,548 29.8
2. Travel 25,000 7,115 28.5
3. External assistance 21,000 11,301 53.8
4. Durables: total non-
depreciated cost
25,000 21,975 87.9
- Infrastructure sub-
tot.
- Equipment sub-tot.
- Prototypes sub-tot. 25,000 21,975 87.9
5. Consumables 20,101 2,014 10.0
6. Other costs 0 2,206
7. Overheads 43,218 17,712 41.0
TOTAL 1,188,260 376,879 31.7
*) If the Commission has officially approved a budget modification indicate the breakdown of the revised budget
Otherwise this should be the budget in the original grant agreement.
**) Calculate the percentages by budget lines: e.g. the % of the budgeted personnel costs that were actually
incurred
6.2. Accounting system
All beneficiaries have electronic invoice handling and archiving systems. Once an
invoice is saved/scanned into the system, a routing process for approval begins, based on
Page 26
26
the unique cost codes of the project. Invoices are certified by authorized persons (project
managers or head of units). The project codes as well as electronic accounting and time
recording systems of each beneficiary are:
Project code Accounting system Time recording
system
LBS 4013081, 4703537,
75773112
SAP Sole TM
DPHYS 4013082,
752851141
SAP Sole TM
UJ 2100002385 SAP Sole TM
SYKE XYN3253, (P00656
1.1.2015 onwards)
AdeEko+,
(Raindance 1.1.2015
onwards)
TAIKA, TAUNO
1.6.2014 onwards
MTT 21230040 AdeEko Sole TM
When invoices are approved they are routed for payment and archived with all relevant
documentation. Financial secretaries review the project accounts to ensure costs have
been recorded correctly.
All beneficiaries have electronic time recording system. Employees record their working
time in the system on a daily basis, which is then approved by the authorized person on a
weekly or monthly basis.
All personnel are instructed to give suppliers official reference to the project, i.e. LIFE12
ENV/FI/597 N-SINK. The reference can be also added to invoices when handled in the
electronic system. If invoice is missing the reference it is stamped to invoices by
coordinating beneficiary.
6.3. Partnership arrangements (if relevant)
Coordinating beneficiary transfer pre-finances of the Commission as well co-finances to
associated beneficiaries according to shares defined in the budget shortly after receiving
the money. Co-financiers’ contributions are invoiced in four equal parts in Decembers
2013 – 2016, except from the Ministry of the Environment, whose contribution is invoiced
twice; in 2014 and 2015 after submitting the Mid-Term Report, according to the
instructions by the Ministry of the Environment. All beneficiaries enter the information in
the financial tables themselves and deliver the tables with the supporting documentation to
coordinating beneficiary, who check the material delivered.
6.4. Auditor's report/declaration
Currently, University of Helsinki has a contract with PwC Julkistarkastus Oy, (postal
address: P.O. Box 1015, 00101 Helsinki). The auditor’s report will be included in the
Final Report.
Page 27
27
6.5 Summary of costs per action
Action no.
Short name of action
1. Personnel
2. Travel and subsistence
3. External
assistance
4.a 4.b 4.c Prototype
6. Consumables
7. Other costs
TOTAL
A1 Preparation of the study
sites
23564.9
995.2 1610.0 12.4 533.6 26716.1
B1
N-SINK sediment filtration
demonstrations
30710.2 7211.0 21975.0 101.9 59998.0
B2
Long-term and model
demonstrations of
catchment scale N
retention
59515.4 1261.0 103.1 60879.4
B3
Cost-effective
allocation of nutrient
abatement measures at
watershed level
29405.0 91.8 29496.8
C1
Monitoring the
ecosystem effects of sediment
filtering in Lake
Keurusselkä
51068.6 2017.0 2480.0 14.8 55580.4
C2
Monitoring the
ecosystem effects of sediment
filtering in Lake
Vanajavesi
15402.1 1627.2 1467.61 18496.9
C3
Verification of
catchment scale N
retention models
0
D1
Communication and
dissemination
3388.2 155.0 3543.2
D2
Development of after
Life communicat
ion plan
0
E1
Project managemen
t and monitoring
of the project
progress
101493.36
2750.1
204.7 104448.2
Over-heads
17719.6
TOTAL 314547.7 7115.1 11301.0 0 0 21975.0 2014.3 2205.9 376878.6
Page 28
28
Costs incurred in Cost Category 6 consist of participation costs, which were included in
Travel expenses in the budget but now marked in Other costs. No other discrepancies so
far exist between this table and the one set in the grant agreement. Annex 8. contains the
same information in Excel format.
7. Annexes
7.1 Administrative annexes
Annexes submitted to the Commission with the Inception Report
o Partnership agreement
o LIFE+ notice board
o Kick off meeting minutes
Annex 1. Meeting reports: SAB, Workshop M4.1 (electronic form only)
7.2 Technical annexes
Annex 4. Deliverables
o D 1.2, Description of the flow direction and monitoring points
o D 2.1, N-SINK sediment filtration demonstrations: Progress report
o D 3.1, Metadata description of available water chemistry and biology data
from the target areas
o D 3.2, Demonstration of the effects of water protection on water quality in
two heavily loaded river basins in southern Finland, Lake Vanajanselkä and
River Porvoonjoki
o D 3.3, Catchment model description
o D 7.1, Conceptual model of linking economic and ecological approaches
o D 7.2, First model results, up-scaling and scenario building
Annex 5. Documents related to demonstration in Keuruu (electronic form only)
o Water permit application
o Report of KVVY
o Water permit
o Construction plan and hydraulic modelling
o Detailed construction plan
o Tender invitation
o Decision of procurement
Annex 6. ELY statement (electronic form only)
Annex 7. Carbon footprint estimate (electronic form only)
Annex 9. Keywords and abbreviations
Annex 10. English summaries to Annexes in Finnish (electronic form only)
Page 29
29
7.3 Dissemination annexes
7.3.1 Layman's report
To be submitted with the Final Report
7.3.2 After-LIFE Communication plan – for LIFE+ Biodiversity and LIFE Environment
Policy and Governance projects
To be presented in the Final Report
7.3.3 Other dissemination annexes
Annex 3. Dissemination material
o Press cuttings
o Aalto et al. EGU 2014
o Arvola et al. Landscape ecology 2015
o Huotari et al. ICUD 2014
o Kokkonen et al. IAHR 2014
o Rankinen et al. 2014
7.4 Final table of indicators
To be included in the Final Report
Page 30
30
_________________________________________________________________
8. Financial report and annexes
- Annex 8. Financial tables and documents
o Payment Request
o Consolidated Cost Statement for the Project
o Financial Statements of Individual Beneficiaries
o Financial excel tables (electronic form only)
o Costs incurred per actions (electronic form only)
o VAT declarations (electronic form only)
o Report of the formation of laboratory costs at Lammi Biological Station
(electronic form only)
o Price list of the Lammi Biological Station confirmed by Dean of the Faculty
(electronic form only)
- At this point, Contribution of the beneficiaries seems to be much lower than foreseen in
the budget due to the way it is calculated in the form. In the Final report when all costs
and funding will be reported Contribution of the beneficiaries will be according to the
budgeted.
- Financial reporting form of LBS includes laboratory analysis costs where supplier is
University of Helsinki. For projects which pay overheads to Lammi Biological Station
these are non-profit costs including only direct costs consisting of material and
chemical expenses and taking into account a need of service and replacement of the
equipment used as well as a need for guidance related to working in the laboratory. If
laboratory personnel makes the analysis their work is also included in costs (Annex 8, in
Finish, LBS report of the laboratory prices)
- Annex 2. Clarification of Ms Tiirola ERC Consolidator Grant (electronic form only)
o Declaration
o ERC Grant Agreement for Consolidator Grant
o Timesheets
o Salary slips
o Proof of payment
- In the Inception Report we expressed our need for additional external funding for
expensive laboratory analysis due to budget cut in the late phase of the application
process. We applied additional funding from FIWA who granted 10 000 euros to
support denitrification and N2O determinations, which results can be used in the project.
We consider the need and possibilities of re-allocation funds from personnel and/or
travel expenses to laboratory analysis or look for other possibilities to apply.