LBNL-6152E Lighting energy savings potential of split- pane electrochromic windows controlled for daylighting with visual comfort L.L. Fernandes Lawrence Berkeley National Laboratory E.S. Lee Lawrence Berkeley National Laboratory G. Ward Anyhere Software Windows and Envelope Materials Group Building Technology and Urban Systems Department Environmental Energy Technologies Division February 2013 Published in Energy and Buildings 61 (2013) 8-20 10.1016/j.enbuild.2012.10.057
Transcript
LBNL-6152E
Lighting energy savings potential of split-pane electrochromic windows controlled for daylighting with visual comfort L.L. Fernandes Lawrence Berkeley National Laboratory E.S. Lee Lawrence Berkeley National Laboratory G. Ward Anyhere Software Windows and Envelope Materials Group Building Technology and Urban Systems Department Environmental Energy Technologies Division February 2013 Published in Energy and Buildings 61 (2013) 8-20 10.1016/j.enbuild.2012.10.057
!
DISCLAIMER
This document was prepared as an account of work sponsored by the United States Government. While this document is believed to contain correct information, neither the United States Government nor any agency thereof, nor The Regents of the University of California, nor any of their employees, makes any warranty, express or implied, or assumes any legal responsibility for the accuracy, completeness, or usefulness of any information, apparatus, product, or process disclosed, or represents that its use would not infringe privately owned rights. Reference herein to any specific commercial product, process, or service by its trade name, trademark, manufacturer, or otherwise, does not necessarily constitute or imply its endorsement, recommendation, or favoring by the United States Government or any agency thereof, or The Regents of the University of California. The views and opinions of authors expressed herein do not necessarily state or reflect those of the United States Government or any agency thereof or The Regents of the University of California.
!
Published in Energy and Buildings 61 (2013) 8-20. 10.1016/j.enbuild.2012.10.057.
Lighting energy savings potential of split-pane electrochromic windows controlled for daylighting with
visual comfort
L.L. Fernandesa,*
aBuilding Technology and Urban Systems Department, Environmental Energy Technologies Division, Lawrence Berkeley National Laboratory, Mailstop 90-3111, 1 Cyclotron Road, Berkeley, CA
USA
bAnyhere Software, 950 Creston Rd., Berkeley, CA USA
, E.S. Leea, G. Wardb
Abstract A simulation study was conducted to evaluate lighting energy savings of split-pane electrochromic (EC) windows controlled to satisfy key visual comfort parameters. Using the Radiance lighting simulation software, interior illuminance and luminance levels were computed for a south-facing private office illuminated by a window split into two independently-controlled EC panes. The transmittance of these was optimized hourly for a workplane illuminance target while meeting visual comfort constraints, using a least-squares algorithm with linear inequality constraints. Blinds were successively deployed until visual comfort criteria were satisfied. The energy performance of electrochromics proved to be highly dependent on how blinds were controlled. With hourly blind position adjustments, electrochromics showed significantly higher (62% and 53%, respectively without and with overhang)lighting energy consumption than clear glass. With a control algorithm designed to better approximate realistic manual control by an occupant, electrochromics achieved significant savings (48% and 37%, respectively without and with overhang). In all cases, energy consumption decreased when the workplace illuminance target was increased. In addition, the fraction of time during which the occupant had an unobstructed view of the outside was significantly greater with electrochromics: 10 months out of the year versus a handful of days for the reference case.
Keywords: Building energy-efficiency; Daylighting; Control optimization, Electrochromic windows. 1. Introduction Electrochromics (EC) are glazings whose optical transmittance can be controlled via a small applied electric potential. This is potentially useful in managing the admission of daylight into buildings, since they can be darkened when too much of it causes glare and be made lighter when more is needed to illuminate the interior space. Without the aid of shading devices, however, electrochromics on their own cannot provide visual comfort in extreme glare situations such as when the sun is visible through the window. The deployment of these shading devices can cause significant increases in lighting energy use since occupants tend to leave shades down long after the period of visual discomfort has passed [1]. It appears then that the maximization of the lighting energy saving potential of EC windows would require them to be controlled for visual comfort first and only then for providing daylight to the space, thus minimizing shading deployment. A field study had been conducted with large-area EC windows, but the control algorithm provided less than optimal visual comfort control [2]. The study presented here was conducted to explore the potential of this strategy. Given the difficulty of implementing experimentally the chosen optimization algorithm for control of electrochromic glass and Venetian blinds based on visual comfort, a computer simulation approach was in order. To maximize the admission of daylight to the
* Corresponding author. Lawrence Berkeley National Laboratory, MS 90R3111, 1 Cyclotron Rd, Berkeley, CA 94720, USA. Tel.: +1-510-495-8892. Fax: +1-510-486-4089.
2
space without decreasing visual comfort, the electrochromic window here considered had two independently-controlled panes, the bottom one for view and the top one for daylight. The effect of adding an overhang to the façade is also studied, in order to determine if this very common type of exterior shading reduces the need for interior shading device deployment.
Previous simulation studies of energy impacts of electrochromics have tended to use a single transmittance for the whole window, had varying degrees of consideration of visual comfort in their operation, and most did not consider the impact of occupant deployment of blinds due to visual discomfort. Sullivan et al. [3] evaluated three control strategies. The first was to set EC transmittance to maintain work plane illuminance. In the second strategy, the windows were maintained in their darker state above a certain incident vertical global irradiance threshold, and in their lighter state when incident global irradiance was below a lower threshold level. Between the two irradiance thresholds, EC transmittance was interpolated linearly between the lightest and darkest state. The third strategy was to switch the EC to its darkest state whenever there was a cooling load during the previous hour. Workplane illuminance maintenance was also used by Moeck et al. [4] in their assessment of visual quality in spaces daylit through EC windows. Karlsson et al. [5] used control according to vertical global irradiance, similarly to Sullivan. Later, Karlsson added control based on indoor air temperature, also taking occupancy into account [6]. When the space was unoccupied (25% of the time, randomly distributed), the window was darkened above a high temperature setpoint, and set at its lightest state below a low temperature setpoint. Jonsson and Roos [7] also considered occupancy. When the space was unoccupied, the control algorithm kept the windows dark when there was need for cooling and light when there was need for heating, otherwise the electrochromics were controlled to maintain transmitted vertical irradiance below a setpoint.
In none of the above control methods was it intended to address visual comfort. Therefore, these
methods would not, by themselves, suit the purpose of this study. Other work was conducted in which visual comfort was considered, directly or indirectly. In subsequent studies [8,9], Jonsson and Roos refer to a control method similar to that described in [7], i.e. maintaining transmitted vertical irradiance above a setpoint, as a strategy to control discomfort glare. While this could address visual comfort in some situations, it does not, for example, tackle the issue of direct sun visibility. Furthermore, the effect of operable shading devices on lighting energy consumption was not part of the scope of the study. Platzer [10], in addition to considering EC control based on room air temperature, exterior vertical irradiance, or window luminance, also assumed that a roller shade was deployed whenever glare conditions were present. The article does not specify which criteria for glare were used. In a similar study [11], Venetian blinds were used instead. They were deployed to prevent direct sun reaching the occupants’ eyes, and then closed further until the façade luminance was below a luminance setpoint. Assimakopoulos et al. [12, 13] used several EC control techniques similar to those already described above, but also introduced the use of two sophisticated control techniques that do not require detailed knowledge of the underlying physical processes: an adaptive neuro-fuzzy inference system (ANFIS) [12, 13] and proportional-integral-derivative (PID) control [13]. The ANFIS system used average window luminance, workplane illuminance, vertical solar irradiance and indoor temperature as independent variables. This kind of system requires a dataset for the algorithm to “learn”. In these cases, data was used from experiments in which the electrochromics were controlled by an expert [12] or test subjects [13]. Gugliermetti et al. [14] used the Daylight Glare Index (DGI) [15] to determine vertical solar irradiance setpoints for EC switching.
For the simulation study presented in this paper, and given the focus on lighting energy savings,
electrochromics were controlled to maintain workplane illuminance. This is similar to Sullivan’s first control strategy [3], with two differences. One is that here two windowpanes are controlled independently. The other is that two visual comfort criteria are used to constrain EC control: luminance ratios between visual task and surrounding environment, and vertical illuminance at the occupant’s eye. Regarding blind deployment, an approach similar to Platzer’s [11] is taken, with the additional constraint of vertical illuminance at the eye. Maintaining workplane illuminance can be performed by a simple linear algorithm, and that was the approach chosen here. Constraints on the chosen visual comfort metrics could be directly put in linear form (vertical illuminance) or were easily linearlizable (luminance ratios), which would not have been possible if more mathematically complex visual comfort metrics, such as DGI, had been used.
3
2. Methodology 2.1 Research design
This study is aimed at determining if electrochromic windows can be controlled to provide lower lighting energy consumption than ordinary windows, while maintaining occupant visual comfort. The independent variables considered here are glazing type (ordinary or electrochromic), presence of overhang, workplane illuminance setpoint for electrochromic control (600, 800 or 1000 lx) and Venetian blind control frequency (hourly or daily). The dependent variable is annual lighting energy use, obtained by climate-based hourly computer simulation for Oakland, California, which has a Mediterranean climate. For daylight hours, the sky is clear, intermediate and overcast during 3%, 39% and 57% of the time, respectively, according to the criteria in Table 1.
The electrochromic window configuration chosen for this study has two independently-controlled
panes, one at the top of the window for daylight admission and the other, larger, at the bottom for view. Both for electrochromic and ordinary windows, Venetian blinds were controlled to block direct sunlight penetration and provide occupant visual comfort.
The computer simulation approach, based on Radiance, a lighting calculation and image rendering
computer program [16] is sketched in Figure 1. Coefficients representing the relationship between the luminous flux originating in an array of solar positions and discrete portions of the sky dome are pre-computed. They are then used to efficiently calculate the lighting conditions in the space for each daylight hour of the year. In each of these hourly timesteps, an optimization algorithm determines the window configuration that will maximize daylight admission while providing visual comfort. The contribution of the electric lighting system that is necessary to maintain workplane illuminance is also calculated. This process is described in more detail in the following sections.
Table 1. Definition of sky types
CIE Sky Type Condition Clear Direct normal irradiance is more than 200% of diffuse horizontal Intermediate Direct normal is between 5% and 200% of diffuse Overcast Direct normal is less than 5% of diffuse
Figure 1. General structure of computer simulation approach. The precomputation phase reduces the computation time of the annual hourly simulation phase.
4
2.1.1 Lighting simulation A daylight coefficient approach, similar to the work of Reinhart and Walkenhorst [17], is employed
in order to enable rapid evaluation of different skies for each blind and overhang configuration. For each configuration, calculations are performed and images rendered for the partial contributions of 145 solar positions and 145 sky patches, distributed according to Tregenza and Waters’ original proposal [18]. The Radiance command rtcontrib is used to calculate the sky patch contributions. A single patch is included for the ground contributions outside the local surface that captures shadows from the building structure. Figure 2 shows the lighting contributions from a single sky patch and its corresponding solar position, as seen from the occupant's point of view. This view is implemented in Radiance as a 180° hemispherical "fisheye" view centered on the VDT.
Figure 2. Contributions through the lower glazing from sky patch 045 and the matching solar position with blinds fully deployed at 20° with overhang.
The calculations take 76 different configurations into account. To enable simulation of the independent control of the two electrochromic window panes, the effect of each pane needs to be calculated separately. For each of these, calculations are performed for each one of the 19 blind positions (fully open, deployed over the top pane with nine possible slat angles, or deployed over both panes with nine possible slat angles). Finally, each configuration is considered with and without the overhang, which doubles the total number of calculation runs again.
Each calculation takes three interreflections (ambient bounces) into account, as the principal concern
is a comparison metric for this case study, and not high absolute accuracy. Although this is probably not optimal, even for a relatively shallow space such as this, previous simulations have shown that increasing the number of bounces only increases the overall levels rather than the distribution of light. The advantage of this is a significant decrease in calculation time, since the calculations take two weeks on a render farm consisting of 8 nodes with two AMD Opteron 246 2.0 GHz processors each. These nodes run the FreeBSD operating system.
The daylight coefficients thus calculated are used according to sky luminance distribution and sun
position for a particular time, date and location, as long as solar radiation data is available. The sky luminance distribution is determined from one of the three CIE sky models: Clear, Intermediate or Overcast. For a particular time, the model used is selected by evaluating the solar radiation data according to the conditions presented in Table 1. For CIE Clear or Intermediate sky types, the sun is also simulated. The luminances of the sky model and of the sun are calibrated according to the diffuse horizontal and direct normal irradiances. A quick ray tracing sample is then taken of the selected sky model to determine the multiplier for the daylight coefficient corresponding to each sky patch.
5
Figure 3(left). Combined result on Dec. 21 at 12 noon using TMY data for Oakland. Figure 4 (right). General view of the office.
Sixty-four samples are taken within each patch and then averaged, to account for local luminance variations. For the direct solar component, the four precomputed solar positions that are the closest to the actual sun position are found and the respective four daylight coefficients are interpolated bilinearly. This was found to be adequate for simulations with Venetian blinds in a previous daylight coefficient study [17], and preliminary experiments confirmed it to be suitable for this study. Figure 3 shows the combined result based on TMY weather data for Oakland, California on December 21 at noon. This image component calculation is reasonably fast, taking less than 10 seconds on a single CPU.
2.2 Space
The space chosen for this study is a one-person office situated in the Windows Test Facility of the
Lawrence Berkeley National Laboratory, in Berkeley, California, containing typical office furniture (Figure 4). It is 4.57 m (15 ft) deep and 3.05 m (10 ft) wide, and measures 2.74 m (9 ft) from floor to ceiling.
The space was modeled in Radiance with surface reflectance of 0.20, 0.50 and 0.70 for the floor,
walls and ceiling, respectively. An L-shaped desk, whose work surface has a reflectance of 0.41, is located in the southwest corner. A 43-cm (17-in) LCD visual display terminal (VDT) sits on the desktop. Two sheets of white paper (0.75 reflectance) modeled on both sides of the VDT serve as placeholders for illuminance calculations. The occupant is considered to be seated at the desk, facing and looking at the VDT. The viewpoint is 1.22 m (4 ft) above the floor, 1.52 m (5 ft) away from window, and 1.22 m (4 ft) away from the facing wall.
The space has a single, south-facing window, which is divided into two panes. The upper pane has
the purpose of admitting daylight and the lower one to provide view. Based on the properties of currently-available technology, the transmittance of the electrochromics can vary between 0.05 and 0.60. The reference window has a transmittance of 0.60. The window has no exterior obstructions and is equipped with interior Venetian blinds. The slats are white, 2.54-cm (1-in) wide and spaced 1.78 cm (0.7 in) apart. Slat reflectance is 0.85 with a specularity of 1%. Three blind heights were modeled: 1) fully retracted, 2) covering the top window pane only and 3) covering the whole window. Slat angles start at 0° (horizontal) and go up to 80° (downward towards the exterior) in 10° increments. The space was also modeled with an overhang placed at the height of the division between the upper and lower window panes. The overhang considered is 91 cm (3 ft) deep and 2.54 cm (1-in) thick, and much wider than the window on both sides, effectively simulating a continuous façade. It is white with a reflectance of 0.60.
6
2.3 Window controls
2.3.1 Occupant visual comfort criteria Three criteria are used here to determine whether an occupant in this position experiences visual
discomfort. The first is whether the sun’s orb is directly visible by the occupant. The second is based on the values for the ratios between the luminance of the computer monitor and different areas of the occupant’s field of view. The Illuminating Engineering Society of North America recommends limits for these ratios so that visual comfort is maintained in offices [19]. For areas “near” the direction of view the maximum luminance ratio allowed is 3:1 and for “far” areas the ratio is 10:1. The “near” area of the field of view wasdefined to be within a 30° cone centered on the direction of view, and the “far” area a 60° cone. For the rest of the field of view, a ratio of 40:1 was used. The third criterion is derived from Osterhaus’ research [20], which suggests an additional requirement that the total vertical illuminance at the eye should not exceed 800 lux.
2.3.2 Control algorithms
Two control algorithms were tested for the Venetian blinds. In one of them, blinds were controlled
every hourly timestep. In the other, the blind position stayed the same all day. The control algorithm for the electrochromics did not vary between these two cases.
2.3.2.1 Hourly blind control
The optimal blind position depends on the transmittance of the electrochromics and vice-versa.
Therefore, the window control algorithm is iterative (Figure 5) and divided into three main steps: 1) deployment of blinds to block direct sun falling on the occupant's eyes, 2) optimization of window transmittance and 3) additional blind deployment. For the reference window step 2 is omitted (Figure 6). The control algorithm is applied at every daylight hour of the year.
Figure 5. Control algorithm flow chart for electrochromic window.
Figure 6. Control algorithm flow chart for reference window.
Start
Deploy blinds to block direct sun
Visual comfort
provided?
End
Test for visual comfort
Deploy blinds further
Yes
No
Optimize EC pane transmittance
Start
Deploy blinds to block direct sun
Visual comfort
provided?
End
Test for visual comfort
Deploy blinds further
Yes
No
Optimize EC pane transmittance
Start
Deploy blinds to block direct sun
Visual comfort
provided?
End
Test for visual comfort
Deploy blinds further
Yes
No
7
2.3.2.1.1 Blind deployment to block direct sun Without this first step, there is a very slim chance of providing visual comfort. When the sky is
overcast, blinds are left fully raised, since the sun is assumed not to be visible. If the sky is intermediate or clear, and if the sun is visible through one of the windowpanes, the blinds are lowered and the slat angle adjusted to exclude the view of the sun. Whenever the sun is visible through the lower pane, the blind is fully lowered, otherwise, the blinds are deployed over the upper pane only.
2.3.2.1.2 Optimization of electrochromic window transmittance
The electrochromic window panes are then set to a transmittance level that comes as close as possible
to meeting the workplace illuminance target without causing visual discomfort as defined in Section 2.3.1. This calculation is performed by an algorithm for least-squares optimization with linear inequality constraints [21]. The workplane illuminance target is 600, 800 or 1000 lux at the center of each sheet of paper depicted in Figure 7; i.e., light levels that are more than sufficient for general reading and writing tasks on the desk areas adjacent to the keyboard. The lowest illuminance target, 600 lx, was set at a level that provided a deadband above the setpoint for electric lighting, which was held constant at 540 lx, independently of the target illuminance for electrochromic control.
This prevents spurious lighting energy consumption if the optimization algorithm converges slightly
below target. In order to reduce the computation time of the optimization algorithm, luminance ratio constraints were applied on 10x10-pixel images obtained by filtering the original, 332x332-pixel images (Figure 8). Each pixel of the smaller image is an average of a 33x33 pixel square in the original image†
. Assuming a monitor luminance of 200 cd/m2, i.e. that of a current LCD computer monitor, each of these 100 “visual comfort pixels”, rather than all 110,224 original pixels individually, is constrained to a certain luminance, according to its position in the field of view (Figure 9).
Figure 7. Each window pane contributes independently to the amount of light present in the room. For June 12th at 1 PM standard time, the image on the left shows the contribution of the lower pane, the one on the right the contribution of the upper pane.
† Pixels outside the image circle are not counted in the averaging.
8
Figure 8. Luminance map obtained from images shown above in Figure 7, after pixel averaging.
Figure 9. Luminance constraints for averaged pixels.
The pixel averaging may underestimate some glare sources, for example if they are very small, or if
they are divided between neighboring reduced pixels. In the case of very small sources, however, it could be argued that this is an advantage because the human visual system does not usually respond to glare sources as small as the original pixels. Using the value of individual pixels to determine luminance ratios would excessively constrain the optimization. Figure 10 shows optimization results for June 12th at 1 PM (standard time) in Oakland, California. Optimal EC transmittance is 5 and 26% for the lower and upper windowpanes, respectively. Illuminance on target points is approximately 690 (left) and 470 lux (right). Vertical illuminance at the eye is about 350 lux. The corresponding luminance of the “visual comfort pixels” is shown in Figure 11. All values satisfy the visual comfort criteria.
Figure 10. Occupant’s view of the room for optimal pane transmittance of 5% for the lower pane and 26% for the upper pane.
Figure 11. Luminance values for “visual comfort pixels” (cd/m2).
9
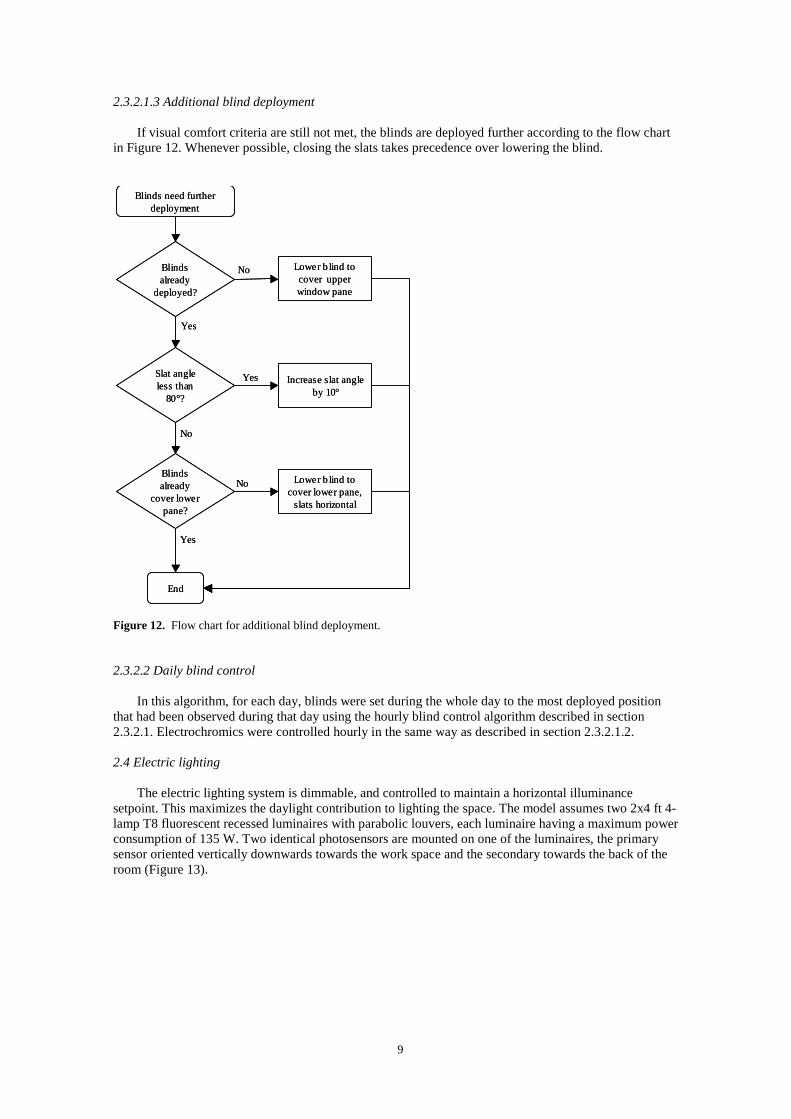
2.3.2.1.3 Additional blind deployment If visual comfort criteria are still not met, the blinds are deployed further according to the flow chart
in Figure 12. Whenever possible, closing the slats takes precedence over lowering the blind.
Figure 12. Flow chart for additional blind deployment.
2.3.2.2 Daily blind control In this algorithm, for each day, blinds were set during the whole day to the most deployed position
that had been observed during that day using the hourly blind control algorithm described in section 2.3.2.1. Electrochromics were controlled hourly in the same way as described in section 2.3.2.1.2.
2.4 Electric lighting
The electric lighting system is dimmable, and controlled to maintain a horizontal illuminance
setpoint. This maximizes the daylight contribution to lighting the space. The model assumes two 2x4 ft 4-lamp T8 fluorescent recessed luminaires with parabolic louvers, each luminaire having a maximum power consumption of 135 W. Two identical photosensors are mounted on one of the luminaires, the primary sensor oriented vertically downwards towards the work space and the secondary towards the back of the room (Figure 13).
Blinds need further deployment
End
Yes
NoBlinds already
deployed?
Lower b lind to cover upper window pane
Lower b lind to cover lower pane,
slats horizontal
Increase slat angle by 10°
Slat angle less than
80°?
Blinds already
cover lower pane?
Yes
No
Yes
No
Blinds need further deployment
End
Yes
NoBlinds already
deployed?
Lower b lind to cover upper window pane
Lower b lind to cover lower pane,
slats horizontal
Increase slat angle by 10°
Slat angle less than
80°?
Blinds already
cover lower pane?
Yes
No
Yes
No
10
Figure 13. “Views” from sensors: a) sensor 1, b) sensor 2 (partial view of door).
The power consumption as a function of light output for the electric lighting system is shown in
Figure 14. With lights at full power, average workplane illuminance is close to 600 lux. Lights are controlled to maintain an average work plane illuminance of 540 lux (approx. 50 footcandles) and are turned on only when more than the minimum light output (10% of maximum) is necessary to achieve that target. The system is normally controlled by the primary sensor. At times when the ratio between the primary and secondary sensors is greater than 0.8065 – the ratio's value with no daylight and electric lights at full power – it is considered that there is a high likelihood of a misleading primary sensor signal due to direct sunlight incidence on that sensor's area of concern and therefore the auxiliary sensor's signal is used instead. The main sensor's response to electric lights is shown in Figure 15.In Figure 16, hourly values of work plane illuminance due to daylight are plotted for the whole year.
Figure 14. Luminaire power consumption vs. light output.
Figure 15. Work plane illuminance vs. sensor signal for electric lighting system.
11
Figure 16. Work plane illuminance vs. sensor signal for daylight (electrochromic window, no overhang). The plot on the right shows the same data in more detail. The horizontal line is the illuminance setpoint for electric lighting control (540 lux). The sloped line is the illuminance versus sensor signal function.
The sloped line represents the sensor response characteristic, chosen so that it does not underestimate work plane daylight illuminance during 90% of the time for which average daylight workplane illuminance is below setpoint. This calibration was done separately for electrochromic and reference windows, with and without overhang.
2.4.1 Lighting energy
For every daylight hour of the year, the fraction FLof maximum light output necessary to achieve the
workplane illuminance setpoint is determined by
(1) where Esetis the illuminance setpoint, Edaylight is the daylight illuminance and Emax is the illuminance provided by the electric lights at maximum output. The annual energy consumption is then determined by summing the power consumption (determined from the relationship plotted in Figure 14) for all daylight hours of the year. 3. Results
The annual lighting energy values obtained are shown in Table 2. They indicate that, for hourly blind
control with 600 lx illuminance setpoint, annual energy use is higher for the electrochromic window than for the reference window. In both cases the introduction of the overhang results in a slight increase in energy use. An hourly plot of the difference between the lighting energy usage of both windows (Figure 17) shows that, during a significant period of time, the electrochromic window requires more energy than the reference window, either with or without overhang.
12
Table 2. Annual lighting energy consumption for all simulated configurations.
Figure 17. Year-round difference in lighting energy usage between reference and electrochromic window: (top) without overhang, (bottom) with overhang. Positive values (blue) mean reference window requires more power than the electrochromic window.
13
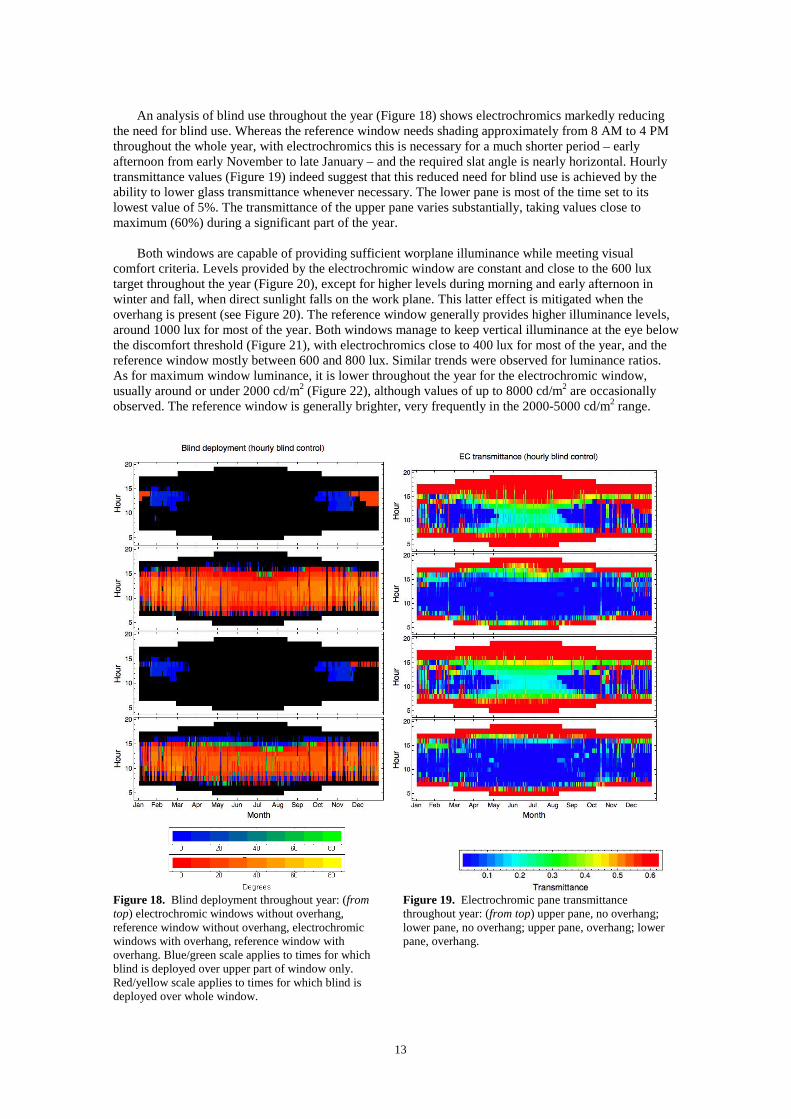
An analysis of blind use throughout the year (Figure 18) shows electrochromics markedly reducing
the need for blind use. Whereas the reference window needs shading approximately from 8 AM to 4 PM throughout the whole year, with electrochromics this is necessary for a much shorter period – early afternoon from early November to late January – and the required slat angle is nearly horizontal. Hourly transmittance values (Figure 19) indeed suggest that this reduced need for blind use is achieved by the ability to lower glass transmittance whenever necessary. The lower pane is most of the time set to its lowest value of 5%. The transmittance of the upper pane varies substantially, taking values close to maximum (60%) during a significant part of the year.
Both windows are capable of providing sufficient worplane illuminance while meeting visual
comfort criteria. Levels provided by the electrochromic window are constant and close to the 600 lux target throughout the year (Figure 20), except for higher levels during morning and early afternoon in winter and fall, when direct sunlight falls on the work plane. This latter effect is mitigated when the overhang is present (see Figure 20). The reference window generally provides higher illuminance levels, around 1000 lux for most of the year. Both windows manage to keep vertical illuminance at the eye below the discomfort threshold (Figure 21), with electrochromics close to 400 lux for most of the year, and the reference window mostly between 600 and 800 lux. Similar trends were observed for luminance ratios. As for maximum window luminance, it is lower throughout the year for the electrochromic window, usually around or under 2000 cd/m2 (Figure 22), although values of up to 8000 cd/m2 are occasionally observed. The reference window is generally brighter, very frequently in the 2000-5000 cd/m2 range.
Figure 18. Blind deployment throughout year: (from top) electrochromic windows without overhang, reference window without overhang, electrochromic windows with overhang, reference window with overhang. Blue/green scale applies to times for which blind is deployed over upper part of window only. Red/yellow scale applies to times for which blind is deployed over whole window.
Figure 19. Electrochromic pane transmittance throughout year: (from top) upper pane, no overhang; lower pane, no overhang; upper pane, overhang; lower pane, overhang.
14
Figure 20. Average work plane illuminance: (from top) electrochromic windows without overhang, reference window without overhang, electrochromic windows with overhang, reference window with overhang.
Figure 21. Vertical illuminance at the eye: (from top) electrochromic windows without overhang, reference window without overhang, electrochromic windows with overhang, reference window with overhang.
15
Figure 22. Maximum window luminance: (from top) electrochromic windows without overhang, reference window without overhang, electrochromic windows with overhang, reference window with overhang.
3.1. Effect of higher work plane illuminance setpoints for electrochromics Given that the reference window provided higher work plane illuminance than the electrochromic
window, it was decided to investigate the effect of increasing the illuminance setpoint for the optimization of electrochromic pane transmittance from 600 lux to 800 lux and 1000 lux. As can be seen in Table 2, this brought the energy performance of the electrochromics to levels very close to the reference case. This suggests that the advantage of the reference window had indeed been that the electrochromic control algorithm was reducing the amount of useful daylight. Increasing the setpoint from 800 to 1000 lux did not bring significant improvements. Changes in blind deployment with increasing setpoint are negligible, occurring for less than a handful of hours for the whole year.
16
3.2. Daily blind control Because blinds were adjusted hourly, the results above probably do not present an accurate picture of
what would happen with a person in an actual office. Previous studies have suggested that office occupants, once they lower the blinds, tend to leave them lowered for the rest of the day, or even for days or weeks [1].
A blind adjustment algorithm designed to better approximate actual blind control by occupants was then tested. For each day of the year, and for the whole day, blinds were set to the most deployed blind position that had been observed for the same day with the hourly blind adjustment mode. This resulted in the blind deployment shown in Figure 23 for an electrochromic control setpoint of 600 lux.
Figure 23. Blind deployment throughout year with daily blind control algorithm and electrochromic setpoint of 600 lux: a) electrochromic windows without overhang, b) reference window without overhang, c) electrochromic windows with overhang, d) reference window with overhang.
17
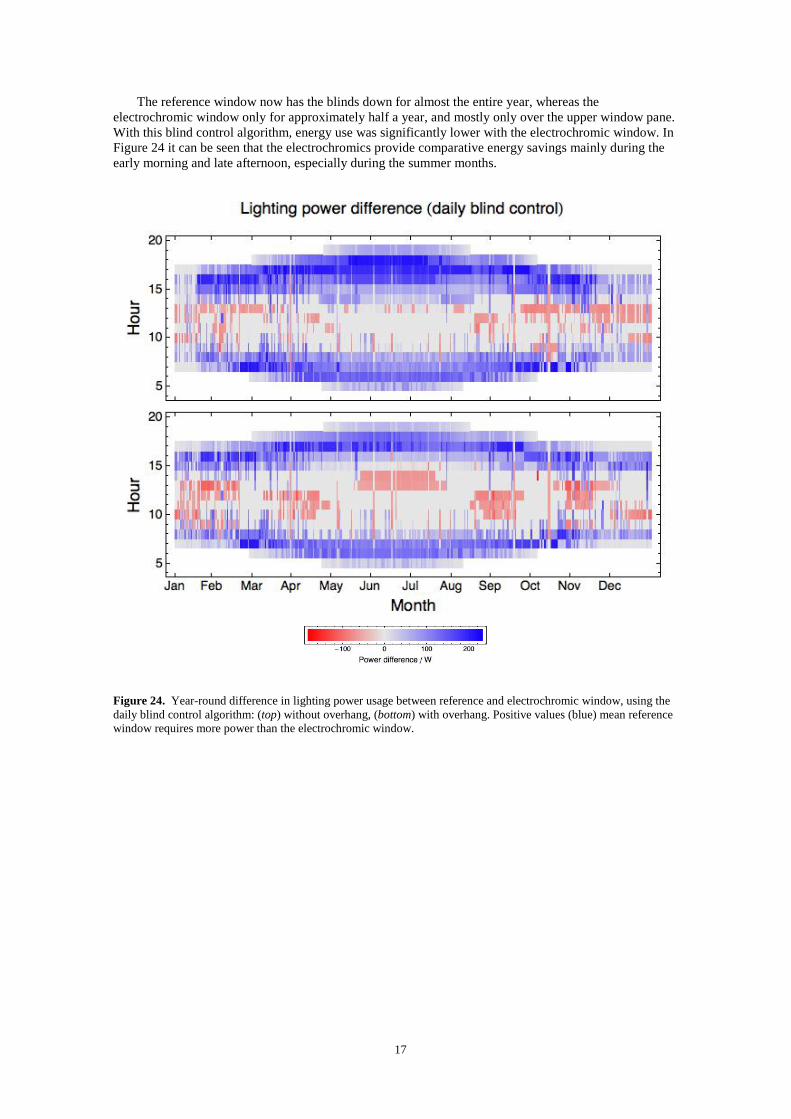
The reference window now has the blinds down for almost the entire year, whereas the electrochromic window only for approximately half a year, and mostly only over the upper window pane. With this blind control algorithm, energy use was significantly lower with the electrochromic window. In Figure 24 it can be seen that the electrochromics provide comparative energy savings mainly during the early morning and late afternoon, especially during the summer months.
Figure 24. Year-round difference in lighting power usage between reference and electrochromic window, using the daily blind control algorithm: (top) without overhang, (bottom) with overhang. Positive values (blue) mean reference window requires more power than the electrochromic window.
18
Figure 25. Average work plane illuminance with daily blind control algorithm: a) electrochromic windows without overhang, b) reference window without overhang, c) electrochromic windows with overhang, d) reference window with overhang.
Average work plane illuminance was, for the electrochromic window, also constant, with reduced occurrence of high values (Figure 25). For the reference window the values were lower than previously, and clearly insufficient in the early morning and late afternoon, which probably explains the power consumption pattern seen in Figure 24.
Raising the workplane illuminance setpoint for electrochromics optimization to 800 lux, resulted in
further reductions in energy use.
19
4. Discussion At first, the higher lighting energy consumption observed with electrochromic windows can be
surprising. This result, however, may have more to do with the shading system used in this study than with the glass itself. Electrochromics control light by absorbing it, therefore preventing it from contributing to interior illumination, whereas Venetian blinds do so by redirecting light, some of which enters the space towards the ceiling and raises the light levels without contributing to glare, thus comparatively reducing the need for electric light. Paradoxically, by reducing the need for blinds, electrochromics seem to be actually reducing daylight use. If this is correct, it is reasonable to assume that the relative merits of the two types of glass would be quite different if a non-light-redirecting shading system were used in this study, e.g. roller shades. Nevertheless, the results indicate that, when coupled with Venetian blinds that are continuously controlled to provide visual comfort, windows with ordinary glass result in equal or lower (depending on the illuminance setpoint) energy consumption than split electrochromic windows optimized to provide a certain horizontal illuminance.
It is usually the case, however, that blinds are adjusted less frequently than hourly. Results with the
blind position adjusted daily suggest that electrochromics can have a significant advantage over ordinary glass in terms of lighting energy consumption. Depending on the workplane illuminance for which electrochromics were controlled, energy savings ranged from 43% to 67%.
A significant advantage of electrochromic windows that this study shows is that they require much
less obstruction of the exterior view by a shading device. With hourly adjustment, electrochromics require very minimal deployment of blinds, whereas ordinary glass demands everyday use, and for most of the day. With daily adjustment, ordinary glass requires blinds all the way down throughout the whole year, with the exception of a handful of days, whereas electrochromics only from roughly mid-November to mid-January. This increased availability of view could bring significant benefits to building occupants, both physical and physiological. For office workers, views of the exterior have been correlated with both reduced physical and psychological discomfort [22], as well as increased job satisfaction and decreased job stress [23], especially for views of nature [24]. For patients in health care facilities, view has been correlated with faster recovery [25] and better physical and mental health condition [26, 27], as well as being preferred by staff [28].
There might also be advantages in using a setpoint higher than 600 lx to control the electrochromics.
Occupant preferences for horizontal illuminance in daylit offices can be significantly higher than the recommended values for electric lighting [29]. Higher light levels can also have potential health care applications, for example in the treatment of seasonal affective disorder [30] or sleep disturbances experienced by patients with Alzheimer’s disease [31].
Because electrochromics require a shading device to provide visual comfort, it could be argued that a
window with ordinary glass and an automated shading device might be a more cost-effective option. This might be the case should an automated light-redirecting shading system of the type considered in this study be widely accessible. However, the level of optimization for occupant visual comfort that was assumed here is not readily available in a commercial product. Furthermore, at present, most commercially-available automated shading systems are of the diffusing type, such as roller shades, which would probably provide lower lighting energy savings. Finally, should automated light-redirecting shading systems with the level of optimization considered here become available, electrochromics might still be the choice in applications where view is of primary importance.
The effects of adding an overhang to the façade are mixed but generally less significant than the
differences between the two types of glass. With hourly blind control, and depending on glass type and control algorithm, it can increase lighting energy use between 6% (original case, i.e. electrochromics controlled for 600 lx) and 25% (electrochromics controlled for 800 lx). This is probably due to the overhang blocking daylight from entering the room and causing lights to be on longer or at a higher power setting. However, the overhang also has the effect of reducing the need to deploy blinds, which has a more marked effect with daily blind control, since what effectively determines blind deployment in those cases is the worst visual comfort condition for each day. In this case, adding the overhang still leads to increases in energy use for the electrochromics (3 to 14%), but for the reference window results in about 15% energy savings because it allows blind slats to be more open during a significant part of the year. Overall, the reduced blind deployment increases the availability of view to the outside, this effect being the most significant in the case of electrochromics with daily blind control.
20
Some limitations should be had in mind when considering the results from this study. Energy consumption values were calculated for all daylight hours of the year and would be different if another time period was used, e.g. 9:00-17:00. Nevertheless, it is anticipated that the trends mentioned above would generally still be observed, although operational schedules that include hours of darkness would probably reduce the relative differences in consumption between the cases studied. The results obtained here are applicable to spaces that have a similar ratio of glazed to non-glazed façade area. Had the windows been smaller, it is likely that the relative differences between systems would be reduced. In the limit of very small windows, the difference in performance would become negligible. Standby power of the electric lighting system, which was considered here to be zero, would increase energy consumption, again probably reducing relative differences between cases. The power to operate the electrochromics, which would introduce a small reduction in the energy savings with this system, was also not considered in this study. Empirically derived models for blind adjustment, such as described in [32], could be used to achieve more realistic results. It would also be more realistic to use more than one occupant viewing direction and position to evaluate visual comfort. Regarding the lighting calculations, future studies should probably include additional interreflections, and place a ground plane outside to account for shading from the building structure. Although it was assumed here, for simplicity of implementation of the simulation method, that the CIE standard sky models are adequate for comparing performance between systems, absolute energy consumption values might be more accurate if a more sophisticated model were used, such as for example the Perez model [33]. As mentioned before, the pixel reduction technique used in constraining luminance ratios may underestimate some glare sources. Further research is necessary to determine the adequate level of averaging, which is likely to depend on position in the field of view. These limitations notwithstanding, the present study can give a very useful picture of how window systems compare to each other in terms of providing daylight and visual comfort.
5. Conclusion A simulation study was conducted for a south-facing private office in Berkeley/Oakland, California.
A split EC window was controlled to meet visual comfort requirements and to optimize daylight illuminance. Lighting energy use savings were computed using simulated photosensor signal levels to dim the recessed fluorescent lights in response to available daylight. If the height and slat angle are controlled hourly, annual lighting energy use is higher for the EC window(62% and 53%, respectively without and with overhang), relative to the reference window (Tv=0.60). Prior field studies indicate that manually operated interior shades are rarely operated in this optimal manner, therefore it was attempted to achieve more realistic results with daily control based on each day’s hour of least visual comfort. If the reference case blind is controlled one time per day at the first instance of visual discomfort, then annual lighting energy use is decreased (48% and 37%, respectively without and with overhang) if the EC window is used.
This study indicates that, for south-facing spaces, electrochromics have the potential to provide
lighting energy savings over the whole year, relative to ordinary clear glass. Further research is needed to determine whether the particular control method used here can be implemented in a physical room, since it depends on quantities that are challenging to measure, such as the separate contributions from the individual EC window panes. The results also show that, due to their ability to simultaneously obstruct direct sun and redirect daylight into the space, the lighting energy performance of continuously adjusted Venetian blinds can be challenging to match by more sophisticated and innovative daylighting systems.
Acknowledgments We would like to thank and acknowledge our LBNL colleagues for their contributions to this
research: Judy Lai, Dennis DiBartolomeo and Andy McNeil. This work was supported by the Assistant Secretary for Energy Efficiency and Renewable Energy,
Building Technologies Program, of the U.S. Department of Energy, under Contract No. DE-AC02-05CH11231 and by the California Energy Commission through its Public Interest Energy Research (PIER) Program on behalf of the citizens of California.
21
References
[1] Rubins, A.I., Collins, B.L., Tibbott, R.L. 1978, Window blinds as a potential energy saver - A case study (NBS Building Science Series 112), Washington, DC, USA. Department of Commerce, National Bureau of Standards.
[2] Lee, E.S., D.L. DiBartolomeo, J.H. Klems, M. Yazdanian, S.E. Selkowitz. 2006. Monitored Energy Performance of Electrochromic Windows Controlled for Daylight and Visual Comfort. ASHRAE Transactions 112(2):122-141, 2006.
[3] Sullivan, R., E.S. Lee, K. Papamichael, M. Rubin, S. Selkowitz. 1994. The effect of switching control strategies on the energy performance of electrochromic windows. Proceedings SPIE International Symposium on Optical Materials Technology for Energy Efficiency and Solar Energy Conversion XIII, April 18-22, 1994, Freiburg, Germany.
[4] Moeck, M., Lee, E.S., Rubin, M.D., Sullivan, R.T., Selkowitz, S.E., 1998, Visual quality assessment of electrochromic and conventional glazings, Solar Energy Materials and Solar Cells 54(1998):157-164.
[5] Karlsson, J., Karlsson, B., Roos, A., 2000, Control strategies and energy saving potentials for variable transmittance windows versus static windows, Eurosun 2000, Copenhagen, Denmark, June 19-22.
[6] Karlsson, J., 2001, Control system and energy saving potential for switchable windows, Building Simulation 2001, Rio de Janeiro, Brazil, August 13-15.
[7] Jonsson, A., Roos, A., 2010, Visual and energy performance of switchable windows with antireflection coatings, Solar Energy 84(2010):1370-1375.
[8] Jonsson, A., Roos, A., 2008, Simulations of Energy Influence using Different Control Mechanisms for Electrochromic Windows, Sustainable Buildings 2008, Melbourne, Australia.
[9] Jonsson, A., Roos, A., 2010, Evaluation of control strategies for different smart window combinations using computer simulations, Solar Energy 84(2010):1-9.
[10] Platzer, W.J.,Switchable façade technology—energy efficient office buildings with smart facades, Proceedings of the Solar World Congress 2003, Göteborg, Sweden, June 14–19, 2003.
[11] Platzer, W.J., 2003, Switchable façade technology: Final technical report (36 month), Fraunhofer Institute for Solar Energy Systems, Freiburg, Report no. swift-pr-coord-030730.
[12] Assimakopoulos, M.N., Tsangrassoulis, A., Guarracino, G., Santamouris, M., 2004, Integrated energetic approach for a controllable electrochromic device, Energy and Buildings 36(2004):415-422.
[13] Assimakopoulos, M.N., Tsangrassoulis, A., Santamouris, M.,Guarracino, G., 2007, Comparing the energy performance of an electrochromic window under various control strategies, Building and Environment, 42(2007):2829-2834.
[14] Gugliermetti, F, Bisegna, P., 2003, Visual and energy management of electrochromic windows in Mediterranean climate, Building and Environment 38(2003):479-492.
[15] Chauvel, P., et al, 1982, Glare from windows: current views of the problem, Lighting Research and Technology 14(1):31-46.
[16] Ward Larson, G., Shakespeare, R., 1998, Rendering with Radiance: the art and science of lighting visualization, Morgan Kaufman, San Francisco.
[17] Reinhart, C. F., Walkenhorst, O., 2001, Dynamic RADIANCE-based Daylight Simulations for a full-scale Test Office with outer Venetian Blinds, Energy & Buildings, 33 (7): 683-697.
[18] Tregenza, P., Waters, I. M., 1983, Daylight Coefficients, Lighting Research and Technology, 15(2): 65-71.
[19] Illuminating Engineering Society of North America, 1999, The IESNA lighting handbook: reference and application, 9th ed., IESNA, New York.
22
[20] Osterhaus, W. K. E., 1996, Discomfort glare from large area glare sources at computer workstations, Building with daylight: Energy efficient design. Proceedings 1996 IEEE Industry Applications Society annual Meeting, II, pp. 1825-1829, Houston, Texas, USA.
[21] Lawson, C., Hanson, R., 1974, Solving least squares problems, Prentice-Hall.
[22] Aries, M. B. C., Veitch, J. A., & Newsham, G. R., 2010,Windows, view, and office characteristics predict physical and psychological discomfort, Journal of Environmental Psychology, 30: 533-541.
[23] Shin, W.S., 2007, The influence of forest view through a window on job satisfaction and job stress, Scandinavian Journal of Forest Research, 22: 248-253.
[24] Ulrich, R.S., 1986, Human responses to vegetation and landscapes, Landscape and Urban Planning, 13: 29-44.
[25] Ulrich, R.S., 1984, View through a window may influence recovery from surgery, Science, 224: 420-421.
[26] Keep, P., James, J., Inman, M., 1980, Windows in the intensive therapy unit, Anaesthesia, 35: 257-262.
[27] Raanaas, R.K., Patil, G.G., Hartig, T., 2011, Health benefits of a view of nature through the window: a quasi-experimental study of patients in a residential rehabilitation center, Clinical Rehabilitation, 26(1): 21-32.
[28] Verderber, S., 1983, Human response to daylighting in the therapeutic environment, Proceedings of the 1983 International Daylighting Conference, Phoenix, Arizona.
[29] Galasiu, A.D., Veitch, J.A., 2006, Occupant preferences and satisfaction with the luminous environment and control systems in daylit offices: a literature review, Energy and Buildings, 38(7):728-742.
[30] Terman, M., Terman, J.S., Quitkin, F.M., McGrath, P.J., Stewart, J.W., Rafferty, B., 1989, Light therapy for seasonal affective disorder: A review of efficacy, Neuropsychopharmacology, 2:1-22.
[31] Van Someren, E.J.W., Hagebeuk, E.E.O., Lijzenga, E., Schellens, P., de Rooij, S.E.J.A., Jonker, C., Pot, A-M., Mirmiran, M., Swaab, D.F., 1996, Circadian rest-activity rhythm disturbances in Alzheimer's disease, Biological Psychiatry, 40:259-270.
[32] Reinhart, C. F., 2004, Lightswitch-2002: a model for manual and automated control of electric lighting and blinds, Solar Energy, 77(1):15-28.
[33] Perez, R., Seals, R., Michalsky, J., 1993, All-weather model for sky luminance distributions – preliminary configuration and validation, Solar Energy, 50(3):235-245.