13
Peter A. Craig Concrete Constructives 1/31/2011 Concrete Floor Drying Study for the Expanded Shale Clay and Slate Institute

Peter A. Craig
Concrete Constructives
1/31/2011
Concrete Floor Drying Study for the Expanded Shale Clay and
Slate Institute

2
ESCSI - Lightweight Concrete Drying Study Background: Over the past decade moisture-related flooring and coating problems have become one of the most serious and costly of construction problems. Such issues range from the blistering and disbondment of flooring materials to the development of serious indoor air quality issues that result from mold growing within and below flooring materials. Today the costs associated with such problems are estimated to be in the hundreds of millions of dollars each year and have led to every aspect of the slab construction process being re-examined. Such scrutiny has led to the increased use of low-permeance, below-slab vapor retarder materials positioned in direct contact with the underside of the slab to take moisture from the ground as completely out of play as possible. However, even with this precaution taken there remains the challenge of getting the concrete itself to dry to an acceptable level within the project schedule. Over the years there have been several concrete drying studies performed and published. These studies have measured the drying time of both normal weight and lightweight concrete mixtures of various water-to-cement ratios (w/c). Data from the famed Brewer PCA study(1)
showed that under controlled laboratory conditions a normal weight concrete mixture with of w/c of 0.50 dried to a 3 lb moisture vapor emission rate (MVER) in 82 days. In 2000 Suprenant and Malisch published results of a comparative lightweight concrete drying study that showed that under similar laboratory conditions lightweight concrete with a w/c of 0.40 took 183 days to reach a 3 lb MVER(2)
. Data such as reported in these controlled studies has led many to the conclusion that lightweight concrete will take twice as long to dry as normal weight concrete. But do these drying times and comparative evaluations hold true for concrete placed in the field and maintained for the most part under jobsite conditions? To answer these questions the Expanded Shale, Clay and Slate Institute (ESCSI) in cooperation with members of flooring and concrete industry conducted two concrete drying studies that compared the drying times of normal and lightweight concrete in both laboratory and field conditions. The Studies: Study #1 was a non-climate controlled drying study of both normal and lightweight concrete placed and maintained in a warehouse in Dalton, Georgia. Study # 2 was a climate controlled drying study of both normal and lightweight concrete placed and maintained at the W.R. Grace Laboratories in Cambridge, Massachusetts.
3
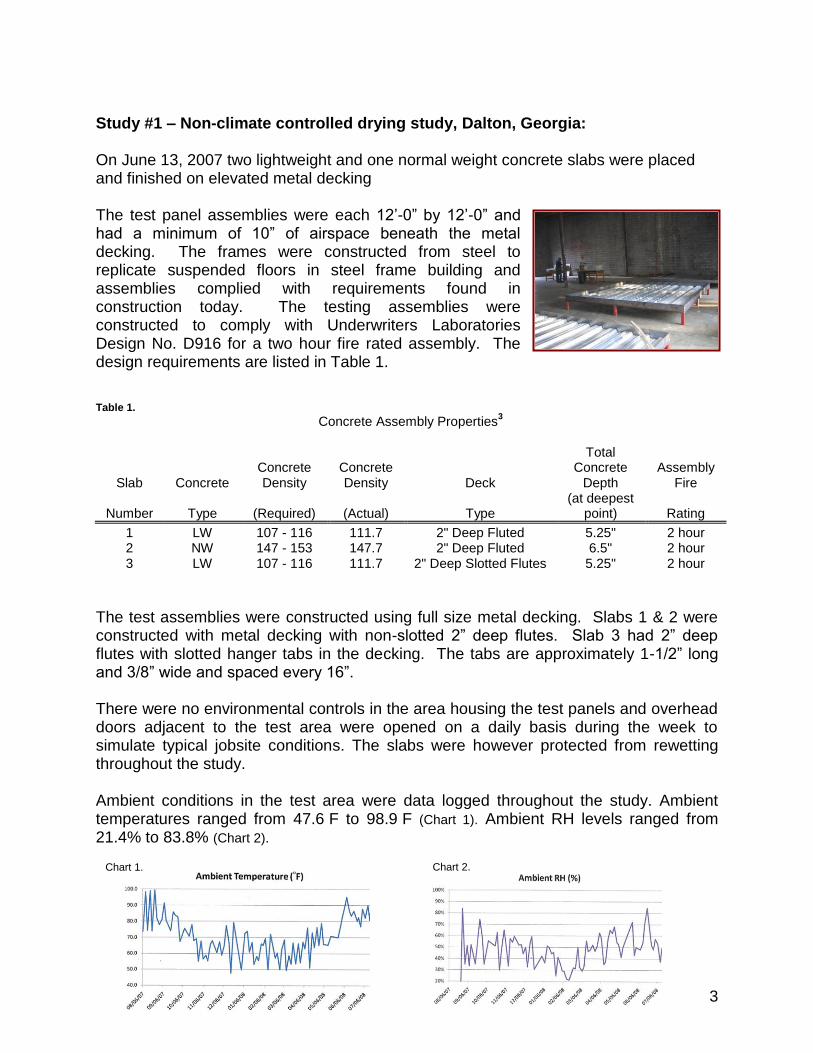
Study #1 – Non-climate controlled drying study, Dalton, Georgia: On June 13, 2007 two lightweight and one normal weight concrete slabs were placed and finished on elevated metal decking The test panel assemblies were each 12’-0” by 12’-0” and had a minimum of 10” of airspace beneath the metal decking. The frames were constructed from steel to replicate suspended floors in steel frame building and assemblies complied with requirements found in construction today. The testing assemblies were constructed to comply with Underwriters Laboratories Design No. D916 for a two hour fire rated assembly. The design requirements are listed in Table 1. Table 1.
Concrete Assembly Properties3
Concrete Concrete Total
Concrete Assembly Slab Concrete Density Density Deck Depth Fire
Number Type (Required) (Actual) Type (at deepest
point) Rating
1 LW 107 - 116 111.7 2" Deep Fluted 5.25" 2 hour 2 NW 147 - 153 147.7 2" Deep Fluted 6.5" 2 hour 3 LW 107 - 116 111.7 2" Deep Slotted Flutes 5.25" 2 hour
The test assemblies were constructed using full size metal decking. Slabs 1 & 2 were constructed with metal decking with non-slotted 2” deep flutes. Slab 3 had 2” deep flutes with slotted hanger tabs in the decking. The tabs are approximately 1-1/2” long and 3/8” wide and spaced every 16”. There were no environmental controls in the area housing the test panels and overhead doors adjacent to the test area were opened on a daily basis during the week to simulate typical jobsite conditions. The slabs were however protected from rewetting throughout the study. Ambient conditions in the test area were data logged throughout the study. Ambient temperatures ranged from 47.6
F to 98.9
F (Chart 1). Ambient RH levels ranged from 21.4% to 83.8% (Chart 2).
Chart 1.
Chart 1. Chart 2.

4
Concrete The concrete mixtures were batched at a local ready mix supplier and delivered to the test site. The concrete mixtures and properties are found in Tables 2-5.
Although the concrete was delivered to the test assemblies via chute, the moisture content in the lightweight aggregate was suitable for concrete pumping with a moisture content of 18%. The mixes showed good workability and were typical of what is seen in the field. The concrete was leveled with a screed, bull floated and finished with a walk behind machine. One half of each slab was finished to a smooth, but non-burnished finish. The other half of each slab was finished to a burnished finish.

5
The finished concrete was cover cured with polyethylene sheeting for a period of 7 days.
Drying Times: Slab drying was monitored using two moisture testing methods. Test method ASTM F1869; “Standard Test Method for Measuring Vapor Emission Rate of Concrete Subfloor Using Anhydrous Calcium Chloride”, was used to measure the Moisture Vapor Emission Rate (MVER) at the surface of the slabs. Test method ASTM F 2170, “Standard Test Method for Determining Relative Humidity in Concrete Floor Slabs using in situ probes”, was used to measure the internal relative humidity (RH) of the test slabs. MVER testing was performed by Professional Testing Laboratory of Dalton, GA.
6
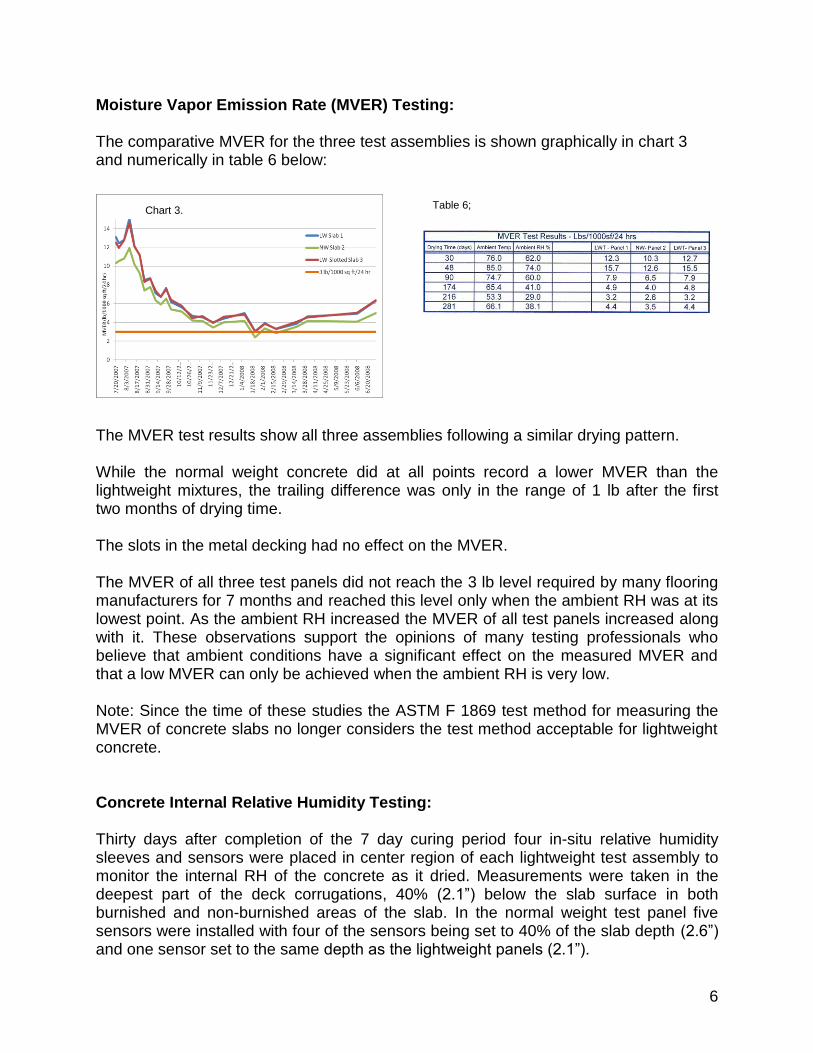
Moisture Vapor Emission Rate (MVER) Testing: The comparative MVER for the three test assemblies is shown graphically in chart 3 and numerically in table 6 below:
The MVER test results show all three assemblies following a similar drying pattern. While the normal weight concrete did at all points record a lower MVER than the lightweight mixtures, the trailing difference was only in the range of 1 lb after the first two months of drying time. The slots in the metal decking had no effect on the MVER. The MVER of all three test panels did not reach the 3 lb level required by many flooring manufacturers for 7 months and reached this level only when the ambient RH was at its lowest point. As the ambient RH increased the MVER of all test panels increased along with it. These observations support the opinions of many testing professionals who believe that ambient conditions have a significant effect on the measured MVER and that a low MVER can only be achieved when the ambient RH is very low. Note: Since the time of these studies the ASTM F 1869 test method for measuring the MVER of concrete slabs no longer considers the test method acceptable for lightweight concrete.
Concrete Internal Relative Humidity Testing:
Thirty days after completion of the 7 day curing period four in-situ relative humidity sleeves and sensors were placed in center region of each lightweight test assembly to monitor the internal RH of the concrete as it dried. Measurements were taken in the deepest part of the deck corrugations, 40% (2.1”) below the slab surface in both burnished and non-burnished areas of the slab. In the normal weight test panel five sensors were installed with four of the sensors being set to 40% of the slab depth (2.6”) and one sensor set to the same depth as the lightweight panels (2.1”).
Chart 3. Table 6;

7
In each of the 3 test panels one sensor data logged measurements in the non-burnished area of the slab on a daily basis. All other measurements were recorded manually by Advanced Adhesive Technology of Dalton, Georgia. All of the sensors used had NIST traceable calibration certificates. The results of these tests are shown graphically in chart 4 and numerically in table 7 below.
The RH measurements reported in table 7 are the comparative RH levels recorded using sensors from one manufacturer in both the burnished and non-burnished areas of the slab. After the first month of drying time the variation in measurements between the burnished and non-burnished was not found to be significant. In the first few months of data collection the extremely high internal concrete RH caused several of the sensors to malfunction. These sensors were replaced. Once the concrete internal RH fell below 95% no other sensor malfunctions were experienced. From this point on both the normal weight and lightweight concrete mixtures followed similar drying patterns within a few percentage points of each other.
Chart 4.
Table 7.
Table 7.

8
In the normal weight panel measurements were taken both at 40% of the slab thickness (2.6”) and at a depth matching measurements taken in the lightweight panel 2.1”). At the 180 day mark there was no difference in the RH between the two depths. At the 273 day mark the 2.6” measurement was 1% higher than the 2.1” measurement. At the year mark the 2.6” measurement was 2% higher than the measurement at 2.1”. While the normal weight concrete did dry to slightly lower levels than either of the lightweight slabs it should be noted that under non climate controlled conditions, in one year’s time, none of the test assemblies reached a relative humidity level of 75% which is required by many floor covering manufacturers and referenced in ASTM F 710. The total water in the normal weight and lightweight assemblies is shown in Table 8. Even though the lightweight aggregate was saturated to a point that was suitable for pumping, there was only 11.3% more water in the lightweight assembly.
Mix Water from HW HW
Water from
Water from Total
Test Concrete in
Water per
Sand per Sand
Sand per
Stone per Stone
HW Stone
per LWA per LWA
LWA per
Water per
Assembly
Assembly
cubic yard
cubic yard
Moisture
cubic yard
cubic yard
Moisture
cubic yard
cubic yard
Moisture
cubic yard
Assembly
NWC 2.46 275 1469 4% 56.5 1840 0.5% 9.16 0 838.02
LWC 1.90 270 1480 4% 57.0 0 1075 18% 163.98 932.86
It is believed that the similar drying profiles, for both normal and lightweight concrete mixtures, is a result of the assemblies drying downward from the top surface only. Study #2: Climate controlled drying study - W.R. Grace Laboratories, Cambridge, Massachusetts:
In conjunction with studies being performed for the ASTM F-6 Resilient Flooring Committee, and W.R. Grace, the drying of normal and lightweight slabs of the same water-to-cement ratio (w/c) were monitored for ESCSI by Eric Koehler of W.R. Grace and Edward Lyon of Simpson, Gumpetz & Heger (SGH). The normal weight control concrete slab reported in this study was batched to a w/c of 0.50 and placed on April 16, 2009. The lightweight control concrete slab reported in this study was batched to a w/c of 0.50 using lightweight aggregate with an absorbed moisture content of 23.6%. The lightweight slab was placed on April 22, 2009.
Table 8.
9
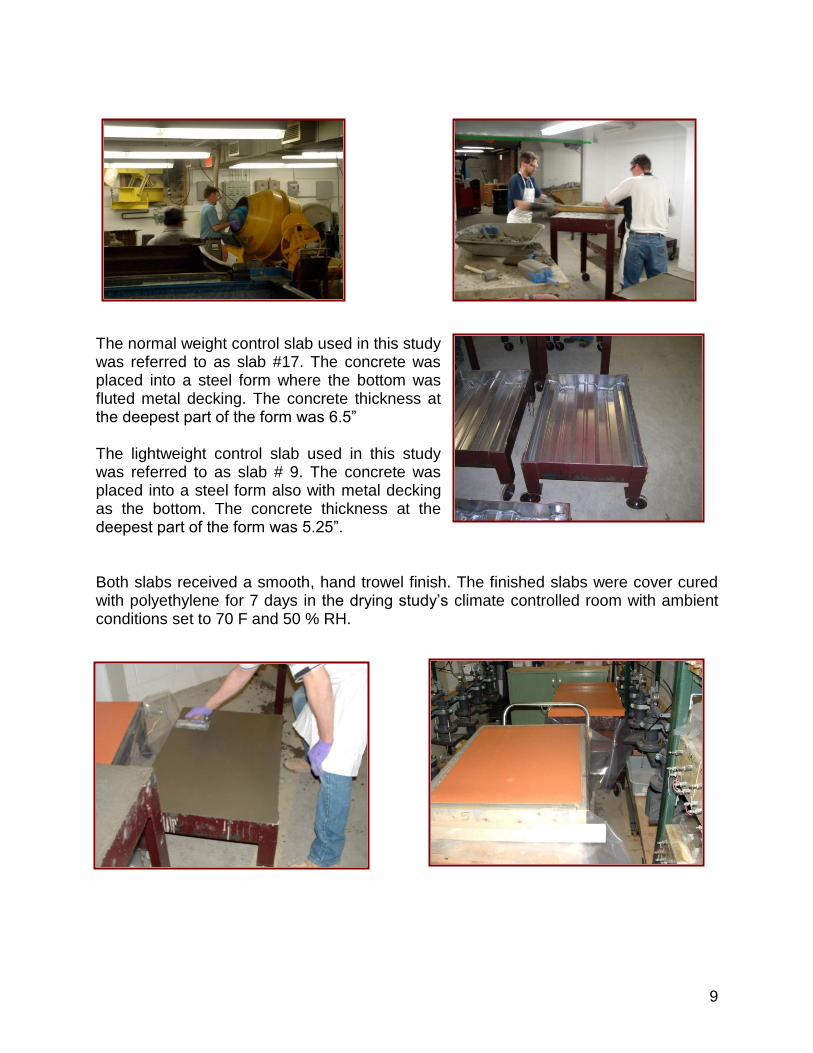
The normal weight control slab used in this study was referred to as slab #17. The concrete was placed into a steel form where the bottom was fluted metal decking. The concrete thickness at the deepest part of the form was 6.5” The lightweight control slab used in this study was referred to as slab # 9. The concrete was placed into a steel form also with metal decking as the bottom. The concrete thickness at the deepest part of the form was 5.25”. Both slabs received a smooth, hand trowel finish. The finished slabs were cover cured with polyethylene for 7 days in the drying study’s climate controlled room with ambient conditions set to 70 F and 50 % RH.
10
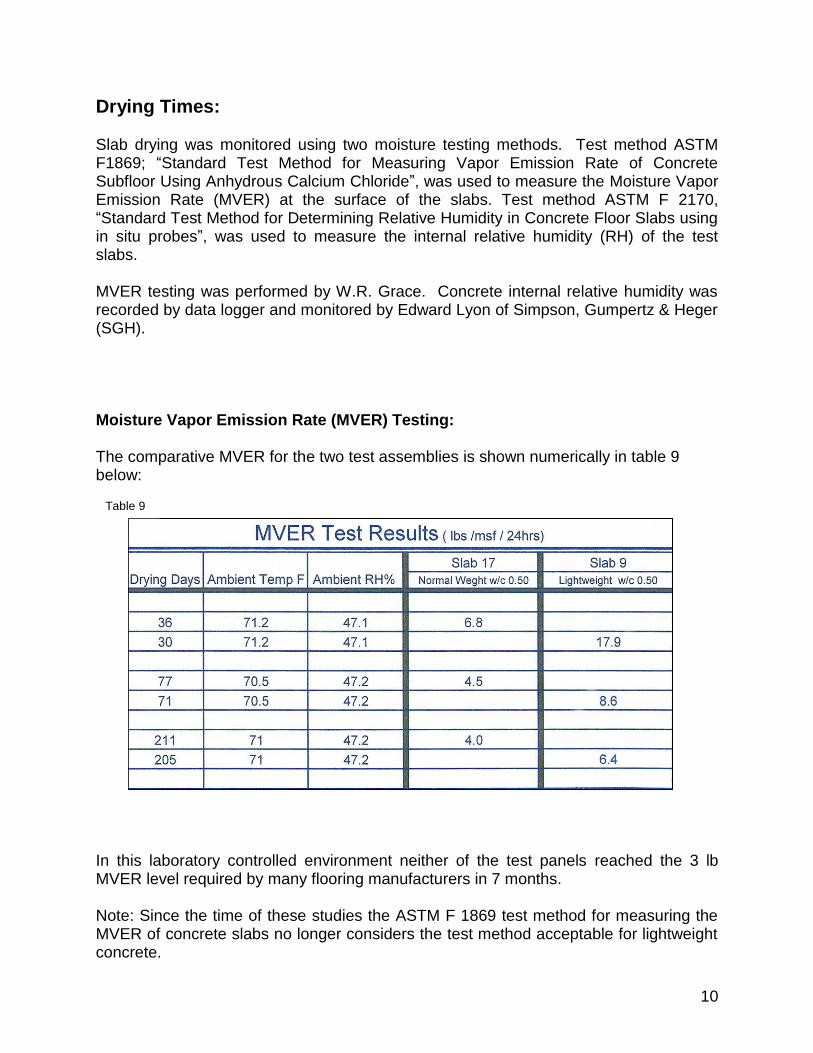
Drying Times: Slab drying was monitored using two moisture testing methods. Test method ASTM F1869; “Standard Test Method for Measuring Vapor Emission Rate of Concrete Subfloor Using Anhydrous Calcium Chloride”, was used to measure the Moisture Vapor Emission Rate (MVER) at the surface of the slabs. Test method ASTM F 2170, “Standard Test Method for Determining Relative Humidity in Concrete Floor Slabs using in situ probes”, was used to measure the internal relative humidity (RH) of the test slabs. MVER testing was performed by W.R. Grace. Concrete internal relative humidity was recorded by data logger and monitored by Edward Lyon of Simpson, Gumpertz & Heger (SGH). Moisture Vapor Emission Rate (MVER) Testing: The comparative MVER for the two test assemblies is shown numerically in table 9 below: In this laboratory controlled environment neither of the test panels reached the 3 lb MVER level required by many flooring manufacturers in 7 months. Note: Since the time of these studies the ASTM F 1869 test method for measuring the MVER of concrete slabs no longer considers the test method acceptable for lightweight concrete.
Table 9

11
Concrete Internal Relative Humidity Testing:
One month after completion of the 7 day curing period in- situ relative humidity sleeves and sensors were placed at 40% of the slab thickness in each test slab. The results of these tests are shown graphically in chart 5 and numerically in table 10 Below: Chart 5
Table 10

12
While the normal weight concrete did consistently record a slightly lower internal RH level than the lightweight slab, it should be noted that even under ideal drying conditions both of the slabs were still in the 85% RH range after 7 months. Comments: Based on the results of these two studies, and observations from scores of projects around the country, the drying of both normal weight and lightweight concrete, to the levels currently being required by the flooring industry, can be a very difficult challenge within the construction schedule. The results of these reported studies do support that lightweight concrete does take longer to dry than normal weight concrete, however the difference in the drying time recorded in these studies is considerably less than that which has been historically reported and understood. For concrete to dry in a timely manner there are factors other than whether the concrete is normal weight or lightweight that come into play. Curing compounds, of any type, should be avoided for slabs that need to dry and receive floor covering or coatings. Curing compounds slow down the drying process and must be physically removed from the concrete surface to comply with ASTM F 710 and flooring manufacturer’s requirements. Covering curing methods satisfy the need for concrete to be cured without further delaying the drying process. For either normal weight or lightweight concrete to dry as quickly as possible, the concrete should be protected from re-wetting and surrounded by an ambient environment that is conducive to drying. Raising the temperature of the slab will have the greatest drying effect in conjunction with a low ambient relative humidity level. Conclusion: The design benefits of lightweight concrete should not be discarded with the belief that switching to normal weight concrete alone will solve the slab drying problem.
13
References:
1. H.W. Brewer, “Moisture Migration – Concrete Slab-on-Ground Construction,” Bulletin D89, Portland Cement Association, Skokie, Illinois, May 1965.
2. Suprenant, Bruce A. and Malisch, Ward R., “Long Wait for Lightweight”, Concrete Construction Magazine, Hanley Wood, LLC., November 16, 2000.
3. Fire Resistance Directory, Volume 1, Underwriters Laboratories, Inc., Northbrook, Illinois, 2009, pp 219-222.


