A high irradiance laser’s focal spot, shaped as a nar-row line of 10–20mm in length by 10–50 μm in width,induces the formation of a plasma column above theirradiated target. The plasma column is functionalto the generation of an extreme ultraviolet (EUV;i.e., λ ∼ 10–50nm) or soft x-ray (1–10nm) coherentradiation (laser) by means of amplified spontaneousemission (ASE) in single-pass amplification alongthe column's length. Besides cylindrical lenses, para-bolic and spherical reflectors have proved efficient ingenerating a line focus, i.e., utilizing either (i) astig-matism or (ii) spherical aberration. Astigmatism isobserved when the tangential and sagittal foci donot coincide, which induces two line foci on the cor-responding planes. A tilt of the focusing mirror, cen-trally illuminated, leads to a change of the tangentialfocus as given by
f T ¼ ðR=2Þ cos θ ð1Þ
and a change of the sagittal focus as given by
f S ¼ ðR=2Þ= cos θ; ð2Þ
where R is the radius of curvature of the mirror and θis the mirror tilt angle. The focal spots thus appearstretched over a certain length as a thin stripe oflight. On the other hand, spherical aberration is thevariation of focus location with illumination apertureon the sphere surface. A spherical mirror can thusinduce a line focus stretched along the focal planewhen illuminated nonradially with a pencil of lightimpinging on an off-axis region. In the particularcase of an illumination beam parallel to the mirror-symmetry axis, the line focus is produced along suchan optical axis itself. The general case of nonparallelorientation has been discussed elsewhere [1,2].
The two frames of reference while generating a linefocus, i.e., that of exploiting astigmatism (on-axis illu-mination of a tilted reflector) and that of using sphe-rical aberration (off-axis illumination of a reflector),are physically equivalent and produce the same irra-diance distribution on the target. This is mathemati-cally proved if a reference system transformation isdeployed. Figure 1 shows the equivalence between as-tigmatic focusing and spherical-aberration focusing.The former geometry implies tilting a reflector (thicktraces in Fig. 1) that can be interpreted as a segmentof a large-aperture reflector (thin traces in Fig. 1) of
identical radius of curvature. In Fig. 1, the line focuslies along the optical axis, and in order to keep the tar-get fixed in space, the spherical collectors are shiftedaccordingly. In fact, to keep the target fixed at the cen-ter of Fig. 1, the tilted mirror is shifted backward fordecreasing grazing angle (θ) according to the distanceof the sagittal focus.
In x-ray laser science there is an interest in gener-ating line foci at a low grazing angle to maximize theoutput by means of so-called grazing incidencepumping (GRIP) [3]. On the other hand, a large graz-ing angle is beneficial for scaling down the outputwavelength. In fact, due to the sin2θ dependence ofthe optical penetration depth into a plasma [4], alarge θ permits depositing of the energy deeper intothe plasma, at higher electron densities, which isrequired for short-wavelength lasing. Hence a firstissue to address while line focusing is the trade-offbetween efficiency and wavelength scaling.
Furthermore, the use of focusing reflectors hasshown advantages in terms of intensity throughput,lower wavefront distortion, and damage thresholdwith respect to cylindrical lenses. A parabolic mirroris beyond the scope of the present communication.Our investigations indicated that a parabolic mirrorproduces broader line foci than an equivalent spheri-cal mirror. A broad line focus can make the overlap-ping of prepulses to the main pulse easier. On theother hand, spherical mirrors may produce signifi-cantly hotter and denser plasma conditions atcomparable drive beam energy by means of tighterfocusing.
The aim of this work was to investigate theparameter-dependent characteristics of the line fo-cus obtained with a spherical reflector and relatethem to the laser plasma column for ASE. Morespecifically, the study considered the angle of inci-dence, the profile of the driver beam, and the beamdiameter. We will show results obtained with an in-house code and validate the computational resultswith previous experimental data [5].
2. Methods
Simulations were done using self-written three-dimensional (3D) ray-tracing code (in the followingjust KuBERT from “Kubisch BErn Ray Tracing”).KuBERT has two major advantages: 1) it is rapid,both in the geometry construction and in the problemsolving, since it focuses on computation of the veryessential information we are interested in; 2) it isself-written, and hence open-source and more man-ageable and controllable in its functionality. Its cap-ability for vectorial propagation of arbitrary beamprofiles in optical media makes it an effective toolfor the study of line-focus irradiance distributionsas a function of beam profile and focusing geometry.The Visual Basic code (based on the .NET Frame-work library) takes a number of inputs for the illumi-nation (e.g., ray bundle discretization and width,divergence, energy, wavelength) and for the optics,such as element type (e.g., lens, mirror, grating,), ver-tex coordinates, shape, rotation, and offset. Specialillumination profiles (e.g., “super-Gaussian”) can berealized using masks in front of the homogeneoussource. Given a certain optics type, additional inputsmay be requested, such as refractive index for lenses.The optics are thus modeled as sequential objects,rather than as juxtaposed surfaces as in much com-mercial software. This facilitates the construction ofthe geometry. The input data are processed as a vec-tor basis (multiplied by the given energy distributionfunction) using free beam propagation, Snell's law,and reflection law, finally counting the ray-trace in-tercepts on an autofocus plane (image). This permitsus to generate a number of plots, such as ray path,intensity profiles (one-dimensional) or mappings(two-dimensional) at given surfaces, spot diagrams(vector propagation), optical path length, and travel-ing-wave speed (useful for x-ray laser studies). Nophysical effects are accounted for (only geometry),such as polarization, interference, etc. The geometricpropagation is in 3D.
The driver laser was simulated as a super-Gaussian beam, i.e., characterized by a radial inten-sity profile given by the following relation:
IðrÞ ¼ IoExp½−2ðr=roÞ2N �; ð3Þ
where Io is the peak intensity, ro is the beam radius,andN is the super-Gaussian exponent that forN ¼ 1provides a TEM00 mode profile. As given in Table 1,the default value was N ¼ 6.
Fig. 1. Geometry of the line-focus generation with a sphericalreflector oriented for three grazing incidence angles on the target.In the sketch the target position is kept fixed, and the reflector ismoved correspondingly. The radius of curvature (ROC) is taken asin the Bern x-ray laser facility (“BeAGLE” system). The sketch vi-sualizes the equivalence between the two discussed line-focusinggeometries; i.e., thick traces indicate tilted reflectors and thintraces indicate an off-axis large-aperture illuminated reflector.
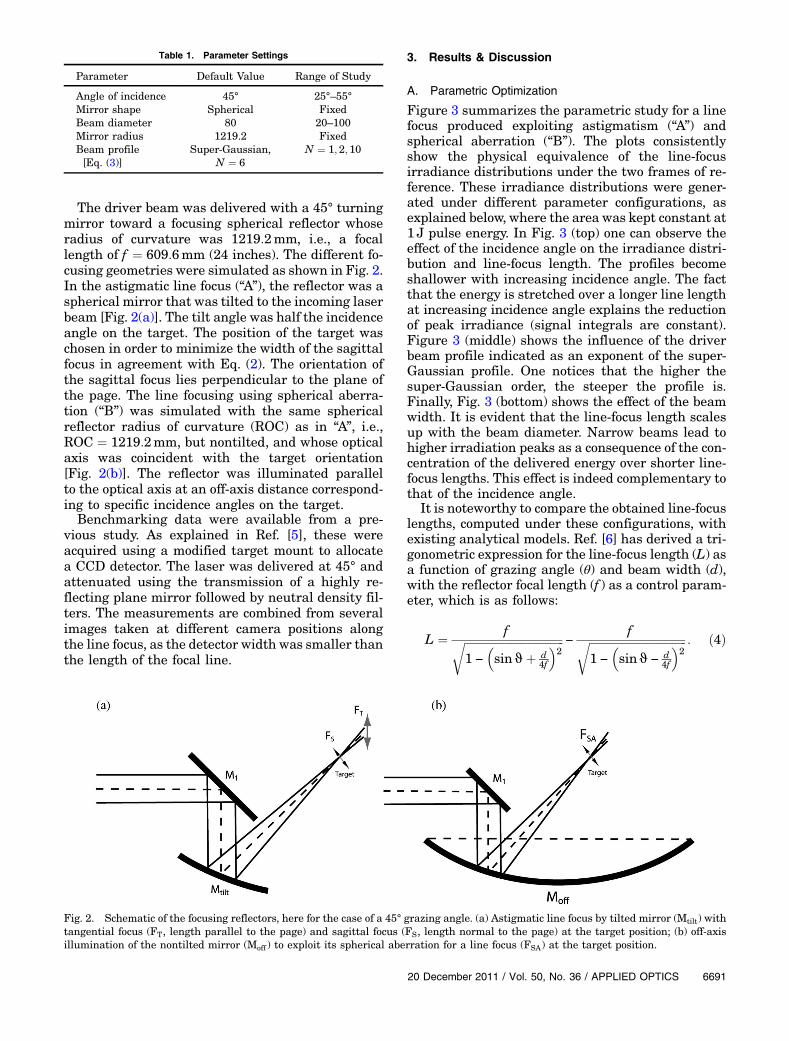
The driver beam was delivered with a 45° turningmirror toward a focusing spherical reflector whoseradius of curvature was 1219:2mm, i.e., a focallength of f ¼ 609:6mm (24 inches). The different fo-cusing geometries were simulated as shown in Fig. 2.In the astigmatic line focus (“A”), the reflector was aspherical mirror that was tilted to the incoming laserbeam [Fig. 2(a)]. The tilt angle was half the incidenceangle on the target. The position of the target waschosen in order to minimize the width of the sagittalfocus in agreement with Eq. (2). The orientation ofthe sagittal focus lies perpendicular to the plane ofthe page. The line focusing using spherical aberra-tion (“B”) was simulated with the same sphericalreflector radius of curvature (ROC) as in “A”, i.e.,ROC ¼ 1219:2mm, but nontilted, and whose opticalaxis was coincident with the target orientation[Fig. 2(b)]. The reflector was illuminated parallelto the optical axis at an off-axis distance correspond-ing to specific incidence angles on the target.
Benchmarking data were available from a pre-vious study. As explained in Ref. [5], these wereacquired using a modified target mount to allocatea CCD detector. The laser was delivered at 45° andattenuated using the transmission of a highly re-flecting plane mirror followed by neutral density fil-ters. The measurements are combined from severalimages taken at different camera positions alongthe line focus, as the detector width was smaller thanthe length of the focal line.
3. Results & Discussion
A. Parametric Optimization
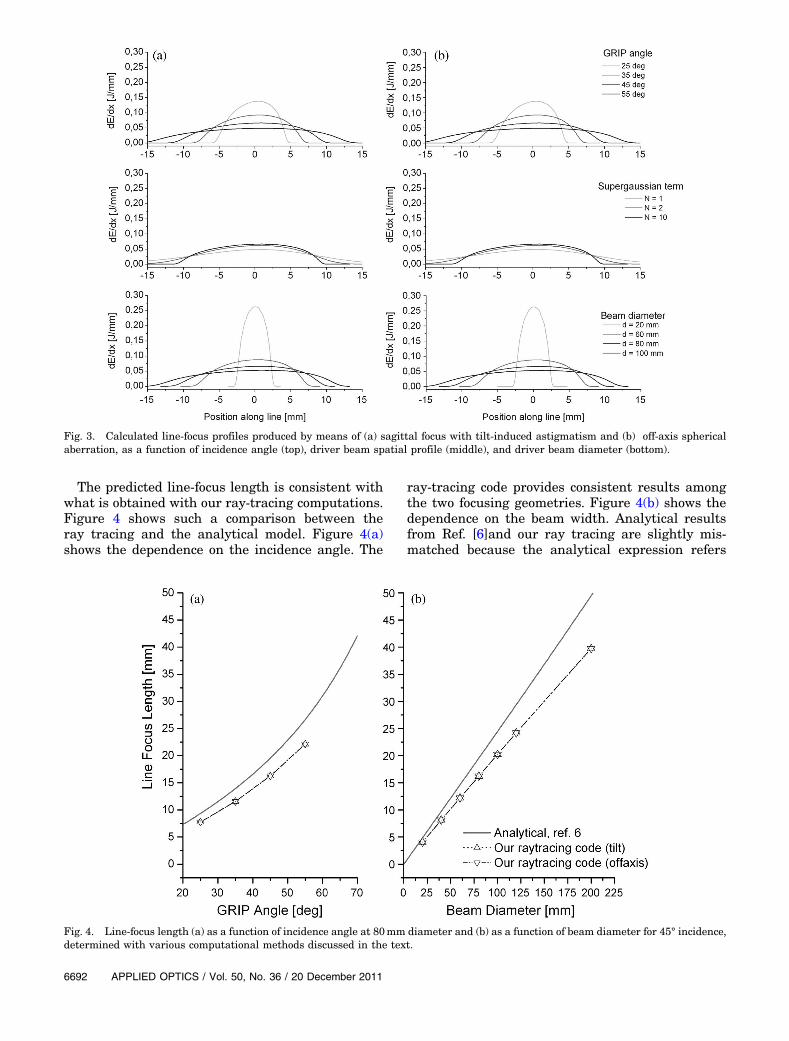
Figure 3 summarizes the parametric study for a linefocus produced exploiting astigmatism (“A”) andspherical aberration (“B”). The plots consistentlyshow the physical equivalence of the line-focusirradiance distributions under the two frames of re-ference. These irradiance distributions were gener-ated under different parameter configurations, asexplained below, where the area was kept constant at1 J pulse energy. In Fig. 3 (top) one can observe theeffect of the incidence angle on the irradiance distri-bution and line-focus length. The profiles becomeshallower with increasing incidence angle. The factthat the energy is stretched over a longer line lengthat increasing incidence angle explains the reductionof peak irradiance (signal integrals are constant).Figure 3 (middle) shows the influence of the driverbeam profile indicated as an exponent of the super-Gaussian profile. One notices that the higher thesuper-Gaussian order, the steeper the profile is.Finally, Fig. 3 (bottom) shows the effect of the beamwidth. It is evident that the line-focus length scalesup with the beam diameter. Narrow beams lead tohigher irradiation peaks as a consequence of the con-centration of the delivered energy over shorter line-focus lengths. This effect is indeed complementary tothat of the incidence angle.
It is noteworthy to compare the obtained line-focuslengths, computed under these configurations, withexisting analytical models. Ref. [6] has derived a tri-gonometric expression for the line-focus length (L) asa function of grazing angle (θ) and beam width (d),with the reflector focal length (f ) as a control param-eter, which is as follows:
L ¼ fffiffiffiffiffiffiffiffiffiffiffiffiffiffiffiffiffiffiffiffiffiffiffiffiffiffiffiffiffiffiffiffiffiffiffiffi1 −
Fig. 2. Schematic of the focusing reflectors, here for the case of a 45° grazing angle. (a) Astigmatic line focus by tilted mirror (Mtilt) withtangential focus (FT, length parallel to the page) and sagittal focus (FS, length normal to the page) at the target position; (b) off-axisillumination of the nontilted mirror (Moff ) to exploit its spherical aberration for a line focus (FSA) at the target position.
The predicted line-focus length is consistent withwhat is obtained with our ray-tracing computations.Figure 4 shows such a comparison between theray tracing and the analytical model. Figure 4(a)shows the dependence on the incidence angle. The
ray-tracing code provides consistent results amongthe two focusing geometries. Figure 4(b) shows thedependence on the beam width. Analytical resultsfrom Ref. [6]and our ray tracing are slightly mis-matched because the analytical expression refers
Fig. 3. Calculated line-focus profiles produced by means of (a) sagittal focus with tilt-induced astigmatism and (b) off-axis sphericalaberration, as a function of incidence angle (top), driver beam spatial profile (middle), and driver beam diameter (bottom).
Fig. 4. Line-focus length (a) as a function of incidence angle at 80mm diameter and (b) as a function of beam diameter for 45° incidence,determined with various computational methods discussed in the text.
to the full line length on the target surface and alsoassumes a fully flat-top profile. In our ray-tracingcomputation we have more fully accounted for phy-sical factors, such as the illumination profile (super-Gaussian), the intensity distribution on the target,and the geometry of focusing.
The irradiance distributions in Fig. 3 show that bychanging one parameter, multiple profile character-istics are modified. For instance, an increase in inci-dence angle alters the leading and the trailing edges,the overall length, etc. For small beam diametersthe profile structure is not changed but only scaled,except when changing the beam profile. With in-creasing beam diameter the line-focus profile be-comes increasingly asymmetric. To highlight suchinterparametric dependence, normalization of bothFWHM and peak were applied to the distributions,from the data shown in Fig. 3 and visualized in Fig. 5.In these plots the FWHM is centered on 0 (i.e., from−0:5 to 0.5), and the irradiance values of each curveare taken from the background-corrected value. Inphysical terms, this corresponds to changing pairsof parameters consistently to maintain the line-focusing extension. For instance, one may cochangethe incidence angle and beam width altogether, suchthat the line-focus length remains constant at var-ious incidence angles. One notices that the distribu-tions for the case of the variation of the incidenceangle (Fig. 5, top) and the variation of beam diameter
(Fig. 5, bottom) show insignificant modification.This indicates that the irradiance structure is notmodified by operating on such parameters; only thedistributions are rescaled to different extents. Thechange of the beam Gaussian profiles is, on the otherhand, causing a significant remodulation in distribu-tion bandwidth, especially noticeable at the edges(Fig. 5, middle). This suggests that one can consis-tently optimize the line-focus irradiance profiles byoperating on angle and beam width and preferablyhomogenizing the driver beam profile (e.g., super-Gaussian N > 6).
B. Amplification Length
The line-focus optimization affects the driver irradi-ance as well as the effective amplification length. Thedriver irradiance must be higher than a givenamplification threshold, but indeed not much higherto prevent loss of inversion due to collisional de-exicitation in an overly hot/dense plasma [7]. Anyexcess beam energy, with respect to the thresholdrequirements, may be instead used for extendingthe line-focus length. Increasing the line-focus lengthas much as possible is advantageous for increasingthe amplification length, as long as the pump irradi-ance is above the threshold value. The thresholdvalue can be inferred from the optimum plasmatemperature/density for EUV amplification [8].
Fig. 5. Width- and peak-normalized line-focus irradiance profiles produced by means of (a) sagittal focus with tilting-induced astigma-tism and (b) off-axis spherical aberration as a function of incidence angle (top), beam profile (middle), and beam diameter (bottom).
The line-focus length can be increased, as shownabove, with a larger grazing angle, as long as thedecrease in peak irradiance is still above the amplifi-cation threshold. The increase of the grazing angleshould thus produce increasingly stronger x-ray laseramplification, because a noise signal above thresholdis amplified over a longer column. For an excessive in-crease of the grazing angle, the peak irradiance alongthe line focus drops beneath the threshold value andthus impedes noise signal growth in an ASE regime.
Analyzing the structure of the line-focus irradiancedistributions shown in Fig. 3(a), one notices that twoincidence curves cross each other at specific pointson their trailing and leading edges. The leading-edge cross point (let us call it “L”) is higher thanthe trailing-edge one (let us call it “T”), as shown inFig. 6(a). This is due to the skewness of the profiles.Considering that the skewness is graduallymitigatedat increasing incidence angle, the height gap betweenthe two cross points also is consistently reduced at alarge grazing angle.
Let us consider, as visualized in Fig. 6(a), ahorizontal line that indicates the amplificationthreshold. The amplification length is thus the seg-ment joining the incidence curve trailing and leadingedges above the threshold line. If such a threshold isvery low, all irradiance curves shown are mainly inthe amplification range. If the threshold is elevated,the shallowest curve will gradually fall below theamplification cutoff. More specifically, one can define
four important cases depending on the height of thethreshold, namely:
Case A: The threshold is at the point T (lowercross point).
Case B: The threshold is between point T and pointL (higher cross point).
Case C: The threshold is between point L and pointP (curve peak).
Case D: The threshold is at or above P.
If the amplification threshold is consistent withcase A, then the irradiance is above the amplificationthreshold even at the largest possible incidenceangle. Figure 6(b) shows the amplification lengthas a function of grazing angle for the four cases. Thediscussed case A has no definitive optimum (topvalue), since the threshold is the lowest and any ir-radiation induces amplification. If the amplificationthreshold fits case B, the amplification length tendsto reach a plateau at a large grazing angle [Fig. 6(b)].If the threshold is further raised to fit case C, the am-plification length increases with increasing grazingangle up to an optimum value. Hence, the occurrenceof an optimum value in the amplification length ver-sus the grazing angle dependence is indicative of athreshold located within the range of the irradiancesdeposited on the target. Finally, if the threshold fitscase D, the amplification length will increase at acomparable rate, as in the cases above [Fig. 6(b)],but beyond a certain optimum value, the drop of am-plification length is more pronounced. Hence, thehigher the threshold, the faster the drop is at highgrazing angles, as shown in Fig. 6(b).
The model presented above is in agreement withour own experimental observation published pre-viously [5] concerning the occurrence or lack of anoptimum, which was so far not fully understood. Inthat work we indeed reported experimentally the ab-sence/occurrence of an optimum for the case of palla-dium (Pd) target irradiated with 2 J and 5 J. Theirradiance distribution profiles obtained at 2J anda large grazing angle were possibly closer to the am-plification threshold, which is confirmed by an opti-mum value at θ ¼ 35°. In the case at 5 J, all studiedirradiance profiles were largely above the amplifica-tion threshold, which did not provide any specificoptimum up to the boundary data.
For the cases analyzed here, i.e., with the set ofcurves at incidence angles of 25°, 35°, 45°, and 55°,we have used the θ ¼ 25° peak height (point M) asthe normalization value and computed the othercurves accordingly in a percent scale [Fig. 6(a)]. Inthis respect, the T and the L points are identifiedas crossing points among the θ ¼ 45° and the θ ¼55° curves at ordinate values as follows: T is at26.8%, L is at 29.7%, P is at 34.7%. The discussionhere is based on four arbitrarily chosen irradiancecurves, but it can be generalized for any set of N ir-radiance distributions and the crossing between anyarbitrarily spaced Nth and ðN − 1Þth irradiance
Fig. 6. (a) Normalized line-focus irradiance distributions as afunction of incidence angle from Fig. 3(a). One can define four im-portant cases for an amplification threshold, as explained in thetext (cases are labeled as A, B, C, D). (b) Depending on the fourcases, the amplification length will have an optimum (high thresh-old) or not (low threshold), as a function of incidence angle.
curves. The discussion here neglects refractive lossesand assumes that a longer plasma column implies alonger gain–length product.
C. Incidence Angle Adjusted by Tilting the Target
Grazing angle variation has been proposed by tiltingthe target instead of moving the focusing optics [9].The characteristics of the line focus under thesefocusing conditions are therefore investigated.Although such an inclination of the target correlateswith the incidence angle, it should be noticed that thebeam profile typically evolves along the direction ofpropagation. At the sagittal focus a line focus is“naturally” generated. The latter evolves in the sagit-tal and tangential planes, such that the aspect ratiois inverted and a 90° rotated line spot is produced atthe tangential focus. By tilting the sample, addi-tional aberration and coma are induced. The spotdiagrams obtained for the four incidence angles dis-cussed above are shown in Fig. 7, with a tilt angle ofthe target of 2° with respect to the nominal value.
The spot diagrams of Fig. 7 are indeed scale-invariant, and when plotted nondimensionally theylook identical. The most distinguishing feature isthe bilobed (“propellerlike”) shape, which indicatesa variation of focal irradiance across the spot. Thetrailing and leading edges are thus characterizedby lower irradiance than the central part. This effect
is exacerbated at large grazing angles, with the con-clusion that at large target tilt the plasma column ischaracterized by increased longitudinal gradients intemperature and density.
In Ref. [9], these effects are not observed for thespecific experimental setup chosen. In fact, the tar-get was tilted over a relatively wide angular rangeof 12°, while the grazing angle on the focusing mirrorwas kept constant at 7°. An adjustable cylindricallens before the compressor was used to keep thelength of the line focus constant and to avoid theformation of a bilobed line focus.
D. Ray-Tracing Validation
Having so far compared computational results, e.g.,of analytical versus ray-tracing simulations, we turnnow to a comparison with the experimental results(Fig. 8). We show the specific case of a 45° angle ofincidence and a beam of 60mm (FWHM) in diameter,which is what our experimental setup permitted usto acquire. One notes that our ray-tracing code cap-tures the profile quite faithfully throughout. Themeasurement was unfortunately affected by highfrequency noise and lower frequency fluctuationsthat are smoothed out computationally. The predic-tive value of our computation is, however, validated,and with it the extent of the implications discussed
Fig. 7. Spot diagrams obtained by ray tracing with an additional target tilt of 2° to obtain the indicated incidence angles.
for optimized line focusing in soft x-ray amplifiedspontaneous emission lasing.
4. Conclusions
Line-focus irradiation is important for the generationof a plasma column to sustain ASE for laboratory-scale soft x-ray lasers. The adjustment of the drivebeam parameters and irradiation scheme is impor-tant to obtain saturated output, especially at a shortwavelength, which demands conflicting conditions interms of GRIP angle. In this work we performed acomputational study of line-focus generation usingself-written ray-tracing software and comparing theobtained results to experimental measurement ofthe line focus. For the calculations, two beam focusingapproaches were compared, i.e., (1) exploiting astig-matism of a tilted spherical reflector and (2) usingspherical aberration from off-axis spherical mirror il-lumination. In both cases the line-focus length wasshown to increase with a larger grazing incidence an-gle, in agreement with the literature data. Computedirradiance distributions were shown to have a closematch with experimental data of line-irradiance
profiles. We demonstrated that the amplificationlength is optimized at the largest grazing angle forwhich the irradiance is still above the amplificationthreshold. Therefore, a “sledge-hammer approach,”i.e., high peak irradiation at short line foci, may leadto nonoptimum x-ray output. The delivering of thedrive pulses at the incidence angle induced by tiltingthe target, instead of the focusing setup,was shown todeteriorate the line focus characteristics.
The authors are grateful to T. Feurer for invaluablesupport and to C. Imesch andM. Grünig for prelimin-ary investigations. The project is supported by theSwiss National Science Foundation and partly bythe Holcim Stiftung Wissen. Discussions with parti-cipants of the COST MP0601 actions have been alsouseful.
References1. I. N. Ross and E. M. Hodgson, “Some optical designs for the
generation of high quality line foci,” J. Phys. E 18, 169–173(1985).
2. I. N. Ross, J. Boon, R. Corbett, A. Damerell, P. Gottfeldt, C.Hooker, M. H. Key, G. Kiehn, C. Lewis, and O. Willi, “Designand performance of a new line focus geometry for x-ray laserexperiments,” Appl. Opt. 26, 1584–1588 (1987).
3. R. Keenan, J. Dunn, V. N. Shlyaptsev, R. F. Smith, P. K. Patel,and D. F. Price, “Efficient pumping schemes for high averagebrightness collisional x-ray lasers,” Proc. SPIE 5197,213–219 (2003).
4. W. Kruer, The Physics of Laser Plasma Interactions(Westview, 2003).
5. M. Gruenig, C. Imesch, F. Staub, and J. E. Balmer, “Saturatedx-ray lasing in Ni-like Sn at 11:9nm using the grazing inci-dence scheme,” Opt. Commun. 282, 267–271 (2009).
6. D. Ursescu, “Grazing incidence pumped Zr x-ray laser forspectroscopy on Li-like ions,” Ph.D. Thesis (J. GutenbergUniversity, 2006).
7. R. C. Elton, X-Ray Lasers (Academic, 1990).8. G. J. Pert, “Optimizing the performance of nickel-like collision-
ally pumped x-ray lasers,” Phys. Rev. A 73, 033809 (2006).9. Y. Wang, M. A. Larotonda, B. M. Luther, D. Alessi, B. Berrill,
V. N. Shlyaptsev, and J. J. Rocca, “Demonstration of high-repetition-rate tabletop soft-x-ray lasers with saturated out-put at wavelengths down to 13:9nm and gain down to10:9nm,” Phys. Rev. A 72, 053807 (2005).
Fig. 8. Comparison of experimental and computational results.The experimental curve was obtained with an incidence angleof 45°, a beam diameter of 60mm (FWHM), and a super-Gaussianprofile of order N ¼ 6.