Linear and non-linear relationships: Year 9 MATHEMATICS CONCEPTUAL NARRATIVE Leading Learning: Making the Australian Curriculum work for us by bringing CONTENT and PROFICIENCIES together www.acleadersresource.sa.edu.au
Transcript
Linear and non-linear relationships: Year 9MATHEMATICS CONCEPTUAL NARRATIVE
Leading Learning: Making the Australian Curriculum work for us by bringing CONTENT and PROFICIENCIES together
www.acleadersresource.sa.edu.au
ContentsWhat the Australian Curriculum says about ‘Linear and non-linear relationships’ 3Content descriptions, year level descriptions, achievement standards and numeracy continuum
Working with Linear and non-linear relationships 4Important things to notice about this sub-strand of the Australian Curriculum: Mathematics and numeracy continuum
Engaging learners 5Classroom techniques for teaching Linear and non-linear relationships
From tell to ask 6Transforming tasks by modelling the construction of knowledge (Examples 1–4)
Proficiency: Problem-solving 13Proficiency emphasis and what questions to ask to activate it in your students (Examples 5–7)
Connections between ‘Linear and non-linear relationships’ and other maths content 17A summary of connections made in this resource
‘Linear and non-linear relationships’ from Year 7 to Year 10A 18
Resources 20
Linear and non-linear relationships: Year 9 | MATHEMATICS CONCEPTUAL NARRATIVE2
Res
ourc
e ke
y
The ‘AC’ icon indicates the Australian Curriculum: Mathematics content description(s) addressed in that example.
The ‘From tell to ask’ icon indicates a statement that explains the transformation that is intended by using the task in that example.More information about ‘Transforming Tasks’: http://www.acleadersresource.sa.edu.au/index.php?page= into_the_classroom
Look out for the purple pedagogy boxes, that link back to the SA TfEL Framework.
The ‘Bringing it to Life (BitL)’ tool icon indicates the use of questions from the Leading Learning: Making the Australian Curriculum Work for Us resource.
Bringing it to Life (BitL) key questions are in bold orange text.
Sub-questions from the BitL tool are in green medium italics – these questions are for teachers to use directly with students.More information about the ‘Bringing it to Life’ tool: http://www.acleadersresource.sa.edu.au/index.php?page= bringing_it_to_life
◆ ◆ ◆ ◆ ◆Throughout this narrative—and summarised in ‘Linear and non-linear relationships’ from Year 7 to Year 10A (see page 18)—we have colour coded the AC: Mathematics year level content descriptions to highlight the following curriculum aspects of working with linear and non-linear relationships:
◆ Plotting and sketching skills and strategies
◆ Connection between numerical, algebraic and graphical representations and methods
◆ Strategies for solving equations
◆ Using digital technologies.
Socratic questioning
Student voice
Explore before explain
Use dialogue
From tell to ask
Linear and non-linear relationships: Year 9 | MATHEMATICS CONCEPTUAL NARRATIVE 3
Content descriptionsStrand | Number and algebra.
Sub-strand | Linear and non-linear relationships.
Year 9 ◆ ◆ | ACMNA214 Students find the distance between two points located on a Cartesian plane using a range of strategies, including graphing software.
Year 9 ◆ ◆ | ACMNA294 Students find the midpoint and gradient of a line segment (interval) on the Cartesian plane using a range of strategies, including graphing software.
Year 9 ◆ ◆ | ACMNA215 Students sketch linear graphs using the coordinates of two points and solve linear equations.
Year 9 ◆ ◆ ◆ | ACMNA296 Students graph simple non-linear relations with and without the use of digital technologies and solve simple related equations.
Year level descriptionsYear 9 ◆ | Students develop strategies in sketching linear graphs.
Achievement standardsYear 9 ◆ | Students find the distance between two points on the Cartesian plane.
Year 9 ◆ | Students find the gradient and midpoint of a line segment.
Year 9 ◆ | Students sketch linear and non-linear relations.
Numeracy continuumRecognise and use patterns and relationships
End of Year 10 ◆ | Students explain how the practical application of patterns can be used to identify trends. (Recognise and use patterns and relationships: Linear and non-linear relationships).
What the Australian Curriculum says about ‘Linear and non-linear relationships’
Source: ACARA, Australian Curriculum: Mathematics
Working with Linear and non-linear relationshipsImportant things to notice about this sub-strand of the Australian Curriculum: Mathematics and numeracy continuum
What we are building on and leading towards in Year 9 ‘Linear and non-linear relationships’In Year 7 students plot given coordinates and make observations about where points lie on a straight line or otherwise. Students make the step from solving problems that have been expressed as number sentences, to solving simple linear (algebraic) equations.
In Year 8 students continue to plot coordinates on a Cartesian plane, but now they are expected to generate coordinates from linear equations. This will be done with and without digital technologies. Developing this skill enables students to explore the use of graphical techniques as well as algebraic methods for solving simple linear equations.
In Year 9 students continue to solve linear equations graphically, but they develop efficiency through understanding that a linear graph can be sketched from plotting just two points. Students investigate gradients of linear graphs and develop techniques for calculating the distance between two points and the midpoint of lines on a Cartesian plane.
In Year 10 students use their understanding of gradients to solve problems involving parallel and perpendicular lines. They continue to solve linear equations that now may involve simple algebraic fractions. Students transfer their skills from solving linear equations to solving linear inequalities. They apply their ability to plot linear equations (with and without digital technologies) to solve simultaneous equations graphically and explore the use of algebraic technique. Quadratic equations, equations of circles, and exponents are introduced and students explore the connection between the algebraic and graphical representation. At this stage, students are only expected to sketch and solve equations of quadratics.
In Year 10A students sketch parabolas, circles and exponential functions, and solve simple exponential equations. They investigate the features of graphs and develop an understanding of the connection between the graphical and algebraic representation of polynomials so that they are able to sketch a range of curves and describe the features of the curves from looking at their equation. Factorisation of quadratics extends to non-monic quadratic equations.
• Developing linear relationships from practical and real-life situations, supports students in gaining a conceptual understanding that the straight line is representing a relation between two varying quantities. Once this understanding has been established, concepts of coordinates, equations, slope and Y-intercept have some significance to the learner; particularly if they have encountered linear relationships in a range of different contexts.
• As well as providing situations where linear relationships occur, it is valuable to identify non-linear relationships as well, so that learners realise that not all relationships will be linear. In the James Nizam sculpture of the stacking goblets (see ‘Example 8: Stacking sculpture’ in the Linear and non-linear relationships: Year 8 narrative), the number of goblets in each level is a linear relationship (Level 1 has 1 goblet, Level 2 has 2 goblets, etc) but the number of goblets in the entire sculpture as it grows is not (after one level the structure has 1 goblet, after two levels it has 3, after three levels it has 6 …).
Linear and non-linear relationships: Year 9 | MATHEMATICS CONCEPTUAL NARRATIVE4
Grade, pitch and slopeGrade, pitch, and slope are important components in landscape and garden design, building and landscape architecture and for engineering and aesthetic design factors. In environmental design, drainage, slope stability, navigation by people and vehicles, complying with building codes and design integration are all aspects of slope considerations.
‘Jobs that use maths slopes’ can be found at: https://sciencing.com/jobs-use-math-slopes-7231483.html
Source: Alicia Rudnicki (2017) ‘Jobs that use maths slopes’, Sciencing, Leaf Group Education
Triangle puzzlerStudents can construct this intriguing puzzle. The answer as to where the extra unit came from can be explained by considering the slope of the two lines that make up the ‘hypotenuse’ of the larger triangle.
Placing a ruler along this ‘side’ reveals that it is not a straight line and that the blue and red hypotenuses do not have the same slope ( 3
8 ≠ 25 ).
See ‘Example 3: Triangle puzzler – gradient’ in this narrative for further information.
Baldwin StreetAccording to Guinness World Records, Baldwin Street in Dunedin, New Zealand is the steepest street in the world.
The street has the following properties:
• 161.2m in length with an elevation gain of 47.22m
• An average gradient of 1 in 3.41
• A maximum gradient of 1 in 2.86.
It is the site of the annual Cadbury Jaffa Race, where up to 25,000 Jaffas are released at the top of the incline and bounce their way in a sea of orange to the bottom. The 2013 Cadbury Jaffa Race down Baldwin Street video can be found at: https://www.youtube.com/watch?v=zYZCcABDuWE
Cyclists from all over the world travel there in order to conquer the climb. Watch the strategies of the riders as they begin to struggle. Why does this work?
Cycling up the steepest street in the World in New Zealand video can be found at: https://www.youtube.com/watch?v=a9uO3KCJImA
Baldwin St World Record video can be found at: https://www.youtube.com/watch?v=hhXRZjcgKgY
Source: Rudy Pospisil (2017) Baldwin St World Record, https://www.youtube.com/watch?v=hhXRZjcgKgY
Linear and non-linear relationships: Year 9 | MATHEMATICS CONCEPTUAL NARRATIVE 5
Engaging learnersClassroom techniques for teaching Linear and non-linear relationships
Socratic questioning
Student voice
Explore before explain
Use dialogue
From tell to ask
From tell to askTransforming tasks by modelling the construction of knowledge (Examples 1–4)
The idea that education must be about more than transmission of information that is appropriately recalled and applied, is no longer a matter for discussion. We know that in order to engage our students and to support them to develop the skills required for success in their life and work, we can no longer rely on a ‘stand and deliver’ model of education. It has long been accepted that education through transmission of information has not worked for many of our students. Having said this, our classrooms do not necessarily need to change beyond recognition. One simple, but highly effective strategy for innovation in our classrooms involves asking ourselves the question:
What information do I need to tell my students and what could I challenge and support them to develop an understanding of for themselves?
For example, no amount of reasoning will lead my students to write the equation of a line in algebraic form themselves. They need to receive this information in some way. However, it is possible my students can be challenged with questions that will result in them identifying the relationship between the coordinates, so I don’t need to instruct that information.
At this stage of development, students can develop an understanding of the patterns and relationships that can exist on a coordinate system. When teachers provide opportunities for students to recognise, create and describe relationships between coordinates of points, they require their students to generalise. Telling students rules and relationships removes this natural opportunity for students to make conjectures and verify and apply connections that they notice. Using questions such as the ones described here, supports teachers to replace ‘telling’ the students information, with getting students to notice for themselves.
When we are feeling ‘time poor’ it’s tempting to believe that it will be quicker to tell our students a formula, rather than ask a question (or series of questions) and support them to establish a formula for themselves. Whether this is true or not really depends on what we have established as our goal. If our goal is to have students recall and apply a particular rule or theorem during the current unit of work, then it probably is quicker to tell them the rule and demonstrate how to apply it. However, when our goal extends to wanting students to develop conceptual understanding, to learn to think mathematically, to have a self-concept as a confident and competent creator and user of mathematics, then telling students the rule is a false economy of time.
When we challenge our students to establish a theorem, we model that algebra can be powerful and useful. We provide our students with an authentic context for working algebraically. Telling students formulae removes this opportunity for students to generalise.
Curriculum and pedagogy linksThe following icons are used in each example:
The ‘AC’ icon indicates the Australian Curriculum: Mathematics content description(s) addressed in that example.
The ‘Bringing it to Life (BitL)’ tool icon indicates the use of questions from the Leading Learning: Making the Australian Curriculum Work for Us resource.The Bringing it to Life tool is a questioning tool that supports teachers to enact the AC: Mathematics Proficiencies: http://www.acleadersresource.sa.edu.au/index.php?page=bringing_it_to_life
The ‘From tell to ask’ icon indicates a statement that explains the transformation that is intended by using the task in that example.This idea of moving ‘From tell to ask’ is further elaborated (for Mathematics and other Australian Curriculum learning areas) in the ‘Transforming Tasks’ module on the Leading Learning: Making the Australian Curriculum work for us resource: http://www.acleadersresource.sa.edu.au/index.php?page=into_the_classroom
Look out for the purple pedagogy boxes, that link back to the SA TfEL Framework.
Linear and non-linear relationships: Year 9 | MATHEMATICS CONCEPTUAL NARRATIVE6
Linear and non-linear relationships: Year 9 | MATHEMATICS CONCEPTUAL NARRATIVE 7
From tell to ask examples
Example 1: Homework ratesStudents find the midpoint and gradient of a line segment (interval) on the Cartesian plane using a range of strategies, including graphing software.Students sketch linear graphs using the coordinates of two points and solve linear equations.
ACMNA294 ◆ ◆
ACMNA215 ◆ ◆
Example 2: The race – using linear relations to determine the formula for circumferenceStudents graph simple non-linear relations with and without the use of digital technologies and solve simple related equations.Students sketch linear graphs using the coordinates of two points and solve linear equations.
ACMNA296 ◆◆◆
ACMNA215 ◆ ◆
Example 3: Triangle puzzler – gradientStudents find the midpoint and gradient of a line segment (interval) on the Cartesian plane using a range of strategies, including graphing software.
ACMNA294 ◆ ◆
Example 4: Circumcircles – midpoints and distancesStudents find the distance between two points located on a Cartesian plane using a range of strategies, including graphing software. Students find the midpoint and gradient of a line segment (interval) on the Cartesian plane using a range of strategies, including graphing software.
ACMNA214 ◆ ◆
ACMNA294 ◆ ◆
Linear and non-linear relationships: Year 9 | MATHEMATICS CONCEPTUAL NARRATIVE8
Example 1: Homework rates
Consider using this task from the Linear and non-linear relationships: Year 8 narrative to consolidate the students’ understanding of linear relations and their different representations.
Lisa Simpson is planning to set up a ‘Homework Help’ business. When you hire Lisa to assist you with your homework, there is an initial charge of $2 and then an ongoing charge that is equivalent to $5 per hour. Ask students:
• Do you have any questions?
• What might it cost you to get help with your homework? Is this reasonable?
• How might Lisa show ‘customers’ her price schedule? Is there another way?
• How might you generalise her charges? How might you write it in words/express it using algebraic notation?
• What are some different ways that Lisa might increase her income? Which way is better? Convince Lisa. (Encourage students to graph several options, so that they can see that increasing the initial charge affects the vertical axis intercept, and that the hourly rate affects the slope. They can also see that as there is a positive slope; the more students she tutors, the more she will earn.)
• What does this remind you of? Do any other businesses use a similar method of charging for their services? How is it the same or different?
Students may be familiar with tradespeople who have a callout fee and a charge for every 15 minutes, or a cab charge which has a flag fall then a per km/time charge which is continuous. Challenge students to find different examples. Choose one and represent it in as many ways as possible, for example: in words, in a table, in a graph, and as an algebraic expression.
Ask groups to share their examples and in each case draw connections between the initial value and: the slope as seen in the table, on the graph, in the equation, and how it relates to their context.
If none of the examples have a negative slope, challenge students to consider if this is possible. A simple example is phone credit which reduces with the length of a call.
A backwards question can provide intellectual challenge:
Two students said they hired Lisa to help them with their homework. One stayed for 2 hours and paid $16, while the other stayed for 2.5 hours and paid $19.25.
• How might you generalise her charges? Is there another way? How might you write it in words/ express it using algebraic notation?
Students can discuss whether these rates are reasonable and what they would be prepared to pay or might charge. Graphing different scenarios helps them to identify how the rate per hour affects the gradient of the line and how the initial charge affects the Y-intercept.
Backwards questionsA ‘backwards’ question requires a little more thinking about than a standard application question. We ask this type of question to challenge students to work flexibly with a concept. There are many ways that teachers can do this. Two possible options include asking questions where students need to complete missing information and asking questions that start by giving the students an answer.
(This activity also appears in the Linear and non-linear relationships: Year 8 narrative.)
ACMNA294 ◆ ◆
Students find the midpoint and gradient of a line segment (interval) on the Cartesian plane using a range of strategies, including graphing software.
ACMNA215 ◆ ◆
Students sketch linear graphs using the coordinates of two points and solve linear equations.
Questions from the BitL tool
Understanding proficiency: What patterns/connections/relationships can you see?Can you represent/calculate in different ways?
Reasoning proficiency: In what ways can your thinking be generalised? What can you infer?
Instead of telling students about the equations of a linear relationship, we can challenge students to recognise the relationships between the coordinates of the points for themselves, by asking questions.
Socratic questioning
Student voice
Explore before explain
Use dialogue
From tell to ask
Linear and non-linear relationships: Year 9 | MATHEMATICS CONCEPTUAL NARRATIVE 9
Example 2: The race – using linear relations to determine the formula for circumference
ACMNA296 ◆ ◆ ◆
Students graph simple non-linear relations with and without the use of digital technologies and solve simple related equations.
ACMNA215 ◆ ◆
Students sketch linear graphs using the coordinates of two points and solve linear equations.
Instead of telling students the formula for the circumference of a circle, we can challenge students to explore the connection between circumference and diameter and hence establish the formula, by asking questions.
Questions from the BitL tool
Understanding proficiency: What patterns/ connections/ relationships can you see?
Socratic questioning
Student voice
Explore before explain
Use dialogue
From tell to ask
Consider a race from one red post to another then back, as represented in Figure 1. You can choose to run around the sides of a square (as shown in orange), or take a circular path (blue) or take a straight path, over and back (green).
• Which path would you take and why?
Consider the length of the different paths:
• Which is the shortest/the longest path?
• If the distance between the two posts is 100 metres, can you determine the lengths of any of the paths accurately? For any of the paths you can’t, can you make any statement about their length? (Having a dimension for the circle provides a more concrete way of thinking about this problem. It also allows students to make an estimate for the circumference of the circle before they are asked to generalise for any diameter.)
• If the distance between the two posts is d metres, can you determine an expression for the lengths of any of the paths accurately? For any of the paths you can’t, can you make any statement about their length? (We are looking for students to be able to make a statement such as, ‘The square is 4 times the diameter, 4d, the straight path is 2d and the circular path is less than 4d but more than 2d’.)
Some students may believe that the relationship will change depending on the size of the circle. Ask them:
• What if we use a bigger/smaller circle? What do you think the relationship will be then?
Students could begin to explore this problem using a range of different circles and share their findings. They can change the method for measuring circumference and increase the accuracy of their measurements. Software could be used for a high degree of accuracy.
The relationship between diameter and circumference could be plotted on a graph and the equation of the line could be investigated. This can be done manually or using Excel and ‘fitting a trendline’ (see Figure 2).
Linear and non-linear relationships: Year 9 | MATHEMATICS CONCEPTUAL NARRATIVE10
A similar investigative approach could be taken to establish the relationship between radius and area. Students can draw upon their understanding of calculating the areas of other shapes in their estimate of the areas of a circle.
We can also take this opportunity to consolidate understanding within the Statistics strand. When discussing errors that occur when measuring physical objects, we are exploring the practicalities and implications of collecting data.
We can ask:
• How accurate are the measurements taken from smaller circles? How accurate are the measurements taken from larger circles?
• How can you determine which of these two sets of measurements are more accurate?
Often the data from the larger circles is more accurate as it is physically easier to collect. Even if this is not the case, if you find the errors as a percentage of the measurement being taken, the percentage error of large circles is less than the percentage error for the small circles (all other factors being the same). When investigating percentage differences in this context, we are connecting our understanding in number, statistics and measurement. In this way, we are giving students the opportunity to work mathematically rather than just do mathematics.
(This activity also appears in the Using units of measurement: Year 8 narrative.)
Example 3: Triangle puzzler – gradient
Students can construct this intriguing puzzle (see Figure 3). The answer as to where the extra unit came from can be explained by considering the slope of the two lines that make up the ‘hypotenuse’ of the larger triangle.
Placing a ruler along this ‘side’ reveals that it is not a straight line and that the blue and red hypotenuses do not have the same slope ( 3
8 ≠ 25 ).
In the top ‘triangle’, the hypotenuse dips inwards and in the bottom triangle it bows out. The difference in the area over the full length equates to 1 sq. unit.
ACMNA294 ◆ ◆
Students find the midpoint and gradient of a line segment (interval) on the Cartesian plane using a range of strategies, including graphing software.
Questions from the BitL tool
Understanding proficiency: What patterns/connections/relationships can you see?Can you represent/calculate in different ways?
Reasoning proficiency: In what ways can your thinking be generalised?What can you infer?
Instead of telling students how to use a table of values to plot a line, we can challenge students to go from the known to the unknown for themselves, by asking questions.
Socratic questioning
Student voice
Explore before explain
Use dialogue
From tell to ask
Figure 3
Linear and non-linear relationships: Year 9 | MATHEMATICS CONCEPTUAL NARRATIVE 11
Example 4: Circumcircles – midpoints and distances
Instruct the students to draw any triangle on their page, and ask:
Is it possible to draw a perfect circle around that triangle so that all the vertices lie on the circle? Try it. How did you go?
This activity explores a way for the students to discover how to draw that circle for any triangle.
Begin this activity by plotting points A (-5, 1), B (3, 9) and C (3, -3) using a scale which results in the triangle being about ½ page in size. Ask students:
• How might you find the midpoint, M, of the side AB? How many different ways can you do this? (Students might count squares across and up to be the same for each half, measure, fold the side in half or even use a formula.)
Find the line that passes through M and is at right-angles to AB. This is called the perpendicular bisector. Ask students:
• Why might it be given that name? (Perpendicular means upright or 90º, and bisect means cut in half.)
• How might you draw this line? How many different ways can you do this? (Students might fold the side in half and crease the fold to find the line. They may start at the midpoint (M) they found and make sure they have a perpendicular slope.)
Find the perpendicular bisector of AC. You might do this using the same or a different method. Find the point of intersection, X, of the perpendicular bisectors you have now found. Ask students:
• What do you notice about the distance between X and A, X and B, and X and C? Convince me. (X was the same distance from all 3 points.)
Draw all the points and lines you have found on another set of axes. Using X as the centre, draw a circle passing through point A. Ask students:
• What do you notice?
• Why might you have suspected this when you found the distances earlier? (X was the same distance from all 3 points, so X can be the centre and the common distance is the radius of the circle.)
This circle is called the circumcircle of the triangle ABC (see Figure 4). Ask students:
• Why might it be given that name? (‘Circum’ – as in circumference and circumnavigate means to ‘go around’. This is the circle that ‘goes around’ the triangle.)
• Use what you have learned to draw the circumcircle for the triangle you drew at the start.
ACMNA214 ◆ ◆
Students find the distance between two points located on a Cartesian plane using a range of strategies, including graphing software.
ACMNA294 ◆ ◆
Students find the midpoint and gradient of a line segment (interval) on the Cartesian plane using a range of strategies, including graphing software.
Questions from the BitL tool
Understanding proficiency: What patterns/connections/relationships can you see?Can you represent/calculate in different ways?
Reasoning proficiency: In what ways can your thinking be generalised?What can you infer?
Instead of telling students the formula for midpoints and distances on a Cartesian plane, we can challenge students to go from the known to the unknown for themselves, by asking questions.
Socratic questioning
Student voice
Explore before explain
Use dialogue
From tell to ask
Figure 4
Linear and non-linear relationships: Year 9 | MATHEMATICS CONCEPTUAL NARRATIVE12
When the class share their different methods of finding the midpoint and the distance, it provides the opportunity to talk about what they notice.
For the midpoint, observe that whatever method they used, they found a point that was half way between the two x-values and halfway between the y-values. This is the concept of an ‘average’ with which they are familiar. Ask the students to calculate the averages of the x-coordinates and the average of the y-coordinates for both midpoints that they had found by other methods, to confirm this. Use this technique to find the midpoint of BC. (N.B. The perpendicular of BC will also pass through X.)
This exploration naturally leads to generalising this idea of using averages to find midpoints. Encourage students to explain it in words before using algebraic notation. Draw out the connection between the text and the symbolism. The algebraic generalisation is, of course, the Midpoint Formula:
Midpoint (x1 + x2
2 , y1 + y2
2 )
Discuss the use of subscripts in the formula to show that you are to use the x-values, but that one x-coordinate comes from one point and the other x-coordinate from a second point.
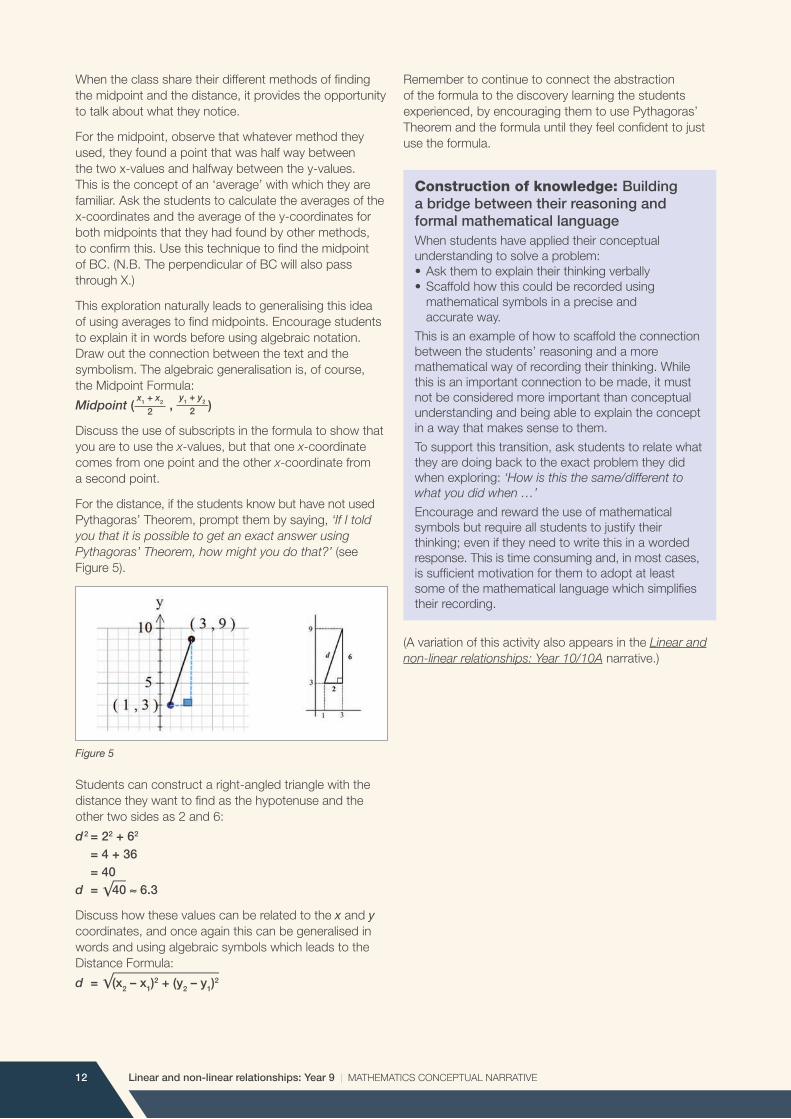
For the distance, if the students know but have not used Pythagoras’ Theorem, prompt them by saying, ‘If I told you that it is possible to get an exact answer using Pythagoras’ Theorem, how might you do that?’ (see Figure 5).
Students can construct a right-angled triangle with the distance they want to find as the hypotenuse and the other two sides as 2 and 6:
d2 = 22 + 62
= 4 + 36 = 40d = 40 ≈ 6.3
Discuss how these values can be related to the x and y coordinates, and once again this can be generalised in words and using algebraic symbols which leads to the Distance Formula:
d = (x2 – x1)2 + (y2 – y1)
2
Remember to continue to connect the abstraction of the formula to the discovery learning the students experienced, by encouraging them to use Pythagoras’ Theorem and the formula until they feel confident to just use the formula.
Construction of knowledge: Building a bridge between their reasoning and formal mathematical language When students have applied their conceptual understanding to solve a problem:• Ask them to explain their thinking verbally• Scaffold how this could be recorded using mathematical symbols in a precise and accurate way.
This is an example of how to scaffold the connection between the students’ reasoning and a more mathematical way of recording their thinking. While this is an important connection to be made, it must not be considered more important than conceptual understanding and being able to explain the concept in a way that makes sense to them.
To support this transition, ask students to relate what they are doing back to the exact problem they did when exploring: ‘How is this the same/different to what you did when …’
Encourage and reward the use of mathematical symbols but require all students to justify their thinking; even if they need to write this in a worded response. This is time consuming and, in most cases, is sufficient motivation for them to adopt at least some of the mathematical language which simplifies their recording.
(A variation of this activity also appears in the Linear and non-linear relationships: Year 10/10A narrative.)
Figure 5
Linear and non-linear relationships: Year 9 | MATHEMATICS CONCEPTUAL NARRATIVE 13
Proficiency: Problem-solvingProficiency emphasis and what questions to ask to activate it in your students (Examples 5–7)
Problems are described in the AC: Mathematics as ‘meaningful’ or ‘unfamiliar’. Students of all abilities and ages should be provided with experiences of both meaningful and unfamiliar problems.
Meaningful problemsMeaningful problems are set in a context that a student can project themselves into. It may be that the mathematics and strategy being applied is familiar to the student or the problem relates to their own life experience. Connecting with a context does not mean that the students have to see it as ‘fun’ nor does it have to relate to an immediately practical situation from daily life.
Students can connect with a problem through provocations such as the use of manipulatives (either physical or digital) or through a dramatisation (eg, a story, interesting background information, a video clip). The intention is to give students the opportunity to work as a mathematician would work, in a context that they can access at their current stage of development.
Unfamiliar problemsFundamentally there are two groups of unfamiliar problems:
• Problems for which the students would not be able to say that they had done a similar example previously, they would therefore need to create an approach (develop a strategy).
• Problems in which the students develop a new piece of knowledge. They begin the problem by applying the knowledge/skills that they have and they complete the problem having recombined that knowledge to form a new piece of understanding.
Growth mindset: Learning that not knowing is the beginning of a learning opportunityUnfamiliar problems tend to provoke a response of, ‘I don’t know’, or ‘I’m not sure’. Students respond differently to this feeling; some shut down, others begin to ask, ‘But how could I work that out?’
In developing powerful learners we are aiming for all of our students to learn that ‘not knowing’ is the beginning of a learning opportunity and that the first move that they need to make on the journey to finding out more is to ask, ‘What could I do to work this out?’
Engaging in problem-solving supports the move from tell to askInstead of telling students:
• the problem to solve
• the information they’ll need
• the steps they should take.
We can ask students to identify:
• the problem to solve
• the information they’ll need
• a possible process to use.
Proficiency: Problem-solving examples
Example 5: Intersecting circles – non-linear relationship in a geometric contextStudents graph simple non-linear relations with and without the use of digital technologies and solve simple related equations.
ACMNA296 ◆◆◆
ACMNA215 ◆ ◆
Example 6: Best midpoint – midpoints and distancesStudents find the distance between two points located on a Cartesian plane using a range of strategies, including graphing software. Students find the midpoint and gradient of a line segment (interval) on the Cartesian plane using a range of strategies, including graphing software.
ACMNA214 ◆ ◆
ACMNA294 ◆ ◆
Example 7: Handshakes – non-linear relationshipStudents graph simple non-linear relations with and without the use of digital technologies and solve simple related equations.
ACMNA296 ◆◆◆
Example 5: Intersecting circles – non-linear relationship in a geometric context
This activity is from the NRICH website.
Students collect data from intersecting circles and identify that the relationship between the number of circles and the number of regions is not linear. The challenge is to identify and describe this non-linear relationship.
The link to the problem on the NRICH website is: http://nrich.maths.org/539
ACMNA296 ◆ ◆ ◆
Students graph simple non-linear relations with and without the use of digital technologies and solve simple related equations.
Questions from the BitL tool
Problem-solving proficiency: Interpret; Model and plan; Solve and check; Reflect.
Reasoning proficiency: What can you infer?
Instead of telling students the information they’ll need and the steps they should take, we can challenge them to identify the information they’ll need and the steps they could take for themselves, by asking questions.
Socratic questioning
Student voice
Explore before explain
Use dialogue
From tell to ask
Linear and non-linear relationships: Year 9 | MATHEMATICS CONCEPTUAL NARRATIVE14
Linear and non-linear relationships: Year 9 | MATHEMATICS CONCEPTUAL NARRATIVE 15
Example 6: Best midpoint – midpoints and distances
This activity is a Three-Act Maths Task from Dan Meyer’s blog: 101 questions. It should be presented to students along with the question:
What’s the first question that comes to mind?
This video activity challenges students to determine who made the best attempt to find the midpoint. It requires the students to identify their own criteria for judging what constitutes ‘best’. This is an opportunity for students to apply their coordinate geometry skills to find exact midpoints and distances.
The best midpoint activity can be accessed at: http://threeacts.mrmeyer.com/bestmidpoint/
ACMNA214 ◆ ◆
Students find the distance between two points located on a Cartesian plane using a range of strategies, including graphing software.
ACMNA294 ◆ ◆
Students find the midpoint and gradient of a line segment (interval) on the Cartesian plane using a range of strategies, including graphing software.
Questions from the BitL tool
Problem-solving proficiency: Interpret; Model and plan; Solve and check; Reflect.
Reasoning proficiency: What can you infer?
Instead of telling students the information they’ll need and the steps they should take, we can challenge them to identify the information they’ll need and the steps they could take for themselves, by asking questions.
Socratic questioning
Student voice
Explore before explain
Use dialogue
From tell to ask
Example 7: Handshakes – non-linear relationship
This activity is from the NRICH website.
Students collect data from a number of mathematicians shaking hands with each other. They can use a range of enactments, representations and models to explore this. The relationship between the number of people and the number of handshakes is not linear. The challenge is to identify and describe this non-linear relationship.
The link to the problem on the NRICH website is: http://nrich.maths.org/6708
(A variation of this activity also appears in the Linear and non-linear relationships: Year 10/10A narrative.)
ACMNA296 ◆ ◆ ◆
Students graph simple non-linear relations with and without the use of digital technologies and solve simple related equations.
Questions from the BitL tool
Problem-solving proficiency: Interpret; Model and plan; Solve and check; Reflect.
Reasoning proficiency: What can you infer?
Instead of telling students the information they’ll need and the steps they should take, we can challenge them to identify the information they’ll need and the steps they could take for themselves, by asking questions.
Socratic questioning
Student voice
Explore before explain
Use dialogue
From tell to ask
Linear and non-linear relationships: Year 9 | MATHEMATICS CONCEPTUAL NARRATIVE16
Linear and non-linear relationships: Year 9 | MATHEMATICS CONCEPTUAL NARRATIVE 17
Connections between ‘Linear and non-linear relationships’ and other maths contentThere are many opportunities to connect to other content in the AC: Mathematics, when we use linear and non-linear relationships as a starting point.
Here are just some of the possible connections that can be made:
Mathematics: Year 9
Whilst working with Linear and non-linear relationships, connections can be made to:
How the connection might be made:
Students investigate Pythagoras’ Theorem and its application to solving simple problems involving right-angled triangles. ACMMG222
Refer to: Example 3: Triangle puzzler – gradient
Students calculate areas of composite shapes. ACMMG216 Refer to: Example 3: Triangle puzzler – gradient
Students solve problems involving direct proportion. Students explore the relationship between graphs and equations corresponding to simple rate problems. ACMNA208
Refer to: Example 2: The race – using linear relations to determine the formula for circumference
Making connections to other learning areas
We know that when our students meet a concept frequently and in different contexts, they have a greater chance of developing understanding. With this in mind, it is our responsibility to help our students to make these connections by intentionally designing tasks that connect a number of different content descriptions. Alternatively, connections can be made through questioning individual or small groups of students.
Linear and non-linear relationships: Year 9 | MATHEMATICS CONCEPTUAL NARRATIVE18
‘Linear and non-linear relationships’ from Year 7 to Year 10AThe AC: Mathematics year level content descriptions shown here have been colour coded to highlight the following curriculum aspects of working with Linear and non-linear relationships:
Plotting and sketching skills and strategies ◆In Year 7 to Year 9 students focus mostly on plotting and sketching skills and strategies.
Connection between numerical, algebraic and graphical representations and methods ◆In Year 8 to Year 10A students focus mostly on using and comparing multiple representations and methods.
Strategies for solving equations ◆In Years 10/10A students focus mostly on strategies for solving equations.
Using digital technologies ◆In Year 8 to Year 10A students use digital technologies to identify and represent functions and relations and also solve related problems.
Year level ‘Linear and non-linear relationships’ content descriptions from the AC: Mathematics
Year 7 ◆ Students solve simple linear equations. ACMNA179
Year 7 ◆ Students investigate, interpret and analyse graphs from authentic data. ACMNA180
Year 8 ◆ ◆ Students plot linear relationships on the Cartesian plane with and without the use of digital technologies. ACMNA193
Year 8 ◆ ◆ Students solve linear equations using algebraic and graphical techniques. Students verify solutions by substitution. ACMNA194
Year 9 ◆ ◆ Students find the distance between two points located on the Cartesian plane using a range of strategies, including graphing software. ACMNA214
Year 9 ◆ ◆ Students find the midpoint and gradient of a line segment (interval) on the Cartesian plane using a range of strategies, including graphing software. ACMNA294
Year 9 ◆ ◆ Students sketch linear graphs using the coordinates of two points and solve linear equations. ACMNA215
Year 9 ◆ ◆ ◆ Students graph simple non-linear relations with and without the use of digital technologies and solve simple related equations. ACMNA296
Year 10 ◆ Students solve problems involving linear equations, including those derived from formulas. ACMNA235
Year 10 ◆ ◆ Students solve linear inequalities and graph their solutions on a number line. ACMNA236
Year 10 ◆ ◆ ◆ Students solve linear simultaneous equations, using algebraic and graphical techniques including using digital technology. ACMNA237
Year 10 ◆ Students solve problems involving parallel and perpendicular lines. ACMNA238
Year 10 ◆ ◆ Students explore the connection between algebraic and graphical representations of relations such as simple quadratics, circles and exponentials using digital technology as appropriate. ACMNA239
Year 10 ◆ Students solve linear equations involving simple algebraic fractions. ACMNA240
Year 10 ◆ ◆ Students solve simple quadratic equations using a range of strategies. ACMNA241
Year 10A ◆ Students solve simple exponential equations. ACMNA270
Year 10A ◆ Students describe, interpret and sketch parabolas, hyperbolas, circles and exponential functions and their transformations. ACMNA267
Linear and non-linear relationships: Year 9 | MATHEMATICS CONCEPTUAL NARRATIVE 19
Year 10A ◆ ◆ Students apply understanding of polynomials to sketch a range of curves and describe the features of these curves from their equation. ACMNA268
Year 10A ◆ Students factorise monic and non-monic quadratic expressions and solve a wide range of quadratic equations derived from a variety of contexts. ACMNA269
Numeracy continuum: Recognising and using patterns and relationships
End Year 6 Identify and describe pattern rules and relationships that help to identify trends.
End Year 8 Students identify trends using number rules and relationships.
End Year 10 Students explain how the practical application of patterns can be used to identify trends.
Source: ACARA, Australian Curriculum: Mathematics
Linear and non-linear relationships: Year 9 | MATHEMATICS CONCEPTUAL NARRATIVE20
Resources
NRICH websitehttp://nrich.maths.org
In this conceptual narrative we have highlighted the possibility of using tasks from an organisation called NRICH enriching mathematics.
The NRICH website contains a large collection of high quality maths problem-solving tasks, together with suggestions about content that may be related to the task, ways to get started and different (valid) solutions that have been submitted by students from around the world.
Dan Meyer’s blog: 101 questionshttp://www.101qs.com
Dan’s blog contains images and short films that can be presented to students along with the question: What’s the first question that comes to mind?
A spreadsheet of Dan Meyer’s Three-Act Maths Tasks can be accessed at http://bit.ly/DM3ActMathTasks.
Visual patternshttp://www.visualpatterns.org/
This website has multiple visual patterns that students can consider and describe in a way that makes sense to them. Students will have multiple interpretations of each image, promoting multiple ways of visualising, solving problems and stimulating dialogue. They can be used as lesson starters.
Scootlehttps://www.scootle.edu.au/ec/p/home
This website has over 20,000 quality-assured digital learning resources aligned to the Australian Curriculum. You can filter your search to uncover a wealth of relevant teaching and learning items.
reSolve: maths by inquiryhttps://www.resolve.edu.au
This website provides classroom resources for years F to 10 that promote fluency, deep understanding, strategic problem-solving, and mathematical reasoning. Each classroom resource is designed to develop progressive understanding through tasks that encourage a spirit of inquiry.
Plus Magazine https://plus.maths.org
An online magazine which aims to introduce readers to the beauty and the practical applications of mathematics. It includes articles, teaching packages, puzzles and more. It has examples of mathematical modelling from scaffolded to open in authentic contexts.
Numeracy in the Newshttp://www.mercurynie.com.au/mathguys/mercury.htm
Numeracy in the News is a website containing 313 full-text newspaper articles from the Tasmanian paper, The Mercury. Other News Limited newspapers from around Australia are also available. The intention of the website is to raise the consciousness of students as critical readers of media reports, including statistical inference. The ‘Teacher discussion’ notes are a great example of how you can adapt student questions to suit articles from our local papers, such as The Advertiser.
Linear and non-linear relationships: Year 9 | MATHEMATICS CONCEPTUAL NARRATIVE 21
TIMES moduleshttp://schools.amsi.org.au/times-modules/
TIMES modules are prepared by the Australian Mathematical Sciences Institute (AMSI) as part of The Improving Mathematics Education in Schools (TIMES) Project. The ‘Data investigation and interpretation’ module has been developed for Foundation to Year 10, and is a great knowledge source for teachers, modelling good analysis and inference reports.
Top drawer teachers – resources for teachers of mathematics (statistics)http://topdrawer.aamt.edu.au/Statistics
This website by the Australian Association of Mathematics Teachers, provides expert mathematics advice, teaching suggestions and classroom activities. Each ‘drawer’ is divided into sections: Big ideas, Misunderstandings, Good teaching, Assessment, and Activities.
This CSIRO Double Helix Extra is a free fortnightly email newsletter featuring mathematics news and activities. It includes a quiz, brainteaser, news and a classic hands-on activity.
CensusAtSchool NZ is part of a global project that provides a random sampler and additional resources for teaching statistics. It aims to:
• ‘foster a positive attitude to statistics through using data that is both relevant and real
• improve understanding of a data gathering process, its purposes and benefits to society
• provide access to large and meaningful multivariate data sets
• encourage effective IT teaching and learning
• enhance the process of statistical enquiry across the curriculum.’
Linear and non-linear relationships: Year 9 | MATHEMATICS CONCEPTUAL NARRATIVE22
Notes
Linear and non-linear relationships: Year 9 | MATHEMATICS CONCEPTUAL NARRATIVE 23
Do you want to feel more confident about the maths you are teaching?
Do you want activities that support you to embed the proficiencies?
Do you want your students thinking mathematically rather than just doing maths?
If you answered yes to any of these questions, then this resource is for you.
Packed full of examples, along with questions you can ask students as they engage in their learning, this resource supports you to develop confidence in teaching the Australian Curriculum: Mathematics.