Linear Collider Collaboration Tech Notes LCC-0125 SLAC-TN-03-070 September 2003 Beam-Beam Interaction Simulations with Guinea Pig C. Sramek, T. O. Raubenheimer, A. Seryi, M. Woods, J. Yu Stanford Linear Accelerator Center Stanford University Stanford, CA Abstract: At the interaction point of a particle accelerator, various phenomena occur that are known as beam-beam effects. Incident bunches of electrons (or positrons) experience strong electromagnetic fields from the opposing bunches, which leads to electron deflection, beamstrahlung and the creation of electron/positron pairs and hadrons due to two-photon exchange. In addition, the beams experience a “pinch effect” which focuses each beam and results in either a reduction or expansion of their vertical size. Finally, if a beam’s disruption parameter is too large, the beam can develop a sinusoidal distortion or two-stream (kink) instability. This project simulated and studied these effects as they relate to luminosity, deflection angles and energy loss in order to optimize beam parameters for the Next Linear Collider (NLC). Using the simulation program Guinea Pig, the luminosity, deflection angles and beam energy data was acquired for different levels of beam offset and distortion. Standard deflection curves and luminosity plots agreed with theoretical models but also made clear the difficulties of e-e- feedback. Simulations emphasizing kink instability in modulated and straight beam collisions followed qualitative behavioral predictions and roughly fit recent analytic calculations. A study of e-e- collisions under design constraints for the NLC provided new estimates of how luminosity, beamstrahlung energy loss, upsilon parameter and deflection curve width scale with beam cross sections (σ x , σ y , σ x ) and number of particles per bunch (N). Finally, this same study revealed luminosity maxima at large N and small σ y, which may merit further investigation.
Transcript
LCC-0125 SLAC-TN-03-070 September 2003
Abstract: At the interbunches of electrons deflection, beamstrahexperience a “pinch ebeam’s disruption pasimulated and studiedfor the Next Linear Cwas acquired for diffmodels but also madcollisions followed qdesign constraints fodeflection curve widtrevealed luminosity m
Linear Collider Collaboration Tech Notes
Beam-Beam Interaction Simulations with Guinea Pig
C. Sramek, T. O. Raubenheimer, A. Seryi, M. Woods, J. Yu
Stanford Linear Accelerator Center Stanford University
Stanford, CA
action point of a particle accelerator, various phenomena occur that are known as beam-beam effects. Incident (or positrons) experience strong electromagnetic fields from the opposing bunches, which leads to electron lung and the creation of electron/positron pairs and hadrons due to two-photon exchange. In addition, the beams ffect” which focuses each beam and results in either a reduction or expansion of their vertical size. Finally, if a rameter is too large, the beam can develop a sinusoidal distortion or two-stream (kink) instability. This project these effects as they relate to luminosity, deflection angles and energy loss in order to optimize beam parameters ollider (NLC). Using the simulation program Guinea Pig, the luminosity, deflection angles and beam energy data erent levels of beam offset and distortion. Standard deflection curves and luminosity plots agreed with theoretical e clear the difficulties of e-e- feedback. Simulations emphasizing kink instability in modulated and straight beam ualitative behavioral predictions and roughly fit recent analytic calculations. A study of e-e- collisions under r the NLC provided new estimates of how luminosity, beamstrahlung energy loss, upsilon parameter and h scale with beam cross sections (σx, σy, σx) and number of particles per bunch (N). Finally, this same study axima at large N and small σy, which may merit further investigation.
Beam-Beam Interaction Simulations with Guinea Pig
C. Sramek, T.O. Raubenheimer, A. Seryi, M. Woods and J. Wu
Office of Science, Student Undergraduate Laboratory Internship (SULI)
Stanford Linear Accelerator Center Menlo Park, CA 94025
September 22, 2003
Abstract At the interaction point of a particle accelerator, various phenomena occur which
are known as beam-beam effects. Incident bunches of electrons (or positrons) experience strong electromagnetic fields from the opposing bunches, which leads to electron deflection, beamstrahlung and the creation of electron/positron pairs and hadrons due to two-photon exchange. In addition, the beams experience a “pinch effect” which focuses each beam and results in either a reduction or expansion of their vertical size. Finally, if a beam’s disruption parameter is too large, the beam can develop a sinusoidal distortion, or two-stream (kink) instability. This project simulated and studied these effects as they relate to luminosity, deflection angles and energy loss in order to optimize beam parameters for the Next Linear Collider (NLC). Using the simulation program Guinea Pig, luminosity, deflection angle and beam energy data was acquired for different levels of beam offset and distortion. Standard deflection curves and luminosity plots agreed with theoretical models but also made clear the difficulties of e-e- feedback. Simulations emphasizing kink instability in modulated and straight beam collisions followed qualitative behavioral predictions and roughly fit recent analytic calculations. A study of e-e- collisions under design constraints for the NLC provided new estimates of how luminosity, beamstrahlung energy loss, upsilon parameter and deflection curve width scale with beam cross-sections ( xσ , yσ , zσ ) and number of particles per bunch (N). Finally, this same study revealed luminosity maxima at large N and small yσ which may merit further investigation.
1. Introduction
When electron and positron beams collide at the interaction point (IP) of a particle accelerator, phenomena known as beam-beam effects occur. Incident bunches of electrons (or positrons) experience the strong electromagnetic fields of the opposing bunches, which cause electrons to deflect at angles on the order of a few microradians from the IP. Also, as relativistic charged particles on a curved trajectory, some deflected electrons emit radiation in a process called beamstrahlung. In addition, low energy electron/positron pairs and hadrons are created due to the two-photon exchange process.
These effects have positive and negative consequences on the collider’s ability to function as a tool for conducting high energy physics research. For instance, the vertical deflection angle has an approximate linear dependence on the vertical offset of the two beams for small offsets, which means this angle can be used as a feedback signal to correct the beams’ vertical displacement. On the other hand, beamstrahlung takes away energy from some electrons, contributing to an energy spread which limits the precision in measurement of particle masses. Also, the particles produced in two-photon exchange are backgrounds to be dealt with during data reduction.
In order to adequately study subatomic particles with a particle accelerator, it is desirable to achieve a high luminosity, which depends acutely on beam-beam effects. In an electron/positron linear collider, where the beam-beam forces are large, the Coulomb attraction between the beams results in a “pinch” effect which focuses each beam and reduces its vertical size. Similarly, with an electron/electron collider, there is an opposite “anti-pinch” effect. In addition, if a beam’s “disruption parameter” )(
2yxy
zeNryD σσγσ
σ+= is too
large, the beam can develop a sinusoidal distortion, or two-stream “kink” instability. Both of these effects contribute to a “luminosity enhancement factor” HD in determining luminosity D
Nnf HLyx
brep
σπσ4
2
= [1].
Our project focuses on performing computer simulations of electron/positron and electron/electron collisions in order to study some effects beam-beam interactions have on the performance of next-generation linear colliders. This involves testing mathematical models of beam-beam effects and finding beam input parameters (xyz cross-sections, vertical and waist offsets) that optimize selected output characteristics (energy spread, luminosity, deflection).
2. Materials and Methods
The simulations in our project can be divided into three subsets: production of standard deflection and luminosity plots, examination of electron/positron (e+e-) two-stream instability and optimization of electron/electron (e-e-) collision parameters. All simulations done in this project were carried out using Guinea Pig, a beam-beam simulation program written by Daniel Schulte [2]. Preliminary Work:
Guinea Pig simulates the collision of a single pair of a particle bunches with a given set of input parameters (spotsize, offset, energy, etc.). Since we wished to study interaction characteristics which varied with some of these input parameters, a preliminary task was to automate Guinea Pig. This was done using several MATLAB scripts which varied the desired parameters in the input files, ran a selected number of simulations and compiled the useful data from the output files of each simulation. In addition, we used these scripts to generate output data plots and to generate specific input particle distributions. All MATLAB scripts can be found on the web page for this project http://www-project.slac.stanford.edu/lc/local/accelphysics/codes/gp/Sramek/ under the heading ‘Matlab Scripts’ (/other/scripts.htm).
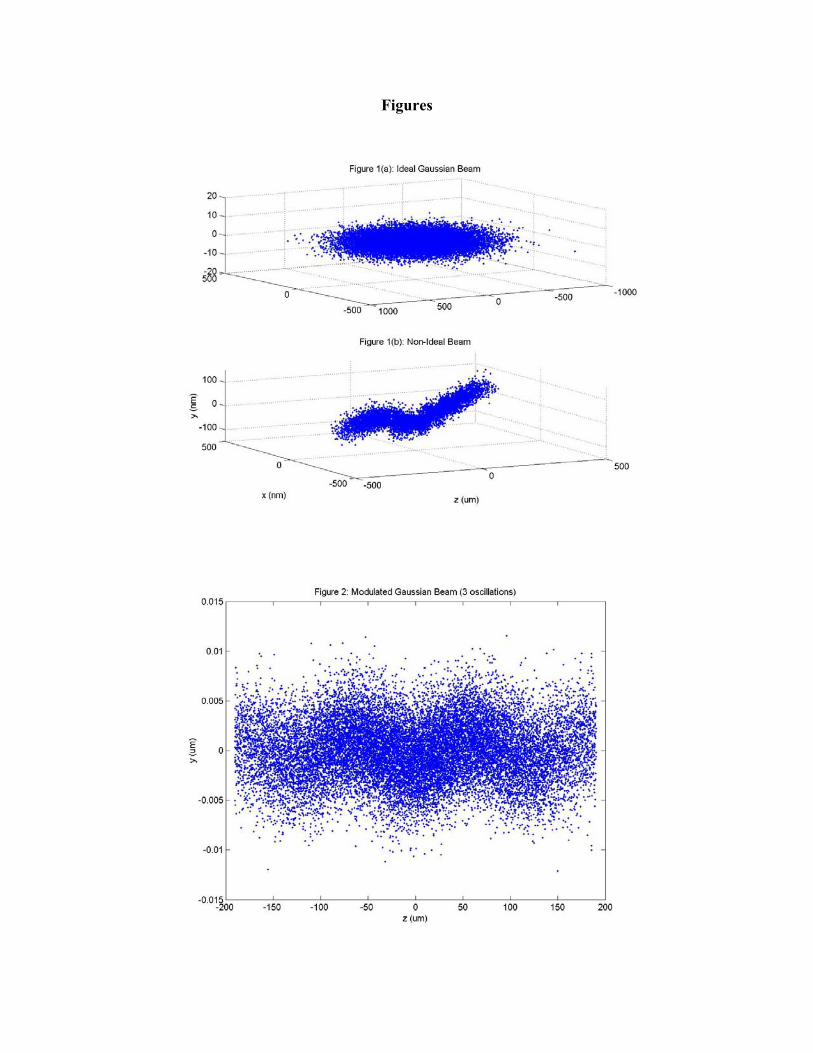
Production of Standard Plots: Plots that are useful for determining optimal beam parameters include deflection curves (avg. vertical particle deflection angle vs. vertical beam offset) and luminosity plots (interaction luminosity vs. vertical offset) as well as deflection or luminosity as functions of vertical waist offset. Deflection and luminosity plots were generated over a y-offset range on the order of 10 yσ and a y-waist-offset range on the order of 5 zσ for both NLC and TESLA accelerator parameters [3] (Table 1). Two types of electron\positron beams were used. The first type was an ideal beam with a normal charge distribution in the 6 phase space dimensions (Figure 1a). The second type was from a set of non-ideal beams (six electron\positron beam pairs for each accelerator) generated by the program MatLiar, which simulates the beam through the course of the entire linear collider up to the interaction point. This second type was characterized by vertical “tails” toward the rear end of the beam caused by wakefields in the accelerator cavities (Figure 1b). For e-e- beam collisions, the charge of the positron beam was simply inverted. Examination of Two-Stream Instability: In order to study effects of the disruption parameter on single bunch kink instability, we ran a set of simulations where the number of particles per bunch was increased and the post-interaction y-z particle distributions were examined. This was done with both uniform and normal initial longitudinal distributions for e+e- interactions under modified NLC accelerator parameters (Table 1). The set was run with both no offset and a 0.33 yσ vertical offset for disruption values between approximately 1 and 40. We also ran a simulation set where the incident uniform or Gaussian electron beam was modulated by 0.33 yσ in the vertical direction (Figure 2). The number of oscillations on the modulated beam and number of particles in both beams were varied in order to investigate luminosity minima due to resonance. Optimization of e-e- Parameters:
Two sets of simulations were run in order to optimize the beam parameters xσ , yσ , zσ and N for e-e-. The first set required steadily increasing one of the parameters (with all others held constant) in order to evaluate how luminosity, beamstrahlung energy loss and upsilon parameter scale in the e-e- case. The second set involved generating deflection curves with an additional parameter varied in order to determine which parameters affect the width of the curve’s linear region. When the horizontal and vertical beam sizes were changed, beam emmitance was held constant and the horizontal and vertical beta functions were varied. Both of these sets involved ideal Gaussian beams and standard NLC accelerator parameters (Table 1). The varied parameters took values between 10% and 1000% of nominal e+e- NLC values.
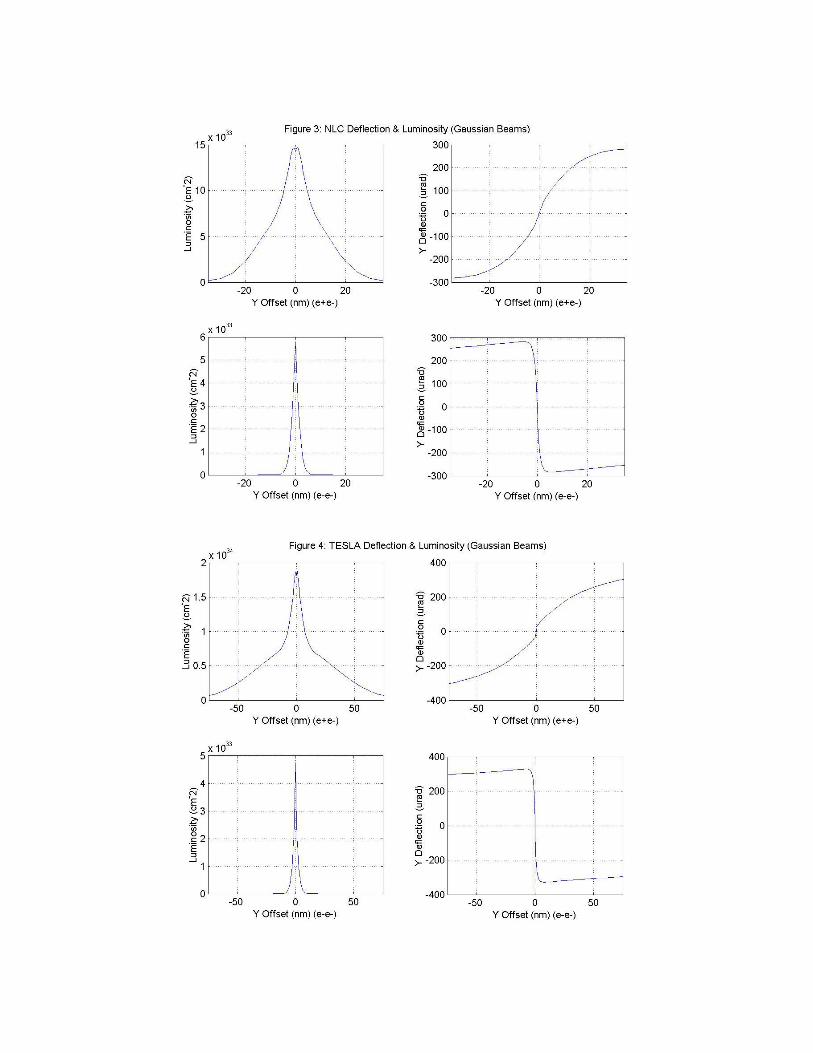
3. Results and Discussion 3.1 Production of Standard Plots: Figure 3 displays deflection curves and luminosity plots for e-e+ and e-e- Gaussian beam collisions under NLC parameters while Figure 4 shows the same simulations under TESLA parameters (Table 1). These plots can be viewed in detail off the project webpage at /yo/gauss/nlc/yo_g_nlc.htm and /yo/gauss/tesla/yo_g_tesla.htm. From these standard plots, we can make several observations. First, e-e- beam interactions have a fractional luminosity of e+e- interactions (~30%). Second, e-e- has significantly smaller deflection curve linear regions and much narrower luminosity peaks than e-e+ (approximately a difference of a factor of 7 in both cases). This occurs because of the pinch/anti-pinch beam-beam effect. For e-e-, when the beams are not offset, the Coulomb repulsive force is straight along the z-axis. With any offset, there is a vertical component to this force, resulting in a large degree of deflection for even small offsets. Contrarily, with e+e- there is a Coulomb attraction (with and without vertical offset) and the electrostatic force pulls the beams together, resulting in a more gradual increase of deflection angle and slower decrease in luminosity.
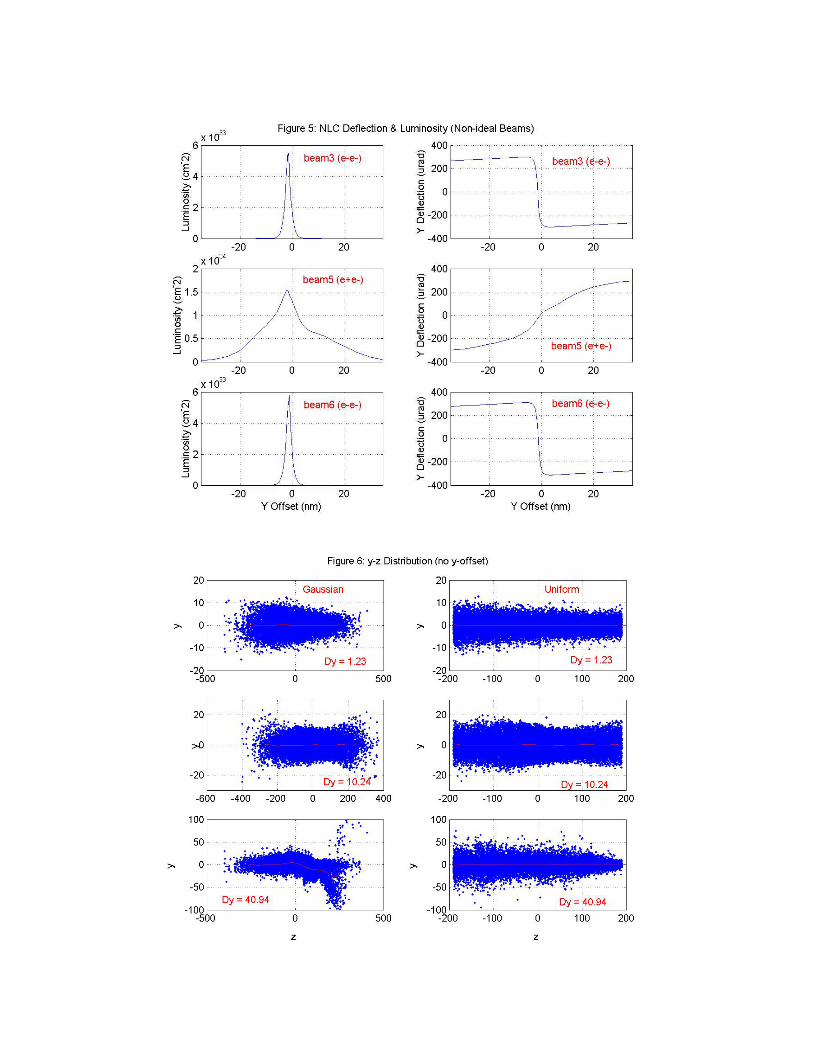
Figure 5 shows deflection curves and luminosity plots for several NLC MatLiar-generated beam interactions. The complete set of plots for all input beam pairs in both e+e- and e-e- configurations can be found at /yo/matliar/nlc/yo_ml_nlc.htm (NLC) and /yo/matliar/tesla/yo_ml_tesla.htm (TESLA). In these non-ideal cases, the zero-deflection point and luminosity maximum do not occur at zero vertical offset; rather they are shifted up or down. However, these two points do coincide, allowing for relatively straightforward feedback algorithms. The difference in deflection curve linear region width between e+e- and e-e- is important in relation to feedback. Ground motion jitter will introduce a vertical offset on the order of a few nanometers; if this offset is outside the linear region, feedback will be much more difficult. The presence of a waist offset had a slightly different effect than a vertical offset. For the MatLiar-generated beams, the luminosity maxima occurred for non-zero waist offset values as before with vertical offset. However, there was a much weaker correlation between zero-deflection point and luminosity maxima; in only about half of the NLC cases did these points coincide. In addition, the Gaussian beams for both NLC and TESLA also had luminosity maxima for non-zero offsets. Adding an optimal waist
offset resulted in a luminosity increase of ~10% for e+e- and ~1% for e-e-. This indicates that the off-centered maxima for the MatLiar beams were real effects and that it is significantly beneficial to offset the beam waists, at least in the e+e- case. The full set of waist offset plots can be viewed at /wo/gauss/. 3.2 Examination of Two-Stream Instability:
Our study of two-stream instability appears to be in decent agreement with analytic predictions. As previously calculated for the uniform beam case, the wave-number describing the natural oscillation that occurs in the beam is [4]:
z
y
z
y
yxyz
eD
kDNr
kβσσβγβσσσσ 3232)(3 0222
20 =⇒=
+≡
In terms of the characteristic number of oscillations (n0) along a beam, this is:
yz Dkn
πβπσ
232
232 0
0 ==
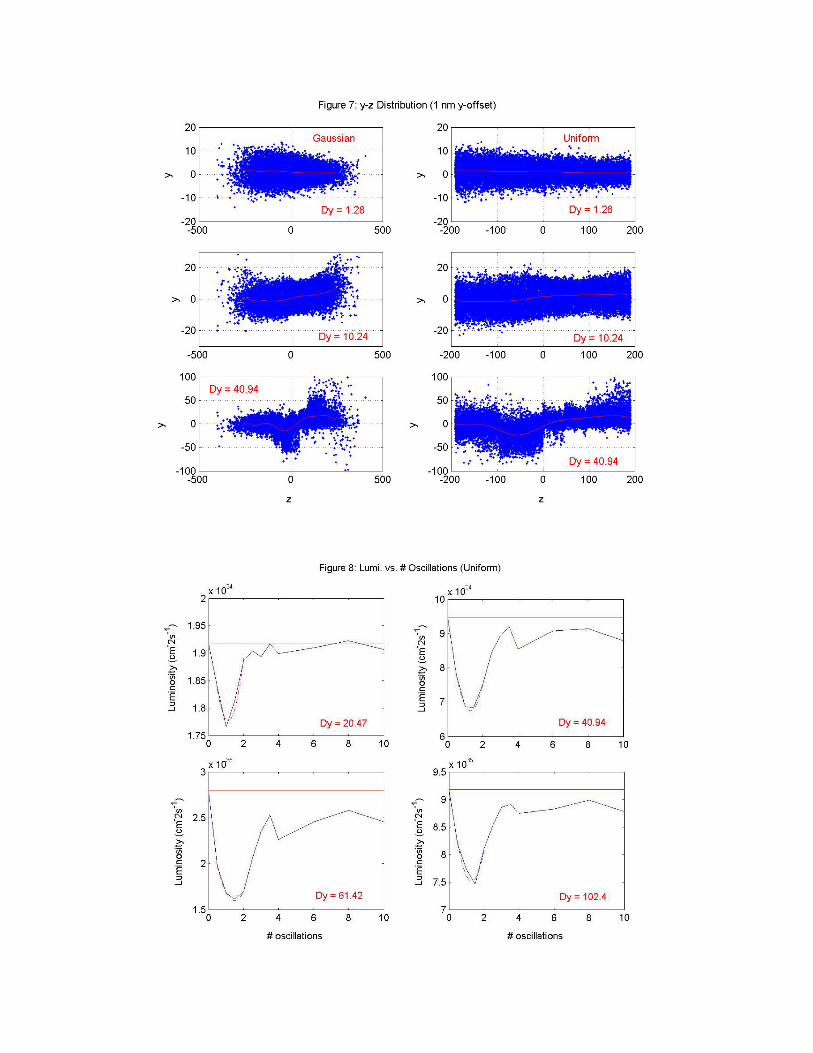
Figure 6 displays post-interaction y-z particle distributions for both uniform and Gaussian (z-distribution) incident beams with increasing particles per bunch (and hence increasing disruption). Figure 7 shows the same simulations run with a 0.33 yσ vertical offset. Superimposed on each distribution is a 10th degree polynomial fitted to the average vertical position of 50 particles at 400 longitudinal slices. With no offset, we do not expect large amplitude oscillations to arise as disruption is increased. This is seen in our uniform case post-interaction distributions, as the fitted curve appears relatively straight for disruption values as high as 40. With an initial offset, we expect the characteristic number of oscillations to occur in the beams. As the expression shown earlier predicts, when Dy > 11.4, more than one period of oscillation is observed. We expect the amplitude of oscillation to increase as the initial offset is further increased. Additional output distributions can be found at /kinkstudy/no_offset/no_offset.htm and /kinkstudy/offset_1/offset_1.htm.
With a modulated beam/straight beam interaction (uniform z-distribution), it is predicted that the y-z distributions takes the form [4]:
[ ])(sin4
~),( 02
2
220
00
0
zskekk
kkyzsy
zszk
r +−
+
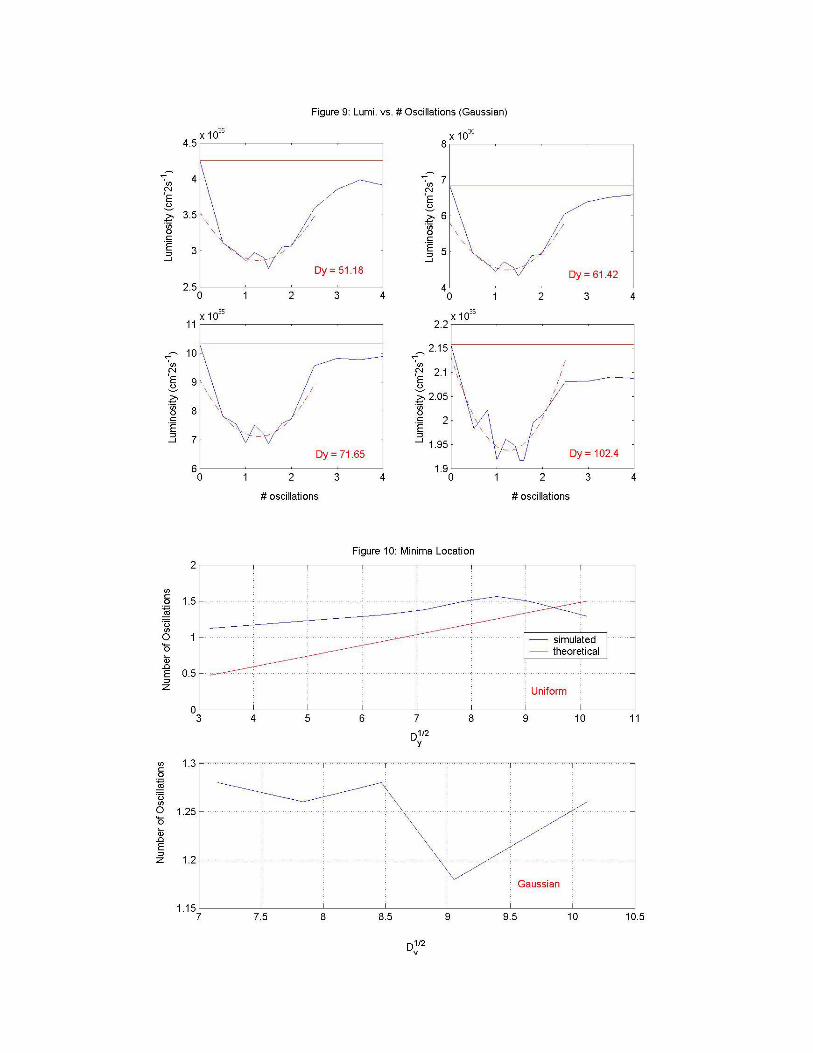
where yr0 and k are the initial amplitude and wave-number of the modulated beam and k0 is the natural wave-number given earlier. This implies a resonant condition of k = k0/2 or n = n0/2. Figure 8 shows luminosity vs. number of oscillations for modulated electron beam/straight positron beam interactions. This is for a uniform longitudinal charge distribution with increasing disruption. Figure 9 shows the same plots for a normal longitudinal charge distribution. Focusing on the uniform case, it is apparent that there is a distinct minimum (between 90% and 60% maximum luminosity) occurring between 1/2 and 2 oscillations in each case. A polynomial is fitted to this region in order to estimate the locations of the minima. From our expression for n0, we expect the minima location
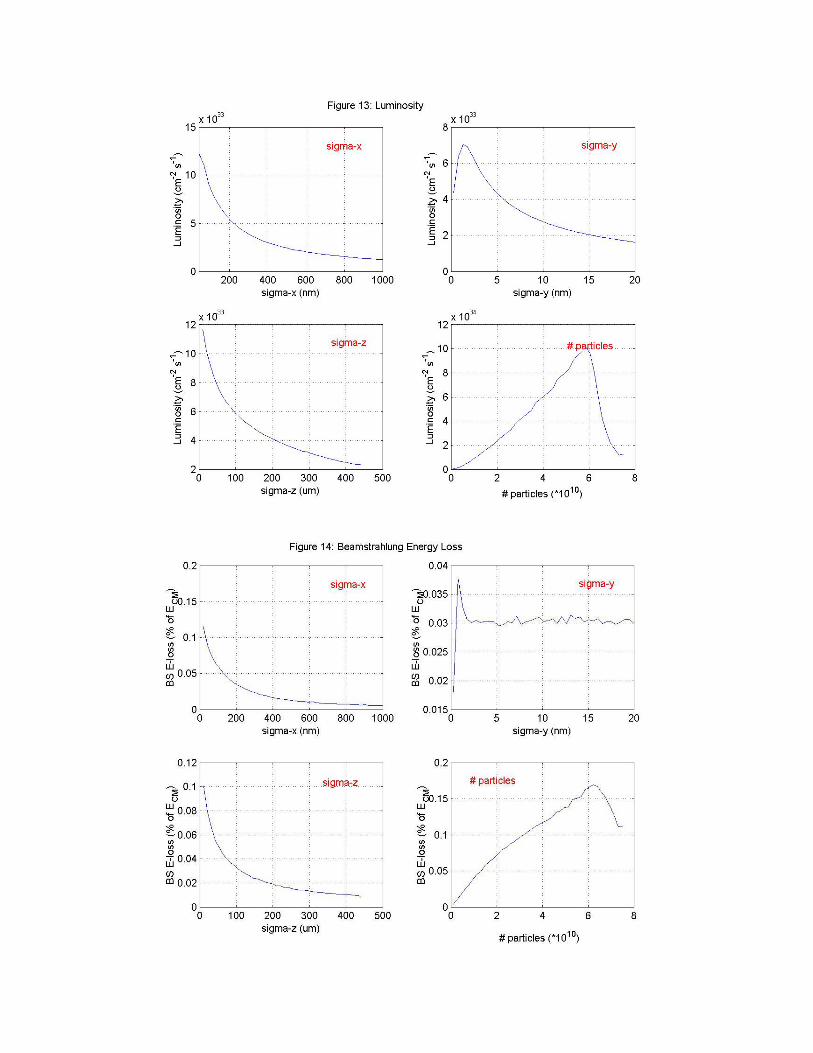
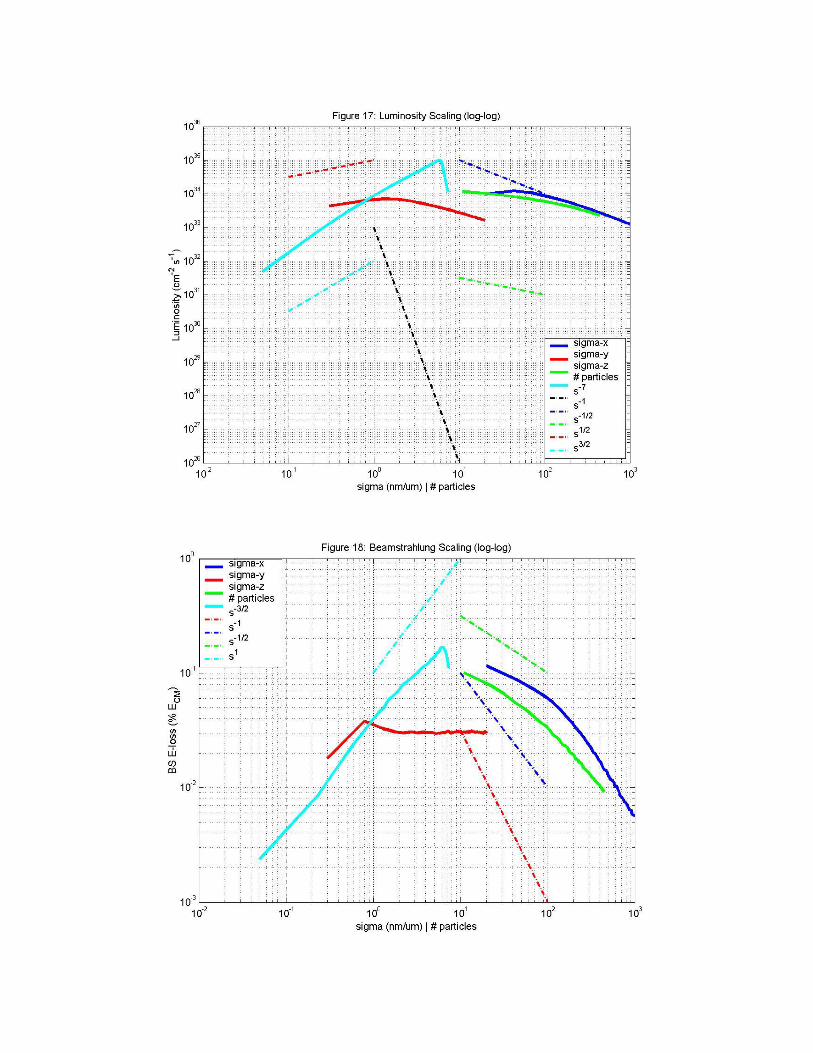
in terms of number of oscillations to increase with the square root of disruption. As figure 10 indicates, our results appear to agree with this prediction. The small discrepancy may be explained by inaccuracies with the fitting algorithm used to estimate the minima. There may have been too few points available to get an adequate polynomial fit, resulting in calculated minima slightly larger or smaller than expected. Post-interaction y-z distributions for the modulated uniform beam case can be found at /kinkstudy/nosc/ while more luminosity vs. number oscillations plots are at /kinkstudy/nosc/lumi/ and /kinkstudy/nosc/lumi_g/. 3.3 Optimization of e-e- Parameters: The scaling found for e-e- parameters indicated the need for an analytical model to describe this interaction. Figures 13, 14 and 15 show luminosity, beamstrahlung energy loss and maximum upsilon value, respectively, plotted against xσ , yσ , zσ and number of particles per bunch. These same plots are shown on a logarithmic scale in figures 17, 18 and 19 along with lines representing input parameters raised to different exponents. All of this data can be found at /eestudy/scaling/. Matching these lines to the data, we found that luminosity, upsilon and beamstrahlung energy loss scale as:
2/1
2/3
)(~
zyx
NLσσσ
, zx
Nσσ
~Υ , 2/32/1~
xzBS
Nσσ
δ
These scaling estimates assume that only one parameter is varied at a time and are valid for 1nm < yσ < 20nm, 0.1um < xσ < 1um, zσ < 400um and N < 5e10.
The luminosity scaling appears to be in partial agreement with past work. An earlier study found the following empirical equation for luminosity enhancement fit simulation results [5]:
( ) )ln1.01,1min()()(15.01)(
4.01 yoxRf
DA
D DxIeRfHy
y +⋅
−= −
+ , π3
)( yDRfx = , 2
2
1)(x
yRfσ
σ+=
In the approximation of f(R) = 1 and = 0, this implies that luminosity scales as: yA
2/1
2/3
)(~
zyx
NLσσσ
Although we also found this to be approximately correct for xσ < 100 nm, the scaling for xσ apparently changes as xσ increases.
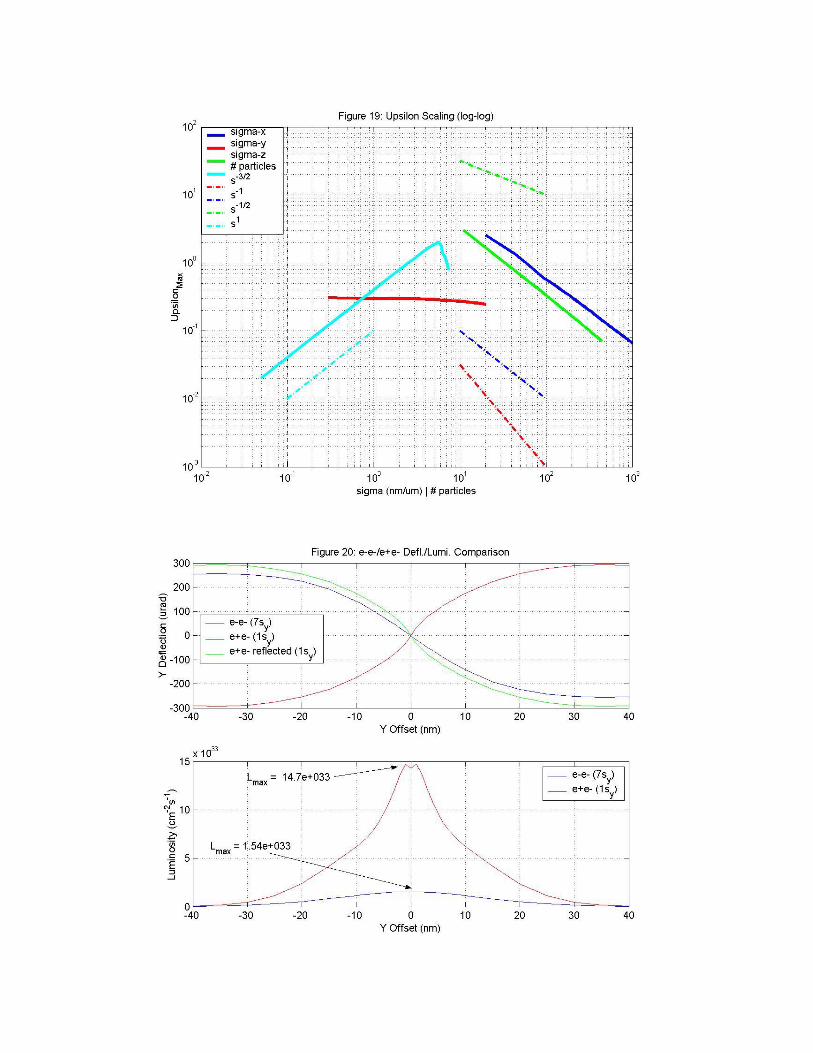
Unlike luminosity, andΥ BSδ have no previous estimate for e-e-. However, results for seem very reasonable because we also find that Υ zxN σσ/~Υ for e+e- [6].
BSδ scaling is a little different; e+e- scales as , which is dissimilar to e-
e- scaling [6]. Since we found for smallerzxBS N σσδ 22 /~
x1−xBSδ ~ σ σ , it’s possible −+eeBSδ~ ,−−eeBSδ
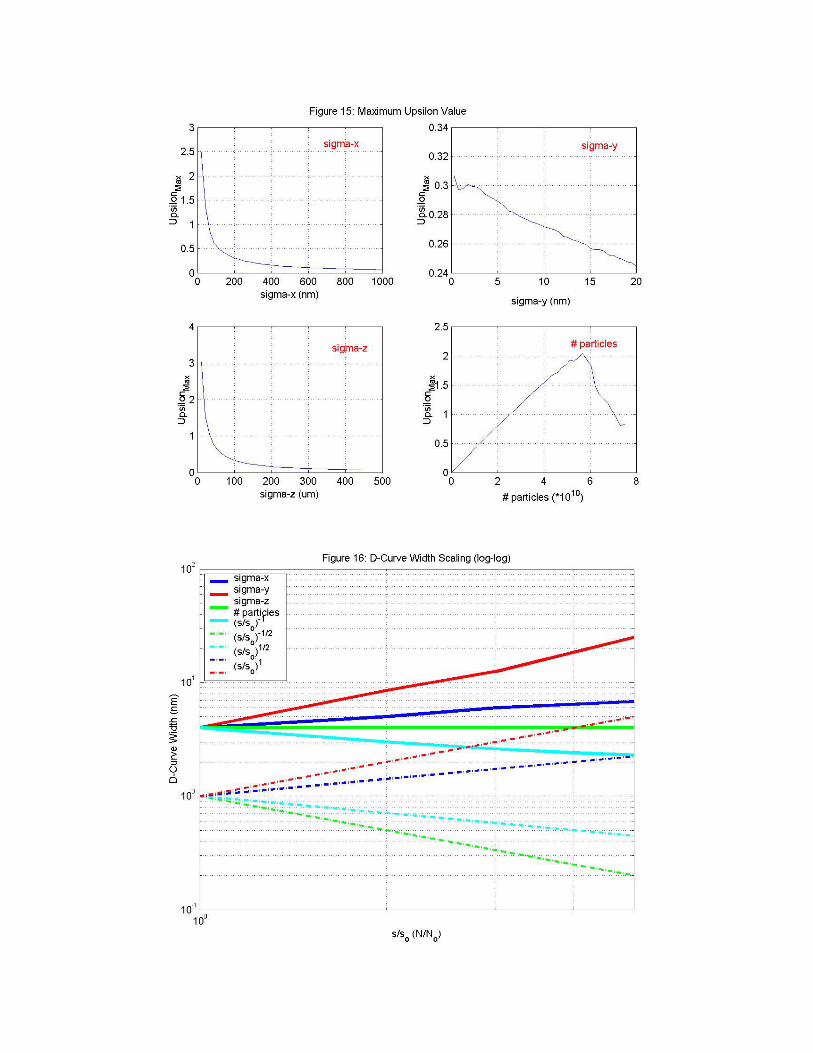
but we have no explanation for why this might happen. As e-e- feedback will likely require the deflection curve linear region to be larger,
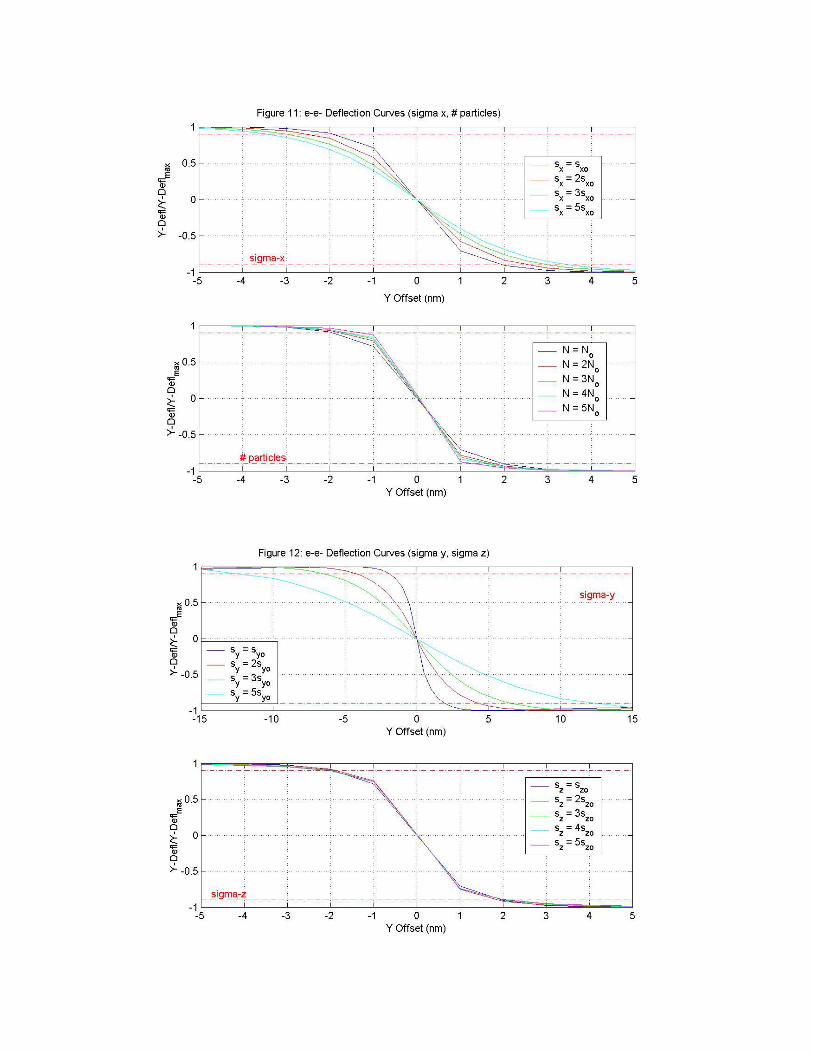
it is important to understand how the width of the linear region varies with beam parameters and what trade-off in luminosity must be made. Figure 11 shows normalized deflection curves for e-e- Gaussian beam collisions (NLC parameters) as xσ and number
of particles per bunch are varied, while figure 12 shows normalized deflection curves as yσ and zσ are varied. If we define the width of a curve’s linear region as the offset range where the deflection angle is between 90% of its minimum and maximum values (illustrated by the two red lines), we find that this width depends on yσ , xσ and number of particles. Figure 16 plots deflection curve width against these parameters on a log-log scale along with exponential lines to estimate scaling. To view these plots in more detail, see /eestudy/dcurves/. Matching these lines to the data, we found that deflection curve width scales as:
Ny x
yσ
σ~∆
In order to achieve a comparable width to e+e- (under standard NLC parameters), yσ must be increased approximately by a factor of 7. However, due to both anti-pinch effect and luminosity reduction from increased yσ , e-e- luminosity is left at only ~10% of nominal e+e- luminosity (Figure 20). Some other interesting details came out of the scaling study. For instance, there is a sharp peak in luminosity (as well as Υ and BSδ ) around N = 6e10 (Dy = 102.4). Although we initially believed this to be a result of limitations with Guinea Pig, more rigorous simulations involving a greater number of simulated particles on a larger grid produced the same results (see /eestudy/big_n/ for data). This effect could be the result of two counteracting contributions: an increase in luminosity due to an increase in the number of interacting particles and a decrease due to greater Coulomb repulsion between the beams, which causes the beams’ spotsizes to increase. Although this peak occurs well outside NLC operating parameters, this is nevertheless an important effect as other next-generation linear collider designs (such as TESLA) use different beam spotsizes (which will change the location of the peak) and larger values for N. The presence of a peak means these designs may operate at a less than optimal number of particles per bunch; any collider on the right hand side of this peak can increase luminosity by increasing the repetition frequency. 4. Summary:
Simulations of beam-beam interactions were performed. Standard plots indicated the difficulty of e-e- feedback as well as possible benefits of a applying a vertical or waist offset. Simulations of two-stream instability showed a rough agreement with theory in terms of characteristic and resonant beam oscillation frequencies. From a study of e-e- interactions, the scaling of luminosity, beamstrahlung energy spread, Upsilon and deflection curve width with xσ , yσ , zσ and N were estimated. Increasing yσ is a viable beam parameter change that could lead to feasible e-e- feedback, but other unspecified changes must be made in order to regain the lost luminosity. Luminosity maxima occurring at certain values of N and yσ were also found and may warrant further investigation.
References [1] K. Yokoya, P. Chen, “Beam-Beam Phenomena in linear colliders,” KEK Preprint
91-2, April 1991, pp. 1-38. [2] D. Schulte, Ph.D. thesis, University of Hamburg 1996; TESLA-97-08. [3] International Linear Collider Technical Review Committee (ILC-TRC) Second
Report, Chapter 2, SLAC-R-606 (2003). [4] T. Raubenheimer, J. Wu, “Luminosity Loss due to Beam-Beam Instability,”
SLAC-PUB, in preparation (2003). [5] K. Thompson, P. Chen, SLAC-PUB-8230 (1999). [6] T. Raubenheimer, Lecture Notes for Accelerator Physics and Technologies for
Linear Colliders, IP Issues and Luminosity. [7] P. Chen, “Overview of Quantum Beam Physics,” Quantum Aspects of Beam
Physics: Proceedings, World Scientific, 1998.
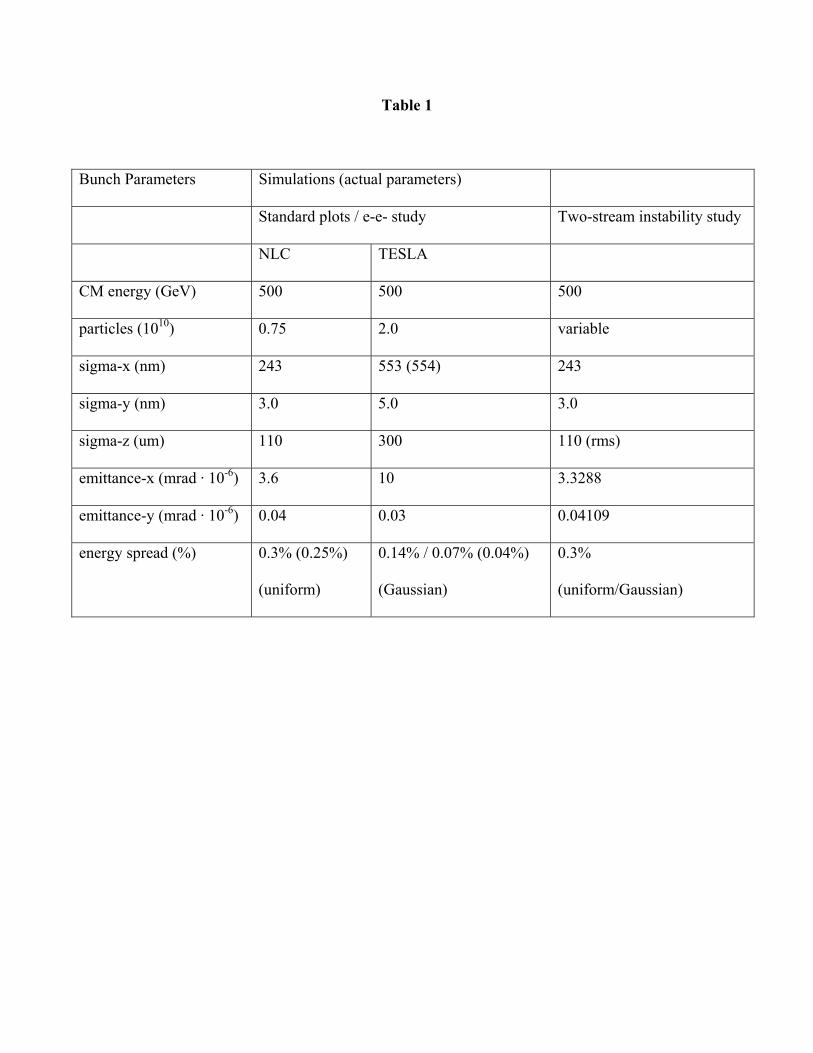
Table 1
Bunch Parameters Simulations (actual parameters)
Standard plots / e-e- study Two-stream instability study