16
•

Loughborough UniversityInstitutional Repository
Linking performance ofparent Grade 91 steel to the
cross-weld creepperformance using feature
type tests
This item was submitted to Loughborough University's Institutional Repositoryby the/an author.
Citation: SIEFERT, J.A., PARKER, J.D. and THOMSON, R.C., 2016. Link-ing performance of parent Grade 91 steel to the cross-weld creep performanceusing feature type tests. IN: Parker, J., Shingledecker, J. and Siefert, J. (eds).Advances in Materials Technology for Fossil Power Plants, Proceedings fromthe Eight International Conference (EPRI 2016), Albufeira, Algarve, Portugal,11-14 October 2016, pp. 530-543.
Additional Information:
• This article is made available as an electronic reprint with the permis-sion of ASM International for the Loughborough University InstitutionalRepository. Reproduction, distribution to multiple locations via electronicor other means, duplication of any material in this article for a fee or forcommercial purposes, or modification of the content of this article is pro-hibited.
Metadata Record: https://dspace.lboro.ac.uk/2134/23727
Version: Published
Publisher: c© Electric Power Research Institute (EPRI). Distributed by ASMInternational.
Rights: This work is made available according to the conditions of the Cre-ative Commons Attribution-NonCommercial-NoDerivatives 4.0 International(CC BY-NC-ND 4.0) licence. Full details of this licence are available at:https://creativecommons.org/licenses/by-nc-nd/4.0/

Please cite the published version.
2
LINKING PERFORMANCE OF PARENT GRADE 91 STEEL TO THE CROSS-WELD CREEP PERFORMANCE USING FEATURE TYPE
TESTS
John A. Siefert and Dr. Jonathan D. Parker Electric Power Research Institute, Charlotte, NC, USA
Prof. Rachel C. Thomson
Department of Materials, Loughborough University, Leicestershire, LE11 3TU, UK
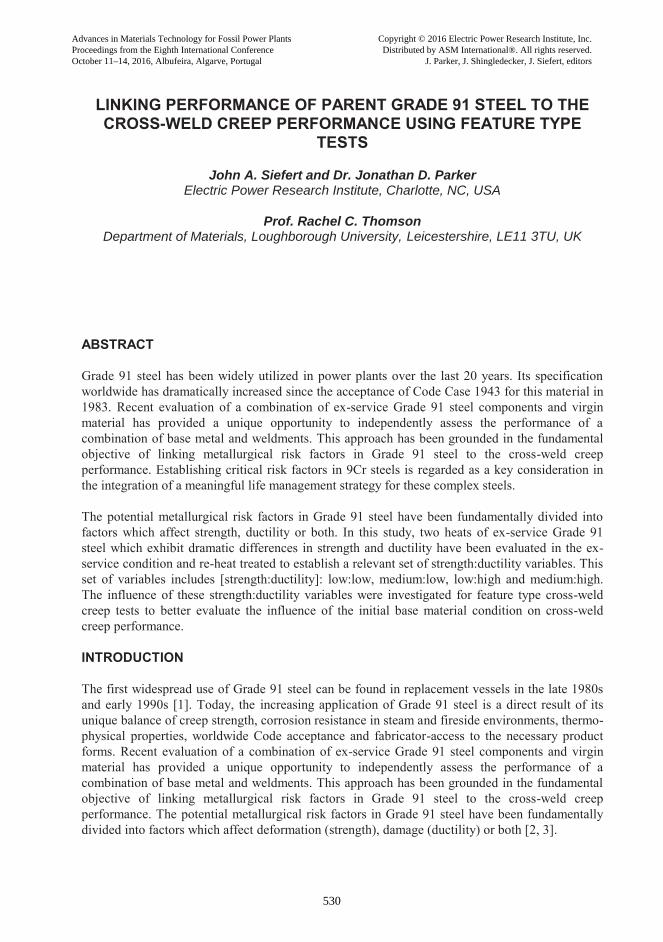
ABSTRACT Grade 91 steel has been widely utilized in power plants over the last 20 years. Its specification worldwide has dramatically increased since the acceptance of Code Case 1943 for this material in 1983. Recent evaluation of a combination of ex-service Grade 91 steel components and virgin material has provided a unique opportunity to independently assess the performance of a combination of base metal and weldments. This approach has been grounded in the fundamental objective of linking metallurgical risk factors in Grade 91 steel to the cross-weld creep performance. Establishing critical risk factors in 9Cr steels is regarded as a key consideration in the integration of a meaningful life management strategy for these complex steels. The potential metallurgical risk factors in Grade 91 steel have been fundamentally divided into factors which affect strength, ductility or both. In this study, two heats of ex-service Grade 91 steel which exhibit dramatic differences in strength and ductility have been evaluated in the ex-service condition and re-heat treated to establish a relevant set of strength:ductility variables. This set of variables includes [strength:ductility]: low:low, medium:low, low:high and medium:high. The influence of these strength:ductility variables were investigated for feature type cross-weld creep tests to better evaluate the influence of the initial base material condition on cross-weld creep performance. INTRODUCTION The first widespread use of Grade 91 steel can be found in replacement vessels in the late 1980s and early 1990s [1]. Today, the increasing application of Grade 91 steel is a direct result of its unique balance of creep strength, corrosion resistance in steam and fireside environments, thermo-physical properties, worldwide Code acceptance and fabricator-access to the necessary product forms. Recent evaluation of a combination of ex-service Grade 91 steel components and virgin material has provided a unique opportunity to independently assess the performance of a combination of base metal and weldments. This approach has been grounded in the fundamental objective of linking metallurgical risk factors in Grade 91 steel to the cross-weld creep performance. The potential metallurgical risk factors in Grade 91 steel have been fundamentally divided into factors which affect deformation (strength), damage (ductility) or both [2, 3].
Advances in Materials Technology for Fossil Power Plants Proceedings from the Eighth International Conference October 11–14, 2016, Albufeira, Algarve, Portugal
Copyright © 2016 Electric Power Research Institute, Inc. Distributed by ASM International®. All rights reserved.
J. Parker, J. Shingledecker, J. Siefert, editors
530

Today, the balance of the world’s construction codes continue to emphasize high temperature creep strength and extrapolation of this behavior to estimate component performance for expected in-service operation exceeding 105 hours. Traditionally, there has been little focus or consideration regarding the importance of the parent steel creep ductility. This is unfortunate because creep ductility continues to be directly responsible for poor or unexpected component behavior and for a range of end-material applications:
1. For CrMoV steels, the risk factors linked to prior austenite grain size and inclusions have been identified in ½Cr-½Mo-¼V piping steels [4] and 1Cr-1Mo-¼V rotor steels. In both cases, the size and distribution of the inclusions were linked to steel making. Indeed, a synergistic effect between MnS inclusions and the high tramp element concentrations have often been found in coarse-grained forgings [5-7]. The Gallatin Unit 2 IP-LP single flow rotor is one example where a high density of MnS inclusions was attributed to catastrophic failure [5]. With respect to Grade 91 and 92 steels, the presence of inclusions has been identified and shown to contribute to cavity nucleation [5, 8].
2. For Grade 122 steel, the metallurgical risk factors have been linked to be the degradation of the microstructure associated with the formation of Z-phase [9, 10] and voids formed on inclusions. The formation of Z-phase dramatically reduces the creep ductility in this material resulting in premature failure far below originally calculated values. The evolution of Z-phase occurs after time in-service and so was not originally identified in the initial data development as a harmful, cavitation forming phase.
3. For 316H stainless steel, a clear link has been identified between creep-fatigue damage and the formation of sigma phase [11]. For less-than-ideal compositions of 316H (but still within the allowable specification), a small fraction of delta ferrite formed during melting and/or processing. During service, the delta ferrite transformed to sigma phase and increased the susceptibility of selected 316H casts to both creep and thermal fatigue damage after ~130,000 hours in operation [11, 12]. The replacement of the main steam piping system at Eddystone in the mid-1980s involved a restricted 316H composition range which was well into the predicted austenite phase field (according to the Schaeffler diagram). To the authors’ knowledge, additional issues such as those identified with sigma formation leading to complete replacement were mostly avoided by this restricted composition.
Investigating whether there are metallurgical risk factors in the Grade 91 steel composition which affect creep ductility is a primary focus of this research because the creep ductility of the parent material can have serious implications with respect to design (i.e. mechanical notch), in the cross-weld creep performance (i.e. metallurgical notch) and in flexible operation (i.e. creep-fatigue). The realities of component performance impose a multi-axial stress state in the material and enhance the development of damage in susceptible heats of material. This has a cumulative effect of reducing the damage tolerance of the component and inherently increases the risk to catastrophic failure. The performance of an ex-service Grade 91 steel header that operated in a power plant in the UK at a nominal steam temperature of ~570°C (1058°F) and for ~79k hours has served as the basis for an initial set of studies described here [13]. This header received considerable interest worldwide as a potential leading indicator of future issues in the power generation industry since the initial root cause pointed to a significant issue concerning the composition and more specifically the N:Al ratio.
531

The concern regarding the N:Al ratio in Grade 91 steel was the formation of aluminum-nitride (AlN) and the subsequent reduction in available nitrogen in the matrix to form MX carbides. To affirm this suspicion, a simple analysis of composition for this particular component as well as other, unexpected and early-in-life failures helped to reaffirm a reasonable relationship between the N:Al ratio and performance, Figure 1A [14, 15]. Although the linking of AlN to the deterioration in creep strength seemed reasonable, there was no attempt to explain or evaluate the ex-service material in terms of the creep ductility. Since AlN particles are hard inclusions, with a rod-like morphology and of length ~500 to 1,000 nm, it is possible that these particles are potentially linked to a decrease in the damage tolerance of the material. This association has not been clearly identified to date and remains the subject of on-going investigations. More recent analysis has revisited the initial assumption that the root cause for premature failure in many of the recent Grade 91 steel components was simply a function of the N:Al ratio. Indeed, and as depicted in Figure 1B, there appears to be a stronger correlation between the creep ductility of the parent material and the cross-weld creep performance in terms of number of in-service damaged stub to header welds and for the header reported in [14]. This not a new concept, having been identified as being a significant factor related to the HAZ performance in power generation steels like legacy CrMoV components operating in the UK, Figure 2 [16].
Figure 1A: Relationship between Cracked and Uncracked Components among a Population of Grade 91 steel Components from a Single End-user and as a Function of the Nitrogen to Aluminum Ratio Figure 1B: Relationship between the Percentage of Cracked Stubs along a Superheater Outlet Header and the Nitrogen to Aluminum Ratio and the Reduction of Area as measured from a Creep Test performed at 625°C (1157°F) and 100 MPa (14.5 ksi)
Figure 2: Relationship between the Parent Steel Ductility and the Ratio between the Parent Steel to Heat Affected Zone Creep Life. In this illustration, decreasing parent steel ductility leads to a higher ratio (i.e. a reduction in cross-weld creep life), adopted from [16]
B
A
532

EXPERIMENTAL PROCEDURE Initial comparison of performance linking the risk factors in the Grade 91 parent to the cross-weld performance focused on the evaluation of two heats of material, Barrel 2 (B2) and Tee Piece 1 (TP1) as referenced in [14]. The composition of these two materials is provided in Table 1. Although it is recognized that there is not a widely accepted creep embrittlement factor for martensitic steels, the modified J-factor does provide an overall ranking regarding the overall cleanliness of the steel, Equation 1 [17]. For reference, the B2 material possessed a Modified J-Factor of 345 while for the TP1 material this value was 159. A factor like the Modified J-Factor is preferred because it attempts to relate inclusion forming elements like Si and Mn to a critical amount of known tramp elements such as S, P, As, Sn and Sb. However, it is recognized that this does not take into account the elements Al and N which can result in the formation of AlN. Although a direct link has not been established in Grade 91 steel, it is hypothesized that inclusions act as a trap site for tramp elements. Thus, the hypothesis would suggest that the potency of inclusions in the matrix is enhanced in the presence of tramp elements with respect to damage evolution. Equation 1. Modified J-Factor = (Si + Mn) × (S + P + As + Sn + Sb) × 104
Where: elemental values expressed as weight percent Table 1: Chemical Composition (given in Weight Percent) for the Materials of Interest and as Compared to the Requirements in the Standard Specification for SA-335 P91
Material C Cr Mn Mo Ni Si Al
SA-335 P91 0.08 8.0 0.30 0.85
0.40 max 0.20
0.02 max 0.12 9.5 0.60 1.05 0.50
B2 0.10 8.77 0.41 0.94 0.12 0.41 0.040 TP1 0.10 8.30 0.40 0.94 0.19 0.33 0.020
Material P S N Nb V Ti Zr
SA-335 P91 0.020 max 0.010 max 0.030 0.06 0.18
0.01 max 0.01 max 0.070 0.10 0.25
B2 0.009 0.010 0.0454 0.071 0.21 <0.002 <0.002 TP1 0.012 0.002 0.0424 0.070 0.21 <0.002 <0.002
Material Cu Pb As Sn Sb B O SA-335 P91 N/A N/A N/A N/A N/A N/A N/A
B2 0.19 0.00075 0.0128 0.008 0.0023 <0.0003 0.003 TP1 0.05 0.00003 0.0042 0.003 0.00063 <0.0003 0.0024
The B2 and TP1 material were obtained after ~79k hours of operation at ~570°C (1058°F). These materials were joined by a girth weld and thus the material used in this study was in operation in the same location in the header. Analysis of the material in this location showed that it was operating very close to the intended design temperature of 570°C (1058°F). No creep damage was identified in evaluation of large, through thickness cross-sections of the parent material and both materials possessed a microstructure consistent with tempered martensite. To create material conditions which further explored the damage-deformation matrix (illustrated in Figure 3 and later verified in Table 3) and to limit the number of tested materials, sections of B2 and TP1 were re-heat treated to the following procedures (note, AC = air cooled):
1. Renormalized and Tempered Barrel 2 (RNT-B2) – 1065°C/0.5 h/AC+765°C/2 h/AC
533

2. Ferritic Tee Piece 1 (F-TP1) – 950°C/0.5 h/Cooling at 100°C/h to 760°C/3 h/AC New weldments were made in the Grade 91 base materials of interest, B2 and TP1 in both the original and heat treated conditions using a matching filler. Welding of these materials followed several common guidelines including: the shielded metal arc welding process (SMAW), a minimum preheat of 150°C (300°F), a maximum interpass of 350°C, (660°F), a single-vee joint geometry with an included angle of 30°, and [where specified] a reduced post weld heat treatment (PWHT) of 675°C (1250°F). The welding and PWHT procedures referenced guidance in [18, 19]. A second set of welds was made in the TP1 material, in order to explore the effects of under-matching, matching and over-matching filler materials on performance. In this context, “matching” refers to the filler metal strength with respect to the parent metal strength. Nominal compositions for the filler materials used are provided in Table 2. In totality, the following weldments were investigated in terms of cross-weld creep performance:
B2; Matching Filler Metal [E9015-B9] + PWHT at 675°C/2h RNT-B2; Matching Filler Metal [E9015-B9] + PWHT at 675°C/2h F-TP1; Matching Filler Metal [E9015-B9] + PWHT at 675°C/2h TP1; Matching Filler Metal [E9015-B9] + PWHT at 675°C/2h TP1; Under-Matching Filler Metal [E8015-B8] + No PWHT TP1; Over-Matching Filler Metal [EPRI P87] + No PWHT
A key portion of this evaluation included the testing of the parent metal using conventional round bar creep samples which measured 12.7 mm (0.50 inches) in the gauge diameter and feature test samples for the cross-weld creep behavior which included the entire cross-section of the weldment. At least one parent metal test was conducted in each condition of interest using a standard test condition of 625°C (1157°F) and 100 MPa (14.5 ksi). In selected cases, additional tests at 625°C (1157°F) and 80 MPa (11.6 ksi) are reported. The feature test samples for examination of the cross-weld creep performance include a gauge cross-sectional area that is ~635 mm2 (1 inch2). This area is more than a factor of 10 larger than more commonly reported results for cross-weld creep tests employing small diameter sample(s) typically on the order of 6.35 mm (0.25 inches) diameter in the gauge length. This is an important consideration since the performance of these feature test samples must reasonably reproduce the behavior of in-service components in terms of damage and extent of damage through the width and thickness of the HAZ. A common test temperature of 625°C (1157°F) and test stresses of 60 MPa (8.7 ksi) and 80 MPa (11.6 ksi) were investigated for each of the weldments. A more detailed explanation of a typical cross-weld creep test procedure including strain monitoring, electro-discharge machining extraction of samples following testing and evaluation of accumulated creep damage is referenced in [19]. The initial results from both base metal and cross-weld creep samples were compared on a strength basis using a Larson-Miller Parameter relationship, Equation 2 [20]. For Grade 91 base metal, a constant value of 30 is generally utilized for comparisons whilst for Grade 91 cross-weld samples a constant value of 20 is typically used. In both material constituent examples, a large database of Grade 91 base metal performance has been obtained (>1700 individual data points) and for Grade 91 cross-weld failures where failure was reported in the HAZ (>300 individual data points). Such databases are critical to establishing the relevance of the evaluated test conditions since this remains as a key consideration in relating shorter-term results to long-term behavior in
534
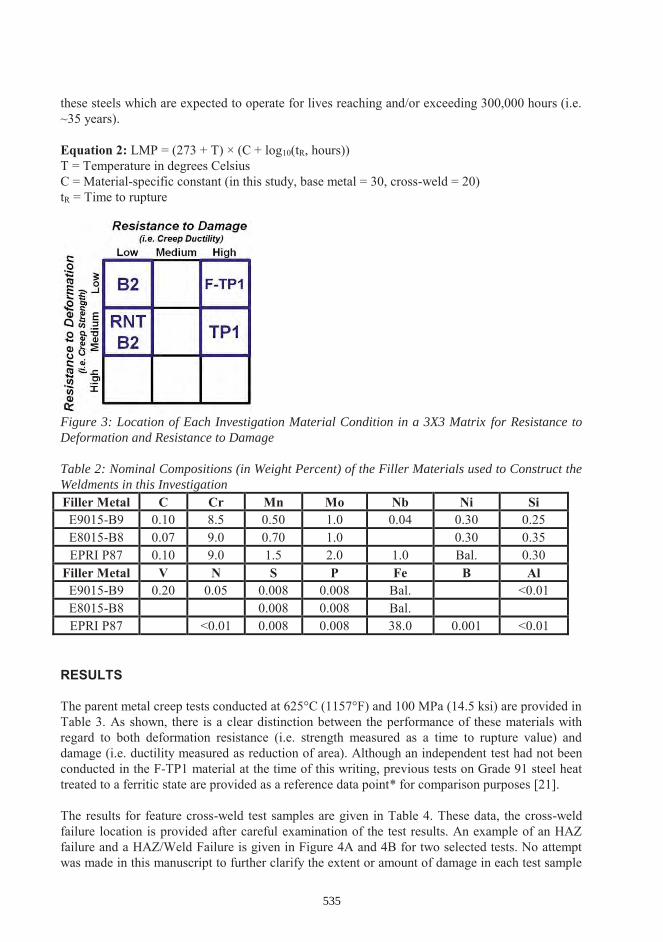
these steels which are expected to operate for lives reaching and/or exceeding 300,000 hours (i.e. ~35 years). Equation 2: LMP = (273 + T) × (C + log10(tR, hours)) T = Temperature in degrees Celsius C = Material-specific constant (in this study, base metal = 30, cross-weld = 20) tR = Time to rupture
Figure 3: Location of Each Investigation Material Condition in a 3X3 Matrix for Resistance to Deformation and Resistance to Damage Table 2: Nominal Compositions (in Weight Percent) of the Filler Materials used to Construct the Weldments in this Investigation Filler Metal C Cr Mn Mo Nb Ni Si E9015-B9 0.10 8.5 0.50 1.0 0.04 0.30 0.25 E8015-B8 0.07 9.0 0.70 1.0 0.30 0.35 EPRI P87 0.10 9.0 1.5 2.0 1.0 Bal. 0.30
Filler Metal V N S P Fe B Al E9015-B9 0.20 0.05 0.008 0.008 Bal. <0.01 E8015-B8 0.008 0.008 Bal. EPRI P87 <0.01 0.008 0.008 38.0 0.001 <0.01
RESULTS The parent metal creep tests conducted at 625°C (1157°F) and 100 MPa (14.5 ksi) are provided in Table 3. As shown, there is a clear distinction between the performance of these materials with regard to both deformation resistance (i.e. strength measured as a time to rupture value) and damage (i.e. ductility measured as reduction of area). Although an independent test had not been conducted in the F-TP1 material at the time of this writing, previous tests on Grade 91 steel heat treated to a ferritic state are provided as a reference data point* for comparison purposes [21]. The results for feature cross-weld test samples are given in Table 4. These data, the cross-weld failure location is provided after careful examination of the test results. An example of an HAZ failure and a HAZ/Weld Failure is given in Figure 4A and 4B for two selected tests. No attempt was made in this manuscript to further clarify the extent or amount of damage in each test sample
535

as this is the focus of on-going assessment using a variety of macro-evaluation techniques to procedures detailed in [22] and electron microscopy methods. Table 3: Parent Metal Creep Test Results for Tests Conducted at 625°C and 100 MPa
Sample Time to Rupture (hours) Reduction of Area (%) Barrel 2 784 26.5
Tee Piece 1 2,950 83.0 Renormalized and Tempered Barrel 2 3,360 15.0
Ferritic Tee Piece 1 <300* >83.0*
Figure 4A: Example of a Heat Affected Zone Failure Figure 4B: Example of a Heat Affected Zone and Weld Metal Failure. Although from the macro image it is not readily apparent, there is substantial weld metal damage and this is evidenced by the necking that can be seen at the centerline of the weld metal. Table 4: Cross-weld, Feature Creep Test Results for a Standard Test Temperautre of 625°C (1157°F)
Base Metal Welding Procedure Stress (MPa, ksi)
Life (hours)
Cross-weld Failure Location
Barrel 2 E9015-B9 + 675°C/2h [Matching Filler Metal]
80, 11.6 426 HAZ 60, 8.7 2,390 HAZ
Renormalized and Tempered Barrel 2
E9015-B9 + 675°C/2h [Matching Filler Metal]
80, 11.6 842 HAZ 60, 8.7 2,596 HAZ
Ferritic Tee Piece 1 E9015-B9 + 675°C/2h [Matching Filler Metal]
80, 11.6 269 Parent Metal 60, 8.7 3,627 [On-going]
Tee Piece 1
E9015-B9 + 675°C/2h [Matching Filler Metal]
80, 11.6 3,743 HAZ 60, 8.7 13,163 HAZ
E8015-B8 + No PWHT [Under-matching Filler Metal]
80, 11.6 1,509 HAZ/Weld 60, 8.7 4,064 HAZ/Weld
EPRI P87 + No PWHT [Over-matching Filler Metal]
80, 11.6 2,129 HAZ 60, 8.7 13,130 HAZ
The cross-weld feature test data for strain and time are shown in Figures 5 and 6 for each of the evaluated test stresses of 80 MPa (11.6 ksi) and 60 MPa (8.7 ksi), respectively. Note that the data are plotted with a log scale on the y-axis and in part due to the amount of strain that is
B
A
536

accumulated in the F-TP1 tests. The implication of these results will be discussed in more detail in the Discussion section.
Figure 5: Strain:Time data for Cross-weld Feature Tests at 625°C (1157°F) and 80 MPa (11.6 ksi). Note that all tests had failed as of the time of this writing.
Figure 6: Strain:Time data for Cross-weld Feature Tests at 625°C (1157°F) and 60 MPa (8.7 ksi). Note that two tests were still on-going as of the time of this writing. A Larson Miller Comparison of the parent metal behavior and that of the cross-weld tests is shown in the set of graphs in Figures 7A and 7B, respectively. The results include a comparison with the EPRI databases for parent metal performance (Figure 7A) and HAZ failures in Grade 91
537

steel cross-weld samples (Figure 7B). In each comparison, a mean (solid line) and mean-20% (dotted line) is shown. The lines were fit to the respective EPRI database of failures.
Figure 7A: Larson Miller Parameter Comparison for Parent Metal Performance (C = 30) Figure 7B: Larson Miller Parameter Comparison for Cross-weld Creep Performance (C= 20) DISCUSSION The objective of this research is to identify and link the metallurgical risk factors in Grade 91 parent steel to the cross-weld creep performance. Proper evaluation of the risk factors and their potential link to in-service component performance is a critical objective guiding a series of on-going initiatives that will eventually feed into fundamental material descriptions aiding component modeling, life assessment using continuum damage mechanics and perhaps a specific metallurgical risk factor for 9Cr steels if appropriate. Initial examination of parent steels B2 and TP1 in Table 1 shows that both materials possess a low (poor) N:Al ratio (Table 1). However, and as per the information provided in Figure 1, one heat (B2) exhibited a very high level of in-service damage in contrast to the relatively benign performance of TP1 (i.e. little noted damage although there were considerably less stub-to-header penetrations in this heat). Additionally, and highlighting the contrast specifically with regard to chemistry, one heat would be regarded as very clean (TP1) as compared to B2, both in terms of either individual elemental content (S, P, As, Sb, Sn, Pb) or as a function of the modified J-factor. Initial mechanical test results which evaluate material in the low:low (damage:deformation) regime (i.e. B2) or in the low:medium regime (i.e. RNT-B2) and to a material in the high:medium regime (i.e.TP1) show dramatically different trends in performance even though all of these cross-weld creep tests failed in the HAZ of the respective Grade 91 parent metal steel. There is clear evidence that the increased creep ductility in TP1 resulted in a dramatic increase in cross-weld creep performance. This increase in HAZ failure life is in spite of the fact that TP1 exhibits a less-than-mean strength and a relatively poor N:Al ratio of 2. Furthermore, and although the RNT-B2 and TP1 parent metal tests possess the same resistance to deformation (Table 3), the increase in life for the TP1 cross-weld was observed to be on the order of 5 times greater than that of the RNT-B2 test. This is remarkable since the observed trends at 80 MPa (11.6 ksi) are even more distinct at 60 MPa (8.7 ksi) and cannot be explained on the basis of deformation alone.
538

Most noteworthy in these results is the fact that both B2 and TP1 parent steels meet the minimum criterion in ASME B&PV Code Section IIA with regard to chemical composition, tensile strength, yield strength, tensile elongation and hardness (Tables 1 and 5). Thus, it can be reasonably stated that this comparison clearly underscores that there are clear distinctions between the behavior of these parent Grade 91 steels both in-service (Figure 1) and for post-test performance (Table 4, Figures 5, 6 and 7). Table 5. Evaluation of B2 and TP1 for Minimum Tensile, Hardness and Charpy Impact Values to Relevant ASME and EN Codes
Sample Tensile (MPa)
Yield (MPa)
Elong. (%)
Hardness (HBW)
Charpy Impact Energy, Average of three Tests at
Ambient Temperature (J)
SA-335 P91 Minimum 585 415 20 250 max 27
B2 702.1 525.5 22.5 209 65.3 TP1 622.1 429.0 26.0 197 86.3
Continued evaluation of the results in Table 4 shows that a material with good resistance to damage, but poor resistance to deformation (F-TP1) can actually exceed the performance of a material with poor ductility but acceptable strength (RNT-B2). In the comparison of tests at 60 MPa (8.7 ksi), the cross-weld creep test in F-TP1 has thus far exceeded that of the RNT-B2. The underperforming comparison of F-TP1 at 80 MPa (11.6 ksi) to that of RNT-B2 is likely to be highlighting a sensitivity of the ferritic material to the applied stress. There may be other extenuating effects such as the fact that the ferritic parent metal microstructure of the parent material in F-TP1 is notch strengthening whilst the combined multiaxial effect and poor damage tolerance of RNT-B2 creates an intensified notch-weakening effect in the HAZ region. Nevertheless, the results demonstrate a certain reality with respect to welded component structures that cannot simply be accommodated by a simple consideration of strength alone. Furthermore, and with regard to condition and life assessment practices, material which is underperforming in regards to deformation may actually exhibit acceptable performance when the assessment considers a proper minimum set of conditions such as: the parent metal condition, operating temperature and an analysis of the stresses in the welded component. Conventional opinions have suggested that under-matching filler materials (in this study –B8 type filler metal) are poor choices due to under-performing results on a time-to-rupture basis. These same conventional opinions have also suggested that vastly over-matching filler materials (in this study, the nickel-base EPRI P87 type filler metal) may accelerate damage in the HAZ of 9Cr steels. Upon closer examination, these conventional assertions appear to be overly simplistic and do not capture the complexities in the test results. There is evidence that at the higher stress tests (80 MPa) the over-matching weldment fell short of mean behavior. However, and at 60 MPa, the over-matching weldment achieved mean performance that was effectively equal to that of the matching weldment. The potential increased sensitivity of the test results to the applied stress may provide supporting evidence that nickel-base filler materials can potentially accelerate failure. However, more tests at higher stresses would be necessary to fully substantiate this claim. Furthermore, and consistent with in-service observations, a higher applied test stress >80 MPa (11.6 ksi) may promote a fusion line failure as
539

opposed to a HAZ failure. It is interesting to note for the over-matching weldment (i.e. nickel-base filler metal) there was not a marked level of fusion line damage at either test stress. The under-matching weldment consistently met the mean-20% bound line in Figure 7B. This point has been discussed in more detail in [23, 24] where ample evidence was provided to show that the E8015-B8 filler material effectively matches the strength of the Grade 91 heat affected zone, Figure 8. For simulated HAZ creep tests in Grade 91 steel, the literature data falls directly onto the mean-20% line shown in Figure 7B and Figure 8 and therefore it is not unexpected that the under-matching cross-weld creep tests also fall on this minimum bound line. The under-matching weldment made with E8015-B8 consistently achieved minimum performance. The strain:time data for these weldments provided an interesting observation. The observed macro strain was not only higher in the under-matching weldment (Figures 5 and 6), but also showed a consistent and relevant life fraction spent in tertiary creep. A meaningful extrapolation of this uniaxial observation to an actual component structure is complex, but subsequent evaluation has shown that the onset of tertiary creep in the under-matching weldment is linked to the formation of a macro-crack in either the HAZ or weld metal. This is potentially remarkable when put into a component performance context because it has been shown that defects in a matching weldment do not link to a detectable, macro-size (i.e. ~3 mm in length) until very late in life (90-95% life fraction) for Grade 91 steel [22]. The evidence in Figure 8 comparing the life fraction of under-matching, matching and over-matching weldments suggests that the macro-defect in the under-matching filler metal is forming before at least 90% life fraction and for the matching filler material at a life fraction of ≥95%. No notable formation of a macro defect in the over-matching weldment could be identified. For a component life cycle, the formation of a defect, and earlier in the component life cycle, may give sufficient time to find the defect using conventional inspection techniques and before the defect results in a leak or catastrophic failure.
Figure 8. Comparison of Performance of the TP1 welded with Under-matching, -B8 Type Filler Material in Table 4 to Simulated Heat affected Zone Uniaxial Creep Test data in [25, 26]
540

Figure 9. A Plot of the Derivative of the Strain:Time Data versus Life Fraction and for 60 MPa (8.7 ksi) Tests in Each of the Under-Matching, Matching and Over-Matching Filler Metal Evaluations in TP1. Note: There is a notable increase for the –B8 Type Filler Metal Test (Under-matching) at ~0.8 to 0.9 Life Fraction, for the –B9 Type Filler Metal (Matching) at ~0.95 Life Fraction and no apparent increase for the EPRI P87 Type Filler Metal (Over-matching) CONCLUSIONS The parent metal condition has a direct effect on the cross-weld creep performance in Grade 91 steel. This is most often put into the context of a deformation-related mechanism (i.e. strength), but as presented in this manuscript there is a clear influence of the damage resistance (i.e. ductility) on cross-weld creep performance. Thus, the presented results demand that designers and material developers place an equal emphasis on parent metal performance with respect to the susceptibility to damage. To highlight this reality and for a set of martensitic Grade 91 parent materials which exhibit the same strength, an increase in the ductility from 15% to 83% ROA increased the cross-weld creep life by 5 times at a test condition of 625°C (1157°F) and 60 MPa (8.7 ksi). On-going assessment is working to more definitively link risk factors in the microstructure which are responsible for damage (i.e. inclusions and/or other cavitation-susceptible features in the material). This evaluation will more thoroughly explore the influence of the microstructural features in each investigated set of weldments contributing to a reduction in performance. With regard to the effect of filler metal strength on component performance, a number of interesting trends were observed in this study. Firstly, in the over-matching weldment there was not a clear trend to reduced life especially at the lower applied stress tests at 60 MPa (8.7 ksi). In the tests at 80 MPa (11.6 ksi), there may be an indication of onset to reduced performance but these tests still met acceptable performance (i.e. the test duration was greater than the mean-20% bound). Cross-welds with under-matching filler material consistently failed at the mean-20% bound for HAZ failures in Grade 91 steel. This result can be rationalized by the fact that the filler material used matched the strength of the HAZ very closely. Although the under-matching filler materials showed reduced cross-weld creep life, these welds exhibited the most damage tolerance
541

of all the evaluated filler materials. To highlight this point, there is evidence that macro-crack defects initiate earlier in the test life in an under-matching filler material scenario therefore increasing the likelihood of defect detection in-service. In closing, the results for filler metal strength on performance highlight a need to also balance the strength and damage tolerance in the filler material (and in addition to the parent metal) when designing a component for long-term operation. REFERENCES [1] M. Gold, J. Hainsworth and J. M. Tanzosh. “Service Experience with Design and
Manufacturing Approaches with T/P91 Materials.” EPRI Conference on 9Cr Materials Fabrication and Joining Technologies. EPRI, Palo Alto, CA: 2001. 1006299. pp. 15-1 to 15-20.
[2] The Benefits of Improved Control of Composition of Creep-Strength-Enhanced Ferritic Steel Grade 91. EPRI, Palo Alto, CA: 2014. 3002003472.
[3] The Influence of Steel Making and Processing Variables on the Microstructure and Properties of Creep-Strength-Enhanced Ferritic (CSEF) Steel Grade 91. EPRI, Palo Alto, CA: 2014. 3002004370.
[4] J. D. Parker and A. W. J. Parsons. “High Temperature Deformation and Fracture Processes in 2¼Cr-1Mo and 12Cr½Mo¼V Weldments.” International Journal of Pressure Vessels and Piping 63 (1), 1995. pp. 45 to 54.
[5] Embrittlement of Power Plant Steels. EPRI, Palo Alto, CA: 2013. 3002001474. [6] King, B. L. “Intergranular Embrittlement in CrMoV Steels: An Assessment of the Effects of
Residual Impurity Elements on High Temperature Ductility and Crack Growth.” Philosophical Transactions of the Royal Society A 295 (1413), 1980. pp. 235 to 251.
[7] McPherson, R. “Compositional Effects on Reheat Cracking of Low-Alloy Ferritic Steels.” Metals Forum 3 (3), 1980, pp. 175-186.
[8] J. Parker. “Creep Cavitation in Steels.” Proceedings of the Seventh International Conference on Advances in Materials Technology. ASM International: 2013, pp. 714 to 731.
[9] M. Yoshizawa et al. “Effect of Precipitates on Long-term Creep Deformation Properties of P92 and P122 Type Advanced Ferritic Steels for USC Power Plants.” Materials Science and Engineering A 510-511 (2009). pp. 162 to 168.
[10] H. K. Danielsen, P. E. DiNunzio and J. Hald. “Kinetics of Z-Phase Precipitation in 9 to 12 pct Cr Steels.“ Metallurgical and Materials Transactions A – Physical Metallurgy and Materials Science 44A (5), 2013. pp. 2445 to 2452.
[11] Sigma Phase in 316 Stainless Piping, Main-steam Piping Failure: Eddystone-1 Plant. EPRI, Palo Alto, 1989: GS-6286.
[12] Henry, J., Ward, T. and Zhou, G. “Lessons from the Past: Materials-related Issues in an Ultra-supercritical Boiler at Eddystone Plant.” Materials at High Temperatures 24 (4), 2007. pp. 249-258.
[13] J. D. Parker and S. Brett. “Creep Performance of a Grade 91 Header.” International Journal of Pressure Vessels and Piping 111-112 (2013). pp. 82 to 88.
[14] S. Brett. “Early Type IV Cracking on Retrofit Grade 91 Steel Headers.” Safety and Reliability of Welded Components in Energy and Processing Industry. Graz University of Technology: 2008, pp. 225 to 231.
[15] S.J. Brett, J.S. Bates, and R.C. Thomson. “Aluminium Nitride Precipitation in Low Strength Grade 91 Power Plant Steels.” Proceedings of the Fourth International Conference on Advances in Materials Technology. ASM International: 2005, pp. 1183 to 1197.
542

[16] S. T. Kimmins, M. C. Coleman and D. J. Smith. “An Overview of Creep Failure Associated with Heat Affected Zones of Ferritic Weldments.” Proceedings of the Fifth International Conference on Creep and Fracture of Engineering Materials and Structures, 1993. pp. 686.
[17] H. Kohno. “Effect of Chemical Composition on the Properties of High Purity 3.5NiCrMoV Steel Forgings.” In Conference on Advances in Materials for Fossil Power Plants, Chicago, IL, ASM, 1987. pp. 81 to 88.
[18] A Well-Engineered Approach for Establishing the Minimum Allowable Post Weld Heat Treatment for Power Generation Applications of Grade 91 Steel. EPRI, Palo Alto, CA: 2015. 3002005350.
[19] A Perspective on the Selection of Preheat, Interpass and Post-weld Cool Temperatures Using Grade 91 Steel as an Example. EPRI, Palo Alto, CA: 2015. 3002005351.
[20] F. R. Larson, F. R. and J. Miller. “A Time-Temperature Relationship for Rupture and Creep Stresses.” Transactions of the ASME 145 (7), 1952. pp. 765 to 775.
[21] Life Management of Creep-Strength-Enhanced Grade 91 Steels--Atlas of Microstructures: Base Metal. EPRI, Palo Alto, CA: 2013. 3002000080.
[22] J. A. Siefert and J. D. Parker. “Evaluation of the Creep Cavitation Behavior in Grade 91 Steels.” Submitted to the International Journal of Pressure Vessels and Piping 138 (2), 2016. pp. 31 to 44.
[23] Analysis of the Performance of 9Cr-1Mo (E8015-B8) Filler Metal. EPRI, Palo Alto, CA: 2015. 3002004478.
[24] Best Practice Guideline for Well-Engineered Weld Repair of Grade 91 Steel. EPRI, Palo Alto, CA: 2014. 3002003833.
[25] H. Hongo et al. “Type IV Creep Damage Behavior in Gr.91 Steel Welded Joints.” Metallurgical and Materials Transactions A 43A (2012). pp. 1163 to 1173.
[26] J. Koukal, M. Sondel, and D. Schwarz. „Correlation of Creep Properties of Simulated and Real Weld Joints in Modified 9%Cr Steels.” Welding in the World 54 (1/2), 2010. pp. R28 to R34.
543


