44
TECHNICAL APPENDIX SEPTEMBER 2016 LIONS ON THE MOVE II: REALIZING THE POTENTIAL OF AFRICA’S ECONOMIES

TECHNICAL APPENDIX
SEPTEMBER 2016
LIONS ON THE MOVE II: REALIZING THE POTENTIAL OF AFRICA’S ECONOMIES

Copyright © McKinsey & Company 2017
In the 25 years since its founding, the McKinsey Global Institute (MGI) has sought to develop a deeper understanding of the evolving global economy. As the business and economics research arm of McKinsey & Company, MGI aims to provide leaders in the commercial, public, and social sectors with the facts and insights on which to base management and policy decisions. The Lauder Institute at the University of Pennsylvania ranked MGI the world’s number-one private-sector think tank in its 2015 Global Think Tank Index.
MGI research combines the disciplines of economics and management, employing the analytical tools of economics with the insights of business leaders. Our “micro-to-macro” methodology examines microeconomic industry trends to better understand the broad macroeconomic forces affecting business strategy and public policy. MGI’s in-depth reports have covered more than 20 countries and 30 industries. Current research focuses on six themes: productivity and growth, natural resources, labor markets, the evolution of global financial markets, the economic impact of technology and innovation, and urbanization.
Recent reports have assessed the economic benefits of tackling gender inequality, a new era of global competition, Chinese innovation, and digital globalization. MGI is led by four McKinsey & Company senior partners: Jacques Bughin, James Manyika, Jonathan Woetzel, and Eric Labaye, MGI’s chairman. Michael Chui, Susan Lund, Anu Madgavkar, and Jaana Remes serve as MGI partners. Project teams are led by the MGI partners and a group of senior fellows, and include consultants from McKinsey offices around the world. These teams draw on McKinsey’s global network of partners and industry and management experts. Input is provided by the MGI Council, which co-leads projects and provides guidance; members are Andres Cadena, Richard Dobbs, Katy George, Rajat Gupta, Eric Hazan, Acha Leke, Scott Nyquist, Gary Pinkus, Shirish Sankhe, Oliver Tonby, and Eckart Windhagen. In addition, leading economists, including Nobel laureates, act as research advisers.
The partners of McKinsey fund MGI’s research; it is not commissioned by any business, government, or other institution. For further information about MGI and to download reports, please visit www.mckinsey.com/mgi.

TECHNICAL APPENDIX
This technical appendix is a supplement to the McKinsey Global Institute report Lions on the Move II: Realizing the potential of Africa’s economies, published in September 2016 and available online at www.mckinsey.com/insights/mgi. This appendix outlines key elements of the methodology used in the report, along with the major data sources and assumptions adopted. It takes a chapter-by-chapter approach to outlining the methodology, data sources, and assumptions for each of the significant pieces of analysis covered in the report.
1. Africa’s growth paths have diverged, but long-term fundamentals remain strong Page 2
2. Serving Africa’s markets: A $5.6 trillion opportunity Page 11
3. Unleashing an African industrial revolution Page 23
4. The rise of corporate Africa Page 33
5. Sustaining momentum—imperatives for government Page 37
2 McKinsey Global Institute Technical appendix
1. AFRICA’S GROWTH PATHS HAVE DIVERGED, BUT LONG-TERM FUNDAMENTALS REMAIN STRONGAfrica’s economies find themselves on diverging growth paths. Our analyses of national growth, sectoral growth, and country stability are outlined below.
GDP ANALYSESAnalysis of GDP growth by countryWe calculated national GDP data throughout the report using statistics from the International Monetary Fund’s (IMF) World economic outlook, April 2016. GDP estimates for 2015 are based on current prices in dollars as stated in the World economic outlook database. We scaled historical figures and forecasts until 2020 from 2015 prices (as the base year) using year-on-year GDP growth rates for each country in real terms. We calculated these real growth rates from national-currency-based real GDP data from this database.
We based consensus forecasts to 2025 on consolidated growth forecasts from two data sets of real GDP growth: Oxford Economics and IHS Economics. We chose these data sets because each had forecasts for 54 countries across the full period of interest.
Analysis of GDP growth by sectorWe built up estimates of GDP growth by sector by consolidating data from multiple sources. We collated detailed data for 13 countries accounting for 80 percent of GDP: Algeria, Angola, Cameroon, Egypt, Ethiopia, Ghana, Kenya, Morocco, Nigeria, Senegal, South Africa, Tanzania, and Tunisia. We gave all data a new baseline of 2015 real dollars using the GDP sources referenced in the previous section.
We sourced Algerian local currency data for 2000 to 2014 from that country’s national statistical bureau, and converted it into 2015 real dollars. We sourced Angolan data for 2000 to 2013 from the United Nations Statistics Division’s UNdata data service. We needed to split some sectors into more detailed categories. We did this by using detailed data on GDP by sector from IHS for nine African countries (Cameroon, Egypt, Kenya, Morocco, Nigeria, Senegal, South Africa, Tunisia, and Zimbabwe). For countries not in that group, we applied an average of the nine. In general, the UN data require sector groupings to be split between mining and utilities, trade and tourism, and services into financial services; business services; government services; education, health and social services; other social and personal services; and private household services.
We based sector breakdowns for Cameroon, Egypt, Kenya, Morocco, Senegal, South Africa, and Tunisia on IHS data. We compiled Nigerian data from data provided by the National Bureau of Statistics for 2010 to 2014, and IHS data from 2000 to 2009. We combined Ghanaian data from Ghana Statistical Service data in local currency from 2009 to 2014, and UN data from 2000 to 2009. We reconciled the differing levels of breakdown detail between the two data sets by applying the more detailed structure from the Ghanaian statistics service to the UN data. In the case of Tanzania, we used local currency data from the National Bureau of Statistics for 2005 to 2014, and UN data for 2000 to 2004. We reconciled the differing levels of breakdown detail between the two data sets by applying the more detailed structure from the Tanzanian statistics bureau to the UN data.
Sector data for Ethiopia came from two sources: UN data from 2000 to 2013, and detailed sectoral data for 1999, 2005, and 2013 from Lars Christian Moller, Ethiopia’s great run: The growth acceleration and how to pace it, World Bank working paper number 99399, November 2015. We split mining and utilities, trade and tourism, and services into financial services; business services; government services; education, health and social services; other social and personal services; and private household services based on the same approach discussed earlier.

3McKinsey Global Institute Lions on the move II: realizing the potential of Africa’s economies: Technical Appendix
GDP growth disaggregationOur productivity analysis disaggregated the share of Africa’s recent growth history (from 1990 until 2015) that was driven by growth in the labor force and growth in labor productivity. We completed this analysis using data for 25 African countries generating 92 percent of GDP. We excluded Libya because of its sharp decline in GDP between 2010 and 2015, which would have skewed the results. We estimated the compound annual growth rate in labor productivity per person employed over three periods, 1990 to 2000, 2000 to 2010, and 2010 to 2015, using a weighted average of the data set from The Conference Board Total Economy Database™ (2015) in 2014 dollars (weighted according to number of employed persons in each country from the same data source). The contribution attributed to labor force growth was the residual of GDP growth less labor productivity growth.
Other analyses: Sovereign debt yieldsOur analysis found that Africa’s sovereign debt yields have risen sharply as governments have come under increased fiscal pressure. We came to this conclusion based on data from Bloomberg for all African states that issued Eurobonds in US dollars in 2014 and 2015. We included only government issued international ten-year debt. Countries that issued bonds included 12 major economies, namely Côte d’Ivoire, Egypt, Ethiopia, Gabon, Ghana, Kenya, Morocco, Namibia, Nigeria, Senegal, South Africa, and Zambia. We analyzed the yield to maturity over 12 months for bonds issued in 2014 and 2015, and observed an increase in yields in the two-year period in all countries that had issued bonds, ranging from eight basis points in the case of South Africa to 392 basis points for Zambia. We computed the yield to maturity to enable like-for-like comparison of bonds with differing maturities.
COUNTRY SEGMENTATION ANALYSIS–AFRICAN STABILITY INDEXThe countries on the African continent are in various stages of economic development, and remain vulnerable to economic, social, and political shocks. To better gauge where each economy lies in this context, we positioned them along a stability matrix. We determined a country’s position on the matrix on two dimensions: its recent economic growth performance (from 2010 to 2015), and its relative stability. Our analysis focused on the largest economies in Africa.
We based each country’s recent economic growth on its average GDP compound annual growth rate from 2010 to 2015. We used data provided by the IMF World economic outlook, April 2016 database. We explained how we reconciled real GDP growth on a 2015 price basis earlier.
To understand each country’s relative stability, MGI developed an African Stability Index that focuses on understanding each country’s vulnerabilities. The index ranks countries in relative terms based on an aggregate stability score. This score is based on three factors of equal weighting (one-third each): macroeconomic stability, economic diversification, and political and social stability. We ranked each country in our database. The aggregate stability score is the sum of each country’s rank on each of these three factors, so that the lower the score the higher the stability (Exhibit A1).
Macroeconomic stabilityMGI’s macroeconomic stability measure is based on the average of two measures for each country. We measured the state of fiscal buffers (gross debt-to-GDP ratio) and of external balances (reserves in months of imports). We compiled fiscal buffers from the IMF’s World economic outlook October 2015 forecast of the debt-to-GDP ratio for the selected countries. We arrived at external balances using the latest available data from the World Bank’s World Development Indicators on total reserves in months of imports for selected countries. In some cases, including that of Algeria, we estimated these values based on available reserves and imports data. Countries with low score rankings are best positioned (low debt, high reserves), while high scores imply poor stability.

4 McKinsey Global Institute Technical appendix
Economic diversificationThere were a number of measures of diversification that we could potentially have used. We opted against using the traditional measure of resources as a share of GDP, and instead chose to focus on resources as a share of exports. We took this approach because recent shocks to resource prices and the subsequent impact on resource exports can be tied to a number of stability challenges, including current-account deficits, weakened national government incomes, weakening currencies, weakened household spending power (in dollars), and so on. Exports are an excellent measure of progress in diversification (see Chapter 5 of the report).
To rank countries by economic diversification, we estimated by value the share of resources as a share of total exports. We manually categorized World Integrated Trade Solution (WITS) data from 2014 (or the most recent available year) by country to identify resource exports. We included selected intermediate processed resources (for example, copper plates) under resources because, while counting as intermediate processed goods, these are only marginally more processed than resources and do not significantly diversify the nature of the exports. Countries with low rankings have the lowest share of natural resources in their exports, while countries with high rankings have a significant share of natural resources in their exports (that is, a low score is a positive reading of diversification while a high score is a negative reading).
Social and political stabilityWe based social and political stability on three measures: governance (Ibrahim Index of African Governance), social stability (national unemployment rate), and safety and security (number of violent incidents). We ranked each country on these three measures, and then averaged their ranking to obtain an overall country social and political stability score. We ranked governance according to each country’s relative ranking using the Ibrahim Index of African Governance, 2015, from the Mo Ibrahim Foundation. We ranked social stability using 2015 data on countries’ unemployment, counting both stable and vulnerable employment, from the International Labour Organization’s (ILO) World employment and social outlook: Trends 2015. We ranked safety and security using the number of incidences of political violence in the Uppsala Conflict Data Program Georeferenced Events Dataset instances of political violence GED database 2014.

5McKinsey Global Institute Lions on the move II: realizing the potential of Africa’s economies: Technical Appendix
Exhibit A1
SOURCE: World economic outlook, IMF, April 2016; World Bank World Development Indicators; WITS; IIAG; ILO; Uppsala Conflict Data Program Georeferenced Events Dataset; McKinsey Global Institute Africa Stability Index; McKinsey Global Institute analysis
1 Ibrahim Index of African Governance.
African countries have varying levels of exposure to risks
Macroeconomic stabilityEconomic diversification Social and political stability
Country
Debt-to-GDP ratio, 2015
Reserves in months of imports, latest available year
Natural resources% exports, 2014
Ability to govern, IIAG score, 20151
Unemploy-ment rate, latest available year
Number of violent incidents, 2014
Mauritius 22 6 1 1 13 1
Rwanda 9 15 5 8 1 1
Uganda 11 15 6 13 6 16
Côte d’Ivoire 10 17 8 23 7 1
Morocco 25 4 7 11 20 1
Tanzania 14 12 14 12 4 1
Botswana 3 3 20 2 26 1
Senegal 21 11 11 7 19 1
Kenya 18 14 4 10 17 26
Mali 13 22 3 20 15 21
South Africa 17 7 16 3 30 1
Madagascar 12 24 13 19 5 1
Ethiopia 16 27 2 21 9 20
Algeria 1 2 21 14 18 24
Namibia 6 28 15 4 25 1
Tunisia 20 18 9 6 22 22
Togo 23 25 10 22 11 1
Burkina Faso 7 25 19 16 3 16
Cameroon 8 13 18 24 8 23
Ghana 28 19 23 5 2 1
Equatorial Guinea 5 9 29 27 16 1
Nigeria 2 8 25 25 12 30
Gabon 15 9 25 17 28 1
Zambia 19 20 24 9 23 1
Egypt 30 21 12 18 21 25
Angola 24 5 30 26 10 18
Mozambique 29 23 17 15 29 19
Democratic Republic of Congo 4 29 27 29 13 28
Libya 26 1 28 28 27 27
Sudan 27 30 22 30 24 29
Top 2nd 3rd BottomQuartile

6 McKinsey Global Institute Technical appendix
LONG-TERM FACTORS ARE LIKELY TO ACCELERATE GROWTHOverall, Africa’s GDP is still expanding faster than the global average and is forecast to accelerate over the next five years to once again position Africa as the world’s second-fastest growing region. Behind this positive outlook lie four factors.
Africa has the most rapid urbanization of any region in the worldUrbanization trends are derived from the United Nations Population Division database. Estimates of the number of cities with more than one million inhabitants and with more than five million inhabitants are taken from the McKinsey Global Institute Cityscope database for 2015, a proprietary database of cities across the world.
By 2034, Africa’s workforce will be larger than that of either China or IndiaThe basis for MGI’s analysis of trends in the working-age population was data released by IHS Global Insight World Market Monitor. We used a definition for the working-age population of 15 to 64 years, and used data for 52 African countries. Our discussion on broader demographic trends drew on MGI’s January 2015 report Global growth: Can productivity save the day in an aging world? Labor force and employment data came from the ILO database Trends Econometric Models, October 2014, covering 48 African countries representing 99.8 percent of Africa’s GDP. We estimated vulnerable employment from employment-by-status data as the sum of the category “own-account workers” plus “contributing family members,” while stable employment included “wage and salary workers” plus “employers.”
Using the ILO data, we counted stable (formal, wage-paying) and vulnerable employed workers together as “employed” and found that unemployment for the continent was 8.4 percent of the labor force. Combining these data with IHS statistics on the working-age population, we found that about 32 percent of the working-age population was not part of the labor force. The working-age population grew at 2.7 percent per year from 2000 to 2015, while the labor force grew at 2.8 percent. Over the same period, total employment rose by 2.9 percent per year (for both stable and vulnerable jobs), just higher than growth in the working-age population. Stable jobs deserve closer scrutiny, as these underpin sustainable economic development through higher household income levels, higher state income taxes, and so on. The trend is promising. The stable jobs data show that an estimated 21 million new stable jobs were created from 2010 to 2015, and 53 million over the past 15 years. In fact, the ratio of vulnerable to stable jobs declined from 2.8 in 2000 to 2.3 in 2015. Put another way, stable jobs increased as a share of employment from 35 percent of employment in 2000 to 2010 to 38 percent of employment in 2010 to 2015. This reflected the fact that stable jobs grew at 3.8 percent per year from 2000 to 2015, while vulnerable employment grew at only 2.6 percent a year. We were therefore able to conclude that job creation is outpacing growth in the labor force (Exhibit A2).
Based on the ILO database, from 2000 to 2014 agriculture accounted for the largest share of new jobs created at 45 percent, followed by the services sector at 29 percent, the construction sector at 6 percent, and the manufacturing sector at 5 percent. The government created 13 percent of new jobs (counted as all new education, health care and social work, and public administration and defense jobs). Resources and utilities created 2 percent of jobs combined.

7McKinsey Global Institute Lions on the move II: realizing the potential of Africa’s economies: Technical Appendix
We estimated the average number of years of education as an average of 52 African countries for which data were available. We used data from the UN Development Programme (UNDP) International Human Development Indicators; Robert J. Barro and Jong-Wha Lee, “A new data set of educational attainment in the world, 1950–2010,” Journal of Development Economics, volume 104, issue C, 2013; UNESCO Institute for Statistics, 2013; and UNDP Human Development Report Office estimates. These sources together provided data on years of schooling from 1980 to 2013.
Technological advances create new opportunities for growthIn its November 2013 report Lions go digital: The internet’s transformative potential in Africa, MGI explored in depth the potential of digital technology transforming Africa’s economy. In that report, MGI estimated that the internet could add $300 billion to the continent’s GDP, or about 10 percent, by 2025. We based historical broadband connections and forecasts of broadband penetration on both projected fixed and (almost completely) mobile connections sourced from Analysys Mason DataHub and Ovum (Exhibit A3). We estimated historical and forecast smartphone penetration using projections of smartphone penetration from the GSM Association (GSMA), Sub-Saharan Africa mobile economy report 2013, and GSMA,
Exhibit A2
SOURCE: International Labour Organization; Global Insight World Market Monitor; McKinsey Global Institute analysis
Detailed breakdown of labor-force populationMillion adults
Stable jobs grew at 3.8 percent over the past decade, 1 percentage point faster than the labor force
Unemployed population
20152
449
Stable jobs
Vulnerable employment1
30
196
38389
103
288
254
297
71
32
2000
124
2010
3.8
24 26 28
1 Includes “own account workers” and “contributing family workers” categories according to the International Labour Organization (ILO) definition.2 ILO estimates.NOTE: Numbers may not sum due to rounding.
Stable employment rate%
2.5
3.22.9
3.8
2.6
0.82.8
2010–152000–10
Compound annual growth rate%

8 McKinsey Global Institute Technical appendix
The mobile economy: Sub-Saharan Africa 2015, as well as population data from the UN Population Division.
Data on mobile money payments came from the World Bank Global Findex database, 2014. The share of adults in sub-Saharan Africa with mobile-money accounts was 11.5 percent compared with 2.6 percent in South Asia, 1.7 percent in Latin America, and less than 0.4 percent in East Asia. We considered as adults those aged 15 or older who report personally using a mobile phone to pay bills or to send or receive money through a GSMA mobile money for the unbanked service in the past 12 months; or receiving wages, government transfers, or payments for agricultural products through a mobile phone in the past 12 months. We based growth rates in e-commerce on local currency data sourced from Euromonitor International 2016, and from trade sources and Statistics South Africa for that country.
Africa continues to have rich reserves of resourcesAfrica contains 60 percent of the world’s unutilized but potentially available cropland. This estimate is based on a bottom-up calculation of potential additionally available cropland that is not yet in use (Exhibit A4). Cropland is defined as land producing output greater than 40 percent of maximum yield under rain-fed conditions, excluding forest areas. Estimation of available cropland takes into consideration land conversion from non-permanent cropland and pasture to cropland, the improvement potential of marginal land to a minimum of 40 percent of maximum yield, historical land conversion rates, and cropland expansion scenarios. We used 2013 UN Food and Agriculture Organization data from FAOSTAT
Exhibit A3
%
SOURCE: Ovum; World Bank Global Findex database 2014; Euromonitor; press search; Statistics SA; McKinsey Global Institute analysis
Digital connectivity likely to increase fourfold
Sub-Saharan Africa 11.5
4x
EastAsia 0.4
LatinAmerica 1.7
SouthAsia 2.6
Broadband penetration Mobile money: Africa is growing 4x faster than the next region
E-commerce: Experiencing double-digit growth, 2010–15
21
48
59
68
72
80
Emerging Asia 102
Africa
108World
116
119
Middle East
Latin America 12
13
14
17
34
Compound annual growth rate, 2015–2020202015
17
28
94Nigeria
SouthAfrica
Kenya
NOTE: Not to scale.

9McKinsey Global Institute Lions on the move II: realizing the potential of Africa’s economies: Technical Appendix
and FAO OECD, as well as Awakening Africa’s sleeping giant: Prospects for commercial agriculture in the Guinea Savannah Zone and beyond, Directions in Development paper, World Bank/Food and Agriculture Organization, 2009. The other region with a significant share of potentially available cropland is Latin America with around 30 percent.
Africa has the world’s largest reserves of vanadium, diamonds, manganese, phosphate, platinum-group metals, cobalt, aluminum, chromium, and gold. Our sources here were S&P Global Market Intelligence and the US Geological Survey. The continent is responsible for 10 percent of global exports of oil and gas, 9 percent of copper, and 5 percent of iron ore. Our estimates for oil and gas include crude petroleum oil, petroleum gases, and petroleum oils not crude; for copper, they include refined copper, copper alloys unwrought, copper ores and concentrates, copper waste and scrap, and unrefined copper. Oil and gas constitutes 79 percent of Africa’s resource exports, while copper constitutes about 4 percent and iron ore about 2 percent. These estimates are derived from a database using ITC calculations, based on United Nations Comtrade statistics for 2014. Even at recent lows in the prices of these resources, a significant share of African production continues to be in a competitive cost position.
These findings are based on our analysis of three cost curves covering oil, copper, and iron ore:
� Oil. We used an oil cost curve developed by McKinsey Energy Insights in January 2016. The curve assumes a “slow recovery scenario” in global liquids in the period to 2025. The cost curve constitutes the net present value of all costs that will be incurred from 2015 to 2025: the total cost of production in dollars per barrel. This comprises technical costs (capital expenditure, operational expenditure, and the cost of exploration) and the government take (taxes and royalties). The costs take into account the cash cost for existing fields and the full life cycle cost for greenfield project developments. African countries are spread across the full range of the cost curve based on total cost. Their technical costs fall well below an oil price of $40 to $50 a barrel in most cases. However, when government take is added back, in many cases the total cost exceeds an oil price of $40 a barrel, and in some cases $50 a barrel.
� Copper. The copper cost curve was developed for 2015 by McKinsey’s Basic Materials Institute (BMI) and proprietary MineSpans Commodity Insights, using additional data from Wood Mackenzie, the World Bank, and the Financial Times (for current commodity price data). The cost curve is constructed by mine in dollars per ton, and includes cash costs for the world’s top 50 mines by capacity. African mines are spread across the cost curve with a few that are positioned very low on the curve.
� Iron ore. This third cost curve was also developed for 2015 by McKinsey’s BMI. It is denominated in dollars per ton free on board (including royalties) for 62 percent iron equivalent fines. We see sub-Saharan African production falling into all quartiles across the cost curve, but many fall into the first quartile. Interviews with McKinsey’s BMI Practice indicate that currency devaluation has helped these countries produce in this low-cost position.

10 McKinsey Global Institute Technical appendix
Exhibit A4
SOURCE: World Bank/Food and Agriculture Organization, Awakening Africa’s sleeping giant; McKinsey Global Institute analysis
Africa represents about 60 percent of the potentially available cropland in the world
79Other
Sub-SaharanAfrica
Latin America
1,025
323
623
2013
226
45
42
50
55
65
69
72
Mozambique
Zambia
Angola
Democratic Republic of Congo
Sudan2
Central AfricanRepublic
Others
Tanzania
78
32
45
167
Others
Argentina
Brazil
Venezuela
1 Cropland defined as land producing output greater than 40% of maximum yield under rain-fed conditions, excluding forest areas.2 2009 data (latest available).NOTE: Numbers may not sum due to rounding.
Additional available cropland, 20131
Million hectares

11McKinsey Global Institute Lions on the move II: realizing the potential of Africa’s economies: Technical Appendix
2. SERVING AFRICA’S MARKETS: A $5.6 TRILLION OPPORTUNITYThis chapter outlines the methodology used to estimate Africa’s business opportunities.
AFRICA’S PRIVATE CONSUMPTION IS PROJECTED TO GROW TO $2.1 TRILLION BY 2025This section estimates the business spending opportunity that household consumption presents. It combines historical analysis of growth trends with analysis of potential future growth based on a consolidation of forecasts from a number of sources.
Consolidation of consumption forecastsTo estimate household consumption between 2005 and 2025, we used IHS and Oxford Economics as our primary data sources from which we were able to gather data for 39 African countries. These data were available in 2010 prices. Using these two sources, we calculated an average household consumption number for each country for each year, forming a consensus estimate that we then rebased to 2015 prices. Of particular significance is the downward revision in Nigeria’s 2025 GDP forecasts by IHS, which also led to a downward revision in consumption forecasts. These moves reflected projected currency depreciation, and a recession at the time of publishing our research in the third quarter of 2016.
Next, we aggregated the countries to obtain total household consumption estimates for Africa, which added up to $1.4 trillion and $2.1 trillion in 2015 and 2025, respectively. Our estimates are based on 39 counties in Africa, due to a lack of reliable estimates for the remaining countries.
We then estimated historical consumption growth from 2000 to 2005, from 2005 to 2010, and from 2010 to 2015, and compared this with consumption growth in other regions including emerging Asia, Central and Eastern Europe, and Latin America. We also made comparisons to the scale of three specific countries: Brazil, India, and Russia. All of these estimates were based on these consolidated data sets.
We were not able to conduct an extensive analysis on the household consumption of each of the 39 countries, and therefore aggregated selected countries into regions to analyze the share that each region contributed to total consumption over time. We kept Egypt, Nigeria, and South Africa, the three largest markets in 2015, distinct. We grouped the rest into North Africa, East Africa, Francophone Africa (comprising 15 countries in Central and West Africa, but excluding North and East Africa), and the rest of sub-Saharan Africa (the remaining parts of Central, West and Southern Africa).
Share of consumption split between population and incomeWe wanted to understand what had been driving consumption growth, the main question being: Was it all driven by population trends? To estimate the share of consumption growth attributable to growth in population (measured by growth in the number of households) vs. growth in consumption by household, we relied on consensus forecasts of household consumption per country as well as the number of households from the Canback Global Income Distribution Database (C-GIDD). We calculated the percentage growth in each of the two variables—households and consumption by household—between 2005 and 2015. We then combined the percentage growth of each variable to understand what each contributed to overall growth.

12 McKinsey Global Institute Technical appendix
Analysis of historical consumption growth in product and service categoriesOur analysis of historical shifts in consumption of product categories was estimated using data sourced from Euromonitor Passport, and analyzed by product and country. We illustrated growth rates in real terms.
Analysis of consumption growth potential of product and service categoriesAs outlined, our consensus of household consumption estimates formed the basis of our 2015 and 2025 numbers across Africa. This approach provided us with a top-down estimate of $2 trillion in African consumption in 2025.
Our estimates of the growth potential of categories relied heavily on the African income distribution for the 39 countries (on which the entire household consumption analysis is based) from C-GIDD. This was necessary to capture the difference in spending by different income segments. We also used Euromonitor data that provided spending per product category by income decile level for a selected group of countries. We then combined our estimates of the African income distribution from C-GIDD with estimates of African household spending from Euromonitor as outlined below.
Using C-GIDD, we considered six major household income categories: (1) households with annual incomes lower than $2,000; (2) $2,000 to $5,000; (3) $5,000 to $10,000; (4) $10,000 to $20,000; (5) $20,000 to $50,000; and (6) more than $50,000. Due to a lack of reliable data on household savings and private tax levels, we assumed that income level by segment was also equal to consumption by segment. This methodology can be considered to be fairly accurate for lower income levels, but becomes less accurate for the more than $20,000 category. Based on this analysis, we were able to prepare estimates of total consumption by income segments.
We then tried to obtain estimates of total consumption by income level. For each country, we assumed that the combined consumption of each income bracket could be estimated by the midpoint of the income bracket multiplied by the number of households in that bracket. We estimated this by using 18 income segment brackets to ensure that we worked in small enough income segment groupings that the midpoint was a reasonable approximation of the average.
Euromonitor provides estimates of household spending by major product group for ten income deciles in eight African countries—Algeria, Cameroon, Egypt, Kenya, Morocco, Nigeria, South Africa, and Tunisia. To extrapolate these data across 39 African countries, we first mapped each income decile from Euromonitor to a specific income bracket described above from C-GIDD, and calculated the average consumption basket (proportion spent by product group) for each of the income brackets per product and service category. We observed similar household consumption baskets for similar income brackets across different countries. We therefore took the average for the eight countries for which we have data to create a representative African consumption basket for each income bracket. This allowed us to apply our estimate of each consumption basket for households by income bracket to all 39 countries in our consumption analysis, based on what we knew of the income brackets of those 31 other countries. Although a crude assumption, this approach was necessary in the absence of more recent household surveys in Africa.
For each income bracket, we then applied our representative consumption basket to total consumption by income segment to derive the composition of spending by each income bracket. This gave us an estimate of total spending by category for each country. We then obtained the proportion of spending by product category for each country. Finally, we set the upper limit on consumption for each country in our bottom-up consumption estimates using our consensus estimates of household consumption by country to which we applied the proportion of spending by category that we have noted.

13McKinsey Global Institute Lions on the move II: realizing the potential of Africa’s economies: Technical Appendix
We built separate bottom-up estimates of telecommunications and financial-services consumption and substituted these into the model as these are two sectors in which McKinsey has significant internal expertise in Africa.
We based our financial-services estimates on retail banking revenue in a group of 21 African countries for which historical data and forecasts were available until 2020. The primary source of data for this analysis was McKinsey’s proprietary Global Banking Pools database. For these 21 countries, we extrapolated their growth to 2025 using the compound annual growth rate of retail banking revenue between 2015 and 2020, corrected by the ratio of GDP growth forecasts from 2020 to 2025 divided by GDP growth forecasts from 2015 to 2020. We extrapolated estimates for the remaining 18 countries based on available information on each country’s average banking penetration and average revenue per customer based on the 21 countries for which we had data available using McKinsey Global Banking Pools as our data source (see the later section on business-to-business spending for more detail of our approach).
We based telecommunications estimates for 2015 on a combination of data from World Cellular Information Service, Business Monitor International, Ovum, and Yankee. We built 2025 forecasts using McKinsey proprietary estimates contained in a 2016 report from McKinsey’s Telecommunications, Media, and High Tech Practice in Middle East and Africa (see the later section on business-to-business spending for more detail on our approach).1
Growth potential of segmentsWe broke African households into four income brackets: “basic needs” for households earning less than $5,000 a year; “emerging consumers” earning between $5,000 and $20,000 a year; “global consumers” earning between $20,000 and $50,000; and “affluent” households earning more than $50,000. These definitions are stated in purchasing power parity (PPP) terms to ensure comparability across regions. PPP is the adjustment made to currency exchange rates of countries to standardize purchasing power across countries. percentages quoted for households in the “basic needs” category in our research differ from data observed in national statistics or national household surveys, which are presented in local currency terms and not on a PPP basis.
To determine spending by income segment, we once again relied on estimates of income distribution by households from C-GIDD. Here we use a much more detailed segmentation than the one described earlier in order to estimate total spending by each income bracket; we looked at 18 income segment brackets to understand total consumption spending by income bracket. This analysis was based on the top 15 consuming markets in Africa, constituting around 90 percent of total African household consumption in 2015.
As we outlined above when discussing each country, we assumed that the total income of each income bracket was the product of the midpoint of the income bracket multiplied by the number of households in that bracket. We then aggregated the 18 income segments into the four broad categories of “basic needs,” “emerging consumers,” “global consumers,” and “affluent” households by adding the consumption of the 18 subsegments we had analyzed in detail.
Due to a lack of reliable data about household savings and private tax levels, we assumed that the total income by segment was equal to total consumption. This is fairly accurate for the lower income levels, but is less accurate for households earning above $20,000. Based on this analysis, we were able to prepare estimates of how consumption growth will be split by household income segments.
1 Daniel Boniecki et al., Telecommunications industry at cliff’s edge: Time for bold decisions, McKinsey & Company, 2016.

14 McKinsey Global Institute Technical appendix
For each market, we calculated what proportion of total spending each income bracket was responsible for. We then applied these shares to the consensus forecasts of household consumption for each country to determine actual spending by income segment, and each income segment’s share of growth and compound annual growth rate.
Urban consumptionWe obtained data on cities from MGI’s proprietary Cityscope database v3.0, which enabled us to compare consumption at a national level with consumption in a few of Africa’s largest cities, defined as having a population of more than one million people.
Consumer surveyThe consumer survey was run on an SMS-based or mobile-based platform in six African countries: Ethiopia, Ghana, Kenya, Morocco, Nigeria, and South Africa. The survey contained 22 questions on the sentiment and consumption behavior of African consumers. It focused exclusively on urban areas, surveying a total of 4,600 consumers (Exhibit A5). Each country had a minimum of 500 respondents. We analyzed results for each country, and then aggregated to provide an overall perspective on Africa. We surveyed the four income segments discussed in our growth analysis. The results at an income segment level depended on the ability to sample the highest income levels (with more than $20,000 annual income). Because of challenges in sampling this segment in Ethiopia and Kenya, we combined data to provide an East African perspective.

15McKinsey Global Institute Lions on the move II: realizing the potential of Africa’s economies: Technical Appendix
Exhibit A5
SOURCE: McKinsey African Consumer Survey 2016; McKinsey Global Institute analysis
3321
42
44
4138
3234
18
23
4354 51 45 40
16 178
25–34
15–24
35+
5140 42 47 50
4960 67
58 53 50
33Female
Male
50 42 50
7154
76
2222
19
16
24
141717
1711
1119 14 119 7
4
<$5,000
$5,000–10,000
>$20,000
$10,000–20,000
3
Sample size
Age
Gender
Income group
1,248 870 709 728 542
KenyaGhanaNigeriaSouth Africa Morocco Ethiopia
508
NOTE: All countries targeted major cities only. Numbers may not sum due to rounding.
Demographics of respondents to McKinsey African Consumer Survey 2016
%
16 McKinsey Global Institute Technical appendix
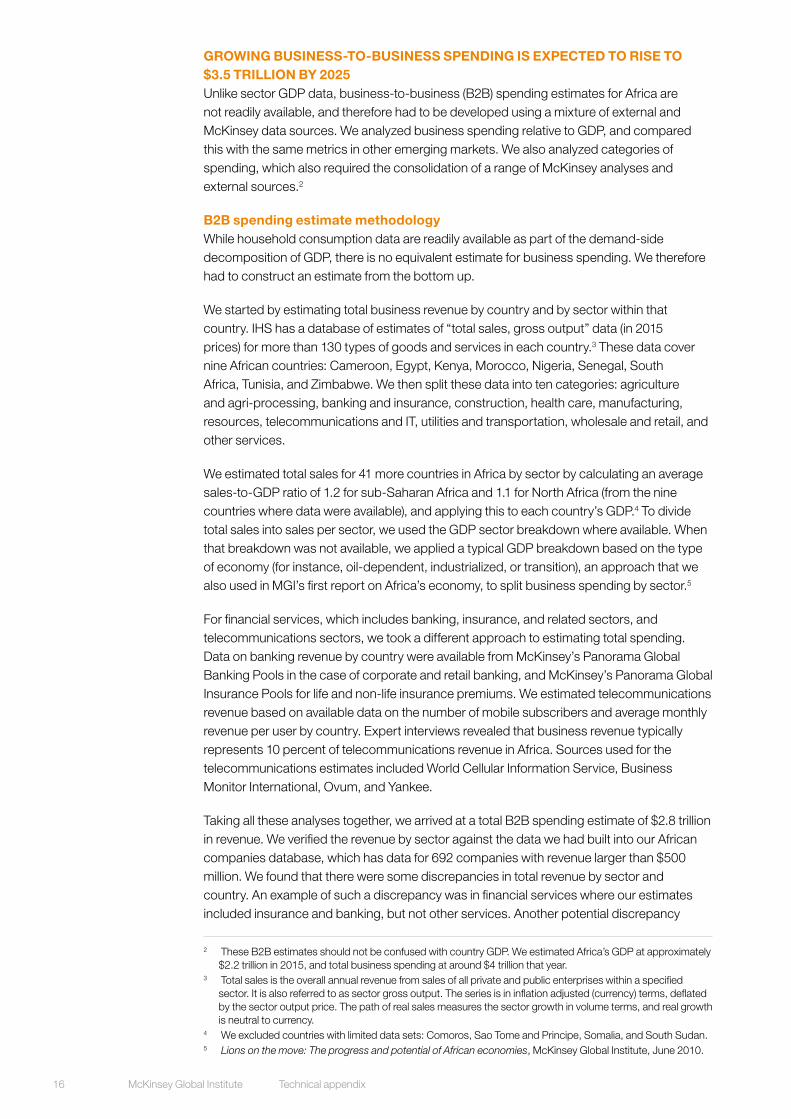
GROWING BUSINESS-TO-BUSINESS SPENDING IS EXPECTED TO RISE TO $3.5 TRILLION BY 2025Unlike sector GDP data, business-to-business (B2B) spending estimates for Africa are not readily available, and therefore had to be developed using a mixture of external and McKinsey data sources. We analyzed business spending relative to GDP, and compared this with the same metrics in other emerging markets. We also analyzed categories of spending, which also required the consolidation of a range of McKinsey analyses and external sources.2
B2B spending estimate methodologyWhile household consumption data are readily available as part of the demand-side decomposition of GDP, there is no equivalent estimate for business spending. We therefore had to construct an estimate from the bottom up.
We started by estimating total business revenue by country and by sector within that country. IHS has a database of estimates of “total sales, gross output” data (in 2015 prices) for more than 130 types of goods and services in each country.3 These data cover nine African countries: Cameroon, Egypt, Kenya, Morocco, Nigeria, Senegal, South Africa, Tunisia, and Zimbabwe. We then split these data into ten categories: agriculture and agri-processing, banking and insurance, construction, health care, manufacturing, resources, telecommunications and IT, utilities and transportation, wholesale and retail, and other services.
We estimated total sales for 41 more countries in Africa by sector by calculating an average sales-to-GDP ratio of 1.2 for sub-Saharan Africa and 1.1 for North Africa (from the nine countries where data were available), and applying this to each country’s GDP.4 To divide total sales into sales per sector, we used the GDP sector breakdown where available. When that breakdown was not available, we applied a typical GDP breakdown based on the type of economy (for instance, oil-dependent, industrialized, or transition), an approach that we also used in MGI’s first report on Africa’s economy, to split business spending by sector.5
For financial services, which includes banking, insurance, and related sectors, and telecommunications sectors, we took a different approach to estimating total spending. Data on banking revenue by country were available from McKinsey’s Panorama Global Banking Pools in the case of corporate and retail banking, and McKinsey’s Panorama Global Insurance Pools for life and non-life insurance premiums. We estimated telecommunications revenue based on available data on the number of mobile subscribers and average monthly revenue per user by country. Expert interviews revealed that business revenue typically represents 10 percent of telecommunications revenue in Africa. Sources used for the telecommunications estimates included World Cellular Information Service, Business Monitor International, Ovum, and Yankee.
Taking all these analyses together, we arrived at a total B2B spending estimate of $2.8 trillion in revenue. We verified the revenue by sector against the data we had built into our African companies database, which has data for 692 companies with revenue larger than $500 million. We found that there were some discrepancies in total revenue by sector and country. An example of such a discrepancy was in financial services where our estimates included insurance and banking, but not other services. Another potential discrepancy
2 These B2B estimates should not be confused with country GDP. We estimated Africa’s GDP at approximately $2.2 trillion in 2015, and total business spending at around $4 trillion that year.
3 Total sales is the overall annual revenue from sales of all private and public enterprises within a specified sector. It is also referred to as sector gross output. The series is in inflation adjusted (currency) terms, deflated by the sector output price. The path of real sales measures the sector growth in volume terms, and real growth is neutral to currency.
4 We excluded countries with limited data sets: Comoros, Sao Tome and Principe, Somalia, and South Sudan.5 Lions on the move: The progress and potential of African economies, McKinsey Global Institute, June 2010.

17McKinsey Global Institute Lions on the move II: realizing the potential of Africa’s economies: Technical Appendix
that we identified was in the case of revenue earned from exports of goods and services. We corrected when the revenue data in the MGI African companies database exceeded our estimates for a particular sector in a particular country. Together, these corrections totaled $0.4 trillion. Overall, we estimated that companies (of all sizes) in Africa earned combined revenue of $3.2 trillion in 2015 (Exhibit A6). The total revenue from the 692 large companies came to $1.4 trillion in 2015, meaning that $1.8 trillion in revenue came from smaller companies.
From the estimate of total revenue, we then calculated the total spending by African businesses. We estimated the share of spending on staff, materials, and services, with the remaining amount approximating earnings before interest, taxes, depreciation, and amortization (EBITDA) of about 13 percent of revenue (Exhibit A7). We estimated staff costs as share of revenue by sector, which ranged from 11 percent of revenue in wholesale and retail to 36 percent in construction. We then applied to total revenue for each country by sector (with an average of 19 percent of total company revenue). We averaged these staff costs as a percentage of revenue from data of African companies (from the Capital IQ database) on staff costs by sector (Exhibit A8 lists the components included in staff costs, as well as the number of companies in each sector where these data were available). We then put the remainder of company spending into two groups: (1) materials (both direct cost of goods and indirect materials) and (2) services. For each sector we identified average levels of spending by companies by taking the total sales for each sector (from IHS data), removing
Exhibit A6
SOURCE: MGI African companies database; CIQ database; IHS; UNCTAD; UN services and trade imports; World Cellular Information Service; Business Monitor International; Ovum; Yankee; McKinsey Purchasing and Supply Management Practice; McKinsey Basic Materials Institute; McKinsey Oil and Gas Practice; McKinsey Global Banking Pools; McKinsey Global Institute analysis
Methodology for determining the size of sales from African companies
2.8
1.4
3.2
0.3
1.8
Sales from large companies (revenue >$500 million)
Sales from smaller companies (revenue <$500 million)
Adjustment for additional sales from large companies
IHS sales
Sales from African companies
Source: MGI African companies database
Calculated as residual
IHS real total sales, gross output1for nine countries, extrapolated to all African countries using an assumed sales-to-GDP ratio
Includes revenue from African companies that exceeds local sales
1 Total sales is the overall annual revenue from sales of all private and public enterprises within the specified sector. It is also referred to as sector gross output. The series is in inflation adjusted (currency) terms, deflated by the sector output price. Real sales path measures the sector growth in volume terms, and real growth is neutral to currency.
$ trillion

18 McKinsey Global Institute Technical appendix
the EBITDA margin and salaries by sector (using the Capital IQ database) to determine spending less salaries and EBITDA margin, and then allocating spending to materials or to services. We estimated the share of these groups by sector using data sourced from the Capital IQ database and from McKinsey’s proprietary procurement benchmarks by sector obtained from the McKinsey Purchasing and Supply Management Practice, the McKinsey BMI Practice, and the McKinsey Oil and Gas Practice.
We estimated capital goods spending separately, again using benchmarked data from the Capital IQ database and McKinsey procurement benchmarks by sector. Capital items are typically funded outside company revenue flows, and we therefore estimated them in addition to spending on materials and services, and did not reflect on EBITDA. We applied these estimates to business revenue estimates (by country and by sector) for 2015 and 2025 in order to estimate spending on materials, services, and capital goods for these two periods.
Exhibit A7
SOURCE: MGI African companies database; CIQ database; IHS; UNCTAD; UN services and trade imports; World Cellular Information Service; Business Monitor International; Ovum; Yankee; McKinsey Purchasing and Supply Management Practice; McKinsey Basic Materials Practice; McKinsey Oil and Gas Practice; McKinsey Global Banking Pools; McKinsey Global Institute analysis
African total company spending excluding salaries and EBITDA is 68 percent of revenue
2,145
3,165
Revenue, 2015
Total staff costs
590
EBITDA, 2015
430
Total operating expense and cost of goods sold
Services costs
415
2,145
Total spend, 2015
2,560
720
Materials costs
Total operating expense and cost of goods sold
1,425
Capital goodsspent
Share of revenue%
100 13 19 234568 13 8168
1 EBITDA = earnings before interest, taxation, depreciation, and amortization.
Total for all African companies$ billion

19McKinsey Global Institute Lions on the move II: realizing the potential of Africa’s economies: Technical Appendix
B2B spending growth methodologyTo understand how spending was likely to evolve by country and sector, we estimated 2025 business spending levels. Much of the methodology is the same as we have discussed. We estimated total business revenue in 2025 and applied the same staff, materials, services, and capital goods costs. IHS provides estimates of 2025 sales levels for the nine countries already listed. For financial services, the McKinsey Panorama Global Banking Pools and McKinsey Panorama Global Insurance Pools provided growth estimates from 2015 to 2020. We extrapolated those growth estimates using the ratio in GDP growth from 2020 to 2025 vs. 2015 to 2020. In the case of telecommunications, we used previous McKinsey research that found that mature markets would grow at a rate of zero to 2 percent per year, and growth markets would grow between 5 and 8 percent per year.6 Taking the average of these ranges, we treated countries with less than $3,000 in per capita GDP (in 2014) as growth markets. Markets in Africa cannot really be described as mature, and therefore we treated countries with greater than $3,000 in per capita GDP as a mix between the two growth rates, with the average weighted between the share of rural population (growth market) and the share of urban population (mature market).
For the other 41 countries, each sector’s growth rate was scaled to that country’s GDP growth rate, having established a trend between GDP growth and B2B spending (see next discussion). We developed that scaling for two groups: North African countries and
6 Daniel Boniecki et al., Telecommunications industry at cliff’s edge: Time for bold decisions, McKinsey & Company, 2016.
Exhibit A8
SOURCE: Capital IQ; company annual financial statements; McKinsey Global Institute analysis
Staff costs account for 19 percent of revenue, according to a large sample of African companies
11
12
12
16
16
20
24
30
35
36
Resources
Agriculture and agri-processing
Utilities and transport
Manufacturing
Wholesale and retail
Other services
Health care
Banking and insurance
Construction
Telecommunications and IT
Staff costs1 as % of revenue for African companies%
1 Includes stock-based compensation marketing, stock-based compensation, G&A, employee salaries and other benefits, salaries and employee benefit, salaries, wages and benefits, other personnel costs, employee compensation, incentives, benefits, personnel expense, pension and other employee benefits, pension and benefits, salaries and fringe benefits, compensation and benefits, compensation, payroll taxes, benefits, human resources, incentive compensation and employee benefits, profit sharing, pension and other benefits, and staff expense.
3
13
4
33
6
23
8
20
6
16
Sample size

20 McKinsey Global Institute Technical appendix
sub-Saharan African countries. For each group, we derived a scaling factor for each of the eight sectors (excluding financial services and telecommunications). We based these factors on available data for each sector from the nine countries already mentioned. For instance, for Cameroon, Kenya, Nigeria, Senegal, South Africa, and Zimbabwe, we forecast the resources sector to grow at 67 percent of the GDP growth rate from 2015 to 2025, and then applied this factor to other sub-Saharan countries. From these factors, we calculated growth rates for each sector in each country. This allowed us to estimate revenue in 2025, from which we estimated B2B spending as already described.
B2B spending as a share of GDP compared with other marketsAfrican consumer and business spending totaled $4 trillion in 2015. B2B spending was approximately 65 percent of spending, down from 69 percent of spending in 1995. The compound annual growth rate of B2B spending as a proportion of the same growth rate for GDP was 0.72 from 1995 to 2005 and 0.66 from 2005 to 2015. This shows that business spending growth has been fairly consistent over time. Our estimates of B2B spending growth of 3.3 percent from 2015 to 2025 vs. GDP growth of approximately 4 percent for the region means that this ratio increases slightly to 0.83 percent, reflecting a small acceleration in business spending growth, but still broadly within the range measured. B2B spending shows slower growth than consumer spending in proportion to GDP. Consumer spending growth relative to GDP growth from 1995 to 2005 is estimated at 0.93, and 0.87 from 2005 to 2015. At the 3.8 percent average growth estimated for Africa from 2015 to 2025, this ratio increases slightly to 0.95 (Exhibit A9).
We find fairly similar trends in India and Brazil. In India, B2B spending averaged 72 percent of total spending from 1995 to 2015. In Brazil, B2B spending declined from 72 percent of spending in 1995 to 65 percent in 2015. In contrast, China has experienced an increase in the B2B share of total spending from 81 percent in 1995 to 88 percent in 2015. In India, the B2B growth rate relative to the GDP growth rate declined from 1.19 from 1995 to 2005, to 0.86 from 2005 to 2015. In Brazil, the same metric declined from 0.99 from 1995 to 2005, to 0.27 from 2005 to 2015, while in China it declined from 1.59 from 1995 to 2005, to 1.04 from 2005 to 2015, reflecting slowing business spending growth in both countries in more recent times. Africa’s B2B share of spending and B2B growth relative to GDP growth is at the lower end compared with other emerging markets, but still within the range observed.

21McKinsey Global Institute Lions on the move II: realizing the potential of Africa’s economies: Technical Appendix
Exhibit A9
SOURCE: IHS; World Bank; National Bureau of Statistics; McKinsey Global Institute analysis
African B2B growth has historically been 0.7 times GDP but could accelerate to 0.9 times GDP
China
India
Brazil
Africa1
2005–2015
Compound annual growth rate as a portion of GDP growthMultiple of x
Malaysia
1 Includes Cameroon, Egypt, Kenya, Morocco, Nigeria, Senegal, and South Africa.
9.0
10.2
6.9
11.4
7.1
6.4
5.3
6.2
3.7
0.9
2.4
2.1
1995–2005
6.8
4.2
4.9
3.0
0.91.0 1.0
1.6
B2BB2C
0.91.00.9
1.2
1.11.1
0.3
1.0
0.90.9
0.60.6
0.950.870.93 0.830.660.72
2015–2025
4.1
3.1
4.5
3.5
3.8
3.3
Compound annual growth rate%
2005–20151995–2005 2015–2025

22 McKinsey Global Institute Technical appendix
2005, 2015, and 2025 for specific goods such as cement, fabricated metals, and business services, we were able to analyze historical growth rates and potential future growth rates. For instance, business services and construction services grew at about 5.4 percent and 7 percent, respectively, from 2005 to 2015 according to the database, and looked set to slow to 2.4 percent and 3.5 percent, respectively, from 2015 to 2025. Estimates for spending on business telecommunications and corporate banking were our own using methods already discussed.
Share of larger and smaller companiesIn Chapter 4 of our report, we explained how we developed the MGI African companies database. Combining the information from that database, which contains total revenue earned by sector in each country for companies larger than $500 million, with our analysis of total revenue by sector gave us the share of total revenue earned by these large companies. The cost factors discussed earlier were not based on a particular scale of company, and we therefore applied the same factors to companies of different size. Therefore the share of spending of companies larger than $500 million is the same as the share of revenue.
B2B spending categoriesTo understand in some detail how B2B spending has been allocated, we looked in more depth at the more than 130 categories of goods and services estimated in the IHS database of “total sales, gross output” data (in 2015 prices) in Cameroon, Egypt, Kenya, Morocco, Nigeria, Senegal, South Africa, Tunisia, and Zimbabwe. Using IHS estimates of sales in

23McKinsey Global Institute Lions on the move II: realizing the potential of Africa’s economies: Technical Appendix
3. UNLEASHING AN AFRICAN INDUSTRIAL REVOLUTIONThis chapter outlines the methodology used to estimate Africa’s manufacturing opportunity that could almost double output from $500 billion in 2015 to $930 billion in 2025.
ESTIMATING AFRICA’S MANUFACTURING OUTPUTCategorization of types of manufactured goodsManufacturing consists of a wide range of activities (Exhibit A10). MGI puts manufactured goods into five categories based on their specific traits: regional processing, global innovation for local markets, resource-intensive, labor-intensive tradables, and global technologies. Throughout our analyses in this chapter we used trade data from UNCTAD and WITS-UN Comtrade, and manufacturing output data from IHS World Industry Service.
Estimating manufacturing outputEstimates of total African manufacturing output are not readily available. We developed our own estimate by scaling up data of total output of manufactured goods from the IHS World Industry Service database for the nine African countries where data were available (Cameroon, Egypt, Kenya, Morocco, Nigeria, Senegal, South Africa, Tunisia, and Zimbabwe) to the entire continent. The database estimates “total sales” or manufacturing sector gross output in 2015 prices (removing the impact of currency fluctuations). For scaling up, we used a factor of 1.31, which implies that the nine countries generate approximately three-quarters of the continent’s manufacturing output. We chose this factor based on the share of manufacturing value added that these nine countries contribute to total manufacturing value added in Africa—a share of 83 percent. Manufacturing value-added data for all countries were not available. However, we did find data for 23 countries generating 93 percent of total African GDP. By correcting for share of manufacturing value added, and then share of GDP, we arrived at the factor of 1.31.
We sourced GDP data in real prices from the IMF World economic outlook, April 2016, and data on manufacturing value added (in real prices) from several sources, namely national statistical agencies in a number of countries; Lars Christian Moller, Ethiopia’s great run: The growth acceleration and how to pace it, World Bank working paper number 99399, November 2015; and the United Nations statistics division.
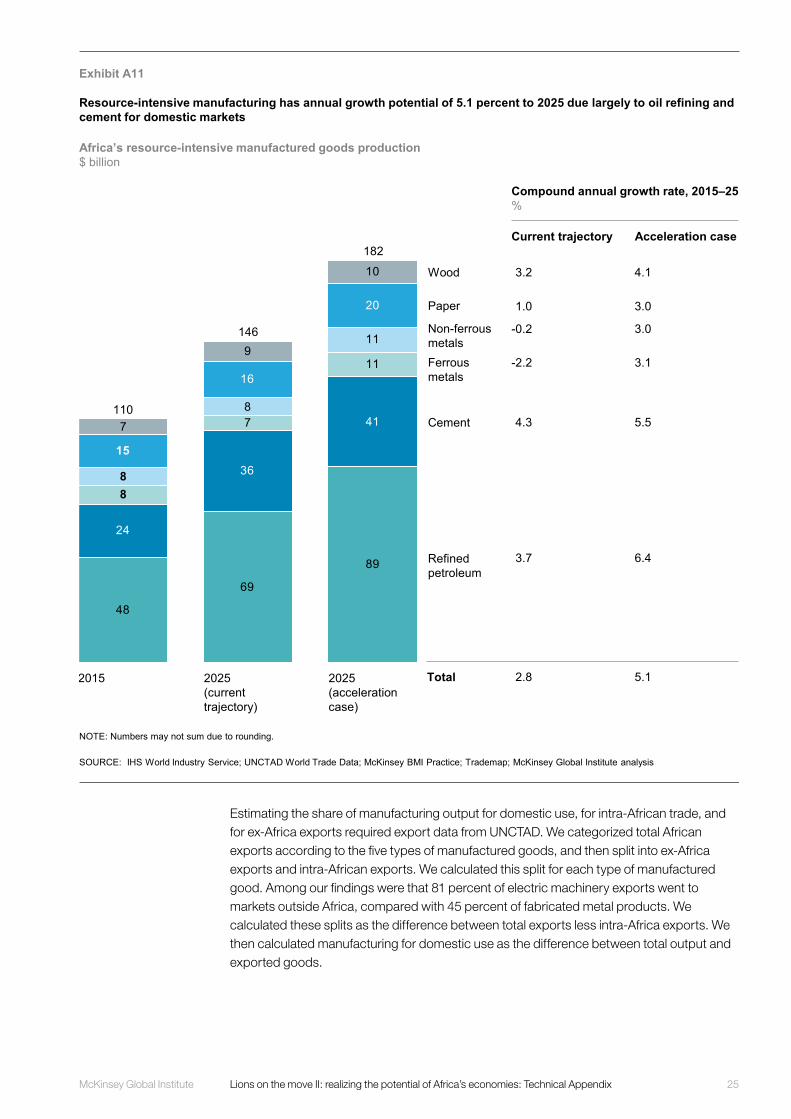
We followed this methodology for all types of manufacturing except resource-intensive goods, for which we developed our analysis from a number of different sources (Exhibit A11). Processed oil and gas products output was estimated by the relevant McKinsey practice and our McKinsey’s Energy Insights group. We based processed minerals on IHS estimates, scaled up by 1.31 as described. We modeled ferrous metal products on iron and steel, and ferrochrome, from estimates developed by McKinsey’s Basic Materials Institute using data from Trademap, the practice’s proprietary supply models, and Consensus Economics. We modeled non-ferrous metal products based on refined copper, again using data from Trademap, models developed by the McKinsey’s Basic Materials Practice, and Consensus Economics. We also estimated other resources such as paper and pulp products, and wood (based on IHS data and McKinsey input). Many of these estimates were highly sensitive to resource price fluctuations. Average price data for the relevant year, 2015, were used.

24 McKinsey Global Institute Technical appendix
Exhibit A10
SOURCE: IHS World Industry Service; UN GDP data; McKinsey Global Institute analysis
Regional processing and global innovation are Africa’s largest categories of manufacturing
African revenue from manufactured goods in 20151
$ billion, 2015 real; %
1 Regional processing includes agri-processing, beverages, fabricated metals, and other industries that locate close to demand and sources of raw materials. Global innovations for local markets includes chemicals, automotive, machinery, and other industries that are R&D-intensive, with production close to demand. Resource-intensive includes energy and resource-intensive processing of commodities such as refined oil, cement, and basic metals. Labor-intensive tradables includes apparel, footwear, textiles, and other goods that are highly tradable and require low-cost labor. Global technologies includes computers, communications devices, and other high-R&D, high-value-density products.
Machinery
Transportation
23
2
Automotive
32
42
Chemicals
Minerals
15
20
Metals22
Other43
Refined petroleum
Other21
Beverages14
Fabricatedmetal 51
14
Food
12
23
Footwear
TextilesOther
23
Apparel
43
Medical, precision,and optical instruments
Communications equipment
3
17
Computers
80
Regional processing Global innovation for local markets
Resource intensive Labor-intensive tradables
Global technologies
$188 $137
$110 $55
$10
25McKinsey Global Institute Lions on the move II: realizing the potential of Africa’s economies: Technical Appendix
Estimating the share of manufacturing output for domestic use, for intra-African trade, and for ex-Africa exports required export data from UNCTAD. We categorized total African exports according to the five types of manufactured goods, and then split into ex-Africa exports and intra-African exports. We calculated this split for each type of manufactured good. Among our findings were that 81 percent of electric machinery exports went to markets outside Africa, compared with 45 percent of fabricated metal products. We calculated these splits as the difference between total exports less intra-Africa exports. We then calculated manufacturing for domestic use as the difference between total output and exported goods.
Exhibit A11
SOURCE: IHS World Industry Service; UNCTAD World Trade Data; McKinsey BMI Practice; Trademap; McKinsey Global Institute analysis
48
69
24
36
16
20
7
9
89
41
11
7
8
11
8
8
15
10182
2025 (acceleration case)
2025 (current trajectory)
146
Ferrous metals
Paper
Non-ferrous metals
Wood
110
Refined petroleum
2015
Cement
Compound annual growth rate, 2015–25%
3.2
1.0
-0.2
-2.2
4.3
3.7
2.8
4.1
3.0
3.0
3.1
5.5
6.4
5.1
Current trajectory Acceleration case
Resource-intensive manufacturing has annual growth potential of 5.1 percent to 2025 due largely to oil refining and cement for domestic markets
Africa’s resource-intensive manufactured goods production$ billion
Total
NOTE: Numbers may not sum due to rounding.

26 McKinsey Global Institute Technical appendix
UNDERSTANDING AFRICAN MANUFACTURED GOODS TRADEAnalysis of Africa’s export trajectoryWe based estimates of Africa’s share of global manufacturing exports on nominal trade data from UNCTAD between 2000 and 2014. We estimated Africa’s share of total global trade over time and compared it with important manufacturing countries such as China, Germany, and Vietnam. Africa’s share of manufactured exports increased from 1.1 to 1.4 percent from 2000 to 2014, while China’s increased from 4.5 to 15 percent over that period. We also analyzed exports by category of manufactured good, both by absolute quantity of exports and by share of global exports in that category. While exports of all categories of goods grew from 2004 to 2014, only global technologies and global innovation for local markets increased their share of global exports, while the share of global exports of regional processing goods remained flat.
ESTIMATING AFRICA’S MANUFACTURING GROWTH POTENTIALTo understand the scale of Africa’s manufacturing opportunity, we estimated potential growth based on an extrapolation of its current growth trajectory and on an acceleration case.
Estimating African-produced share of goods consumptionAfrica imports a significant share of goods that could be produced within the continent. We estimated the total consumption of each type of good within the continent. To estimate this consumption of goods, we started with data from IHS (apparent consumption data) for all manufactured goods in the nine countries that we have noted in 2015 prices, which totaled approximately $530 billion in 2015.
We estimated total consumption for all of Africa using a different methodology. We used our earlier estimate of total African output of $500 billion in 2015, and then subtracted the ex-Africa exports of these goods in 2015 (from UNCTAD), and added the imports of these goods from outside Africa in 2015 (also from UNCTAD). These data were available for all countries and we were therefore able to estimate total African consumption in 2015 of about $800 billion in manufactured goods. Ex-Africa exports were about 13 percent of this total (we did not remove intra-African exports as we assume these are consumed on the continent) at $102 billion while imports were about half of the $800 billion; the balance was produced domestically. After categorizing these data, we estimated about $280 billion in consumption of global innovation, $260 billion in consumption of regional processing, and about $77 billion in consumption of labor-intensive goods.
Using these consumption data, we estimated the share of local supply and imported goods by category. For regional processing, we found that 66 percent of consumption was produced within Africa, or $175 billion of $260 billion in consumption (excluding what is exported). In the case of global innovation, we found that 39 percent of consumption was produced within Africa, or $108 billion of $280 billion in consumption (again excluding what is exported). For labor-intensive tradables, 55 percent of consumption of $77 billion was produced in Africa: $42 billion.
We completed a similar analysis for the regional progressing, global innovation, and labor-intensive tradables manufacturing categories in two other regions: Association of Southeast Asian Nations (ASEAN) and Mercosur. ASEAN includes Brunei, Cambodia, Indonesia, Laos, Malaysia, Myanmar, Philippines, Singapore, Thailand, and Vietnam. Of these members, we found data for Indonesia, Malaysia, Philippines, Singapore, Thailand, and Vietnam. Mercosur includes Argentina, Brazil, Paraguay, Uruguay, and Venezuela. Of these, we found data for all except Paraguay. We chose these two regions because each is an effective and large emerging-market regional trading group.

27McKinsey Global Institute Lions on the move II: realizing the potential of Africa’s economies: Technical Appendix
The share of total consumption produced in each region was calculated by summing the gross output (IHS measure for total production of manufactured goods) of each region and dividing this by the total consumption of those goods in that region (this time using IHS apparent consumption data). This ratio gave the share of regionally produced goods in each category. We made adjustments to each of these figures. We scaled both the consumption and output numbers by GDP to compensate for the countries where data were not available. For ASEAN, Brunei, Cambodia, Laos, and Myanmar together added another 5 percent to consumption and to output. In Mercosur, Paraguay added 1 percent to consumption and to output. A final correction removed exports to countries outside of each region from that region’s total gross output in order to confine our analysis to output of the countries within each of the regions analyzed. By way of comparison, 25 percent of ASEAN’s regional processing goods were exported outside the region in 2014, while 14 percent of Mercosur’s regional processing goods were exported outside the region in 2014. The export data were from UNCTAD. All data used were in 2015 US dollar prices.
For resource-intensive manufacturing, we used cement as the only example. Cement is a good that is typically not traded globally because the cost of transportation can be prohibitive. Interviews with McKinsey specialists indicated that globally traded cement constitutes less than 5 percent of global demand. Our own analysis found similar results. Our analysis was based on volume (in million metric tonnes) rather than value (in US dollars) because volume data were readily available, while reliable data on cement prices were patchy. We estimated the volume of cement imported into Africa from countries outside the continent at 33 million metric tonnes in 2013 and 32 million metric tonnes in 2014 (using WITS-UN Comtrade data on 51 African countries), while we estimated total consumption at 212 million metric tonnes in 2013 and 228 million metric tonnes in 2014 (from International Cement Review, which has data for 53 African countries). We calculated consumption as the sum of total imports into Africa plus total production from African countries, less exports out of Africa. We found that imported cement from outside Africa accounted for about 15 percent of consumption. For ASEAN and Mercosur, we followed the same approach, making use of the same data sources. Mercosur imported 4 percent of its cement by volume from outside the region, while ASEAN imported 5 percent of its cement by volume from outside the region; both values are very close to the global average mentioned in interviews. We took estimates of the total value of cement consumption from IHS.
Growth potential in regional processing goodsWe estimated the growth potential of each category of manufactured good. Regional processing goods included beverages, fabricated metals, food, plastics, printing and publishing, rubber, tobacco, and waste treatment. Having already estimated total African consumption in 2015 of about $800 billion in manufactured goods, we estimated total consumption in 2025 by using compound annual growth rates ranging from, for example, 3.2 percent for food to 3.9 percent for plastics. We based these growth rates on a range of data sources to estimate consumer and B2B spending growth. We arrived at an estimate of consumption of about $1.17 trillion in 2025 for all manufactured goods, of which consumption of regional processing goods came to $370 billion.
We have also already described how we estimated the African-produced share of consumption for regional processing at 66 percent. That figure is an aggregation (using the same analysis) of consumption of each type of regional processing goods (beverages, plastics, and so forth). We based our extrapolation of the current trajectory to 2025 on maintaining that same proportion of African production as a share of total African consumption for each type of good. For the acceleration case, we assumed that Africa produced a higher share of its regional processing goods, increasing from 66 percent of consumption to 80 percent of African consumption by 2025. We chose the figure of 80 percent because it fell within the range that ASEAN and Mercosur were able to achieve

28 McKinsey Global Institute Technical appendix
in supplying their own shares of consumption, at 79 percent and 89 percent, respectively. Therefore, if African countries maintain their share of consumption at the 2015 level, they can increase output by $53 billion. If they can raise their overall share of output to 80 percent of consumption by 2025, they can increase output by $122 billion (on a base output of $188 billion in regional processing goods in 2015). Africa’s exports outside of Africa were only 7 percent of total output in 2015. Because this is a small share of total output, we did not estimate growth in regional processing goods exported from Africa. Regional processing has a low trade intensity (at 5 to 20 percent of exports divided by gross output on a global level), which means that this is largely a regional and local market opportunity, albeit one significant in scale.
Growth potential in global innovation for local marketsFor this category of goods, we assessed potential manufacturing growth from meeting consumption growth in Africa and consumption growth in Africa’s export markets. The global innovation for local markets category includes automotive, chemicals, electrical machinery, other machinery, and transportation equipment. We first established that global innovation goods of $137 billion were produced by African countries in 2015, and then that approximately $108 billion were produced for the African market and $29 billion for the ex-Africa export market (using UNCTAD data). The global innovation category has a medium trade intensity (at 40 to 50 percent of exports divided by gross output on a global level), which means about half the output of these goods is destined for local or regional markets and half for global markets. This is why we looked at both.
We used a similar methodology for estimating the growth potential by meeting greater African demand as we used for regional processing goods. We estimated the share of African consumption that was met by African production in 2015, and then assumed that this share remained the same in 2025. We estimated that consumption of global innovation goods would grow to about $400 billion in 2025, using the same methodology as for regional processing goods. We had estimated Africa’s share of African consumption as 39 percent (again, this figure is an aggregation of that same analysis for each of the types of global innovation goods) and applied this to extrapolate Africa’s current trajectory to 2025. For the acceleration case, we set a target for Africa to increase its share of production of global innovation goods from 39 percent of African consumption to 60 percent by 2025. We again reviewed the range set between ASEAN and Mercosur, but this time opted to set the target closer to Mercosur’s 63 percent. We take the view that Mercosur is a better reference point in this case. While both ASEAN and Mercosur are in emerging markets, ASEAN does not include China, a significant regional producer of global innovation goods in Asia. ASEAN’s manufactured share of consumption, at 34 percent, would therefore not be representative.
If African countries maintained their share of consumption at the 2015 level, they could increase their output by $28 billion. If they were to raise their overall share of output to 60 percent of consumption by 2025, they could increase output by $134 billion (from a base output of $108 billion in global innovation goods for African markets in 2015).
We sized the export opportunity in a different way. We analyzed Africa’s exports using UNCTAD data to identify total global innovation exports to each country outside Africa. We used IHS data of apparent consumption to estimate the total consumption in each of these markets. We used both data sources to arrive at our estimate. As one example, African manufactured goods had a 2.3 percent market share of global innovation consumption in France in 2014. We then studied the ten largest markets for African exports in more detail. Starting with the largest, these were France, Germany, the United States, Spain, Belgium, the United Kingdom, India, Brazil, Italy, and the Netherlands. Seven of the ten are in Europe, and two are emerging economies (Turkey is Africa’s 11th-largest export market and China its 14th-largest). These ten markets imported $19 billion of African global innovation goods

29McKinsey Global Institute Lions on the move II: realizing the potential of Africa’s economies: Technical Appendix
in 2014. The next step we took was to estimate the consumption of these ten markets in 2025, using an IHS estimate of apparent consumption in 2025. We then sought to find out how much of this potential consumption could be covered by African exports. Africa’s top quartile market share for these ten countries is 2.2 percent, and includes France, Spain, Belgium, and the Netherlands (Exhibit A12). If exports to the other seven countries could rise to this top-quartile share, Africa’s exports of global innovation goods to these ten markets could increase from $19 billion in 2015 to $92 billion in 2025. If we assume that Africa’s share of consumption exports to all other countries remains constant, then there is potential to increase global innovation exports to all of Africa’s current export markets from $29 billion to $104 billion in 2025, an increase of $75 billion. The largest potential lies in the US market, and the African Growth and Opportunity Act (AGOA) trade arrangements could assist those countries in sub-Saharan Africa that qualify. North African countries could benefit from their geographic proximity to Europe. The manufacturing output growth acceleration case is based on this higher market share, while the extrapolation of current trajectory growth case assumed that all countries maintained their existing share of consumption in all of Africa’s export markets. The current trajectory case assumes that exports increase from $29 billion to only $37 billion by 2025, a rise of about $8 billion.
Exhibit A12
SOURCE: UNCTAD World Trade Data; IHS; McKinsey Global Institute analysis
Global innovations is an annual export growth opportunity of ~17 percent to 2025 if market share rises to 2.2 percent in Africa’s top ten export markets
2.7
4.6France
3.0Germany
Spain 2.0
United States
1.0
Italy
India 1.2
1.3
Belgium 1.3
Netherlands
Brazil
0.8
United Kingdom
1.0
Sales to top ten export markets$ billion
2.2
0.9
0.2
0.2
0.8
4.0
3.2
0.3
0.7
2.3
Global innovations for local markets exports by destination—acceleration case
Market share%
0.9
2.7
13.2
4.5
1.5
2.6
29.0
21.3
11.0
5.4
2025 exportpotential—acceleration case$ billion
Total 19 Lift top 10 markets to 2.2% market share (top quartile) 92
Compoundannual growth rate, 2014–25, %
1.3
12.5
24.2
2.3
1.5
12.3
30.3
25.9
9.0
17.0
1.5
2014

30 McKinsey Global Institute Technical appendix
Growth potential in resource-intensive goodsWe calculated the growth potential for resource-intensive goods by category and looked at both domestic and ex-Africa export opportunities. We determined the potential in oil refining using a McKinsey Oil and Gas Practice proprietary database to calculate 2025 production if all probable, and highly probable, African refining development projects are completed by 2025 (resulting in an additional 983,000 barrels a day of capacity). We also assumed a slight increase in efficiency from 67 to 73 percent utilization at existing refineries in southern and northern Africa. We then produced a range that depended on the potential oil price. The lower range assumed that the current oil price was sustained. For the upper range, we used $70 a barrel, the midpoint of a number of potential scenarios that we discussed with the McKinsey Energy Insights group.
In the case of cement, we focused only on the growth opportunity from meeting domestic demand because production of cement is highly local, as we have noted.
We based our projections in metals (iron and steel, ferrochrome, and non-ferrous) on scenarios modeled by McKinsey’s Basic Materials Institute. Given the current slump in commodity markets, the lower opportunity estimate assumed that production remained at current levels. We prepared an upside case in which additional production capacity came online. We based this upside case on African countries building a new five million metric tonnes per year steel plant every four years, building a new 250 kilotonnes a year copper refinery every two years, and one 340 kilotonnes per year ferrochrome smelter every two years (these estimates came from the McKinsey’s Basic Materials Institute based on viable build times for new facilities). This gave real growth rates of about 4 percent, 3 percent, and 3 percent for iron and steel, non-ferrous metals, and ferrochrome, respectively. This upside case means production in the region grows at a rate that is comparable to the potential rate of growth in consumption.
We took paper and pulp base numbers from the IHS database with the lower bound of the opportunity being a growth rate of 0.1 percent for the industry (based on current McKinsey Paper and Pulp Practice forecasts). We also developed a more optimistic opportunity based on forecast production growth from IHS of 3 percent. In the case of wood, we used a similar approach and a growth rate of 3 to 4 percent. We used the IHS forecast of production growth for the lower bound and estimated the upper bound to match GDP growth of about 4 percent, reasoning that a strong link exists between demand for wood and economic development.
For each of these categories of goods (excluding cement), we divided the estimate into a domestic and an ex-Africa opportunity, employing a consistent methodology for all. Using IHS total output data and UNCTAD ex-Africa export data, we were able to determine the 2015 domestic/ex-Africa split of production. We then calculated the split over time using forecast Africa GDP growth vs. the rest of the world from data provided by McKinsey’s Basic Materials Institute.
Growth potential in labor-intensive tradablesFor labor-intensive tradables, we again estimated a domestic and regional production opportunity and an ex-Africa export opportunity. We prepared the domestic opportunity in the same manner as for regional processing and global innovation. First, we estimated African consumption in 2015 and 2025 and then the share of African consumption met by African production: 55 percent. We kept this share constant for the 2025 extrapolation, as it was already far higher than in ASEAN (24 percent) and the same as in Mercosur (55 percent). Labor-intensive tradables have a high global trade intensity of 50 to 70 percent, so meeting a higher level of domestic consumption may be unlikely. We estimated the incremental output that would meet domestic demand at $15 billion.

31McKinsey Global Institute Lions on the move II: realizing the potential of Africa’s economies: Technical Appendix
For the export opportunity we estimated three ways for African countries to increase their exports and categorized the top labor-intensive exporters accordingly: countries that can leverage low labor costs (e.g., Kenya, Madagascar, Nigeria, Ethiopia, and Tanzania); countries that can take advantage of proximity to Europe (Algeria, Egypt, Morocco, and Tunisia); and countries that have neither of these benefits but can still increase exports to the United States because of the advantages offered by AGOA (Mauritius and South Africa). For each of these groups we estimated a target growth rate. For countries with low labor costs, we set a growth target of 11 percent per year until 2025, which we based on the historical growth rate achieved by Bangladesh on its low cost labor exports from 2004 to 2014. Vietnam and China achieved growth rates of 10 percent and 12 percent, respectively, over this period, making this a reasonable benchmark. Many of these countries also qualify for AGOA, giving them a further advantage. Countries that are close to Europe could benefit from apparel trends such as fast fashion together with lower labor costs than Europe. We found that the average growth rate achieved by this group from 2004 to 2014 was 6 percent per year, and we maintained this growth rate for the group until 2025. Finally, for countries that cannot really be considered low-cost labor centers, such as Mauritius and South Africa, there is still the benefit that AGOA offers in access to the US market. For these countries, we assumed that output grows at 5 percent a year, the average labor-intensive export growth rate of AGOA countries from 2004 to 2014, which we took as a benchmark for what could be achieved. We then applied these different growth rates to the 2015 exports of these countries (2015 export data extrapolated from 2014 export data), to estimate the total export opportunity in our acceleration case. Growth in exports to 2025 was an average 6.8 percent for all of these countries, an incremental growth opportunity worth $12 billion.
We based the extrapolation of the current trajectory case for exports on increasing ex-Africa exports by 2.1 percent per year. We arrived at this figure by analyzing Africa’s global market share of labor-intensive imports in 2014. Keeping Africa’s 2014 market share constant to 2025 while global consumption of labor-intensive goods grows (according to IHS estimates) equates to 2.1 percent per year growth in exports, or $3 billion in additional exports.
Job creation potentialManufacturing has the potential to create stable jobs. This matters for a continent with a large, young workforce. While rising productivity and automation mean that the number of jobs created by manufacturing will diminish over time, there is still potential in the coming years to grow this industry, particularly as Africa finds itself with growing demand that can be met by local production.
To estimate the job creation potential of Africa’s manufacturing opportunity, we searched for employment multiplier data by country.7 Since manufacturing is a diverse sector, these multipliers vary significantly depending on the type of goods made. So we needed data that took account of the job creation potential of each of regional processing, global innovation, resource-intensive, and labor-intensive manufacturing separately, and then applied our multipliers to the revenue growth potential of each category of manufacturing. This gave us a range, the upper and lower bounds of which we set by extrapolating the current trajectory and the acceleration cases we have outlined.
We found employment multiplier data for Kenya, Morocco, Nigeria, and South Africa. However, only the South African data were detailed enough to estimate multipliers by subsector. We estimated these multipliers for each subsector as the ratio of output in 2014 to employed persons in that subsector in 2014 (output estimates sourced from IHS and employment numbers from Statistics South Africa’s quarterly labor force survey) to obtain a number for jobs per million dollars of output. We took the South African multiplier for
7 Employment multiplier represents the total change in number of jobs that occurs in all industries for each additional $1 million of output.

32 McKinsey Global Institute Technical appendix
MGI’s economics research team estimated job multipliers by sector for these countries using data from the Global Trade Analysis Project and the ILO. South Africa’s multiplier data by subsector was calculated using data from Organisation for Economic Co-operation and Development statistics, ILO labor statistics, and IHS for 2008 where available.
As most growth in global innovation and resource-intensive manufacturing is less labor intensive, and global innovation, in particular, would be driven by countries like Morocco and South Africa, we used the average of their multipliers to estimate jobs created for these two categories of goods. As regional processing and labor-intensive goods are relatively labor intensive, we used the average of relatively low-cost labor countries Kenya and Nigeria as the basis for the estimate of jobs created for these two categories.
OTHER ANALYSESOther analyses included estimating national labor costs and understanding unit costs of goods imported into Spain and the United States.
Estimating labor costsWe were able to estimate average labor cost data for Bangladesh, Brazil, China, Egypt, Ethiopia, Kenya, Morocco, Nigeria, South Africa, Tunisia, and Vietnam. We did so by dividing total national wages in dollars and benefits by the number of people employed to arrive at an average annual wage in dollars per person per year. These data extended from 1990 to 2014. The source was McKinsey’s Strategy & Trend Analysis Center (Global Growth Model), which uses proprietary calculations developed using data from World Bank World Development Indicators, the United Nations Systems of National Accounts, and the ILO.
Understanding AGOA’s impact on trade competitivenessTo understand the impact of AGOA on Africa’s export competitiveness, we sourced data from ITC Trademap (the ITC calculations are based on UN Comtrade statistics) for a category called women’s suits, jackets, dresses, skirts, and shorts (item code 6204).8 This database contains bilateral data on the total value of goods imported into a country and the volume in tonnes of those imported goods. These imported values are essentially the full cost of these imported items, and therefore give an indication of relative cost competitiveness. Similar categories of goods should have relatively similar unit costs (in dollars per tonne). Some variations in the fabric, style, and quality of these goods will inevitably mean that this simplifying assumption does not completely hold, but the results of this analysis align with findings shared by experts in interviews conducted by the team. Our analysis showed that for this category of good, African exporters to which AGOA applies had a consistent unit cost advantage when exporting to the United States compared with exporting to Spain.
8 In some cases the data used were a mirror of data measured by the trade partner rather than that of the African country’s own declared data.
each type of manufacturing and estimated the number of jobs created in the two cases (trajectory and acceleration). We then used the overall national manufacturing multipliers of Kenya, Morocco, and Nigeria to estimate correction factors to the South African–based multipliers. Kenya’s employment creation multipliers were 1.6 times South Africa’s on a PPP basis. Nigeria’s multipliers were 3.5 times South Africa’s, and Morocco’s were 0.7 times.

33McKinsey Global Institute Lions on the move II: realizing the potential of Africa’s economies: Technical Appendix
4. THE RISE OF CORPORATE AFRICAMGI has built a comprehensive database of large companies operating in Africa that we believe is the first of its kind. The aim is to understand corporate Africa’s business focus, growth patterns, and constraints.
BUILDING THE MGI AFRICAN COMPANIES DATABASEThe MGI African companies database was built up over about three months through a painstaking process of identifying companies active on the continent, searching for information on their revenue, profitability, age, regional footprint, sector of operations, and so on, and searching for historical data where available. We used a number of sources, including web searches for company financial statements, press releases, journal articles, and other databases (when available), including the MGI CompanyScope tool, Capital IQ, Hoovers, Bloomberg, Africa top 500 companies (annual ranking by Jeune Afrique), Kerix, KPMG, Nairobi Stock Exchange, EthiopiaList.com, The Africa Report, African Business Magazine dot.com, African Telecoms News, One Source, and interviews with colleagues and experts across the continent. The process turned up a list of names of about 1,750 companies with revenue of $100 million and upward. However, we narrowed this list down to only companies with revenue of $500 million and upward, and focused our efforts on verifying data for this smaller set of 692 companies.
We compiled the following information: the countries operated in within Africa, region (Northern Africa, Southern Africa, and so forth), sector, most recent revenue (2015 or most recent year available) converted to US dollars, public/private status, whether family-owned, type—African-owned, state-owned enterprise (SOE), or multinational corporation—as well as whether each country of activity is a subsidiary or contains the parent company (headquarters), country of origin in the case of multinational corporations, historical revenue data (2008 to 2015) in both local currency and US dollars, earnings before interest and taxation, net profit margin, earnings before interest, taxation, depreciation, and amortization, and net operating profit less adjusted taxes (NOPLAT) as a percentage of revenue. We attempted to find more than one source on company revenue wherever possible to verify our data. Data sources for revenue included annual reports and statements, Bloomberg, Capital IQ, MGI CompanyScope, company websites, the McKinsey Corporate Performance Analysis Tool (CPAT), press releases, EVS, Hoovers, EthiopiaList.com, Jeune Afrique, Kerix, KPMG, NSE, One Source, Orbis, and Reuters, among others. In a few cases, we made our own estimates of company revenue based on, for instance, oil price data (when volumes produced were known but revenue figures were not published), public information about installed capacity, and other pieces of publicly available information.
Typically, the listed country of activity was based on the country responsible for the largest share of income (when more detailed data were not available), and all revenue was attributed to this country. However, in cases where the company was large enough and more detailed data were available, we recorded that company multiple times for each country where its revenue totaled more than $500 million (when that information was available). This meant splitting revenue so that summing the total revenue of all 692 companies did not lead to double counting. For instance, in the case of the oil and gas company Total, we recorded ten separate companies for its businesses with annual revenue of more than $500 million (in the year for which data were found), in countries including Angola, Gabon, Kenya, Morocco, Nigeria, and South Africa. We did not count subsidiaries with revenue smaller than $500 million or for which revenue data were not available.
We allocated all companies to a sector, typically the sector where the company earned the largest share of income. When this was unclear, companies were allocated to “services” or “others.” Each conglomerate was allocated to its major sector.

34 McKinsey Global Institute Technical appendix
ANALYSES FROM THE COMPANIES DATABASEUsing this new database, we ran a number of analyses:
� Share of corporate tax analysis. To understand the share of corporate tax contributed by the largest companies, we gathered information on total corporate tax collected at the national level from national statistics and accounts data. We then estimated the corporate taxes paid by the largest companies, typically the largest 100 but sometimes fewer when data were limited. Data on corporate taxes paid came from company annual reports and Capital IQ (July 2016). The ratio of tax payments from the largest companies (typically around 100 companies per country) to total corporate tax payments for that country indicated that these largest companies typically contribute 50 to 60 percent of corporate taxes. This range was relatively consistent across countries in West Africa, North Africa, East Africa (about 50 companies), and Southern Africa. In Central Africa, the ratio was slightly higher at 70 percent.
� Companies by sector. This analysis included only the 676 companies in the database with annual revenue over $500 million because we folded the cases of multiple subsidiaries into a single entity for this analysis.
� Family-ownership analysis. To understand the share of family-owned companies in Africa compared with in other regions, we counted companies whose founder or founding family members are still significant stakeholders or important decision makers. We compared the findings from our own research to other regions using findings from Playing to win: The new global competition for corporate profits, McKinsey Global Institute, September 2015. The MGI report analyzed data from the CPAT database. To enable comparison between the two databases, we limited our group of companies to those with annual revenue larger than $1 billion. The analysis excludes multinational corporations from other regions but includes SOEs (as these are African owned).
� Corporate regional footprint analysis. We based this analysis on a subset of 53 companies for which we could find specific data on their geographic footprint in Africa. We grouped these countries into their region of origin: 14 were from North Africa, 11 from West Africa, 24 from Southern Africa, and six from East Africa. We then counted the number of countries to which they had expanded by region, thereby arriving at a distribution of companies from a particular region in other regions.
GROWTH AND PROFITABILITY ANALYSESComparison of African-owned to foreign-owned companies In this analysis, we compared the profitability and growth of multinational corporations to African-owned companies. We based the revenue analysis on a set of 211 companies with revenue data (in most cases from 2008 to 2015, but in some cases from 2010 to 2014) analyzed in local currency terms. Multinational corporations accounted for 25 companies, or 12 percent of this set. A smaller subset of 120 companies also had NOPLAT data that we used to compare profitability. Multinational corporations accounted for 16 companies, or 13 percent of this subset. We fitted a normal distribution to each of the African-owned and multinational sets of companies on profitability and growth to be able to compare their performance.
Growth and profitability analysis by sector We analyzed revenue growth of African companies by sector and compared that with the global average. We based our sector average on the average growth rate of annual revenue in local currency terms for all companies in Africa from that sector. We measured growth from 2008 to 2015 (or the years in that period for which data were available) for 202 companies. We compared these results with the rest of the world by calculating average growth by sector using data from CPAT from 2008 to 2013 (using data for 4,619 companies).

35McKinsey Global Institute Lions on the move II: realizing the potential of Africa’s economies: Technical Appendix
We analyzed each of the sectors based on profitability measured by NOPLAT as a percentage of revenue, averaged across all African companies with revenue greater than $500 million within a sector, and compared this with the global average. We compared these results to a similar analysis of NOPLAT conducted by MGI (based on 2013 data for 4,650 companies analyzed in Playing to win: The new global competition for corporate profits, McKinsey Global Institute, September 2015, which used data from the CPAT database). We had NOPLAT data for 135 companies from the MGI African companies database (excluding the financial-services sector). For the financial-services sector, we based profitability on return on assets in percentage terms from the banking sector only. These data were sourced from the McKinsey Global Banking Pools for both Africa and the rest of the world. Utilities and transportation do particularly poorly in Africa, and closer investigation revealed that weak profitability in that sector is largely due to companies in the airline industry.
Analysis of level of consolidation by sectorWe measured the level of consolidation in the telecommunications, banking, retail, health care, and agri-processing sectors in six markets: Algeria, Egypt, Kenya, Morocco, Nigeria, and South Africa. We based consolidation of market share of the top three players in each market in the following ways for each of the sectors:
� We based telecommunications market share on the share of subscribers held by a company. We used data from a number of sources. We took Nigerian data from the Nigerian Communications Commission’s website; Kenyan data from the Communications Authority of Kenya’s annual report for 2014–15 and the Kenya ICT Performance Review 2009–10; South African data from Businesstech; Moroccan data from Agence Nationale de Réglementation des Télécommunications’s 2014 annual report; Egyptian data from the Ministry of Communications and Information Technology as cited by Egypt Independent; and Algerian data from Autorité de Régulation de la Poste et des Télécommunications’ 2014 annual report.
� We based banking market share on the share of banking assets held by a company. Data came from multiple sources, including Algeria: Financial system stability assessment, IMF, June 10, 2014; Developments in the Kenyan banking sector for the quarter ended 30th September 2014, Central Bank of Kenya; Sub-Saharan Africa banking review: 2014 calendar year, EY; Capital IQ; and AllAfrica.com.
� We based market share in retail (the formal sector only), health care (focused on pharmaceuticals), and agri-processing market on the share of revenue. We sourced data for retail and agri-processing from Euromonitor, trade sources, and national statistical offices, and data on health care from the American Chamber of Commerce in Egypt and press searches for other countries.
Our overall findings were that telecommunications was highly concentrated, with 83 to 100 percent of subscribers in the top three companies. The situation in banking was more varied, with a concentration of over 80 percent in South Africa and Morocco but between 40 and 60 percent in the other markets. Retail was also fairly concentrated in Kenya, Morocco, and South Africa with 60 to 75 percent in the top three companies, while other markets were fragmented with 20 to 40 percent held by the top three companies. Health care was fragmented across countries, with the top three companies in each having a share of 20 to 40 percent. We found the same was true in agri-processing with the top three companies holding between 12 to 26 percent. We did not evaluate other sectors because they contained too many subsectors to enable effective analysis. We also used a second methodology to analyze degree of sector fragmentation in which we estimated large companies’ share of total market revenue; this analysis found that agri-processing, construction, manufacturing, and wholesale and retail were fragmented.

36 McKinsey Global Institute Technical appendix
MORE COMPANIES NEEDED WITH GREATER SCALE AND REACHWe conducted a comparison of the scale of annual revenue earned, the number of companies, and the average annual revenue per company in Africa and other countries. To ensure comparability with data in other countries, we focused on companies earning more than $1 billion in revenue per year, and excluded multinational corporations and SOEs, focusing the comparison on locally owned, private-sector, and large-scale companies. MGI’s African companies database provided data on total revenue, number of companies, and average revenue per company for all African companies (as a group), and for all African companies excluding those from South Africa (as a second group). We sourced data for companies outside Africa from MGI’s CompanyScope v2.09 (we counted only headquarters and not subsidiaries to be comparable). We calculated annual revenue per company as weighted averages.
Based on these data sources, we ascertained that Africa (excluding South Africa) has about one-third of the total corporate revenue of Brazil and India (similar-sized economies) and that Africa has similar total revenue to Turkey, an economy about 2.5 times smaller. Africa excluding South Africa has about 60 percent of the number of large companies in a group of economies of similar size, and its (weighted) average company earnings are less than half that of companies in these economies.
HOW COMPANIES EXPANDEDAfrican-owned companies MGI examined the 100 African companies that have outperformed the market on growth and profitability. This top 100 included African-owned private companies, multinationals, and several SOEs in a variety of sectors and countries. We assessed each company over the course of its full lifespan (in some cases several decades) to pinpoint which key strategic choices it had made that contributed to its growth.
Multinational corporations Our analysis of multinational corporations looked at how long they had been in Africa, and how many countries they were present in (defined as the company having a physical presence or selling its products or services in that country). For the first of these analyses, we used data for 56 companies. For the second analysis, we found data for 88 companies. In both cases, we collated these data by manually searching company websites to understand the year of first operation in Africa and how many countries these companies were present in. The estimated average revenue figures are weighted averages.

37McKinsey Global Institute Lions on the move II: realizing the potential of Africa’s economies: Technical Appendix
5. SUSTAINING MOMENTUM— IMPERATIVES FOR GOVERNMENTThis analysis looks at the imperatives that face African governments and how they might approach resolving them.
IMPERATIVE 1: MOBILIZE DOMESTIC RESOURCESWe estimated that governments could mobilize up to an additional $355 billion in domestic resources by 2025.
Estimating current tax collectionWe estimated tax collection in 2013 of $295 billion to $320 billion. We based the lower end of this estimate on data sourced from the African Economic Outlook, the World Bank, and McKinsey analysis for direct, indirect, and trade taxes paid; we excluded resource rents.9 We based a second estimate of tax revenue on bottom-up estimates by national finance ministries and McKinsey analysis. These data ranged from $309 billion to $322 billion, and we rounded to give our upper estimate of $320 billion.
Estimating tax collection potentialWe estimated that tax collection could increase by between $120 billion and $300 billion by 2025 if governments were able to overcome a number of structural challenges, including high levels of informality in business, fraud, neglect, error, non-payment, late payment, and tax avoidance. We estimated that 30 to 50 percent of Africa’s total tax liability is not collected, using available literature on this topic, discussions with tax authorities and other experts, and McKinsey’s experience on the ground.10 This led us to conclude that Africa’s total tax opportunity is between $415 billion and $620 billion. However, structural challenges, the size of the shadow economy, the number of sole proprietors, and the number of small and medium-sized enterprises limit the ability to capture this full potential.
From interviews with McKinsey experts, we estimated that governments could increase the amount of tax they collect (excluding growth in resource rents) by $50 billion to $100 billion by 2025 through taking short-term measures to modernize tax systems. We based this estimated increase on the experience on the ground of the McKinsey Public Sector Practice, which has observed a 2 to 5 percent per year increase in year-on-year tax revenue after interventions were made. The practice saw a higher impact in the earlier years of an intervention, after which the impact tails off. For the lower end of our estimate, we assumed that taxes collected increased by 3.5 percent per year for the first five years after interventions were taken, and then dropped to 1.5 percent for the subsequent five years (excluding increases in tax collection from GDP growth). For the upper end of our estimate, we assumed a higher increase of 5 percent per year if the tax–to-GDP ratio was less than 18 percent, and 2 percent per year if the tax–to-GDP ratio exceeded 18 percent (best case historical observations). We also set a threshold for the upper limit of tax collection at 25 percent of GDP, based on the upper end demonstrated by African countries in 2013. Countries that we consider modernized in our tax modernization index achieved only a 1.5 percent increase in tax revenue for the first five years after interventions were taken, and no further increase thereafter.
9 Direct taxes include taxes on income, profits and capital gains, payroll, workforce, and property. Indirect taxes include taxes on goods and services, value-added taxes, sales taxes, and excise duty. Trade taxes include taxes on international trade and transactions. Resource rents include signature bonuses, licenses, and extraction royalties.
10 Some of the most useful articles include: Current challenges in revenue mobilization: Improving tax compliance, IMF staff report, April 2015; Anoop Singh, Sonali Jain-Chandra, and Adil Mohommad, Inclusive growth, institutions, and the underground economy, IMF working paper 12/47, 2012; Measuring tax gaps 2012 edition, HM Revenue & Customs, 2012; Andreas Buehn and Friedrich Schneider, Size and development of tax evasion in 38 OECD countries: What do we (not) know? November 2012.

38 McKinsey Global Institute Technical appendix
Estimating life insurance pension fund potentialUsing data from SwissRe Sigma, Africa Re, the McKinsey Global Insurance Pools, and the World Bank’s World Development Indicators, we estimated the size of Africa’s life insurance premiums at $44 billion to $50 billion in 2014. We wanted to focus our attention on the promotion of long-term investment and therefore excluded group life premiums that are short-term in nature from our analysis (despite the fact that increasing acceptance and penetration of all forms of insurance will benefit growth of the industry). We used data for South Africa, the most developed insurance market in Africa, to estimate typical group life insurance levels. Group life will account for between 40 and 47 percent of life insurance premiums between 2015 and 2025, according to information from the Association for Savings and Investment South Africa and projections by McKinsey Global Insurance Pools. We therefore assumed group life to be 40 percent of total life insurance until 2025, and then rounded down to $30 billion in premiums in 2014.
We based our estimate of the growth potential in insurance on a country-by-country growth projection using data from McKinsey Global Insurance Pools until 2020. We extrapolated insurance growth rates from 2020 to 2025 for each country based on the ratio of GDP growth from 2020 to 2025 relative to growth from 2015 to 2020. We reduced our estimate of $36 billion in life insurance growth to $20 billion after accounting for the group life proportion and rounding down.
We consolidated our estimates for total pension fund assets for 12 African countries in 2014 using data from the OECD, the African Private Equity and Venture Capital Association (AVCA Africa), and the IMF.11 Assets totaled about $450 billion or 28 percent of GDP on (unweighted) average for these countries, with annual contributions coming to approximately $55 billion in 2014. We estimated annual contributions primarily from the growth of South African pension funds (around $45 billion between 2013 and 2014 according to the 2014 Annual Registrar of Pension Funds), and prorated for the rest of Africa. We then estimated the total pension fund contribution possible if all countries that had a penetration lower than 28 percent achieved 28 percent of GDP (the average). This would increase assets by around $350 billion over a decade, or $35 billion a year.
IMPERATIVE 3: ACCELERATE INFRASTRUCTURE INVESTMENTEstimating historical infrastructure spendingWe estimated Africa’s historical investment in infrastructure by compiling data from a number of sources. Africa’s infrastructure: A time for transformation, World Bank, 2009, estimated average infrastructure spending in sub-Saharan Africa at $25 billion for four asset classes— telecommunications, power, transport, and water—excluding operation and maintenance spending between 2001 and 2006. The Infrastructure Consortium for Africa estimates that about 70 percent of African infrastructure spending is by sub-Saharan Africa, and we therefore allocated another 30 percent or $11 billion to North African investment to arrive at a total of $36 billion per year investment in infrastructure. We checked these estimates against the McKinsey Infrastructure Spend and Stock (ISS) database, which tracks investment in infrastructure globally for the same four asset classes for eight countries, namely Cameroon, Kenya, Morocco, Nigeria, Senegal, South Africa, Tunisia, and Zimbabwe. The ISS database indicates that infrastructure investment for these eight countries increased from $18 billion in 2001 to $38 billion in 2006, averaging $27 billion over this period. Given that major economies including Egypt are missing from this data set, we used World Bank data as the basis for our estimate. However, we used the ISS data set to understand the level of spending by specific countries and regions since it offered detail at the country level for these eight countries.
11 Pension funds and private equity: Unlocking Africa’s potential, AVCA, 2014.

39McKinsey Global Institute Lions on the move II: realizing the potential of Africa’s economies: Technical Appendix
We estimated that infrastructure investment in 2015 was approximately $80 billion. ICA annual reports from 2008 to 2014 report that total infrastructure investment in Africa ranged between $69 billion and $100 billion each year, or 3 to 4 percent of GDP. Calculating the average level of infrastructure investment during this period at 3.5 percent of GDP indicated that 2015 spending was likely to be $80 billion (spending in 2014 was $75 billion).
Estimating potential future infrastructure spendingMaintaining that level of spending means that Africa will spend about $117 billion per year by 2025. However, we wanted to examine how much Africa should be spending. We found that Africa needs to spend about 4.5 percent of GDP on infrastructure. Previous MGI research has found that the global average for infrastructure stock levels is about 70 percent of GDP for the four classes of infrastructure mentioned.12 We therefore used this as a benchmark for typical spending levels of the whole continent (this might be higher or lower depending on an individual country’s specific circumstances). Estimating future African average annual GDP growth of 4 percent, annual infrastructure investment of 2.8 percent of GDP would be required to achieve 70 percent infrastructure stock.13 In addition, previous MGI work estimated that countries need to replace depreciated infrastructure at a rate of 1.8 percent of GDP each year. We therefore added 2.8 percent to 1.8 percent to give us a required infrastructure spending level of about 4.5 percent of GDP. With annual GDP growth of 4 percent to total $3.340 trillion in GDP by 2025, infrastructure spending would need to total around $150 billion per year by 2025. The benchmark spending level of 70 percent includes a breakdown into the typical spending levels on the four asset classes mentioned. We used this to set the ideal level of spending for each asset class in 2025.
IMPERATIVE 5: CREATE TOMORROW’S TALENTTo determine the difference in years of schooling between African children and those in other emerging regions, we used data from the UNDP’s International Human Development Indicators; Robert J. Barro and Jong-Wha Lee, “A new data set of educational attainment in the world, 1950–2010,” Journal of Development Economics, volume 104, issue C, 2013; and the UNESCO Institute for Statistics. The figure we used of a 12 percent African enrollment rate in tertiary education (compared with India’s 25 percent) came from the World Bank’s education indicators. These indicators show that 8 percent of African students in secondary education enrolled in vocational programs in 2013. This indicates that of the 49 million students who finished secondary education that year (these data come from the Africa-America Institute), only about 4 million enrolled in vocational programs. According to the United Nations, the African population is growing at 2.3 percent a year. Taking into account population growth and our target of attaining 50 percent youth enrollment in vocational programs suggests that Africa would need to enroll approximately 33 million secondary school students in vocational programs by 2025. Similarly, of the 49 million students who finished secondary education, 12 percent enrolled in universities (six million students) in 2013. If Africa were to match India’s rate of 25 percent, and taking into account population growth of 2.3 percent, Africa would need to put 16 million students through university in 2025.
12 Infrastructure productivity: How to save $1 trillion a year, McKinsey Global Institute, January 2013. 13 A consensus of forecasts from IHS and Oxford Economics gives a 4 percent per year growth rate to 2025 for
the continent.


RELATED MGIAND MCKINSEY RESEARCH
South Africa’s big five: Bold priorities for inclusive growth (September 2015)Sluggish growth has left many pessimistic about the country’s economic outlook, but five actions could add 1.1 percentage points ($87 billion) to annual GDP and create millions of jobs by 2030.
Nigeria’s renewal: Delivering inclusive growth in Africa’s largest economy (July 2014)With the right reforms and investments, Africa’s largest economy can live up to its economic potential and bring more Nigerians out of poverty.
Africa at work: Job creation and inclusive growth (August 2012)The world’s second-fastest-growing region must speed up job creation to sustain its successes. By focusing on labor-intensive sectors such as agriculture, some types of manufacturing, and retail and hospitality, African nations could boost the number of new wage-paying jobs from 54 million on current trends to 72 million by 2020.
Global growth: Can productivity save the day in an aging world? (January 2015)Over the past 50 years, the world economy expanded sixfold, average per capita income almost tripled, and hundreds of millions were lifted out of poverty. Yet global economic growth will almost halve in the next 50 years—unless the world can engineer a dramatic improvement in productivity.
Lions go digital: The internet’s transformative potential in Africa (November 2013)A majority of urban Africans own internet-capable devices and go online regularly. If infrastructure investment continues, the internet will take hold on a much larger scale in the coming decade—potentially adding $300 billion a year to Africa’s GDP.
Lions on the move: The progress and potential of African economies (June 2010)Africa’s economic growth is creating substantial new business opportunities that are often overlooked by global companies. Consumer-facing industries, resources, agriculture, and infrastructure together could generate as much as $2.6 trillion in revenue annually by 2020, or $1 trillion more than today.
www.mckinsey.com/mgi
E-book versions of selected MGI reports are available at MGI’s website, Amazon’s Kindle bookstore, and Apple’s iBooks Store.
Download and listen to MGI podcasts on iTunes or at www.mckinsey.com/mgi/publications/multimedia/
Cover image: © Kostadin Luchansky/Getty images.

McKinsey Global InstituteSeptember 2016 Copyright © McKinsey & Company www.mckinsey.com/mgi
@McKinsey_MGI McKinseyGlobalInstitute


